
Exploring the Cutting Process of Coaxial Phase Change Fibers under Optical Characterization Tests

 ,
,  ,
,  , ,
, ,  ,
,  and
and 
Abstract
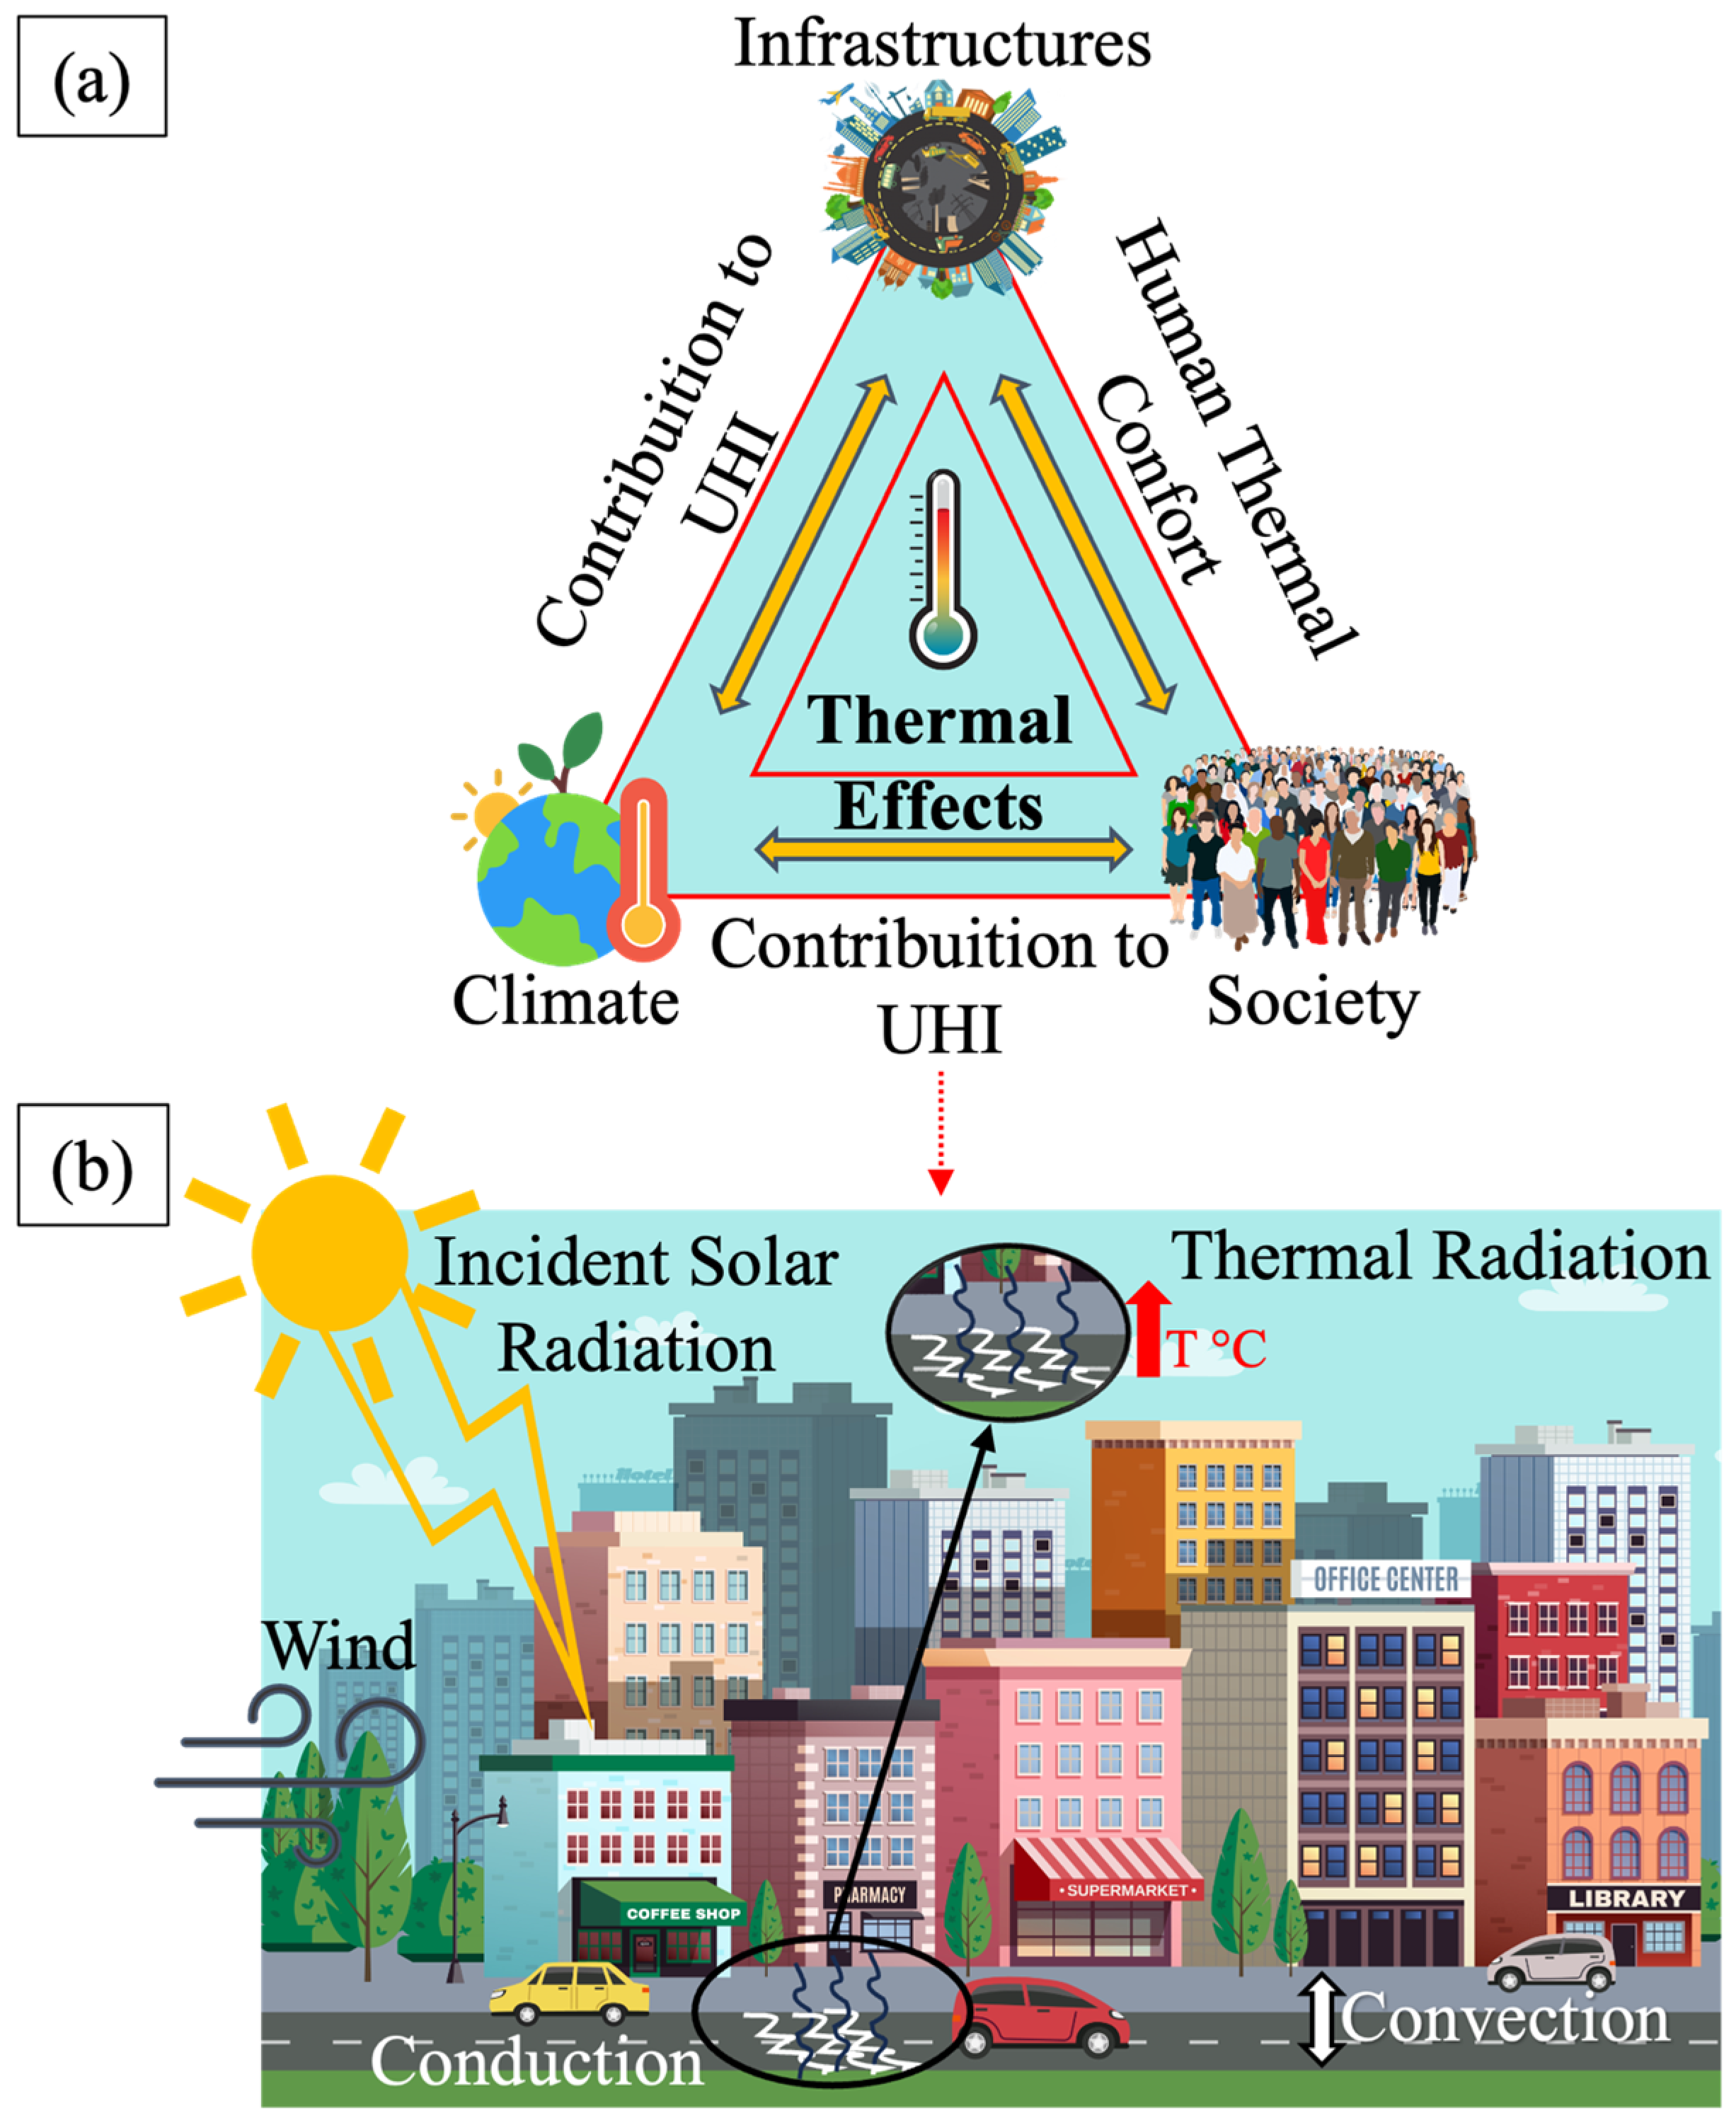
:1. Introduction
2. Materials and Methods
2.1. Materials
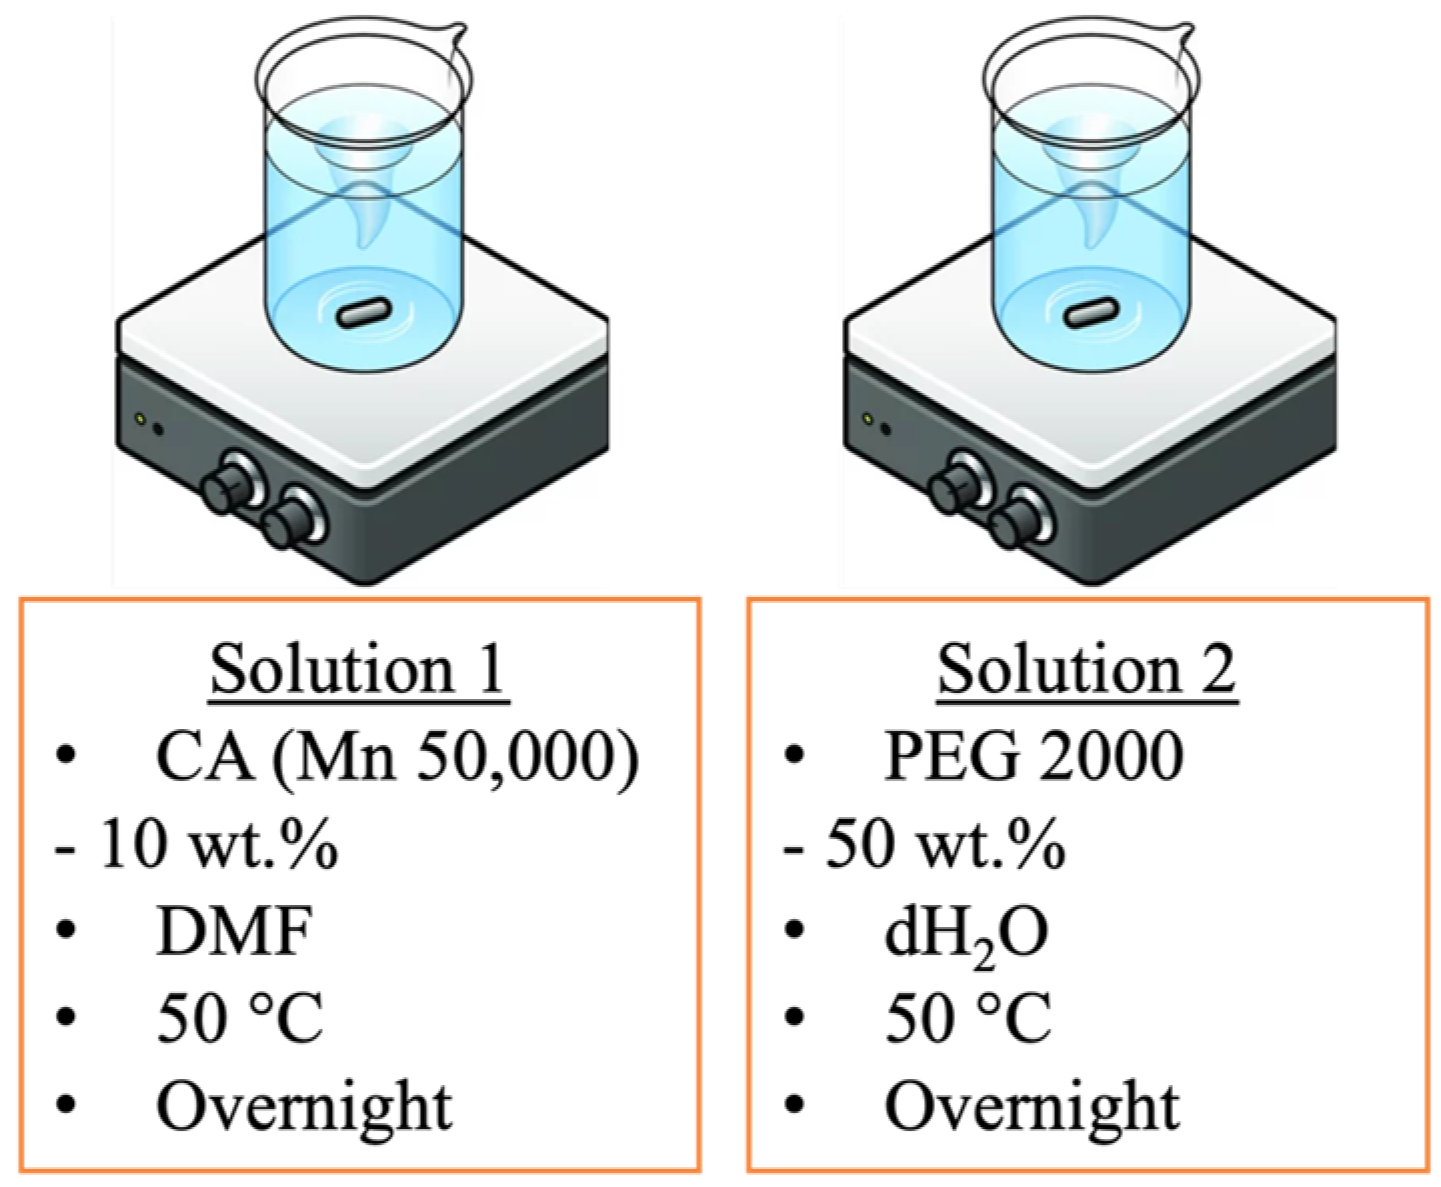
2.2. Preparation of Solutions
2.3. Fibers Production
2.4. Nomenclature of the Samples
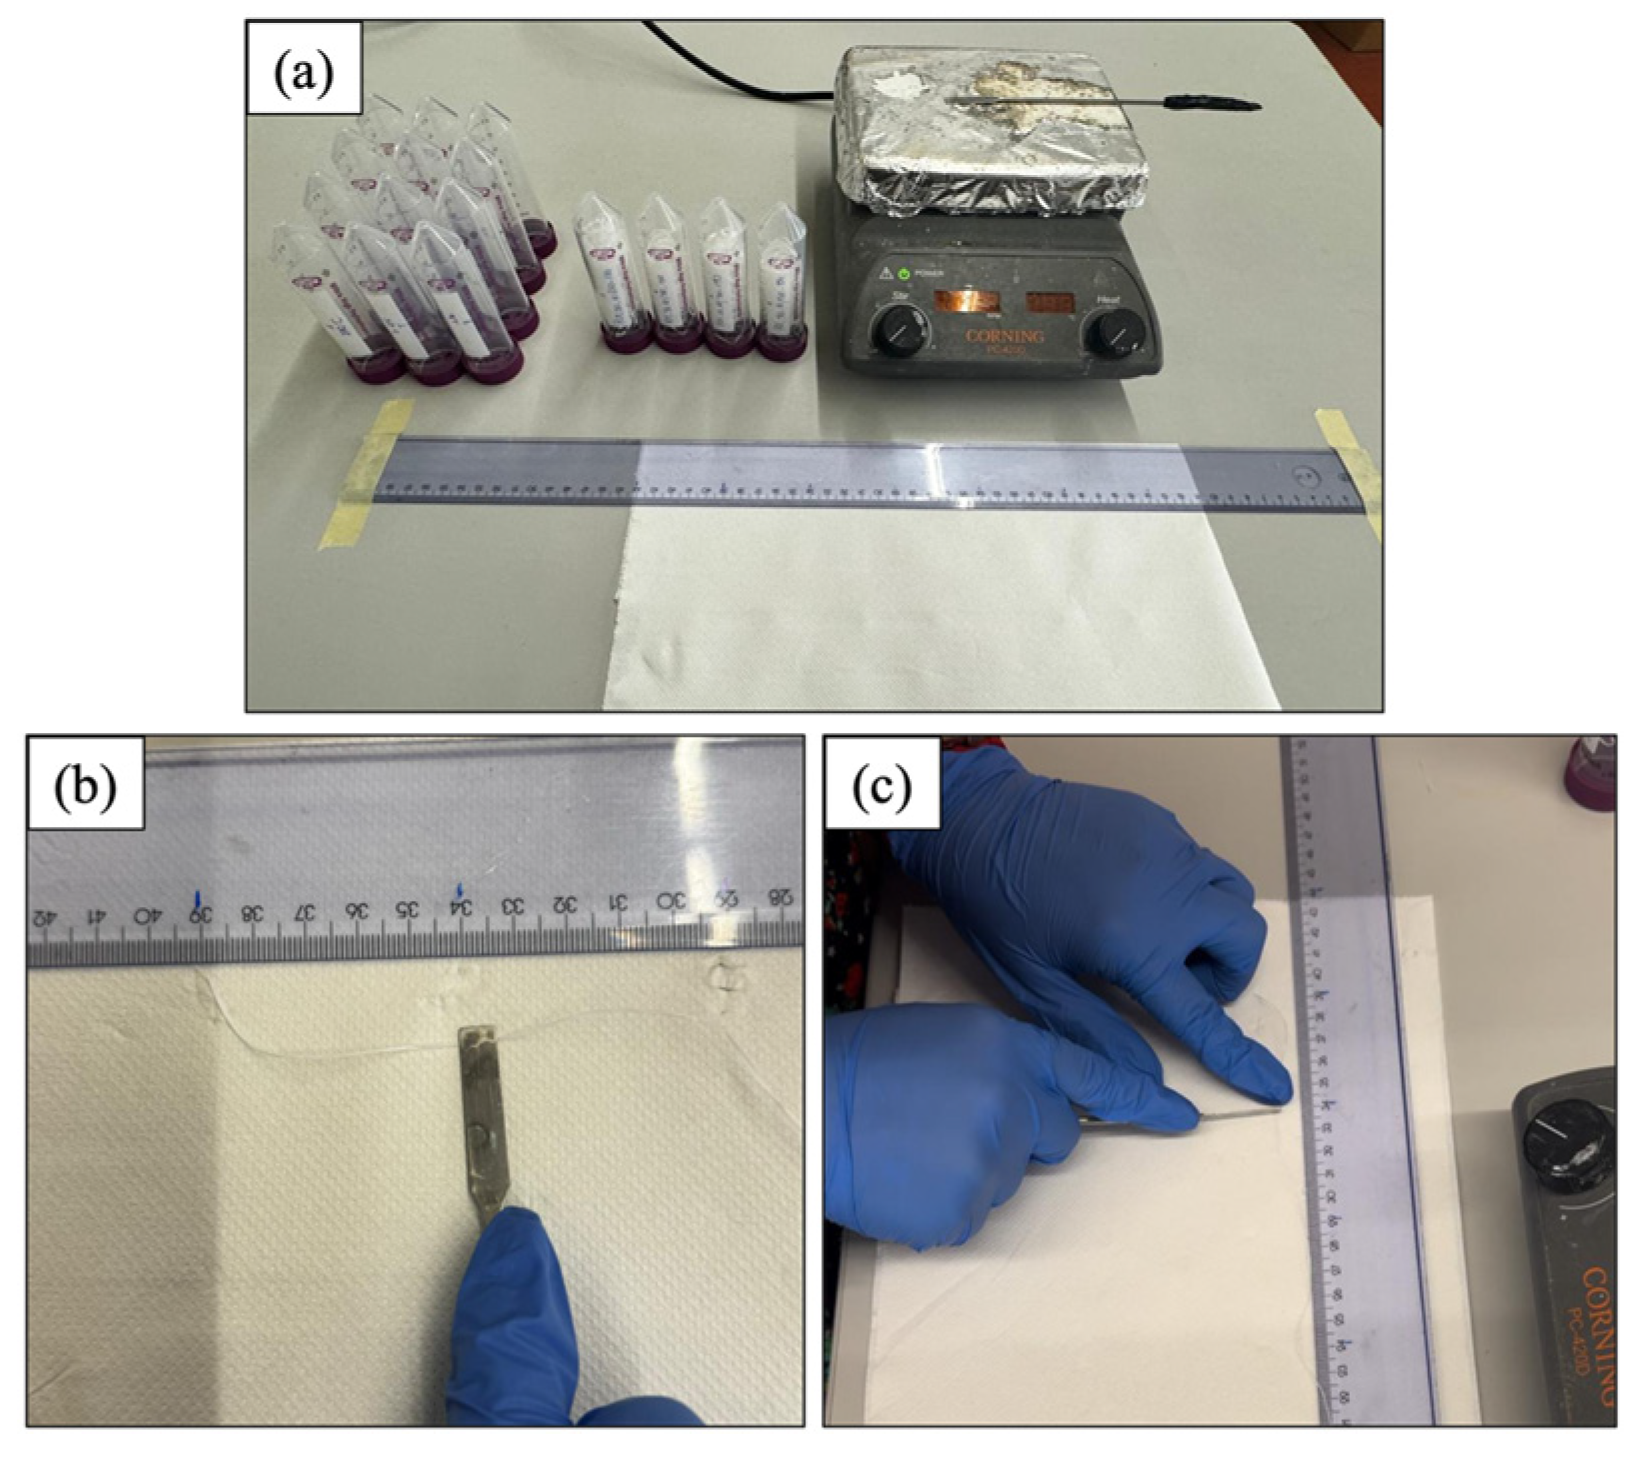
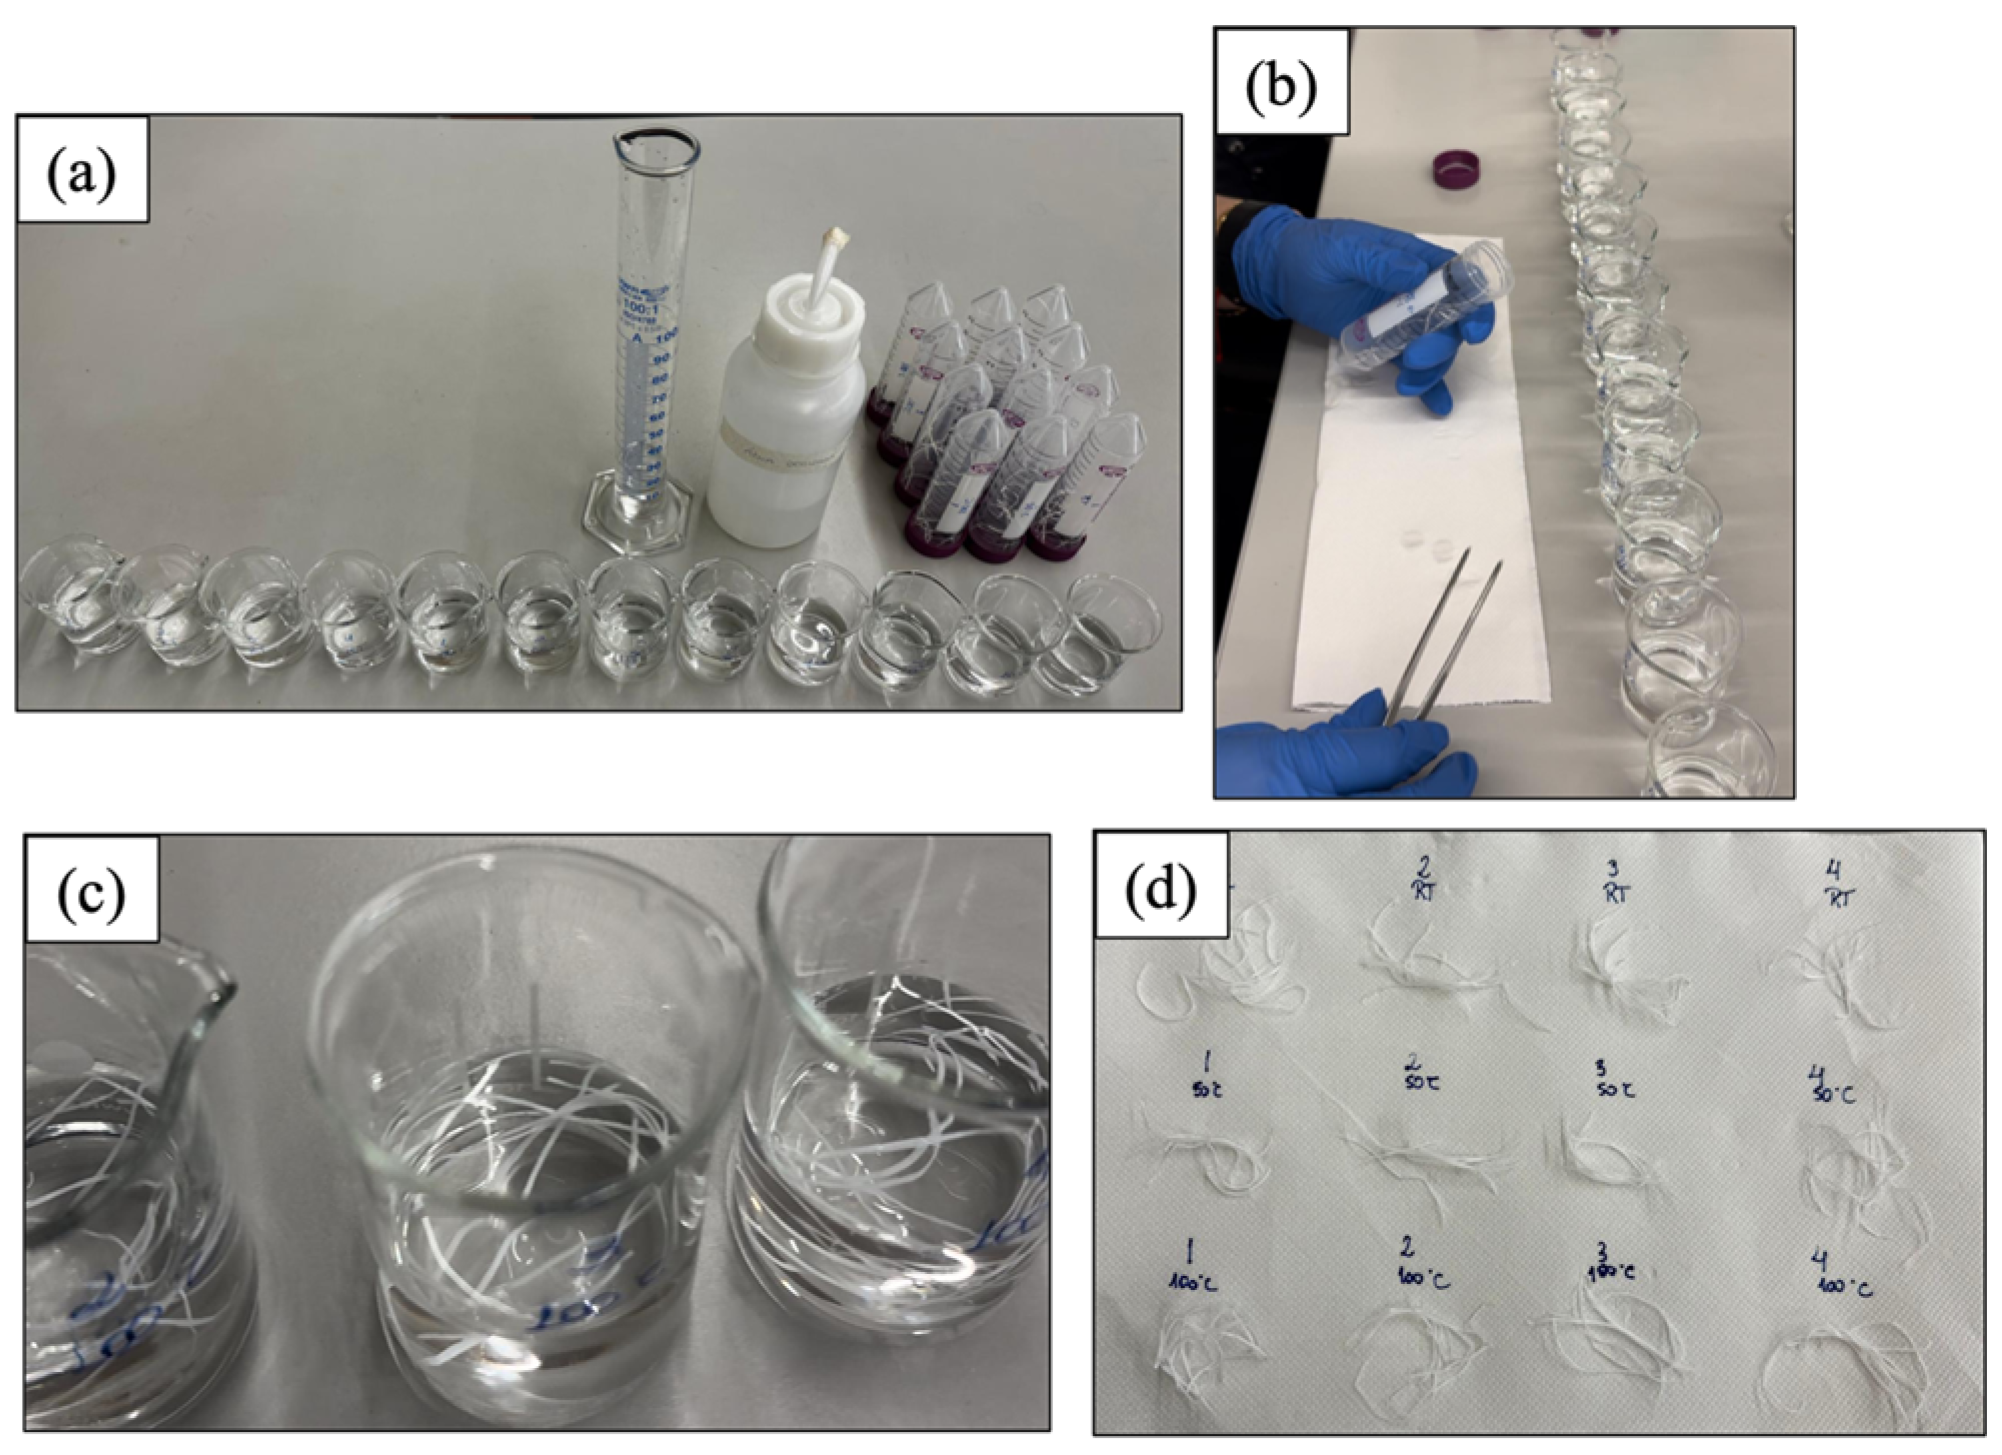
2.5. Hot Cutting and Controlled Washing
2.6. Bright-Field Microscope
2.7. Fourier-Transform Infrared Spectroscopy (FTIR) and Index of Functional Groups
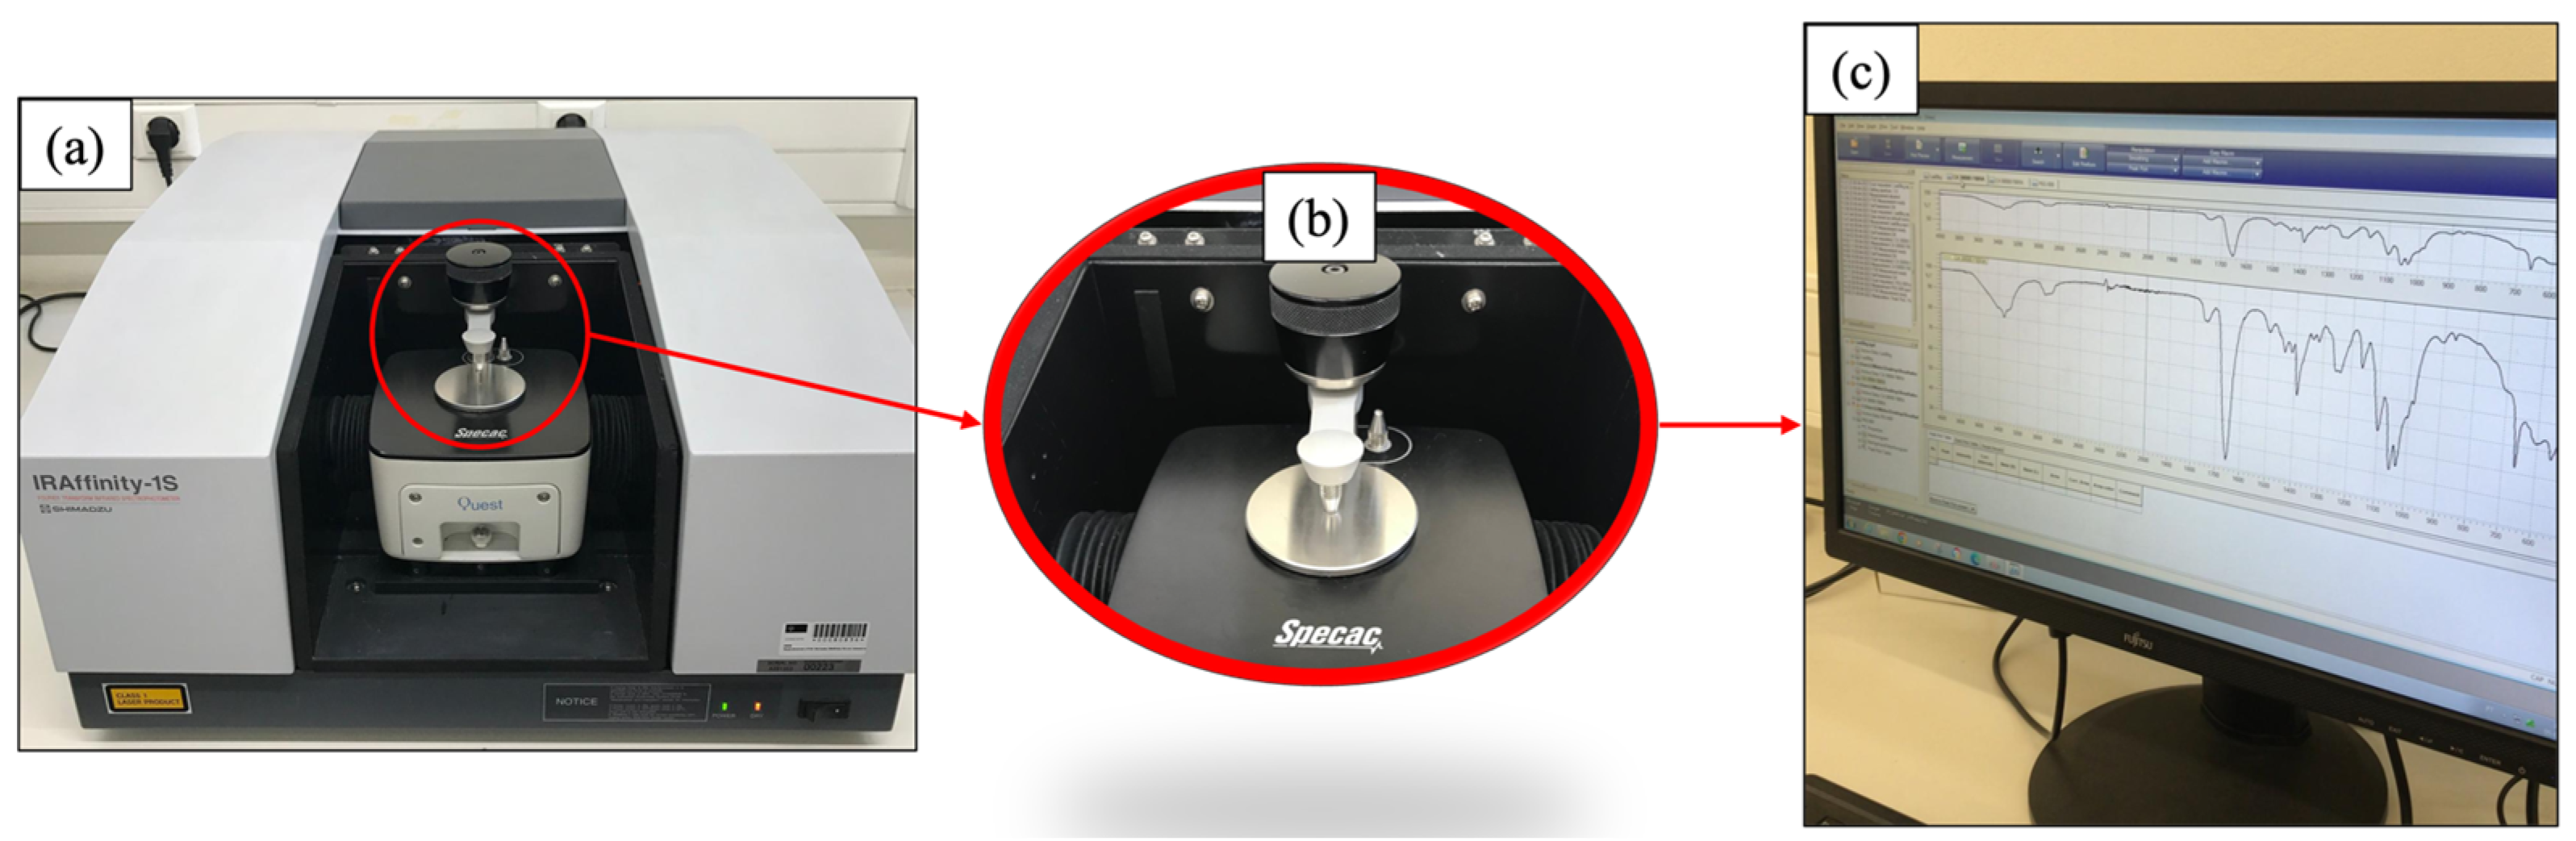
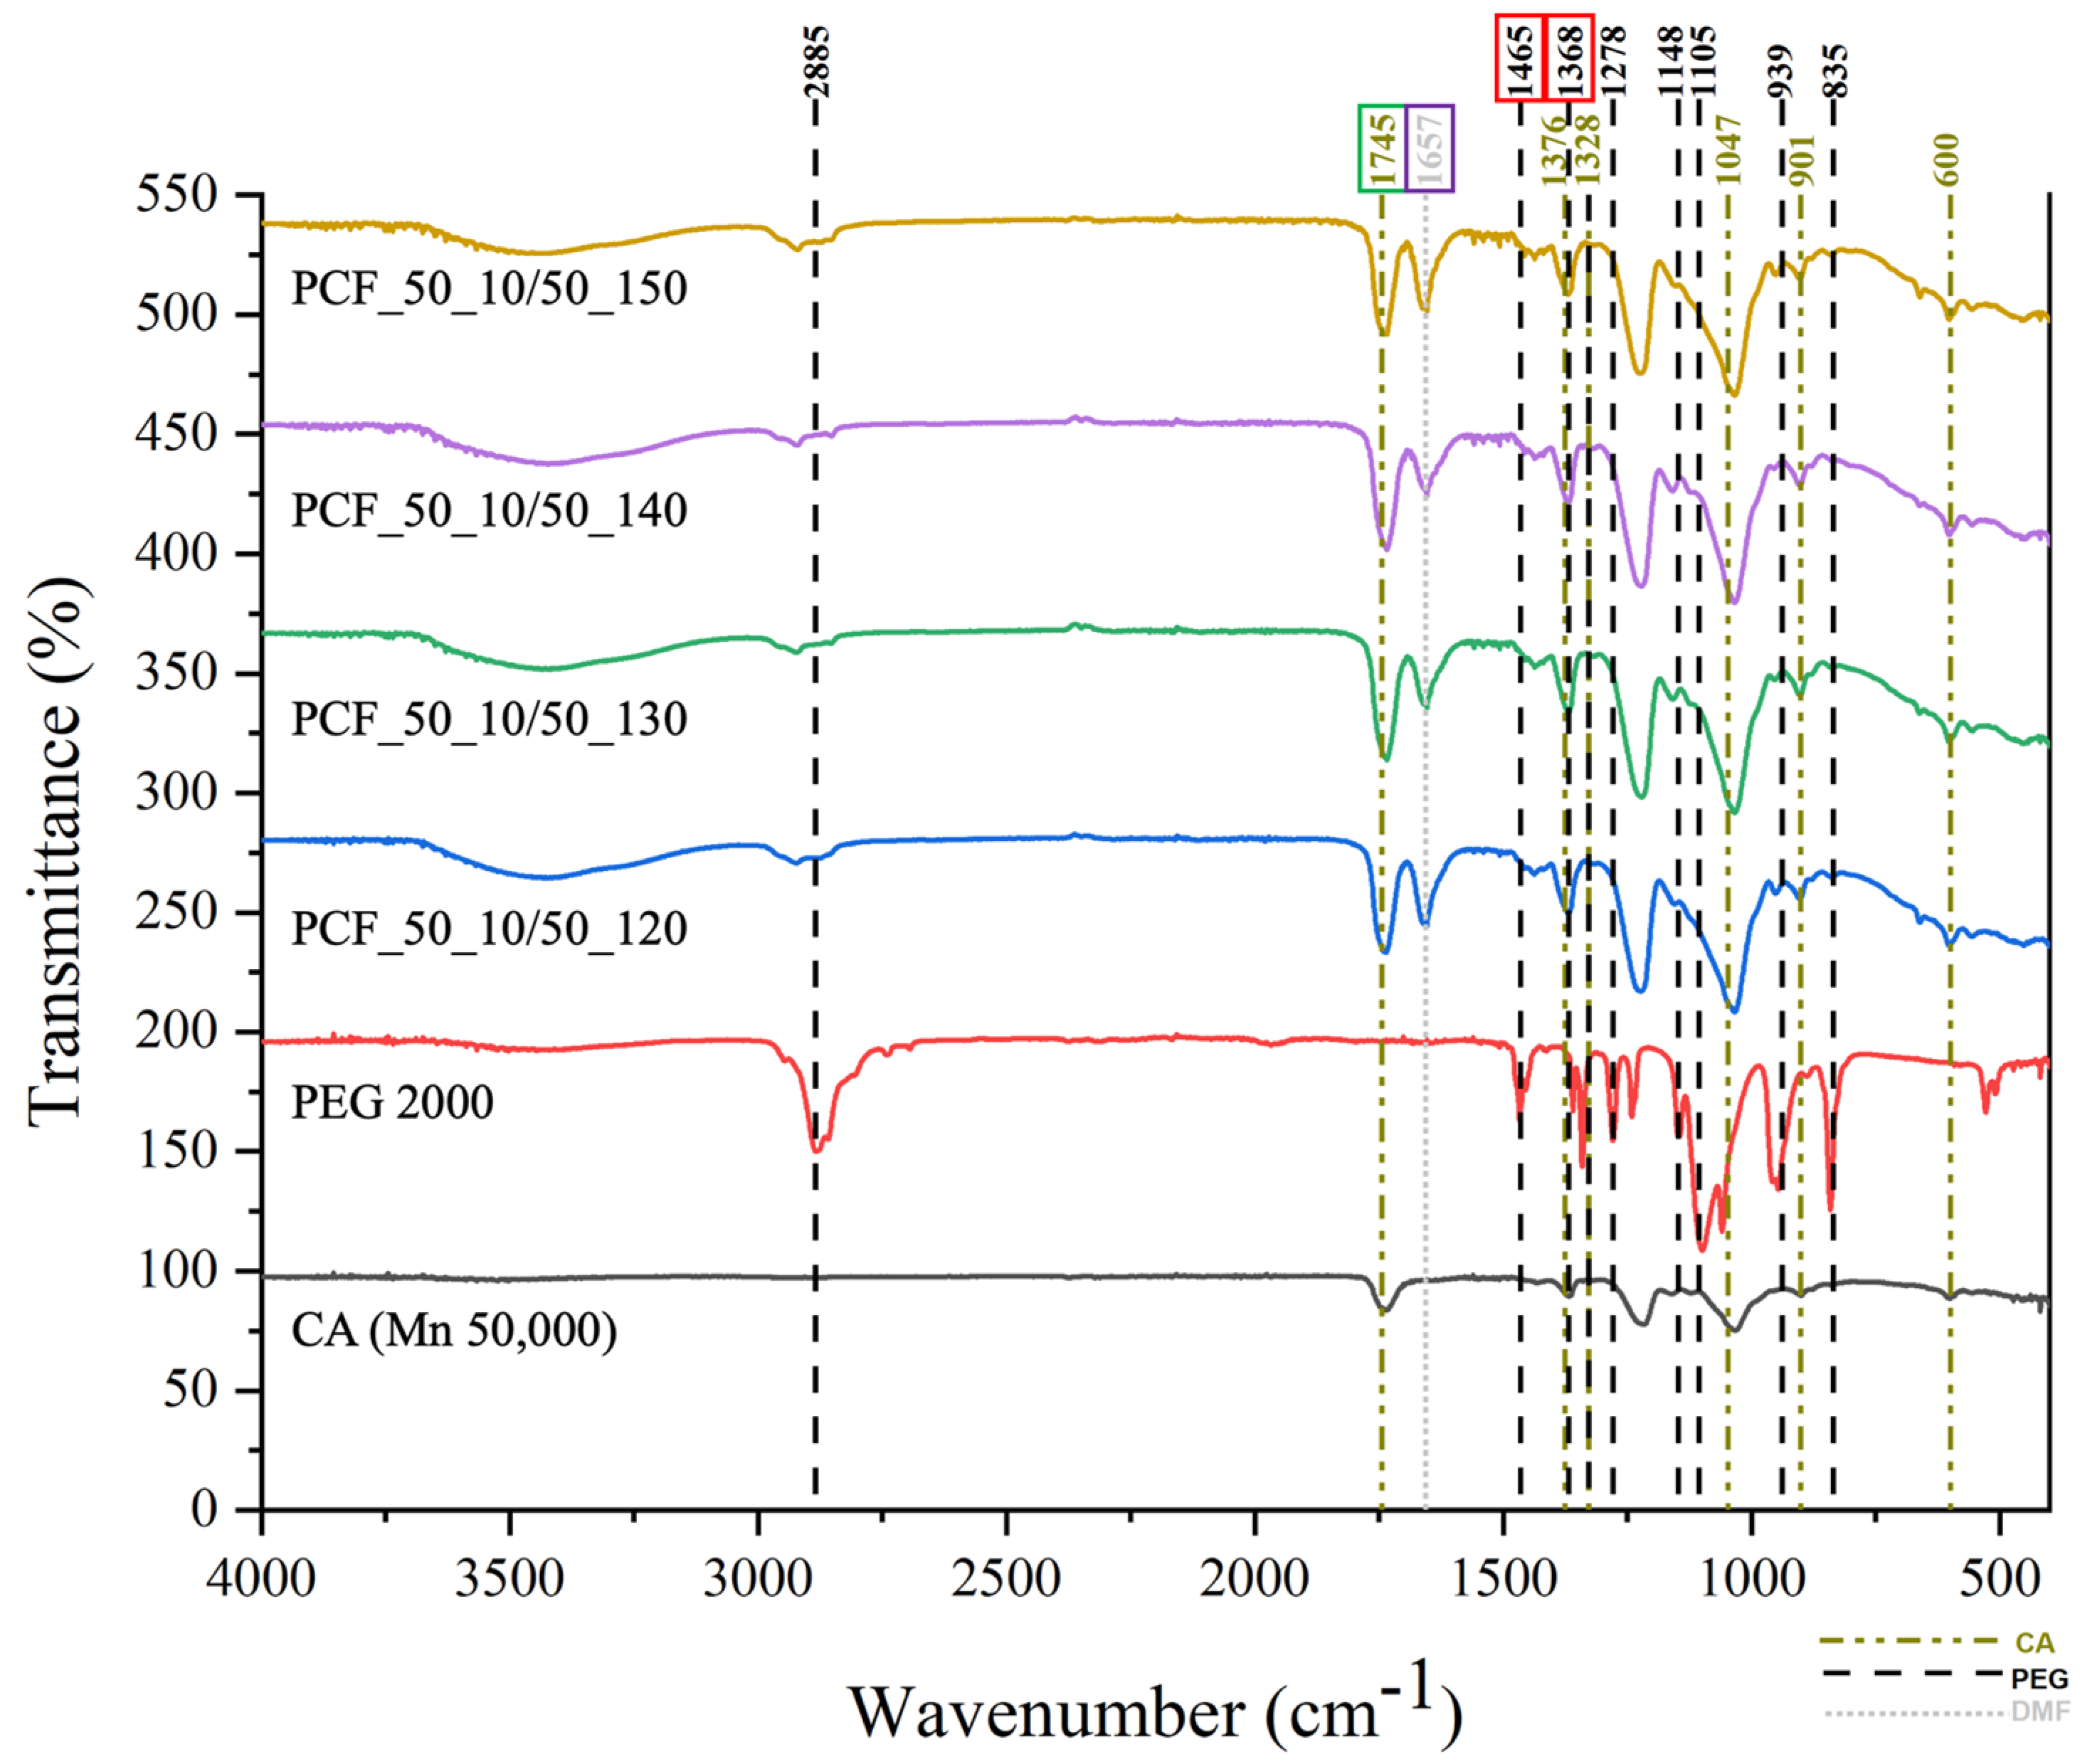
2.7.1. FTIR
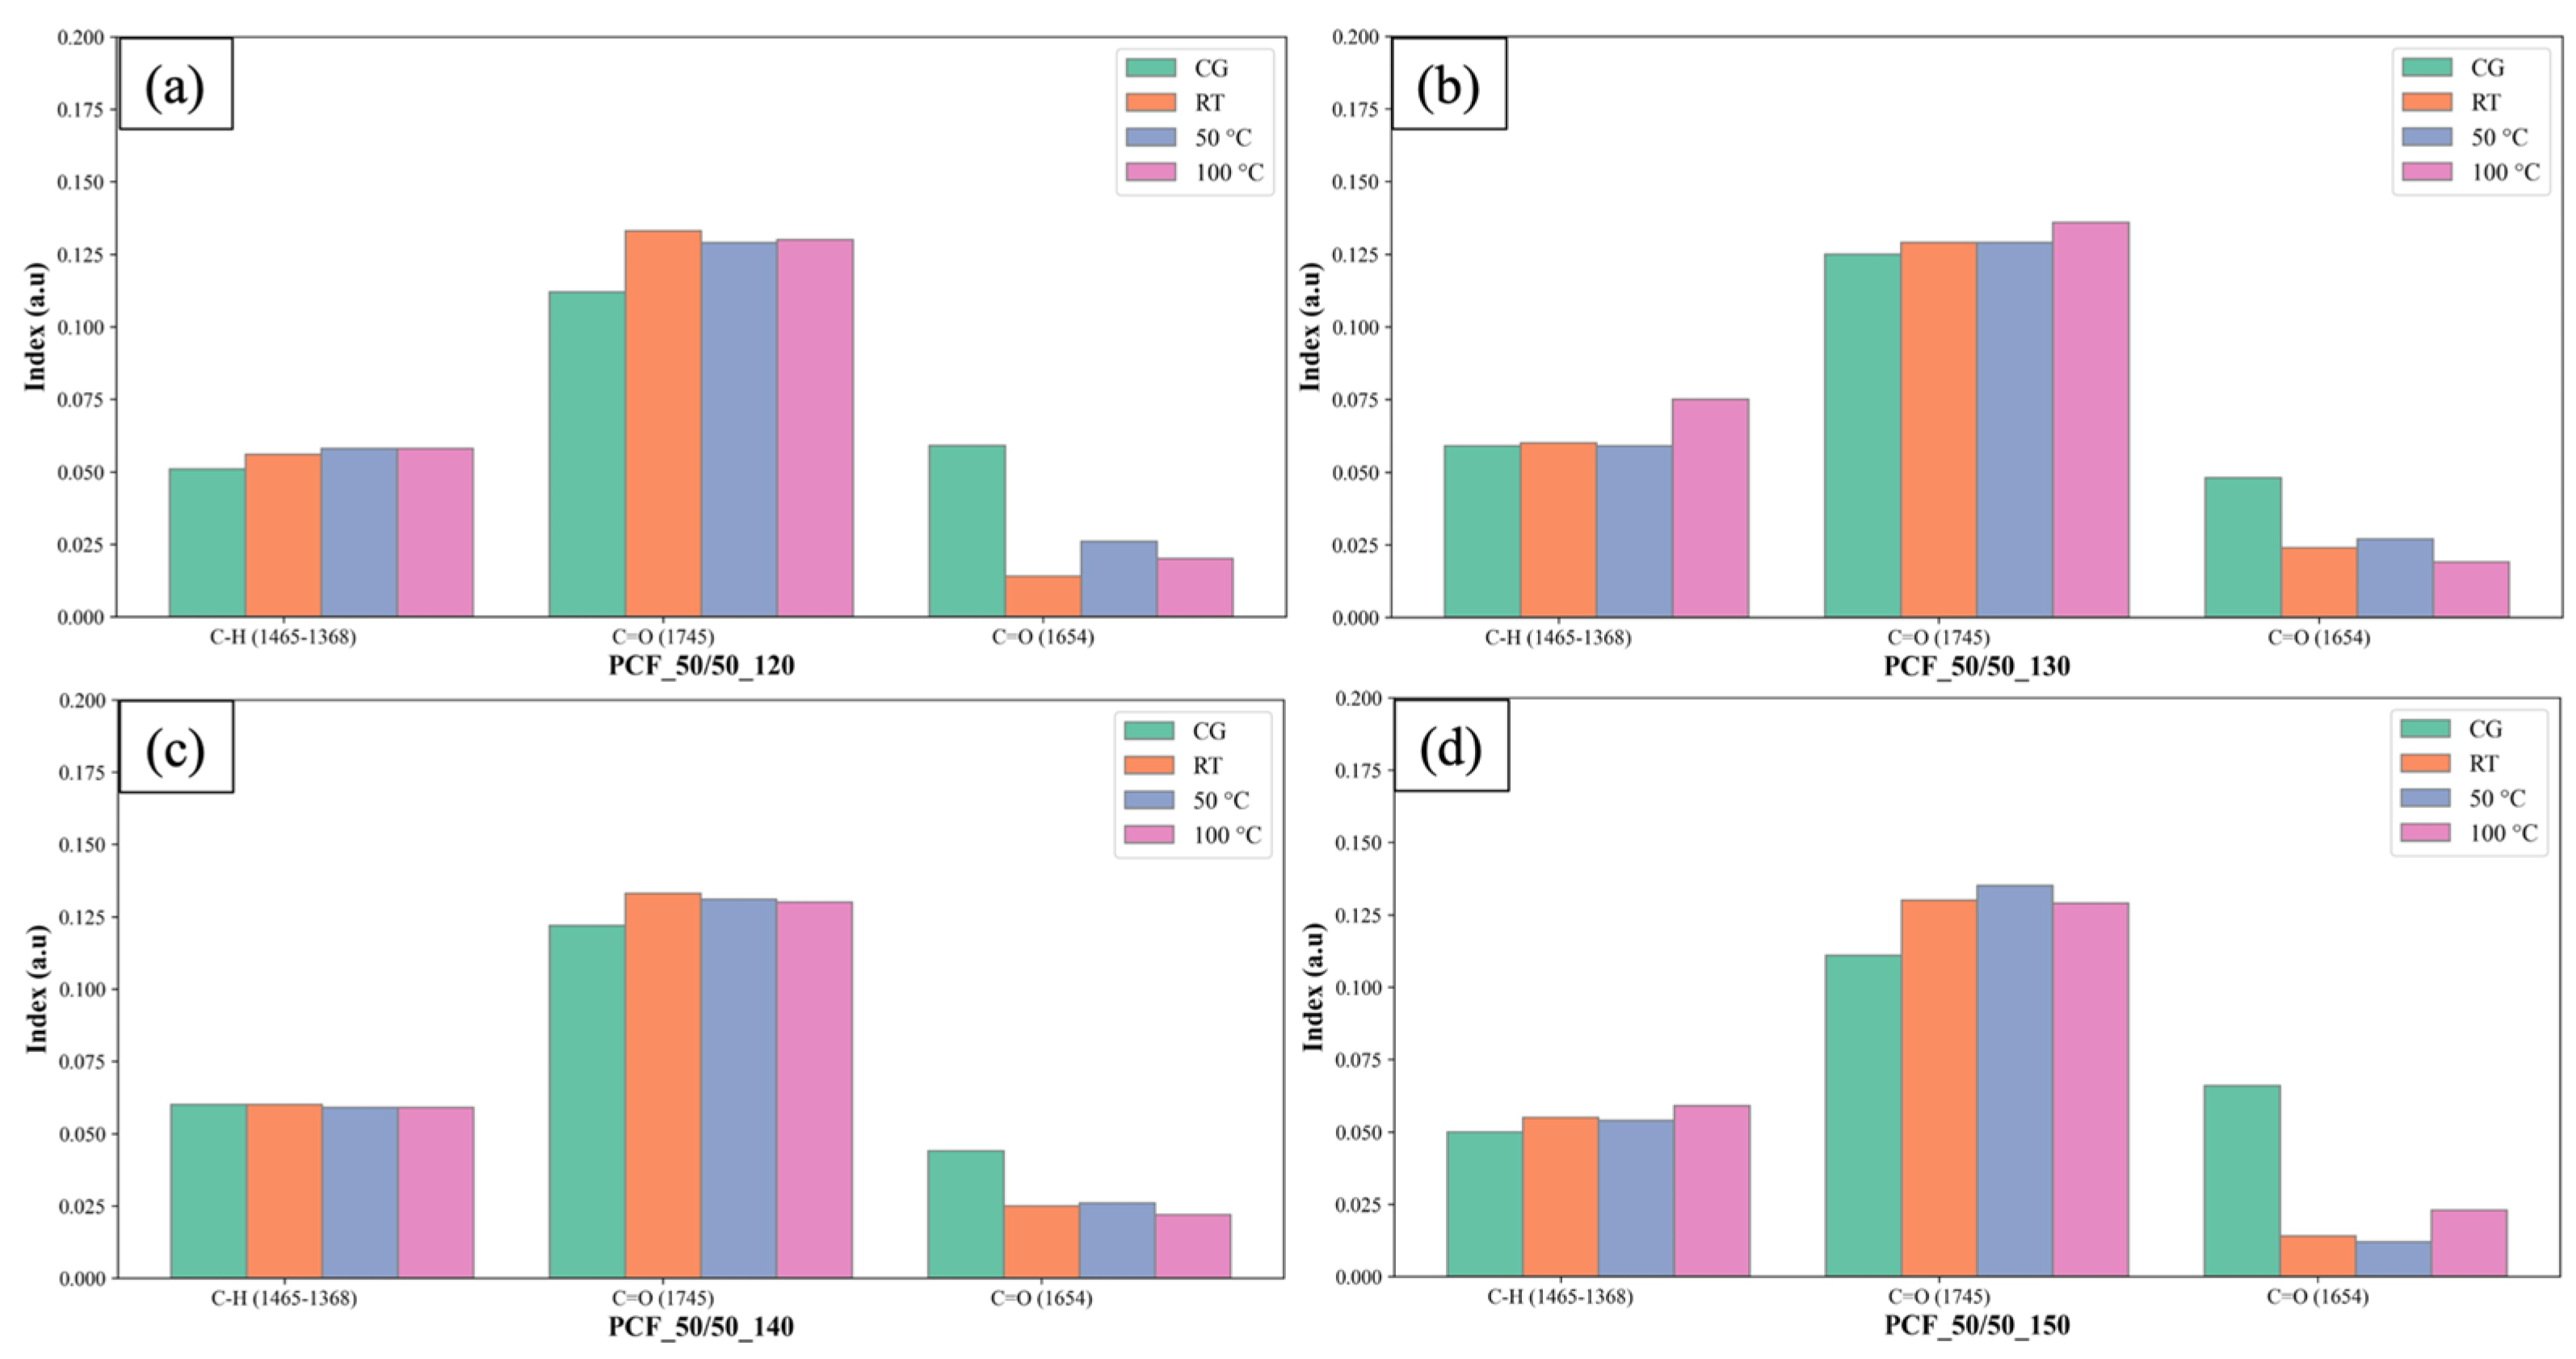
2.7.2. Index Calculation
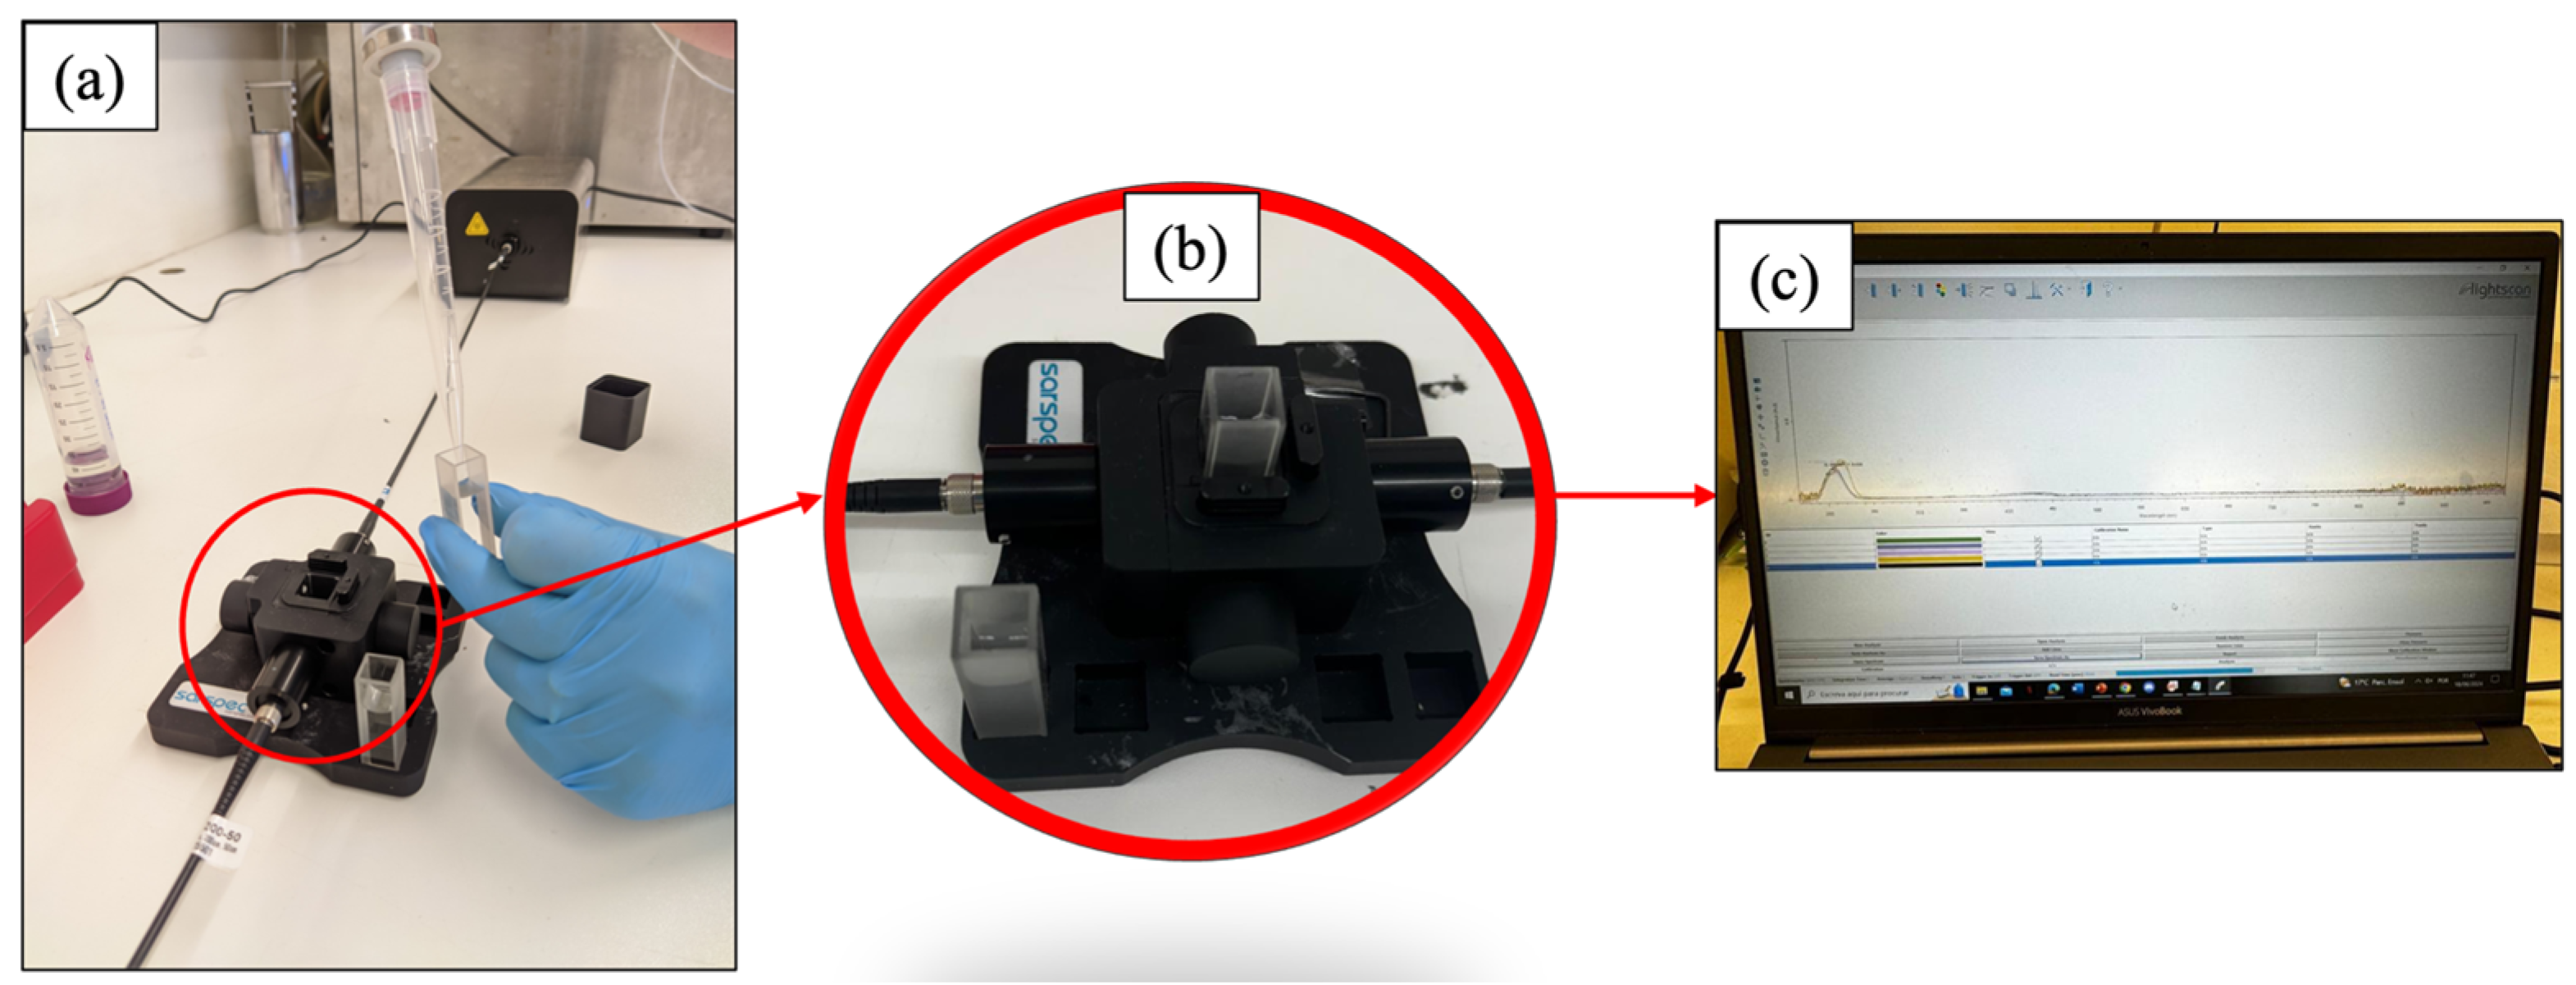
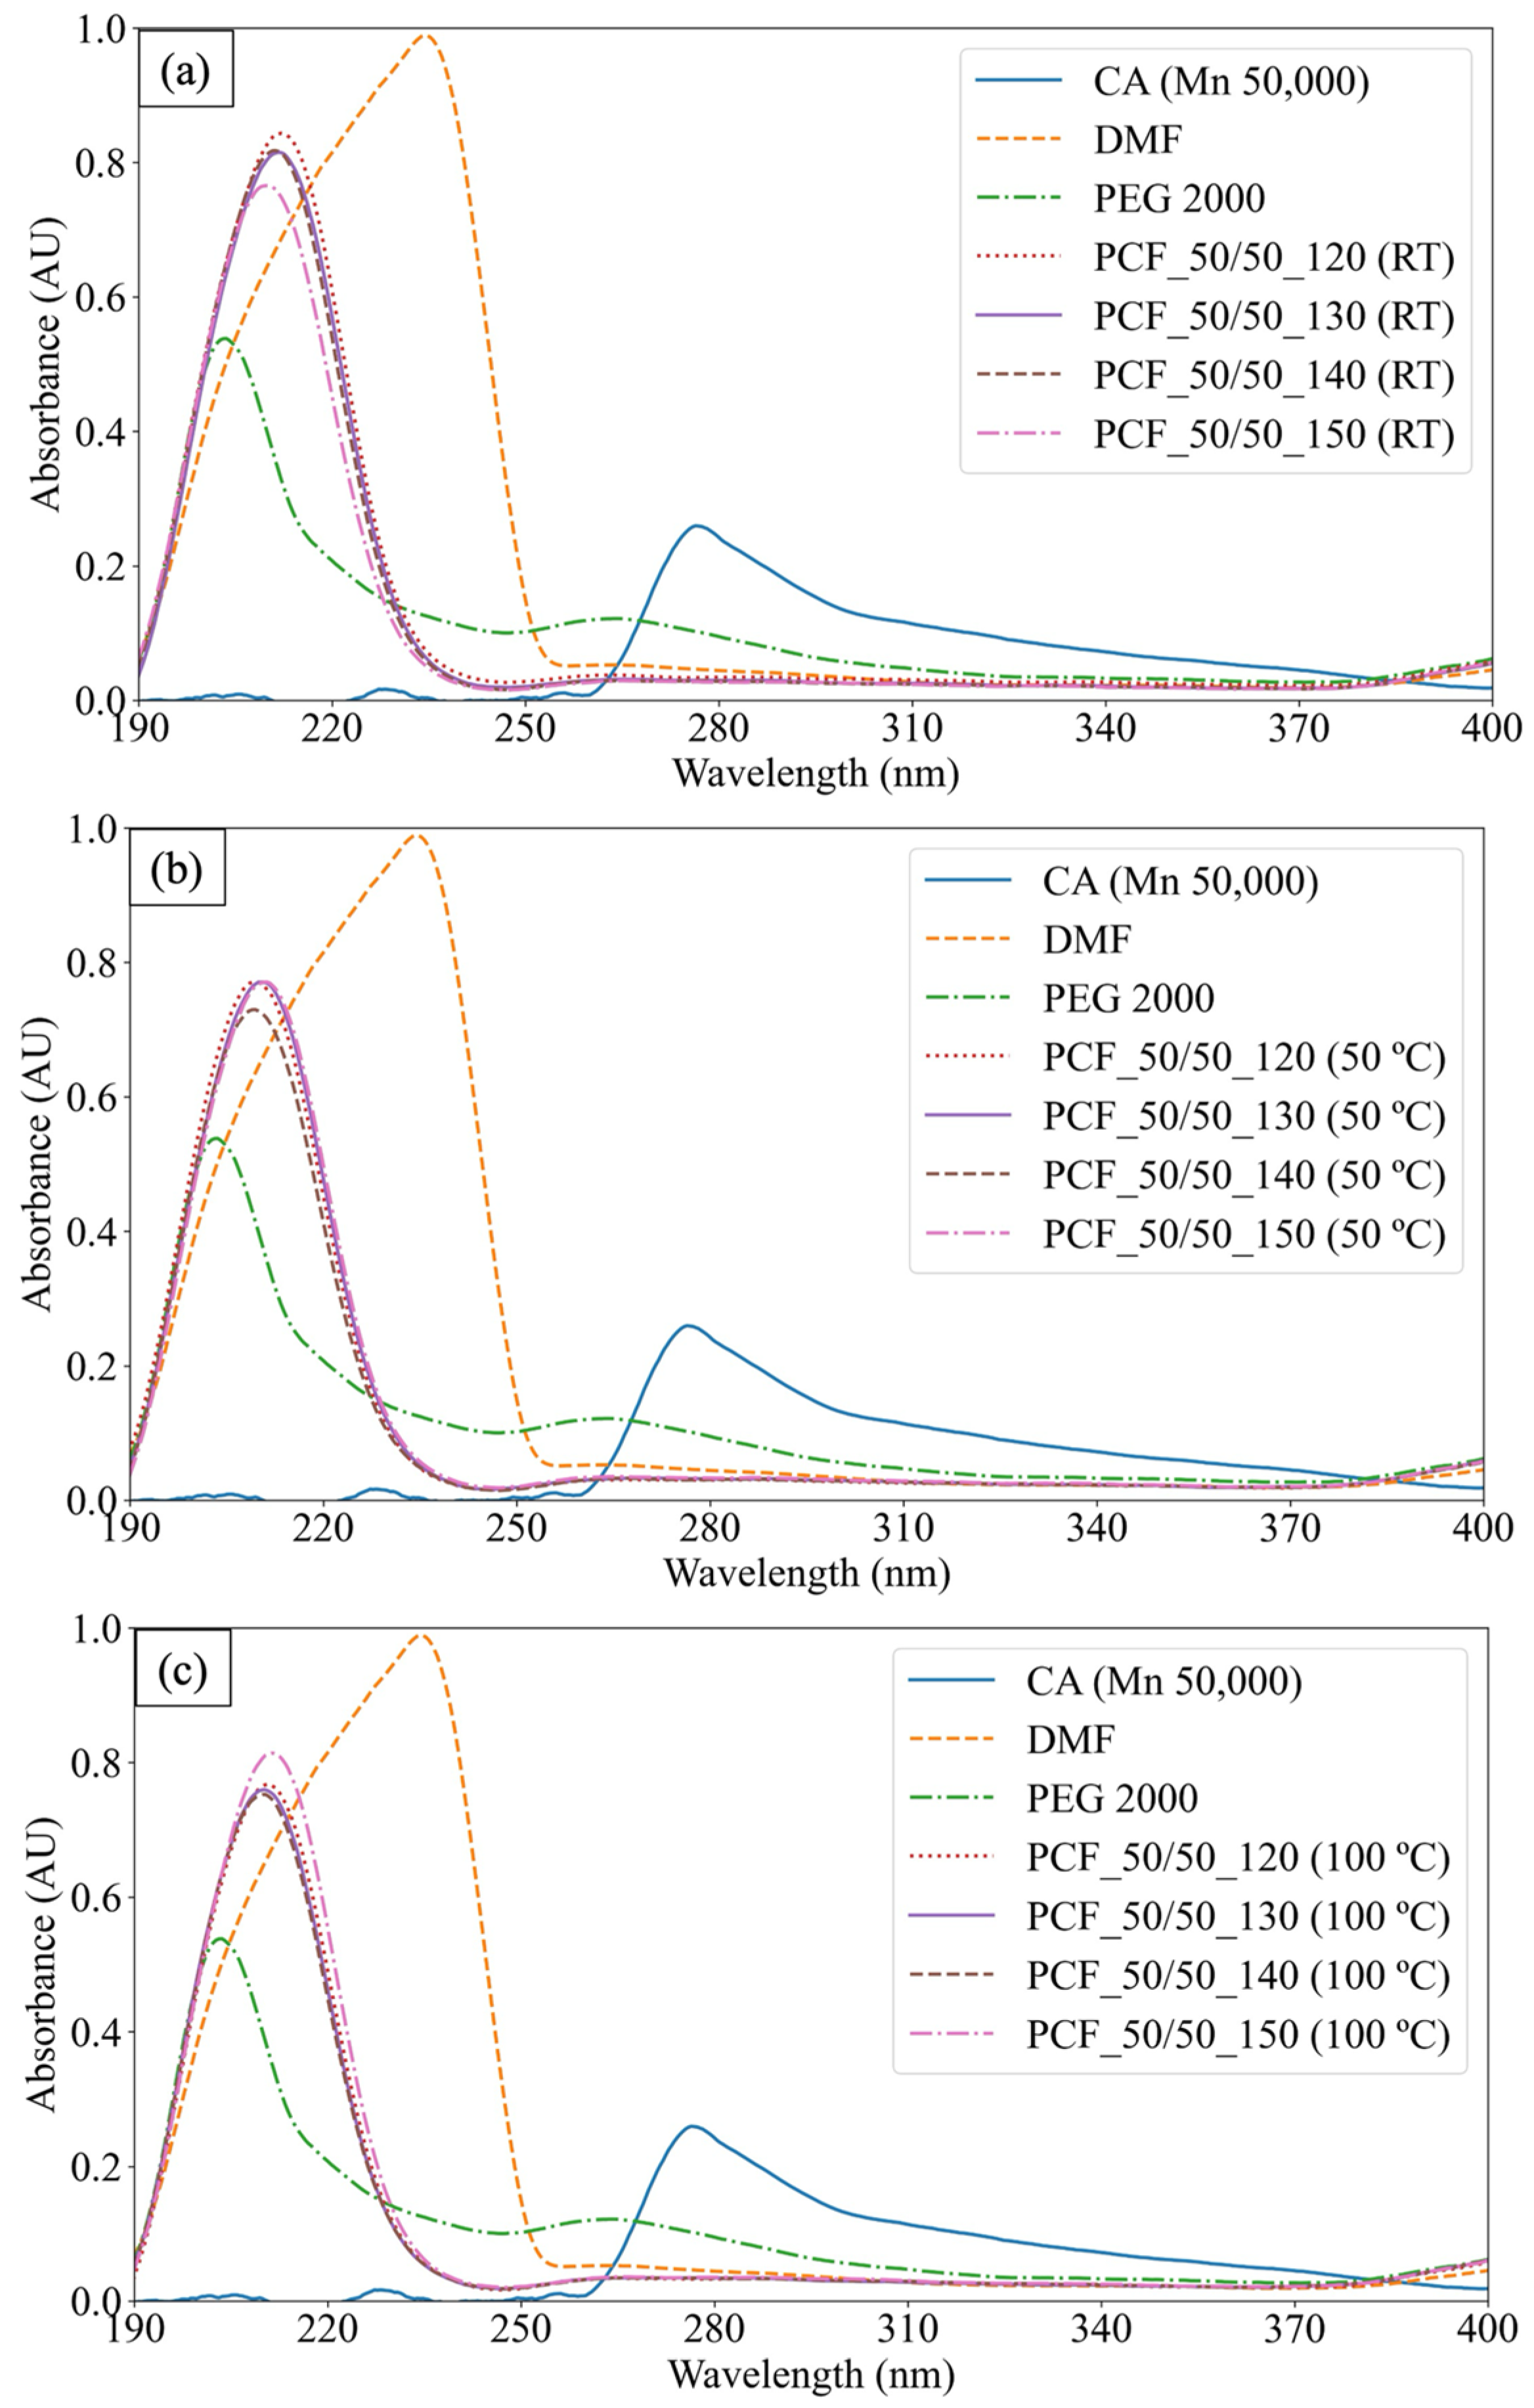
2.8. UV-Visible Spectroscopy
3. Results
3.1. Morphology
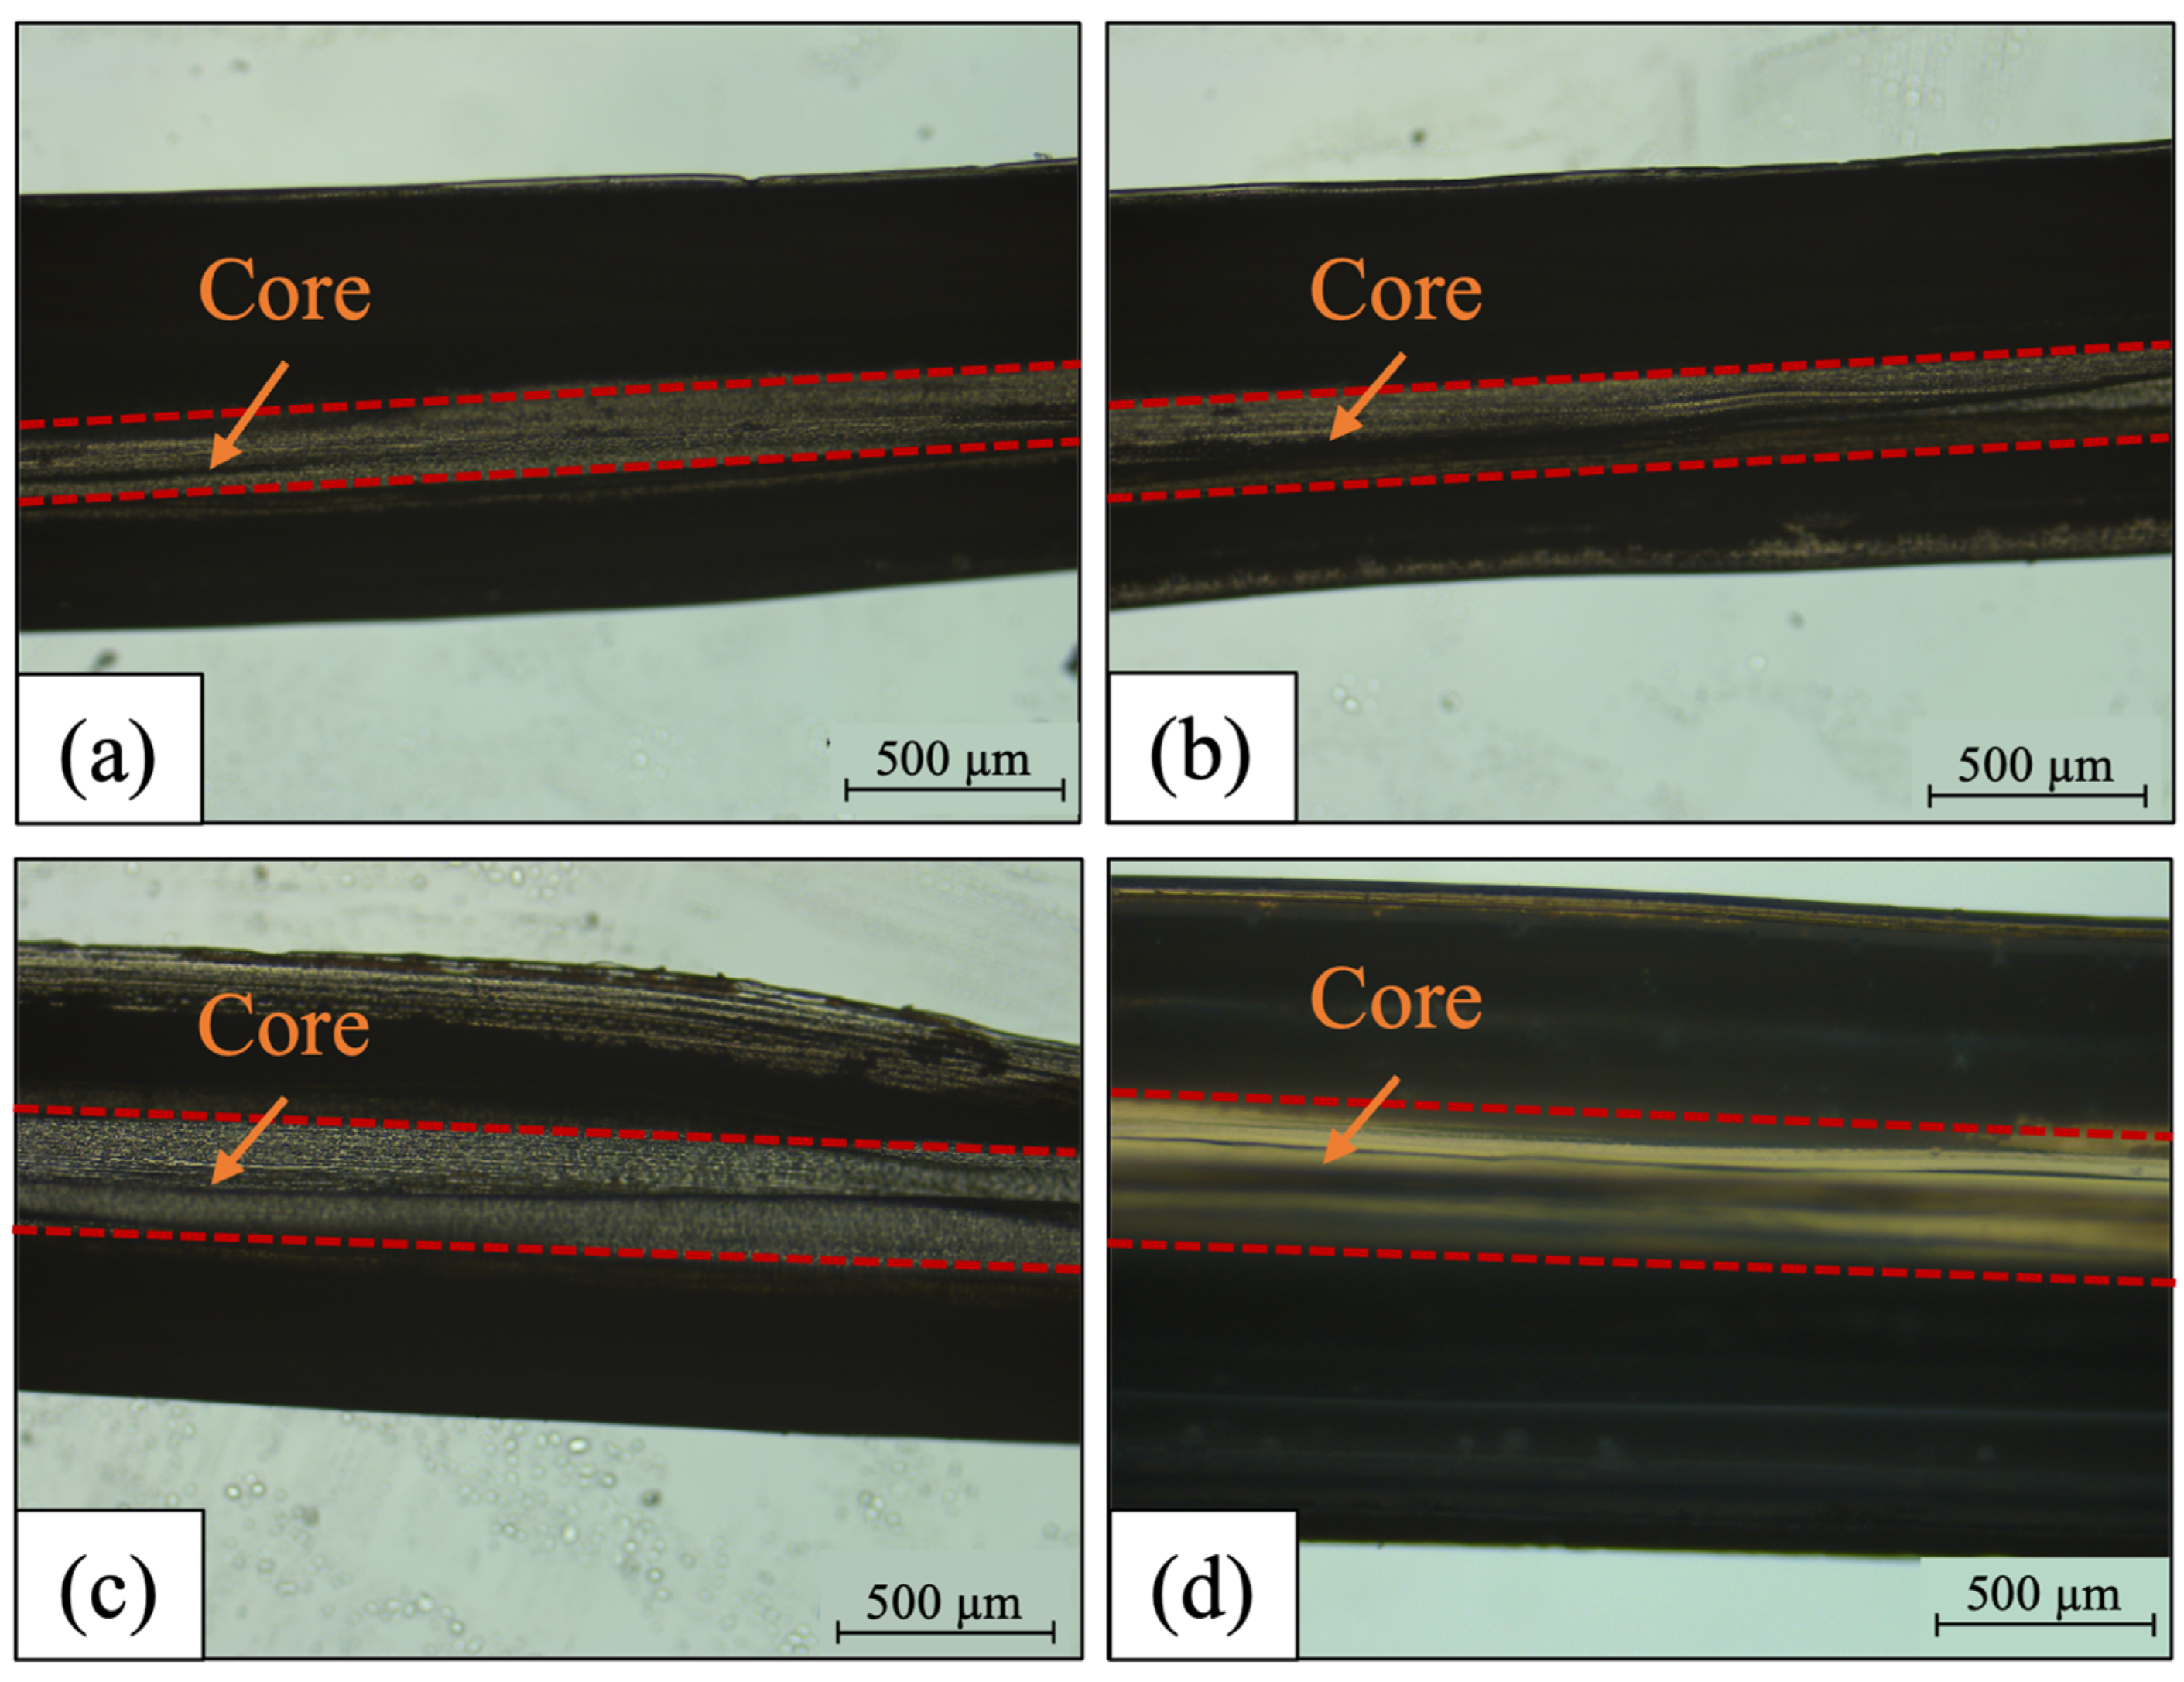
3.1.1. Morphological Structure of PCFs
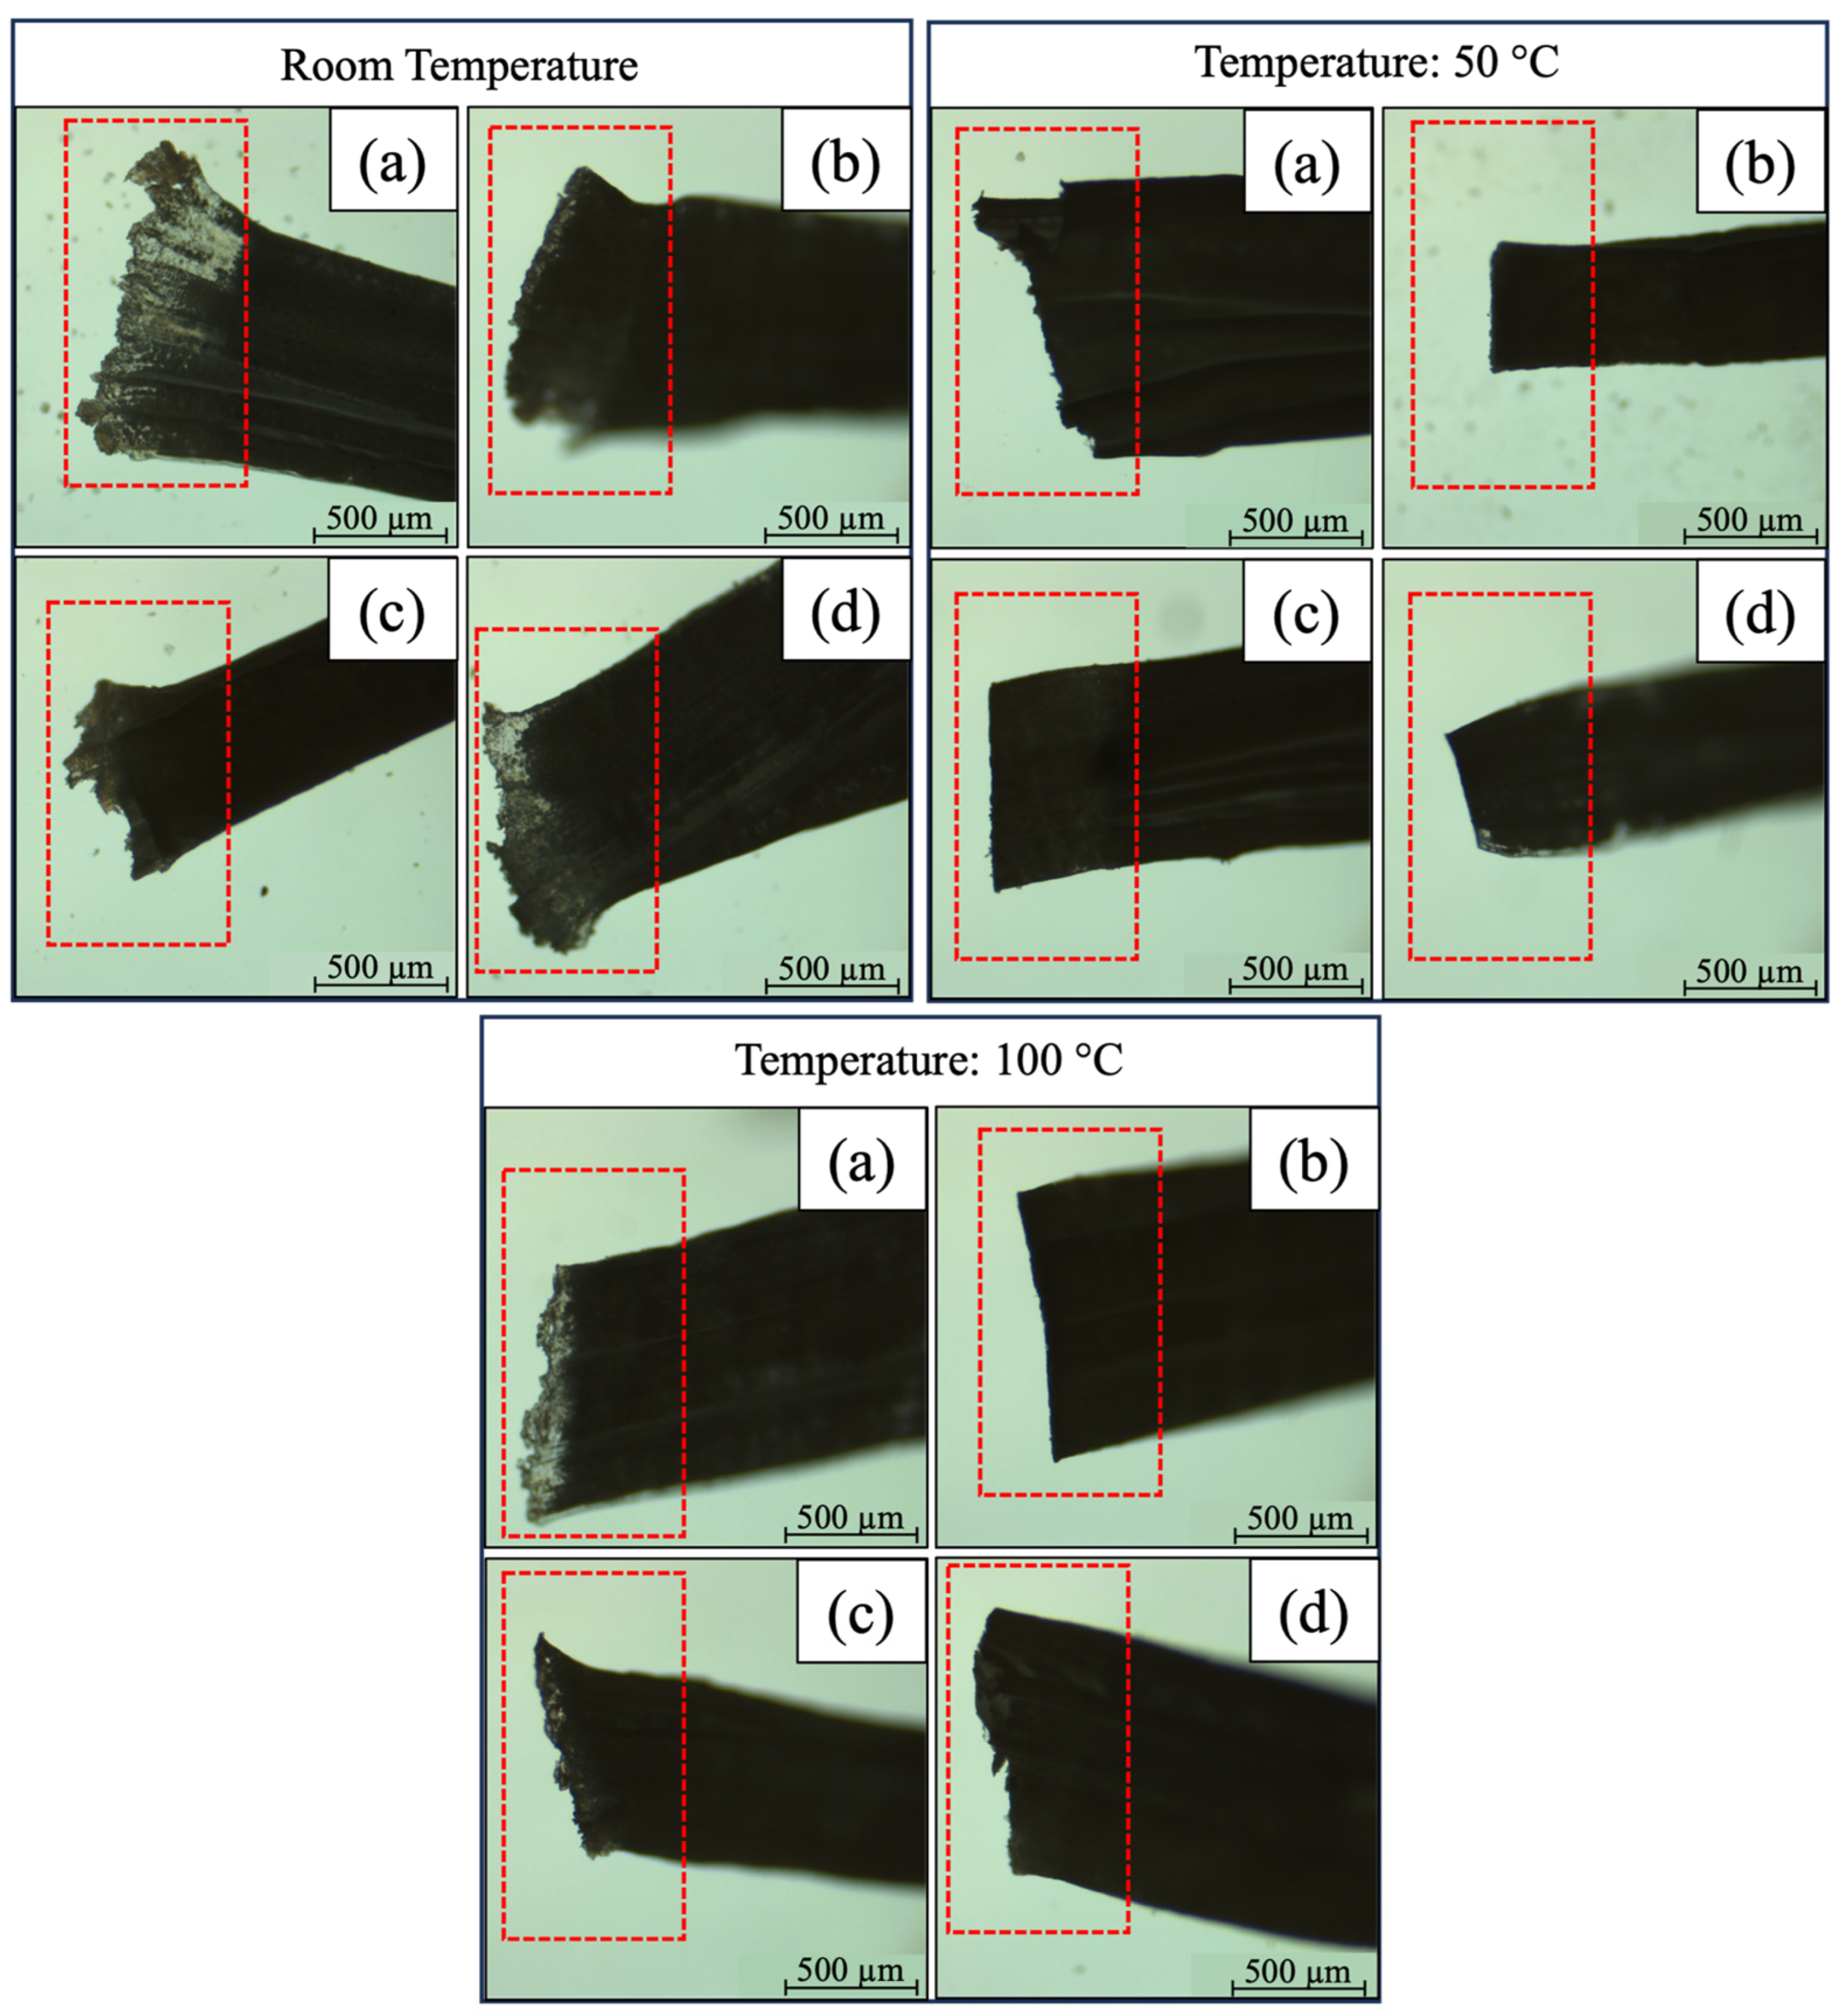
3.1.2. Hot Cutting Analysis
3.2. Chemical Test
3.3. Absorbance Measurements for Controlled Washing
4. Conclusions
Author Contributions
Funding
Institutional Review Board Statement
Informed Consent Statement
Data Availability Statement
Conflicts of Interest
References
- Segundo, I.R.; Freitas, E.; Branco, V.T.F.C.; Landi, S.; Costa, M.F.; Carneiro, J.O. Review and Analysis of Advances in Functionalized, Smart, and Multifunctional Asphalt Mixtures. Renew. Sustain. Energy Rev. 2021, 151, 111552. [Google Scholar] [CrossRef]
- Vardhu, V.A.K.; Sharma, A. Classification, Mitigations and Methods to Detect UHI: A Review. Int. J. Sci. Res. Eng. Manag. 2023, 7, 2–3. [Google Scholar] [CrossRef]
- Matos, A.M.; Delgado, J.M.P.Q.; Guimarães, A.S. Linking Energy Poverty with Thermal Building Regulations and Energy Efficiency Policies in Portugal. Energies 2022, 15, 329. [Google Scholar] [CrossRef]
- Pinheiro, C.; Landi, S.; Lima, O.; Ribas, L.; Hammes, N.; Segundo, I.R.; Homem, N.C.; Castelo Branco, V.; Freitas, E.; Costa, M.F.; et al. Advancements in Phase Change Materials in Asphalt Pavements for Mitigation of Urban Heat Island Effect: Bibliometric Analysis and Systematic Review. Sensors 2023, 23, 7741. [Google Scholar] [CrossRef] [PubMed]
- Sabah, L.; Abdulateef, J. Performance Enhancement of Shell and Tube Latent Thermal Storage System Using Copper Foam. Diyala J. Eng. Sci. 2022, 15, 31–41. [Google Scholar] [CrossRef]
- Sharma, R.; Jang, J.G.; Hu, J.W. Phase-Change Materials in Concrete: Opportunities and Challenges for Sustainable Construction and Building Materials. Materials 2022, 15, 335. [Google Scholar] [CrossRef] [PubMed]
- Anupam, B.R.; Sahoo, U.C.; Rath, P. Phase Change Materials for Pavement Applications: A Review. Constr. Build. Mater. 2020, 247, 118553. [Google Scholar] [CrossRef]
- Al-Yasiri, Q.; Szabó, M. Incorporation of Phase Change Materials into Building Envelope for Thermal Comfort and Energy Saving: A Comprehensive Analysis. J. Build. Eng. 2021, 36, 102122. [Google Scholar] [CrossRef]
- Wang, Z.; Xie, Y.; Mu, M.; Feng, L.; Xie, N.; Cui, N. Materials to Mitigate the Urban Heat Island Effect for Cool Pavement: A Brief Review. Buildings 2022, 12, 1221. [Google Scholar] [CrossRef]
- Wang, X.; Ma, B.; Li, S.; Si, W.; Wei, K.; Zhang, H.; Zhou, X.; Fang, Y.; Kang, X.; Shi, W. Review on Application of Phase Change Materials in Asphalt Pavement. J. Traffic Transp. Eng. Engl. Ed. 2023, 10, 185–229. [Google Scholar] [CrossRef]
- Asadi, I.; Jacobsen, S.; Baghban, M.H.; Maghfouri, M.; Hashemi, M. Reviewing the Potential of Phase Change Materials in Concrete Pavements for Anti-Freezing Capabilities and Urban Heat Island Mitigation. Buildings 2023, 13, 3072. [Google Scholar] [CrossRef]
- Hammes, N.; Pinheiro, C.; Segundo, I.R.; Homem, N.C.; Silva, M.M.; Felgueiras, H.P.; Soares, G.M.B.; Freitas, E.; Costa, M.F.M.; Carneiro, J.A.O. Coaxial Fibres Incorporated with Phase Change Materials for Thermoregulation Applications. Appl. Sci. 2024, 14, 2473. [Google Scholar] [CrossRef]
- Rohani Shirvan, A.; Nouri, A.; Sutti, A. A Perspective on the Wet Spinning Process and Its Advancements in Biomedical Sciences. Eur. Polym. J. 2022, 181, 111681. [Google Scholar] [CrossRef]
- Homem, N.C.; Tavares, T.D.; Miranda, C.S.; Antunes, J.C.; Amorim, M.T.P.; Felgueiras, H.P. Functionalization of Crosslinked Sodium Alginate/Gelatin Wet-Spun Porous Fibers with Nisin z for the Inhibition of Staphylococcus Aureus-Induced Infections. Int. J. Mol. Sci. 2021, 22, 1930. [Google Scholar] [CrossRef] [PubMed]
- Li, X.; Li, Q.; Hu, J.; Li, R.; Lin, J.; Liu, Y. Core-Sheath Phase Change Fibers via Coaxial Wet Spinning for Solar Energy Active Storage. Compos. Part B Eng. 2022, 247, 110346. [Google Scholar] [CrossRef]
- Mahrle, A.; Beyer, E. Theoretical Aspects of Fibre Laser Cutting. J. Phys. D Appl. Phys. 2009, 42, 175507. [Google Scholar] [CrossRef]
- Peters, K. Polymer Optical Fiber Sensors—A Review. Smart Mater. Struct. 2011, 20, 013002. [Google Scholar] [CrossRef]
- Law, S.H.; Harvey, J.D.; Kruhlak, R.J.; Song, M.; Wu, E.; Barton, G.W.; Van Eijkelenborg, M.A.; Large, M.C.J. Cleaving of Microstructured Polymer Optical Fibres. Opt. Commun. 2006, 258, 193–202. [Google Scholar] [CrossRef]
- Chiang, J.S. Analysis of Leaky Modes in Photonic Crystal Fibers Using the Surface Integral Equation Method. Crystals 2018, 8, 177. [Google Scholar] [CrossRef]
- Santos-Sauceda, I.; Castillo-Ortega, M.M.; del Castillo-Castro, T.; Armenta-Villegas, L.; Ramírez-Bon, R. Electrospun Cellulose Acetate Fibers for the Photodecolorization of Methylene Blue Solutions under Natural Sunlight. Polym. Bull. 2021, 78, 4419–4438. [Google Scholar] [CrossRef]
- Qiu, J.; Huo, D.; Xia, Y. Phase-Change Materials for Controlled Release and Related Applications. Adv. Mater. 2020, 32, e2000660. [Google Scholar] [CrossRef] [PubMed]
- Lamontagne, J.; Dumas, P.; Mouillet, V.; Kister, J. Comparison by Fourier Transform Infrared (FTIR) Spectroscopy of Different Ageing Techniques: Application to Road Bitumens. Fuel 2001, 80, 483–488. [Google Scholar] [CrossRef]
- Liang, X.; Kong, Y.; Sun, H.; Zhao, R.; Jiao, L.; Zhang, W.; Liu, B. Study on the Interaction Mechanism of Methoxy Polyethylene Glycol Maleimide with Sweet Potato β-Amylase. Molecules 2023, 28, 2188. [Google Scholar] [CrossRef] [PubMed]
- Swapnil, S.I.; Datta, N.; Mahmud, M.M.; Jahan, R.A.; Arafat, M.T. Morphology, Mechanical, and Physical Properties of Wet-Spun Cellulose Acetate Fiber in Different Solvent-Coagulant Systems and in-Situ Crosslinked Environment. J. Appl. Polym. Sci. 2021, 138, 50358. [Google Scholar] [CrossRef]
- Zhuang, J.; Li, M.; Pu, Y.; Ragauskas, A.J.; Yoo, C.G. Observation of Potential Contaminants in Processed Biomass Using Fourier Transform Infrared Spectroscopy. Appl. Sci. 2020, 10, 4345. [Google Scholar] [CrossRef]
- Frisoni, G.; Baiardo, M.; Scandola, M.; Lednická, D.; Cnockaert, M.C.; Mergaert, J.; Swings, J. Natural Cellulose Fibers: Heterogeneous Acetylation Kinetics and Biodegradation Behavior. Biomacromolecules 2001, 2, 476–482. [Google Scholar] [CrossRef]
- Snyder, R.G.; Hsut, S.L.; Krimm, S.; Randall, H.M. Vibrational Spectp in the C-H Stretching Region and the Structure of the Polymethylene Chain. Spectrochim. Acta Part A Mol. Spectrosc. 1978, 34, 395–406. [Google Scholar] [CrossRef]
- Quan, S.; Li, S.; Wang, Z.; Yan, X.; Guo, Z.; Shao, L. A Bio-Inspired CO2-Philic Network Membrane for Enhanced Sustainable Gas Separation. J. Mater. Chem. A 2015, 3, 13758–13766. [Google Scholar] [CrossRef]
- Segundo, I.R.; Landi, S.; Margaritis, A.; Pipintakos, G.; Freitas, E.; Vuye, C.; Blom, J.; Tytgat, T.; Denys, S.; Carneiro, J. Physicochemical and Rheological Properties of a Transparent Asphalt Binder Modified with Nano-TiO2. Nanomaterials 2020, 10, 2152. [Google Scholar] [CrossRef]
- Yazdani, M.R.; Ajdary, R.; Kankkunen, A.; Rojas, O.J.; Seppälä, A. Cellulose Nanofibrils Endow Phase-Change Polyethylene Glycol with Form Control and Solid-to-Gel Transition for Thermal Energy Storage. ACS Appl. Mater. Interfaces 2021, 13, 6188–6200. [Google Scholar] [CrossRef] [PubMed]
- Culica, M.E.; Chibac-Scutaru, A.L.; Melinte, V.; Coseri, S. Cellulose Acetate Incorporating Organically Functionalized CeO2 NPs: Efficient Materials for UV Filtering Applications. Materials 2020, 13, 2955. [Google Scholar] [CrossRef] [PubMed]
- Milesevic, D.; Popat, D.; Robertson, P.; Vallance, C. Photodissociation Dynamics of N,N-Dimethylformamide at 225 Nm and 245 Nm. Phys. Chem. Chem. Phys. 2022, 24, 28343–28352. [Google Scholar] [CrossRef] [PubMed]
- Todica, M.; Stan, O.; Pop, C.V.; Răzvan, Ș.; Niculăescu, C. Investigation of Polyethylene Glycol with Embedded Gold Nanoparticles Membranes. Rom. J. Phys. 2020, 65, 702. [Google Scholar]


Disclaimer/Publisher’s Note: The statements, opinions and data contained in all publications are solely those of the individual author(s) and contributor(s) and not of MDPI and/or the editor(s). MDPI and/or the editor(s) disclaim responsibility for any injury to people or property resulting from any ideas, methods, instructions or products referred to in the content. |
© 2024 by the authors. Licensee MDPI, Basel, Switzerland. This article is an open access article distributed under the terms and conditions of the Creative Commons Attribution (CC BY) license (https://creativecommons.org/licenses/by/4.0/).
Share and Cite
Hammes, N.; Monteiro, J.; Pinheiro, C.; Felgueiras, H.P.; Soares, G.M.B.; Segundo, I.R.; Costa, M.F.M.; Carneiro, J. Exploring the Cutting Process of Coaxial Phase Change Fibers under Optical Characterization Tests. Appl. Sci. 2024, 14, 8050. https://doi.org/10.3390/app14178050
Hammes N, Monteiro J, Pinheiro C, Felgueiras HP, Soares GMB, Segundo IR, Costa MFM, Carneiro J. Exploring the Cutting Process of Coaxial Phase Change Fibers under Optical Characterization Tests. Applied Sciences. 2024; 14(17):8050. https://doi.org/10.3390/app14178050
Chicago/Turabian StyleHammes, Nathalia, José Monteiro, Claver Pinheiro, Helena P. Felgueiras, Graça M. B. Soares, Iran Rocha Segundo, Manuel F. M. Costa, and Joaquim Carneiro. 2024. "Exploring the Cutting Process of Coaxial Phase Change Fibers under Optical Characterization Tests" Applied Sciences 14, no. 17: 8050. https://doi.org/10.3390/app14178050