Article

Large-Scale Physical Simulation Experiment of Water Invasion Law for Multi-Well Development in Sandstone Gas Reservoirs with Strong Water Drive

1
School of Petroleum Engineering, Chongqing University of Science and Technology, Chongqing 401331, China
2
Xinli Oil Production Plant, PetroChina Jilin Oilfield Company, Songyuan 138000, China
3
Research Institute of Petroleum Exploration and Development, PetroChina, Beijing 100083, China
*
Author to whom correspondence should be addressed.
Appl. Sci. 2024, 14(17), 8067; https://doi.org/10.3390/app14178067
Submission received: 26 July 2024 / Revised: 28 August 2024 / Accepted: 3 September 2024 / Published: 9 September 2024

Abstract

:
In order to clarify the water invasion law and residual gas distribution characteristics in edge and bottom water gas reservoirs with multi-well development, a large-scale three-dimensional physical simulation model was developed and a physical simulation experiment method for the water invasion law of multi-well development in sandstone gas reservoirs with strong water drives was established. Water invasion physical simulation experiments of multi-well development under the conditions of different water body multiples and production systems were conducted. The results show the following: (1) Gas wells near fractures and high-permeability zones experience the earliest water breakthrough. The larger the water body multiple, the faster the rate of water invasion, the earlier the water breakthrough time of gas wells, the more severe the degree of water invasion in gas reservoirs, and the lower the ultimate recovery rate. (2) Shutting in low-position gas wells immediately after water breakthrough reduces the overall water production of the gas reservoir and extends the overall water-free gas production period. However, the ultimate recovery rate is lower than when the wells are not shut in. (3) The residual gas in the fracture model is mainly distributed around the fracture and the edge of the gas reservoir, with the ultimate recovery rate ranging from 38.5% to 58.2%. The residual gas in the fracture–high-permeability zone model is mainly distributed around the fracture–high-permeability zone and the edge of the gas reservoir, with the ultimate recovery rate ranging from 28.32% to 41.8%. The experimental results have important guiding significance for the economical and efficient development of similar gas reservoirs.

1. Introduction

Most of the gas reservoirs in China belong to different degrees to the category of water drive gas reservoirs, of which 40–50% are active with edge and bottom water, and faults and fractures are commonly developed in this type of gas reservoir [1,2,3,4]. Internationally, water drive gas reservoirs are also common. Examples include the Orenburg gas reservoir in the Volga-Ural basin of Russia [5], the Mellon gas field in the Aquitaine basin of France [6], the Kelu and Hela gas fields in the Ouge basin of Ethiopia [7], and the right bank gas field cluster in the Amu Darya basin of Turkmenistan [8]. As the gas reservoir develops, formation pressure will continue to decline. Due to the pressure difference, edge and bottom water flow rapidly along fractures and high-permeability zones. The fluid flow in the formation gradually changes from gas single-phase seepage to gas–water two-phase seepage, resulting in gas seepage resistance increases, and the single-well productivity declines rapidly [9]. Meanwhile, much gas is trapped during water invasion by the cut-off, bypass flow, blind end, and water lock, reducing the ultimate recovery rate of gas reservoirs [10,11,12,13,14]. Moreover, with the aggravation of water invasion, the wellbore fluid increases, the abandonment pressure rises, and the gas–water simultaneous production, and even the shut-in due to waterflooding, production cost, and development difficulty significantly increase [15,16,17,18,19].
In recent years, many scholars have conducted numerous physical simulation experiments to study the law of water invasion in gas reservoirs. Shen et al. [20] considered the influences of different water body multiples, gas reservoir pressure, and single-well production allocation, carrying out physical simulation experiments utilizing three kinds of full-diameter long-core combination models designed to study the water invasion mechanism of fractured bottom water gas reservoirs. Wang et al. [21] established a physical simulation experimental model for multi-layer commingled production by combining typical reservoir cores in parallel according to the similarity criterion. Then, the model was used to study the influence of inter-layer heterogeneity, drawdown pressure, water saturation, and water invasion on the gas supply capacity. Huang et al. [22] conducted experiments using a visualization sand filling tube to study the effects of the dissolved gas on the law of the gas–water contact changes in the water-soluble gas release process. Fang et al. [23] developed physical simulation experiments of water invasion in fractured gas reservoirs using the fracture core samples generated by artificial fracturing to analyze the effects of water body multiples, gas production rates, matrix permeability, and fracture apertures on gas production. Zhou et al. [24] conducted the dynamic simulation of water invasion in fractured gas reservoirs based on the orthogonal experimental method to study the effects of fracture permeability, fracture penetration, and water body multiples on indexes such as recovery rate and water–gas ratio. Liu et al. [25] carried out physical simulation experiments of water invasion performance using fractured–porous full-diameter cores, converted the experimental results into evaluation parameters of water invasion performance by numerical inversion, and then studied the variation law of water invasion dynamics in fractured–porous water-bearing gas reservoirs. Hu et al. [26] selected natural cores for series and parallel combinations and proposed a physical simulation experiment method for multi-layer commingled production edge water gas reservoirs. Based on this method, they conducted an experiment on four-layer commingled production in one well under the three conditions of gas reservoirs without water invasion, with water invasion without flow, and with water invasion with flow, and studied the law and influencing factors of water invasion in multi-layer edge water gas reservoirs. Although many research results have been obtained regarding the water invasion law of fractured edge and bottom water gas reservoirs through physical simulation experiments, most studies have focused on single-well experiments, and the overall water invasion law during the simultaneous development of multiple wells has not been adequately studied. Meanwhile, the conventional-scale core experiment can only collect gas and water production data from the holder outlet without capturing dynamic parameters like pressure and saturation distribution inside the reservoir. Furthermore, due to the influence of model dimension, the experimental results only reflect the trending influence law, mainly qualitative knowledge. It is difficult to characterize the actual production performance of gas wells accurately, and these results cannot be directly applied to the field [27,28].
Therefore, based on the previous research [29,30], this paper takes the typical water-producing well area in the southwest of the Kela 2 gas field as the research object, develops a large-scale three-dimensional physical simulation model, and establishes a physical simulation experiment method for the water invasion law of multi-well development in sandstone gas reservoirs with a strong water drive. Based on this, the water invasion physical simulation experiments of multi-well development under different water body multiples and production systems were conducted. These experiments aimed to reveal the law of water invasion in the multi-well development of sandstone gas reservoirs with strong water drives and to clarify residual gas distribution characteristics. The findings provide experimental and theoretical bases for the rational and efficient development of this type of gas reservoir.

2. Methods

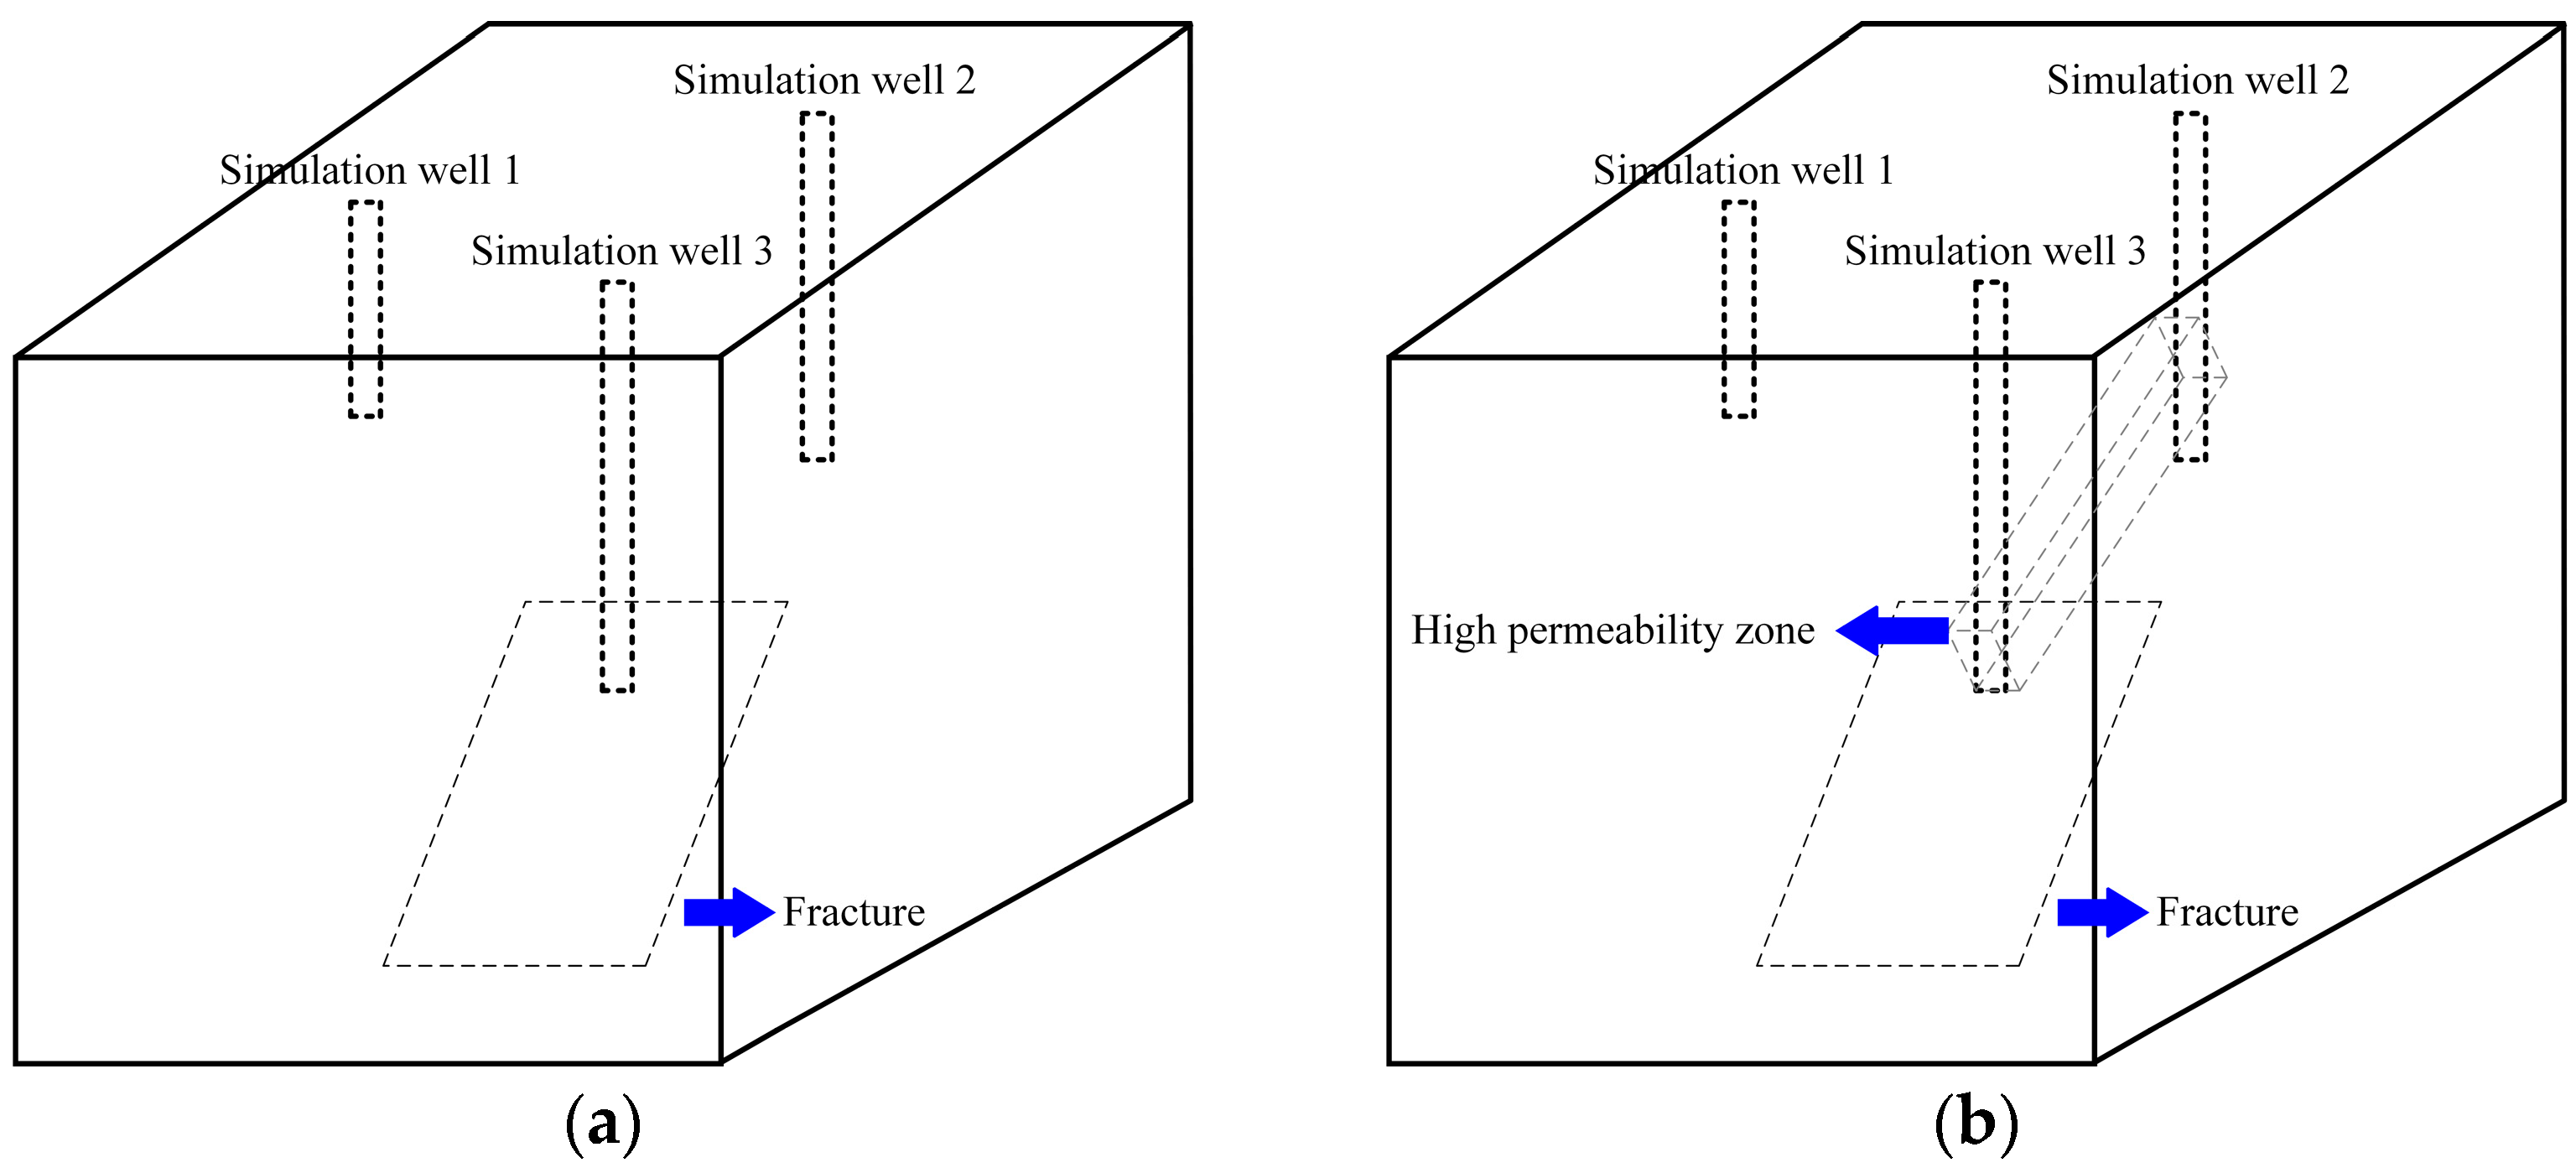
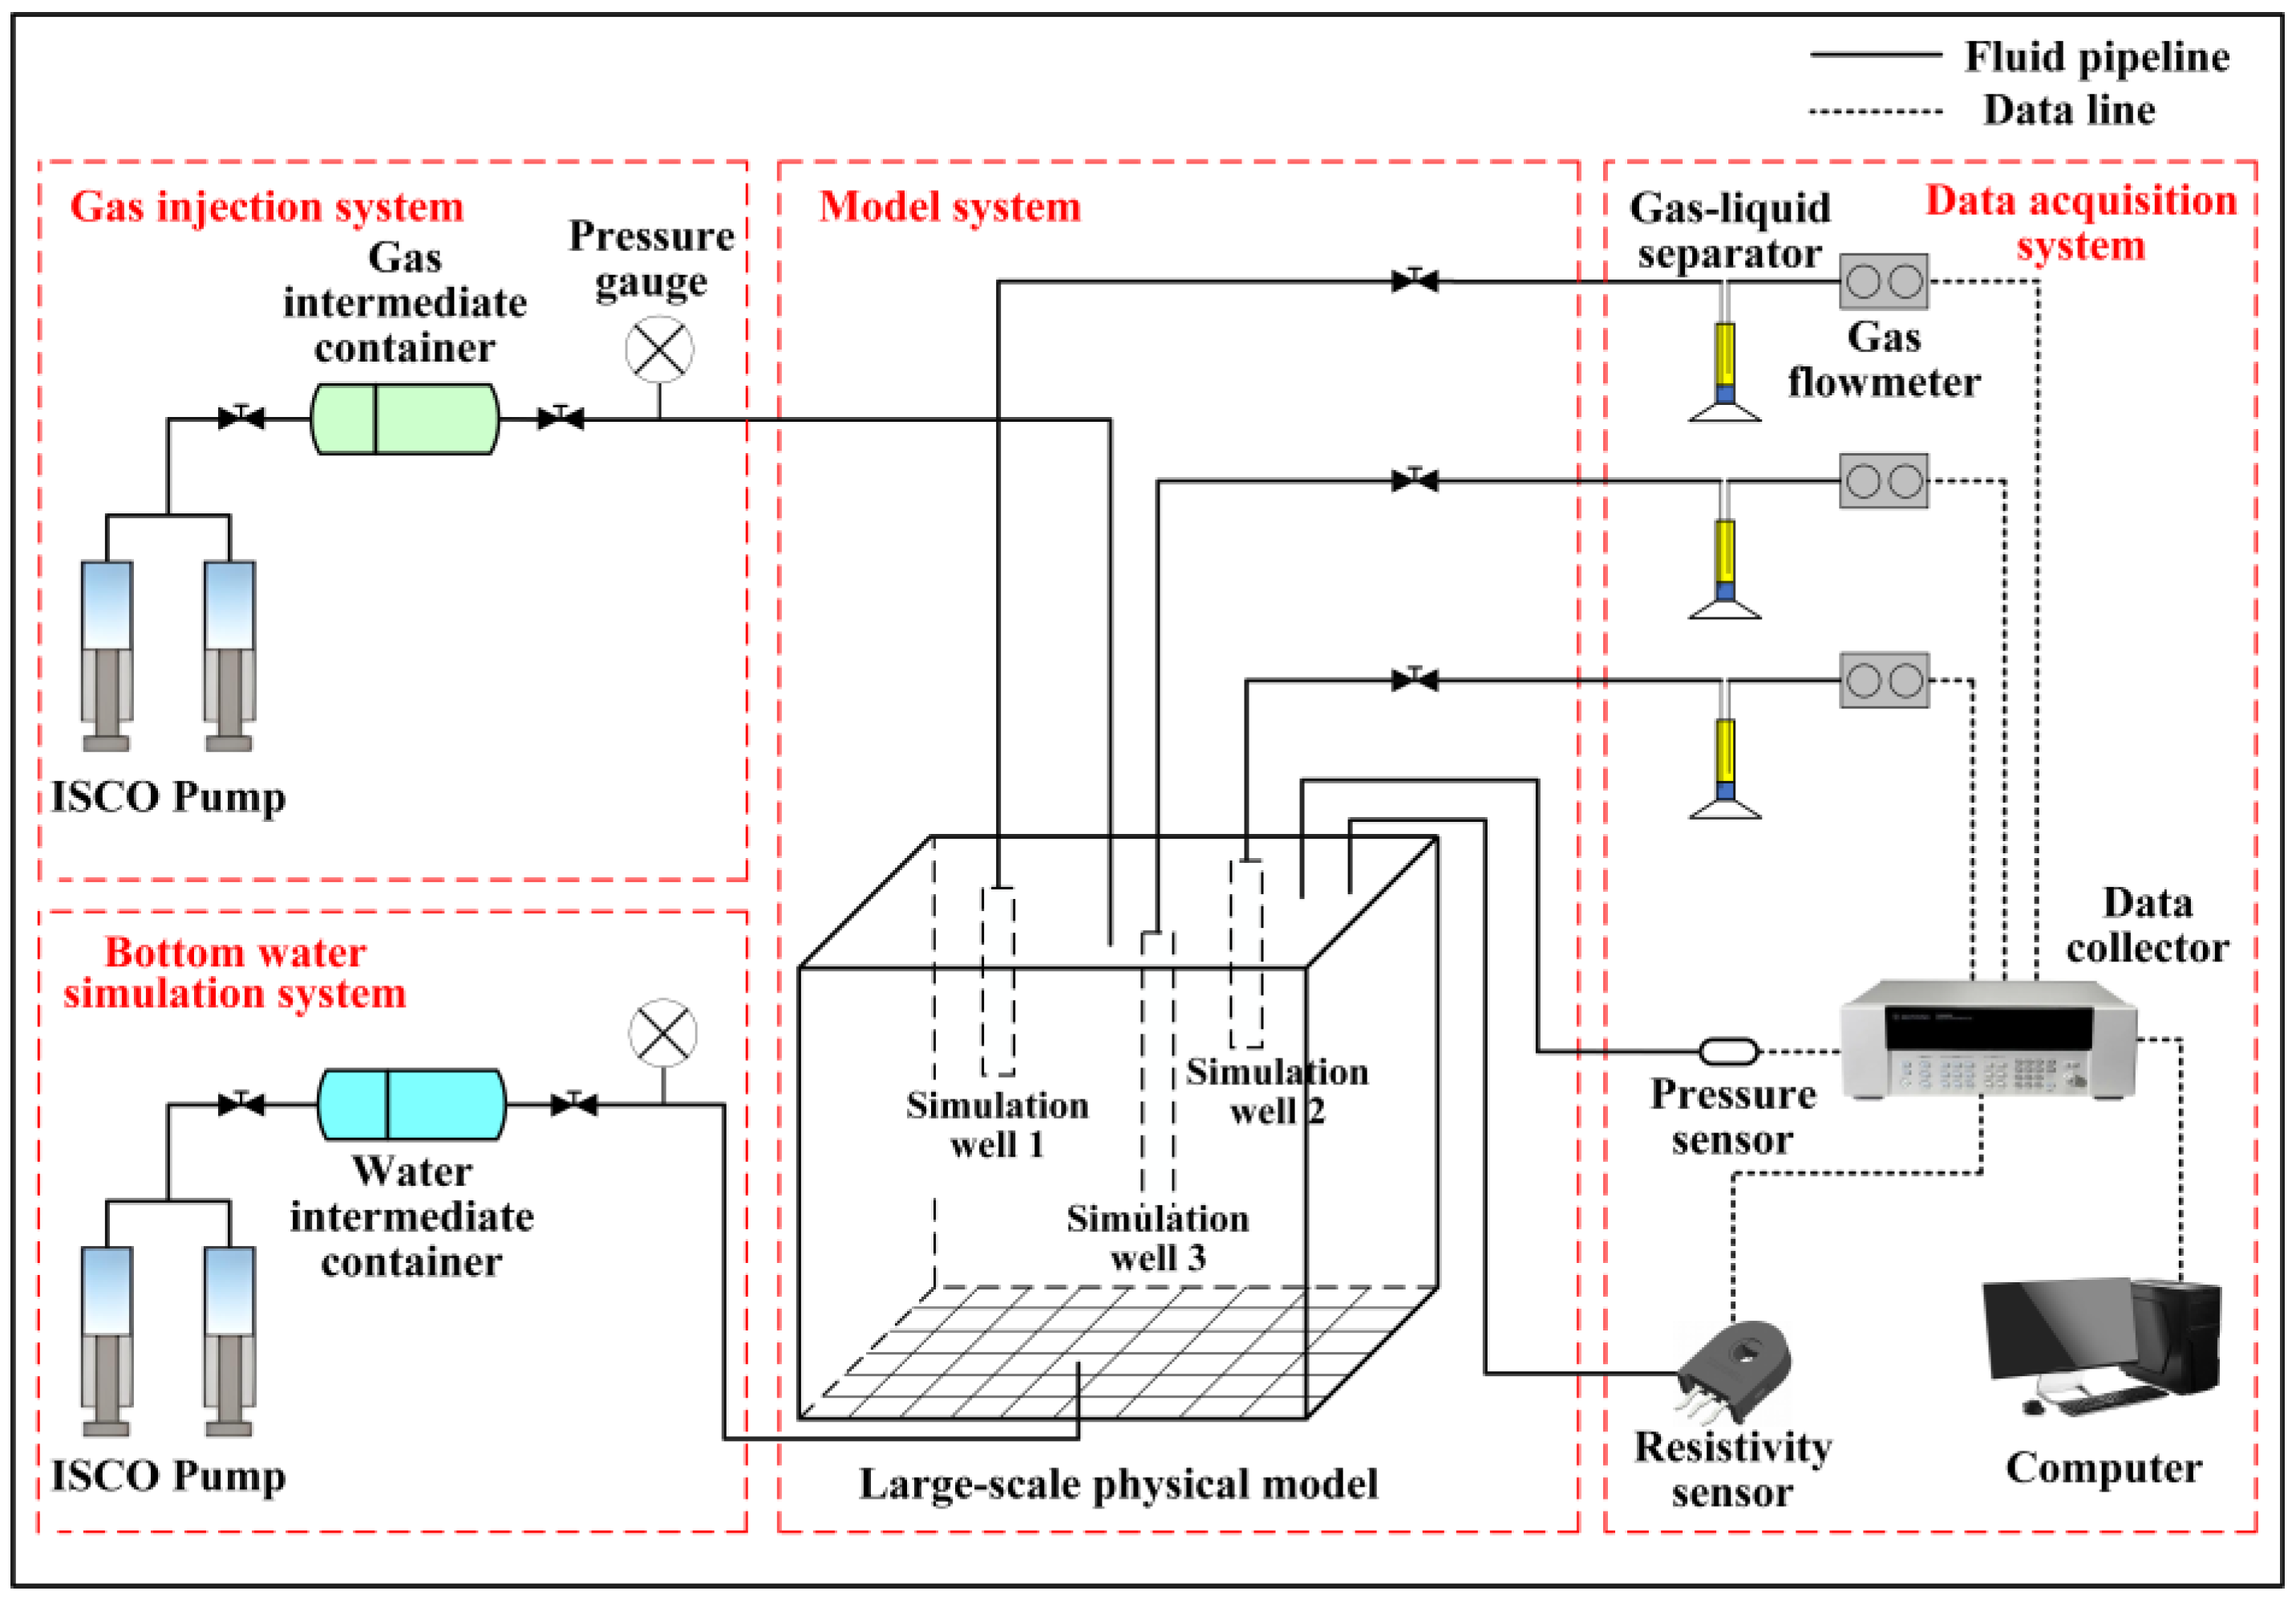
2.1. Experimental Model Design

The Kela 2 gas field is affected by the water body size and the physical properties of the reservoir, with water-producing wells mainly distributed at the east and west ends and the north wing of the gas field. The uplift rate of the gas–water interface at the east and west ends is much faster than that of the north and south wings (Figure 1). The faults and fractures are developed in the southwest, the edge and bottom water energy is strong, and the water-producing layer is continuous.
Therefore, the fracture and fracture–high-permeability zone models (Figure 2) were extracted from the typical water-producing well area (KL203, KL2-14, and KL2-13) southwest of the Kela 2 gas field. The designed experimental models measure 50 cm × 50 cm × 50 cm. The simulated well depths are 5 cm, 10 cm, and 20 cm, respectively (Figure 3). The main body of the experimental model was formed by compressing a mixture of 6% cementing agent content and 80 mesh quartz sand, supplemented by finer 120 mesh and 160 mesh quartz sand. The permeability of the experimental model is 10 × 10−3 μm2, and the porosity is 10%. The fracture surface was simulated by degradable EVA resin film material (30 cm × 20 cm × 0.2 mm), and the permeability increased from 10 × 10−3 μm2 to 635 × 10−3 μm2. The high-permeability zone is simulated by 50 mesh quartz sand and 3% cementing agent content (30 cm × 10 cm × 5 cm), and the permeability is 150 × 10−3 μm2. The front of the experimental model is uniformly arranged with 12 pressure measurement points and 24 resistivity measurement points. The former accurately records the pressure at different locations in the model in real time and reflects the reserve utilization status through the pressure changes. The latter monitors the resistivity at different locations in the model and reflects the change in gas saturation of the reservoir through the change in resistivity. The sieve net is set at the bottom of the experimental model, which makes up for the defect of conventional core point waterflooding and ensures that the water body is in uniform contact with the bottom of the model.

2.2. Experimental Scheme and Steps

As shown in Table 1, two physical models were used to carry out the water invasion physical simulation experiments of multi-well development under different water body multiples (no water body, 3 times water body, and 7 times water body) and production systems (no shut-in after water breakthrough and shut-in after water breakthrough).
As shown in Figure 4, the experimental process mainly includes the gas injection system, the bottom water simulation system, the model system, and the data acquisition system. The experimental steps are as follows:
(1)
The prepared physical model was loaded into a three-dimensional model holder and the confining pressure was added to 25 MPa.
(2)
After stabilizing the confining pressure, the physical model was slowly saturated with nitrogen (99.99%) to 20 MPa.
(3)
The simulated formation water (80 g/L) was loaded into the water body simulation system, pressurized to 20 MPa, and the water body multiple was set as required.
(4)
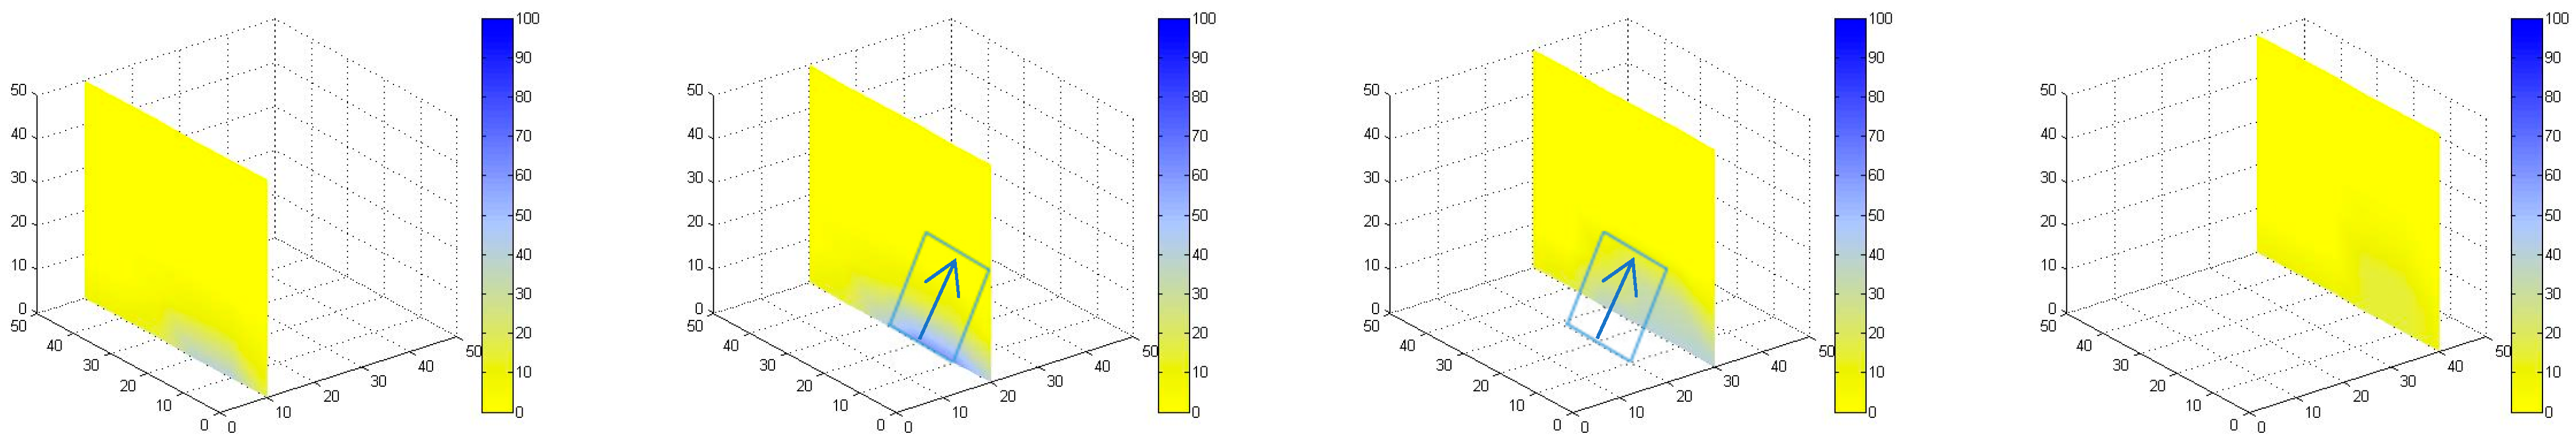
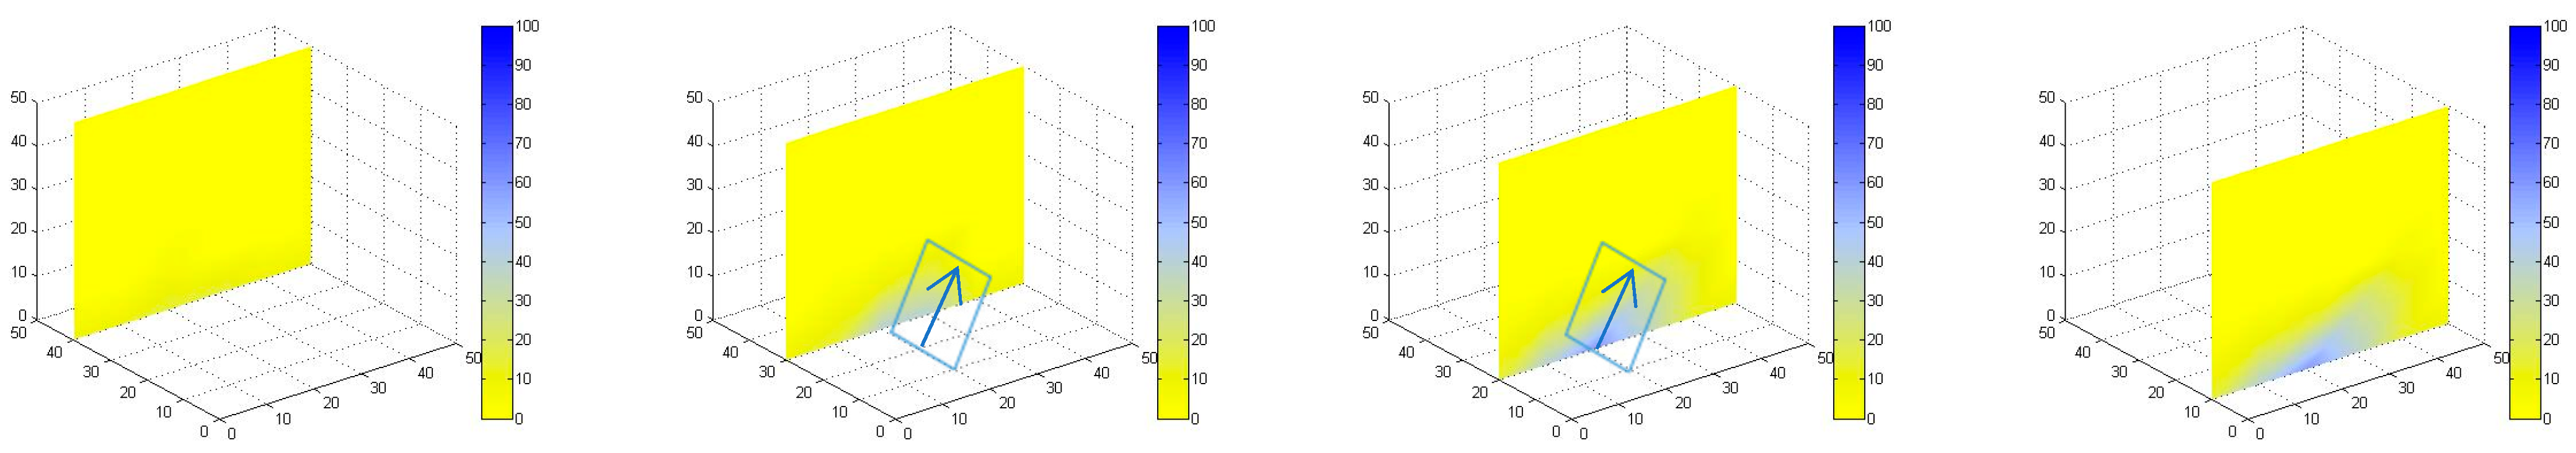
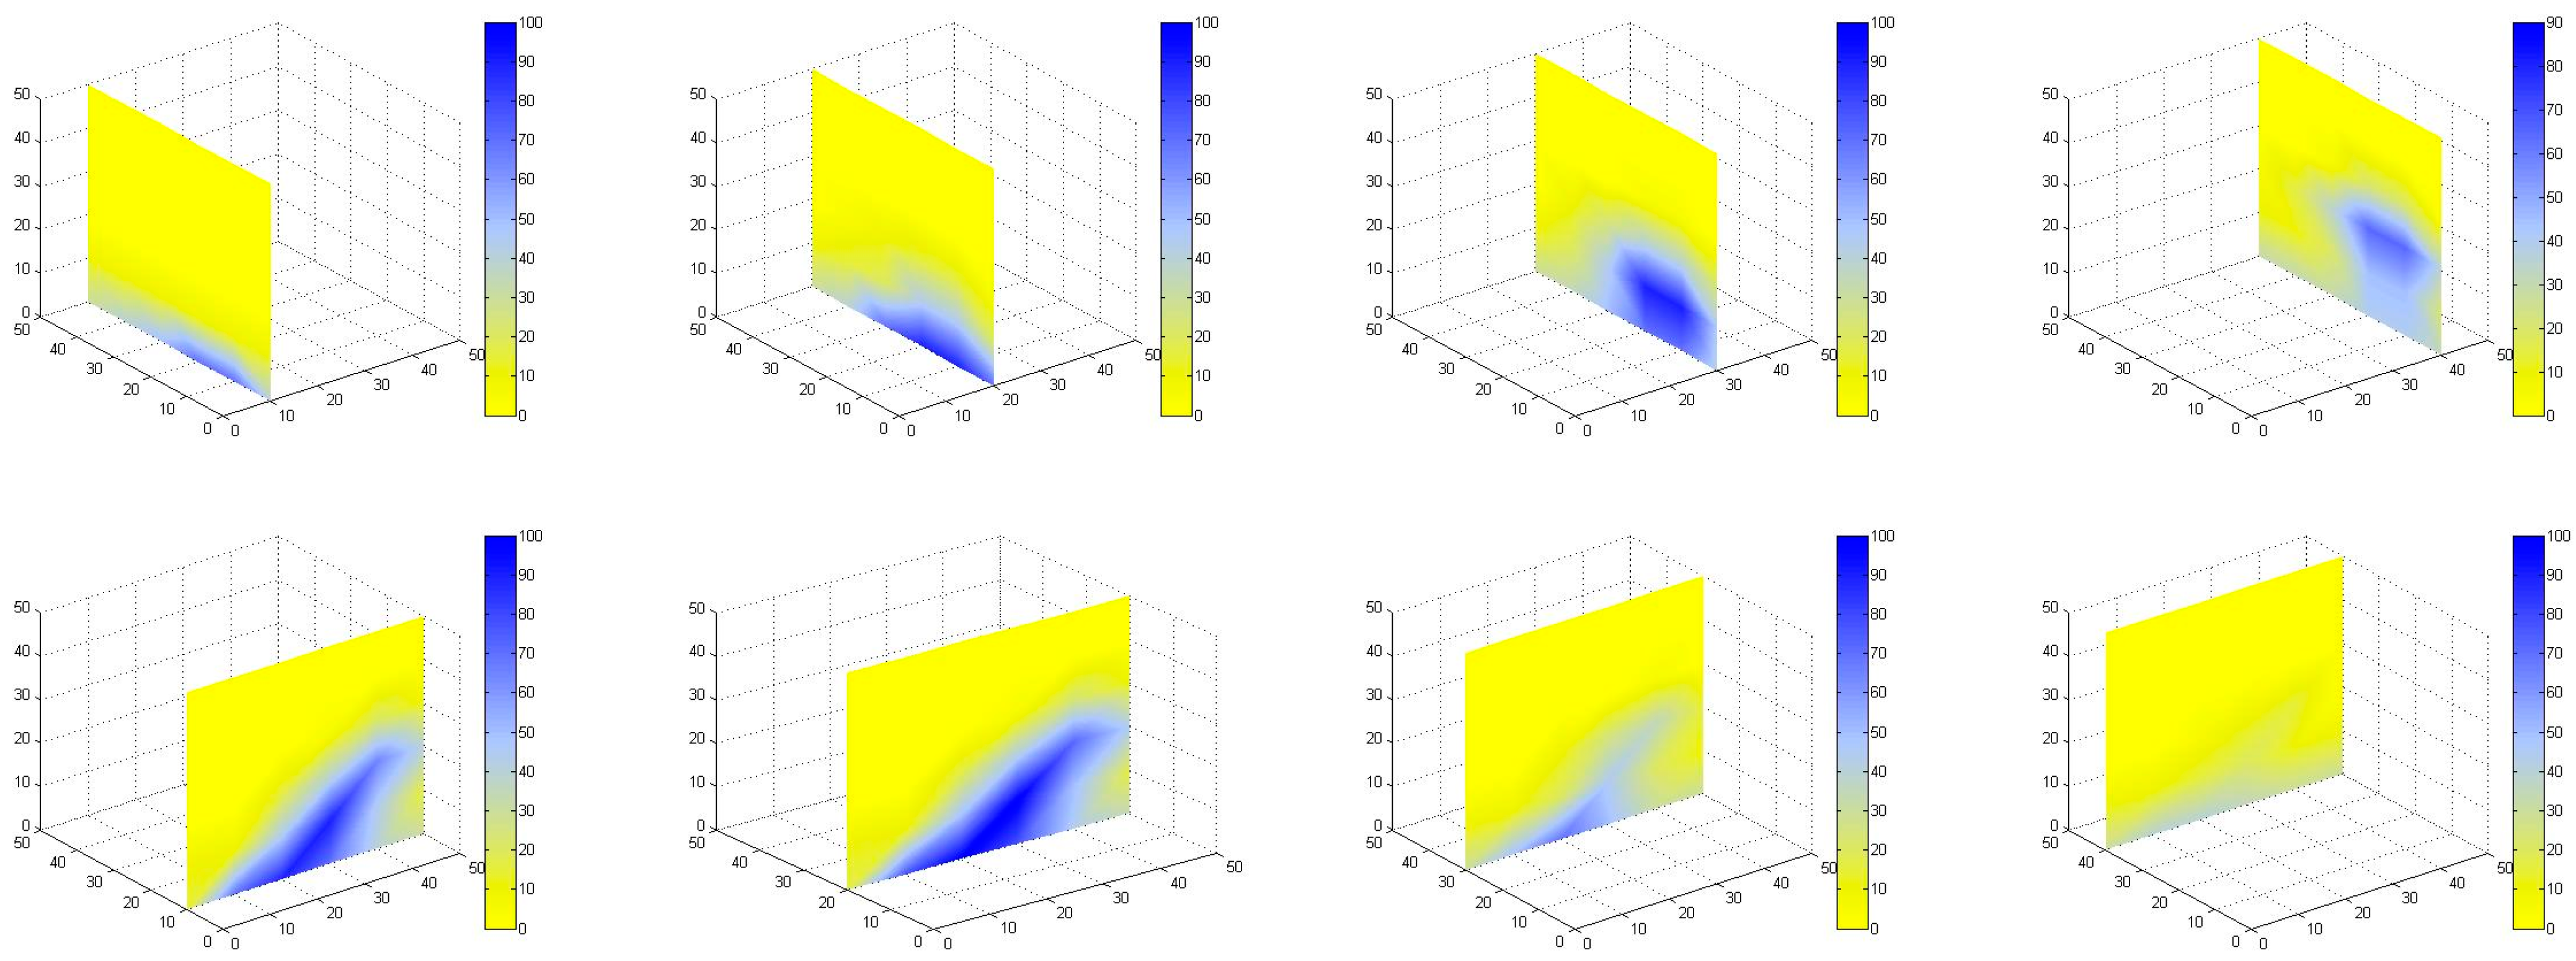
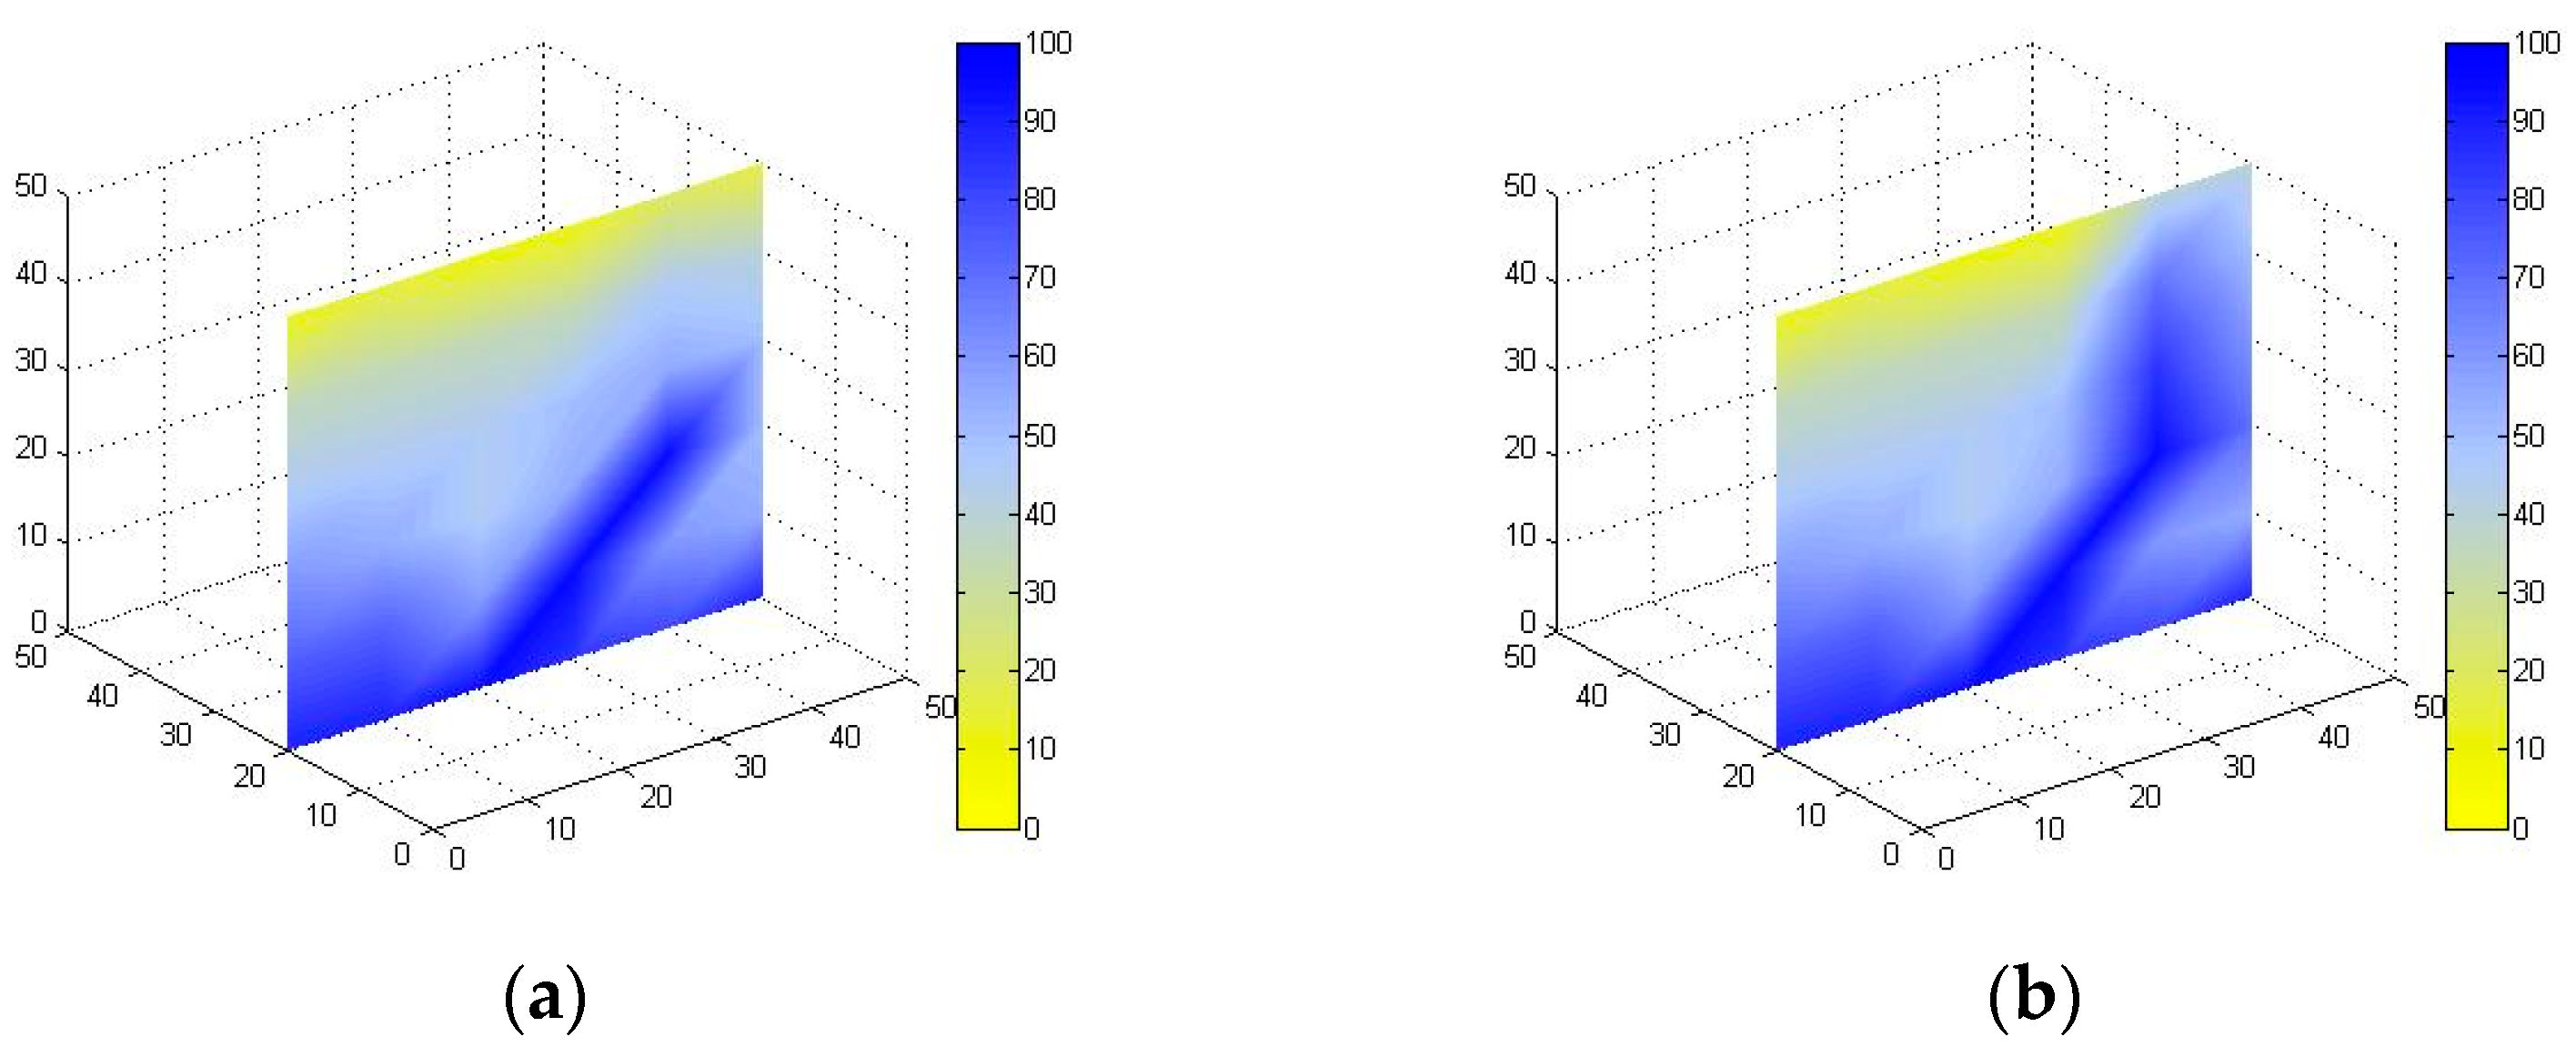
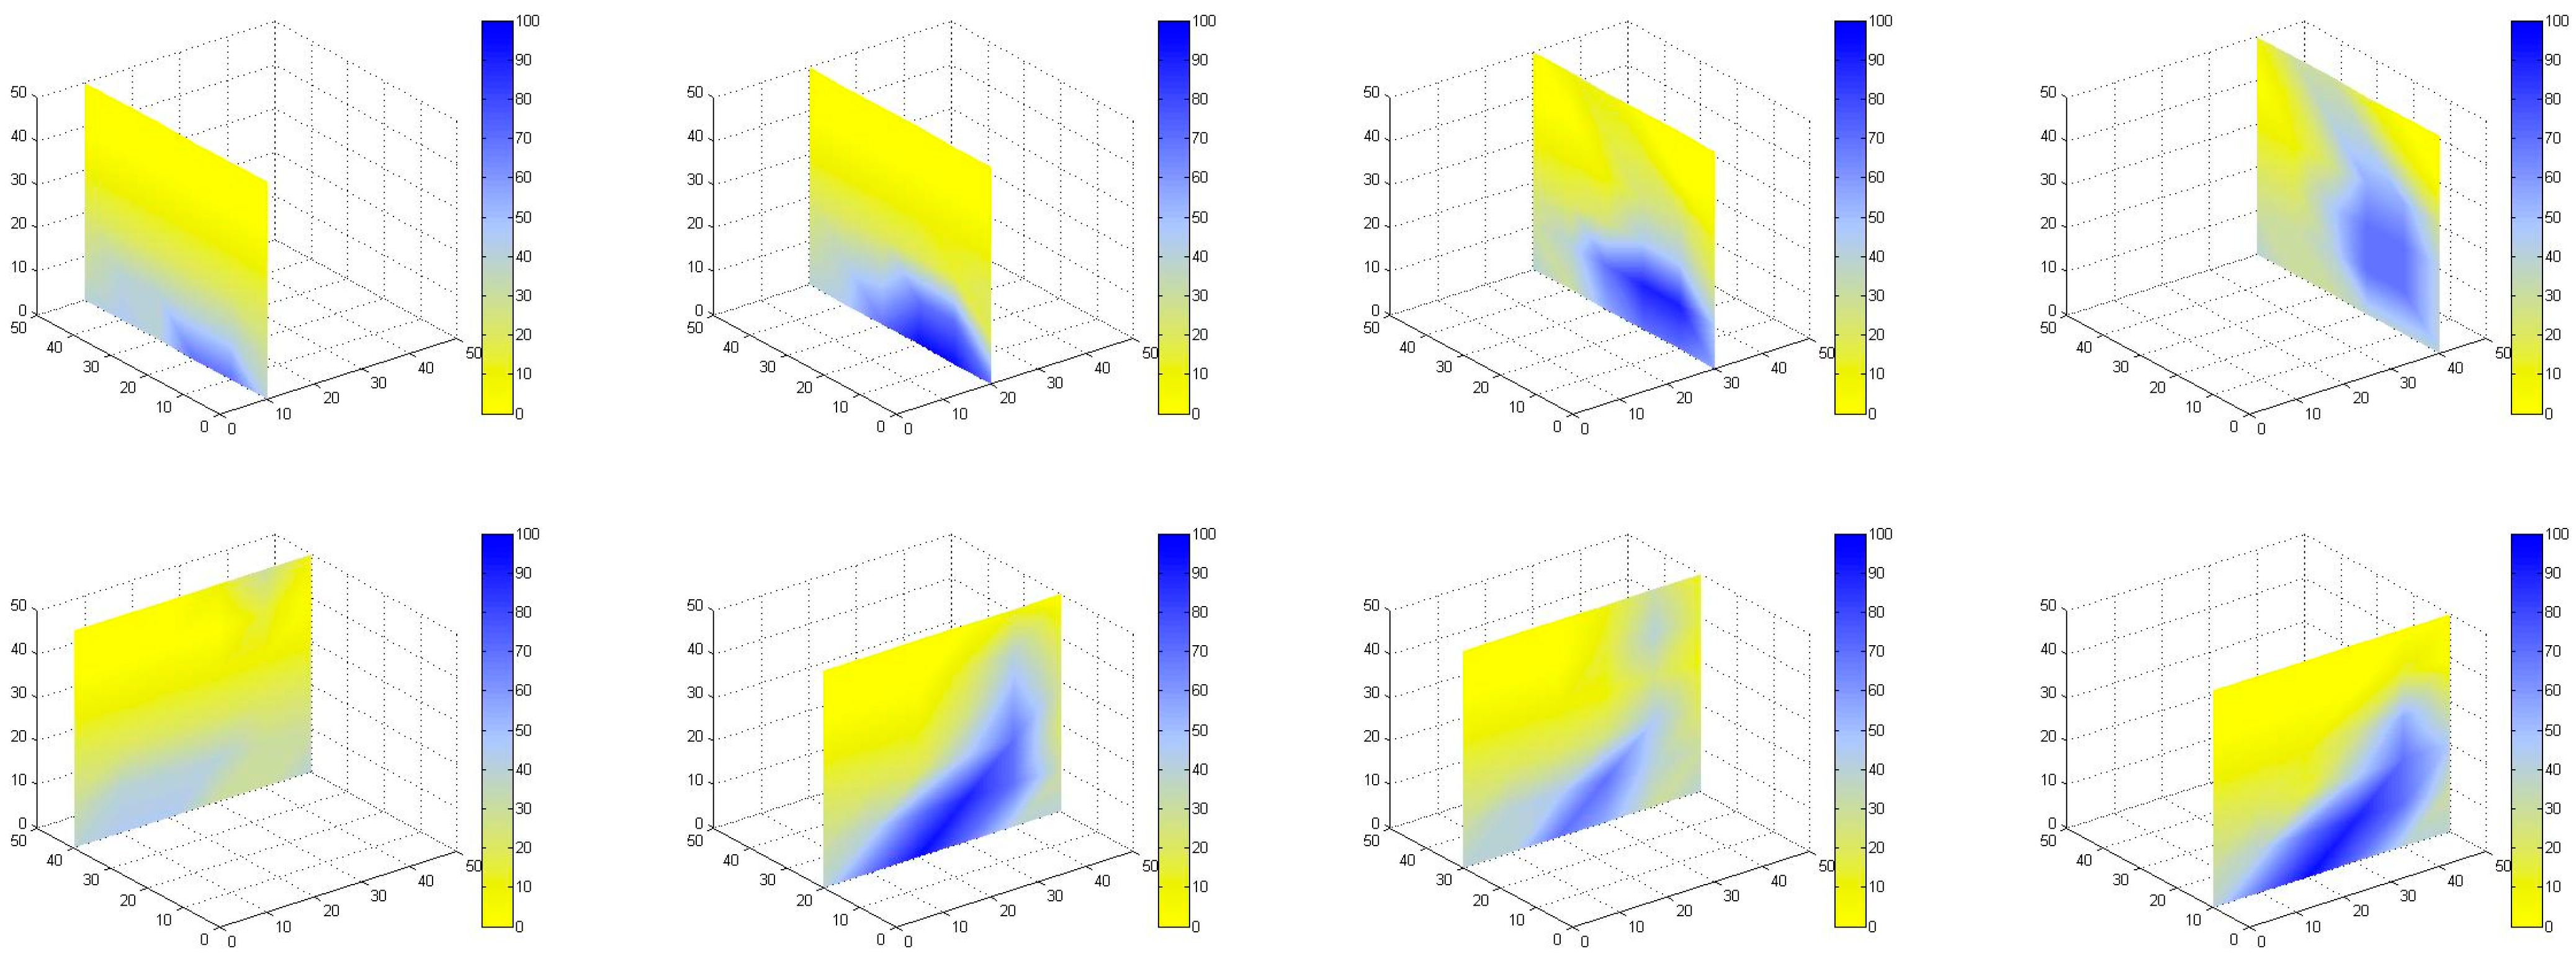
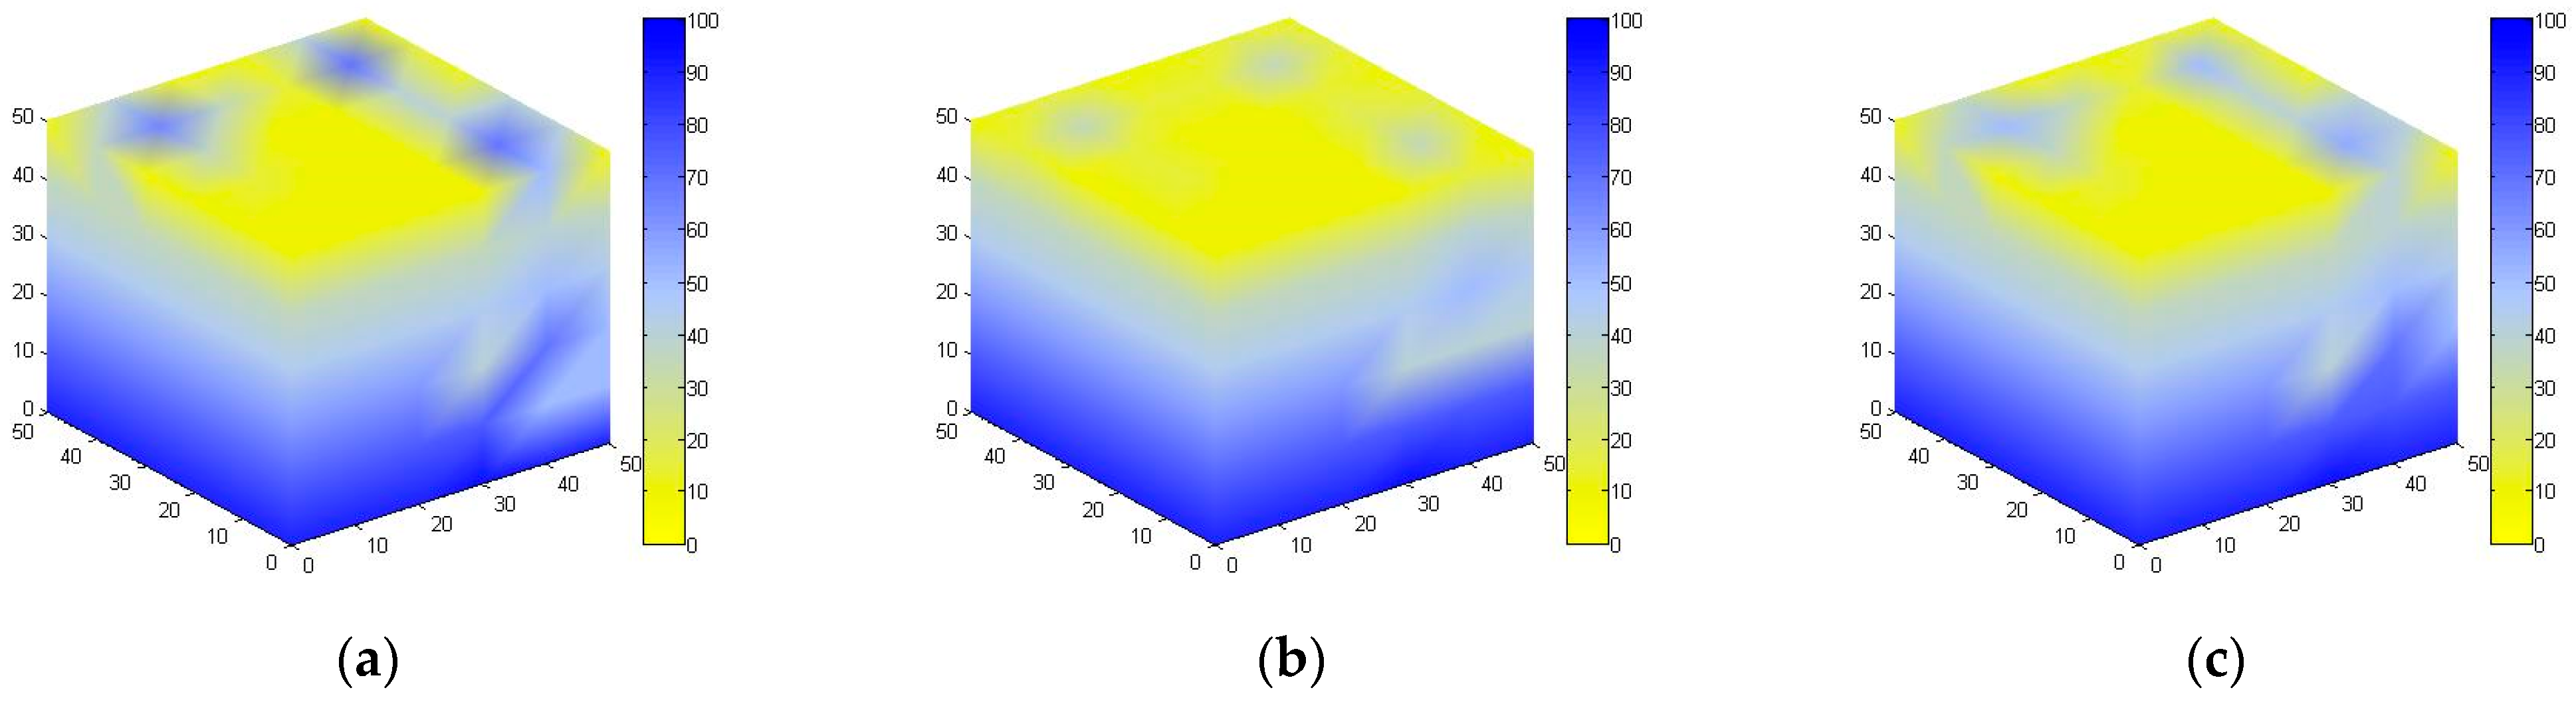
The formation water simulation system was connected to the physical model of saturated gas. According to the experimental scheme, the production allocation for three simulated wells was set to simulate the depletion of the gas reservoir. Through the pressure sensor, resistivity sensor, and gas flowmeter, the instantaneous gas (water) flow rate, cumulative gas (water) production, and pressure (resistivity) in different areas of the model could be recorded in real time during the experiment. Notably, the resistivity needed to be converted into saturation data, and the variation diagram of water saturation in different regions was obtained using Matlab. In the diagram, yellow represents gas, and blue represents water.
(5)
During the experiment, the experiment ended when the gas flow rate was not detected at the outlet of the experiment.

3. Analysis of Experimental Results

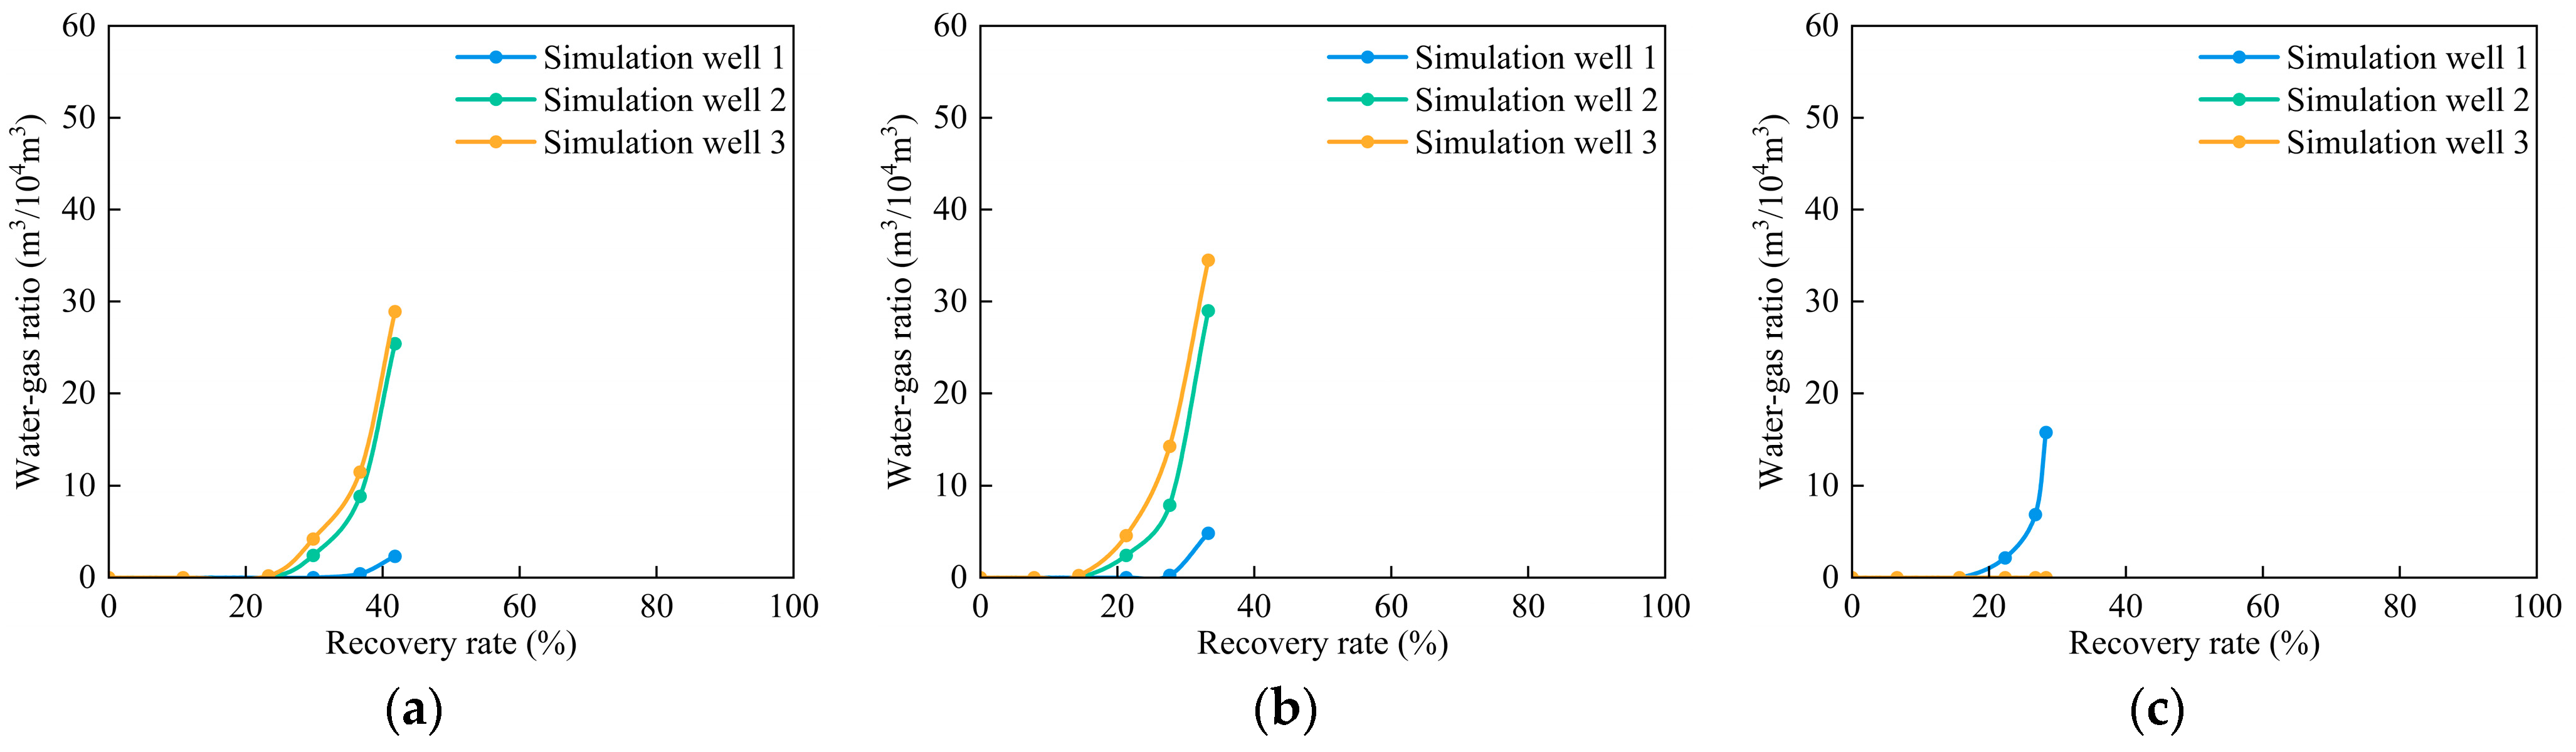
3.1. Water Invasion Simulation Experiment for Multi-Well Development of Fracture Model

As shown in Figure 5, the bottom hole pressure of the three simulation wells decreased approximately linearly with the recovery rate increase when there was no water body. However, until the end of the experiment, the maximum drawdown pressure of the three simulation wells was only 0.23 MPa, indicating that under the condition of no water body, the gas seepage resistance was low, and the ultimate recovery rate reached up to 89.12%.
As shown in Figure 6a, under the three times water body condition, the bottom hole pressure does not change linearly with the recovery rate but changes in an up-concave shape with the increase in recovery rate. In addition, there is an obvious inflection point. Before the inflection point, the bottom hole pressure decreases slowly, but after the inflection point, it drops sharply. This phenomenon indicates that in the early stage of water invasion, the water body can provide some energy for gas reservoirs and delay the decrease in bottom hole pressure. In the middle and late stages of production, with the aggravation of water invasion, on the one hand, the water body quickly flowed into the reservoir along the fracture, forming a gas–water two-phase flow inside the reservoir, resulting in a sharp increase in gas seepage resistance and a rapid drop in bottom hole pressure. On the other hand, under the effect of capillary force, the matrix reservoir in the fracture area experienced imbibition and trapped gas in the matrix, generating a large amount of residual gas, which decreased the ultimate recovery rate to 58.2%, with a waterflood efficiency of 42% (Figure 7).
As shown in Figure 6b, under the seven times water body condition, the curve shape of the relationship between the recovery rate and the bottom hole pressure is nearly the same as that of the three times water body. Compared with the production law of gas wells at three times water body, the larger the water body multiple, the more pronounced the energy supply effect in the early stage of water invasion, and the lower the recovery rate corresponding to the inflection point. After the gas well water breakthrough, the gas and water outflowed intermittently, and waterflooding occurred eventually. It was difficult for the peripheral gas to break through the water invasion area, resulting in the ultimate recovery rate decreasing to 52.8%, and the overall waterflood efficiency was 37.2% (Figure 7). The low water body multiple provided displacement energy for the gas reservoir. The invasion of a small amount of water occupied the reservoir space of the gas, displaced some of the gas, and improved the recovery rate of the gas reservoir. With the increase in water body multiples, the water invasion energy increased, and the water body also trapped a large amount of gas through the cut-off, bypass flow, and water lock while displacing the gas. The recovery rate decreased when the water invasion was dominated by trapped gas.
As shown in Figure 6c, under the seven times water body (shut-in after water breakthrough) condition, the curve shape of the relationship between the recovery rate and the bottom hole pressure at the early stage of water invasion is consistent with that when the well was not shut in after water breakthrough. When the low-position gas well (simulation well 3) was immediately shut in after the water breakthrough, the bottom hole pressure gradually recovered and rose. The average ultimate recovery rate was 38.5%, which is lower than that of the well not shut in after the water breakthrough, and the overall waterflood efficiency was 32.5% (Figure 7).
According to the real-time gas and water production measured in the experiment, the change in the production water–gas ratio during the experiment could also be obtained. The experimental water–gas ratio was defined as the ratio of water production (mL) to gas production (104 mL) per minute. As shown in Figure 8a, under the three times water body condition, because simulation well 3 is close to the fracture area, the earliest water breakthrough occurred when the recovery rate was 12.9%. Then, when the recovery rates were 31.5% and 36.9%, simulation well 2 and simulation well 1 water broke through in turn. The overall water–gas ratio of the fracture model gradually increased with the increase in the recovery rate. The low-position gas well continued to produce water after the water breakthrough, which could delay the water breakthrough time of the high-position gas well and reduce the water–gas ratio of the high-position gas well. The water–gas ratio of simulation well 3 increased gradually after the water breakthrough, and the maximum water–gas ratio could reach 28.5. The maximum water–gas ratios of simulation well 2 and simulation well 1 were 14.3 and 3.7, respectively. Under the seven times water body condition, the water breakthrough times of simulation well 3, simulation well 2, and simulation well 1 were advanced to 11.8%, 30.5%, and 35.8%, respectively (Figure 8b). The maximum water–gas ratio of simulation well 3 was increased to about 36.5, and the maximum water–gas ratios of simulation well 2 and simulation well 1 were increased to about 17.8 and 5.7. Compared with the condition of not shutting in after water breakthrough, under the condition of seven times water body (shut-in after water breakthrough), the overall water production of the gas reservoir decreased, the water-free production period increased, and the recovery rate of the gas reservoir decreased significantly (Figure 8c).
As shown in Figure 9, in the early stage of water invasion, the fracture provided a seepage channel for water invasion. The water invasion front advanced rapidly along the fracture, and the water saturation in the fracture area increased rapidly. In contrast, the water saturation in the matrix area remained almost unchanged. However, analyzing the water saturation change in the matrix area within the fracture range revealed that the reservoir matrix experienced imbibition under the effect of capillary force, leading to an increase in water saturation. Regarding simulation well 3 after the water breakthrough, the water saturation in the fracture area increased dramatically. In contrast, the water saturation in the matrix area also increased but at a significantly slower rate than in the fracture region (Figure 10). When the experiment ended, the water saturation of three times water body was about 78% (Figure 11), and the water saturation of seven times water body was about 85% (Figure 12). At the same time, further analysis shows that there was local water-trapped gas around the fracture area and the edge of the gas reservoir.

3.2. Water Invasion Simulation Experiment for Multi-Well Development of Fracture–High-Permeability Zone Model

As shown in Figure 13a, under the three times water body condition, the bottom hole pressure changes in an up-concave shape with the increase in recovery rate, consistent with the fracture model with the water body. However, the recovery rate corresponding to the inflection point, the ultimate recovery rate (41.8%), and the overall waterflood efficiency (34.5%) were lower than the fracture model with the same water body multiple. The relationship between waterflood efficiency and recovery rate of the fracture–high-permeability zone model is shown in Figure 14. After further analysis, it was found that although there were differences in water avoidance height between simulation well 2 and simulation well 3, the bottom hole pressure of these two wells was relatively close in the late stage of water invasion due to the presence of a high-permeability zone between the two wells.
As shown in Figure 13b, under the seven times water body condition, the shape of the relationship curve between recovery rate and bottom hole pressure is down-concave. The water invasion rate of the fracture–high-permeability zone model was significantly faster than that of the fracture model under the same water body multiple (Figure 15). Because it is difficult for the peripheral gas to break through the water invasion area, the ultimate recovery rate decreased to 33.3%, and the overall waterflood efficiency was 29.9%, which is lower than the fracture model with the same water body multiple (Figure 14).
As shown in Figure 13c, under the seven times water body condition (shut-in after water breakthrough), the curve shape of the relationship between the recovery rate and the bottom hole pressure at the early stage of water invasion was almost the same as that when the well was not shut in after water breakthrough. Simulation well 3 and simulation well 2 were shut in immediately after the water breakthrough, resulting in a rapid flow of water to the gas wells at high positions. The ultimate recovery rate was 28.3%, and the overall waterflood efficiency was 25.3% (Figure 14), lower than the recovery rate without shut-in after the water breakthrough. Meanwhile, the low-position gas well was shut in after the water breakthrough, and the bottom hole pressure gradually increased.
As shown in Figure 16a, the water–gas ratios and water breakthrough times of simulation well 2 and simulation well 3 were close under the condition of three times water body. After further analysis, it was found that continuous water production after water breakthrough can delay the water breakthrough time of high-position gas wells and reduce the water–gas ratio of high-position gas wells. Compared with the water–gas ratio of three times the water body, the larger the water body multiple, the stronger the water invasion energy, the higher the overall water–gas ratio, and the earlier the water breakthrough time under the same gas recovery rate, which is consistent with the analysis conclusion of the fracture model (Figure 16b). However, under the same water body multiple, the fracture–high-permeability zone model had a higher overall water–gas ratio than the fracture model. The water breakthrough times for simulation wells 3, 2, and 1 corresponded to 14.4%, 21.3%, and 27.7% of the overall recovery rate of the model, respectively. Furthermore, the corresponding water–gas ratios at the experiment end of the three simulation wells were 34.5, 29.0, and 4.8, respectively. As shown in Figure 16c, with the immediate shut-in of the gas well after the water breakthrough, the overall water production of the gas reservoir decreased, and the water-free production period increased. However, the water body quickly flowed toward the high-position gas well, reducing the recovery rate of the gas reservoir, which is consistent with the conclusion of the shut-in analysis after the water breakthrough in the fracture model.
As shown in Figure 17, in the early stage of water invasion, in addition to the increase in water saturation in the fracture area and the matrix area within the fracture range, the water saturation of the high-permeability zone was also slightly increased. The formation water quickly invaded simulation well 3 through the fracture, resulting in a significant reduction in the recovery rate of simulation well 3. At the same time, it quickly invaded simulation well 2 through the high-permeability zone, and the water saturation in the high-permeability zone increased rapidly (Figure 18). Due to the rapid water flow out of simulation well 3 and simulation well 2 along the fracture and high-permeability zone, there was a presence of a large amount of water-trapped gas around the fracture–high-permeability zone and at the edges of the gas reservoir at the end of the experiment, indicating that the development of the gas reservoir was not sufficient (Figure 19).

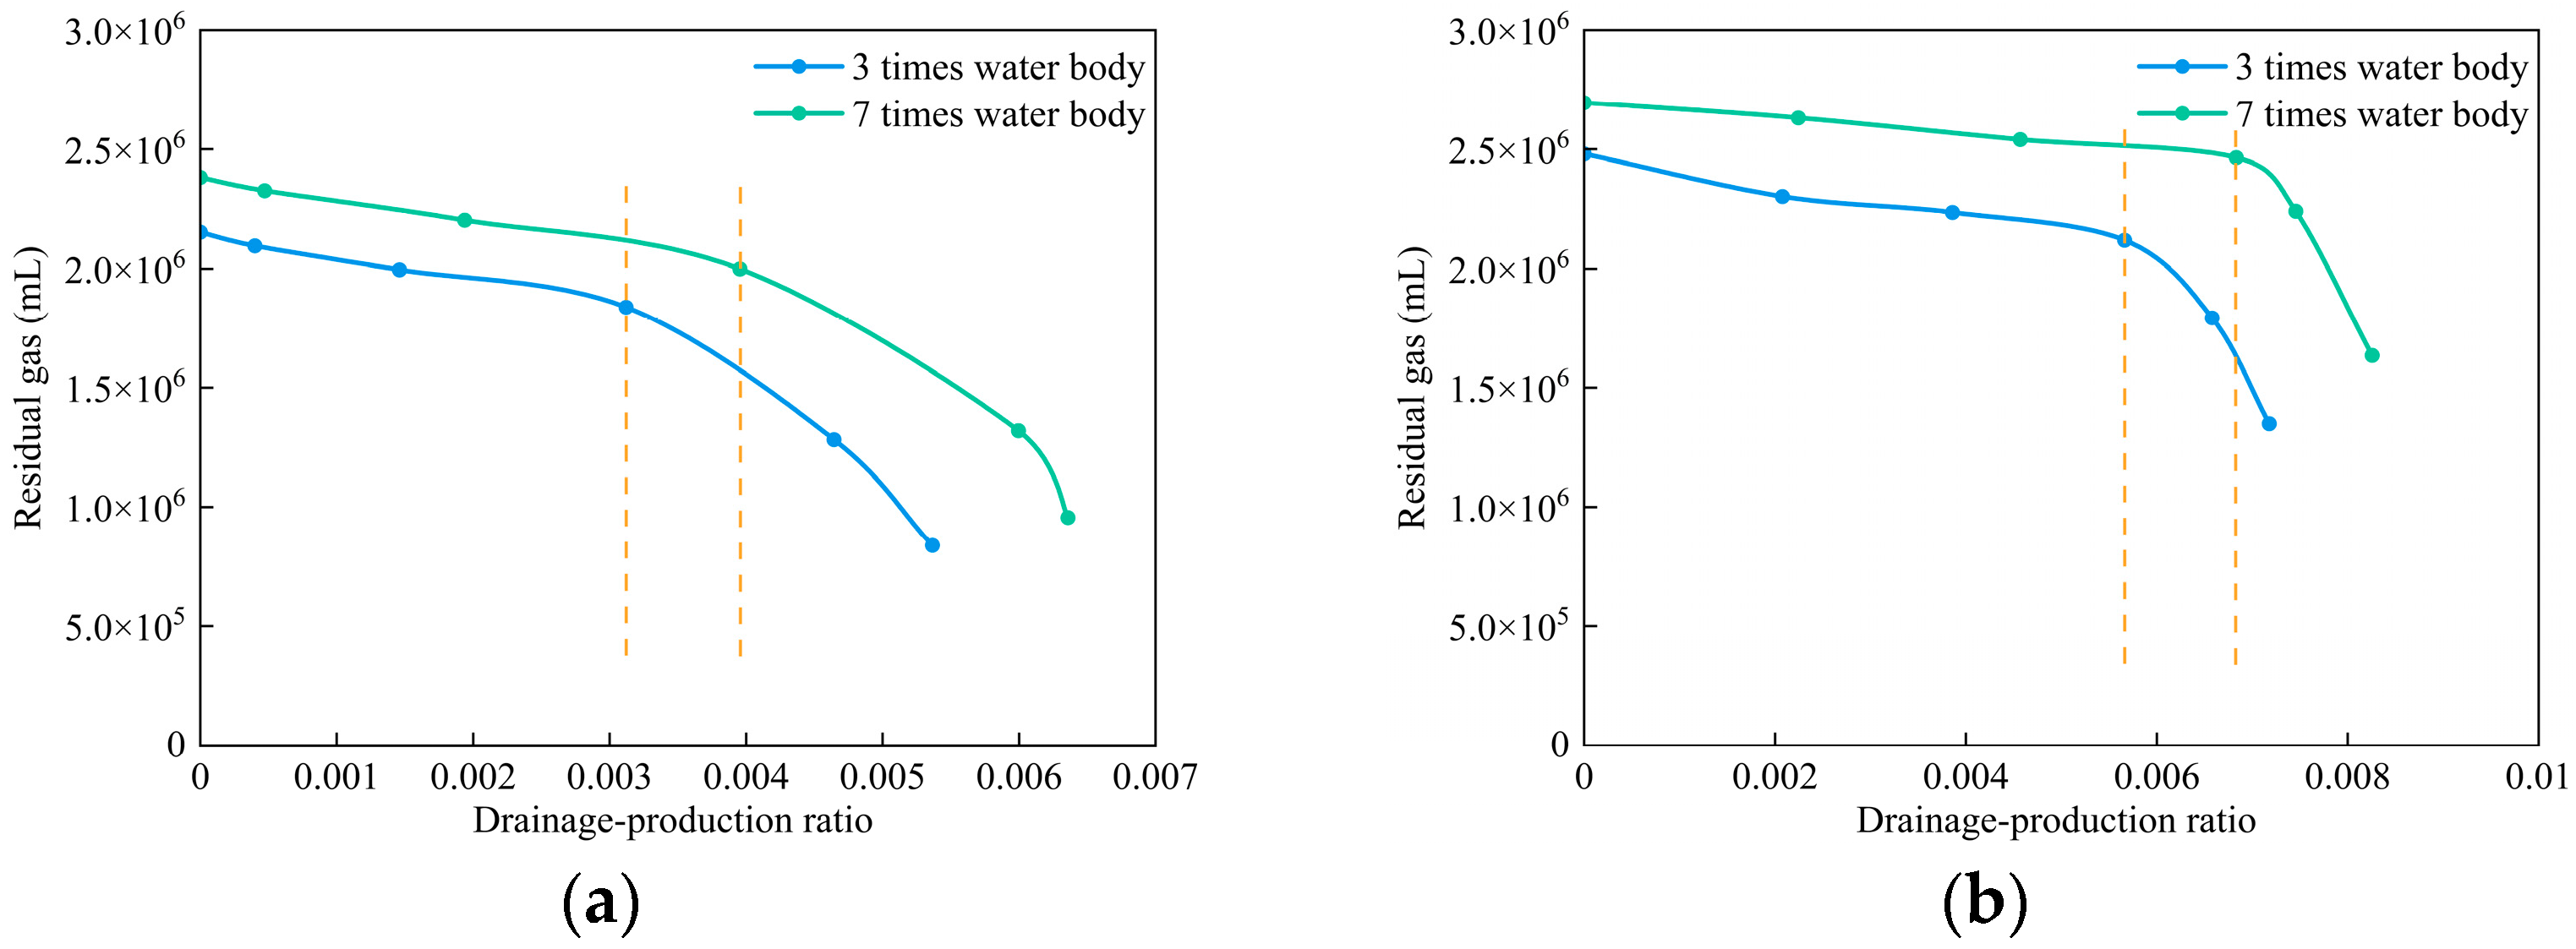
3.3. Characteristics of Residual Gas Distribution in Multi-Well Development of Sandstone Gas Reservoir with Strong Water Drive

In general, the water invasion effect increased with the increase in water body multiples, and the water body advanced rapidly along the fractures and high-permeability zone, resulting in premature waterflooding of gas wells, reduced cumulative gas production, a decreased ultimate recovery rate, and an increased actual residual gas volume of the model. The low-position gas wells immediately shut in after the water breakthrough will lead to rapid water invasion to the high-position gas wells, resulting in rapid waterflooding of the high-position gas wells after the water breakthrough, high gas saturation in some areas, and enrichment of the residual gas.
As shown in Figure 20a and Figure 21, the residual gas in the fracture model was mainly distributed around the fracture zone and at the edge of the gas reservoir. Under different water body multiples and production systems, the ultimate recovery rate ranged from 38.5% to 58.2%, with an average of 49.8%. The overall waterflood efficiency ranged from 32.5% to 42%, with an average of 37.2%. As shown in Figure 20b and Figure 22, the residual gas in the fracture–high-permeability zone model was mainly distributed around the fracture–high-permeability zone and at the edge of the gas reservoir. Under different water body multiples and production systems, the ultimate recovery rate ranged from 28.3% to 41.8%, with an average of 34.5%. The waterflooding efficiency ranged from 25.3% to 34.5%, with an average of 29.9%. As shown in Figure 23, the residual gas volume depends on the drainage–production ratio and the water body scale. The residual gas can be significantly reduced when the drainage–production ratio (drainage speed–gas recovery speed) reaches a certain value.

4. Conclusions

We sought to reveal the law of water invasion in the multi-well development of sandstone gas reservoirs with strong water drives and to clarify residual gas distribution characteristics. Based on previous studies, this paper used the developed large-scale three-dimensional physical model to conduct water invasion simulation experiments under different water body multiples and production systems. The conclusions are as follows:
(1)
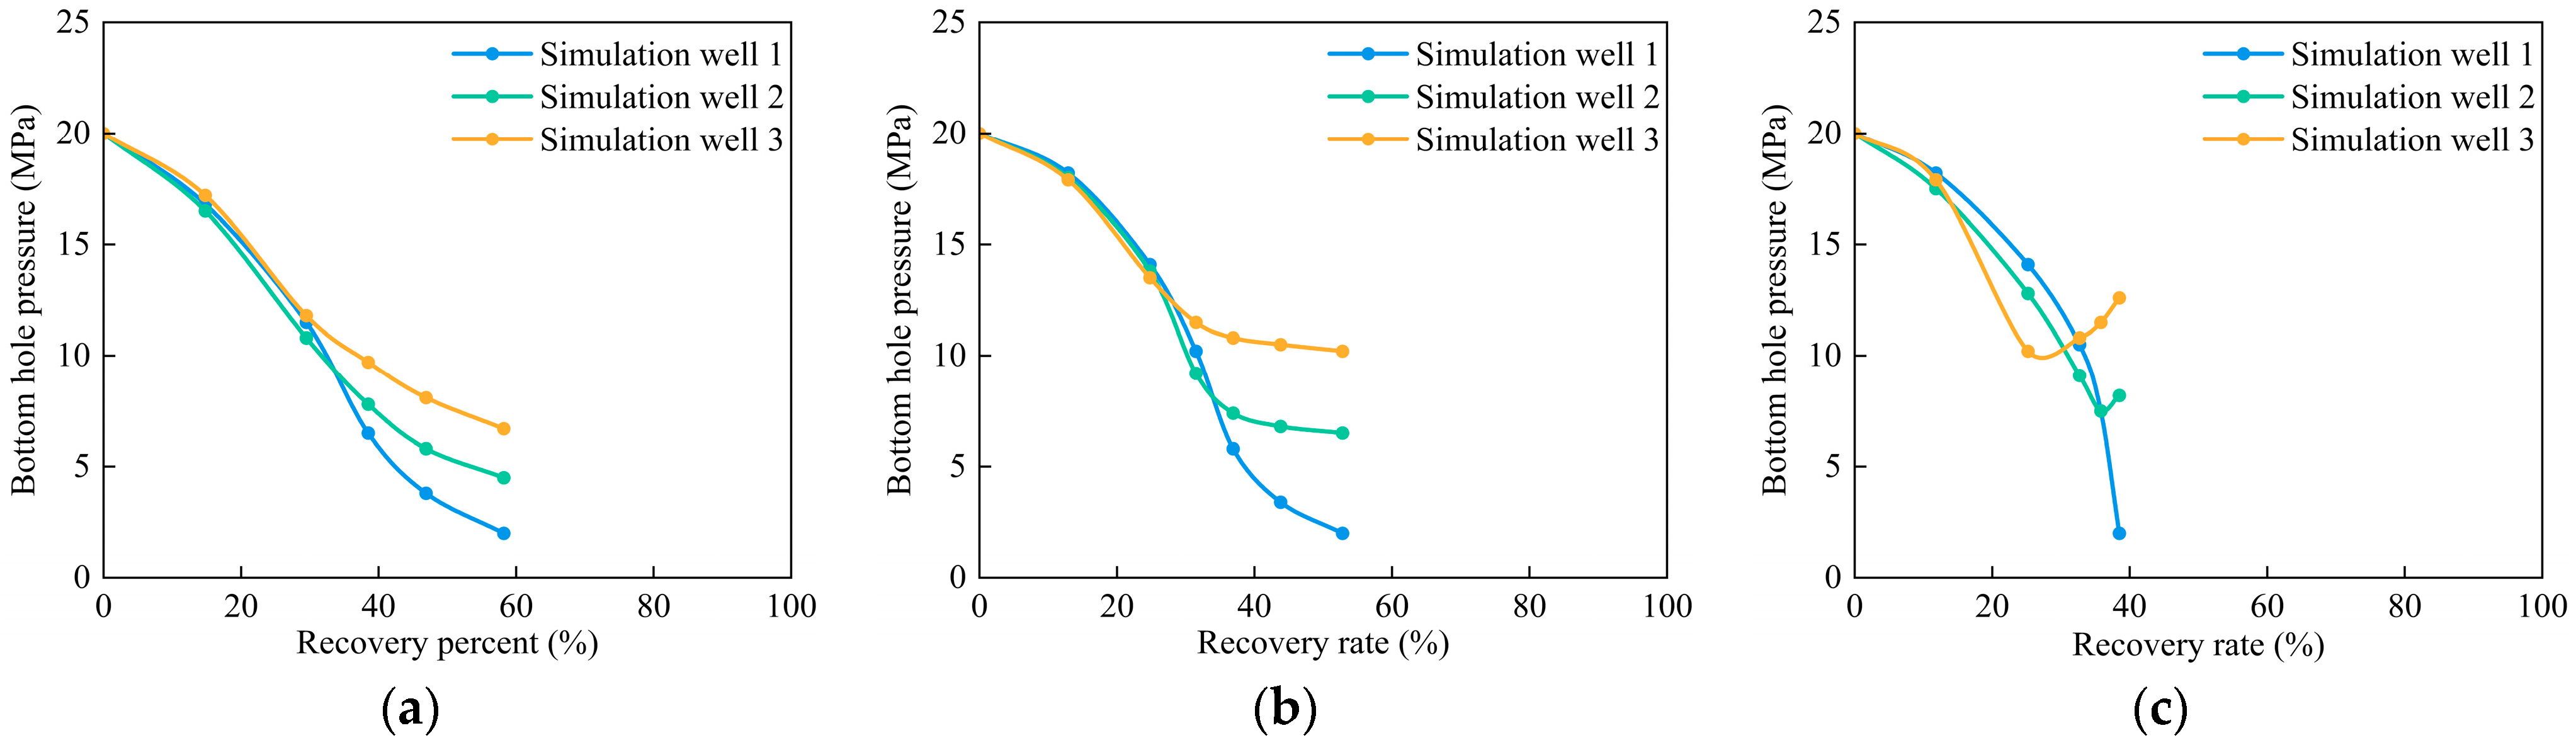
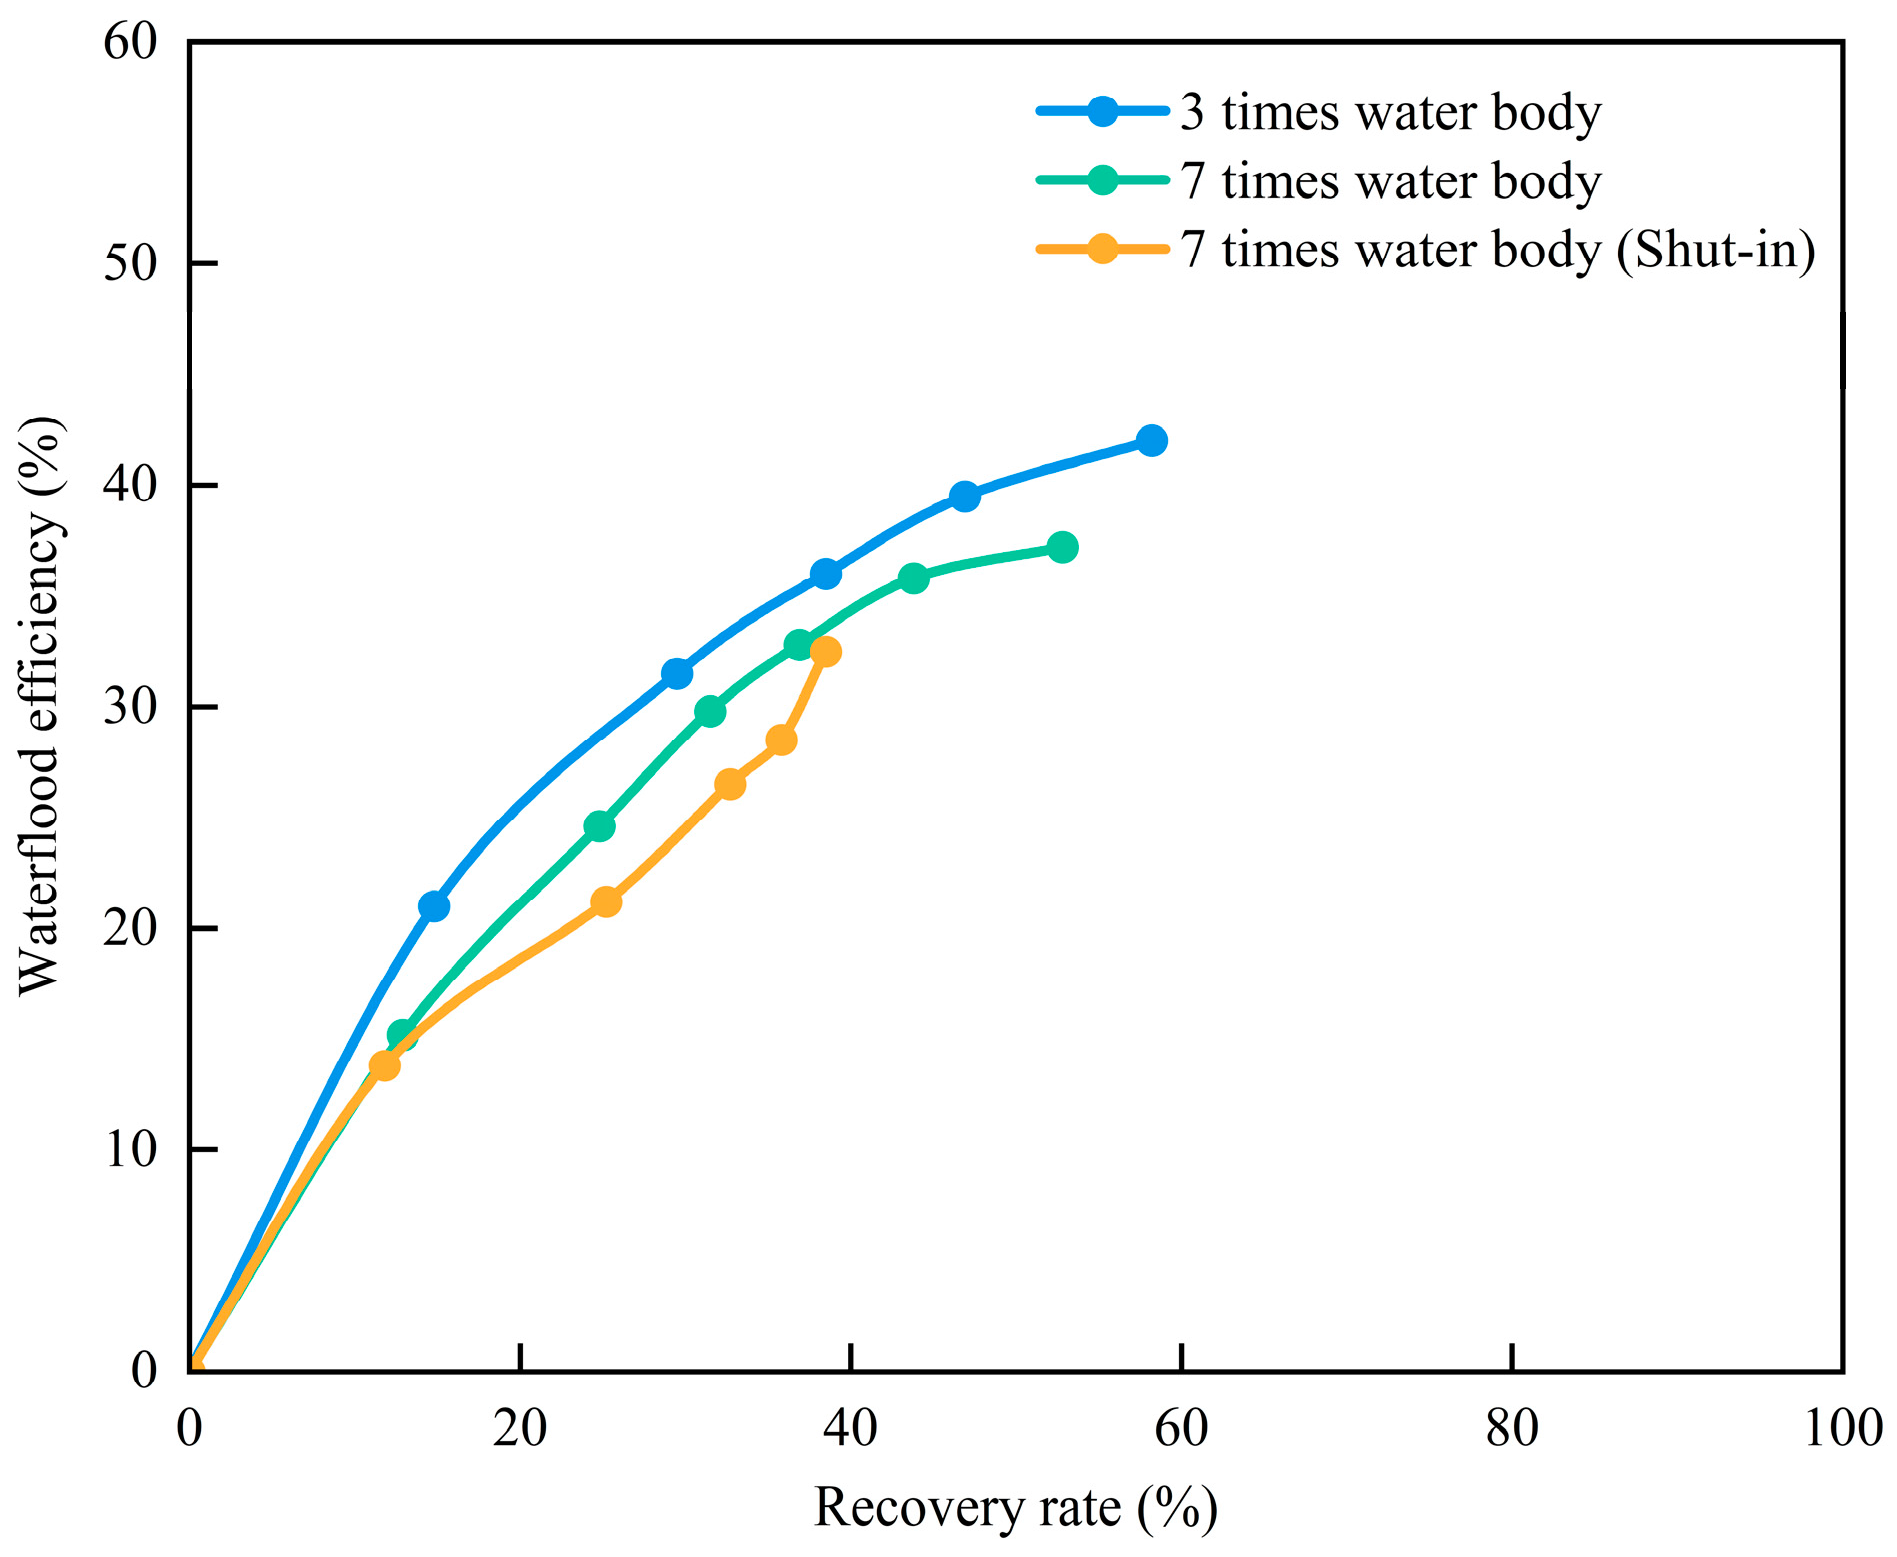
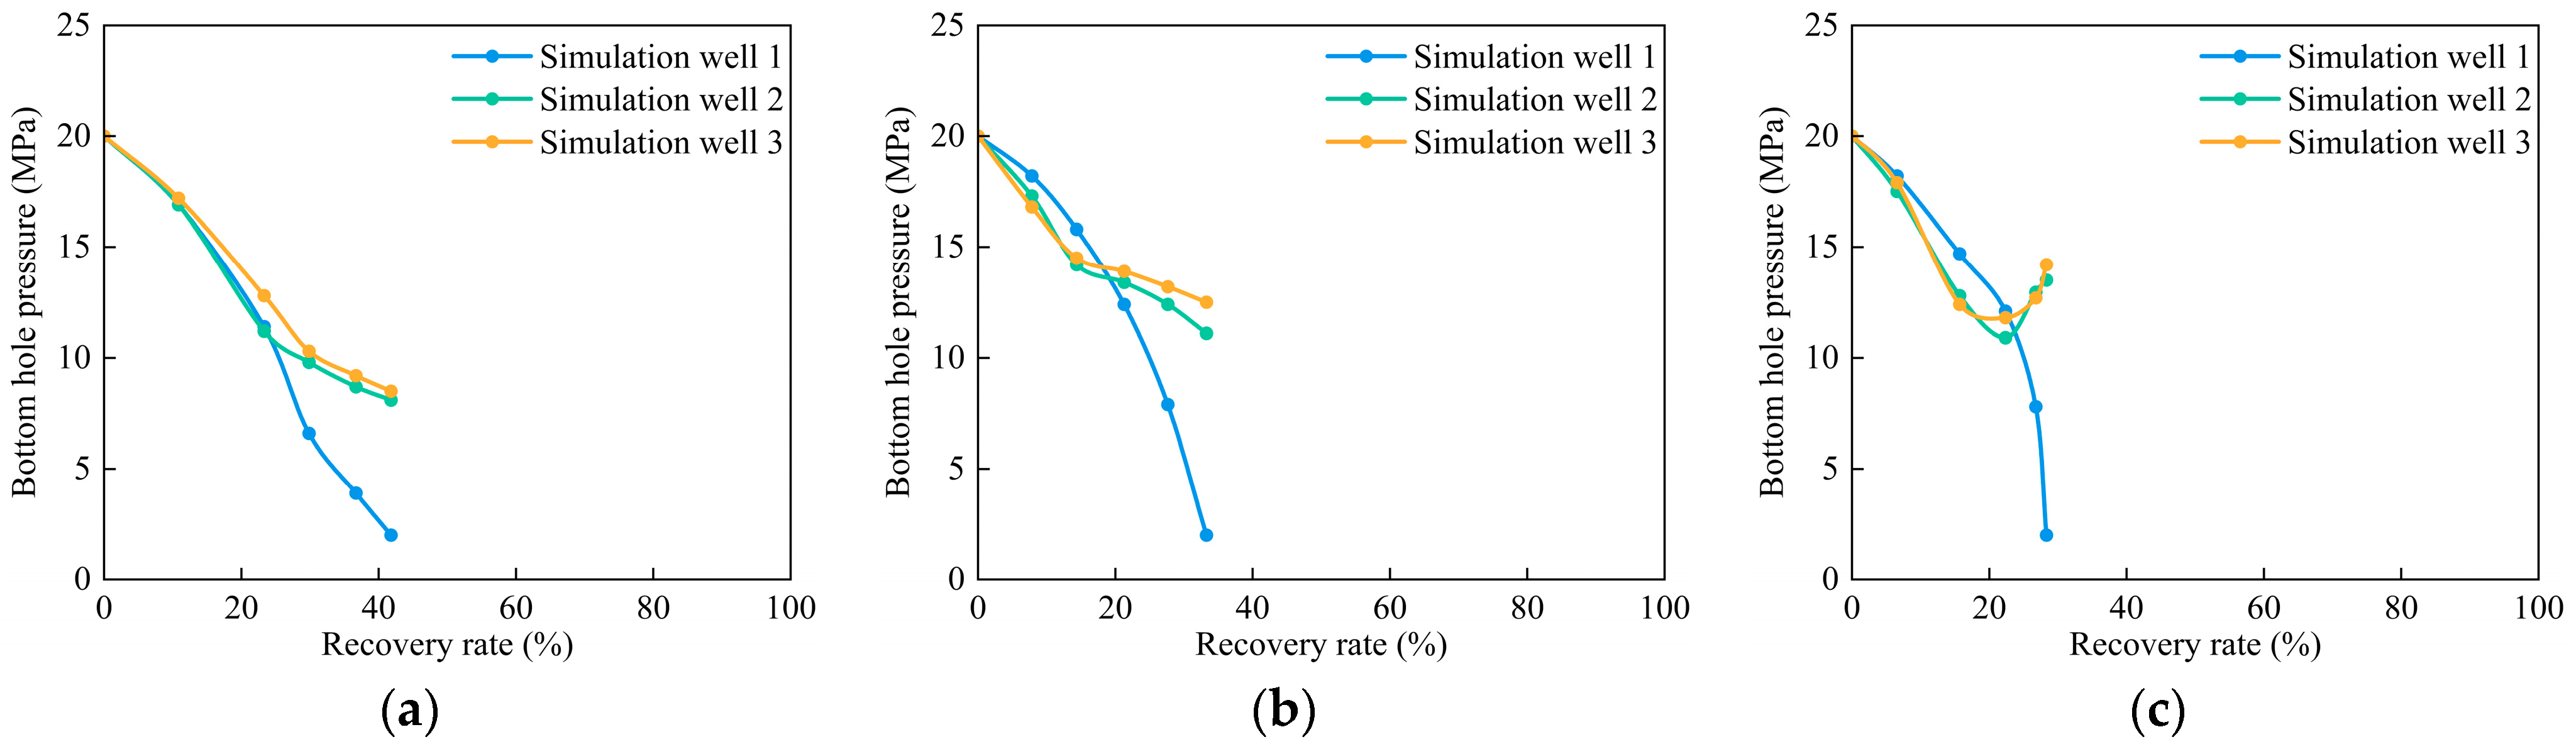
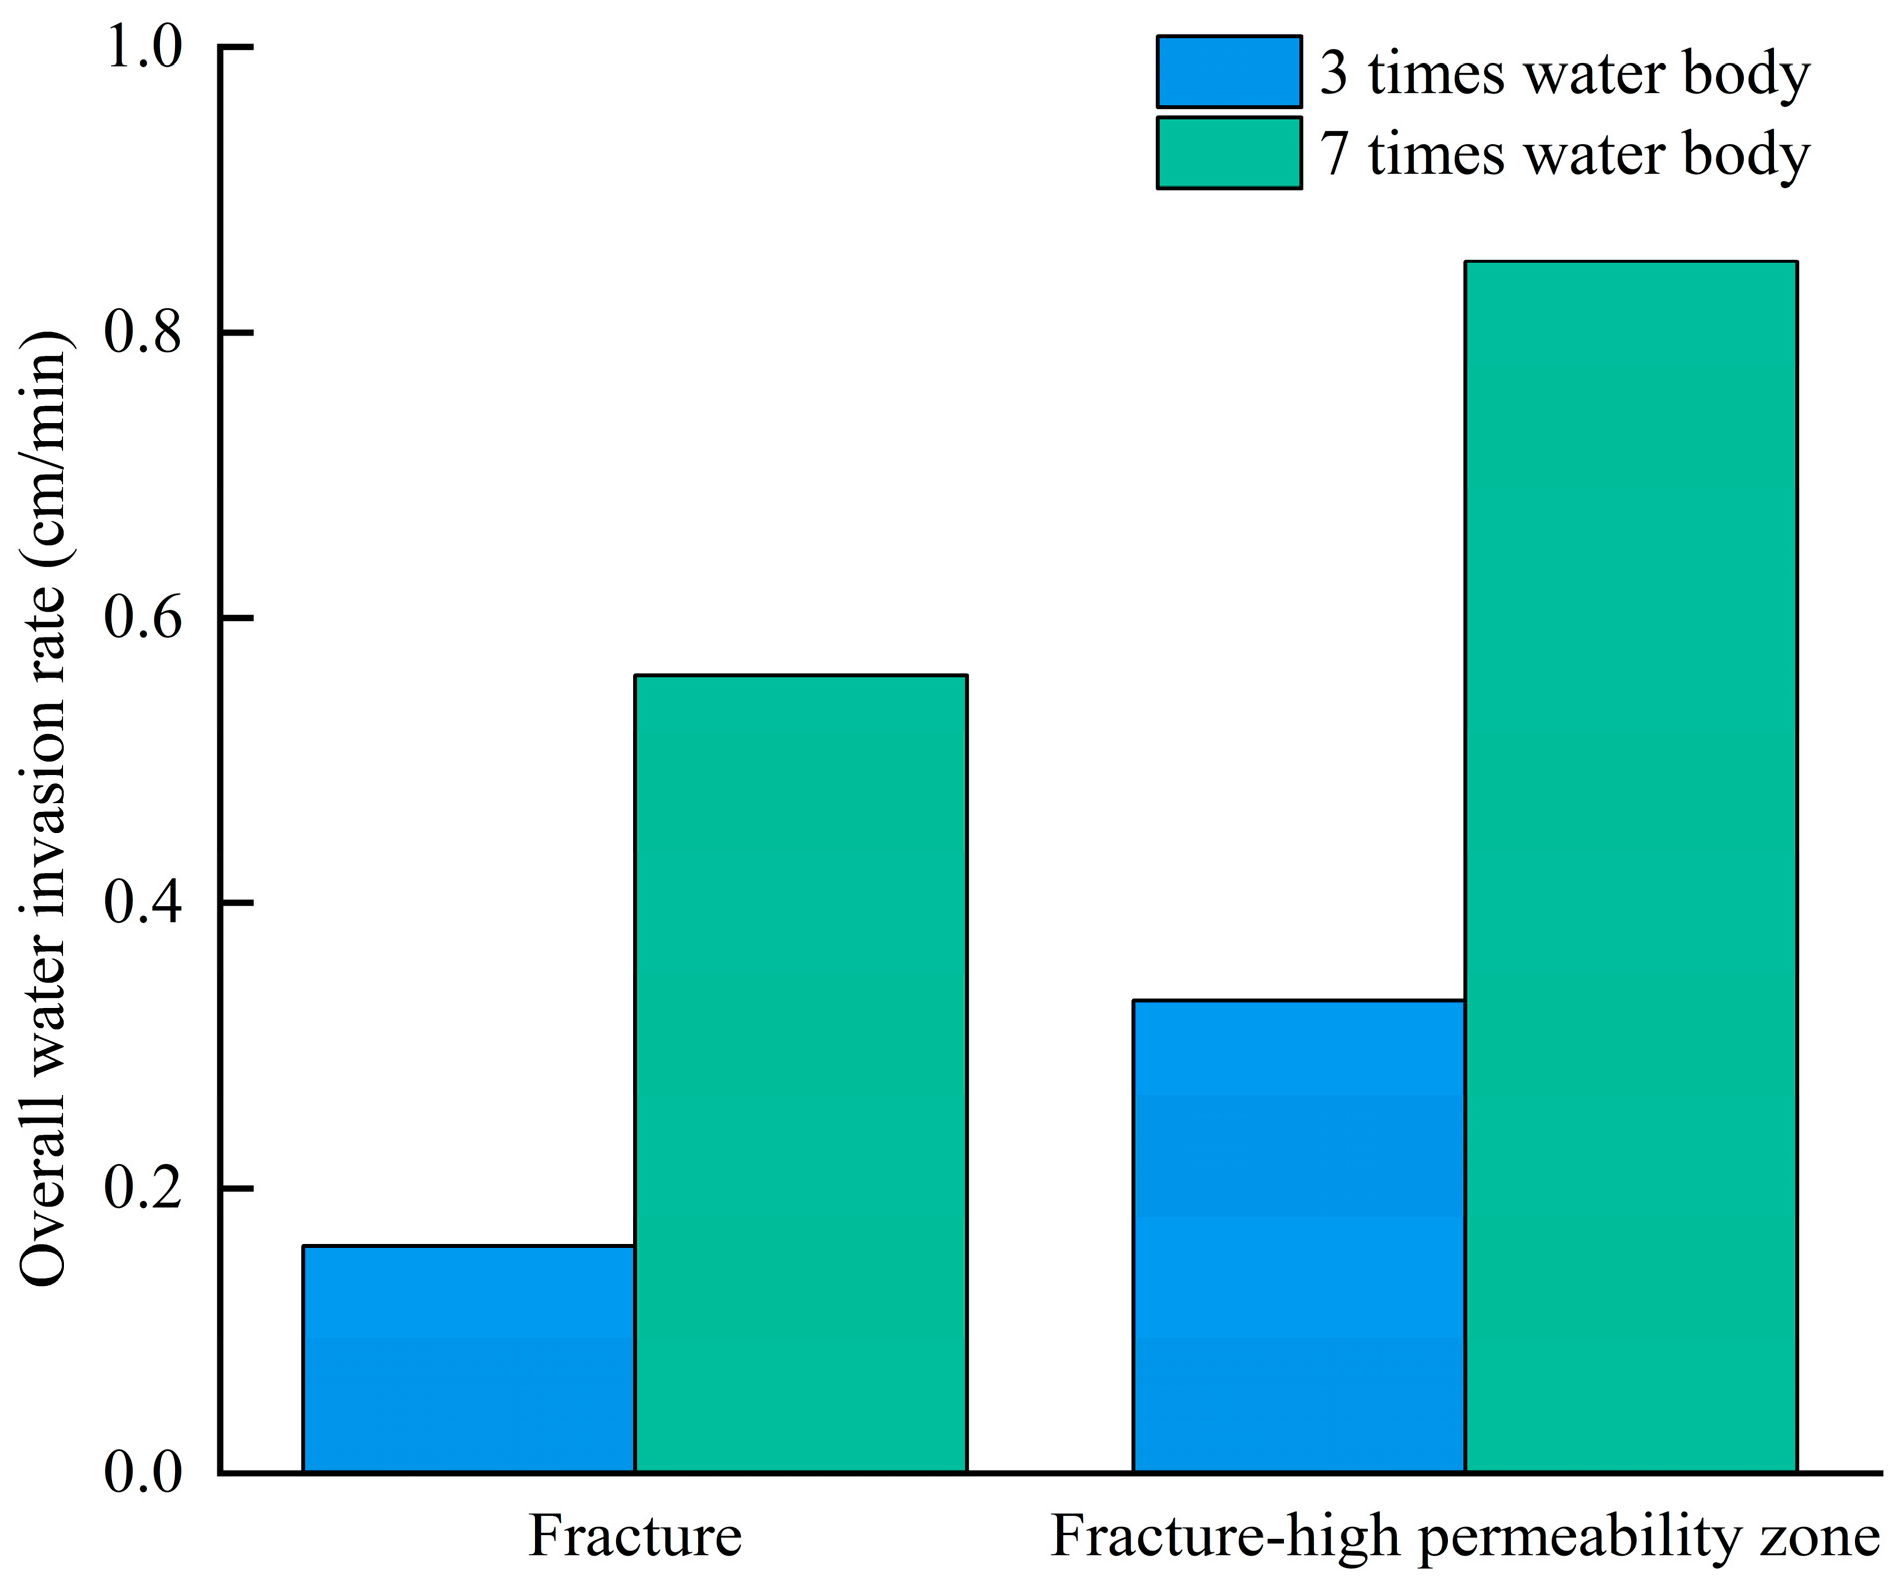
Under the same production system conditions, the water invasion effect is heightened as the water body multiple increases. The strength of the edge and bottom water of the gas reservoir can be assessed by monitoring the change in the bottom hole pressure, allowing for the anticipation and prevention of potential water invasion risks.
(2)
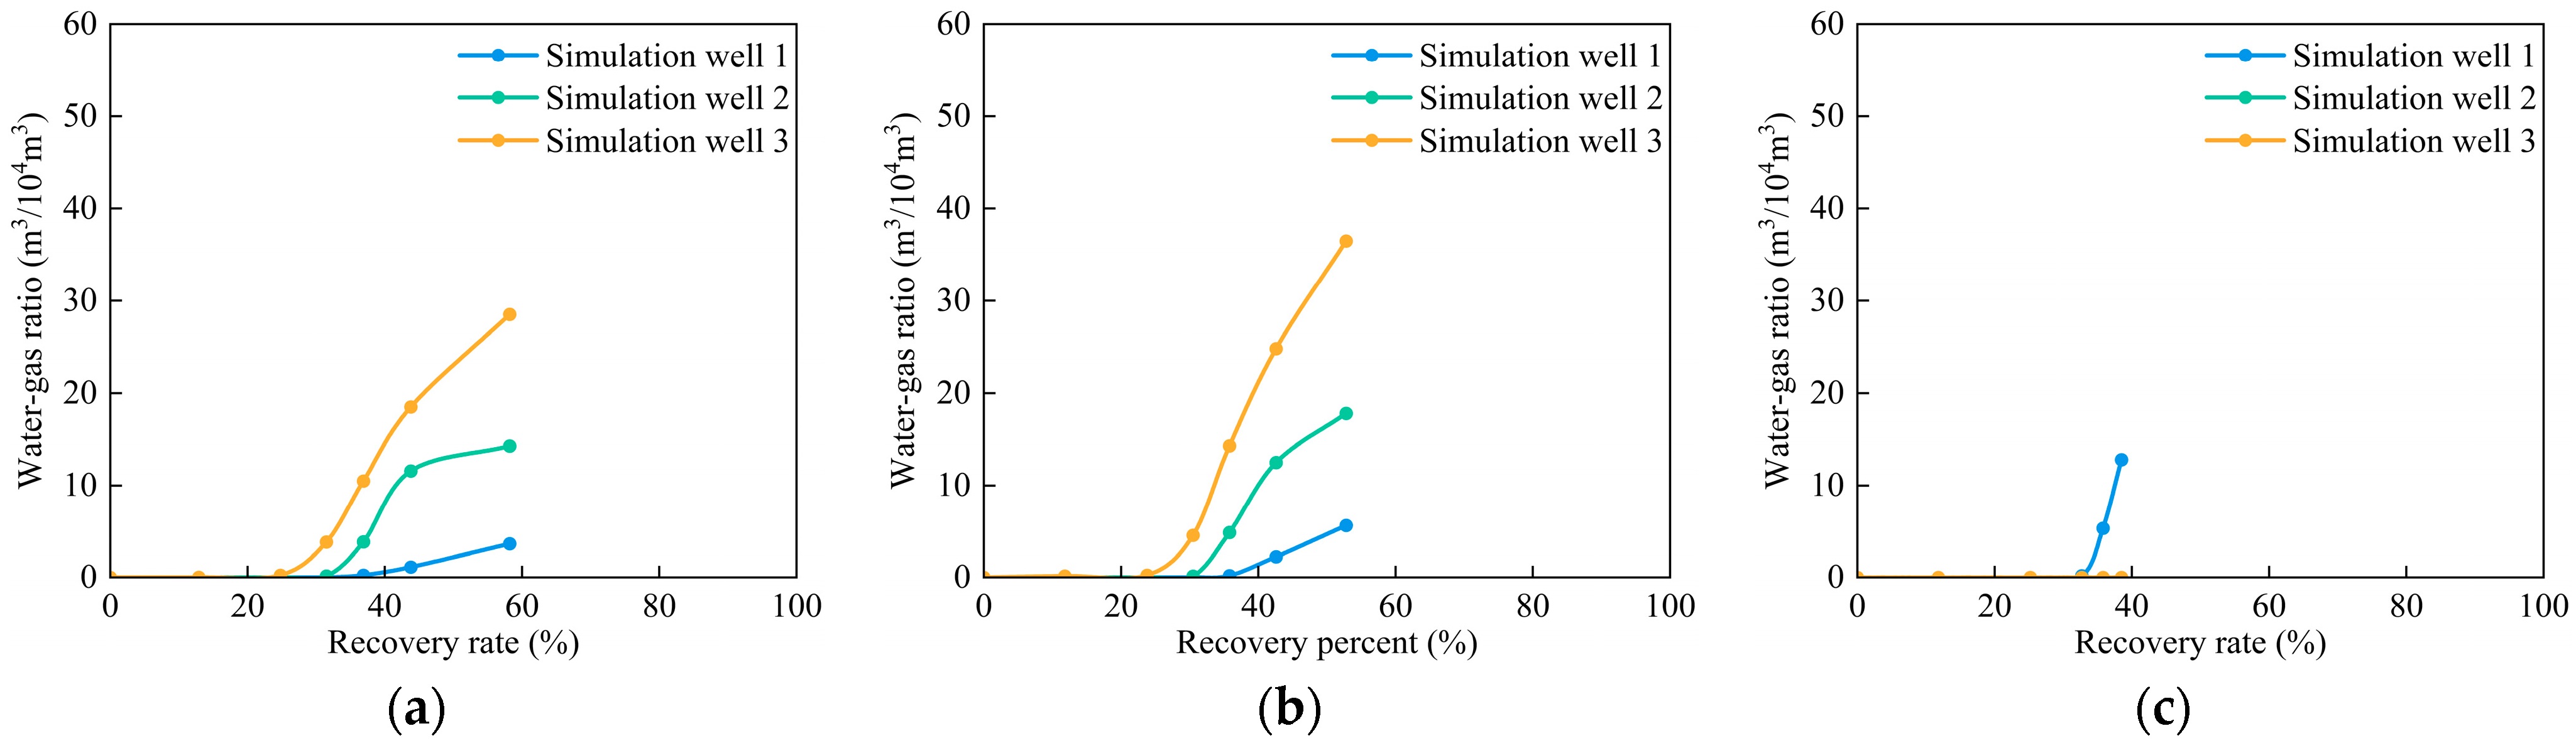
In the late production stage, the water body rapidly advances along the fractures and high-permeability zones, resulting in gas wells waterflooding, lowering the ultimate recovery rate, and increasing the residual gas volume. Therefore, it is suggested that the low-position gas wells should be drained after water breakthrough to reduce the overall energy of water invasion, delay the water invasion rate in the high-position gas well area, improve the development effect, and increase the ultimate recovery rate of the gas reservoir. However, it is necessary to do an excellent job in treating produced water.
(3)
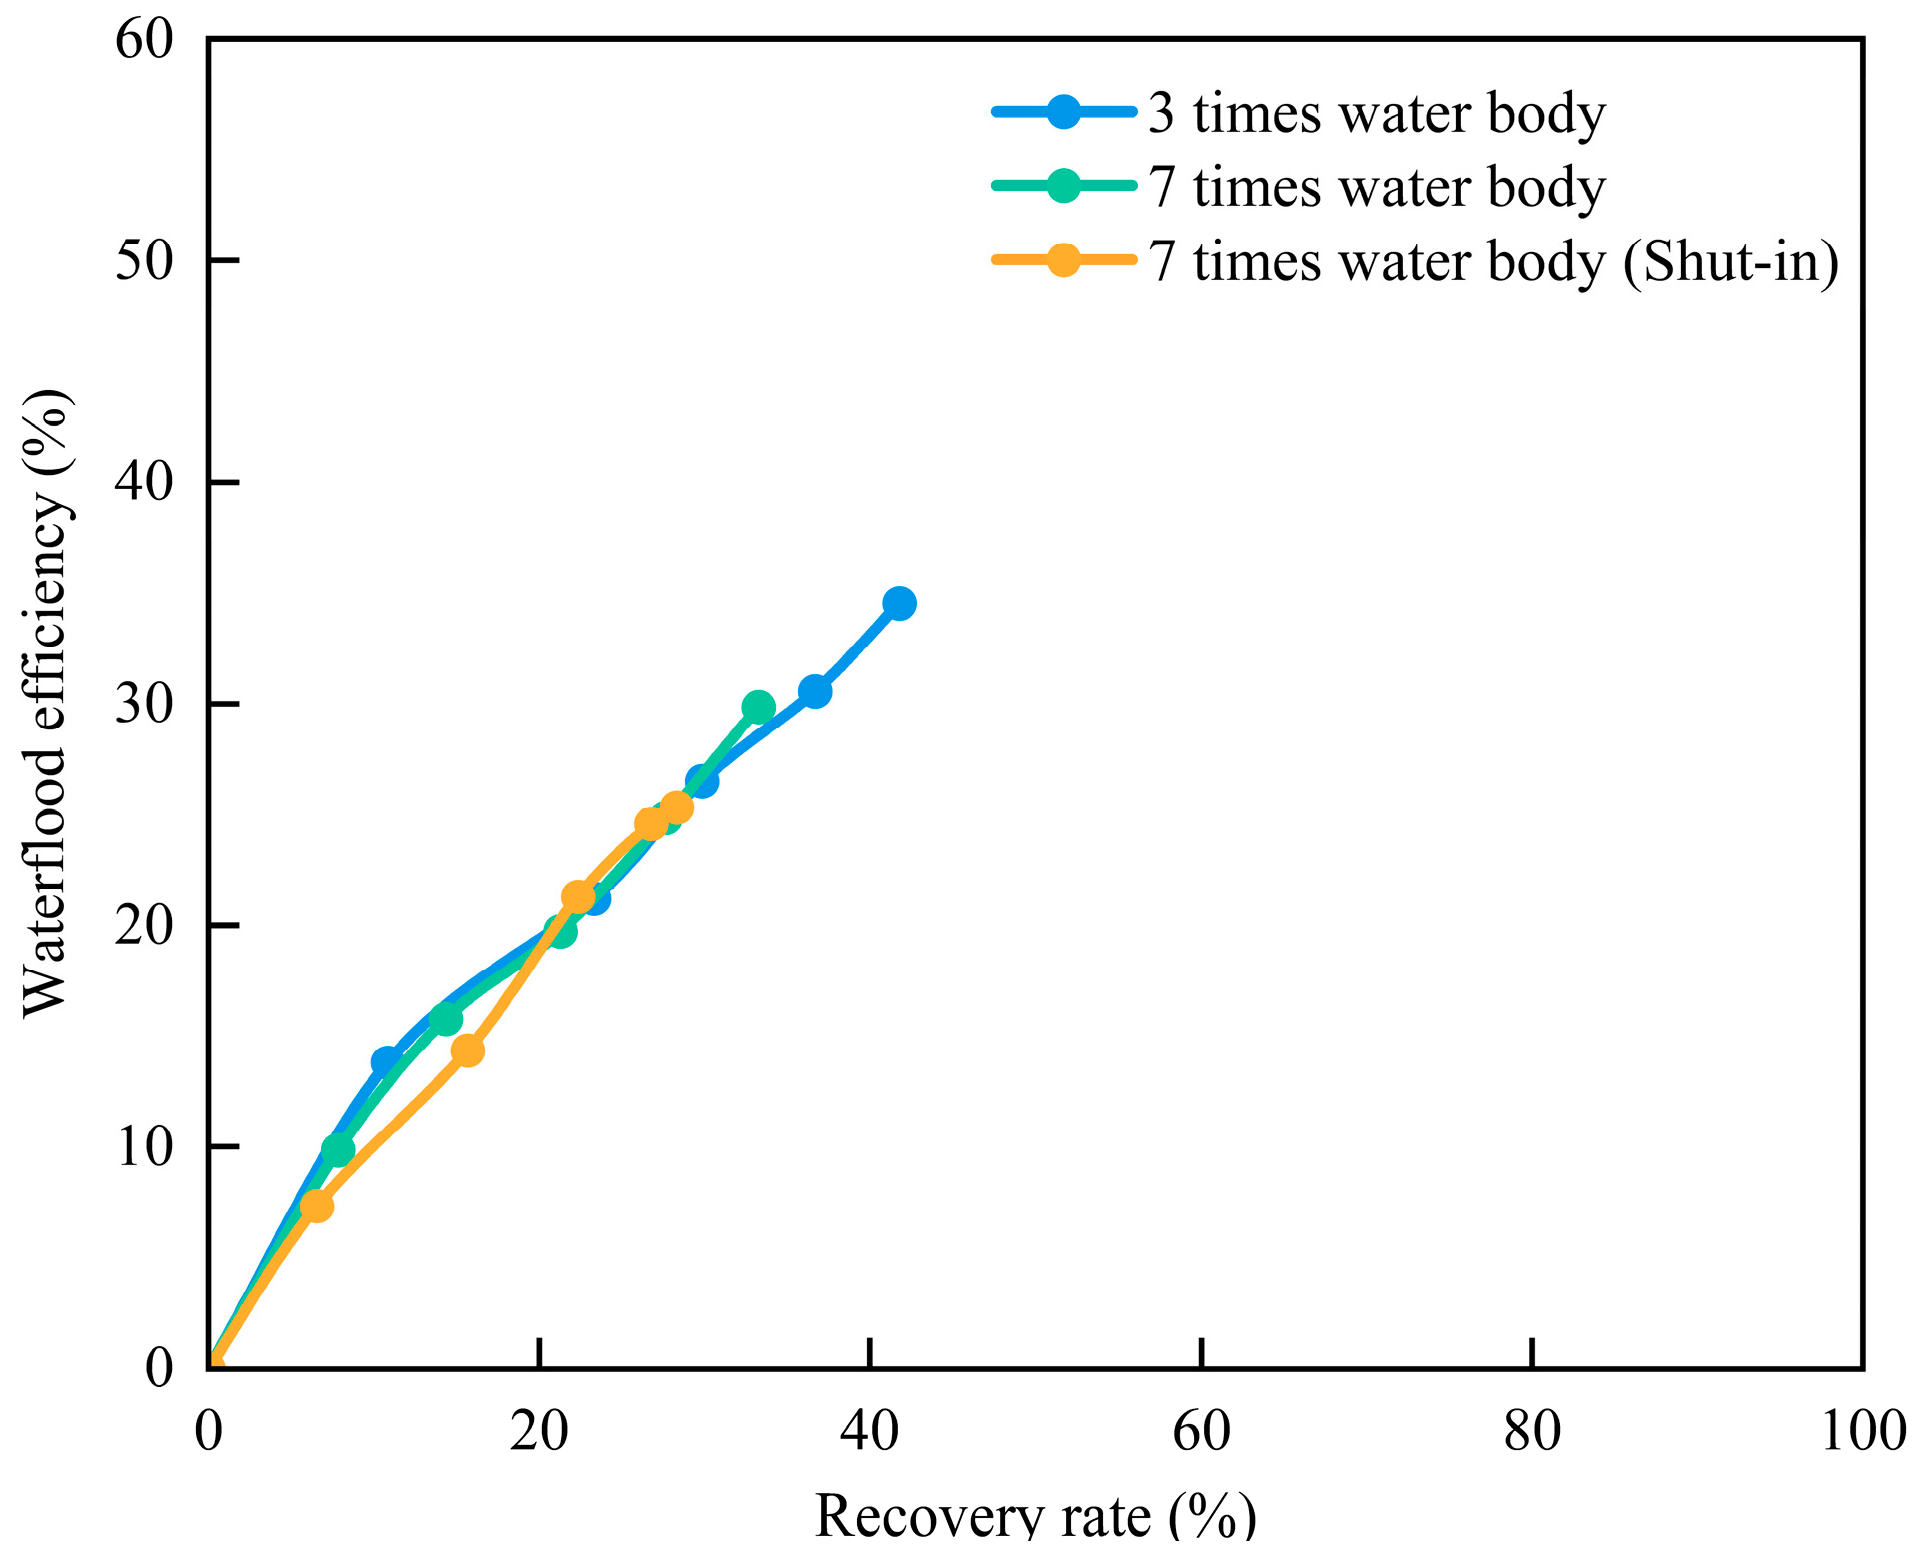
Under the same water body multiple conditions, shutting in the gas well immediately after water breakthrough reduces water production and increases the water-free production period but decreases the recovery rate. This production system is applicable when the water treatment capacity of the gas reservoir is poor, as it aims to maximize the water-free recovery rate and obtain the maximum economic benefits.
(4)
The residual gas is mainly distributed around the fracture–high-permeability zone and at the edge of the gas reservoir. It is suggested that well pattern thickening be implemented or the drainage–production ratio be increased in the residual gas enrichment area, the residual gas volume at abandonment be reduced, and the recovery rate be increased.

Author Contributions

Conceptualization, S.H. and F.F.; methodology, S.H. and J.Z. (Jie Zhang); software, J.Z. (Jian Zhuang); validation, J.Z. (Jian Zhuang) and Y.B.; formal analysis, J.Z. (Jian Zhuang); investigation, S.H. and J.Z. (Jie Zhang); resources, F.F. and Y.B.; data curation, S.H.; writing—original draft preparation, S.H. and F.F.; writing—review and editing, S.H. and F.F.; visualization, S.H.; supervision, F.F. and Y.B.; project administration, S.H.; funding acquisition, S.H. and F.F. All authors have read and agreed to the published version of the manuscript.

Funding

This research was funded by the Natural Science Foundation of Chongqing, CSTB2022NSCQ-MSX1423, the Scientific and Technological Research Program from Chongqing Municipal Education Commission, KJQN202301537, the National Energy Shale Gas Research and Development (Experimental) Center Open Fund, 2023-KFKT-39, the National Energy Tight Oil and Gas Research and Development Center Development Fund, 2023-KFKT-11.

Institutional Review Board Statement

Not applicable.

Informed Consent Statement

Not applicable.

Data Availability Statement

The data presented in this study are available on request from the corresponding author. The data are not publicly available due to some data confidentiality restrictions.

Conflicts of Interest

Author Jian Zhuang was employed by the PetroChina Jilin Oilfield Company. Author Yanan Bian was employed by the Research Institute of Petroleum Exploration and Development. The remaining authors declare that the research was conducted in the absence of any commercial or financial relationships that could be construed as a potential conflict of interest.

References

  1. Wang, Z.; Sun, X.; Xiao, X. Efficient development technologies for ultradeep, overpressured and fractured sandstone gas reservoirs: A cased study of the Kelasu Gas Field in the Tarim Basin. Nat. Gas Ind. 2018, 38, 87–95. [Google Scholar] [CrossRef]
  2. Xu, X.; Wan, Y.; Chen, Y.; Hu, Y.; Mei, Q.; Jiao, C. Physical simulation of water invasion and water control for the fractured water-bearing gas reservoirs. Nat. Gas Geosci. 2019, 30, 1508–1518. [Google Scholar] [CrossRef]
  3. Lyu, Z.; Tang, H.; Liu, Q.; Tang, Y.; Wang, Q.; Chang, B.; Nie, Y. Dynamic evaluation method of water sealed gas for ultra-deep fractured tight gas reservoir in Kuqa Depression, Tarim Basin. Nat. Gas Geosci. 2022, 33, 1874–1882. [Google Scholar] [CrossRef]
  4. Guo, P.; Jing, S.; Peng, C. Technology and countermeasures for gas recovery enhancement. Nat. Gas Ind. 2014, 34, 48–55. [Google Scholar] [CrossRef]
  5. Jia, A.; Yan, H.; Guo, J.; He, D.; Wei, T. Characteristics and experiences of the development of various giant gas fields all over the world. Nat. Gas Ind. 2014, 34, 33–46. [Google Scholar] [CrossRef]
  6. Sun, Y.; Lu, J.; Wan, Y.; Han, Y.; Tang, H.; Li, Q. Enlightenments of Lacq and Meillon gas fields in France to the development of Longwangmiao Fm gas reservoirs in the Anyue Gas Field, Sichuan Basin. Nat. Gas Ind. 2016, 36, 37–45. [Google Scholar] [CrossRef]
  7. Wen, D. Study on Oil and Gas Reservoir Calculation and Hydrocarbon Accumulation of Ouge Basin-Taking Kelu and Hela Gas Fields as Examples. Master’s Thesis, Northeast Petroleum University, Daqing, China, 2017. [Google Scholar]
  8. Mu, L.; Chen, Y.; Xu, A.; Wang, R. Technological progress and development directions of PetroChina overseas oil and gas field production. Petrol. Explor. Develop. 2020, 47, 120–128. [Google Scholar] [CrossRef]
  9. Zhang, J.; Li, X.; Gao, S.; Ye, L.; Liu, H.; Zhu, W.; Fang, F. Water production mechanism of tight sandstone gas reservoir and its influence on percolation capacity. Nat. Gas Geosci. 2019, 30, 1519–1530. [Google Scholar] [CrossRef]
  10. Lyu, J.; Lu, X.; Wang, W.; Xie, K.; Hu, Y. Visual test of gas-water distribution in tight sandstone pores. Spec. Oil Gas Reserv. 2019, 26, 136–141. [Google Scholar] [CrossRef]
  11. Fan, H.; Zhong, B.; Li, X.; Liu, Y.; Yang, H.; Feng, X.; Zhang, Y. Studies on water invasion mechanism of fractured-watered gas reservoir. Nat. Gas Geosci. 2012, 23, 1179–1184. [Google Scholar] [CrossRef]
  12. Li, T. Characteristics of water influx in the development of the Puguang Gas Field, Sichuan Basin. Nat. Gas Ind. 2014, 34, 65–71. [Google Scholar] [CrossRef]
  13. Zhang, T.; Sun, T.; Chen, W.; Zhu, G.; Wang, X. Pore-scale simulation of gas-water two phase flow in carbonate reservoir with different combinations of pore, network and hole. J. Southwest Pet. Univ. Sci. Technol. Ed. 2023, 45, 88–96. [Google Scholar] [CrossRef]
  14. Yan, Y.; Chen, J.; Guo, J.; Cheng, Y.; Zhang, Q. A visualized experiment on gas-water two-phase seepage through oolitic reservoirs in the Longgang Gas Field, Sichuan Basin. Nat. Gas Ind. 2012, 32, 64–66. [Google Scholar] [CrossRef]
  15. Fang, F.; Li, X.; Gao, S.; Xue, H.; Zhu, W.; Liu, H.; An, W.; Li, C. Visual simulation experimental study on water invasion rules of gas reservoir with edge and bottom water. Nat. Gas Geosci. 2016, 27, 2246–2252. [Google Scholar] [CrossRef]
  16. Fang, F.; Liu, H.; Xiao, Q.; Qing, H.; Yang, Q. Experimental simulation study on water invasion laws of heterogeneous gas reservoir. Lab. Res. Explor. 2019, 38, 85–89. [Google Scholar] [CrossRef]
  17. Liu, H.; Ren, D.; Gao, S.; Hu, Z.; Ye, L.; Liu, X. Water influx mechanism and development strategy of gas reservoirs with edge and bottom water. Nat. Gas Ind. 2015, 35, 47–53. [Google Scholar] [CrossRef]
  18. Jia, A.; Yan, H. Problems and countermeasures for various types of typical carbonate gas reservoirs development. Acta Pet. Sin. 2014, 35, 519–527. [Google Scholar] [CrossRef]
  19. Gao, S.; Yang, M.; Ye, L.; Liu, H.; Zhu, W. Simulation experiment of water invasion performance in low-permeability bottom water gas reservoir and its influence on recovery factor. Nat. Gas Ind. 2022, 42, 61–70. [Google Scholar] [CrossRef]
  20. Shen, W.; Li, X.; Liu, X.; Lu, J.; Jiao, C. Physical simulation of water influx mechanism in fractured gas reservoirs. J. Cent. South Univ. Sci. Technol. 2014, 45, 3283–3287. [Google Scholar]
  21. Wang, L.; Yang, S.; Liu, Y.; Xu, W.; Deng, H.; Meng, Z.; Han, W.; Qian, K. Experiments on gas supply capability of commingled production in a fracture-cavity carbonate gas reservoir. Petrol. Explor. Develop. 2017, 44, 779–787. [Google Scholar] [CrossRef]
  22. Huang, X.; Guo, X.; Zhou, X.; Shen, C.; Lu, X.; Qi, Z.; Xiao, Q.; Yan, W. Effects of water invasion law on gas wells in high temperature and high pressure gas reservoir with a large accumulation of water-soluble gas. J. Nat. Gas Sci. Eng. 2019, 62, 68–78. [Google Scholar] [CrossRef]
  23. Fang, F.; Shen, W.; Li, X.; Gao, S.; Liu, H.; Li, J. Experimental study on water invasion mechanism of fractured carbonate gas reservoirs in Longwangmiao Formation, Moxi block, Sichuan Basin. Environ. Earth Sci. 2019, 78, 316. [Google Scholar] [CrossRef]
  24. Zhou, M.; Yue, P.; Guo, C.; Chen, P. Dynamic simulation of water invasion in fractured gas reservoir. Lab. Res. Explor. 2020, 39, 104–109. [Google Scholar] [CrossRef]
  25. Liu, H.; Gao, S.; Ye, L.; Zhu, W.; An, W. Change laws of water invasion performance in fractured–porous water-bearing gas reservoirs and key parameter calculation methods. Nat. Gas Ind. 2020, 40, 90–99. [Google Scholar] [CrossRef]
  26. Hu, Y.; Li, X.; Jiang, L.; Wan, Y.; Guo, C.; Jiao, C.; Cai, X.; Jing, W.; Xu, X.; Zhou, M.; et al. Production experiment of multi-layer edge-water loose sandstone gas reservoir in Qaidam Basin. Nat. Gas Geosci. 2022, 33, 1499–1508. [Google Scholar] [CrossRef]
  27. Yang, D.; Xie, K.; Yin, Q.; Lu, X.; Xiao, J.; Shen, W. Research status and prospect of water intrusion law in edge and bottom water gas reservoirs. Nat. Gas Geosci. 2024, 35, 1304–1322. [Google Scholar] [CrossRef]
  28. Xu, X.; Mei, Q.; Chen, Y.; Han, Y.; Tang, H.; Jiao, C.; Guo, C. Experimental analysis method for water invasion and development performance of gas reservoir. Nat. Gas Geosci. 2020, 31, 1355–1366. [Google Scholar] [CrossRef]
  29. Fang, F.; Gao, S.; Liu, H.; Xiao, Q.; Ma, X.; Zhang, C. Experimental simulation study on water invasion law of gas reservoir with multiwell development. Lab. Res. Explor. 2019, 38, 42–45. [Google Scholar]
  30. Fang, F.; Li, X.; Gao, S.; Liu, H.; Zhu, W.; An, W.; Li, C.; Gui, T. Study on dynamic physical simulation experiment of water invasion in carbonate gas reservoir. In Proceedings of the 2016 Annual Natural Gas Academic Conference, Yinchuan, China, 28 September 2016. [Google Scholar]
  31. Jiang, T.; Zhang, H.; Wang, H.; Yin, G.; Xiao, X. Effects of faults geomechanical activity on water invasion in Kela 2 Gasfield, Tarim Basin. Nat. Gas Geosci. 2017, 28, 1735–1744. [Google Scholar] [CrossRef]
Figure 1. Fluid distribution profile of Kela 2 gas field [31].
Applsci 14 08067 g001
Figure 2. Experimental model design. (a) Fracture model; (b) fracture–high-permeability zone model.
Applsci 14 08067 g002
Figure 3. Well locations and depths of simulated wells.
Applsci 14 08067 g003
Figure 4. Experimental equipment and process.
Applsci 14 08067 g004
Figure 5. The relationship between bottom hole pressure, drawdown pressure, and recovery rate.
Applsci 14 08067 g005
Figure 6. Relationship between bottom hole pressure and recovery rate of fracture model. (a) Three times water body; (b) seven times water body; (c) seven times water body (shut-in after water breakthrough).
Applsci 14 08067 g006
Figure 7. Relationship between waterflood efficiency and recovery rate of fracture model.
Applsci 14 08067 g007
Figure 8. Relationship between production water–gas ratio and recovery rate of fracture model. (a) Three times water body; (b) seven times water body; (c) seven times water body (shut-in after water breakthrough).
Applsci 14 08067 g008
Figure 9. Variation in water saturation in different areas of the fracture model during early water invasion (3 times water body).
Applsci 14 08067 g009aApplsci 14 08067 g009b
Figure 10. Variation in water saturation in different areas of the fracture model at the water breakthrough time of simulation well 3 (3 times water body).
Applsci 14 08067 g010
Figure 11. Variation in water saturation in different areas of the fracture model at the end of the experiment (3 times water body).
Applsci 14 08067 g011
Figure 12. Variation in water saturation of the fracture model at the end of the experiment. (a) Three times water body; (b) seven times water body.
Applsci 14 08067 g012
Figure 13. Relationship between bottom hole pressure and recovery rate of fracture–high-permeability zone model. (a) Three times water body; (b) seven times water body; (c) seven times water body (shut-in after water breakthrough).
Applsci 14 08067 g013
Figure 14. Relationship between waterflood efficiency and recovery rate of fracture–high-permeability zone model.
Applsci 14 08067 g014
Figure 15. Comparison of overall water invasion rate.
Applsci 14 08067 g015
Figure 16. Relationship between production water–gas ratio and recovery rate of fracture–high-permeability zone model. (a) Three times water body; (b) seven times water body; (c) seven times water body (shut-in after water breakthrough).
Applsci 14 08067 g016
Figure 17. Variation in water saturation in different areas of the fracture–high-permeability zone model during early water invasion (3 times water body).
Applsci 14 08067 g017aApplsci 14 08067 g017b
Figure 18. Variation in water saturation in different areas of the fracture–high-permeability zone model at the water breakthrough time of simulation well 3 (3 times water body).
Applsci 14 08067 g018
Figure 19. Variation in water saturation in different areas of the fracture–high-permeability zone model at the end of the experiment (3 times water body).
Applsci 14 08067 g019
Figure 20. Recovery rate and waterflood efficiency under different water body multiples and different production systems. (a) Fracture model; (b) fracture–high-permeability zone model.
Applsci 14 08067 g020
Figure 21. Water saturation distribution of the fracture model at the end of the experiment. (a) Three times water body; (b) seven times water body; (c) seven times water body (shut-in after water breakthrough).
Applsci 14 08067 g021
Figure 22. The water saturation distribution of the fracture–high-permeability zone model at the end of the experiment. (a) Three times water body; (b) seven times water body; (c) seven times water body (shut-in after water breakthrough).
Applsci 14 08067 g022
Figure 23. The relationship between the experimental residual gas volume and the drainage–production ratio. (a) Fracture model; (b) fracture–high-permeability zone model.
Applsci 14 08067 g023
Table 1. Experimental scheme.
Experimental SchemeWater Body Multiples (PV)Number of
Simulation Wells
Single-Well Production Allocation (mL·min−1)Production System
Different water body multiples035000, 10,000, 15,000No shut-in after water breakthrough
33
73
Different production systems735000, 10,000, 15,000Shut-in after water breakthrough
Disclaimer/Publisher’s Note: The statements, opinions and data contained in all publications are solely those of the individual author(s) and contributor(s) and not of MDPI and/or the editor(s). MDPI and/or the editor(s) disclaim responsibility for any injury to people or property resulting from any ideas, methods, instructions or products referred to in the content.

