Article

Evaluating the Plastic Anisotropic Effect on the Forming Limit Curve of 2024-T3 Aluminum Alloy Sheets Using Marciniak Tests and Digital Image Correlation

1
Escuela de Ingeniería Mecánica, Pontificia Universidad Católica de Valparaíso, Av. Los Carrera 01567, Quilpué 2430000, Chile
2
Naval Polytechnic Academy, Chilean Navy, Viña del Mar 2520000, Chile
3
Metallurgical Engineering Department, University of Santiago, Santiago 8320000, Chile
4
Programs, Research and Development Directorate, Chilean Navy, Valparaíso 2360035, Chile
5
Department of Mechanical Engineering (DIM), Faculty of Engineering (FI), University of Concepción, Concepción 4030000, Chile
*
Author to whom correspondence should be addressed.
Appl. Sci. 2024, 14(17), 8082; https://doi.org/10.3390/app14178082
Submission received: 26 July 2024 / Revised: 21 August 2024 / Accepted: 22 August 2024 / Published: 9 September 2024

Abstract

:
This study thoroughly investigates the influence of anisotropy on the formability of 2024-T3 aluminum alloy sheets using advanced techniques such as digital image correlation (DIC) and Marciniak tests. A key finding is the relatively small variation in anisotropy values across different strain paths and orientations, contrasting with more significant variations reported in other studies. Tests were conducted on nine samples with various geometries to induce specific strain paths, including uniaxial, plane, and balanced biaxial strains, oriented in different directions relative to the rolling direction. The study also provides a detailed analysis of microstructural and mechanical characteristics, such as precipitate distribution and anisotropy behavior, which are crucial for understanding the relationship between microstructure and material formability. The results show that while anisotropy impacts deformation capacity, the differences in formability among the directions were minimal, with slightly greater formability observed in the diagonal direction. These findings are compared with forming limit curves (FLCs), offering an integrated view of how relatively uniform anisotropic properties influence formability. These insights are essential for optimizing the processing and application of 2024-T3 alloy in industrial contexts, emphasizing the importance of understanding anisotropy in the design of metal components.

1. Introduction

Given the crucial role of 2024-T3 aluminum alloy in producing lightweight yet high-strength components in aerospace and automotive industries, understanding its mechanical behavior under various loading conditions is essential. The anisotropic nature of this alloy, specifically, significantly influences its mechanical properties and formability. This makes the study of anisotropy and its impact on the forming limit curve (FLC) a vital area of research for optimizing the material’s performance in critical applications.
It is well known that 2024-T3 aluminum has a strong presence in the automotive and aerospace industries to produce components and spares due to its excellent hardness, strength, and lightweight characteristics. The analysis of the mechanical characteristics and resistance to the plastic deformation of aluminum alloy sheets has been the focus of research in recent decades. The impact of artificial aging on the mechanical characteristics of aircraft aluminum alloy 2024 was documented by Reis et al. [1]. Khan et al. [2] investigated how processing variables affected the flow, formability, and hardness of the alloy material. During the deep drawing process, the materials were subjected to cold working with a hemispherical punch to assess their formability. Chen et al. [3] experimented on sheets of 2024 aluminum alloy using hot forming techniques with synchronous cooling (HFSC). According to their analysis, HFSC significantly reduced spring back, resulting in better final geometries with less distortion while maintaining constant hardening levels. The effects of heat treatment on the microstructure, crystallographic texture, and formability of sheets made of 2024 aluminum alloy were examined by Moy et al. [4]. Their research showed that precipitation-induced alterations in the microstructure of the aluminum alloy sheet were caused by solution treatment and artificial aging. They also concluded that heat treatment, which involved solution treatment at 150 °C for two days and artificial aging at the same temperature for two days, improved the forming characteristics of the sheets. The expected failure of 2024 aluminum sheets under biaxial stretching circumstances was examined by Vallellano et al. [5]. Their analysis showed that shear forces are the main factors controlling material failure, and that these forces are concentrated in the through-thickness plane. Tensile and formability tests were used by Wang et al. [6] to conduct an experimental and numerical analysis of 2424 aluminum sheets that were subjected to cryogenic forming procedures. Their research showed that testing conducted at low temperatures can enhance strain limits.
The formability test is widely utilized in the production of sheet metal components, encompassing various operational types and conditions, such as cold forming or hot forming processes. The forming limit diagram (FLD), initially introduced by Keeler and Backofen [7] and later refined by Goodwin [8], serves as a crucial tool in assessing sheet metal formability. The FLD delineates the maximum values of major ( ε 1 ) and minor ( ε 2 ) principal strains that a sheet metal can withstand before necking occurs, signifying a localized thinning of the material. To determine the experimental FLD, several mechanical tests are employed, with the Marciniak [9] and Nakazima [10] tests being the most frequently utilized. In the Marciniak test, flat-tip punches induce plastic straining on the sheet metal, while round-tip punches are employed in the Nakazima test. Different sample geometries are utilized in these tests, resulting in diverse strain paths. The primary distinction lies in the geometry of the punch used, influencing the deformation behavior of the material.
Various methodologies are employed to identify necking onset and the corresponding limit strain. One approach, proposed by Keeler et al. [11] and Sowerby et al. [12], involves the application of grid circles and square patterns on the sample surface, respectively. Bragard et al. [13] devised a grid of circles method, in which each test piece corresponds to a single point in the forming limit diagram (FLD). The digital image correlation (DIC) technique has also been developed, offering a comprehensive optical method for measuring displacement across the entire sample surface. Different approaches utilize DIC measurements of position [14], strain rate [15,16,17,18,19,20,21,22], and strain acceleration [23] (time-dependent), employing the Hencky strain tensor to determine the limit strain and FLD. Additionally, some researchers have presented methods that analyze thickness strain [24,25,26] and have the capability to scrutinize multiple local necks [22,27,28].
There are several factors that impact the limit strain for different strain paths, including parameters like strain hardening n [28], plastic anisotropy R [29], strain rate hardening m [30], alterations in strain path, and the uniformity of strain across the sheet thickness [31]. Crystallographic texture stands out as a critical microstructural characteristic, significantly influencing mechanical properties such as normal and planar plastic anisotropy or yield stress anisotropy.
Face-centered cubic (FCC) materials during lamination are commonly described by their ideal orientation: Copper {112}<111>, Brass {110} <112>, S {123}<634> and Dillamore {4 4 11}<11 11 8>, Cube {001}<100> and Goss {110}<100> with two characteristic fibers: alpha α and beta β . Numerous studies examining the influence of texture on formability properties have explored texture evolution [32], strain paths [33], localized necking [34], the impact of friction on texture [35], texture’s influence on anisotropy [36], and effects on cube texture along with various records of nonproportional loads [37].
Despite extensive research on the mechanical properties and formability of 2024-T3 aluminum alloy, there remains a gap in understanding how anisotropy specifically affects its formability under different strain paths. While previous studies have explored the effects of heat treatment and forming processes, a comprehensive analysis of anisotropy’s role in the FLC behavior of this alloy is still needed. This study addresses this gap by experimentally investigating the influence of anisotropy on the formability of 2024-T3 aluminum alloy sheets using Marciniak tests and digital image correlation. The primary objective of this study is to elucidate the relationship between anisotropy and formability in 2024-T3 aluminum alloy sheets. By examining various strain paths and directions relative to the rolling direction, this research provides critical insights into how anisotropic properties affect the material’s performance during forming processes. The findings are expected to contribute to the optimization of forming processes for aerospace and automotive components, ensuring better predictability and reliability in manufacturing.
In this study, we experimentally investigated how anisotropy influences the formability of 2424 T3 aluminum alloy sheets. Different strain paths were examined using Marciniak tests on nine samples with varied geometries. These paths included uniaxial, plane, and balanced biaxial strain, oriented in three directions relative to the rolling direction. This study also examined the mechanical and microstructural characterizations of the alloy. The results were compared with forming limit curve (FLC) behavior to elucidate the connection between material properties, anisotropy, and formability.

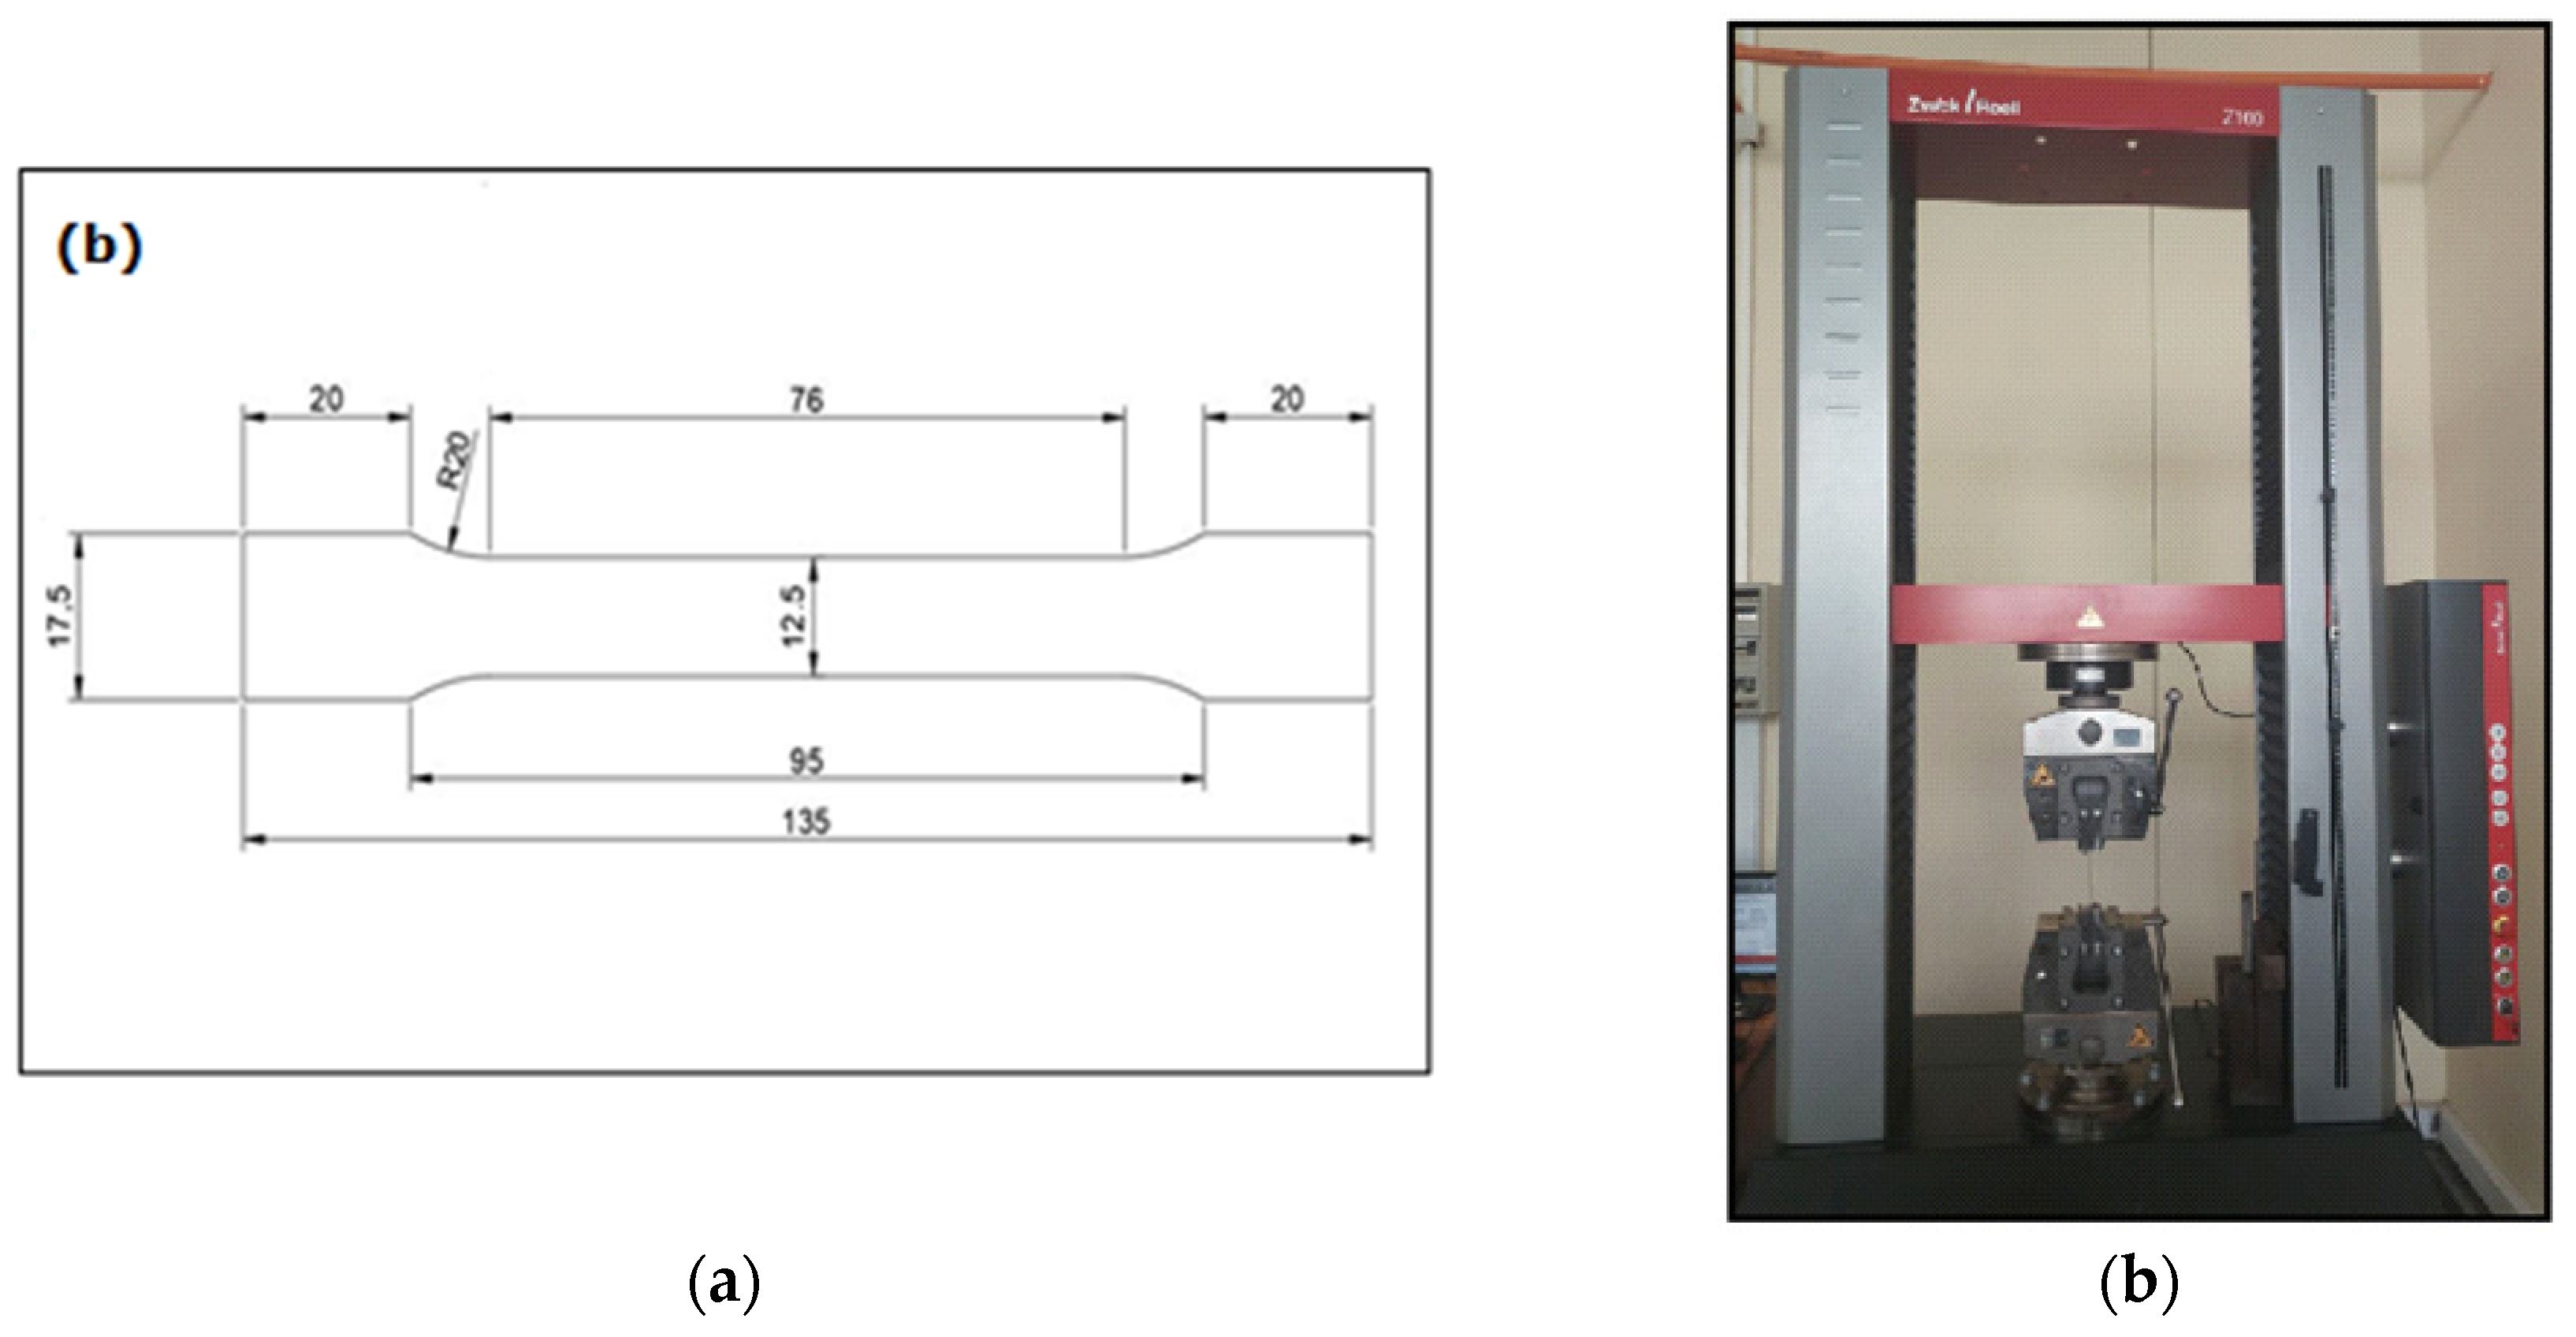
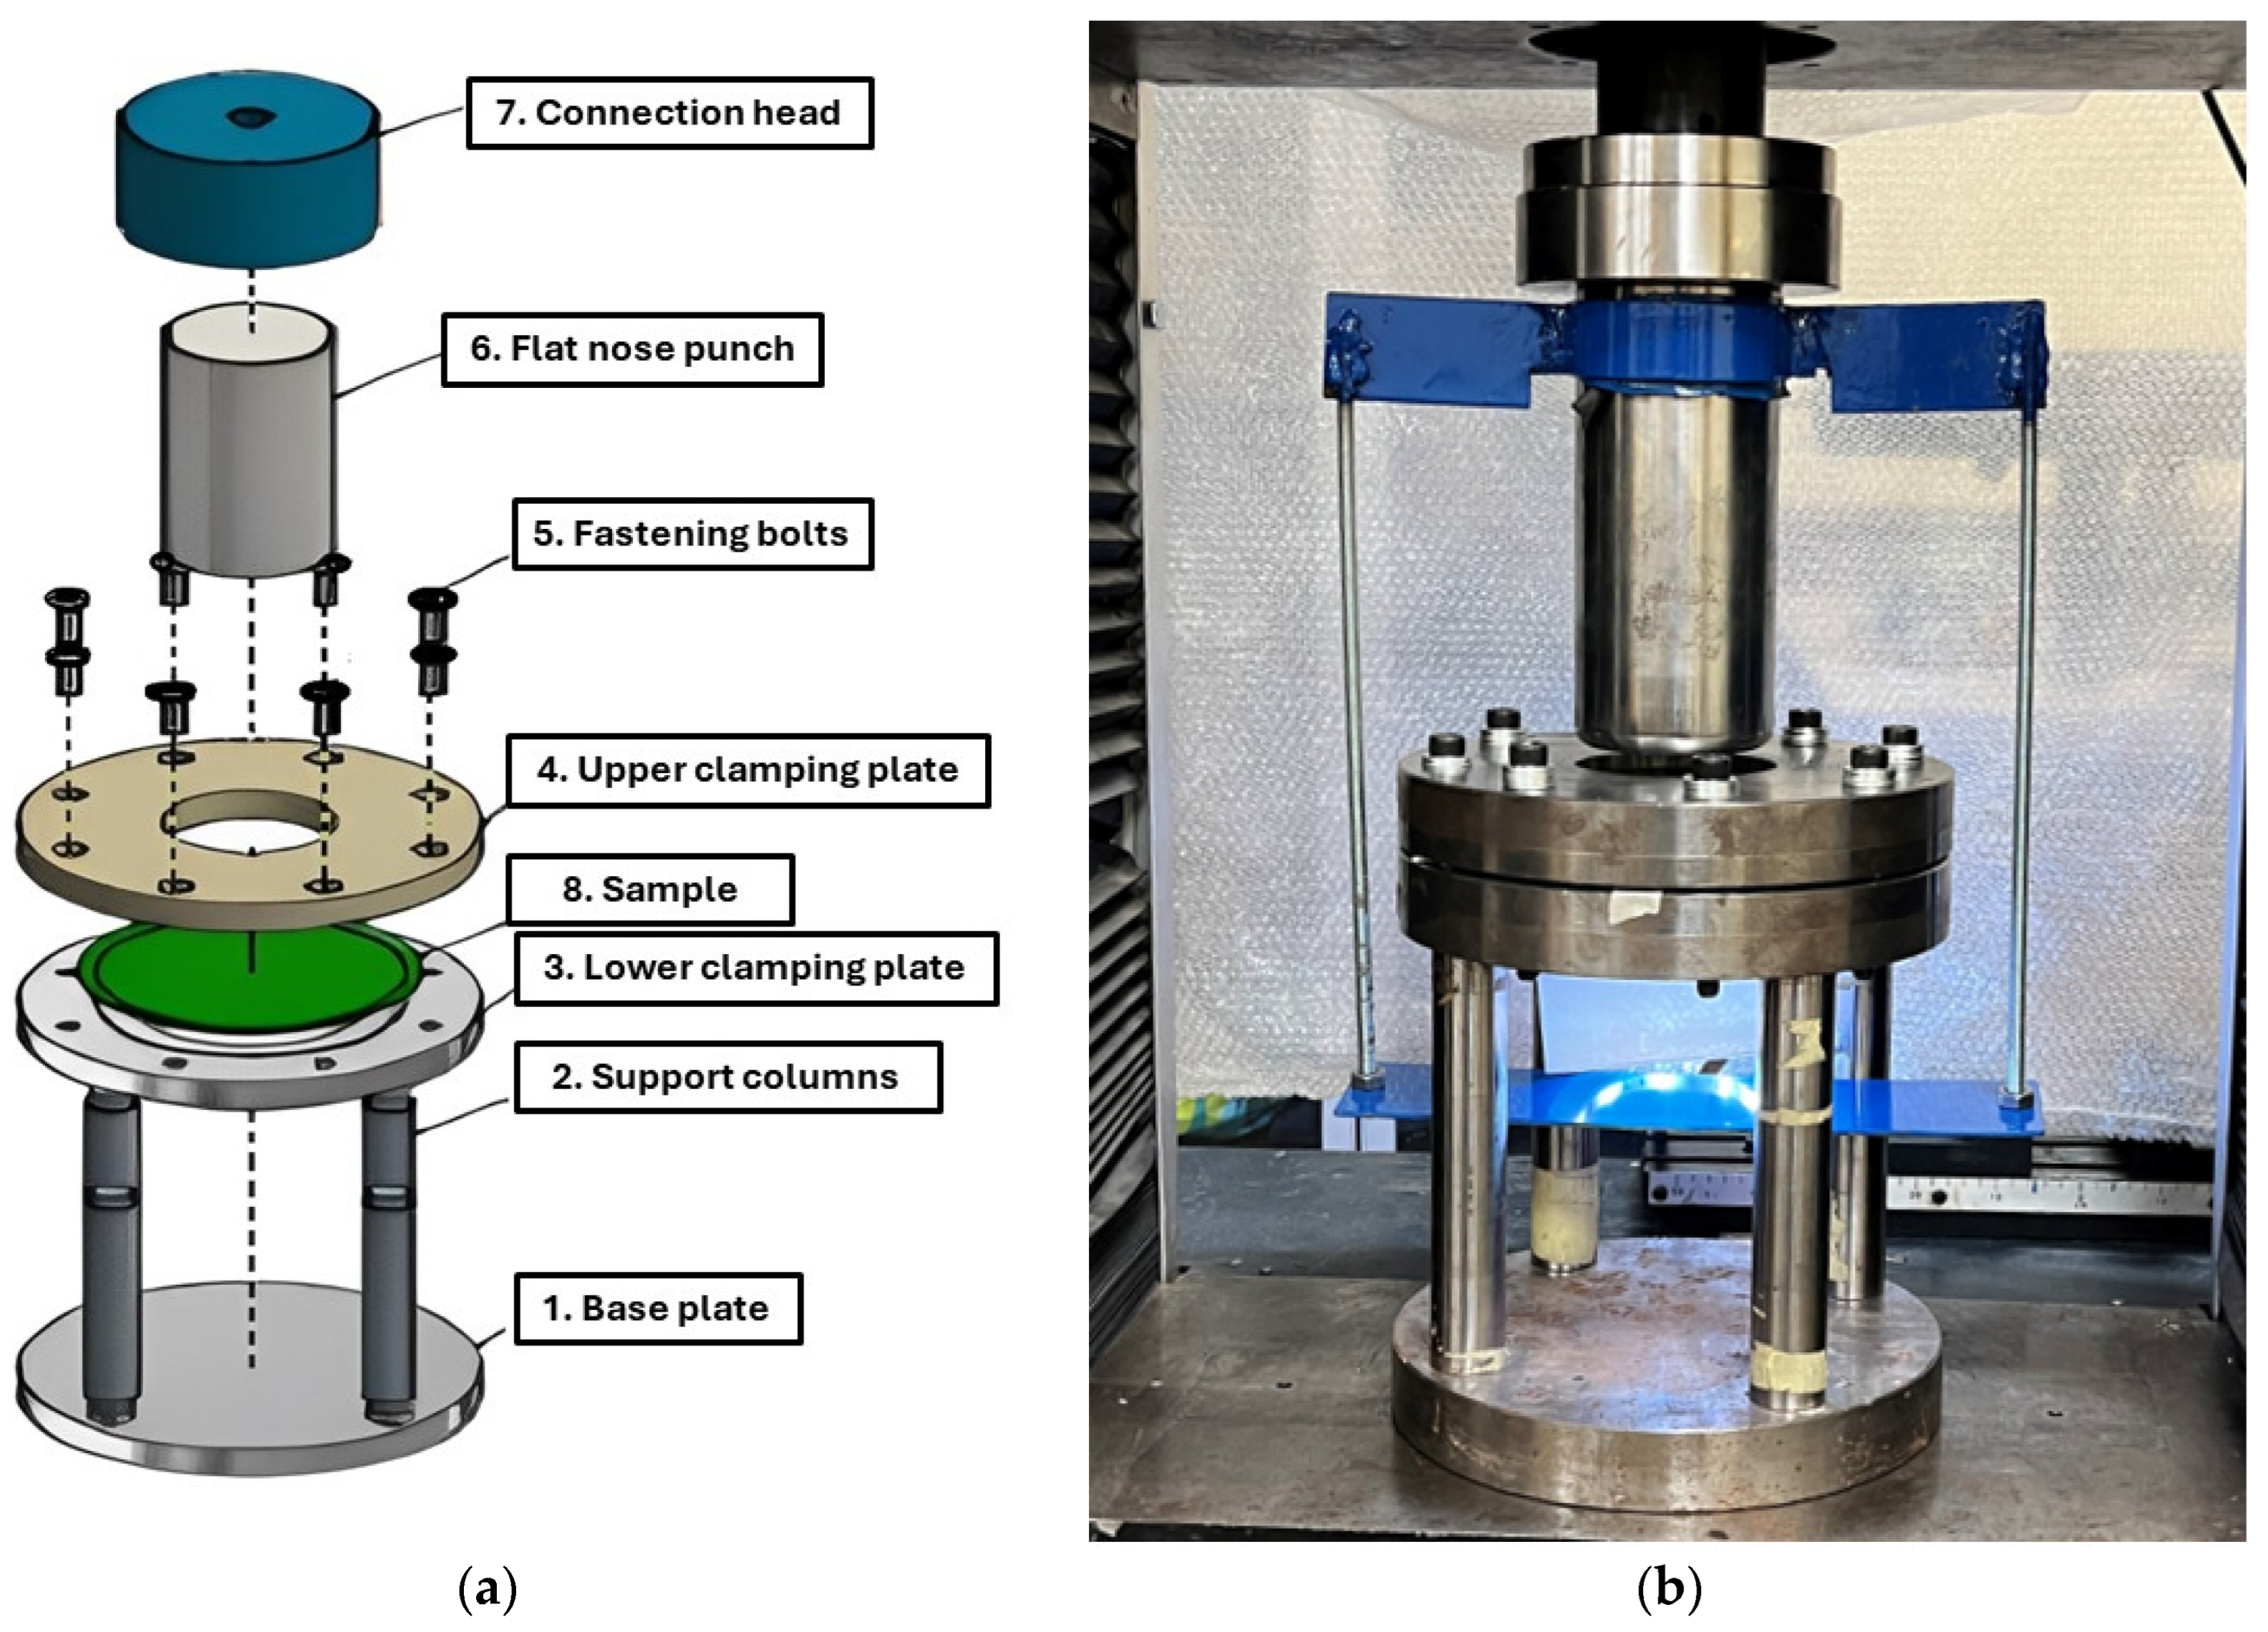
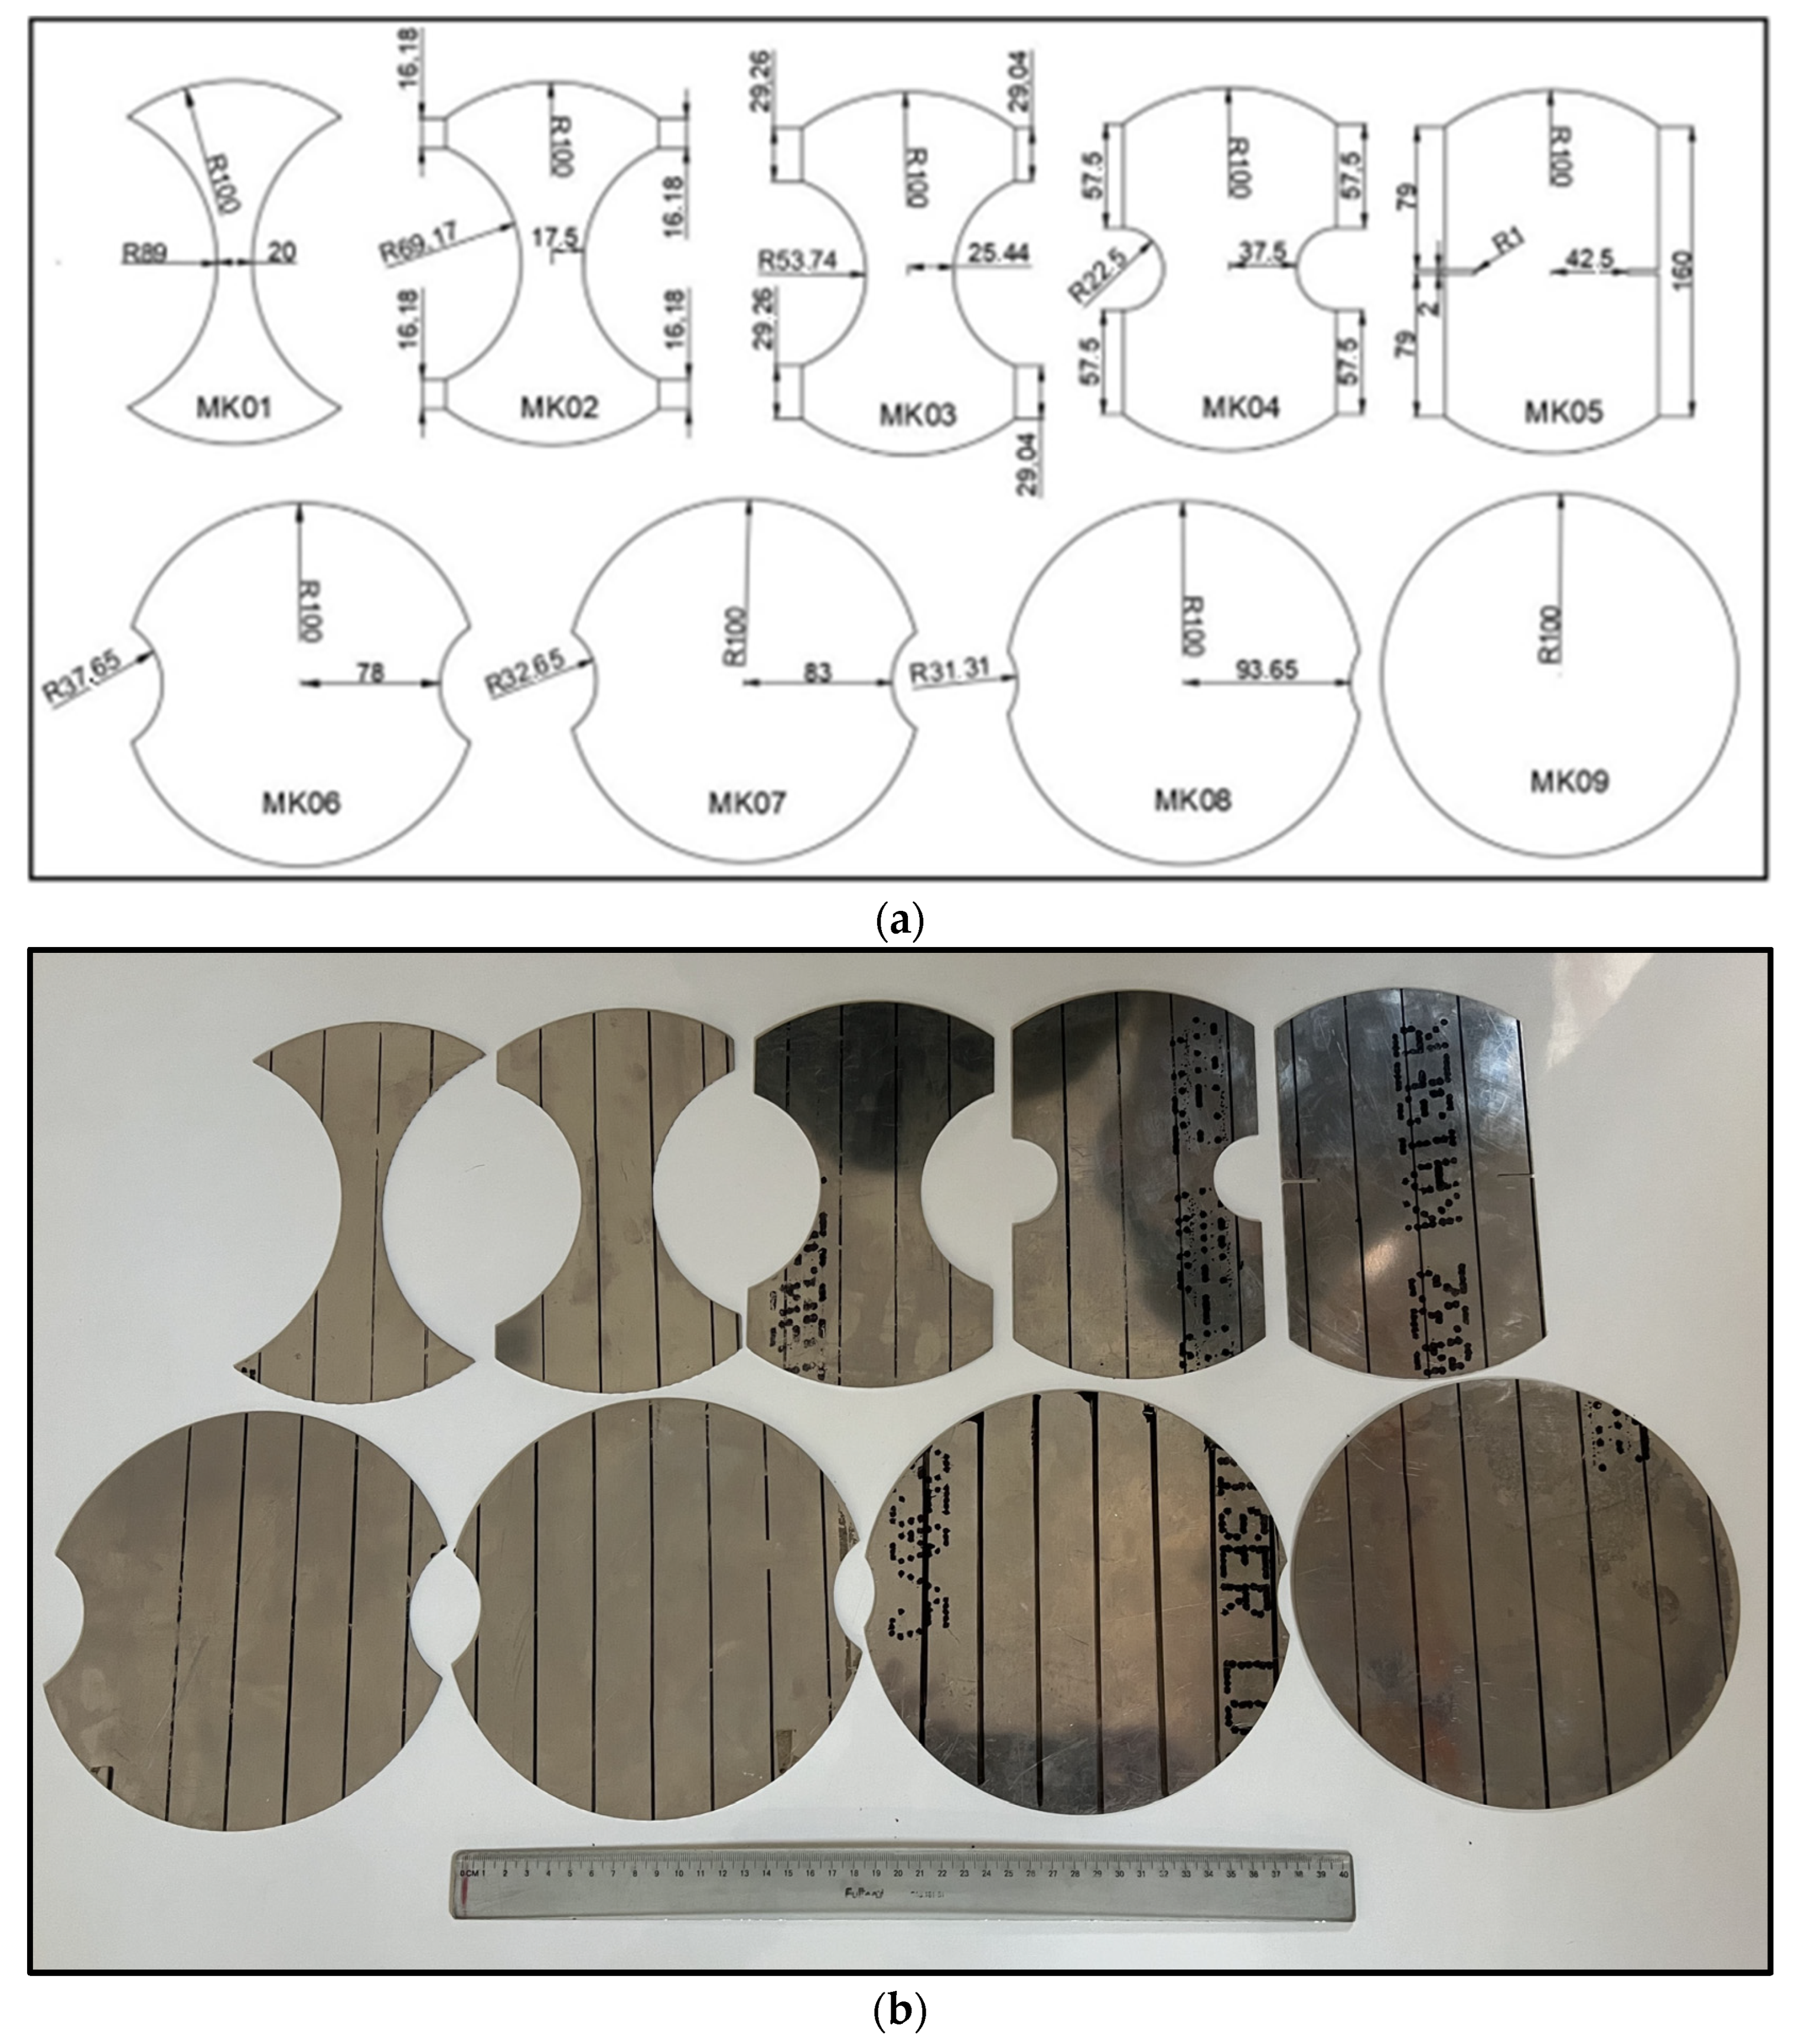
2. Materials and Methods

The studied material was a 0.8 mm thick metal sheet made of commercial 2024-T3 aluminum alloy. More details on the microstructural characterization of the received material can be found later. The chemical composition of the alloy is: Cu 4.9%, Mg 1.8%, Mn 0.9%, Fe 0.5%, Si 0.5%, Zn 0.25% and Al Bal.
The metallographic investigation was carried out with a LEICA DM LM/P optical microscope (Leica, Wetzlar, Germany). The preparation of the sample was carried out according to normal protocols, which included cutting, grinding, polishing, and etching. Different grades of silicon carbide emery paper were used for manual mechanical grinding. Etching was performed for 10 s at room temperature by means of Keller solution that contained 2.5 mL HNO3, 1.5 mL HCl, 1 mL HF, and 95 mL distilled water [38]. Using intersection counting, the grain size was ascertained with Standard Test Methods for Determining Average Grain Size [39]. The metallographic observations were made in the plane defined by the rolling direction (RD) and normal direction (ND). Furthermore, SEM observation was conducted using a HITACHI SU 3500 (Hitachi, Tokyo, Japan) SEM equipped with an EDX (Energy Dispersive X-ray Spectroscopy) Bruker XFlash 410M detector (Bruker Corporation, Billerica, MA, USA) with a resolution of 133 eV on the Mn Kα line.
The ASTM E8 standard [40] was adhered to for the mechanical characterization, focusing on tensile properties. Tensile tests were conducted on three specimens for each direction: DR (0°), DD (45°), and TD (90°) with respect to the rolling direction (RD). Samples were prepared to a width of 12.5 mm following the sheet-type specifications outlined in the standard (Figure 1a). Utilizing a universal tensile testing machine Zwick/Roell with a maximum capacity of 100 kN, the tests were executed under displacement control at a grip speed of 2.5 mm/min (~10−3 s−1) (Figure 1b).
The anisotropy coefficients (R-value) were determined through tensile tests according to the ASTM E517 standard [41] at ~15% engineering strain for each direction (0°, 45°, and 90°). The tests were performed in duplicate at a crosshead displacement rate of 0.5 mm/min (~10−4 s−1). The R-values were obtained from the measurement of values in transversal and longitudinal lines, using DIC within the homogeneous zone, to avoid the dispersion of values onto the non-homogeneous zone. These R-values contained in the longitudinal and transverse directions (length and width) were averaged. Standard deviation was determined, giving very low values.
The Marciniak tests were conducted to assess the formability characteristics of the material, following the guidelines outlined in the ISO 12004-2 standard [14]. The setup comprised a 100 mm diameter flat punch with an edge radius of 10 mm, conforming to standard specifications (See Figure 2), where Figure 2a indicates the different parts of the equipment; base plate (1), support columns (2), lower clamping plate (3), upper clamping plate (4), bolts (5), flat nose punch (6), connection head to tensile machine (7), and as an example, balance biaxial sample (8). The other equipment dimensions were scaled proportionally to the punch diameter. Mounted on the universal tensile test machine described in the universal tensile testing machine model WDW-200E with a capacity of 200 (kN), the tests were executed at a crosshead speed of 2.5 mm/min, with the entire test surface recorded in full HD video, allowing for image extraction at 0.1 s intervals. To prevent interference between the punch and the sheet metal, an 85–15 brass mask with an outer diameter of 200 mm and an internal diameter of 36 mm was interposed. Additionally, to mitigate friction, a 0.4 mm thick sheet of polytetrafluoroethylene (Teflon) and a layer of molybdenum-based spray lubricant were employed.
The sample is fixed to the equipment between the clamping plates, where clamping bolts secure the edges of the sample, preventing slippage. The punch, connected to the mobile crossbar, is adjusted to make contact with the sample. The test begins with the punch moving at a constant speed, forming a cupped shape until the sample fails. The test recording was processed using Free Video to JPG converter, extracting ten images per second, and all images were processed with ImageJ software (1.48v Java 1.6.0_20 (64-bit)), converting them to black and white. A Marciniak test was carried out for nine different geometric dimensions in the sheet for three directions with respect to the rolling direction: rolling direction (RD), diagonal direction DD and transverse direction TD (see Figure 3). The samples for Marciniak’s experiment were selected in accordance with International Standard ISO 12004-2:2008, which established the procedures and criteria for the selection of specimens in formability tests and in previous works. A speckle pattern was applied to the surface of each test sample. The true strains were measured using DIC open-source 2D-DIC MATLAB software Ncorr v1.2. The DIC analysis was carried out, setting the size of the analysis windows as 31 × 31 pixels. The images with the pattern speckle were calibrated with zero normalized cross-correlation. The FLCs were constructed with the average true strain values (Hencky) of the three samples by geometry according to a previous study [22]. Figure 3a shows the dimension for nine samples and Figure 3b shows the samples used. Vertical black lines indicate the rolling direction. The lines were drawn illustratively. For the curves at DD and TD, the lines were traced with the samples in the same position, but the lines were traced diagonally (for DD curve) and transversely (for TD curve), indicating the rolling direction.

3. Results

In this study, the analyses will be conducted on the samples corresponding to the three main deformation paths: uniaxial strain with ρ = 0.5 , plane strain with ρ = 0 , and balanced biaxial strain with ρ = 1 , as described in Equation (1). In all cases, the principal strain ε 11 is always positive, indicating that the material is predominantly stretched in the direction of the major strain.
ρ = ε 22 ε 11 ;                   ε 22 < 0   uniaxial   strain ε 22 = 0   plane   strain   ε 22 > 0   biaxial   strain  

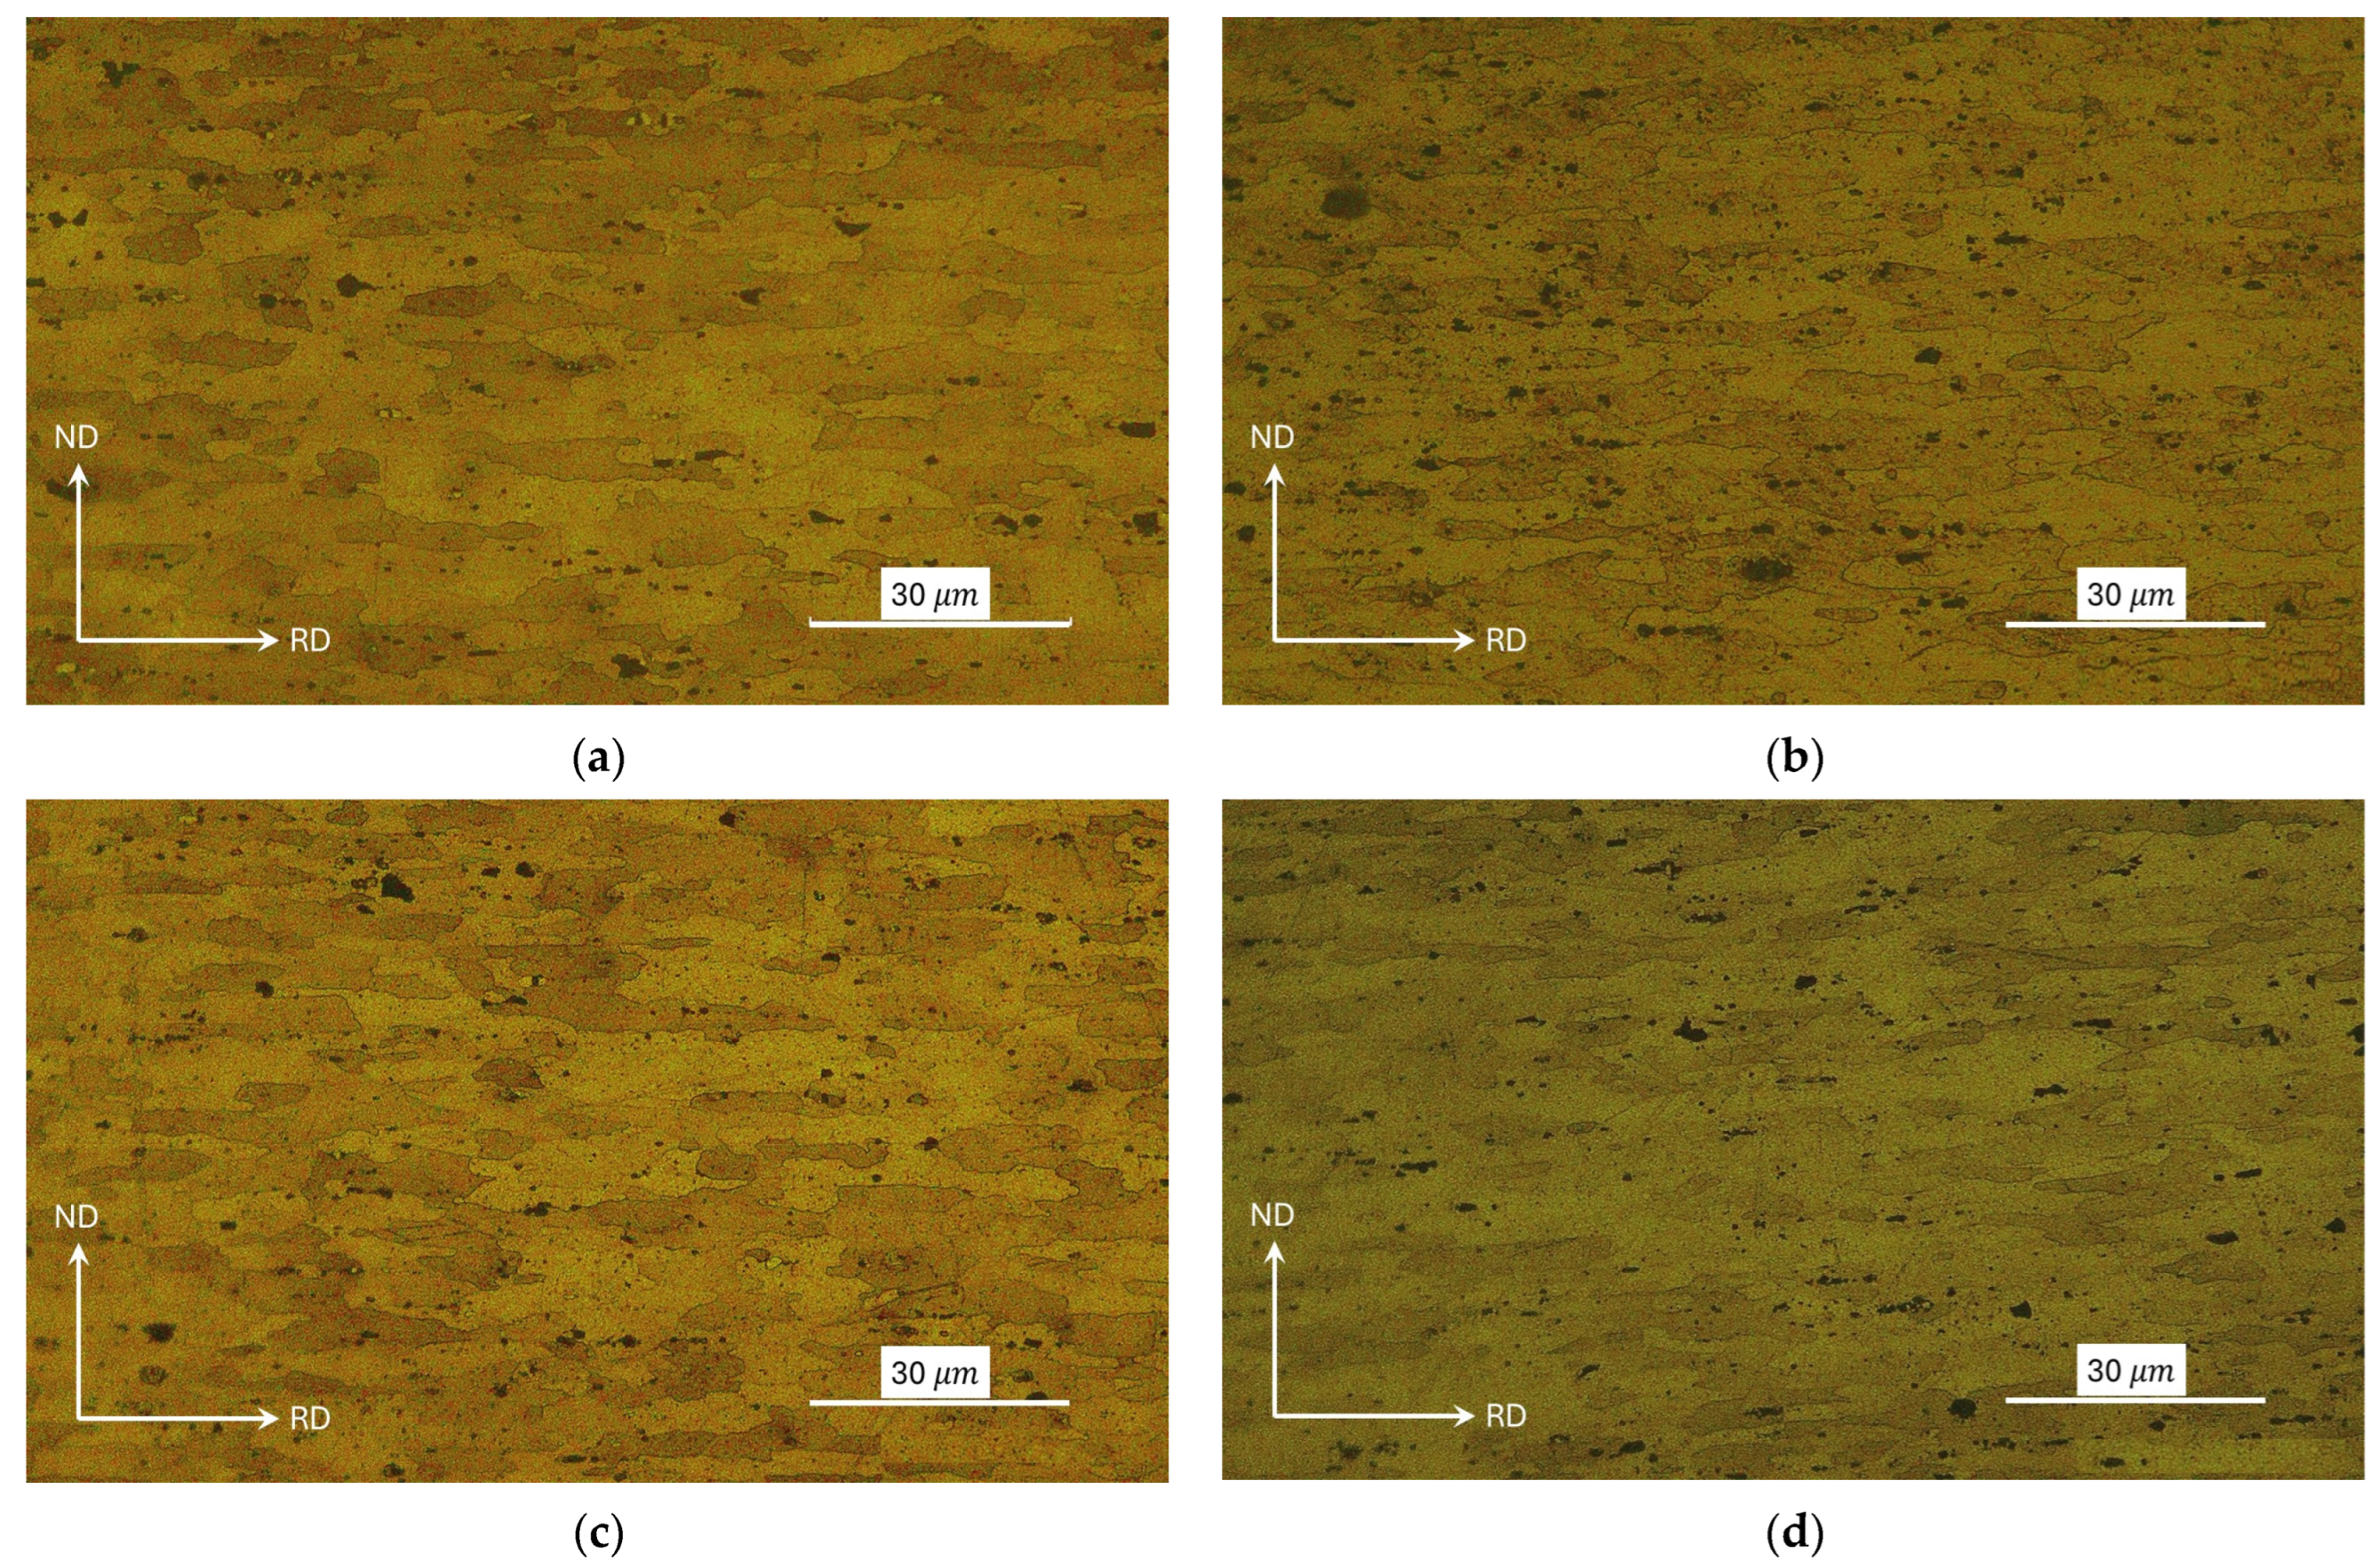
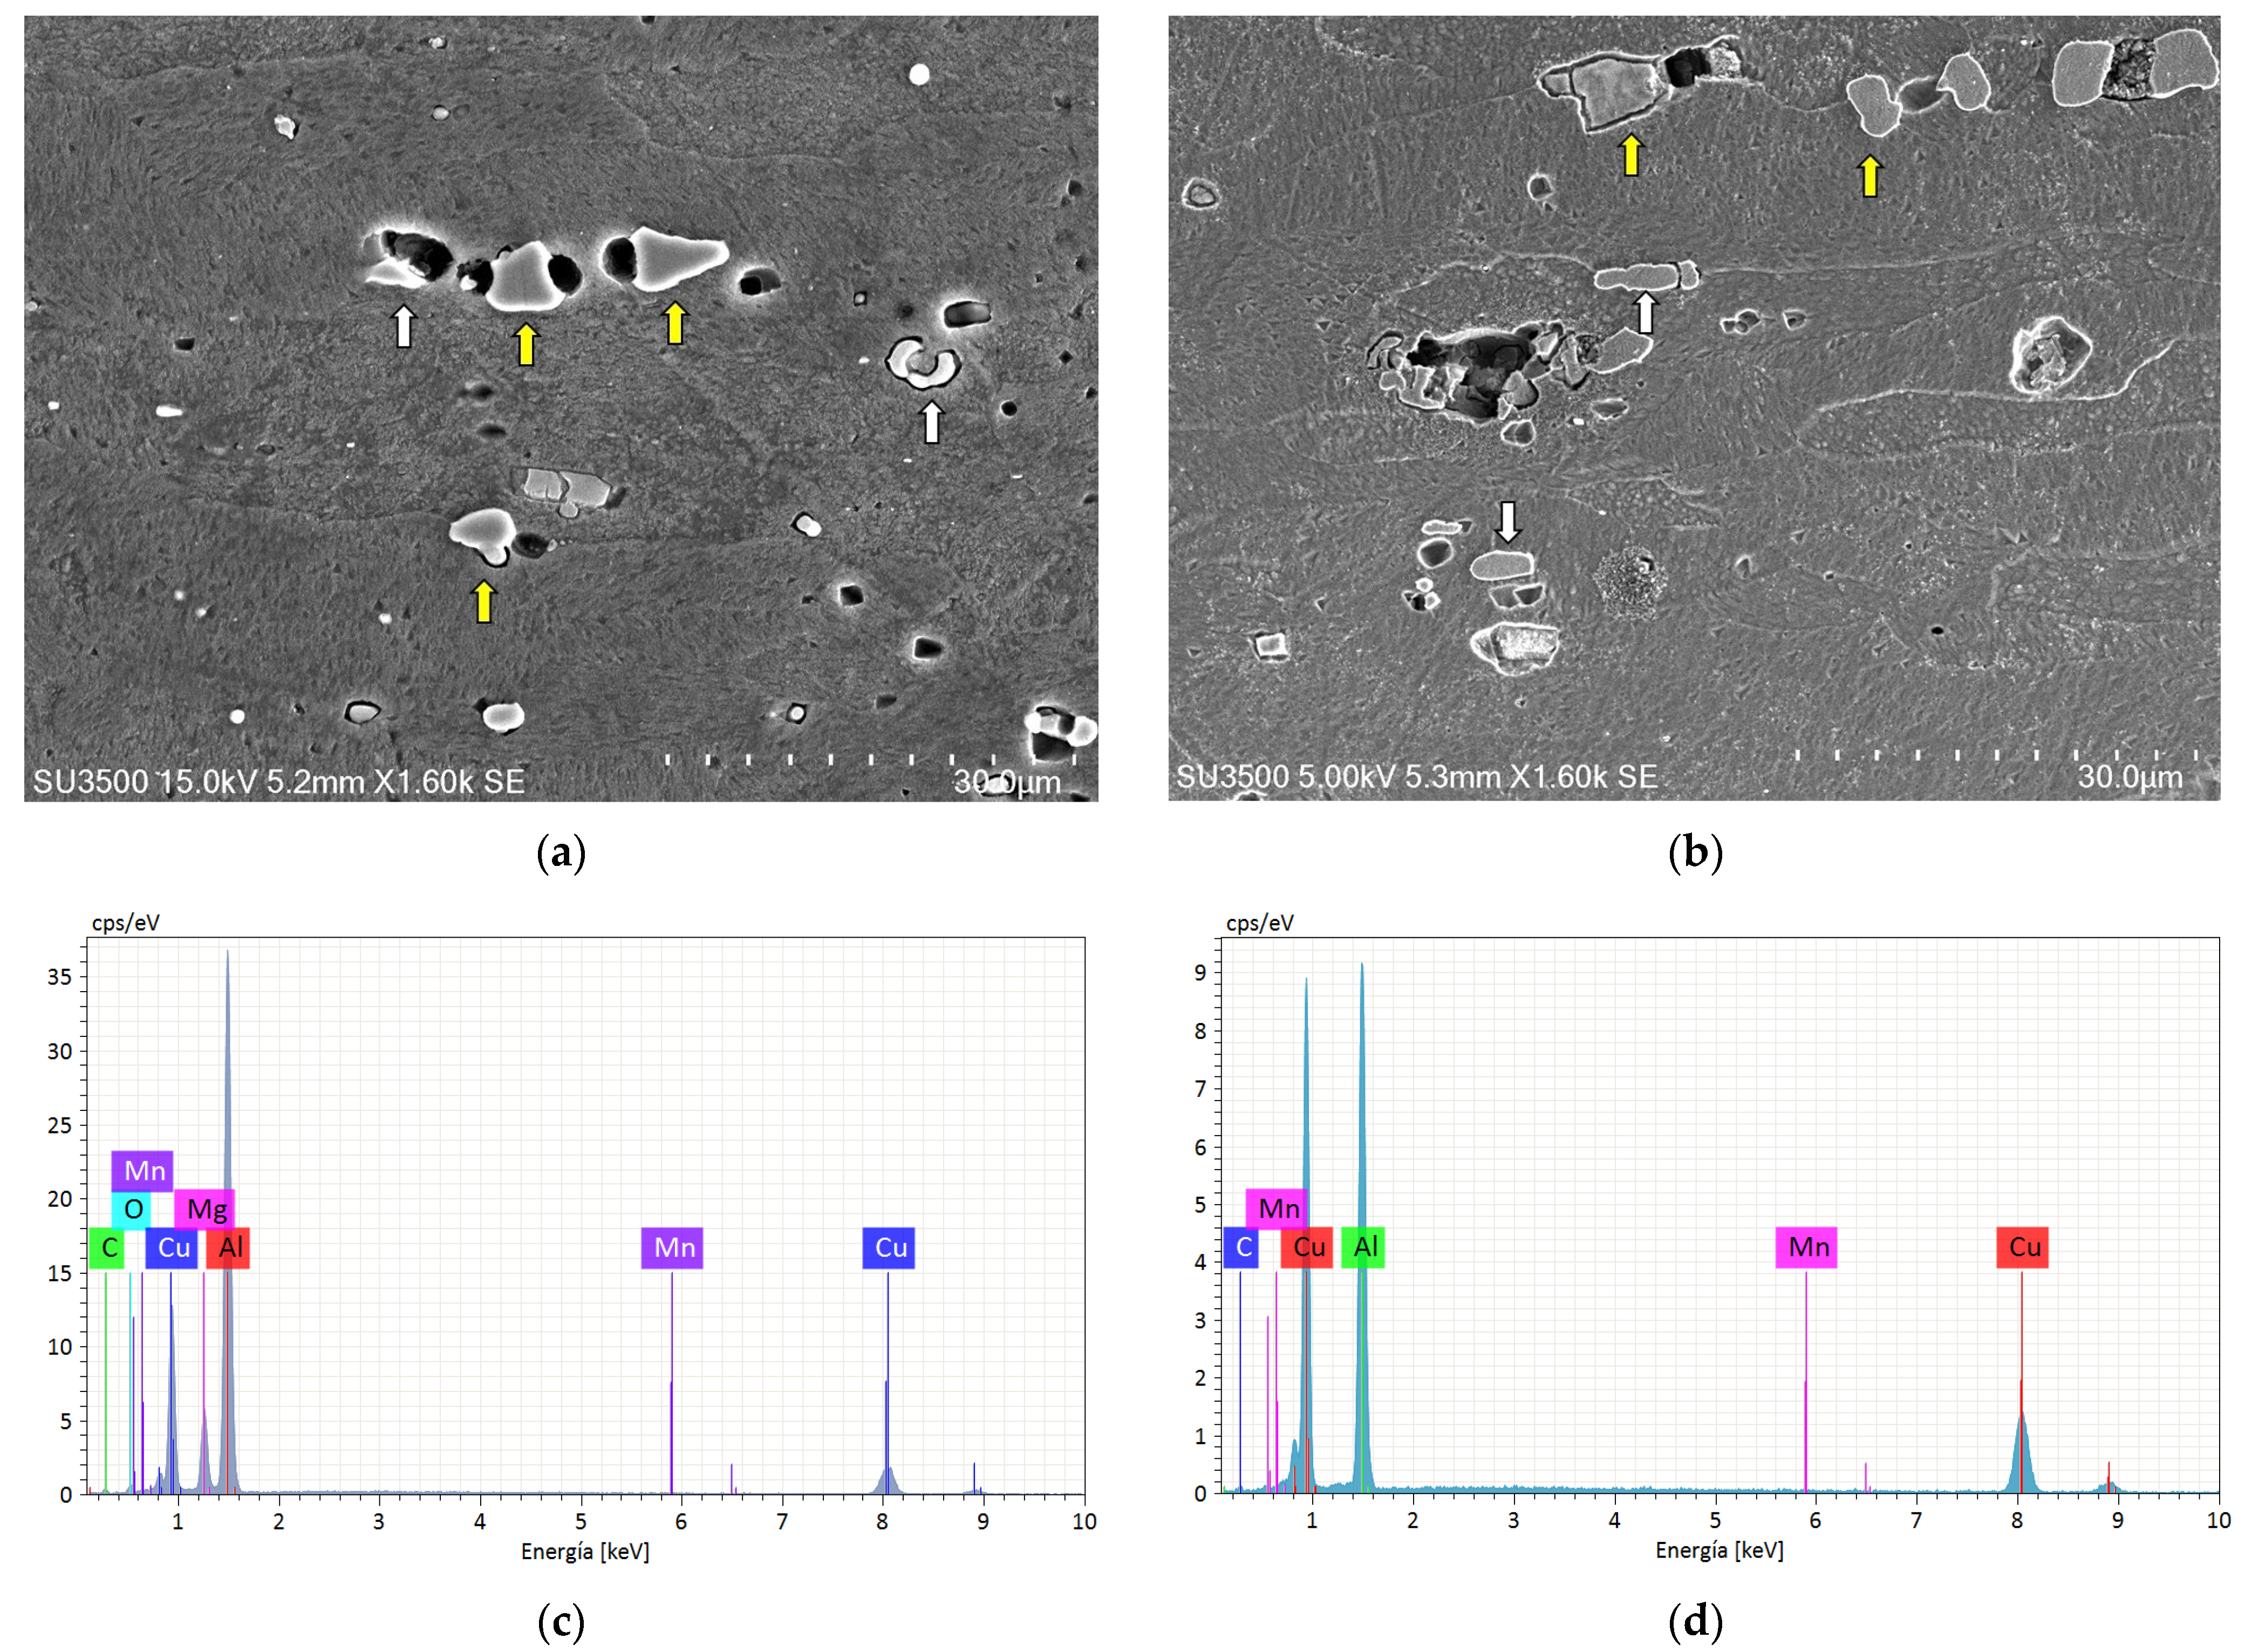
3.1. Microstructural Characterization

The micrographs obtained for the samples of as-received material, subjected to different strain paths, are illustrated in Figure 4. The microstructure of the analyzed alloy in its initial state (as received) is shown in Figure 4a. Axially elongated grains in the rolling direction with many dispersed particles can be observed, with non-uniform distribution in the matrix. The samples subjected to uniaxial, plane, and balanced biaxial strain paths are shown in Figure 4b–d, respectively. The grain size for the initial material, uniaxial, plane and balanced biaxial strains paths are as follows: 47.8 (14.8), 95.6 (20.3), 90.3 and 92.2 (17.6). Values in parentheses indicate the standard deviation. It can be clearly observed that the grains become more elongated, especially under uniaxial and balanced biaxial strain. Similarly, numerous dispersed particles with non-uniform distribution and varying sizes in the matrix are observed. Furthermore, SEM images are shown in Figure 5a,b and EDX analyses are shown in Figure 5c,d. SEM and EDX of as-received and deformed material are illustrated in Figure 5. Figure 5a,b shows SEM images of the initial (undeformed) and biaxially deformed specimens. Figure 5a depicts the specimen as received (undeformed or heated), with intermetallic phases displaying a typical precipitate. Figure 5b shows the specimen under biaxial loading, also revealing intermetallic phases. Figure 5c,d presents EDX spectra corresponding to Figure 5a and Figure 5b, respectively.

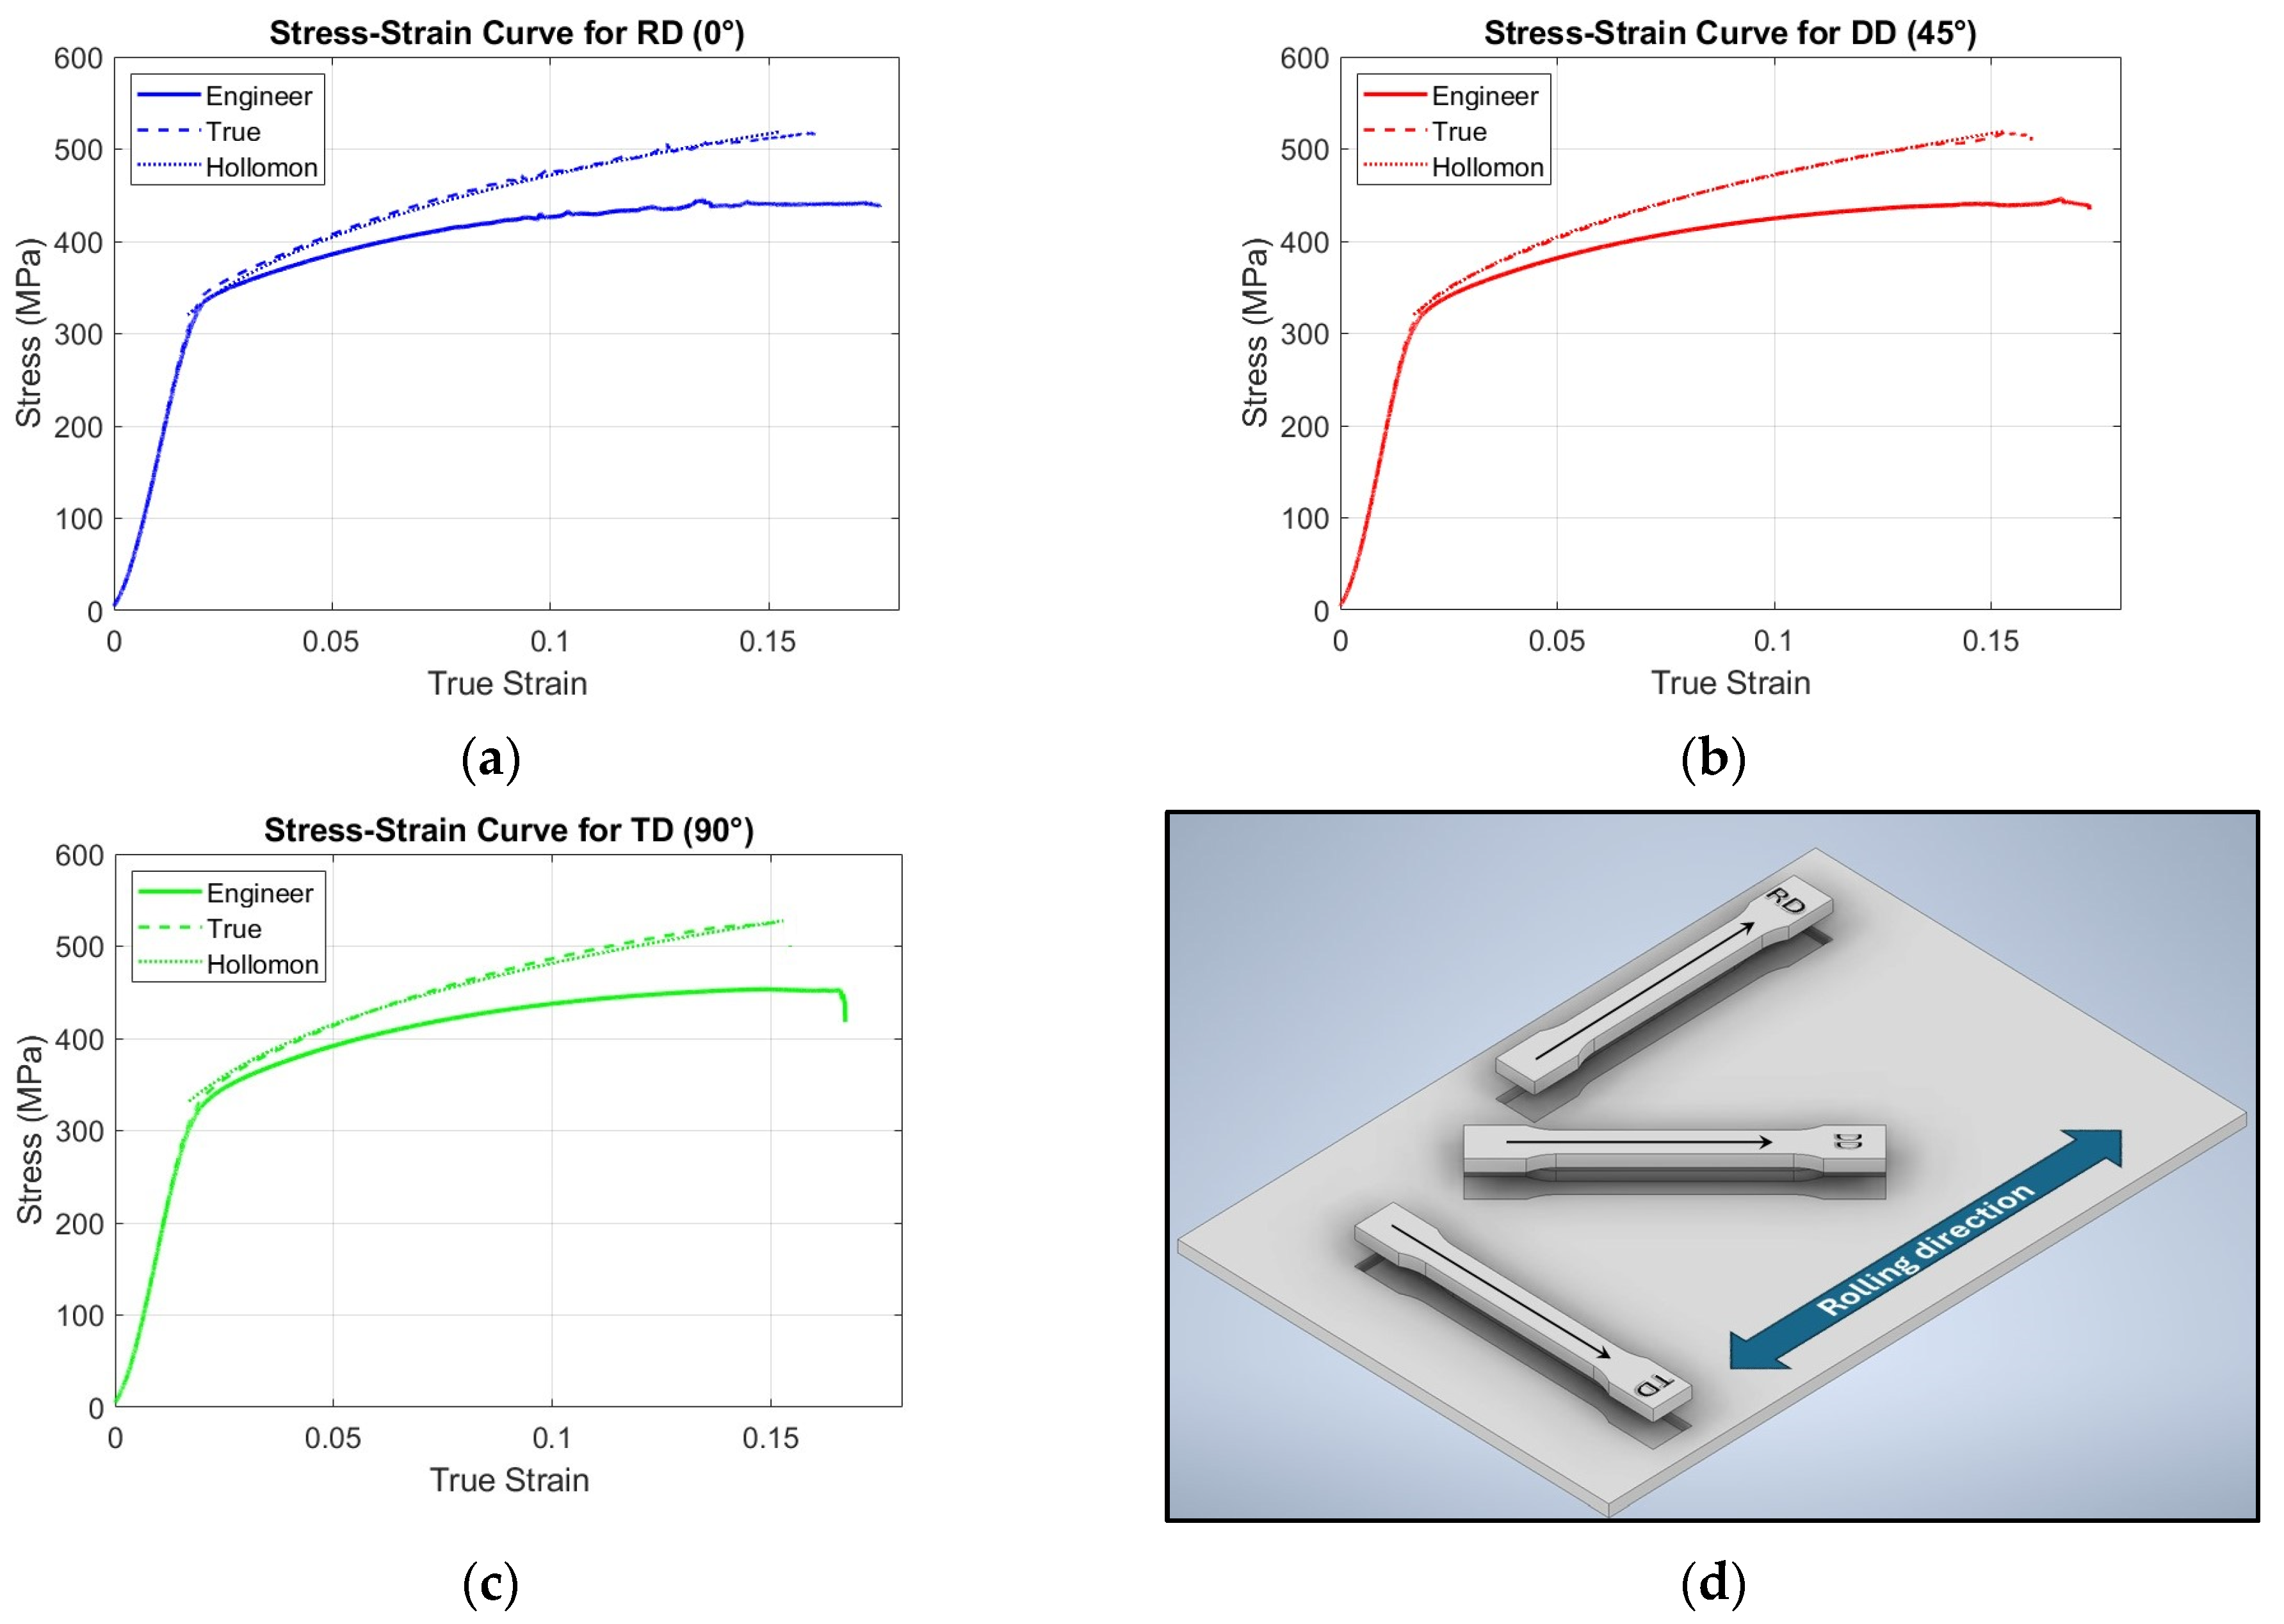
3.2. Mechanical Characterization

The mechanical properties of the material are given in Table 1, showing the load direction with respect to the rolling direction, the yield stress Y S , the ultimate tensile stress U T S , elongation to fracture E I , the coefficients of strain hardening n and coefficient of resistance k , corresponding to the power law σ = k ε n . They were obtained through the true stress–true strain curve between the yield stress and the ultimate tensile stress (See Figure 6a–c). Additionally, these figures include the true stress–strain curves and the Hollomon fit. Figure 6d shows a schematic of tensile specimens in the three directions analyzed. The plastic strain ratio (R-value) was measured to estimate the potential of the 2024-T3 aluminum alloy sheets. The obtained R-values were R 0 = 0.82 , R 45 = 1.07 , R 90 = 0.93 , R ¯ = 0.97 and Δ R = 0.09 . These anisotropy values indicate a low difference in the material, with the highest R-value at 45° to the rolling direction and the lower R-value at 0°. The anisotropy values are summarized in Table 2.

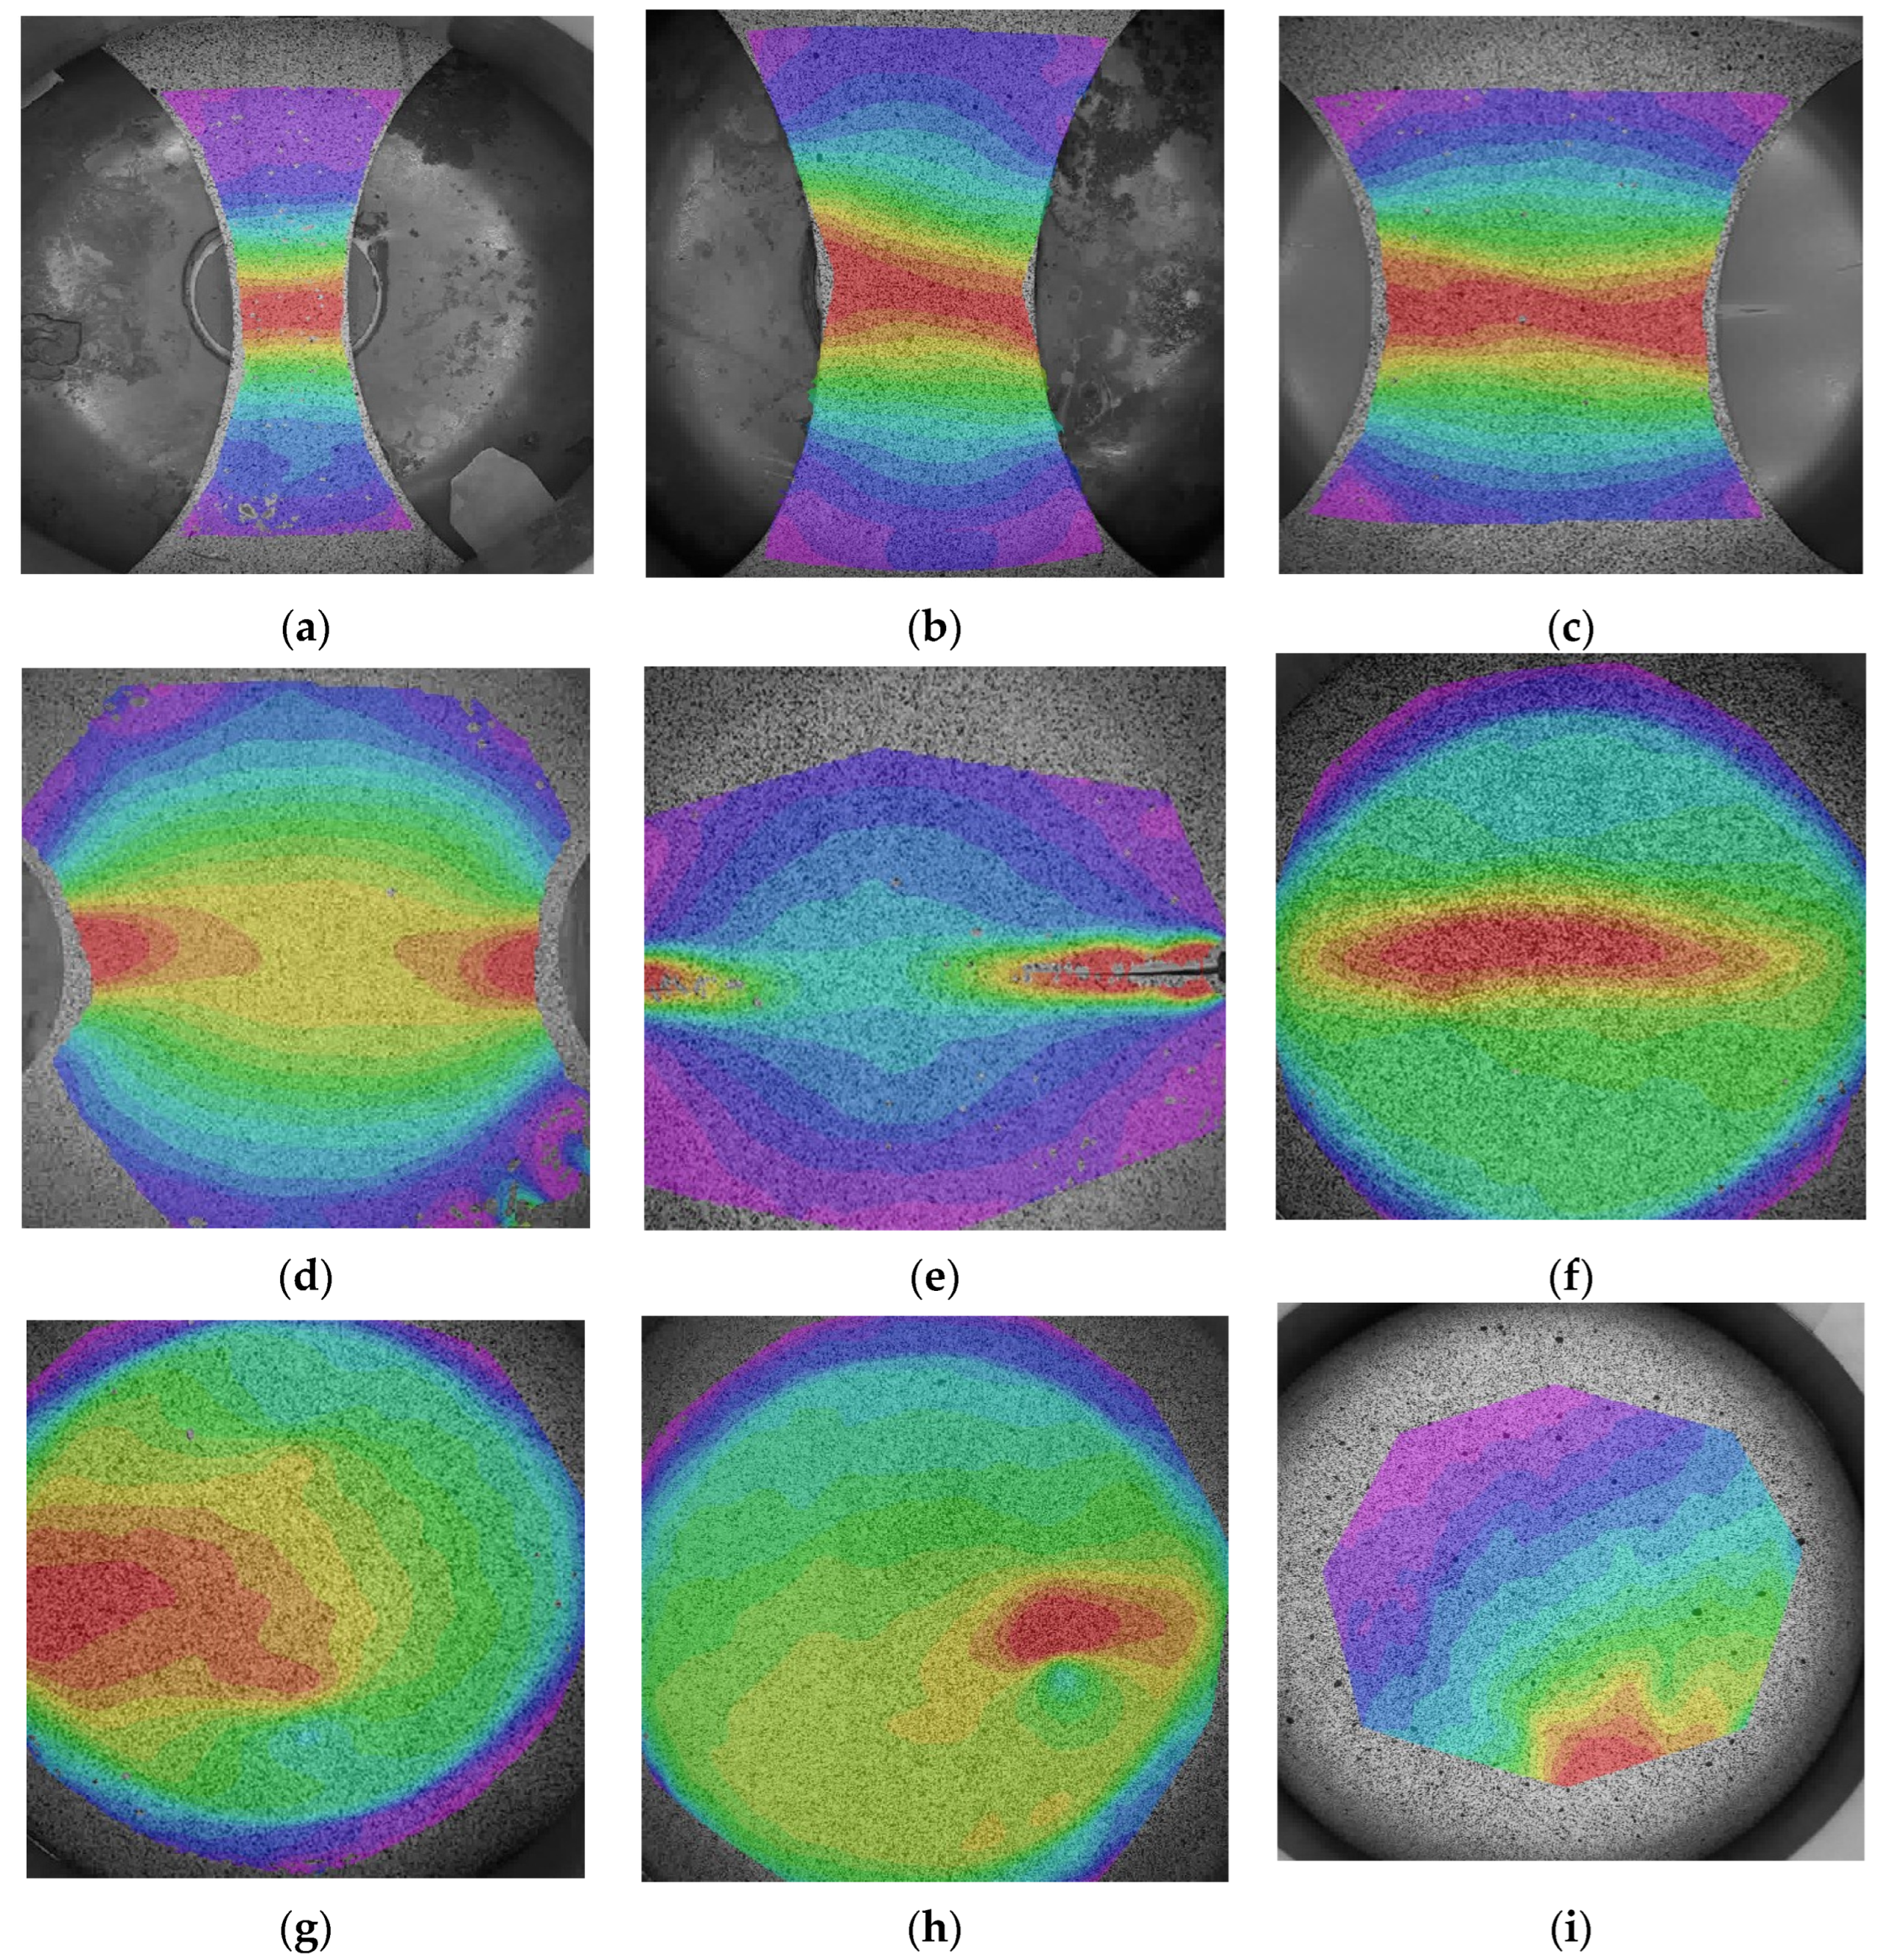
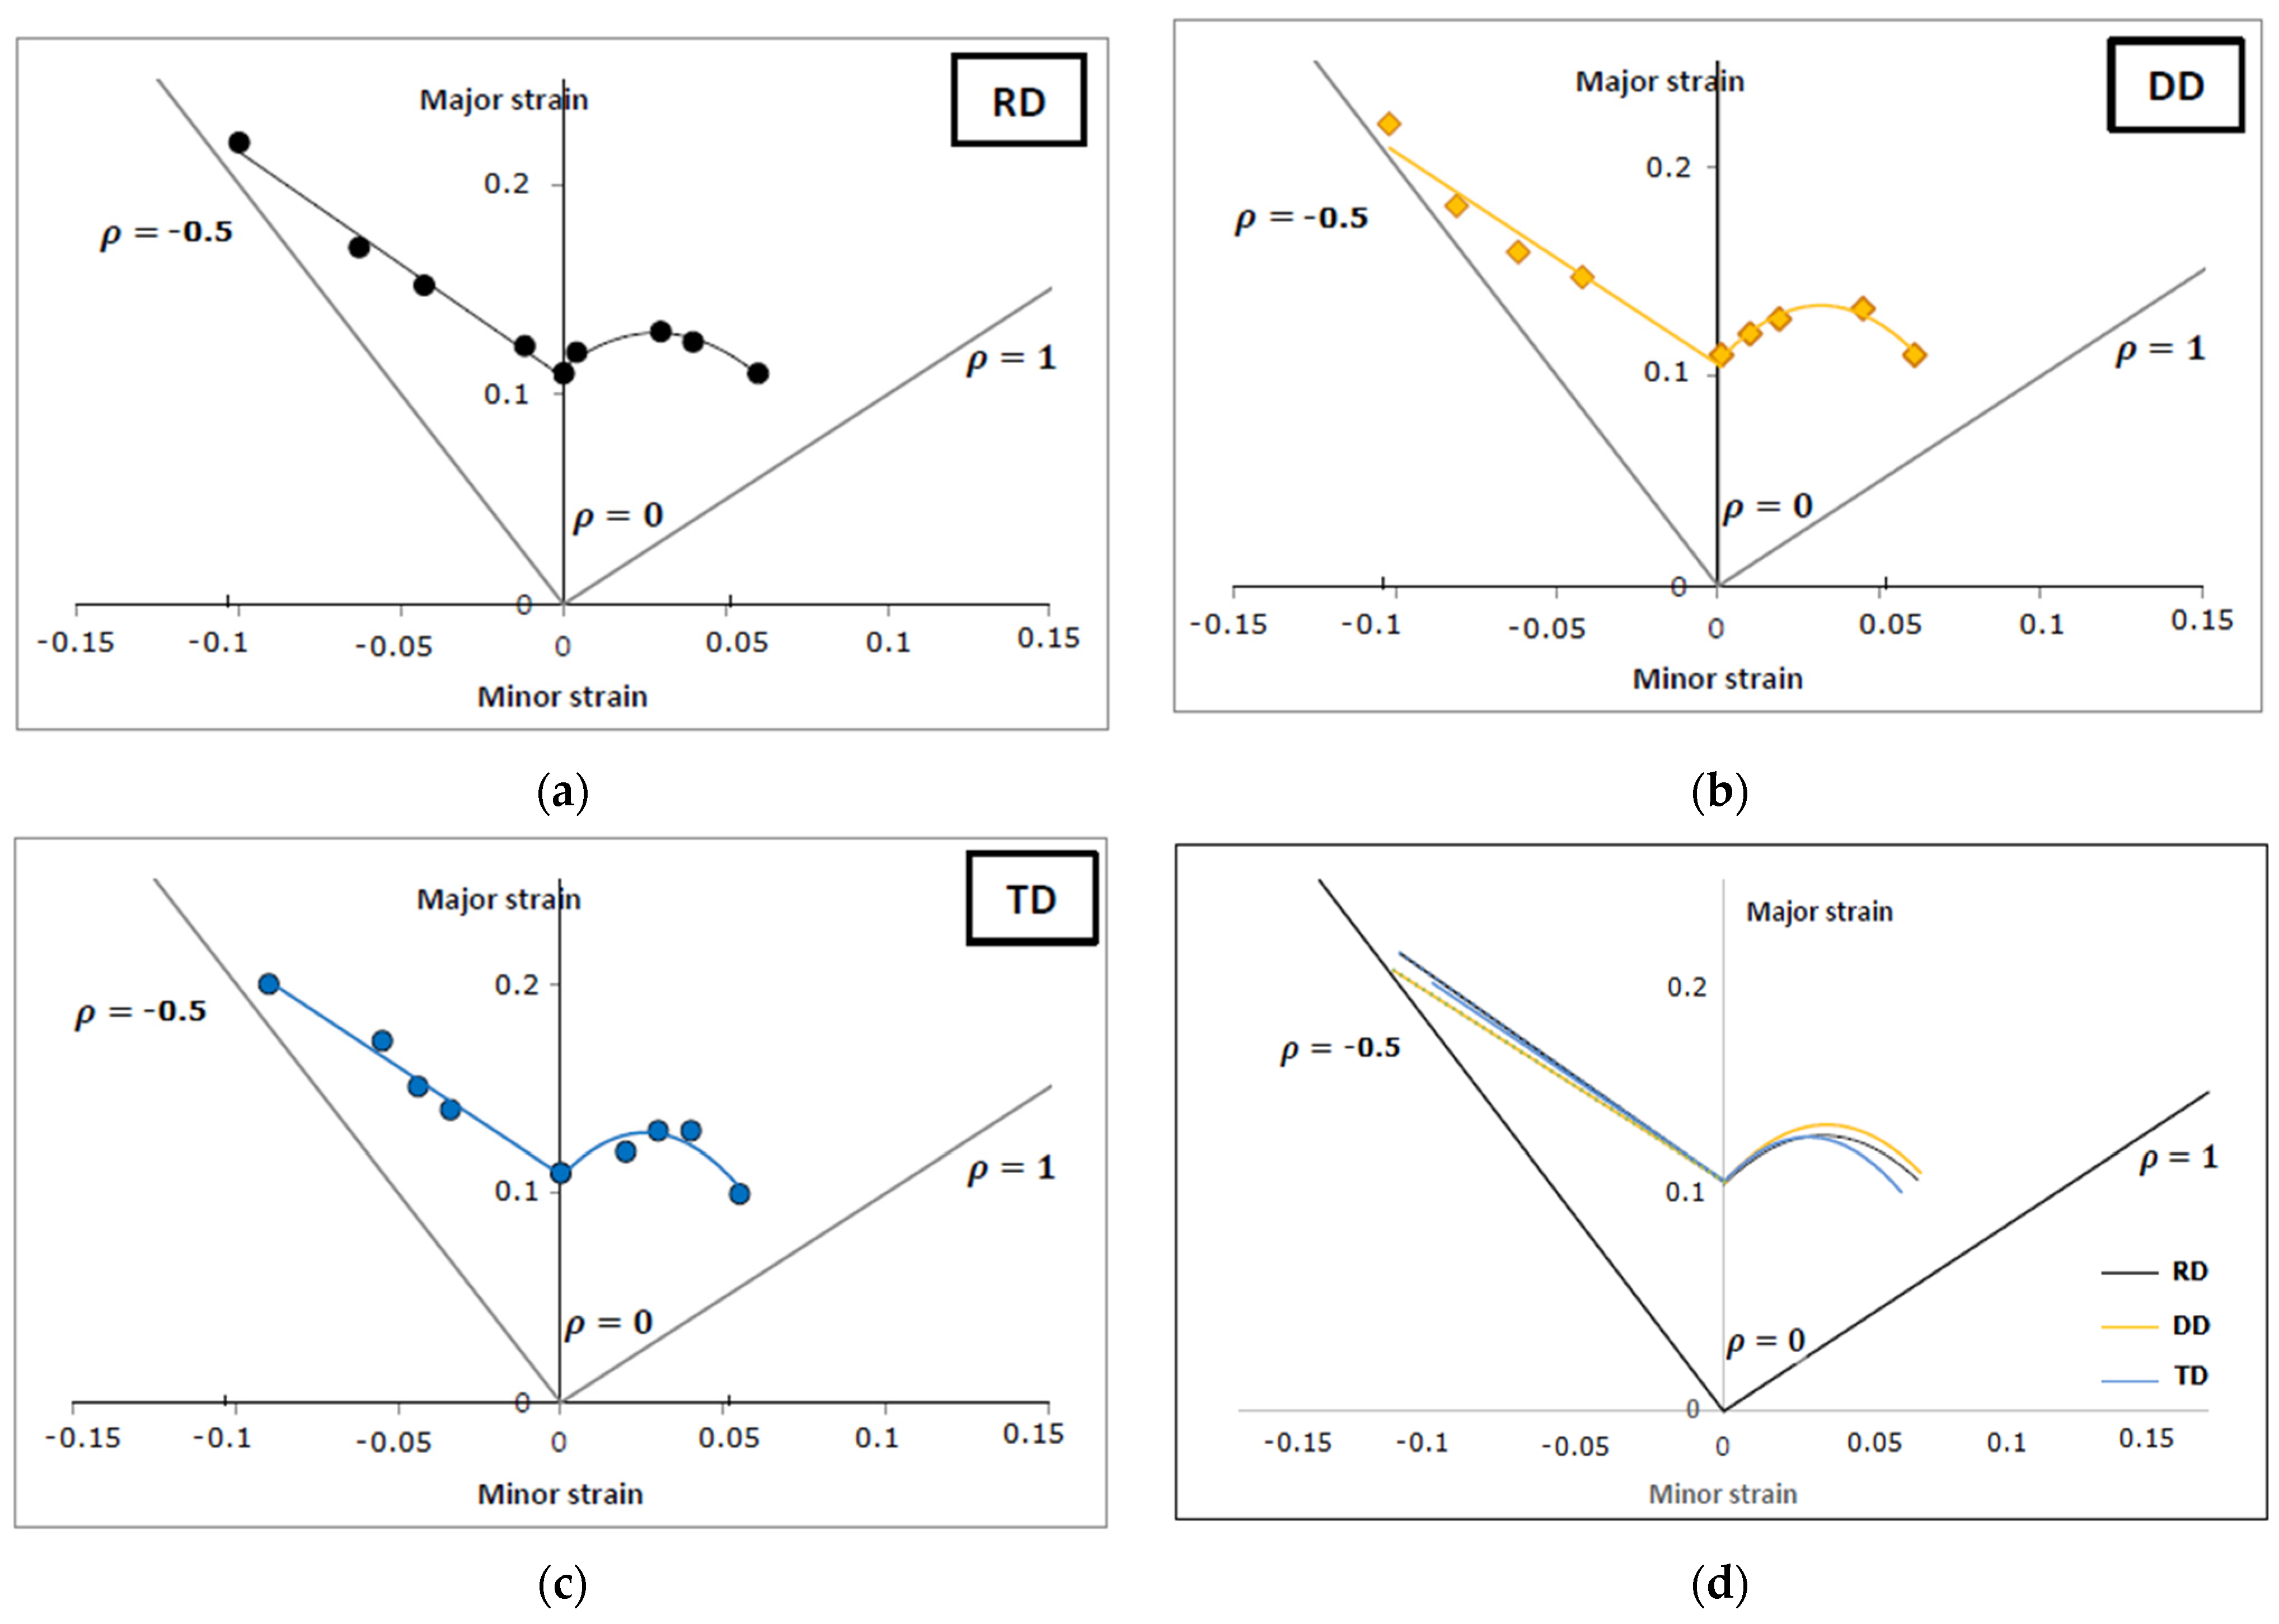
3.3. Formability Evaluation

A graphic representation example of the strain field for the nine samples (major strain), ranging from uniaxial strain to balanced biaxial strain, all oriented along the rolling direction (RD), is shown in Figure 7 (qualitative strain field). The FLC results are displayed in Figure 8a–c, where each image depicts the FLC in the three directions of 0° (RD), 45° (DD) and 90° (TD) with respect to rolling direction. The major strain, ε 1 , represented by the vertical axis in the diagram, and the minor strain, ε 2 , is represented by the horizontal axis. In accordance with the ratio ρ = ε 2 / ε 1 , the strain path is referenced by three lines (two diagonal and one vertical lines). The uniaxial strain path in this instance is indicated by ρ = 0.5 , the plane strain path by ρ = 0 , and the balanced biaxial strain path by ρ = 1 .
The limit strains of FLCs corresponding to RD, DD, and TD are represented by black circles, yellow rhombuses, and blue circles, respectively. Lower limit strain values were obtained under a plane strain path in the three cases, while higher limit strain values of FLC were obtained with a uniaxial strain path. In the case of minor strain results, the three results reached a value close to reference line ρ = 0.5 in uniaxial strain path. The higher minor strain value was obtained by FLC of DD, followed by RD, and lower minor strain value was obtained on TD.
Under the uniaxial strain condition, the highest values of the major strain are equal to ε 1 = 0.22 for the RD and DD directions, and the lowest value of ε 1 = 0.2 is in the TD. In the case of minor strain, the highest value is observed for the 0° and 45° directions with a ε 2 = 0.1 , and finally by the 90° direction ε 2 = 0.09 . For the plane strain condition, there were practically no variations in major and minor strain for the three directions. The respective values were ε 1 = 0.11 and ε 2 = 0 . Under balanced biaxial strain condition, the highest values of the major strain are equal to ε 1 = 0.11 for the RD and DD directions followed for ε 1 = 0.1 for TD. In the case of minor strain, the highest value is observed for the RD and DD directions with a ε 2 = 0.06 , and finally by the 90° direction ε 2 = 0.05 . The limit strain results show an approximately linear trend on the left-hand side of the three diagrams, with the limit strain value of the plane strain path approximately at null strain. Also, it is evident from the right-hand side of FLCs that the trend in limit strains exhibits a clear parabolic pattern.

4. Discussion

4.1. Microstructural Characterization

Figure 4 confirms the relationship between the rolling direction not only for the as-received material but also for the three applied strain paths. In all four images, elongated grains in the rolling direction are observed. It is important to note that Figure 4 only shows the RD-TD plane at 0 degrees with respect to rolling direction, subjected to different deformation routes. Furthermore, although three different directions relative to the rolling direction were tested, the macroscopic results indicate a certain level of independence from the grain direction, as confirmed by the anisotropy results (from tensile tests in different directions) and the similarity of the forming limit curves.
The SEM images in Figure 5 show the as-received material (Figure 5a) and the balanced biaxial deformation path (Figure 5b). Figure 5a depicts an aluminum matrix with a typical morphology of cold-rolling, featuring elongated grains parallel to the rolling direction. Additionally, the presence of bright zones of different sizes, which may correspond to phases at grain boundaries, can be clearly seen. Figure 5b, corresponding to the deformed sample, illustrates elongated grains, also aligned in the rolling direction. Similarly, intermetallic phases are observed at the grain boundaries, indicating that there is no modification of the intermetallic phases during the deformation process. The intermetallic phases were analyzed by means of Energy-dispersive X-ray analysis. Figure 5c,d shows the intermetallic phases corresponding to omega Ω   Al 2 CuMg with an atomic percentage of 62.69% Al, 11.18% Cu and 10.42% Mg, and theta θ   Al 2 Cu with an atomic percentage of 56.74% Al and 33.97% Cu. Edwards et al. [42] analyzed samples of 2024 T-351 aluminum to investigate the effect of different initial testing temperatures on the deformation at which thermoplastic instability occurs. They reported that the phase composition revealed that all samples contained the θ ( Al 2 Cu ) precipitate in varying amounts depending on the thermal processing conditions. The sample heated using the radiator in the Split-Hopkinson Pressure Bar (SHPB), an experimental technique used to evaluate the mechanical properties of materials at high strain rates, had a higher proportion of θ-phase precipitates compared to the sample heated in the Quasi-Static (QS), tests conducted at very low strain rates to study the material’s behavior under near-static conditions in a convection chamber. Hughes et al. [43] revealed various compositions within AA2024-T3, distributed as either individual particles or compositional domains within particles. They reported the intermetallic particle composition as a function of atomic percent, enabling the identification of the phases.

4.2. Mechanical Characterization

The mechanical properties of the three load directions with respect to the rolling direction show very low scatter in the behavior of the curves. The yield stress (YS), ultimate tensile stress (UTS), elongation to fracture (EI), coefficients of strain hardening (n), and coefficient of resistance (k) exhibit very similar values. This is corroborated by the low standard deviation (SD) corresponding to each property, as shown in Table 1. Furthermore, the anisotropy value in the three directions shows values very close to each other, with a normal anisotropy value very close to one, as will be seen in the next section.

4.3. Lankford Anisotropy Coefficients

The evaluation of the plastic strain ratio (R-value) was conducted to assess the drawability of the 2024-T3 aluminum alloy sheets. The measured R-values were R 0 = 0.82 , R 45 = 1.07 , R 90 = 0.93 , R ¯ = 0.97 and Δ R = 0.09 . These values indicate enhanced drawability in the 45° orientation relative to the rolling direction. The mean R-value ( R ¯ = 0.97 ) signifies the good overall drawability of the material. Additionally, the negative planar anisotropy value ( Δ R = 0.09 ) suggests a decreased tendency for earing. This has been widely verified by Hu et al. and Wang et al. [28,44].

4.4. Formability Evaluation

Figure 8a–c shows that for the limit strain values corresponding to uniaxial strain, the highest major strain values are observed in the RD and DD directions (Figure 8a,b), while the lowest value occurs in the TD (Figure 8c). Theoretically, according to Hollomon’s Law σ = k ε n , the major strain values should reach approximately twice the strain hardening exponent (n) [28]. However, the limit strain values in the three directions are notably lower than the theoretical prediction, with reductions of approximately 21%, 27%, and 37% for RD, DD, and TD, respectively. Similarly, upon comparing the experimental values of the minor strain with the theoretically predicted values based on the strain hardening coefficient (n) with minor strain equal to once the coefficient of the strain hardening exponent n , varying degrees of deviation across different orientation directions were observed. For instance, in the RD, where n = 0.14 , the experimental value exhibited a deviation of approximately 29% from the theoretically value. Similarly, in the DD and TD directions, with respective strain hardening indices of n = 0.15 and n = 0.16 , the deviation was 32% and 43%, respectively.
In this context, similar trends to those observed under uniaxial strain conditions were expected for plane strain conditions. Specifically, it was theoretically expected that the major limit strain value would approach approximately n , representing the strain hardening coefficient, while ideally, the minor limit strain would be null. The findings demonstrate a close alignment between the major limit strain values and the strain hardening coefficient, supporting theoretical expectations. Additionally, the minor limit strain values are significantly close to null, with only a negligible displacement to the right of the major strain axis, on the order of ~ 10 3 , in the DD.
Furthermore, the limit strain value along the DD exhibits the closest proximity to the theoretical relationship line ρ = 0.5 , which aligns with the obtained experimenatal anisotropy value of R = 1.09 . In contrast, although the limit strain values in the RD and TD directions are also situated near the ρ = 0.5 line, they deviate from the corresponding anisotropy values obtained, specifically R = 0.82 for the RD and R = 0.93 for the TD [29]. Finally, there is a noticeable departure from the ρ = 1 relationship line when analyzing the limit strain values under the balanced biaxial strain path. Every value that is obtained is shifted to the left, and none of the values match this line. This displacement points to a deformation process influencing the behavior of the material, most likely caused by the crystallographic texture reorienting due to dislocation movement by applied loads [45].
Moy et al. [4] studied the effect of heat treatment on the forming limit curve and compared the results with the as-received material (T3). They concluded that precipitation hardening achieved within two days of aging improved the deformation capacity under plane strain conditions in comparison with the as-received forming limit curve but has no notable improvement on the results obtained by heat treatments. However, it is important to mention that the formability limit curve results were not associated with the anisotropy results. Wang et al. [6] analyzed the plastic deformation of the 2024-O aluminum alloy at cryogenic temperatures, examining different yield criteria. The experimental results were compared with simulated results using the Norton–Hoff constitutive model and the Yld2000-2d yield criterion. They observed that lower temperatures resulted in increased strain hardening. Therefore, they concluded that strain hardening plays an important role in the capacity to withstand plastic deformation. While both studies examined different thicknesses, the results showed a good agreement with the findings of this study. However, it should be noted that neither study considered the mechanical response under different strain paths or the effects of anisotropy on some directions. For example, there is no relationship between the uniaxial strain path in the diagonal direction (45° with respect to the rolling direction) and the anisotropy value in that direction.
Figure 8d shows the forming limit curves in the three directions. In the left-sided scenario, ranging from the uniaxial strain value to the plane strain value, the three curves exhibit a behavior that tends toward linearity, which is notably similar across all three. This similarity is a consequence of the mechanical properties, particularly the coefficients of strain hardening n and R-values. In the case of the right side, Figure 8d reveals that the biaxial strain values, ranging from the plane strain value to the balanced biaxial strain value, associated with the limit strains of the three curves, are remarkably similar, with a clear parabolic trend. The slight discrepancies in strain values can be attributed to various factors, including sample geometry, material properties and crystallographic texture evolution on different strain paths and different sample orientations. Hu et al. [29] reported that a high value of normal anisotropy decreases the limiting strain values. In this study, only one alloy was analyzed, but for comparison, Wang et al. [7] reported their results by simulating the deformation of an aluminum 2024-O alloy. In their study, they showed an increase in the limiting strain values with a normal anisotropy value of R ¯ = 0.83 ( R 0 = 0.68 , R 45 = 1.05 , R 90 = 0.54 ), which is lower than the anisotropy value in this study, demonstrating good agreement with the results obtained ( R ¯ = 0.97 ). Shabadi et al. [46] explored the influence of strain hardening index n and anisotropy coefficient R on AA7020 aluminum sheets. They concluded that both parameters have great relevance on the limit strain results, where they reported that the higher the n value, the higher the limit strain values, as reported by Hu et al. [29]. In comparison, the results of this study are in good agreement, with the difference that the n values they obtained were very different in the three directions. On the other hand, lower R-values, which indicate greater plastic anisotropy, were associated with reduced formability, particularly in the transverse direction, where the limit strains were notably lower.
In summary, the relationship among the microstructural, mechanical, and formability properties is as follows:
Firstly, the reflected microstructural properties were not predominant in the results of either the mechanical properties or the formability. Figure 4 only shows changes in the geometry of the grain on the three strain paths, which is why only the microstructures in the rolling direction (RD) are shown. Furthermore, the intermetallic phases observed in the SEM images do not show significant changes that could be attributed to the deformations. As can be observed in the stress–strain curves (Figure 6a) and the respective mechanical properties (Table 1) for the three directions with respect to the rolling direction, only a few differences can be observed, resulting in low dispersion of mechanical properties.
In the same way, the anisotropy coefficients obtained in the three directions show a low anisotropy trend, with similar values for each direction ( R 0 = 0.82 , R 45 = 1.07 , R 90 = 0.93 ). It should be noted that, due to the similarity of the anisotropy values, they are also reflected in the similarity of the strain limit curves (see Figure 8). The slight differences that can be observed, specifically in Figure 8a, are attributed to the slight differences in the anisotropy values. For example, the limit strain in the uniaxial strain path in the DD direction is the value that is closest to the ρ ratio lines, where theoretically, a value R = 1 should coincide with this line. For the biaxial limit strain values, like the uniaxial strain values, they show small differences. These values also correspond to the anisotropy values. As mentioned above, a high anisotropy value delays the onset of necking.

5. Conclusions

The experimental determination of the formability properties of 2024-T3 aluminum alloy sheets was conducted. Marciniak tests were employed on aluminum alloy sheets with varying geometries, while standard tensile tests were performed to evaluate mechanical properties, material anisotropy, and microstructural observations through microscopy, SEM, and EDX analysis. The following conclusions were obtained:
  • The microstructural analysis revealed the stability of microstructural properties; the intermetallic phases, particularly, remained stable during the deformation process. No significant modification of intermetallic phases such as omega Ω   Al 2 CuMg and theta θ   Al 2 Cu was observed, indicating that the deformation did not alter the phase composition.
  • The formability evaluation indicated that the experimentally measured limit strains were lower than the theoretically predicted values based on the strain hardening coefficient (n). However, despite the low differences, the forming limit curves were able to capture the dependence of the strain hardening coefficient in the results.
  • Despite the slight differences in the anisotropy values, these demonstrate how the limit strain values vary depending on the anisotropy. In particular, the diagonal direction (DD) shows a higher anisotropy value (R = 1.07), which results in higher limit strains compared to the other directions. This indicates a greater deformation capacity in this direction, while the rolling (RD) and tangential (TD) directions present lower anisotropy values and, therefore, lower limit strains. The observed uniformity in plane strain suggests that, under this loading condition, the material exhibits a homogeneous response, regardless of the rolling direction.
For future research, an in-depth look at the role of crystallographic texture in the mechanical properties, anisotropy and formability of materials will be carried out. Understanding how crystallographic texture affects these aspects is crucial to optimizing material performance in specific applications. It is essential to analyze how different textures influence the strength, ductility and strain hardening of materials, as well as studying the relationship between grain orientation and the distribution of intermetallic phases and their impact on the mechanical response.

Author Contributions

Conceptualization, R.I. and K.F.; methodology, R.I.; software, K.F.; validation, R.I., K.F. and J.L.V.; formal analysis, R.I., M.V. and K.F.; investigation, R.I.; resources, E.T.; data curation, R.I. and S.N.S.; writing—original draft preparation, R.I.; writing—review and editing, J.L.V., M.V. and S.N.S.; visualization, E.T.; supervision, R.I.; project administration, R.I. All authors have read and agreed to the published version of the manuscript.

Funding

This research received no external funding.

Institutional Review Board Statement

Not Applicable.

Informed Consent Statement

Not Applicable.

Data Availability Statement

The data presented in this study will be available in the undergraduate thesis of Mechanical Civil Engineering of Augusto Morales M. entitled “Anisotropy Effect on the Forming Limit Curves of 2024 T3 Aluminum alloy Sheets using Digital Image Correlation technique and Marciniak Test”, PUCV 2025, Valparaiso, Chile.

Acknowledgments

Roberto Iquilio Abarzúa gratefully acknowledges the support provided by the Naval Polytechnic Academy and the Programs, Research and Development Directorate of the Chilean Navy with its line of research in Materials Science and Engineering.

Conflicts of Interest

The authors declare no conflicts of interest.

References

  1. Reis, D.A.P.; Couto, A.A.; Domingues, N.I.; Hirschmann, A.C.O.; Zepka, S.; Moura Neto, C. Effect of artificial aging on the mechanical properties of an aerospace aluminum alloy 2024. Defect Diffus. Forum 2012, 326–328, 193–198. [Google Scholar] [CrossRef]
  2. Khan, I.; Ismail, U.; Noman, D.; Siddiqui, M.; Shahzad, M. Effect of process parameters on formability of aluminum 2024. J. Space Technol. 2017, 7, 7–11. [Google Scholar]
  3. Chen, G.; Chen, M.; Wang, N.; Sun, J. Hot forming process with synchronous cooling for AA2024 aluminum alloy and its application. Int. J. Adv. Manuf. Technol. 2016, 86, 133–139. [Google Scholar] [CrossRef]
  4. Moy, C.K.S.; Weiss, M.; Xia, J.; Sha, G.; Ringer, S.P.; Ranzi, G. Influence of heat treatment on the microstructure, texture and formability of 2024 aluminium alloy. Mater. Sci. Eng. A 2012, 552, 48–60. [Google Scholar] [CrossRef]
  5. Vallellano, C.; Morales, D.; García-Lomas, F.J. A study to predict failure in biaxially stretched sheets of aluminum alloy 2024-T3. Mater. Manuf. Process. 2008, 23, 303–310. [Google Scholar] [CrossRef]
  6. Wang, C.; Yi, Y.; Huang, S.; Dong, F.; He, H.; Huang, K.; Jia, Y. Experimental and Theoretical Investigation on the Forming Limit of 2024-O Aluminum Alloy Sheet at Cryogenic Temperatures. Met. Mater. Int. 2021, 27, 5199–5211. [Google Scholar] [CrossRef]
  7. Keeler, S.P.; Backofen, W.A. Plastic instability and fracture in sheets stretched over rigid punches. ASM Trans. Q. 1963, 56, 25–48. [Google Scholar]
  8. Goodwin, G.M. Application of strain analysis to sheet metal forming problems in the press shop. SAE Trans. 1968, 380–387. [Google Scholar]
  9. Marciniak, Z.; Kuczyński, K. Limit strains in the processes of stretch-forming sheet metal. Int. J. Mech. Sci. 1967, 9, 609–620. [Google Scholar] [CrossRef]
  10. Nakazima, K.; Kikuma, T.; Hasuka, K. Study on the formability of steel sheets. Yawata Tech. Rep. 1968, 264, 8517–8530. [Google Scholar]
  11. Keeler, S.P. Circular grid system—A valuable aid for evaluating sheet metal formability. SAE Trans. 1968, 371–379. [Google Scholar]
  12. Sowerby, R.; Chu, E.; Duncan, J.L. Determination of large strains in metalforming. J. Strain Anal. Eng. Des. 1982, 17, 95–101. [Google Scholar] [CrossRef]
  13. Bragard, A.; Baret, J.C.; Bonnarens, H. A simplified technique to determine the FLD at onset of necking. Cent. Res Metall. 1972, 33, 53–63. [Google Scholar]
  14. ISO 12004-2:2008; Metallic Materials-Sheet and Strip Determination of Forming Limit Curves, Part 2: Determination of Forming Limit Curves in the Laboratory. International Organization for Standardization: Geneva, Switzerland, 2008.
  15. Marron, G.; Moinier, L.; Patou, P.; Celeski, J. A new necking criterion for the forming limit diagrams. IDDRG WG Meet. Haugesund 1997, 94, 837–845. [Google Scholar]
  16. Vacher, P.; Haddad, A.; Arrieux, R. Determination of the Forming Limit Diagrams Using Image Analysis by the Corelation Method. CIRP Ann. Manuf. Technol. 1999, 48, 227–230. [Google Scholar] [CrossRef]
  17. Hotz, W.; Merklein, M.; Kuppert, A.; Friebe, H.; Klein, M. Time Dependent FLC Determination Comparison of Different Algorithms to Detect the Onset of Unstable Necking before Fracture. Key Eng. Mater. 2013, 549, 397–404. [Google Scholar] [CrossRef]
  18. Li, J.; Carsley, J.E.; Stoughton, T.B.; Hector, L.G.; Hu, S.J. Forming limit analysis for two-stage forming of 5182-O aluminum sheet with intermediate annealing. Int. J. Plast. 2013, 45, 21–43. [Google Scholar] [CrossRef]
  19. Martínez-Donaire, A.J.; García-Lomas, F.J.; Vallellano, C. New approaches to detect the onset of localised necking in sheets under through-thickness strain gradients. Mater. Des. 2014, 57, 135–145. [Google Scholar] [CrossRef]
  20. Eberle, B.; Volk, W.; Hora, P. Automatic approach in the evaluation of the experimental FLC with a full 2D approach based on a time depending method. In Proceedings of the 7th International Conference and Workshop on Numerical Simulation of 3D Sheet Metal Forming Processes, Interlaken, Switzerland, 1–5 September 2008; pp. 279–284. [Google Scholar]
  21. Volk, W.; Hora, P. Evaluation of Experimental Forming Limit Curves and Investigation of Strain Rate Sensitivity for the Start of Local Necking. AIP Conf. Proc. 2011, 1383, 99–106. [Google Scholar]
  22. Iquilio, R.A.; Cerda, F.M.C.; Monsalve, A.; Guzmán, C.F.; Yanez, S.J.; Pina, J.C.; Vercruysse, F.; Petrov, R.H.; Saavedra, E.I. Novel experimental method to determine the limit strain by means of thickness variation. Int. J. Mech. Sci. 2019, 153–154, 208–218. [Google Scholar] [CrossRef]
  23. Hogström, P.; Ringsberg, J.W.; Johnson, E. An experimental and numerical study of the effects of length scale and strain state on the necking and fracture behaviours in sheet metals. Int. J. Impact Eng. 2009, 36, 1194–1203. [Google Scholar] [CrossRef]
  24. Wang, K.; Carsley, J.E.; He, B.; Li, J.; Zhang, L. Measuring forming limit strains with digital image correlation analysis. J. Mater. Process. Technol. 2014, 214, 1120–1130. [Google Scholar] [CrossRef]
  25. Morales-palma, D.; Vallellano, C.; García-lomas, F.J. Assessment of the effect of the through-thickness strain/stress gradient on the formability of stretch-bend metal sheets. Mater. Des. 2013, 50, 798–809. [Google Scholar] [CrossRef]
  26. Abbas, A.; Campoli, G.; Sinke, J.; Benedictus, R. Fracture in bending–The straining limits of monolithic sheets and machined. Mater. Des. 2011, 32, 1229–1241. [Google Scholar] [CrossRef]
  27. Vysochinskiy, D.; Coudert, T.; Hopperstad, O.S.; Lademo, O.G.; Reyes, A. Experimental detection of forming limit strains on samples with multiple local necks. J. Mater. Process. Technol. 2016, 227, 216–226. [Google Scholar] [CrossRef]
  28. Hu, J.; Marciniak, Z.; Duncan, J. Mechanics of Sheet Metal Forming; Butterworth-Heinemann: Oxford, UK, 2002. [Google Scholar]
  29. Wagoner, R.H.; Chan, K.S.; Keeler, S.P. Forming Limit Diagrams: Concepts, Methods, and Applications. Mater. Sci. Appl. 1989, 2, 153–163. [Google Scholar]
  30. Conrad, H. Effect of the strain-rate sensitivity of the flow stress on the stretch formability of sheet metals. J. Mech. Work. Technol. 1978, 2, 67–74. [Google Scholar] [CrossRef]
  31. Dilmec, M.; Halkaci, H.S.; Ozturk, F.; Livatyali, H.; Yigit, O. Effects of sheet thickness and anisotropy on forming limit curves of AA2024-T4. Int. J. Adv. Manuf. Technol. 2013, 67, 2689–2700. [Google Scholar] [CrossRef]
  32. Chenaoui, A.; Sidoroff, F.; Hihi, A. The texture evolution of a planar polycrystal. J. Mech. Phys. Solids 2000, 48, 2559–2584. [Google Scholar] [CrossRef]
  33. Hoc, T.; Forest, S. Polycrystal modelling of IF-Ti steel under complex loading path. Int. J. Plast. 2001, 17, 65–85. [Google Scholar] [CrossRef]
  34. Flouriot, S.; Forest, S.; Cailletaud, G.; Köster, A.; Rémy, L.; Burgardt, B.; Gros, V.; Mosset, S.; Delautre, J. Strain localization at the crack tip in single crystal CT specimens under monotonous loading: 3D Finite Element analyses and application to nickel-base superalloys. Int. J. Fract. 2003, 124, 43–77. [Google Scholar] [CrossRef]
  35. Raabe, D. Simulation of rolling textures of b.c.c, metals considering grain interactions and crystallographic slip on {110}, {112} and {123} planes. Mater. Sci. Eng. A 1995, 197, 31–37. [Google Scholar] [CrossRef]
  36. Ray, R.K.; Jonas, J.J.; Hook, R.E. Cold rolling and annealing textures in low carbon and extra low carbon steels. Int. Mater. Rev. 1994, 39, 129–172. [Google Scholar] [CrossRef]
  37. Wu, P.D.; Macewen, S.R.; Lloyd, D.J.; Neale, K.W. Effect of cube texture on sheet metal formability. Mater. Sci. Eng. A 2004, 364, 182–187. [Google Scholar] [CrossRef]
  38. ASTM E407-07(2015)e1; Standard Practice for Microetching Metals and Alloys. ASTM International: West Conshohocken, PA, USA, 2015.
  39. Standard Test Method for iTeh Standards iTeh Standards Document Preview; ASTM International: West Conshohocken, PA, USA, 2004; pp. 5–7.
  40. ASTM E8/E8M-16a; Standard Test Methods for Tension Testing of Metallic Materials. ASTM International: West Conshohocken, PA, USA, 2016.
  41. ASTM E517; Standard Test Method for Plastic Strain Ratio r for Sheet Metal 1. ASTM International: West Conshohocken, PA, USA, 1998.
  42. Edwards, N.J.; Kariem, M.A.; Rashid, R.A.R.; Cimpoeru, S.J.; Lu, G.; Ruan, D. Dynamic shear testing of 2024 T351 aluminium at elevated temperature. Mater. Sci. Eng. A 2019, 754, 99–111. [Google Scholar] [CrossRef]
  43. Hughes, A.E.; Glenn, A.M.; Wilson, N.; Moffatt, A.; Morton, A.J.; Buchheit, R.G. A consistent description of intermetallic particle composition: An analysis of ten batches of AA2024-T3. Surf. Interface Anal. 2013, 45, 1558–1563. [Google Scholar] [CrossRef]
  44. Banabic, D. Formability of Metallic Materials: Plastic Anisotropy, Formability Testing, Forming Limits; Springer Science & Business Media: Berlin/Heidelberg, Germany, 2000. [Google Scholar]
  45. Iquilio Abarzúa, R.; Hernández-Durán, E.; Nguyen-Minh, T.; Kestens, L.A.I.; Valín Rivera, J.L.; Castro Cerda, F.M. Microstructure, Anisotropy and Formability Evolution of an Annealed AISI 430 Stainless Steel Sheet. Steel Res. Int. 2022, 93, 1–13. [Google Scholar] [CrossRef]
  46. Shabadi, R.; Suwas, S.; Kumar, S.; Roven, H.J.; Dwarkadasa, E.S. Texture and formability studies on AA7020 Al alloy sheets. Mater. Sci. Eng. A 2012, 558, 439–445. [Google Scholar] [CrossRef]
Figure 1. (a) Scheme of tensile test specimens; (b) tensile test machine.
Applsci 14 08082 g001
Figure 2. Marciniak test: (a) disassembly; (b) Marciniak equipment.
Applsci 14 08082 g002
Figure 3. Specimens for the construction of the forming limit curve: (a) sample geometries; (b) specimens selected for sample in rolling direction.
Applsci 14 08082 g003
Figure 4. Metallographic analysis on Marciniak samples at rolling direction: (a) as-received material; (b) uniaxial strain; (c) plane strain; (d) balanced biaxial strain.
Applsci 14 08082 g004
Figure 5. SEM images and EDS analysis; (a) as-received material; (b) balanced biaxial strain sample; (c,d) EDX analysis of intermetallic phases white arrows Al 2 CuMg , yellow arrows Al 2 Cu .
Applsci 14 08082 g005
Figure 6. Stress–strain engineer, true and Hollomon curves; (a) RD; (b) DD; (c) TD; (d) schematic of tensile samples in the three directions analyzed.
Applsci 14 08082 g006
Figure 7. Qualitative major strain field example of nine samples in RD examples: (a) MK01; (b) MK02; (c) MK03; (d) MK04; (e) MK05; (f) MK06; (g) MK07; (h) MK08; (i) MK09.
Applsci 14 08082 g007
Figure 8. Forming limit curves at different loading orientations with respect to the rolling direction (RD): (a) RD; (b) DD; (c) TD; (d) comparative forming limit curves at RD, DD and TD directions.
Applsci 14 08082 g008
Table 1. Tensile properties.
Sample Orientation, °YS (0.2%), MPa (SD)UTS, MPa (SD)EI, % (SD)n, (SD)k, (SD)
RD337 (7.86)446 (0.86)16.5 (1.33)0.14 (0.01)540 (10.3)
DD321 (3.61)446 (3.39)17.1 (0.71)0.15 (0.01)537 (1.16)
TD324 (4.04)452 (3.08)16.5 (0.67)0.16 (0.01)563 (1.59)
Table 2. Anisotropy coefficients.
R0R45R90 R ¯ Δ R
0.821.070.930.97−0.09
Disclaimer/Publisher’s Note: The statements, opinions and data contained in all publications are solely those of the individual author(s) and contributor(s) and not of MDPI and/or the editor(s). MDPI and/or the editor(s) disclaim responsibility for any injury to people or property resulting from any ideas, methods, instructions or products referred to in the content.

