1. Introduction
The quality of the air directly influences the ecosystems. Air quality is a complex interplay of various pollutants and environmental factors. From the presence of harmful gases like ammonia and hydrogen sulfide to particulate matter (PM) and volatile organic compounds (VOC), understanding and controlling these factors is vital for creating healthier environments.
Recent environmental policies are aimed at a green transition that includes reducing emissions of greenhouse gases and air pollutants. European Green Deal preferences include shielding various ecosystems and reducing air, water, and soil pollution. The Community Emissions Data System (CEDS) report shows increasing amounts of ammonia, nitrous oxide, carbon monoxide, non-methane volatile organic compounds, and other gases over the past century. Livestock production can emit considerable amounts of PM, which causes air quality issues inside, but also outside livestock houses. Farming activities and livestock breeding also cause the emission of several gases, such as CH4, CO2, N2O, and NH3, especially during the digestive process and excreta decomposition.
Air quality is affected by temperature, atmospheric pressure, and humidity. Temperature touches the dispersion of pollutants in the atmosphere and affects people’s and animals’ comfort and well-being levels. Temperature inversions can trap pollutants near the ground. The formation and behaviour of dust particles depend on humidity levels. Different sensor technologies can be used for air quality monitoring. The study by the European Commission’s Joint Research Centre provides an overview of diverse technologies used for air quality measurement. It discusses their capabilities and limitations for detecting pollutants like NO
2, O
3, and PM [
1].
The specific sensors needed in an air quality monitoring system depend on the application [
2,
3]. Much attention has been focused mainly on the study of air quality in urban environments affected by heavy traffic, as shown in [
4,
5], and also indoors [
6,
7].
Building air quality sensors capable of acquiring the environmental parameters is considered widely [
8]. The advantages and challenges of Metal Oxide (MOx) gas sensors for monitoring air quality in homes are explored in [
9]. The potential of air quality sensor networks to inform policy decisions is examined in [
10] where it is shown how sensor data can be used to assess the impact of interventions like traffic management on air quality. To track multiple pollutants, a wider array of sensors [
11] can be used by monitoring stations following regulatory requirements.
Recently, air quality monitoring has evolved from single-parameter measurements to encompass a more holistic approach through the integration of multiple sensors. This shift towards multi-sensor systems [
12,
13,
14,
15] is driven by the recognition that a comprehensive understanding of air quality requires consideration of diverse pollutants and environmental factors. While individual sensors for specific pollutants have been available [
1,
9], a comprehensive approach that simultaneously measures multiple parameters [
16] offers a more nuanced understanding of air quality.
A variety of sensors and technologies are known according to their type, their development stage, the species they apply to, and their potential impact on animal welfare within the Precision Livestock Farming (PLF) field [
17,
18]. The result of the European Project “Climate Care Cattle Farming Systems” [
https://cccfarming.eu] pointed out that “the development of cost-effective methods for rapid and systematic monitoring of emissions is a key element” for precision farming [
19].
Precision farming and digital agriculture is an agricultural management practice that uses advanced technology to optimize field-level or farm-level management concerning livestock farming. It involves the use of various, either collected or real-time, data sources and technologies to make the farming activity more accurate, controlled, and environment friendly [
20,
21].
The microclimate in livestock buildings is a set of parameters of the indoor environment—temperature, humidity, speed of air movement, illumination, noise, aeroionization, concentrations of carbon dioxide, ammonia, hydrogen sulfide, and other gases, as well as dust particles and microorganisms. The economic efficiency of industrial livestock farming depends on the conditions for the rational keeping of animals [
22], which is largely determined by the optimal microclimate in the premises. No matter what high breeding and generation qualities an animal may have, without creating a favourable microclimate for them, they are not able to maintain health and demonstrate their potential productive abilities, determined by heredity.
The influence of microclimate on the animal’s body is determined both by the total influence of its various parameters and by individual parameters. Microclimate affects the physiological processes in the body of animals (heat regulation, gas and energy metabolism, respiration, digestion, and blood circulation), as well as productivity, resistance, and health [
23,
24,
25,
26,
27]. As a result of an unsatisfactory microclimate, productivity and reproductive capacity decrease [
28], and feed costs per unit of production increase [
29]. The artificial microclimate must meet the physiological needs of the body, conducive to obtaining maximum productivity and maintaining the health of animals.
Environmental impact on air in PLF is examined in [
30] where the authors conclude that it can be indirectly reduced using the PLF technologies.
Unlike many recent research and industrial developments to control the composition of the air in an office or home environment, temperature and humidity meters are mainly used in animal husbandry to our knowledge. As a result of our experience [
31] of working on the national scientific program “Intelligent Livestock Husbandry”, we concluded that the design of the environmental monitoring device for PLF should have several main characteristics. Such a device should be inexpensive, allow the measurement of several important indicators of the state of the environment, allow easy scalability, and be based on open-source software so that it can be used by farmers without the need for a long learning curve for work with the device.
This paper addresses these gaps and proposes a multi-sensor platform that is de-signed to allow the addition of different modules according to specific needs and avoid the need for code development due to the use of open-source software with means to access, store, and visualize the measured parameters.
This article delves into the integration of sensors capable of measuring ammonia, hydrogen sulfide, carbon monoxide, PM2.5, TVOC, temperature, humidity, and pressure. Such a multi-sensor system provides a holistic view, empowering users with the data needed to make informed decisions about their surroundings. This study aims to construct a multi-sensor air quality monitoring system based on open-source tools and low-cost sensors.
Section 2 explores the intricacies of each air quality parameter and basic principles of SOLID architecture design.
Section 3 examines the components and equipment needed for the multi-sensor system. The discussion is provided in
Section 4. Finally,
Section 5 concludes the paper.
2. Materials and Methods
The essential air quality parameters, each playing a unique role in shaping the quality of the air, are summarized in
Table 1. Understanding these air quality parameters lays the foundation for developing effective monitoring strategies.
The SOLID principles of system architecture design [
32] were followed when creating the multi-sensor system. This guarantees the stability and maintenance of the system over time. Following the SOLID acronym, the principles of system architecture design are as follows:
S—The Single Responsibility Principle (SRP)
O—The Open-Closed Principle (OCP)
L—The Liskov Substitution Principle (LSP)
I—The Interface Segregation Principle (ISP)
D—The Dependency Inversion Principle (DIP)
The five principles are implemented and improved as follows:
SRP: Each system component, such as sensors, data acquisition modules, and communication interfaces, is designed to perform a single function. For example, the NodeMCU is solely responsible for data collection from various sensors.
OCP: The system is designed to be open for expansion but closed for modification. New sensors or modules can be added without changing the existing system structure, improving scalability.
LSP: Sensor modules and communication protocols are designed to be interchangeable without affecting system functionality. This ensures that each type of sensor can be replaced or upgraded independently. The modularity of the system makes it flexible and open to work with other compatible devices and sensors. It also makes maintenance easier if one of the modules fails.
ISP: The interfaces between the different system components, such as between the NodeMCU and the sensors or between the NodeMCU and the SAL server, are designed to be specific to their needs. This minimizes dependencies and improves modularity. It also provides higher reliability by saving data in two separate and independent locations—in the cloud and on-premises.
DIP: High-level modules, such as data processing and storage components, do not depend on low-level modules. Instead, both depend on abstractions. This approach al-lows flexible integration of different sensors and data transmission methods, which allows us to have the possibility to work with different types of sensors and provide the data in real-time.
The standard principles of SOLID are upgraded according to the specific purpose of the system—animal barn. For this reason, additional architectural techniques are used such as the following:
Data processing and storage techniques where the data processing and storage architecture follows a layered approach.
Local processing: Raspberry Pi running OpenHAB collects and processes data locally, providing immediate responses and control functions.
Long-term storage: Another Raspberry Pi configured as an SQL server stores historical data and retrieves data every few seconds, allowing easy deployment of machine learning models to assess, classify, and predict air quality, air pollutants, and consequences. Additionally, this dual storage approach applies in the event of an internet connection outage or other event, the data are stored locally, and when the connection is restored, it is sent to the cloud.
Cloud integration: Data are also transmitted to the My OpenHAB cloud, allowing remote access and monitoring through a unified user interface. It also allows remote control of the entire system and activation of additional functionalities. What is more, the system supports automation rules that trigger responses to specific air quality conditions, improving its functionality and user experience.
Data validation and calibration are precisely applied where each sensor undergoes rigorous calibration to ensure accuracy. Validation experiments are conducted to verify the reliability of the collected data, ensuring that the system performance meets the required standards. The calibration considers the height and width of the barn, and the height of the place where the device is placed (distance from water facilities, fans, windows, doors—entrance—exit and places for feeding and cleaning animals).
The multi-sensor platform, designed following SOLID principles, is also enhanced with other use-specific architectural techniques to provide a robust, scalable, and maintainable solution for environmental monitoring in a specific environment—an animal barn. The integration of different types of sensors, data processing, and ways of their storage are constructed to obtain a platform that is highly resistant, precise, and resistant to the conditions in which it is applied.
3. Multi-Sensor Architecture
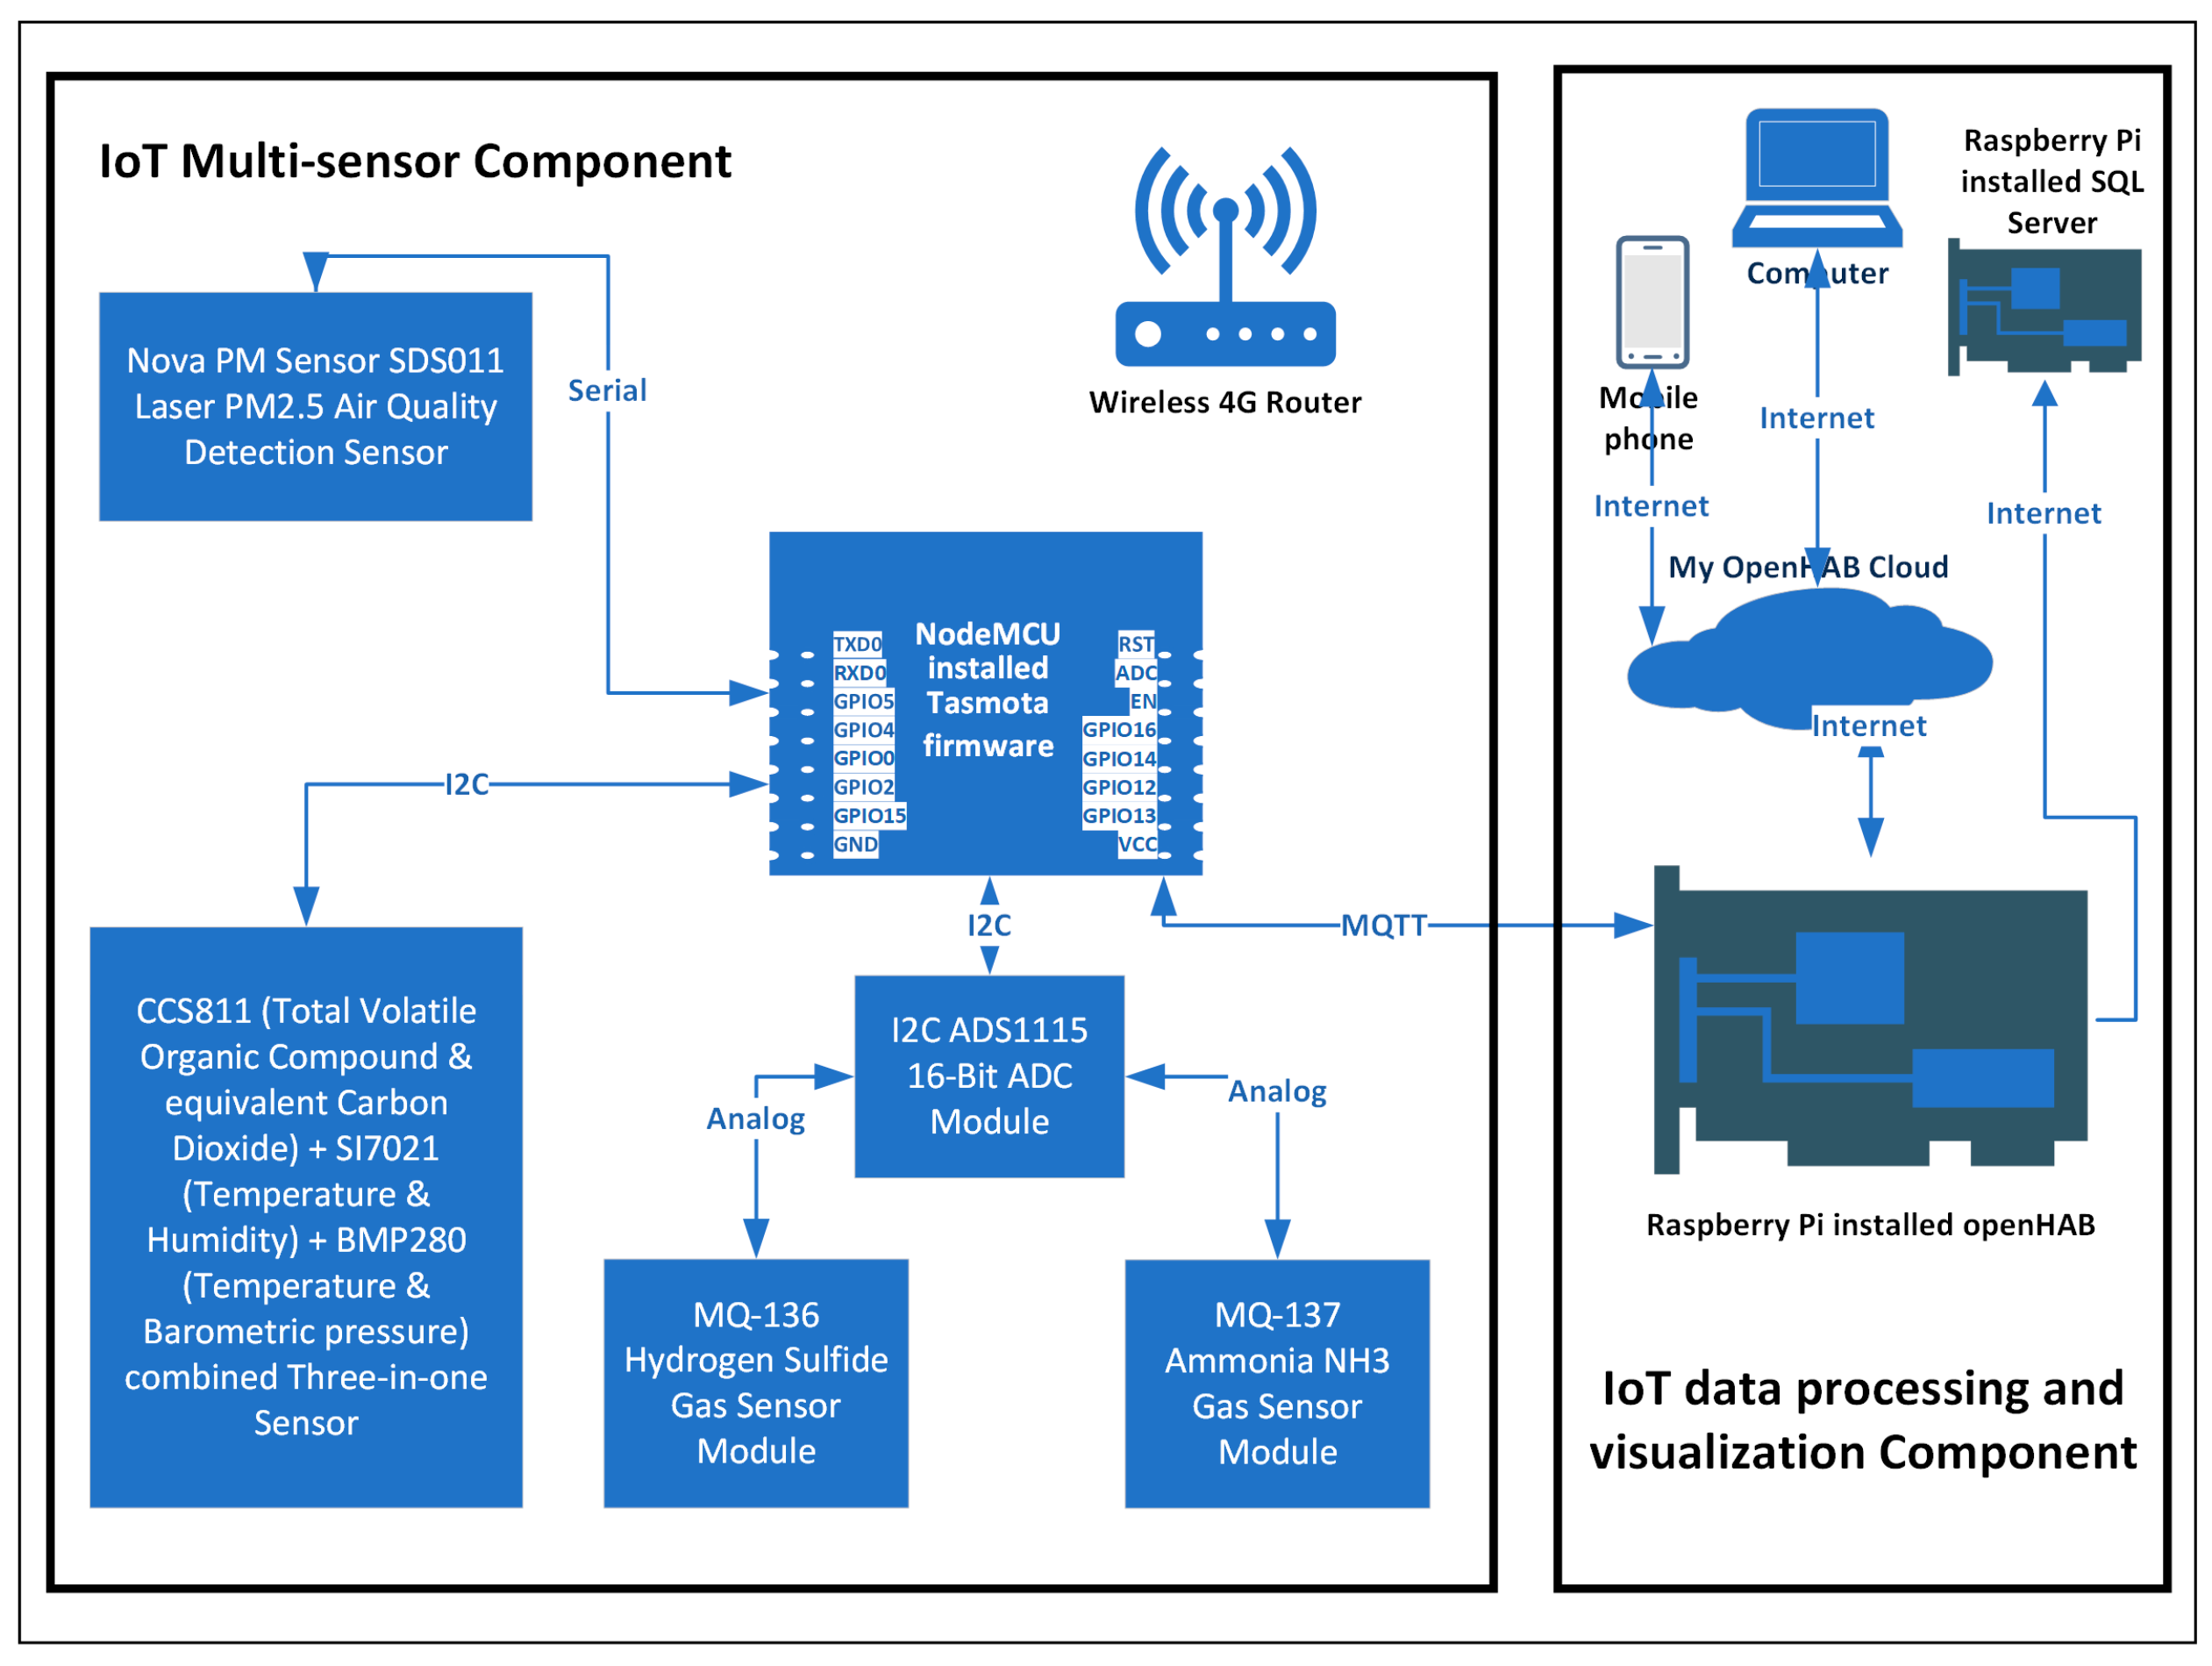
Multi-sensor integration in air quality monitoring transforms monitoring efforts from singular and limited perspectives to a comprehensive and dynamic approach, providing a deeper understanding of the intricate interplay between pollutants and environmental factors. The overall system architecture consists of two main components, as shown in
Figure 1.
First, the IoT multi-sensor layer covers the monitoring devices, network devices, and connecting equipment. It consists of a custom-designed NodeMCU-based multi-sensor with Tasmota firmware installed. This central unit is responsible for collecting data from multiple connected sensors, explained in detail in
Section 2, and measures ammonia, hydrogen sulfide, carbon dioxide, PM2.5, PM10, TVOC, temperature, humidity, and pressure. In this way, continuous monitoring in the barn in real time of several physical parameters is ensured.
Some of the sensors included in the system are connected via a serial interface to measure PM2.5 levels. Another part is connected by a combined sensor module including CCS811, SI7021, and BMP280 sensors. These sensors are connected to the NodeMCU via the I2C interface. On the other hand, to detect specific gases, the system uses MQ-136 and MQ-137 sensors, which detect hydrogen sulfide and ammonia (NH3), respectively. Due to the specificity of these sensors, they are connected via analog interfaces via an I2C ADS1115 16-bit ADC module that converts the analog signals to digital for processing by the NodeMCU.
The multi-sensor devices pre-process the resulting data before being sent to OpenHAB for further processing and visualization. The wireless 4G router creates a Wi-Fi network to which the monitoring devices are connected and provides access to OpenHAB installed on the Raspberry Pi.
Data transfer between each multi-sensor module and OpenHAB is conducted via the Message Queuing Telemetry Transport (MQTT) protocol, which is a publish-subscribe protocol popular among IoT applications. MQTT is based on the idea of maximally light communication (important for IoT) and small system requirements. The basic structure of MQTT includes a client, a broker, a publishing mechanism, and threading. At its core, MQTT is a message exchange-based protocol, and the model used is publish and subscribe.
It is important to note here that there is no direct connection between the system sending data to the broker and the one that requests and then processes it. For this purpose, an intermediate component called a broker is used, which is part of the data processing and visualization layer. A few other important features of the protocol are as follows: from an MQTT perspective, clients do not use addresses; messages are posted to the broker in each topic One of the most important tasks of the broker is to filter the messages from a given topic and forward them to the customers who requested them—Subscribers. A client can receive the messages after requesting them from a specific broker and a precisely defined topic; any customer can post information and any customer can claim it; in general, the broker does not store the messages.
The OpenHAB platform installed on Raspberry Pi 4 (
https://www.openhab.org/), an open-source home automation system, acts as an MQTT client, subscribing to the topics of all multi-sensors and receiving their measurements. All received data are stored in an internal database, organized, and can be monitored and processed locally and remotely via My OpenHAB Cloud. For security and additional processing, the data are saved in a remote MySQL server installed on a Raspberry Pi 2. The price of all hardware components of the multi-sensor is about USD 150, and the software used (Tasmota firmware 11.1.0 Ostara, OpenHAB 3.4.4, System MQTT broker of OpenHAB, MyOpenHAB Cloud) is open source, making the platform an affordable solution.
3.1. Components and Equipment
3.1.1. General Components
A microcontroller, a single-board computer, and open-source IoT automation system OpenHAB (open Home Automation Bus) are the base of the multi-sensor platform (
Table 2). Each component has its importance and every one of them contributes to the overall functionality of the air quality monitoring system.
The NodeMCU communicates wirelessly over Wi-Fi using the MQTT protocol to transmit the collected data both to a Raspberry Pi logic block with OpenHAB installed, which sends the data for storage to an edge device—a Raspberry Pi configured as an SQL server, and to the OpenHAB cloud environment. This dual approach ensures reliable data processing, availability of data, and backup and disaster recovery capabilities. Moreover, this solution presents an opportunity to implement machine learning solutions in the near future that are under development.
From the security point, users can access the system from only one point, which enables early detection and containment of malicious attacks. Access is via HTTPS protocol for encryption of web communications carried over the Internet.
3.1.2. Sensors
Used sensors for different air component targets are shown on
Table 3. The MQ-137 is a gas sensor that is specifically designed for the detection of ammonia (NH
3) gas in the air. It belongs to the MQ series of gas sensors, which are widely used for various applications in detecting different gases. The MQ-137 sensor is particularly sensitive to ammonia and can be used for air quality monitoring, industrial safety, and environmental monitoring.
The MQ-136 sensor is a gas sensor specifically designed for the detection of hydrogen sulfide (H2S) gas in the air. Like other sensors in the MQ series, the MQ-136 is sensitive to a specific gas and provides an analog voltage output that can be measured by a microcontroller or analog-to-digital converter. This sensor is commonly used in applications where monitoring hydrogen sulfide levels is crucial for safety and environmental reasons. The MQ-136 sensor uses a tin dioxide (SnO2) semiconductor material that changes its resistance in the presence of hydrogen sulfide gas. The sensor includes a heater that is used to heat the tin dioxide, making it sensitive to the target gas. As the concentration of hydrogen sulfide increases, the resistance of the sensor decreases, and this change in resistance is used to determine the gas concentration.
The CJMCU-8128 is a sensor module that integrates three sensors: the CCS811 for measuring carbon dioxide (CO2) and total volatile organic compounds (TVOC), the Si7021 for measuring humidity and temperature, and the BMP280 for measuring barometric pressure and temperature. This module provides a compact and convenient solution for environmental sensing in various applications.
The SDS011 is a widely used dust sensor that measures fine particulate matter (PM2.5 and PM10) concentrations in the air. It is commonly employed in air quality monitoring systems to assess the level of airborne particles which can have health implications. Its compact and lightweight design makes it suitable for portable and stationary air quality monitoring applications.
The specification of sensors used for building the multi-sensor system is shown in
Table A1 (
Appendix A). The integration of multiple sensors is realized to monitor the air quality based on the recognition that air quality depends on diverse pollutants and environmental factors.
3.2. Data Logging and Storage
Data from the sensors are recorded every five minutes in the internal database (RRD4) of OpenHAB. The data are also copied through the built-in tools to a remote Internet MariaDB (open-source MySQL) server installed on the top of Raspberry Pi 2.
4. Results
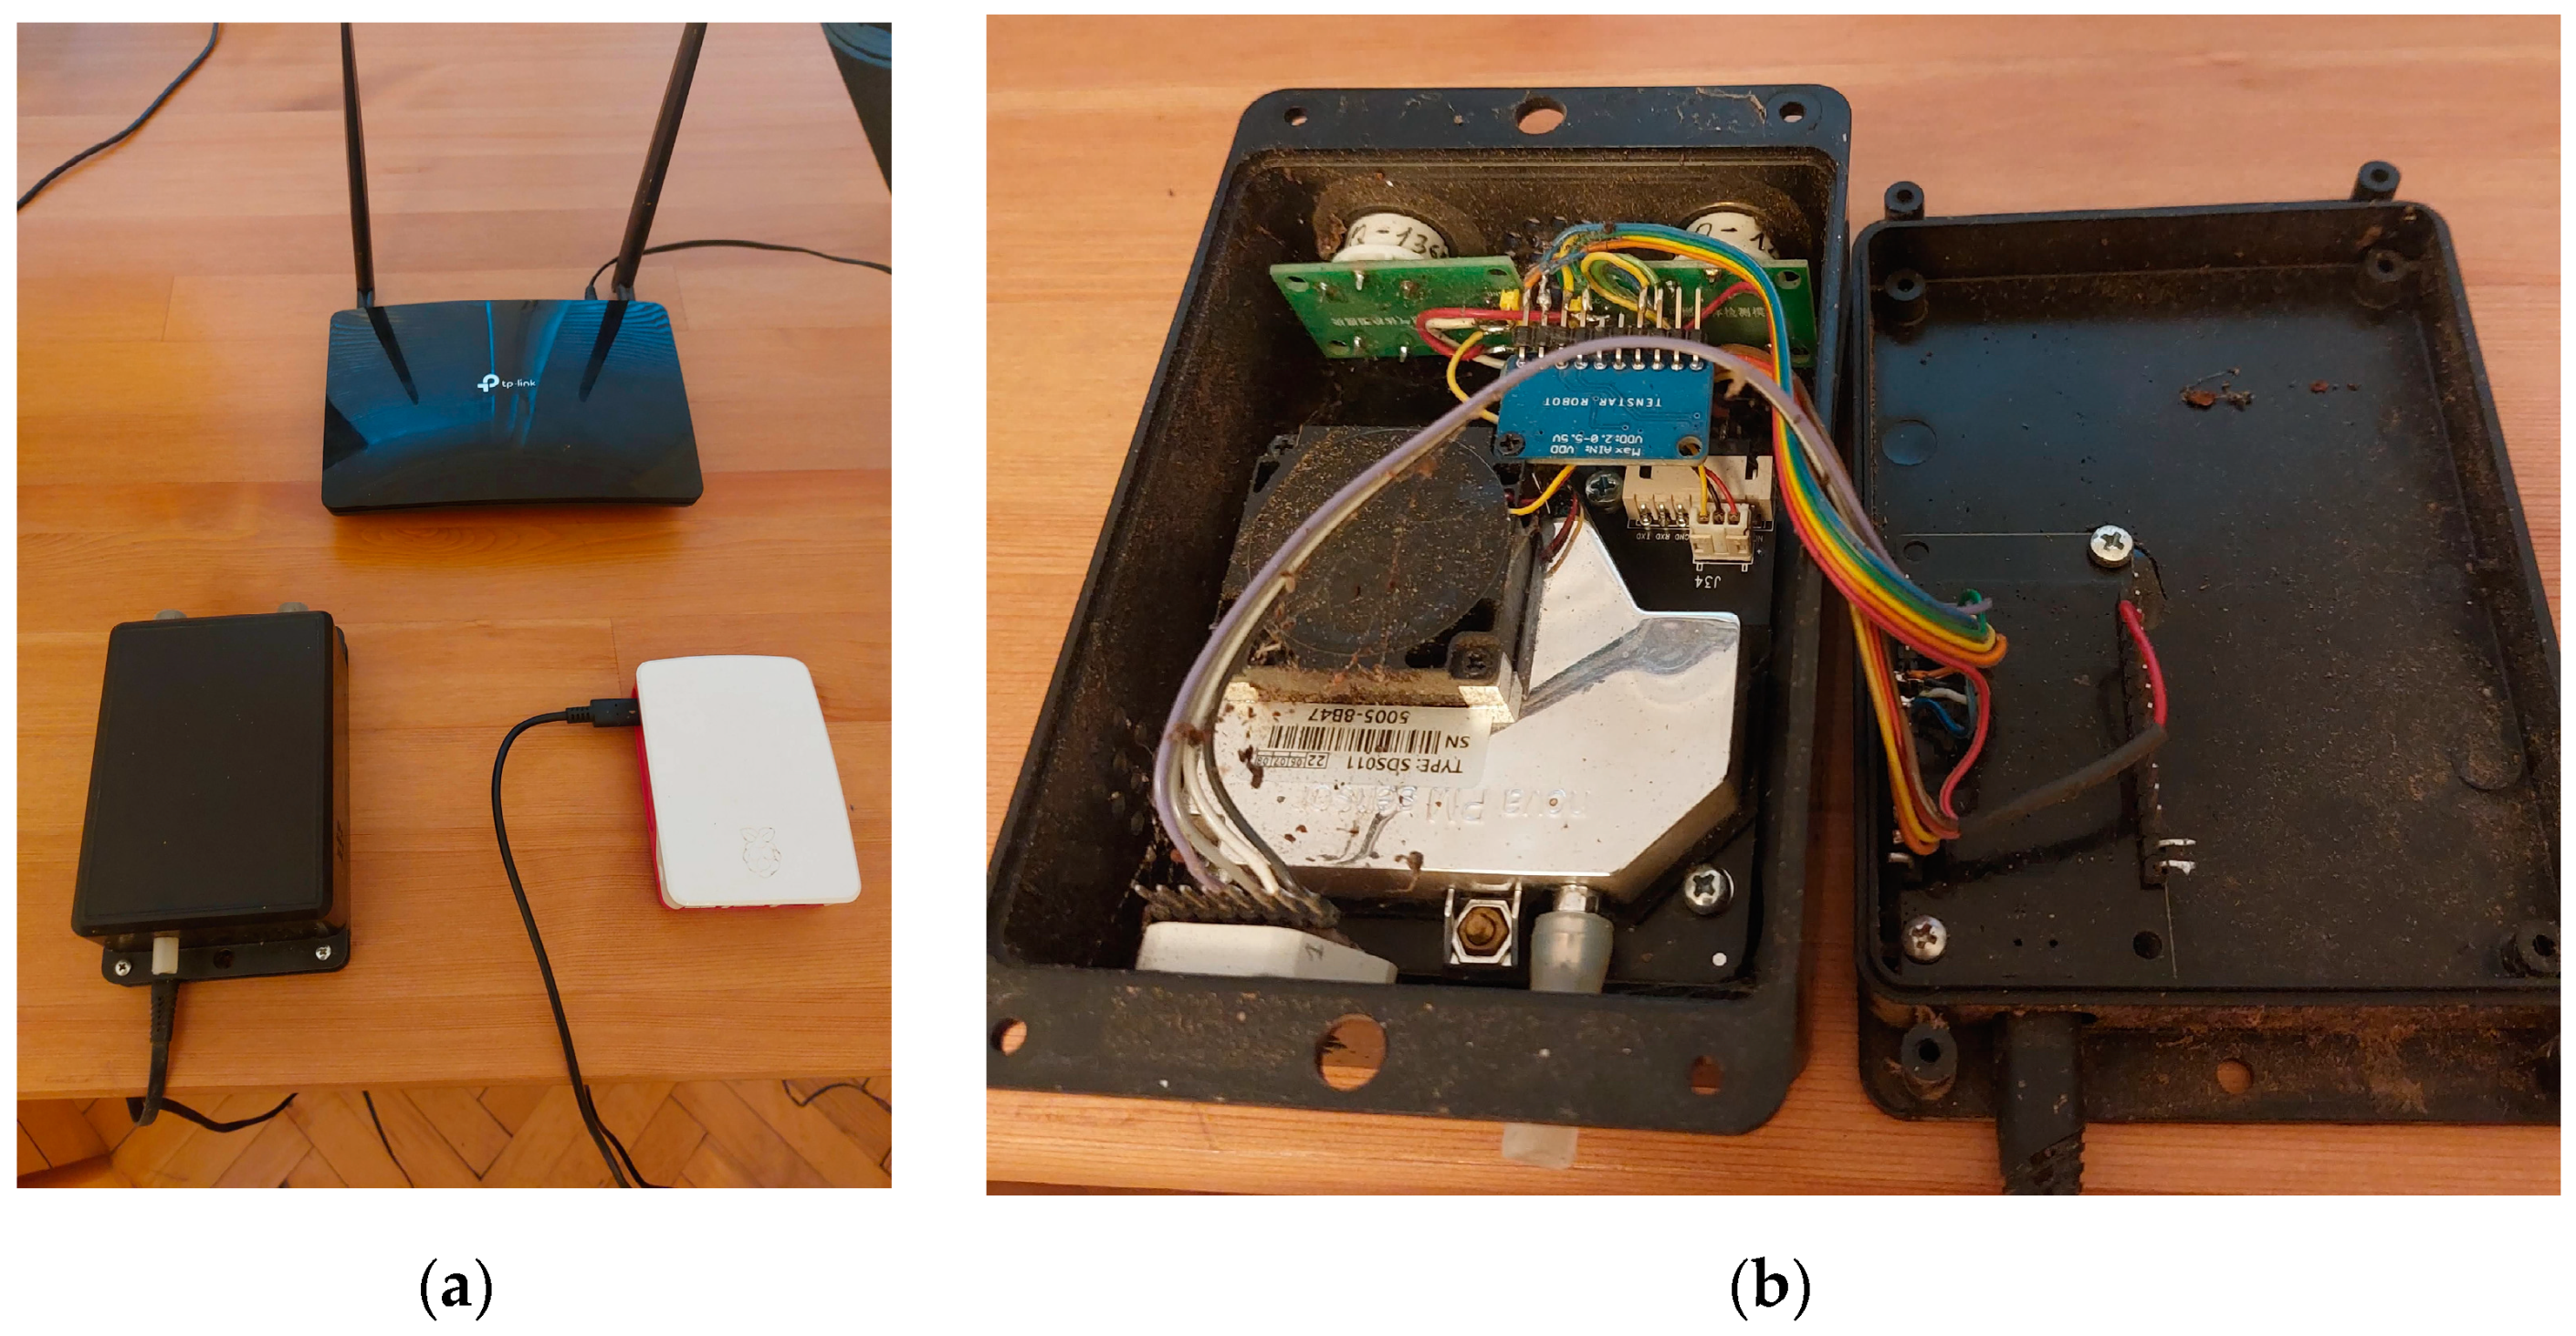
The multi-sensor system is installed in a cow farm in Central Bulgaria near Troyan city (
Figure 2) [
33]. The scope of the collected data is a year (from 19.07.2023 to 9.07.2024).
4.1. Data Profiling
Data profiling is a crucial step in the development of a multi-sensor device as it ensures the quality, consistency, calibration, and reliability of the collected data. By thoroughly examining the datasets, we can identify and address issues such as missing values, data anomalies, and formatting inconsistencies, which could otherwise compromise the accuracy of the device’s outputs. Profiling also supports understanding the data’s underlying patterns, enabling better calibration of sensors and more informed decision making during subsequent analysis. Ultimately, this process lays the foundation for building a robust multi-sensor system, essential for delivering precise, accurate, and actionable insights.
Table 4 presents data profiling of the collected data from the developed multi-sensor device.
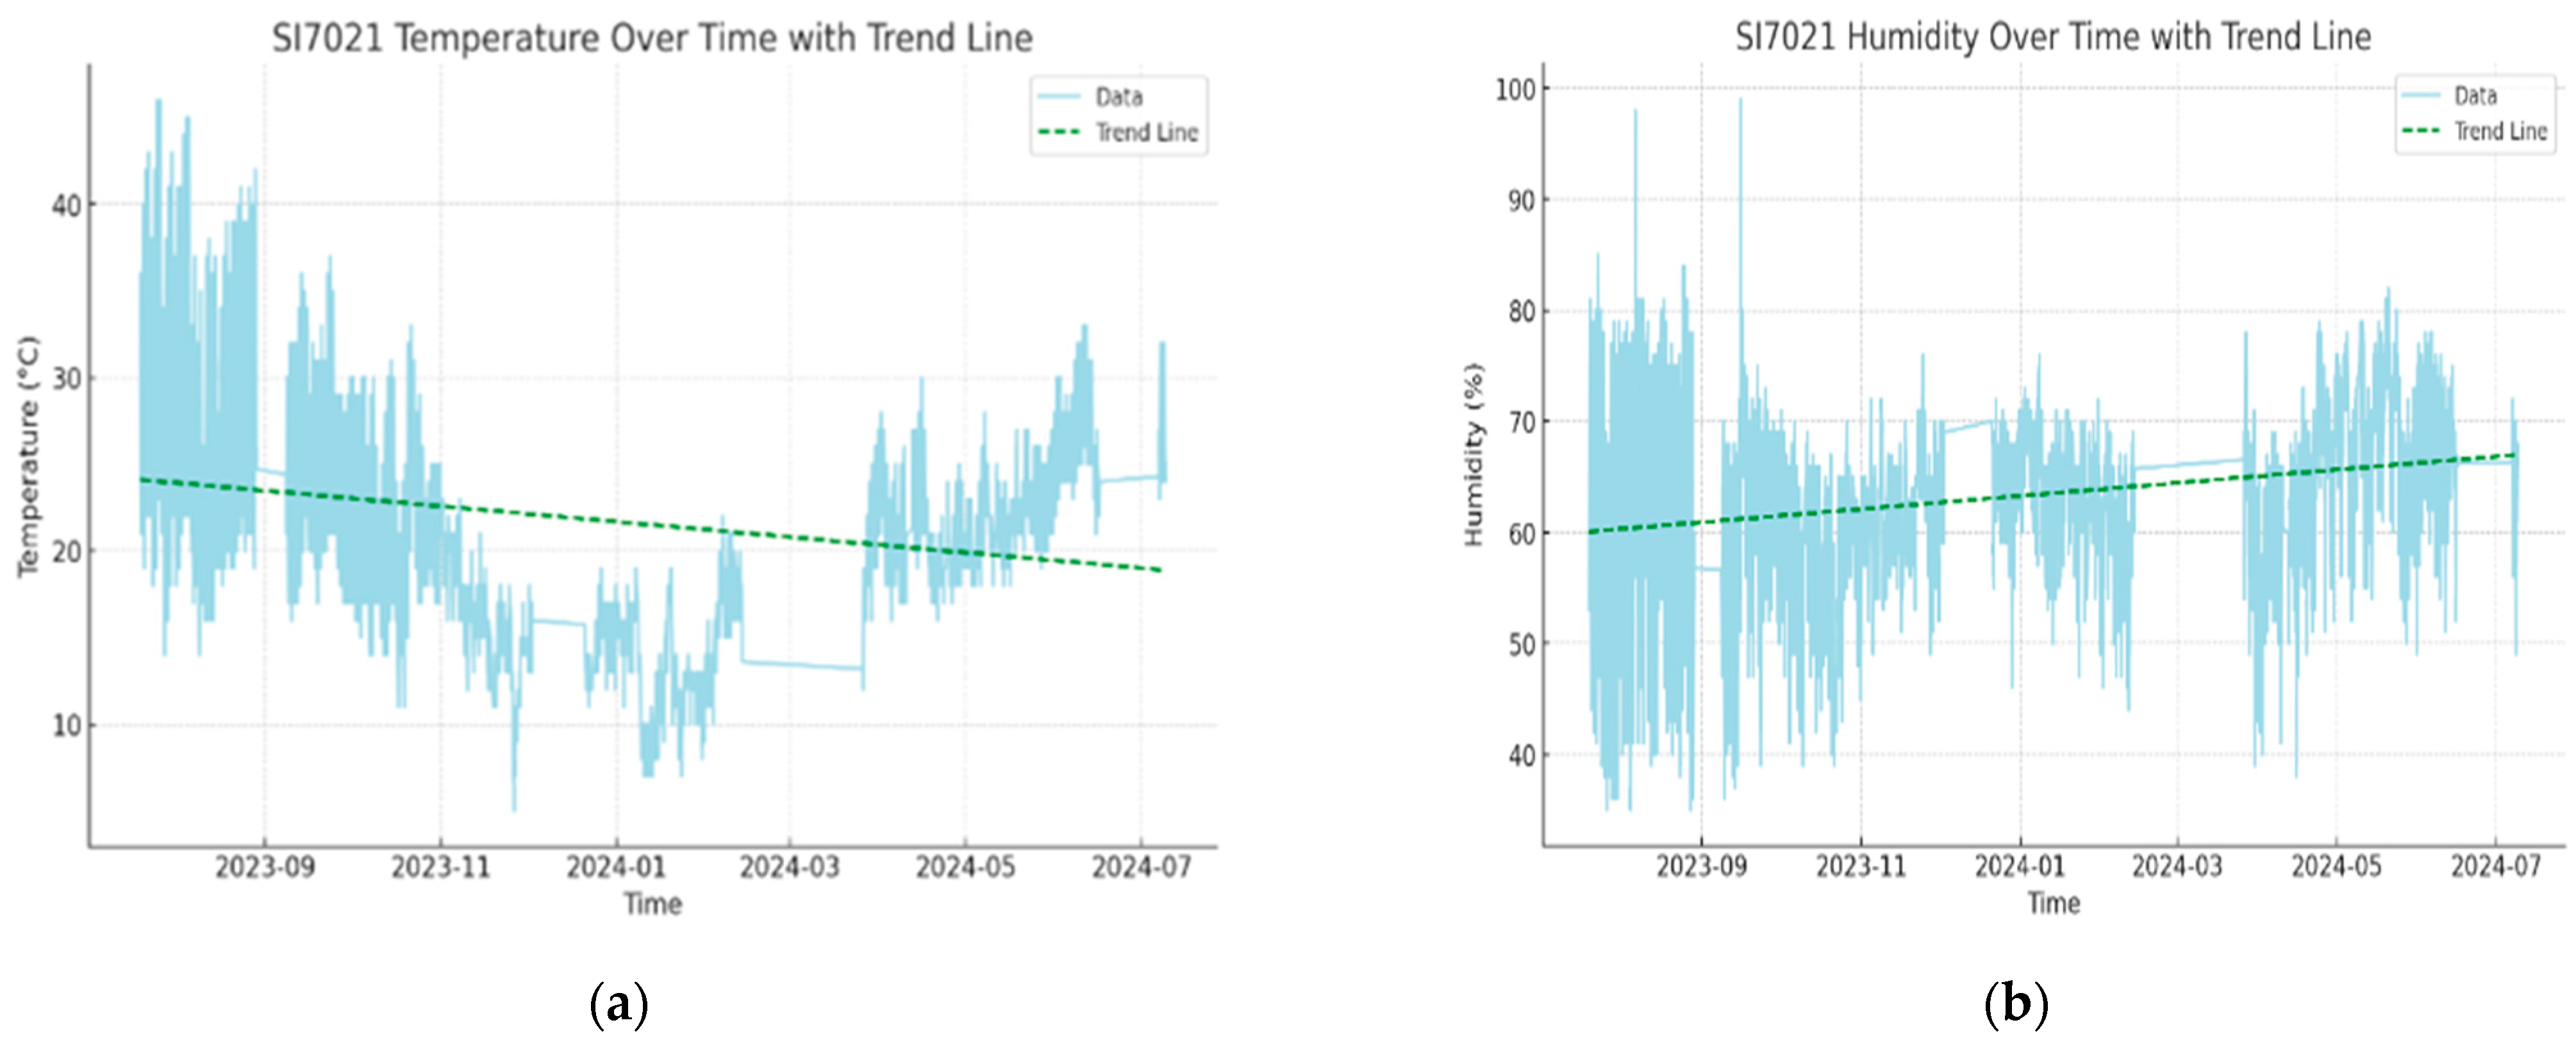
The data collected from various sensors provide valuable insights into the conditions in the barn monitored over time. Some missing data were observed because, during the operation of the multi-sensor module, interruptions occurred due to communication breaks in data transmission, primarily caused by power outages related to weather disturbances such as storms. However, once communication was restored, data collection resumed seamlessly. The BMP280 sensor performed as expected, generating a complete set of data with no missing values, and showing a temperature range from 4.2 °C to 46.8 °C, with an average temperature of approximately 22.09 °C. This indicates a wide fluctuation in temperature, which may correspond to varying operational phases within the monitored environment that will be observed in a later stage. The SI7021 temperature dataset exhibits a similar trend, with temperatures ranging from 5.0 °C to 46.0 °C, though it suffers from a significant amount of missing data (15.1%).
Humidity levels, as recorded by the SI7021 humidity sensor, range from 35% to 99%, with an average humidity of around 63.26%. The high variability in humidity suggests the environment undergoes substantial changes in moisture content, likely influenced by external factors or operational cycles (e.g., usage of a water-cooling system, scheduled filling of water tanks and others). However, the received data also has 14.5% missing data, which may affect the overall interpretation of trends.
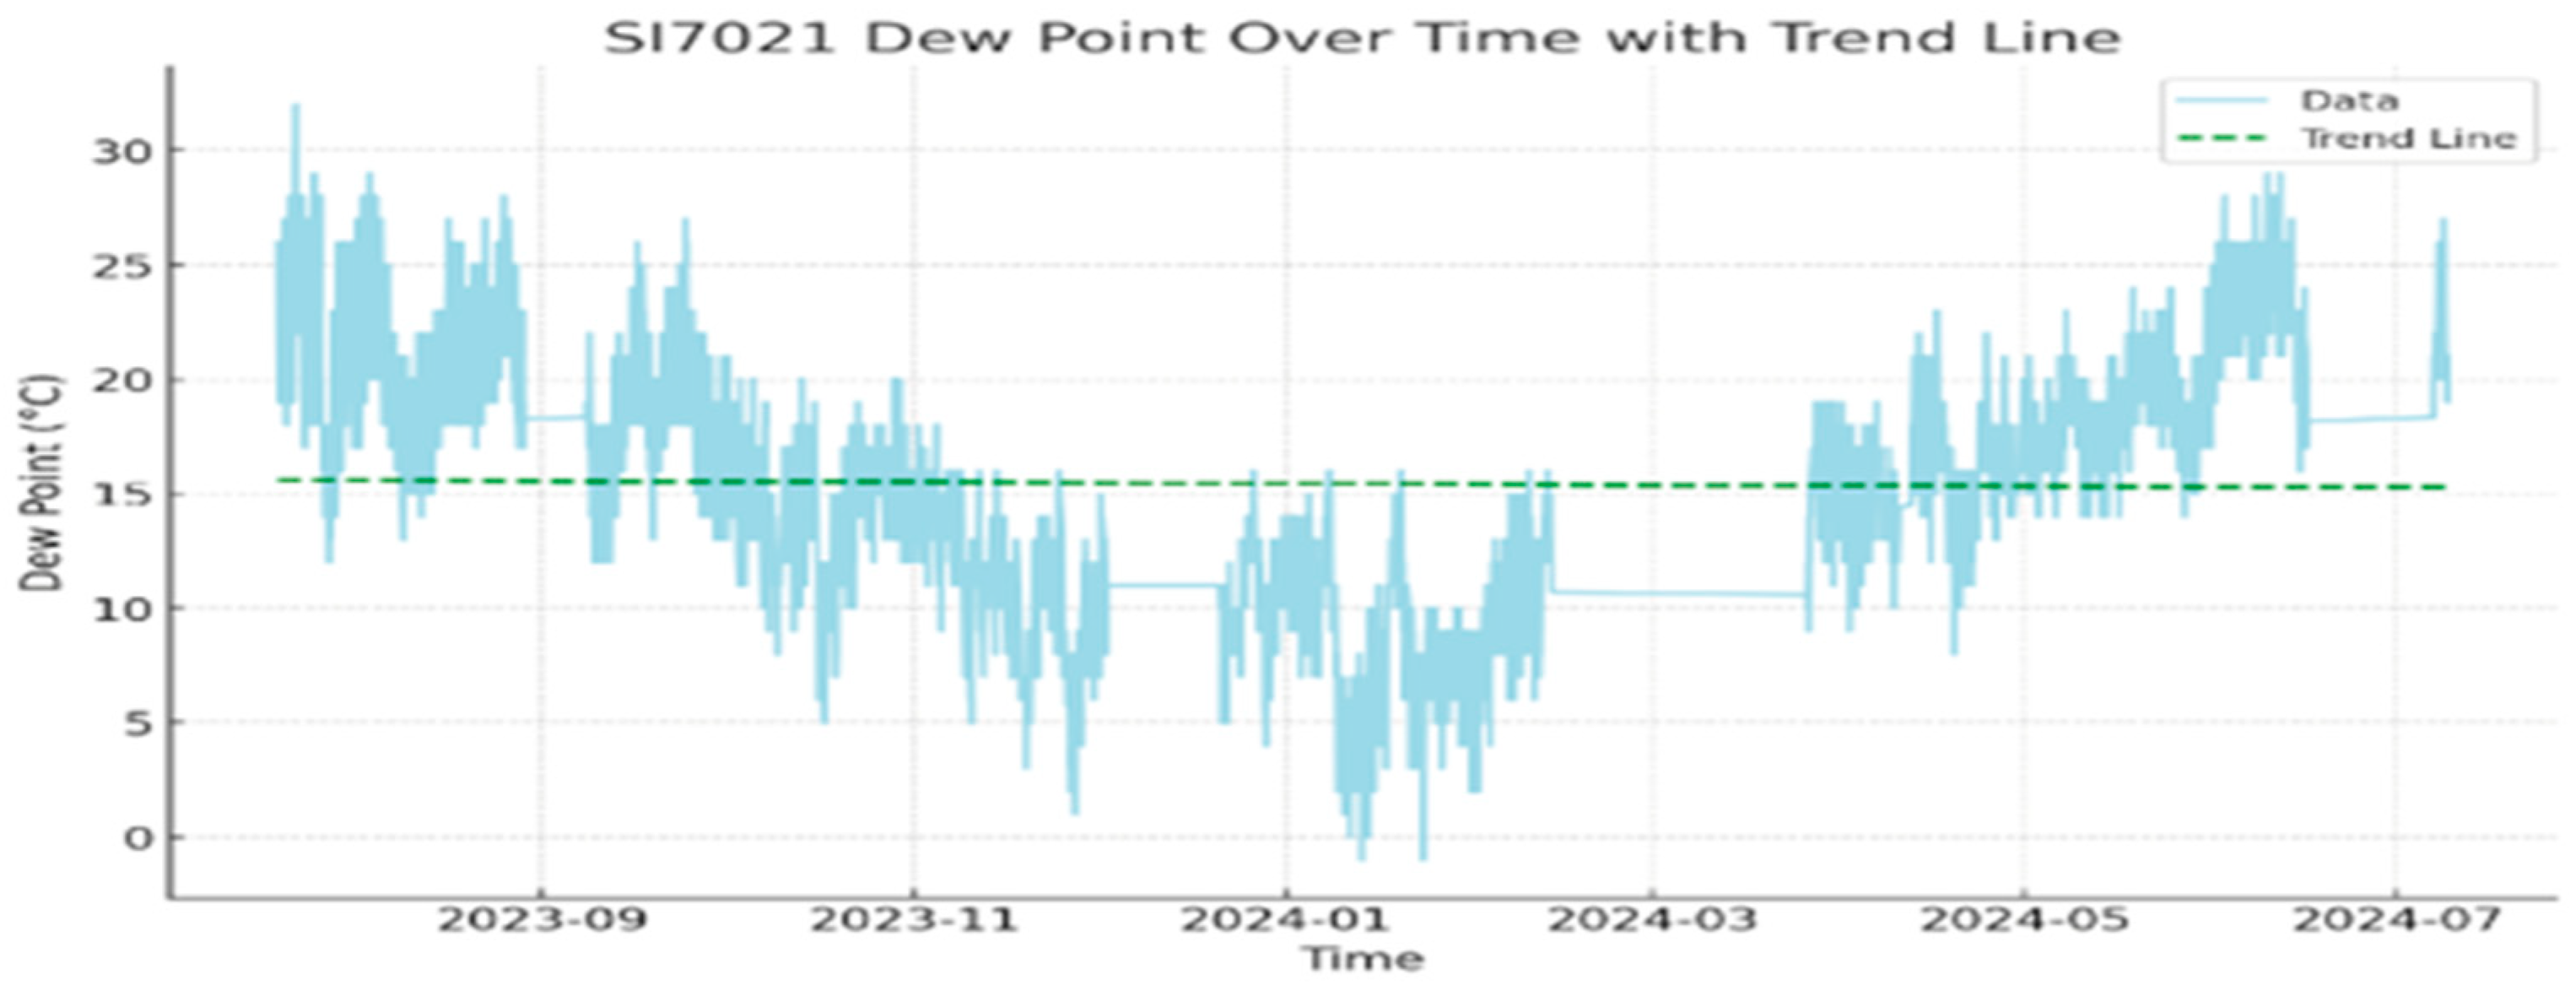
The dew point data, with values ranging from −1.0 °C to 32.0 °C, provide insight into the moisture saturation level of the air, with an average dew point of 15.44 °C. This, combined with the temperature and humidity data, could help in assessing the comfort and safety of the environment for both animals and workers.
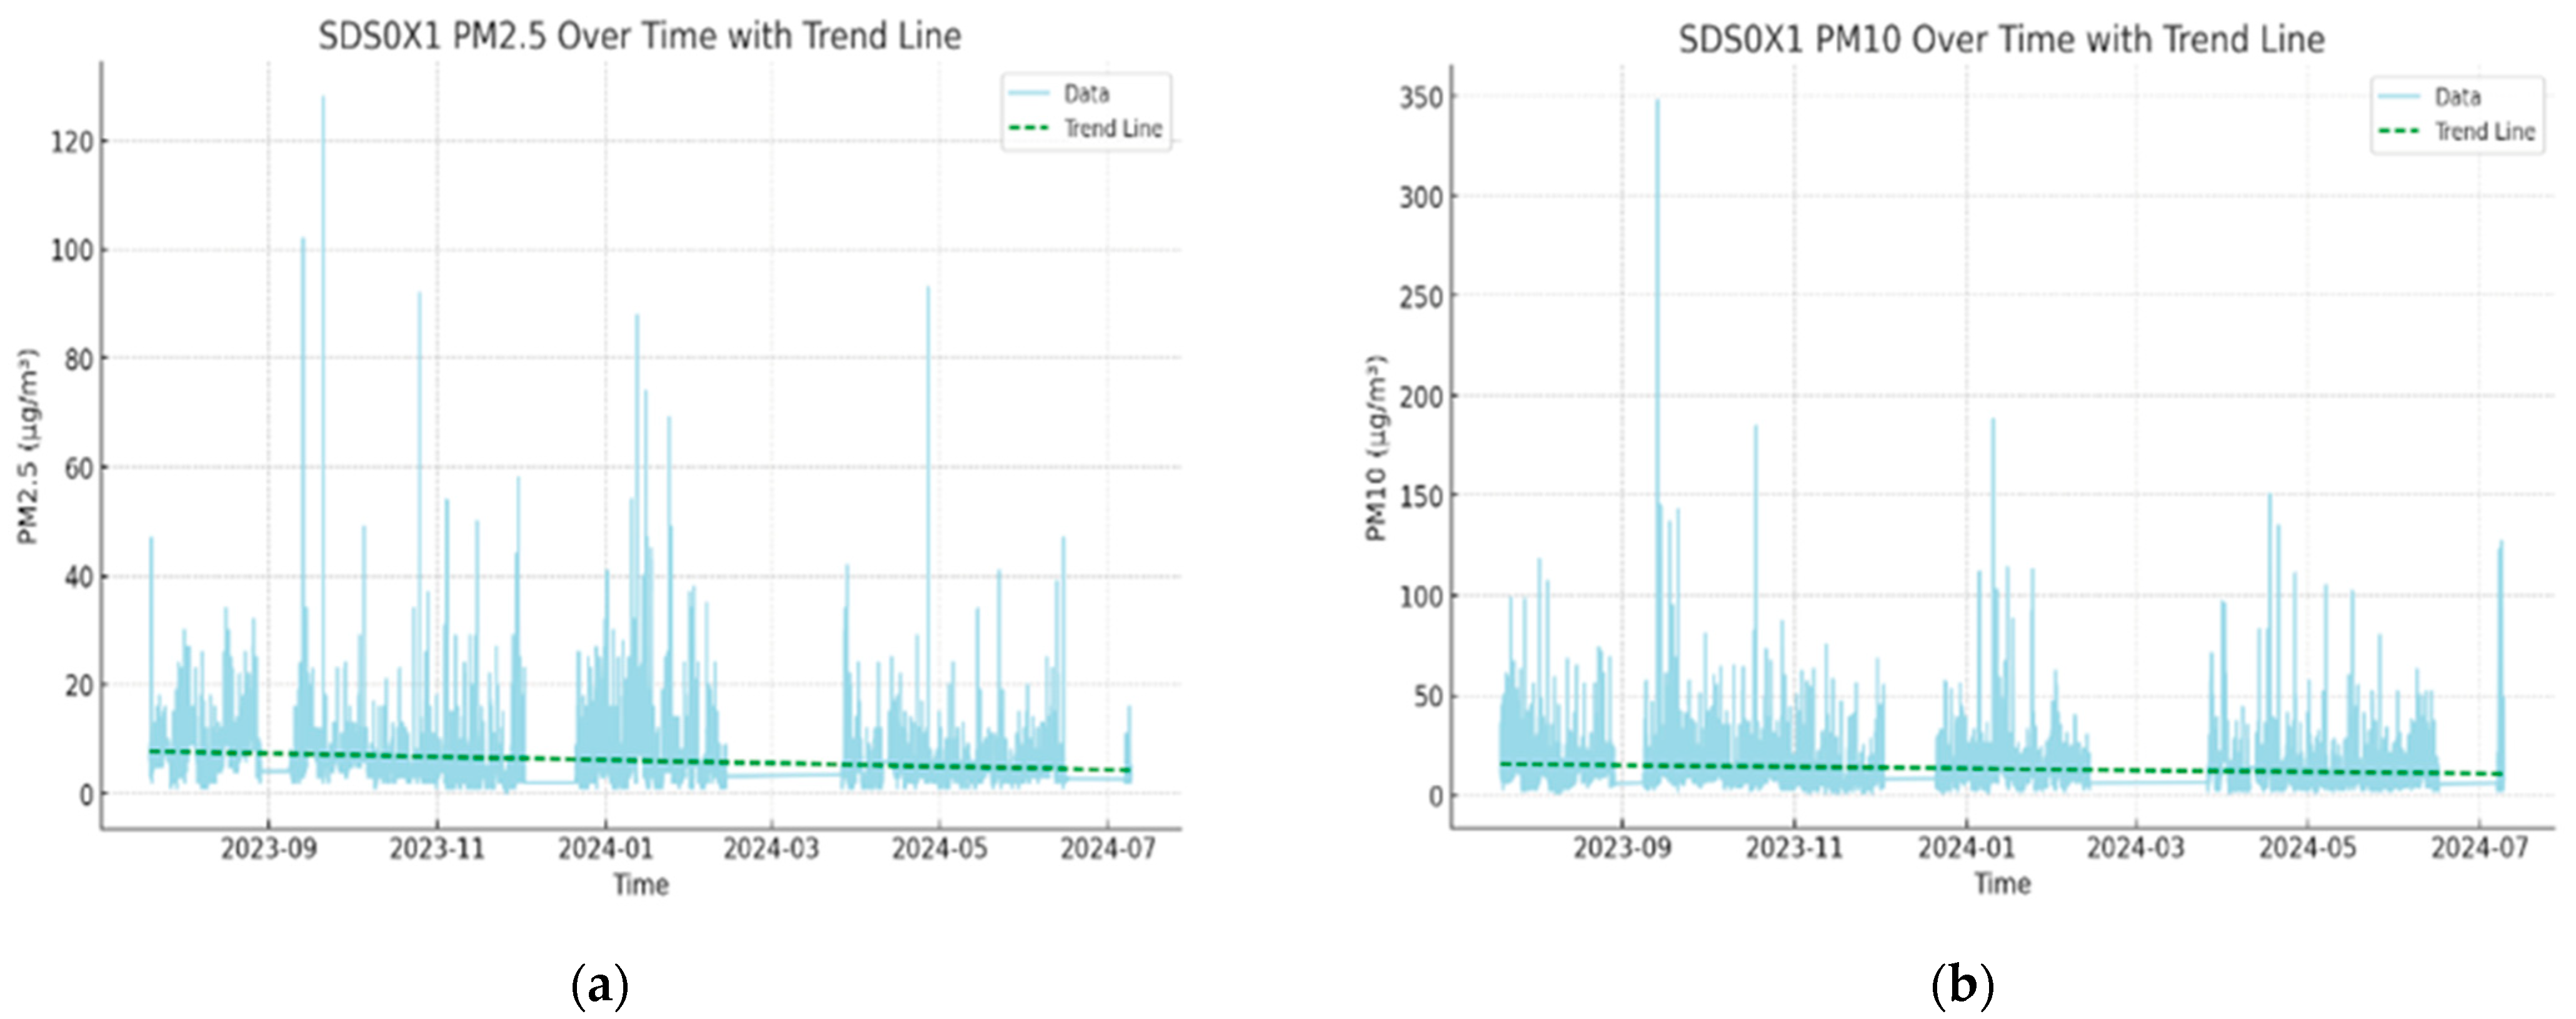
Air quality data, particularly PM2.5 and PM10 levels, reveal potential concerns. The PM2.5 values range from 0 to 128 µg/m3, with an average of 6.18 µg/m3, while PM10 levels range from 1 to 348 µg/m3, averaging 13.45 µg/m3. The occasional spikes in particulate matter could be indicative of activities such as cleaning or feeding, which may stir up dust and affect air quality.
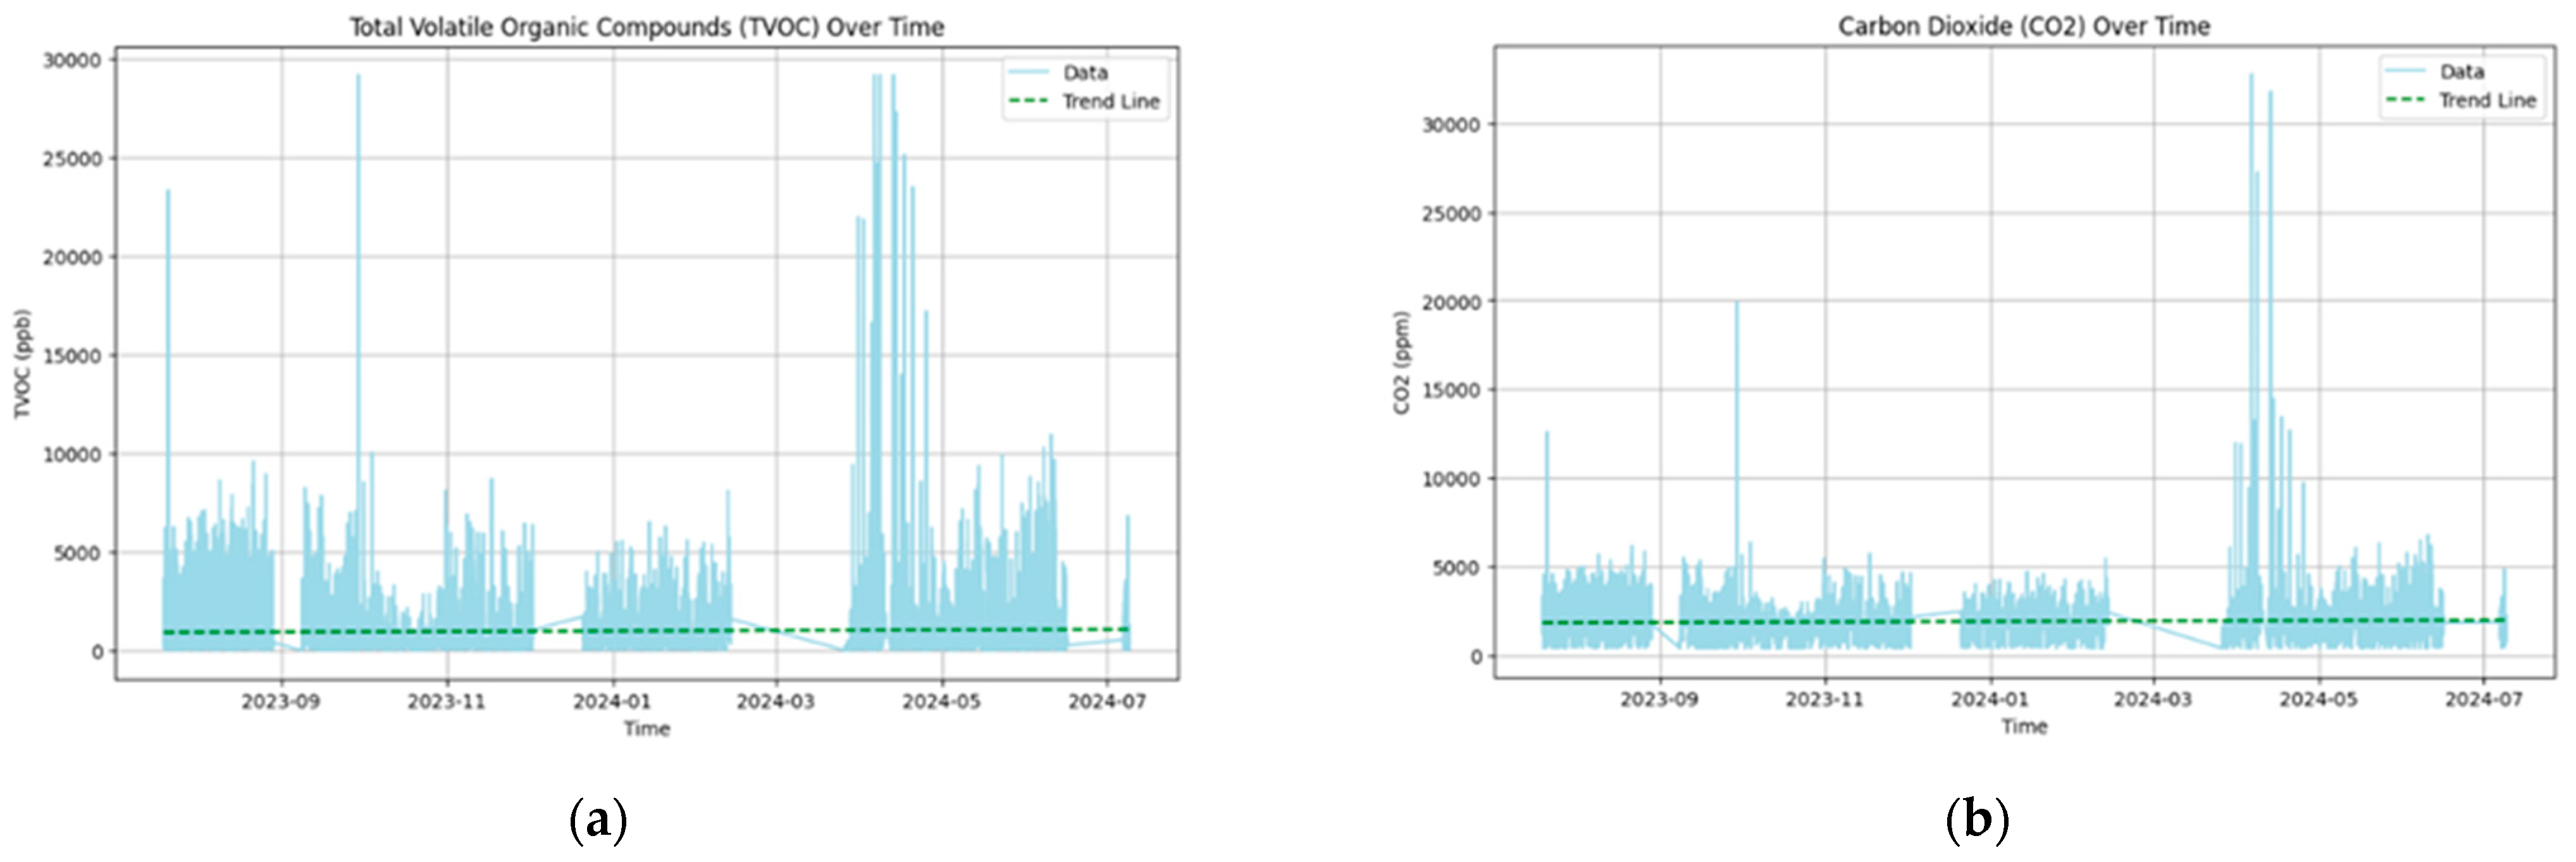
Interestingly, the CCS811 TVOC and eCO2 datasets, which measure total volatile organic compounds and equivalent carbon dioxide, respectively, show a broad range of values. TVOC levels span from 0 to 29,206 ppb, with an average of 981.6 ppb, suggesting periodic increases in airborne chemicals, possibly from animal waste or cleaning agents. The eCO2 levels, ranging from 400 to 32,768 ppm with an average of 1902.7 ppm, indicate variable CO2 concentrations, potentially reflecting changes in ventilation or animal respiration. The use of fans in the barn, the condition of the doors and windows—open or closed—and other weather conditions such as wind strength and direction have a particular influence.
4.2. Time-Series Analysis and Trend Insights
This analysis aims to uncover underlying trends and patterns that can provide valuable insights into the monitored environment. The data are accompanied by a trend line. This analysis supports understanding the current conditions and also proposes guidance for future improvements in environmental management.
The trend line was generated using linear regression, a statistical technique that involves fitting a straight line to the data by minimizing the sum of the squared variances between the observed values and the values predicted by the line. The equation of the trend line is given by the following:
where
y—is the predicted value (e.g., temperature, humidity),
m—is the slope of the line, indicating the rate of change over time,
x—is the time (converted to a numerical format),
b—is the y-intercept.
Figure 3a shows fluctuations over time, with the trend line indicating a slight overall increase in temperature. This is due to seasonal changes and specific operational cycles within the monitored environment.
Figure 3b and
Figure 4 reveal periodic variations, with the trend lines suggesting a stable but slightly decreasing trend. This is due to changes in ventilation and moisture control within the facility.
Figure 5a,b levels exhibit several spikes, which could be linked to activities that stir up dust, such as cleaning or feeding. The trend lines for both PM2.5 and PM10 are relatively flat, suggesting that while there are occasional peaks, the overall levels of particulate matter remain consistent over time. That highlights a lack of appropriate powerful ventilation and proper process of cleaning—two things with high impact on animals in the barn.
Figure 6a highlights significant variability with several spikes reaching up to 30,000 ppb. These fluctuations correspond to specific activities or events within the monitored environment, such as cleaning and the use of chemicals. Despite periods of relative stability, the green trend line indicates a slight overall increase in TVOC levels, suggesting a gradual rise in the background concentration of volatile organic compounds. The periodic clusters of high TVOC levels also suggest operational influences that require further investigation to mitigate the impact on air quality. Similarly,
Figure 6b reveals significant fluctuations with occasional spikes reaching over 30,000 ppm. The trend line shows a slight downward trend, indicating a gradual decrease in the overall CO
2 levels over time. Despite this general decline, the presence of periodic spikes suggests that there are still moments of elevated CO
2 concentration.
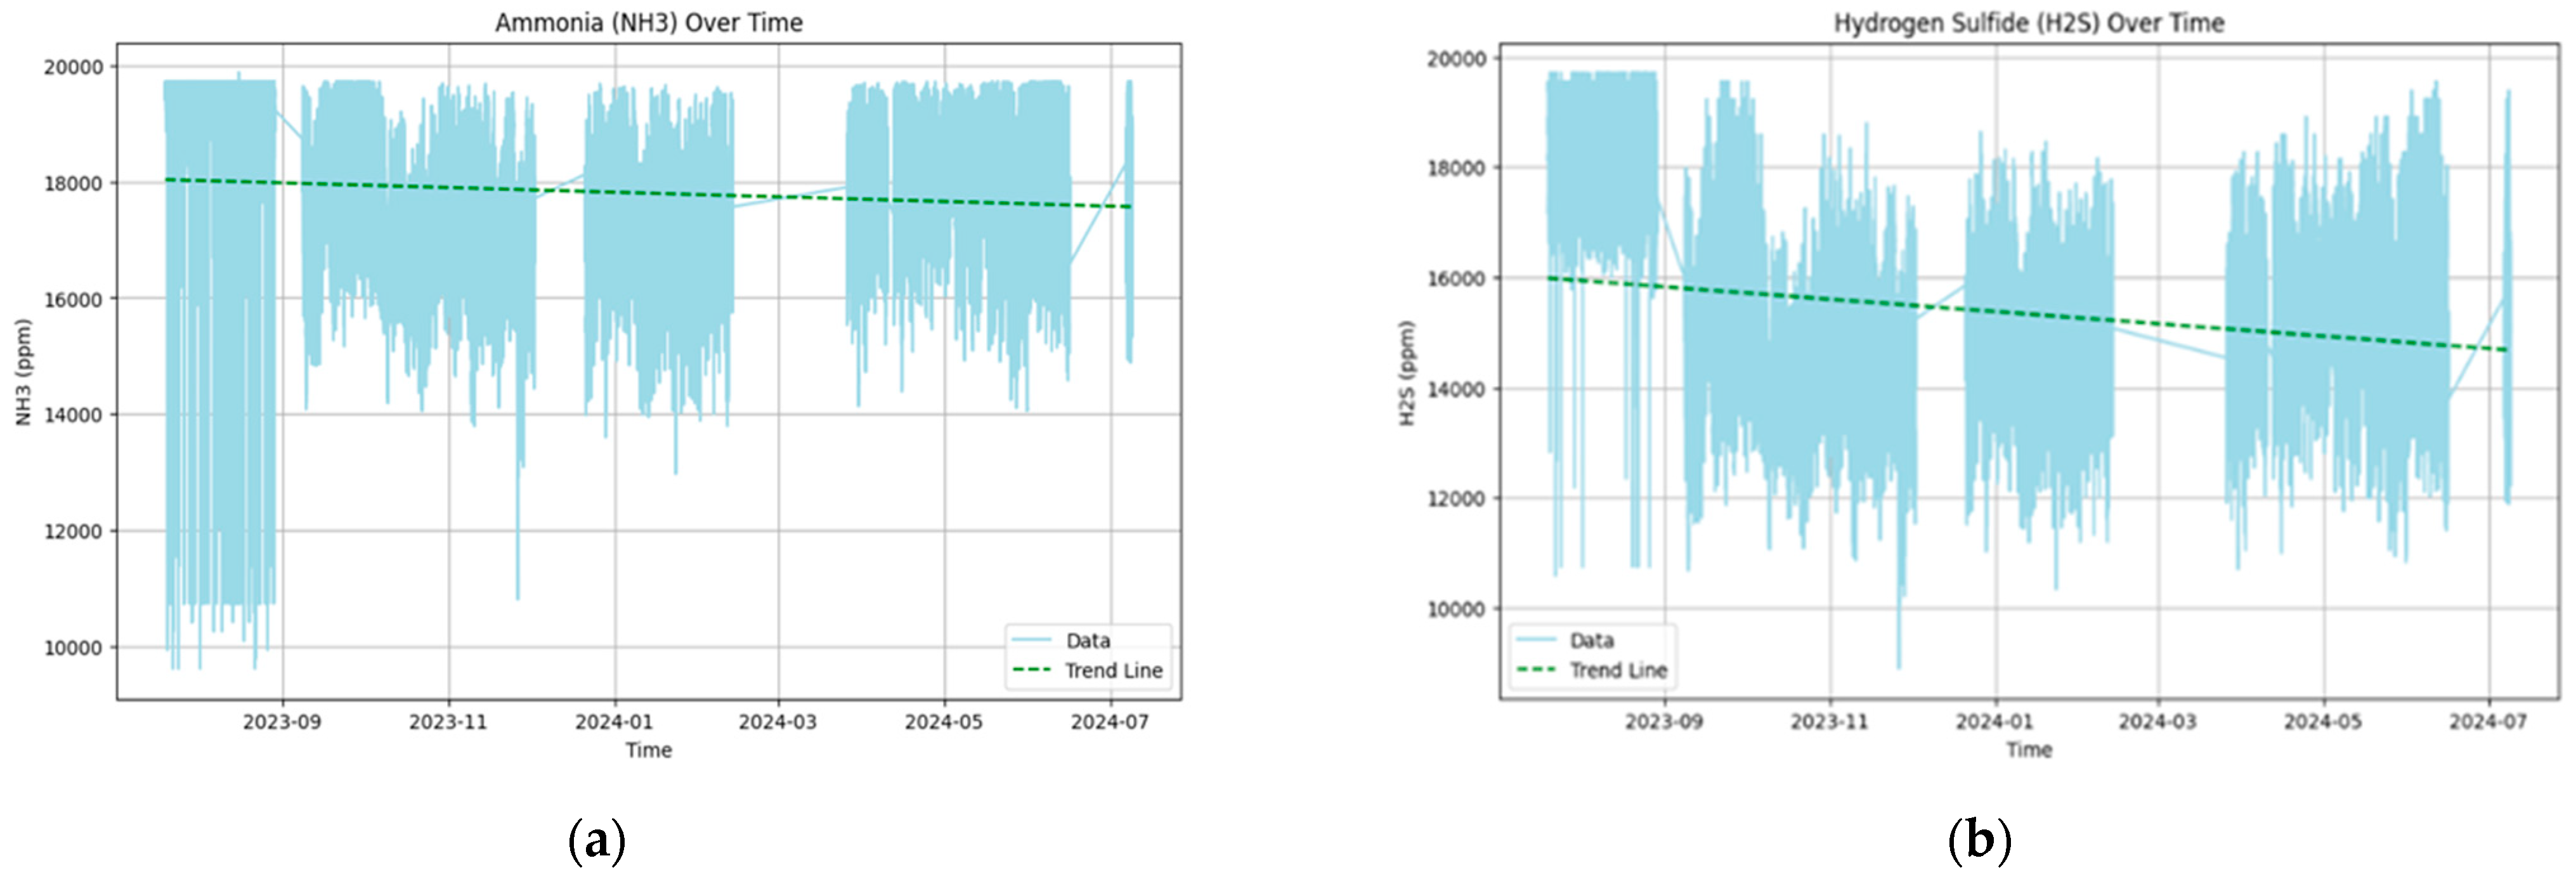
Figure 7a for ammonia (NH
3) and
Figure 7b for hydrogen sulfide (H
2S) levels over time both show significant variability, with concentrations generally fluctuating between 10,000 ppm and 20,000 ppm. For ammonia, the green trend line indicates a slight upward trend, suggesting that overall levels may be gradually increasing. The periodic drops in NH
3 levels could correspond to specific ventilation activities or operational pauses. This relatively stable yet rising trend implies that ammonia accumulation could become a concern over time, particularly if ventilation or ammonia control measures are not adjusted accordingly. Conversely, the hydrogen sulfide plot shows a slight downward trend in the overall H
2S levels, suggesting a gradual decrease during the observed period. However, periodic peaks in H
2S levels remain evident. Both patterns highlight the importance of continuous monitoring and the potential need for optimizing environmental controls in barns to prevent prolonged exposure to elevated ammonia and hydrogen sulfide levels in the environment.
4.3. Correlation Analysis
The correlation analysis aims to give us more clarity about the relationships between collected data for different parameters and how they are related to one another. By understanding these relationships, we can gain insights into the dynamics of the environment being monitored.
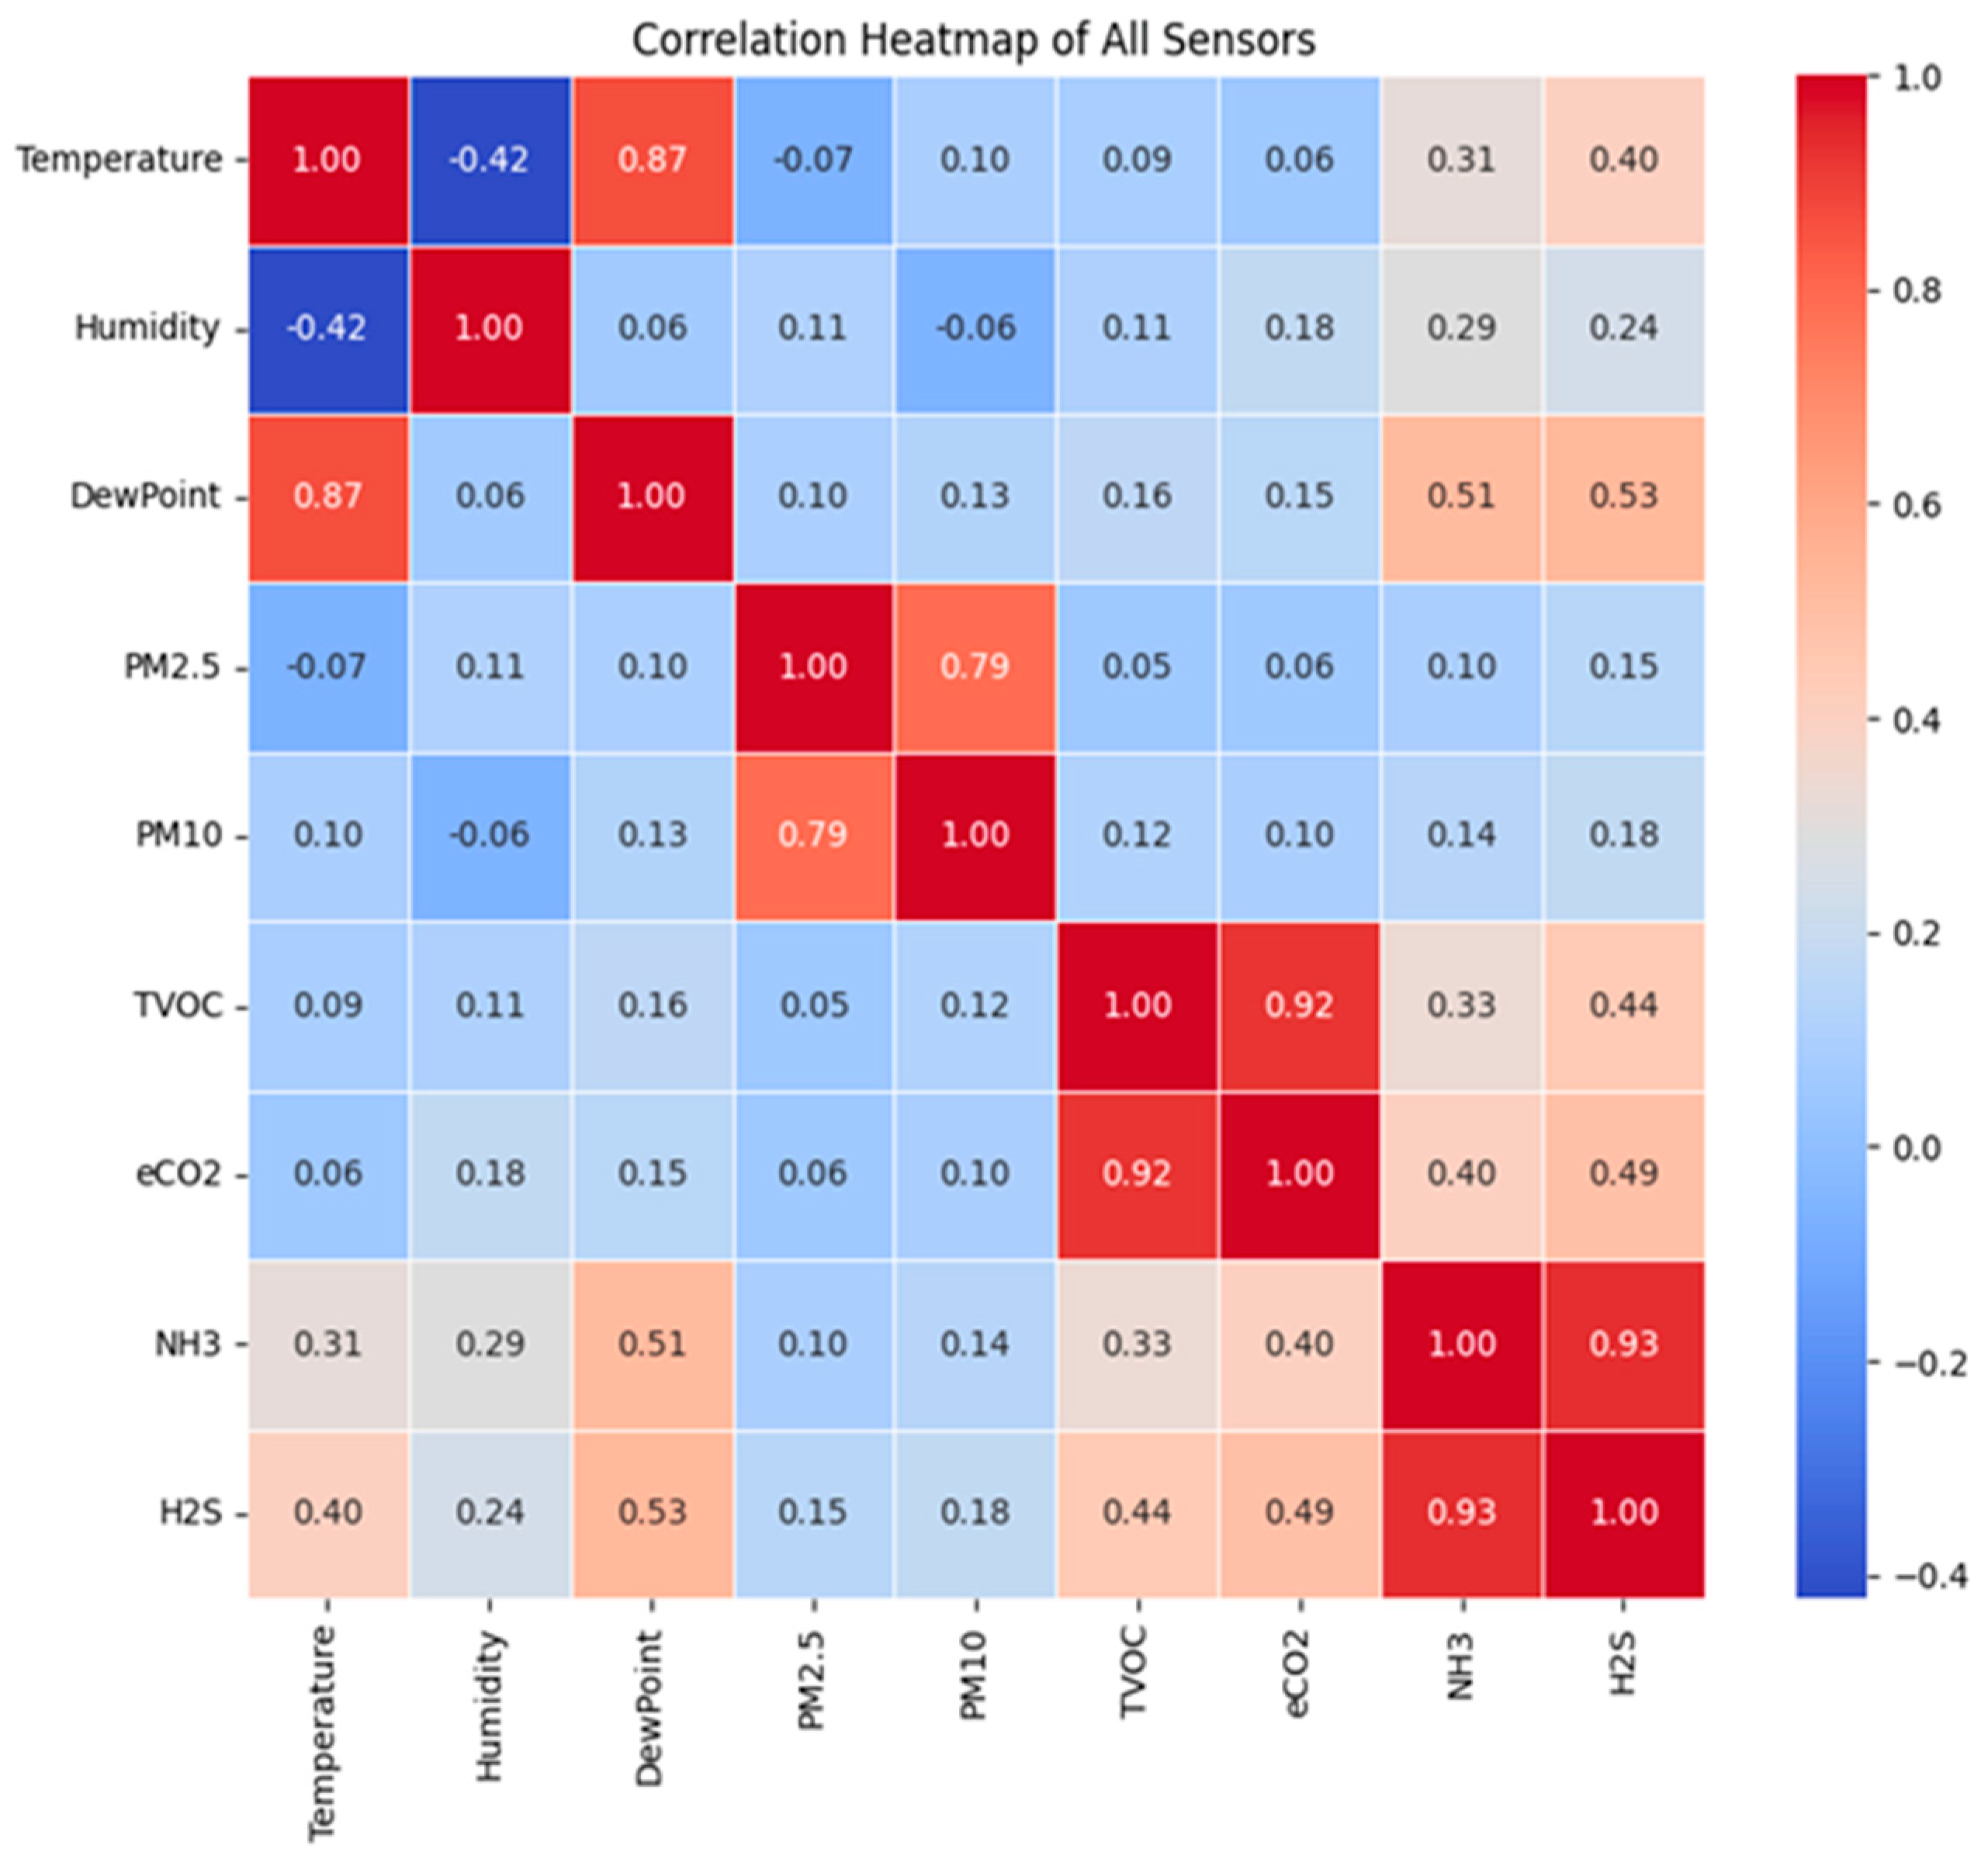
The correlations observed between temperature and dew point are positive (0.87) (
Figure 8). This strong positive correlation is expected, as the dew point is directly influenced by temperature and humidity levels. When the temperature rises, the dew point also tends to increase, provided the moisture content in the air remains relatively stable. The correlation between PM2.5 and PM10 levels is notably high (0.79), indicating that these two measurements of particulate matter tend to move together. This is logical, as PM2.5 is a subset of PM10, and both are often influenced by similar sources, such as dust and other particulate-generating activities within the barn. TVOC and eCO
2 also show a strong positive correlation (0.92), indicating that these two parameters are closely linked in the environment in the barn. This could be due to shared sources, such as animal respiration, waste management practices, and the use of certain chemicals used for milking devices and tanks’ cleaning. Another significant correlation is observed between NH
3 and H
2S, with a correlation coefficient of 0.93, both of which are odorous substances that significantly impact air quality and can affect the taste of animal products. A strong positive correlation between these gases suggests they often increase together, likely due to shared sources like animal waste. Temperature is also correlated with NH
3 and H
2S, implying that higher temperatures could exacerbate the presence of these gases.
5. Discussion
The results of our study show that the developed multi-sensor platform is based on a reliable and precise architecture that combines different types and numbers of sensors that collect heterogeneous data that are stored following strict rules. This is consistent with the findings of other studies, such as those of [
4], which focused on urban air quality, and [
8], which investigated indoor air quality monitoring. However, our study uniquely addresses the specific needs of the livestock environment, filling a gap in the existing literature. Unlike the work of [
9], which mainly discusses the use of metal oxide (MOx) gas sensors for residential air quality monitoring, our system uses a diverse array of sensors tailored to the agricultural sector.
Using multiple sensors to measure the same parameter allows for cross-referencing and validation of data. This redundancy improves the accuracy and reliability of measurements, addressing challenges such as sensor drift or calibration errors [
34]. The result is a more robust and trustworthy dataset.
Air quality can vary widely within a place in an animal barn due to local factors and microenvironments. A multi-sensor system offers the flexibility to tailor monitoring efforts by strategically placing sensors in different locations based on specific environmental concerns. This adaptability ensures that monitoring is reflective of the unique characteristics of each area. The wealth of data generated by multi-sensor systems enables data-driven decision making [
35]. Farmers can use this information to formulate effective strategies for pollution control. Multi-sensor integration allows for the inclusion of new sensors to monitor emerging pollutants or changing environmental conditions, ensuring that air quality monitoring systems remain adaptive and forward looking.
However, challenges arise in maintaining consistency across sensors, especially in ensuring the accuracy and reliability of sensor readings which requires regular calibration and maintenance. Additional challenges for PLF include the continued development of IoT technologies (
https://livestocksense.eu/) and sensors for efficient transmission, storage, and data security that can be integrated into PLF systems and enable them to achieve the goals of precision agriculture [
36]. Factors such as air ionization, noise level, amount of carbon monoxide, and bacterial contamination should also be considered in future PLF multi-sensor systems. The development of complex algorithms to integrate and interpret data from multiple sensors is also among the challenges and ongoing work. Integrating Artificial Intelligence (AI) algorithms for data analysis can enhance the capabilities of multi-sensor systems. Machine learning can improve pattern recognition, leading to more accurate and predictive models. Utilizing edge computing technologies allows for data processing closer to the source, reducing latency and enabling more efficient real-time monitoring without overburdening centralized systems.
In conclusion, the importance of multi-sensor integration in air quality monitoring cannot be overstated. It transforms monitoring efforts from singular and limited perspectives to a comprehensive and dynamic approach, providing a deeper understanding of the intricate interplay between pollutants and environmental factors (
https://www.clearfarm.eu/the-project/ accessed on 10 April 2024). This evolution is essential for fostering sustainable practices in PLF.
6. Conclusions
The implementation of a multi-sensor air quality monitoring system in livestock facilities represents a significant advance in the management of conditions in livestock barns. The importance of multi-sensor integration lies in its ability to provide a comprehensive, real-time snapshot of air quality, overcoming the limitations of traditional single-parameter monitoring systems. By simultaneously measuring various pollutants and environmental factors, this system offers unparalleled insight into pollution sources, synergistic relationships, and the dynamic nature of air quality.
Our system adheres to SOLID principles, ensuring its robustness, scalability and easy maintenance. This is an improvement over existing air quality monitoring solutions, which often lack the flexibility and durability required for effective long-term use in diverse and challenging livestock environments. By integrating sensors for ammonia, hydrogen sulfide, carbon dioxide, particulate matter (PM2.5 and PM10), total volatile organic compounds (TVOC), temperature, humidity, and pressure, our system offers a holistic view of air quality conditions, supporting agricultural manufacturers with the data needed to make informed decisions.
In addition, the multi-sensor system we developed is cost-effective using low-cost sensors and open-source tools, which significantly reduces the overall cost of the system. This aspect makes our solution more affordable and practical for widespread distribution in various agricultural settings, especially in regions with limited resources. Compared to other expensive air quality monitoring systems, our approach offers a viable and sustainable alternative without compromising data accuracy and reliability.
Future developments focus on further reducing costs and integrating advanced data analysis techniques such as artificial intelligence and machine learning. These improvements will allow the prediction of air quality trends and identify potential animal hazards before they become critical problems. Furthermore, improving the system’s robustness to different environmental conditions and ensuring its adaptability to different livestock settings will be essential for wider application.


