Article

On-Edge Deployment of Vision Transformers for Medical Diagnostics Using the Kvasir-Capsule Dataset

Department of Computer Science and Engineering, American University of Sharjah, Sharjah P.O. Box 26666, United Arab Emirates
*
Author to whom correspondence should be addressed.
These authors contributed equally to this work.
Appl. Sci. 2024, 14(18), 8115; https://doi.org/10.3390/app14188115
Submission received: 25 July 2024 / Revised: 19 August 2024 / Accepted: 5 September 2024 / Published: 10 September 2024
(This article belongs to the Special Issue AI Technologies for eHealth and mHealth)

Abstract

:
This paper aims to explore the possibility of utilizing vision transformers (ViTs) for on-edge medical diagnostics by experimenting with the Kvasir-Capsule image classification dataset, a large-scale image dataset of gastrointestinal diseases. Quantization techniques made available through TensorFlow Lite (TFLite), including post-training float-16 (F16) quantization and quantization-aware training (QAT), are applied to achieve reductions in model size, without compromising performance. The seven ViT models selected for this study are EfficientFormerV2S2, EfficientViT_B0, EfficientViT_M4, MobileViT_V2_050, MobileViT_V2_100, MobileViT_V2_175, and RepViT_M11. Three metrics are considered when analyzing a model: (i) F1-score, (ii) model size, and (iii) performance-to-size ratio, where performance is the F1-score and size is the model size in megabytes (MB). In terms of F1-score, we show that MobileViT_V2_175 with F16 quantization outperforms all other models with an F1-score of 0.9534. On the other hand, MobileViT_V2_050 trained using QAT was scaled down to a model size of 1.70 MB, making it the smallest model amongst the variations this paper examined. MobileViT_V2_050 also achieved the highest performance-to-size ratio of 41.25. Despite preferring smaller models for latency and memory concerns, medical diagnostics cannot afford poor-performing models. We conclude that MobileViT_V2_175 with F16 quantization is our best-performing model, with a small size of 27.47 MB, providing a benchmark for lightweight models on the Kvasir-Capsule dataset.

1. Introduction

The use of medical datasets for training image classification models has been in constant growth ever since the introduction of large-scale neural networks [1], aided by advancements in hardware and computing. Although increasing model performance traditionally comes with the cost of higher complexities, different applications led to the creation of frameworks designed to implement lightweight models that maintain high performance. One well-used framework is the TensorFlow Lite (TFLite) framework, built on the TensorFlow (TF) software library for machine learning [2].
Correct predictions in neural network (NN) models are critical, especially within the medical domain. Maintaining high classification performance without human intervention remains of utmost importance, as incorrect classification could be a matter of life or death for a patient [3]. As a result, models tend to be both large (in terms of size and parameters) and complex [4]. Given recent advancements in image classification tasks particularly based on transformer architectures, this paper explores the downsizing of vision transformer (ViT)-based models for the sake of easy on-hand deployment, broadening the applications and potential implementations of medical image classifiers, whilst attempting to retain the respective performance metrics. In particular, our study aims at using state-of-the-art ViT-based classifiers designed for implementation on edge devices and studying their performance—a task that currently has little exploration in the medical domain given the novelty of ViTs, introduced only in 2021 [5].
Given the lack of explainability in deep learning models as a whole, neural network classifiers tend to suffer from large memory allocations and a significantly greater number of weights. This makes them a rather unfavorable approach for on-device deployment, especially as far as edge devices are concerned [6]. With the growing applications of classifiers for a variety of medical-domain applications in edge devices, quantization has emerged as an extremely fast-growing area of research that dates back to 2015 [7]. Although quantization as a concept can be approached in many ways, the two main types are post-training quantization and training-aware quantization models. In this study, we aim to focus on two techniques for quantization: float-16 (F16) quantization (a post-training technique) and quantization-aware training (QAT) [8].
Specifically, we present our findings using the Kvasir-Capsule [9] dataset, a large-scale image dataset collected from medical wireless capsule endoscopies (WCEs). Kvasir-Capsule has been curated and is focused on classifying gastrointestinal anomalies along the digestive tract. By doing so, we aim to develop quantized models using TFLite to compare the performance pre- and post-quantization, giving us a good overview of how “small” a model can be before the performance is deemed less than adequate. As evident within the literature that will be presented, there are currently no known TFLite implementations of ViTs on Kvasir-Capsule, which is where the novelty of this paper is highlighted best.
The main contributions of this study can be summarized as follows:
  • Conduct a comprehensive evaluation of several state-of-the-art transformer-based CNN architectures specifically built for on-hand deployment on the Kvasir-Capsule dataset, namely, EfficientViT, MobileViT, EfficientFormer, and RepViT;
  • Compare model performance based on different quantization methods available within the TFLite framework, namely, F16 quantization and QAT.
The remainder of this paper is structured as follows: We begin with Section 2, examining the literature in the field, specifically looking at classification models trained on the Kvasir-Capsule dataset. Section 3 gives more context on the dataset, the models chosen, and the methodology used in the paper, whilst Section 4 presents our findings, divided into the performance metrics of the models in general and then the metrics of the model deployed on phones. We conclude with future works and limitations faced.

2. Literature Review

Introduced in 2017 by Vaswani et al. [10], transformers were considered a breakthrough in deep learning with their sole reliance on attention mechanisms and significant improvement in training time. They were mainly utilized for Natural Language Processing (NLP) tasks, before Dosovitskiy et al. [5] introduced ViTs in 2021. An image is processed as a sequence of patches from a transformer encoder, similar to NLP, which significantly outperforms state-of-the-art models in both accuracy and resources. Wang et al. [11] studied the performance of transformers on mobile devices by comparing lightweight CNNs (including MobileNetV2 [12] and EfficientNetB0 [13]) and various lite and large transformers. Despite concluding that lite transformers tend to perform very similarly to lightweight CNNs in terms of overall memory footprint, inference latency, and energy consumption, the authors concluded that models with a hybrid CNN–transformer architecture are very promising for on-edge deployment, which is explored in this study. This section explores the use of ViTs in classifying gastrointestinal diseases from the Kvasir-Capsule dataset, along with the possibility of deploying ViT classifiers on edge devices for medical diagnostics.

2.1. Kvasir-Capsule

Created in 2020 and having been updated in 2022, the Kvasir-Capsule dataset remains one of the only comprehensive wireless capsule endoscopy (WCE) datasets available on an open-access basis [9]. This dataset builds on similar datasets available within the field, such as Kvasir [14] and HyperKvasir [15]. Most of the works using this dataset have been conducted between 2022 and now—the majority of which focus on image and video classification, with a few branching beyond into novel methods in deep learning. In Varam and colleagues’ work published in 2023, the authors explored the use of the Kvasir-Capsule WCE dataset for image classification and built further on it by adding an Explainable AI (XAI) aspect [16]. The authors began with an analysis of multiple transfer learning architectures, including InceptionV3, EfficientNet, VGG16, VGG19, Vision Transformer (ViT), ResNet152v2, and MobileNetV3Large. Interestingly, MobileNetV3Large appears to have performed exceptionally well with an average F1-score of 0.95 ± 0.02 across 10-fold validation. Given the robustness of the model and its intended uses being specifically for on-hand deployment, it is interesting that it performs so well compared to more expansive models such as the VGG-19 architecture (with 143.7 M parameters) [17].
More recent studies on the Kvasir-Capsule dataset include the 2024 study conducted by Oukdach and colleagues [18]. The authors here present a novel framework combining global and local features for learning. The authors first pre-processed the dataset and made it into a binary classification problem, with 3490 images in the abnormal class. The Foreign Body and Ampulla of Vater classes were excluded from the dataset, and the Normal class was down-sampled to 3500 images. This method first uses a ViT model for feature extraction and then combines that with a CNN that uses attention to retrieve the “attention features” of the image. Both these features are then fused and fed into an MLP classifier for classification. In comparison to other methods, the authors report a significantly higher F1-score than that of traditional CNN-based or ViT-based models, boasting an accuracy of 0.97 and an F1-score of 0.97 as well. It is important to note that the majority of recent developments for classification pertain to introducing novel architectures or frameworks within the scope of the medical field. For example, Qu et al. [19] focused on addressing the issue of imbalanced medical datasets. In this work, the authors proposed cross-balanced pseudo-supervision for classification, which was then tested on the Kvasir-Capsule dataset (among others). Using only 20 % of the labeled data (on the full dataset), the authors reported an F1-score of 0.9512 using their method. These results are summarized in Table 1.

2.2. On-Edge Deployment for Medical Diagnostics

When exploring the medical field, we can look at the advancements and incorporations of lightweight models (such as those developed with TFLite) to the Internet of Medical Things (IoMT)—an emerging field with significant benefits both in terms of inference efficiency and diagnosis [20]. In [21], Gupta and colleagues worked on developing a lightweight TFLite-based model for auto-classifying histopathological images [22]. The authors use post-training quantization on their model, ReducedFireNet, which compresses the weights of the network after it has been trained. ReducedFireNet has been designed for implementation on IoMT devices, posing several advantages compared to larger models. The key benefits are the high F1-score (reporting an average F1-score of 0.9680 ) and the model’s significantly smaller size. Comprising only around 21,000 parameters, the model comes in at a size of 0.391 MB, highlighting its versatile deployability. Shreya et al. [23] worked on detecting COVID-19 from chest X-ray images [24]. Deploying their model on an ARM Mali GPU and developing an Android application to supplement their propositions, the authors introduced the DDSM++ model, inspired by the DenseNet121 architecture. Their TFLite-quantized models, F16, were reported to have a 30% reduction in inference time post-quantization, whilst their accuracies when trained on a COVID-19 X-ray image dataset dropped by only around 5 % . The accuracy of the full model, FG32, was reported as 0.9847 , with FG16 clocking in at 0.93556 . Despite the drop, it is evident that the model still performs comparatively well in post-quantization.
More recently, Aldamani et al. [25] proposed a mobile application called “LungVision”, aiming to introduce the classification of respiratory diseases to on-edge applications using a publicly available dataset of lung X-rays [26]. The authors experimented with six different neural networks and four different quantization techniques. They showed how QAT is the best optimization approach, with an average of 75.59% reduction in model size. Integer quantization, however, improved inference time by 1.4 s more than other quantization methods. For their mobile application, the authors chose to deploy EfficientNetV2B2, trained using QAT, as it outperformed all other experiments with an F1-score of 97.51% in classifying respiratory diseases and a model size of 9.9 MB. These results are summarized in Table 2.
The previous few papers work towards displaying the merit of using TFLite for image classification in the medical domain. We can see the benefits of these lighter-weight models, which can perform comparably to full-scaled models. Since no research has been conducted specifically on our proposed datasets, this leaves us with an avenue for conducting further research.

3. Proposed System Architecture

Figure 1 demonstrates the system model used in this study. We begin by taking the raw labeled images from the dataset and pre-processing them, which mainly comes in the form of selecting classes and undersampling, similar to previous pre-processing performed in [16]. This only consists of normalizing the pixel-values between 0 and 1, which is a well-known, simple image pre-processing technique [27]. We then train several ViT-based classifiers specifically developed for mobile device applications on these data, as will be explained further in Section 3.2. These models will be further quantized based on the aforementioned quantization techniques. Upon evaluating the performance of these models, an appropriate model is chosen for deployment on a mobile device.

3.1. Dataset

The dataset chosen for this study is Kvasir-Capsule, a large gastrointestinal dataset containing 47,238 labeled images and 117 videos [9]. The dataset was compiled through endoscopy images collected during examinations at a Norwegian hospital. Sample images can be seen in Figure 2. The dataset consists of a total of 14 significantly imbalanced classes, as indicated in Table 3. Of the 47,238 images, 34,338 belong to one class (Normal Mucosa) while the smallest class contains only 10 (Ampulla of Vater). Imbalance this high needs to be addressed for optimal model training. As mentioned in Section 2, Qu et al. [19] were able to obtain great results with using only 20% of the Kvasir-Capsule dataset. Similarly, Varam et al. [16] only used the top 9 classes of Kvasir-Capsule and then continued to extract only 500 images from each class. Based on this, under-sampling techniques were applied in this work as well to address these highly imbalanced data. A training subset was created with a total 4500 images, with 500 images from each of the top 9 classes (Normal Clean Mucosa, Ileocecal Valve, Reduced Mucosal View, Pylorus, Angiectasia, Ulcer, Foreign Body, Lymphangiectasia, and Erosion), as seen in Table 3.

3.2. Neural Network Architectures

In total, seven base models were chosen for this work: EfficientFormerV2S2 [28], EfficientViT_B0 [29], EfficientViT_M4 [30], MobileViT_V2_050 [31], MobileViT_V2_100 [31], MobileViT_V2_175 [31], and RepViT_M11 [32], all made available in the Keras package [33]. Each model was quantized for on-edge classification using two different quantization techniques, further explained in Section 3.3. Experimentally, we devised the classification layers and tuned the hyper-parameters, as seen in Figure 3 below. Afterward, the feature extractor layers from the ViT-based CNN architecture, a global average pooling layer, a dense layer consisting of 1024 nodes, and a dropout layer with a value of 0.3 were applied. Finally, a dense layer for classification consisting of 9 nodes was applied, corresponding to the 9 classes. We used a learning rate of 1 × 10 4 . The rest of this section briefly explains and justifies the architectures chosen for classifying gastrointestinal diseases, along with a summary in Table 4.

3.2.1. EfficientFormerV2

EfficientFormer [34] was designed specifically for image classification tasks, aiming to run faster than MobileNet models but maintain small sizes. EfficientFormer achieves that by using CNNs to capture local features, followed by transformer blocks capturing global ones. This allows for results that balance between size, latency, and performance. EfficientFormerV2 [28] was then introduced with a more fine-grained joint search strategy that saves hardware resources, significantly improving latency. Four versions of EfficientFormerV2 exist: EfficientFormerV2-S0, EfficientFormerV2-S1, EfficientFormerV2-S2, and EfficientFormerV2-L. EfficientFormerV2-S2 was chosen as it performs better than EfficientFormerV2-S0 and EfficientFormerV2-S1 without compromising latency and size the way EfficientFormerV2-L does [28].

3.2.2. EfficientViT

EfficientViT [29] was designed for efficient high-resolution dense prediction, where a lightweight attention module and hardware-efficient operations were introduced to improve latency without compromising performance. This is possible due to the architecture’s ability to prune unimportant connections in the attention layers, reducing computational complexity. This architecture is referred to as EfficientViT_B in the Keras package [33], and 7 different versions are available. Efficient_B0 was chosen for this paper as it is much smaller compared to the other 6 versions. EfficientViT_M [30] was introduced later with much more memory-efficient operations and cascaded group attention, making their inference time much quicker. One limitation, however, is that EfficientViT_M tends to be larger in size when compared to other state-of-the-art architectures due to the larger number of feed-forward networks. Similar to EfficientViT_B0, 6 different versions of EfficientViT_M are made available in the Keras package [33]. EfficientViT_M4 was chosen as it performs relatively better than the other versions, without being too large.

3.2.3. MobileViT

MobileViT [35] was built by incorporating MobileNet CNN blocks, followed by lightweight vision transformer blocks that capture global features. This architecture allows for a balance between performance and efficiency. MobileViT_V2 [31] was then introduced to tackle the computational bottleneck present in the multi-headed self-attention layer in MobileViTs with quadratic complexity. By replacing the multi-headed self-attention layer with a separable self-attention layer with linear complexity, MobileViT_V2 proves to be a great choice for deployment in devices with constrained hardware resources. Out of the various versions of MobileViT_V2 available in the Keras package [33], MobileViT_V2_050, MobileViT_V2_100, and MobileViT_V2_175 were chosen for this experiment.

3.2.4. RepViT

RepViT [32] aimed to enhance lightweight CNNs by utilizing the architectural design of ViTs. The layers in RepViT are reparametrizable, meaning the parameters are reconfigured during inference for better efficiency. This is key as it reduces the computational load on edge devices with limited computational resources. RepViT_M11 was chosen for this work as it provides a balance between size and latency compared to the other 4 versions of RepVit.

3.3. Quantization for On-Edge Classification

The TFLite framework stands out in its ability to handle latency, privacy, connectivity, size, and power consumption constraints [2]. This is especially useful when deploying deep learning models on devices that are usually incapable of handling such complex architectures. Quantization is one of the more popular approaches to optimize a model for deployment, along with pruning and clustering that mainly aim for easily compressible models [36]. Size and latency are optimized through quantization, with some loss of model accuracy. A summary of the two types of quantization chosen for this work can be seen in Table 5. Once a model is trained and converted to TFLite format, it is typically saved in floating-point 32 precision. Post-training F16 quantization then converts the model weights to floating-point 16 format, reducing the model size and allowing for faster, more efficient operations that reduce inference time. QAT [8], however, is a more advanced approach that adjusts model weights to lower precision only when needed during the training phase, not after. This reduces model size whilst still retaining its performance.

3.4. Evaluation Metrics

Three main evaluation metrics are used in this paper to analyze and compare models: F1-score, average inference time per image, and performance-to-size ratio. F1-score, shown in Equation (1), measures how well a model can predict both positive and negative classes as a function of both precision and recall. It is usually preferred as it provides a much better indicator of model performance than other numerical metrics.
F 1 - Score = 2 × Precision + Recall Precision × Recall
Performance-to-size ratio, shown in Equation (2), is a value calculated to better estimate the trade-off between F1-score and model size, similar to the metric used in [25]. The better the performance and the smaller the size, the higher the ratio. We will be using this value to help in deciding the optimal model for deployment on edge devices.
Performance - to - size ratio = F 1 - Score Size
In addition, various visuals are provided to better compare and evaluate the presented models, including bar graphs and confusion matrices.

4. Results and Discussion

In this section, we will outline the results of training the models with the proposed architectures and quantization techniques for on-edge classification. We will begin with an examination of the actual performance of the models on testing data and then look at the sizes of the different models before and after quantization. We will combine the two (i.e., F1-score and size) to obtain a better understanding of how well a model performs relative to its size. This is achieved by a simple performance-to-size ratio. Based on the various analyses conducted in this section, we select a model that works best for on-edge deployment. This model will also go into further analysis by considering its performance by running inference on a normal CPU, imitating on-edge devices. This is needed as ViT operators are poorly supported in the current existing TFLite development frameworks [11]. Based on the performance of some models, several versions of the same architecture are used to attempt to obtain a better performance-to-size ratio.
The general consensus across all models, architectures, and quantizations for on-edge classification is that models are faster in terms of inference time and smaller in terms of the actual size in memory, following extensive literature attesting their performance [37]. However, the performance of each model varies, which will be analyzed in the following subsections.

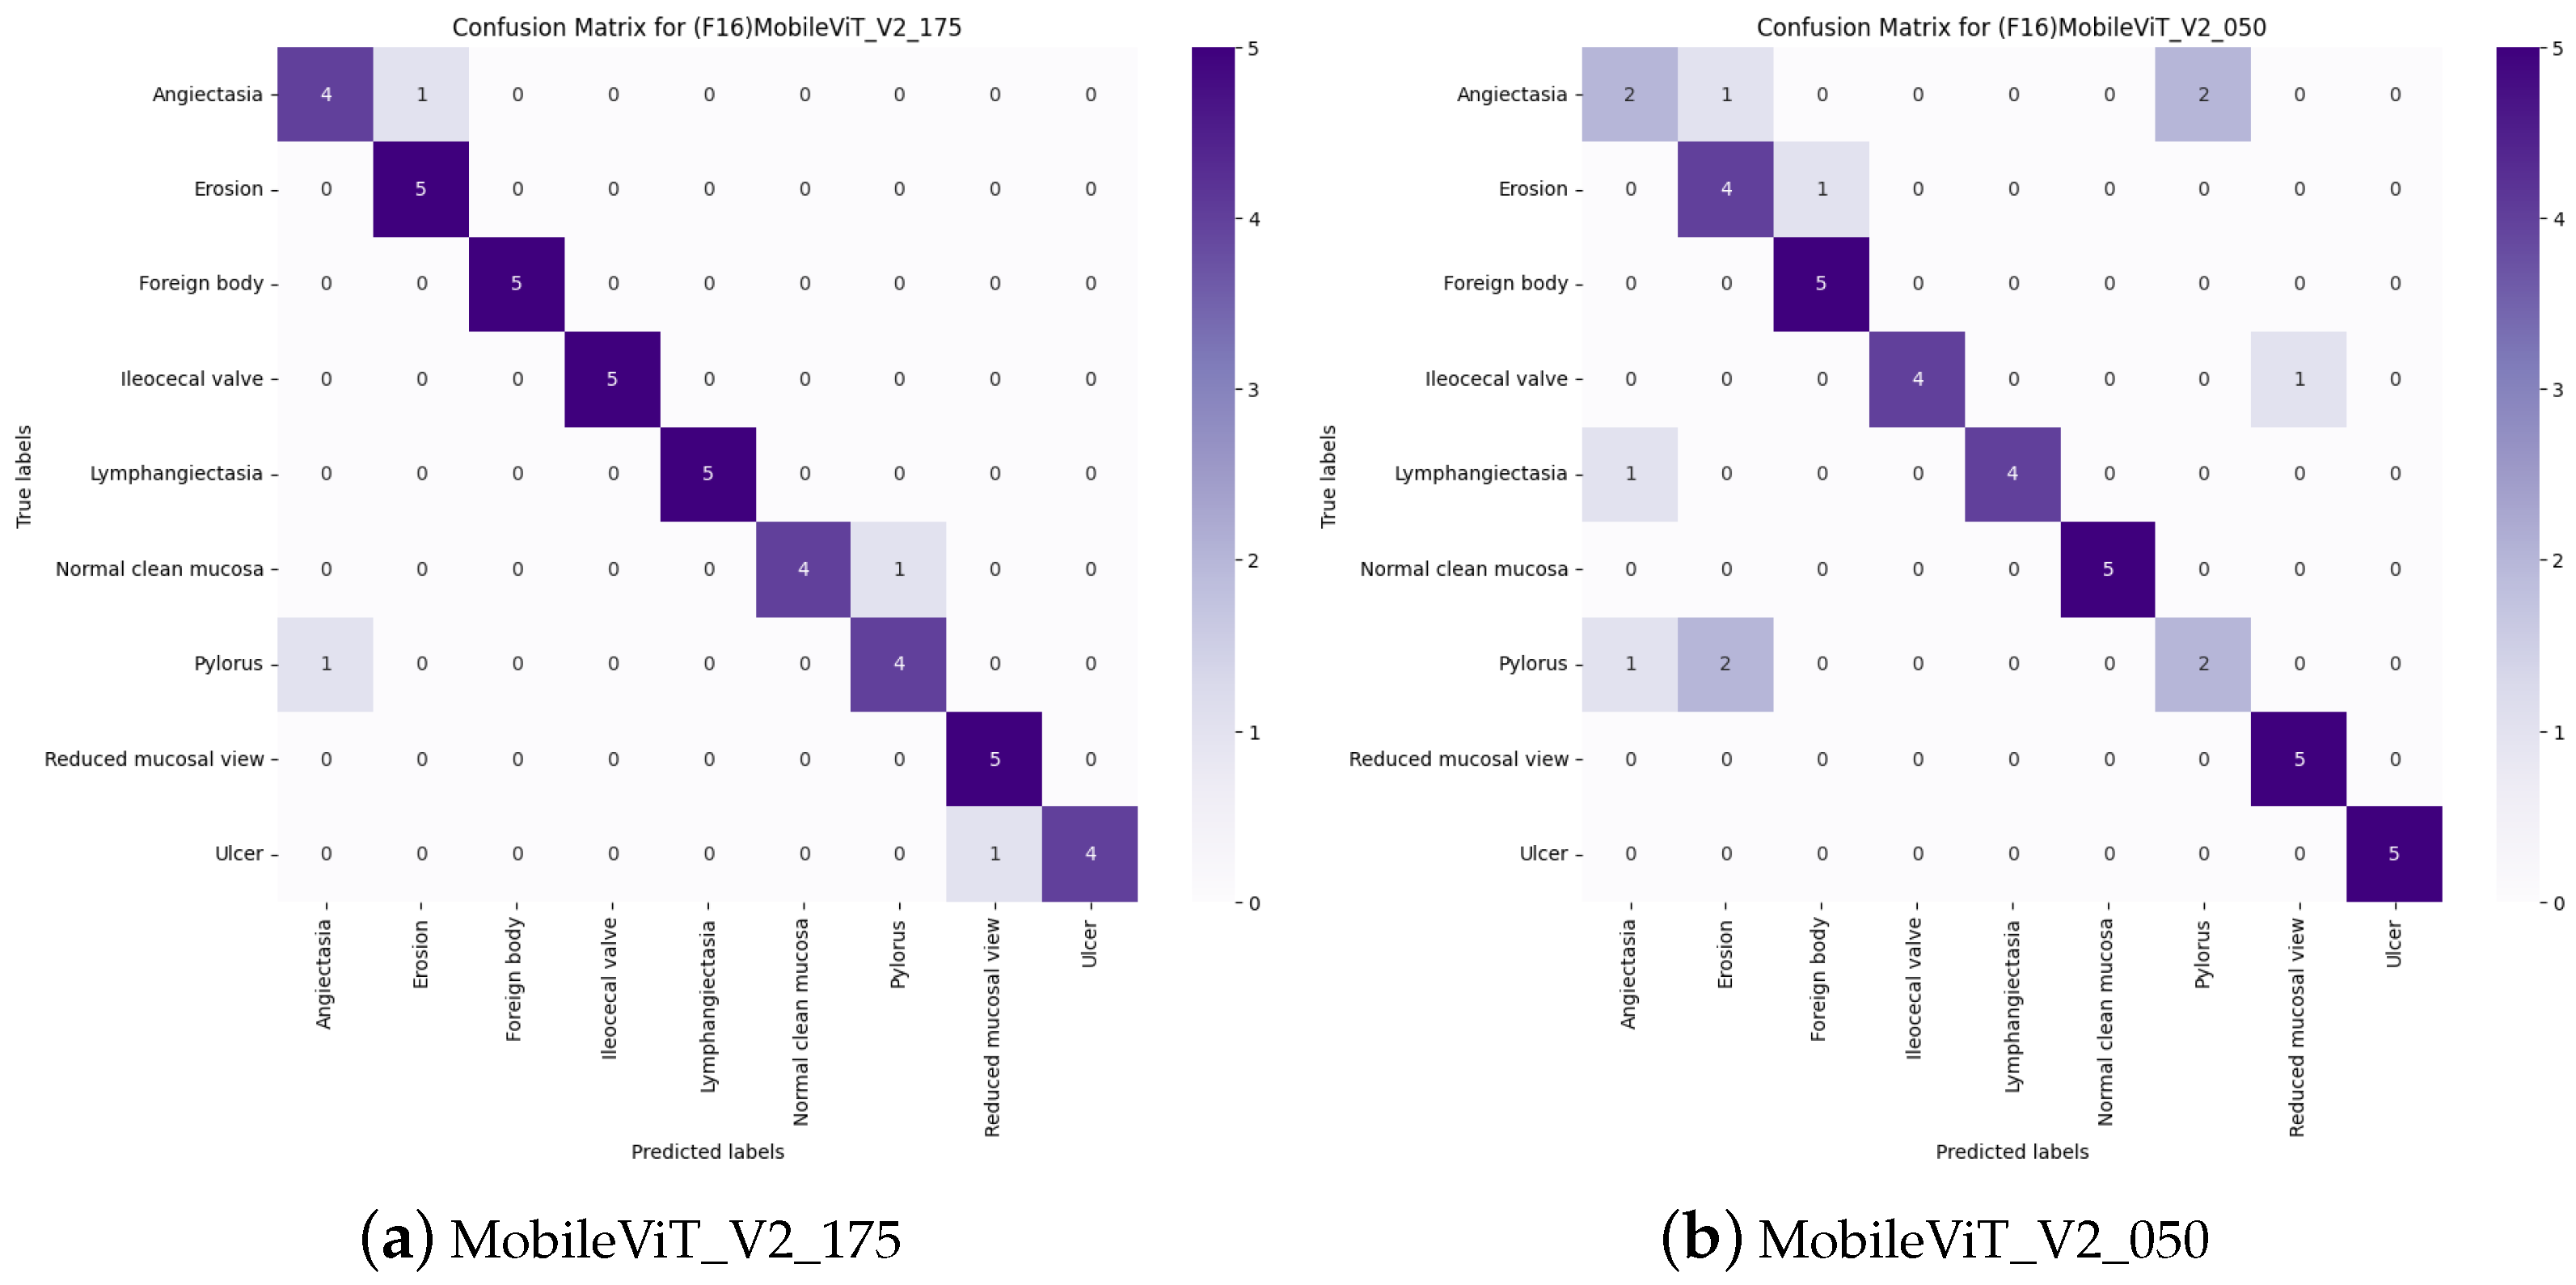
4.1. Model Evaluation

4.1.1. Model F1-Scores

Figure 4 demonstrates the performance of each of the models in terms of the F1-score based on the architecture and quantization types used. Note that the F32 model is the base .tflite model without any quantization applied.
We can see that across the board, there seems to be a drop in the performance of the model as we quantize the model, with the QAT generally performing the worst on the set of testing data. To demonstrate this as a table, we can look at Table 6, which conveys the same information. Percentages highlighted on each row represent the best-performing model.
Looking at the numbers more specifically from the table, we can more categorically identify the weak performance of QAT models. In many cases, however, the F16 quantized model results are comparable to those of the F32 models. This can be seen in MobileViT_ViT_100 and MobileViT_ViT_175. As one final visual representation, the performance of each model in terms of the F1-score is included in Figure 5 with a bar chart.
It is evident that the best-performing model based purely on the F1-score is the MobileViT_V2_175 model, but we will further analyze its performance by considering the size of the models as well. We have set a general bound of 0.9000 on the graph for easier visualization of models that perform well on testing data.

4.1.2. Model Sizes

Table 7 compares the models, the respective quantization technique, and the corresponding sizes in MB. The smallest quantization technique in each model has been highlighted for easier legibility.
Across all seven models, the quantization technique that reduces the model size the most is the QAT method. Table 8 shows the percentage of the original (F32 model) size that each of the other quantization techniques is scaled down to. Once again, it is evident that QAT performs the best in terms of reducing the scale of the model’s size.
Figure 6 presents a similar visualization to Figure 5, where we can see the drop in the size of the model via bar charts. Here, we use a threshold of 30 MB to indicate a generally “small” model.

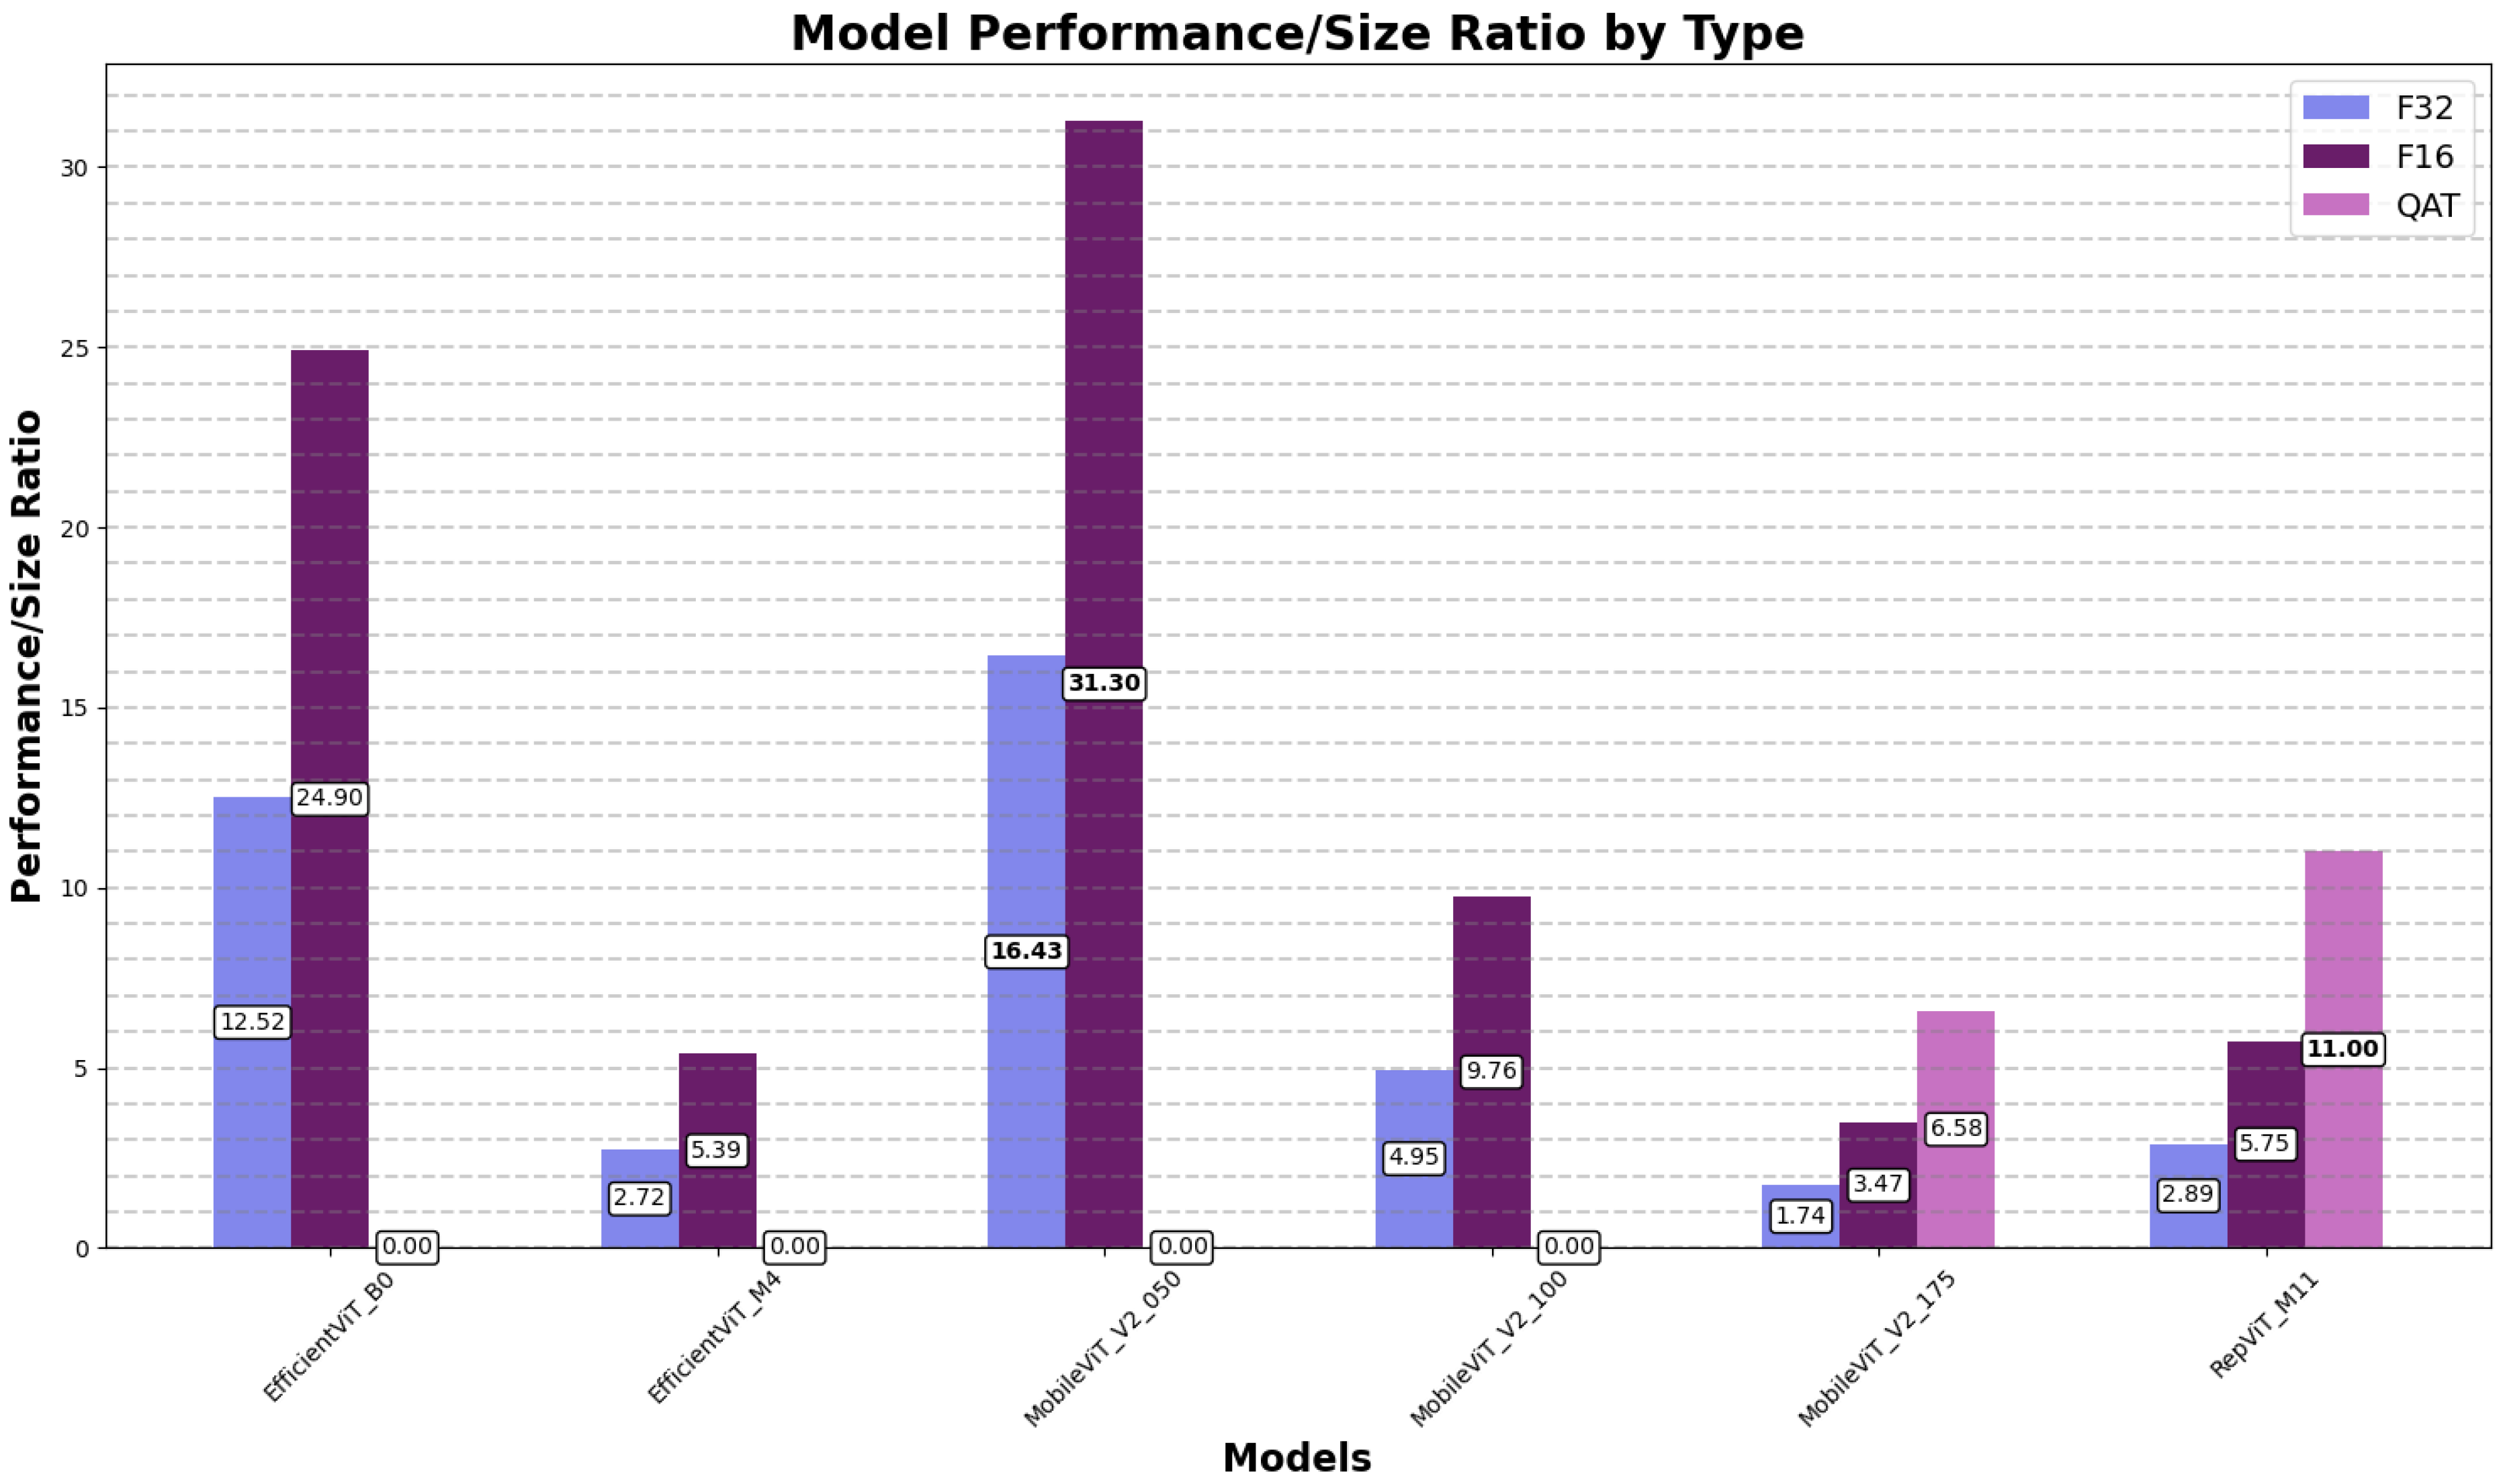
4.1.3. Model Performance-to-Size Ratios

To combine the results of the previous two subsections, we can now evaluate the models in terms of the ratio between their F1-scores and sizes, presented in Table 9. This will give us insight into how well a model performs despite the size reduction and allow us to choose which model would be most optimal for deployment on the mobile device. Higher F1-scores and lower model size provide a higher ratio, which is preferred in the context of this work.
Figure 7 indicates that the model and quantization technique with the best ratio is the MobileViT_V2_050 model using F16 quantization. Upon further investigation, we can see that the model’s size is only 2.89 MB (as opposed to the original 5.50 MB), which is an extremely small model given its function and complexity. This points us in the direction of model efficiency, given that the model can classify images despite using a significantly smaller memory allocation. It is quite quickly evident, however, that the model’s F1-score of only 0.9033 makes it relatively unreliable, especially given the medical domain that our study delves into.
One observation to be made is that the more complex the model is, the better it can classify between each of the nine classes extracted from the dataset. In particular, MobileViT_V2_175 is the best-performing model on average across all quantization types, with a peak performance of 0.9534 for the F16 quantized model. This happens to also be the biggest model of all F16 quantizations, further solidifying the fact that model size generally corresponds to performance in ViT-based classifiers. Regardless, we can also see that the F16 quantized model performs comparably to the F32 default model despite being around half the size. Given that the F16 quantized MobileViT_V2_175 is still only around 27 MB, this makes it a reasonable candidate for deployment on edge devices, although the inference time is expected to be higher given this size difference to other models.
Given that there are currently no implementations of quantized ViT-based classifiers for the Kvasir-Capsule dataset in the literature, these results indicate a promising area of exploration pertaining to small-scaled transformer-based models for medical image classification. It should also be noted that the images used for almost all models were rescaled to be 224 × 224 pixels, although in the case of all versions of MobileViT_V2 they were set to 256 × 256 as per the implementation by Apple [31]. This means that images would have to be pre-processed in a different manner altogether should we implement it on a hand-held device, which can be performed by adding zero paddings to the images with a depth of 16 pixels.
The degradation in performance across different quantization techniques can be credited to the reduced model complexity. However, QAT—through re-training—on average displays the lowest drop in performance. Since it is not a post-training quantization technique, we can better understand the impact of losing information in a model in terms of the weight data. In terms of QAT, MobileViT_V2_175 performed best with an F1-score of 0.9442 at 14.36 MB, and RepViT_M11 performed second best with an F1-score of 0.9311 at 8.46 MB. The marginal difference in performance, despite being only around 58.9 % the size of MobileViT_V2_175, highlights a key benefit of using RepViT_M11.
It is worth noting that no previous work was conducted on Kvasir-Capsule specifically for on-edge classification; therefore, the comparisons are not on fair grounds. Nonetheless, Table 10 attempts to compare our best-performing quantized model, MobileViT_V2_175, with the literature available on the Kvasir-Capsule dataset. Previous works have not reported model size, but we can estimate sizes based on the number of learnable parameters [38]. The authors in [16,18] both used ViTs in their work. The ViT base model amounts to 86 M parameters [5], whilst our base model only has 14.3 M parameters [33]. This allows us to assume model sizes that are at least 6 times larger than our model before quantization. The TNCB model, however, reported 12.2 M parameters, which is less than our MobileViT_V2_175 model. We cannot conclude that the TNCB model is larger than our model before quantization, but we can safely assume that it is larger than our F16 quantized model, which is almost half the size of our original model before quantization, as reported in Table 8.

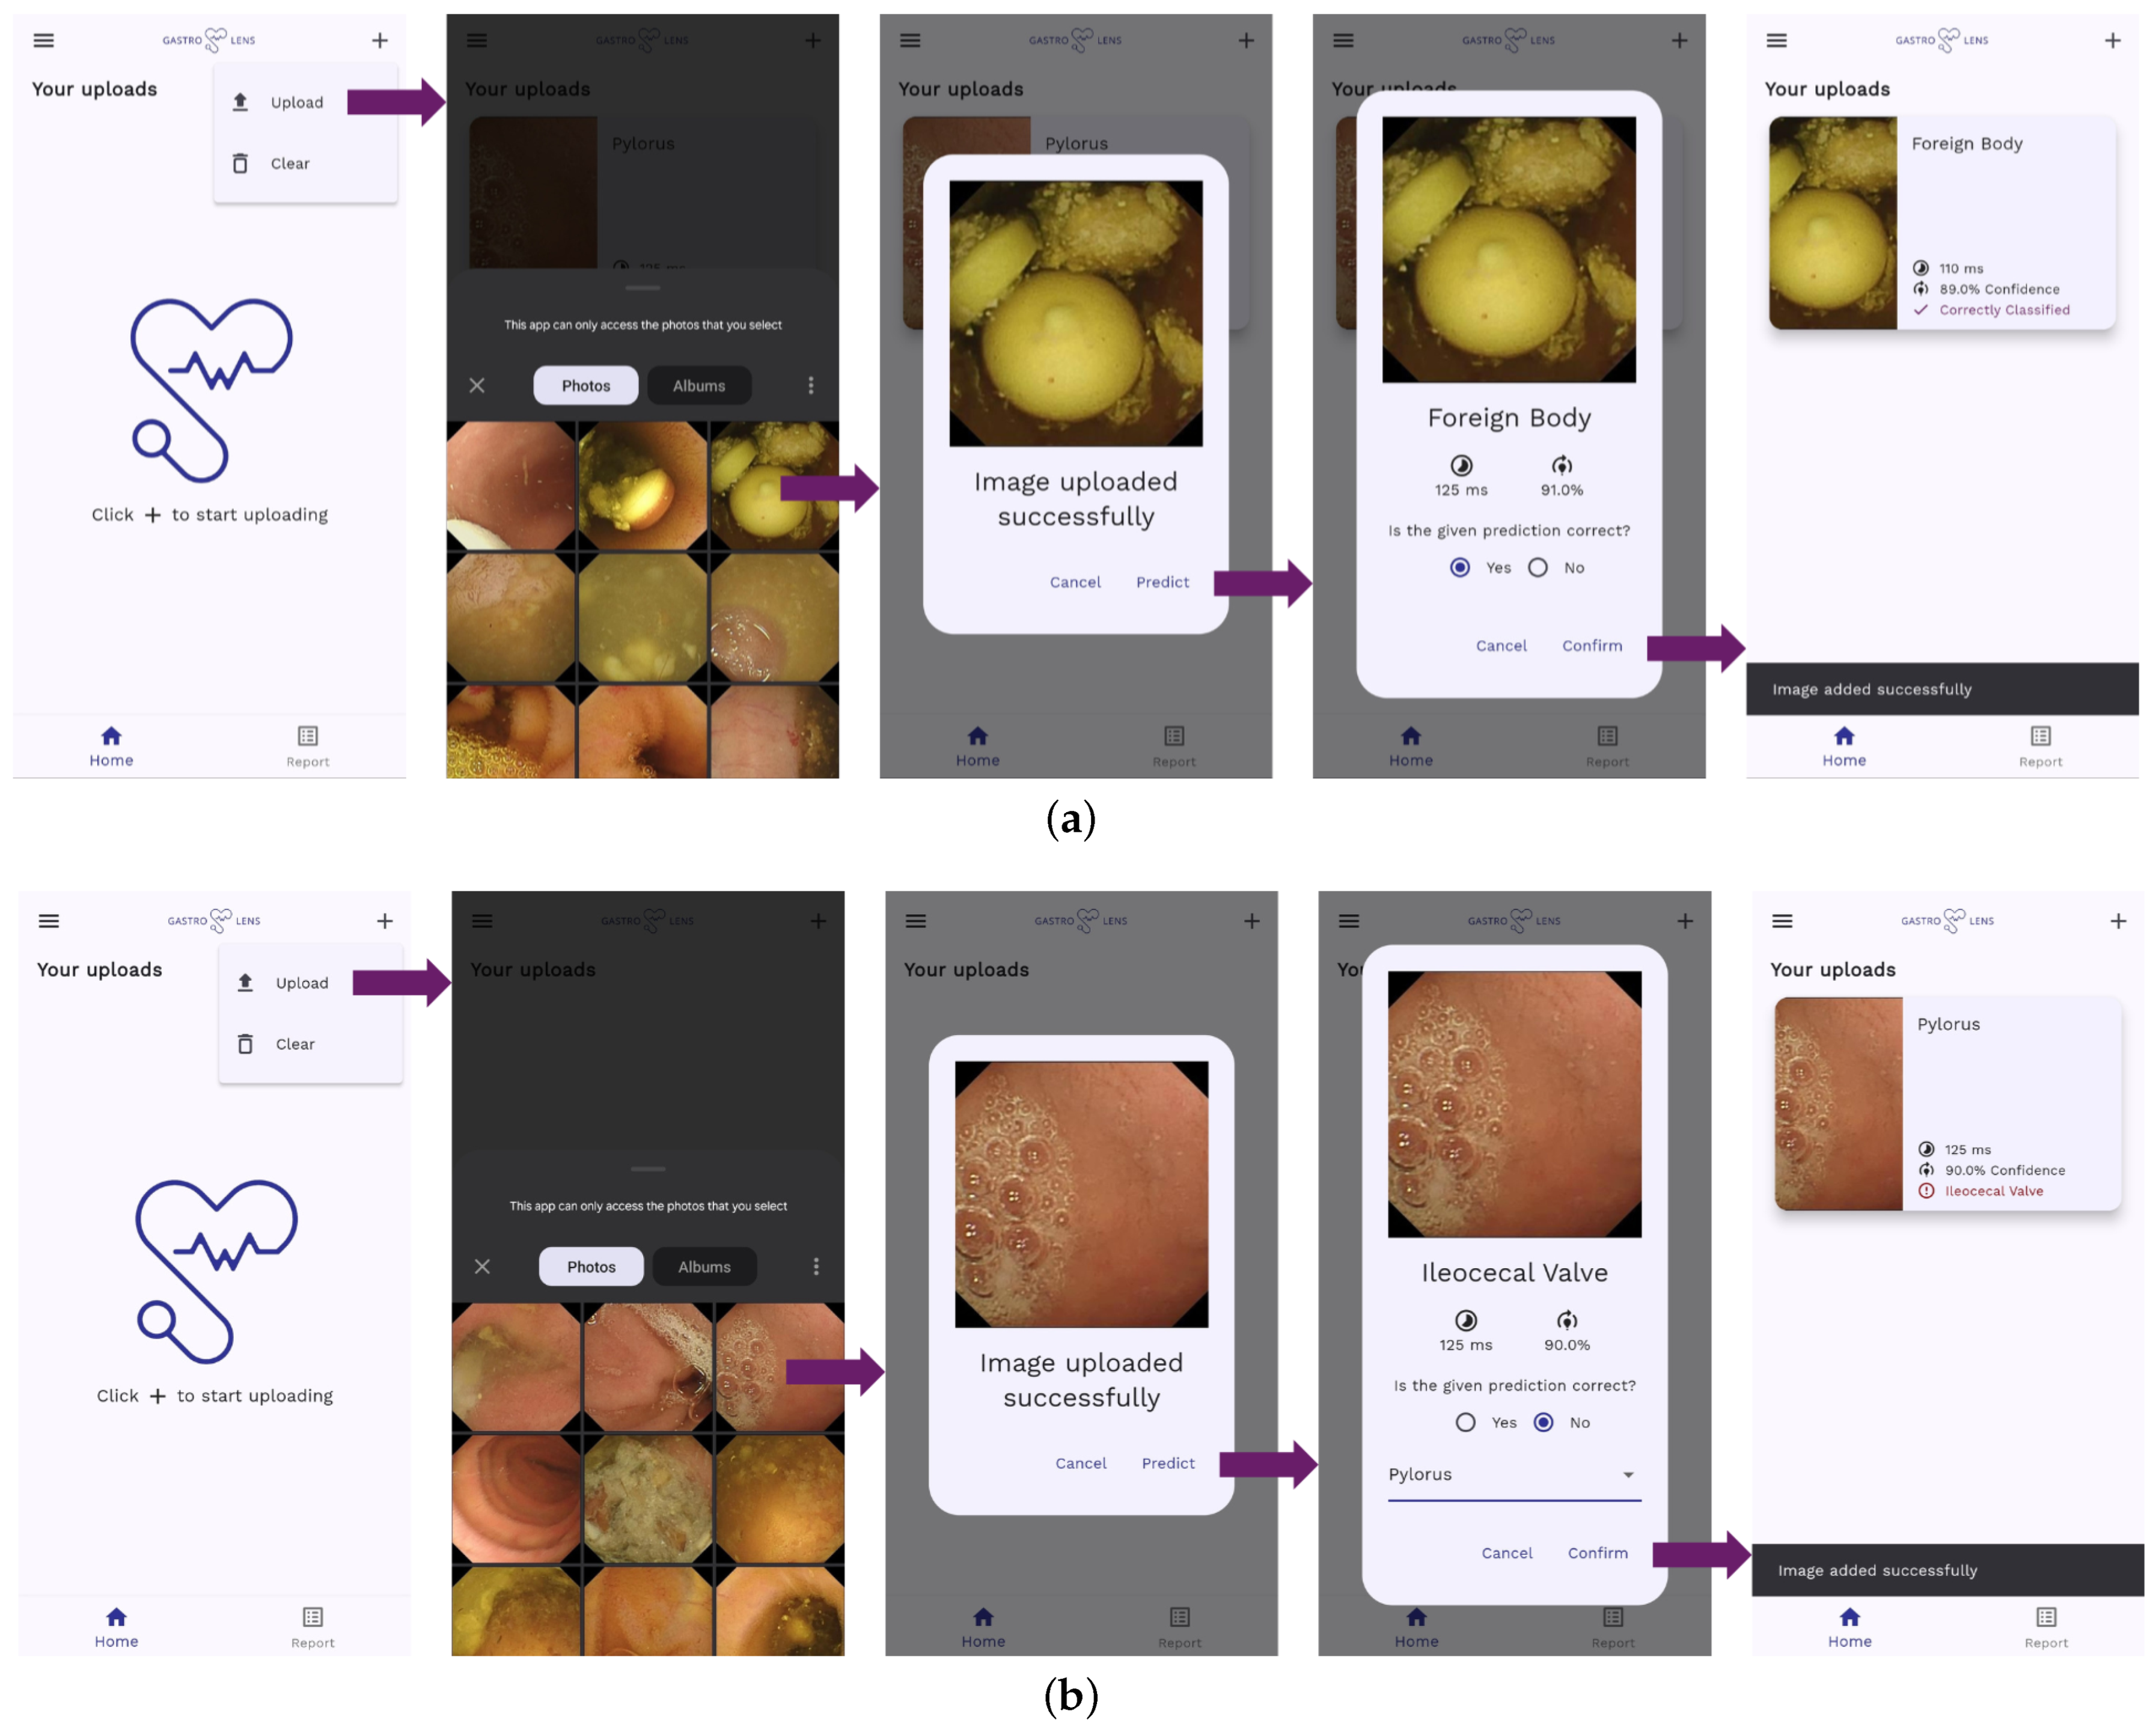
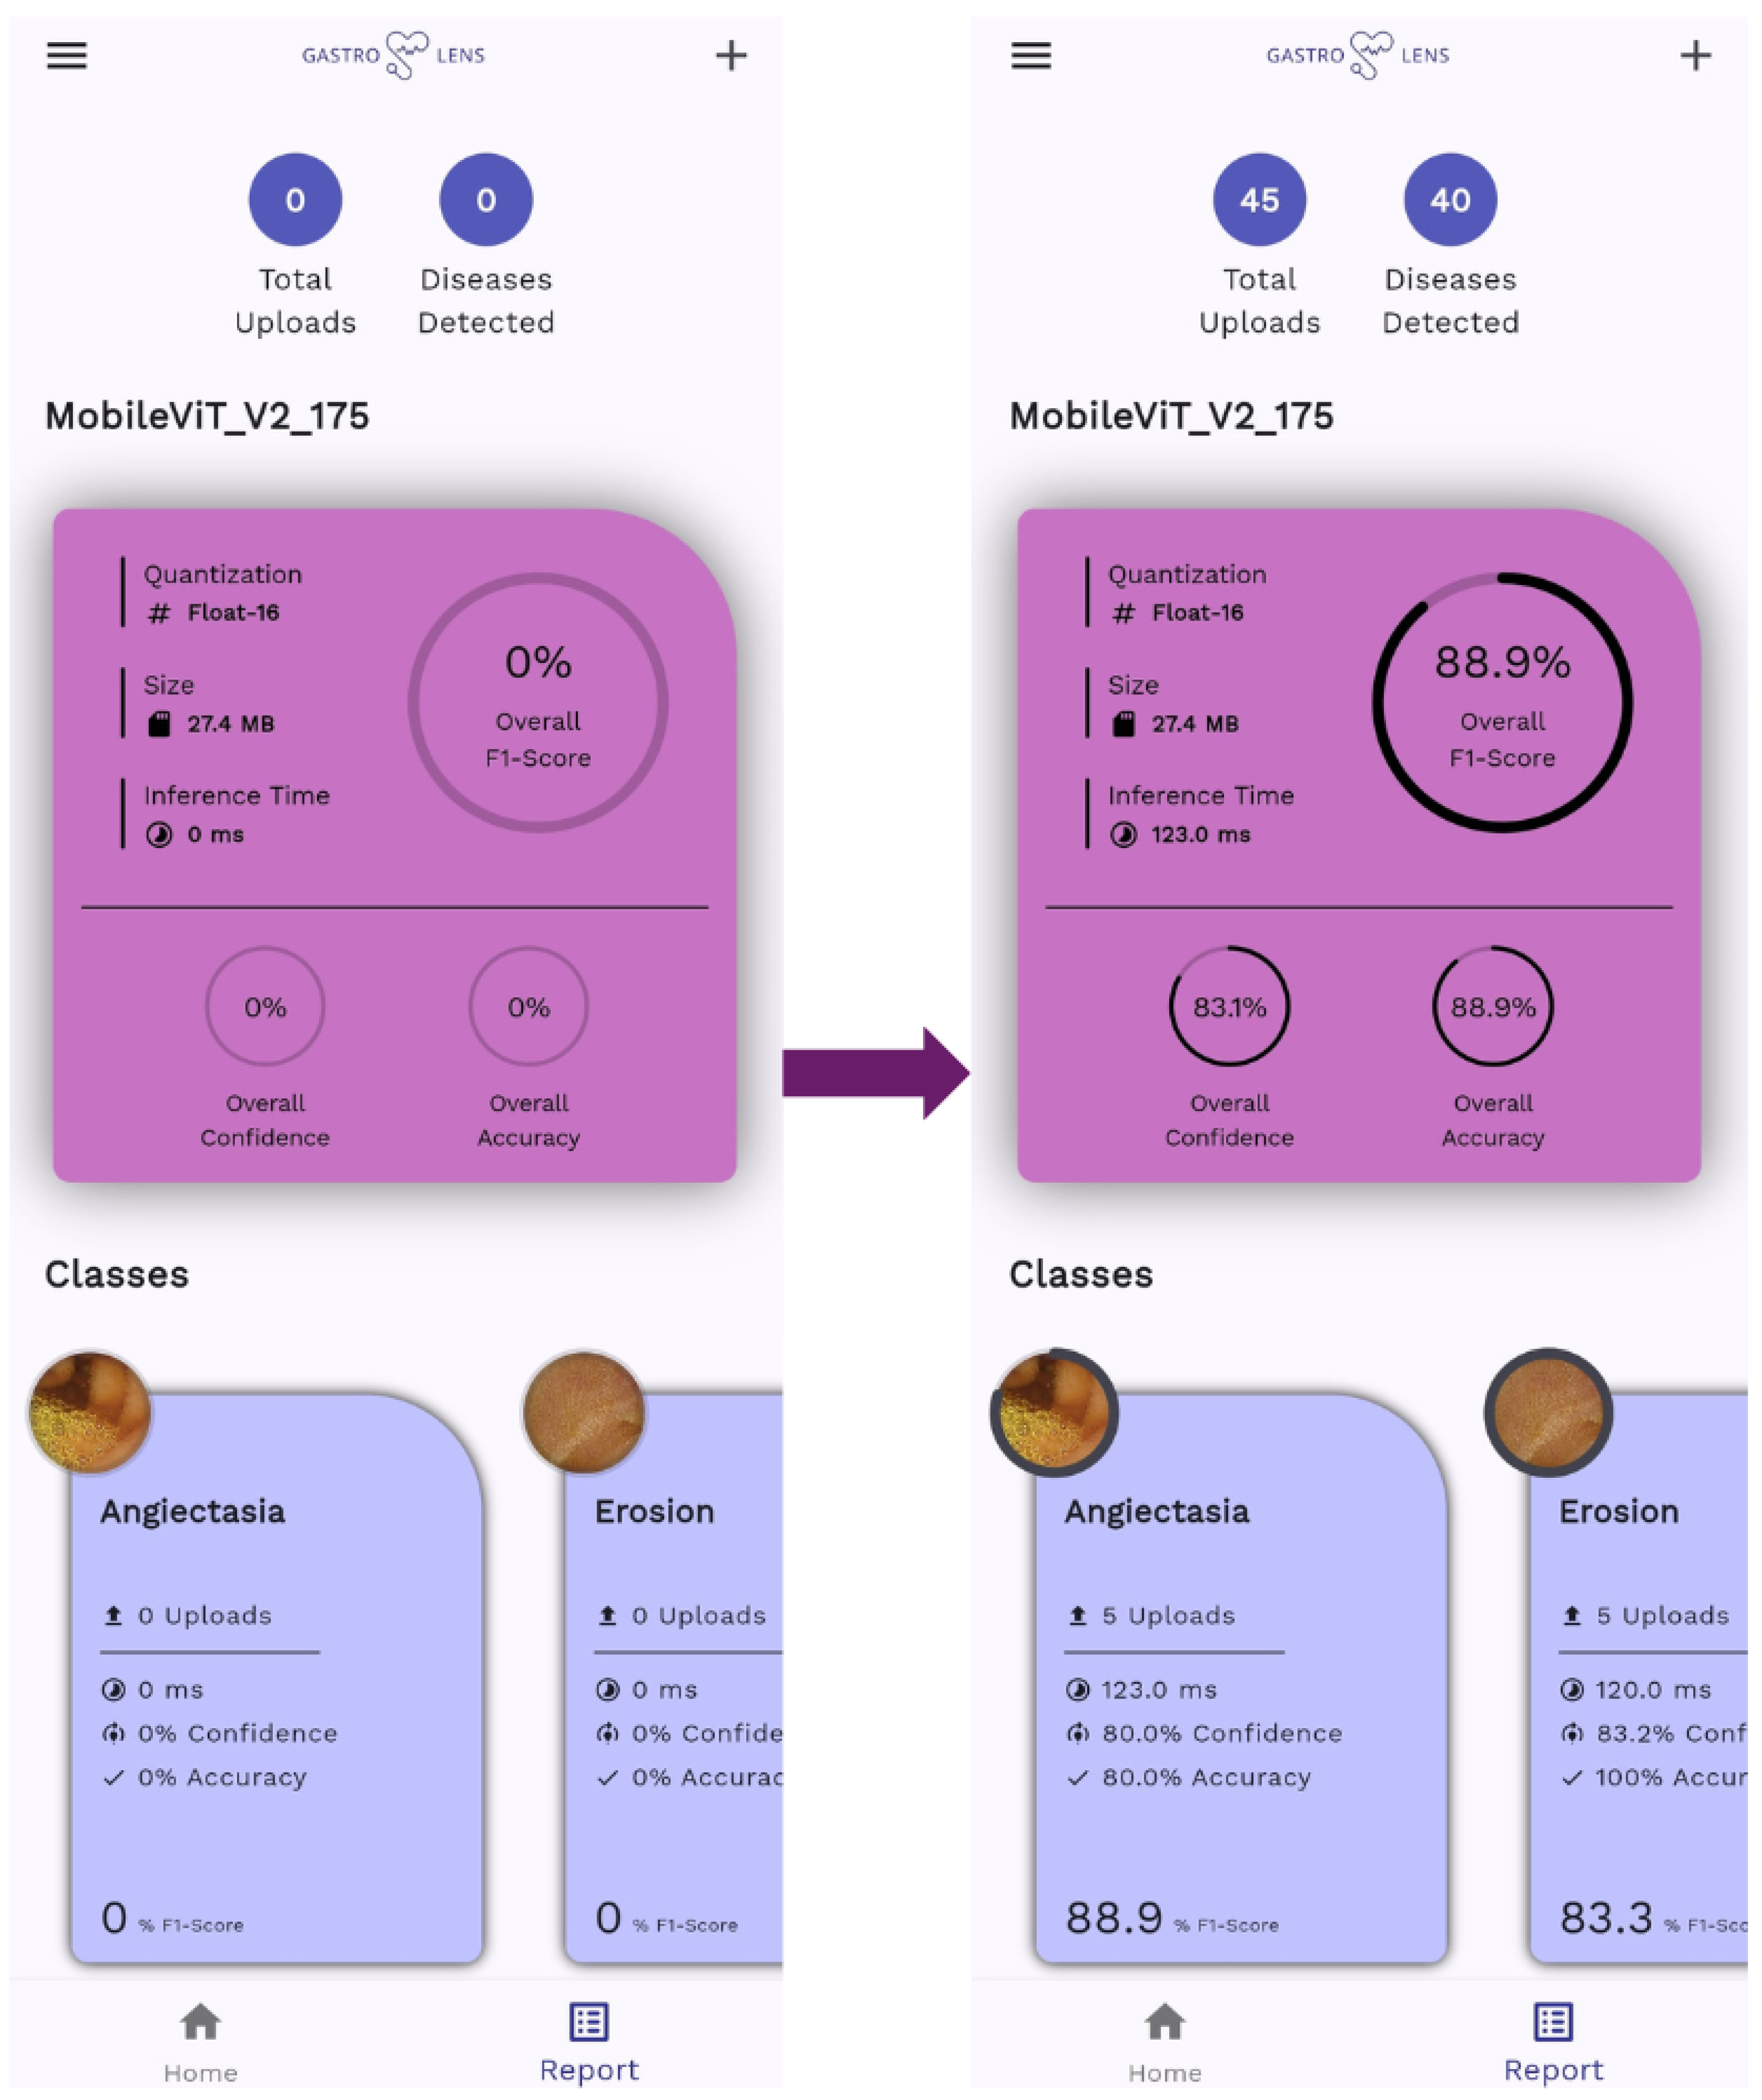
4.2. On-Edge Testing

Given the metrics presented here, we will be selecting the following two quantized models to analyze further through deploying on a CPU: MobileViT_V2_175 with F16 quantization (selected due to having the highest F1-score across all models and quantization types) and MobileViT_V2_050 with F16 quantization (selected due to having the best performance-to-size ratio with an F1-score above 0.90), as illustrated in Table 11. Once again, the models are tested on a CPU to mimic their performance on an on-edge device without GPU capabilities. Experiments were carried out on a CPU instead of an edge device due to the absence of Flutter packages compatible with vision transformers.
The two selected models were then tested using the CPU resources available on Google Colab, which uses an Intel(R) Xeon(R) CPU @ 2.20 GHz (Intel, Santa Clara, CA, USA), to mimic how they would perform on edge devices. Furthermore, mobile devices such as the Samsung Galaxy S24 use a Qualcomm Snapdragon 8 Gen. 3 processor (Samsung, Suwon-si, Republic of Korea), which is loosely comparable to the performance level of an Intel Core i7 processor, justifying why the models were tested on a CPU rather than a mobile device [11]. We will be considering the F1-score, average inference time per image, and the confusion matrix, giving us insight into how the model performs when considering the speed at which it predicts classes and how accurately it does so.
The models were tested on the same 45 images from the testing subset of Kvasir-Capsule, with 5 images taken from each class. F1-scores and average inference time per image were also generated for both models. Looking at Table 12, a significant difference in performance can be observed between the two F1-scores and inference times. The differences in performance can be better visualized in the confusion matrices generated in Figure 8, where MobileViT_V2_175 does a much better job at producing reliable results. MobileViT_V2_050, however, is able run inference that is around 9 times faster than MobileViT_V2_175. Considering the domain that this paper is tackling, accurate results would outweigh model size and latency. MobileViT_V2_175 is able to achieve that while maintaining a reasonable model size and inference time that would not be detrimental to the target edge device.

4.3. Performance on Other Datasets

As further proof of concept, we have adapted a similar paper to compare the performance of our ViT-based lightweight models to that of conventional CNNs. In particular, we will look at [25] and their use of the X-ray Lung Diseases dataset [26]. The dataset contains nine classes (similar to the work presented in this paper) and contains X-ray scans of patients for classifications of nine types of lung diseases.
Table 13 compares the best-performing model from [25] and our approach, showing that with the same quantization approach (QAT) on the same dataset, we are able to outperform what already exists in the literature simply with the introduction of lightweight ViT-based models. Although this paper is entirely based on the Kvasir-Capsule dataset, this works as a testament to the generalization of ViT-based models as lightweight classifiers for on-edge deployment.

5. Conclusions

This work studied the use of quantized ViT models for on-edge medical diagnostics, specifically focusing on the Kvasir-Capsule image classification dataset. The quantization techniques were leveraged using the TFLite framework, utilizing the float-16 and QAT quantization techniques to reduce model size without compromising performance.
In total, seven versions of ViT-based lightweight image classifiers were evaluated, namely, EfficientFormerV2S2, EfficientViT_B0, EfficientViT_M4, MobileViT_V2_050, MobileViT_V2_100, MobileViT_V2_175, and RepViT_M11. The evaluation was based on three metrics in particular, including the F1-score, the model size, and the performance-to-size ratio (dividing the F1-score by the size in MB). Our results indicated that MobileViT_V2_175 with F16 quantization achieved the highest F1-score of 0.9534 , making it the best-performing model. In contrast, MobileViT_V2_050 with QAT was the smallest model at 1.70 MB and had the highest performance-to-size ratio of 41.25 .
Despite tending towards smaller models to address latency and memory concerns, medical diagnostic systems cannot compromise performance. Therefore, MobileViT_V2_175 with F16 quantization, with a size of 27.47 MB, is recommended for deployment on edge devices, providing an optimal balance between size and performance. This study sets a benchmark for lightweight models on the Kvasir-Capsule dataset and highlights the potential of quantized ViTs for medical image classification on edge devices.
Future work will focus on further optimizing these models and creating standardized frameworks for deployment on specific on-edge devices such as mobile phones, as proposed in Appendix A. Despite the performance of MobileViT_V2_175, its size of 27.47 MB might cause challenges when deploying on edge devices with extremely limited memory and computational resources. In addition, F16 quantization may not be compatible with all types of edge devices and may require further fine-tuning to allow for deployment. We would also recommend researchers to expand the dataset (or others) to include more classes and samples to enhance the robustness of the models. Moreover, efforts will be made to improve the explainability and interpretability of these models to ensure their reliable application in clinical settings.

Author Contributions

Conceptualization, D.V., L.K. and T.S.; methodology, D.V., L.K. and T.S.; software, D.V. and L.K.; validation, D.V., L.K. and T.S.; formal analysis, D.V. and L.K.; investigation, D.V. and L.K.; resources, D.V., L.K. and T.S.; data curation, D.V. and L.K.; writing—original draft preparation, D.V. and L.K.; writing—review and editing, D.V., L.K. and T.S.; supervision, T.S.; project administration, T.S. All authors have read and agreed to the published version of the manuscript.

Funding

This research received no external funding.

Institutional Review Board Statement

Not applicable.

Informed Consent Statement

Not applicable.

Data Availability Statement

Data used in this paper are publicly available and cited as relevant. The code used for generating results is available on GitHub through https://github.com/DaraVaram/Lightweight-ViTs-for-Medical-Diagnostics. The code used for developing the mobile application is available on Github through https://github.com/lujain-khalil/gastro_lens. Other supporting material is available upon request.

Acknowledgments

The work in this paper was supported, in part, by the Open Access Program from the American University of Sharjah. This paper represents the opinions of the author(s) and does not mean to represent the position or opinions of the American University of Sharjah.

Conflicts of Interest

The authors declare no conflicts of interest.

Appendix A

The mobile application was developed using Flutter’s development framework, which allows for integrating TFLite models into mobile application development. There is, however, a gap in the currently available resources, and no available dependencies allow for the integration of ViT models into mobile applications developed using Flutter’s framework yet. This application, named GastroLens, was developed for simulation purposes. The user is allowed to upload images from their gallery which are then “classified” using the deployed model, and the results are displayed. A report summarizing the model’s performance across the user’s upload history is also generated for reference. The Shared Preferences dependency was utilized as the application’s back-end, storing the user’s uploads and information.
The application starts on the home screen, with an empty history of user uploads. A drawer can be opened with a common structure of Android application drawers. The “Toggle Dark Mode” button allows the user to toggle the app’s theme between dark and light mode. This can be seen in Figure A1.
Figure A1. Home screen and drawer.
Applsci 14 08115 g0a1
Uploading an image is implemented using the Image Picker dependency, allowing for an interface that adapts to the user’s device. Two options are displayed in the popup menu: “Upload” and “Clear”. “Upload” navigates the user to the gallery, and “Clear” allows the user to clear their history from the app, resetting the report page. Once the image is uploaded, the user can press “Predict” and retrieve results from the model. At this point, there are two possible scenarios. The model could either classify the image correctly or not, as illustrated in Figure A2. The app allows the user to indicate whether or not the model was able to correctly classify the image, before adding it to the home screen. Each card added to the user interface includes its name, inference time, confidence, and whether the image was classified correctly or not. If the image was misclassified, the misclassified class from the model is shown in red.
Figure A2. Classification scenarios at image uploads. (a) An image is uploaded and classified correctly by the model. (b) An image is uploaded and classified incorrectly by the model. The user can choose the correct class from a drop-down menu.
Applsci 14 08115 g0a2
The report page of the application summarizes the results retrieved from the model. At the top, the total number of uploads and number of diseases detected are displayed. The main summary card includes information about the deployed model, classification accuracy, confidence, and F1-score. Below the main summary, a horizontal list of the nine classes is displayed. Each card displays the same information but averaged for each class, as illustrated in Figure A3.
Figure A3. Report page before and after uploading 45 images.
Applsci 14 08115 g0a3

References

  1. LeCun, Y.; Bengio, Y.; Hinton, G. Deep learning. Nature 2015, 521, 436–444. [Google Scholar] [CrossRef] [PubMed]
  2. TensorFlow Lite Guide. 2024. Available online: https://www.tensorflow.org/lite/guide (accessed on 10 July 2024).
  3. Min, J.K.; Kwak, M.S.; Cha, J.M. Overview of deep learning in gastrointestinal endoscopy. Gut Liver 2019, 13, 388. [Google Scholar] [CrossRef] [PubMed]
  4. Mall, P.K.; Singh, P.K.; Srivastav, S.; Narayan, V.; Paprzycki, M.; Jaworska, T.; Ganzha, M. A comprehensive review of deep neural networks for medical image processing: Recent developments and future opportunities. Healthc. Anal. 2023, 4, 100216. [Google Scholar] [CrossRef]
  5. Dosovitskiy, A.; Beyer, L.; Kolesnikov, A.; Weissenborn, D.; Zhai, X.; Unterthiner, T.; Dehghani, M.; Minderer, M.; Heigold, G.; Gelly, S.; et al. An Image is Worth 16 × 16 Words: Transformers for Image Recognition at Scale. arXiv 2021, arXiv:2010.11929. [Google Scholar]
  6. Liu, S.; Ha, D.S.; Shen, F.; Yi, Y. Efficient neural networks for edge devices. Comput. Electr. Eng. 2021, 92, 107121. [Google Scholar] [CrossRef]
  7. Han, S.; Mao, H.; Dally, W.J. Deep Compression: Compressing Deep Neural Networks with Pruning, Trained Quantization and Huffman Coding. arXiv 2016, arXiv:1510.00149. [Google Scholar]
  8. Park, E.; Yoo, S.; Vajda, P. Value-aware Quantization for Training and Inference of Neural Networks. arXiv 2018, arXiv:1804.07802. [Google Scholar]
  9. Smedsrud, P.H.; Thambawita, V.; Hicks, S.A.; Gjestang, H.; Nedrejord, O.O.; Næss, E.; Borgli, H.; Jha, D.; Berstad, T.J.D.; Eskeland, S.L.; et al. Kvasir-Capsule, a video capsule endoscopy dataset. Sci. Data 2021, 8, 142. [Google Scholar] [CrossRef]
  10. Vaswani, A.; Shazeer, N.; Parmar, N.; Uszkoreit, J.; Jones, L.; Gomez, A.N.; Kaiser, L.; Polosukhin, I. Attention Is All You Need. arXiv 2023, arXiv:1706.03762. [Google Scholar]
  11. Wang, X.; Zhang, L.L.; Wang, Y.; Yang, M. Towards efficient vision transformer inference: A first study of transformers on mobile devices. In Proceedings of the 23rd Annual International Workshop on Mobile Computing Systems and Applications, New York, NY, USA, 9–10 March 2022; pp. 1–7. [Google Scholar]
  12. Sandler, M.; Howard, A.; Zhu, M.; Zhmoginov, A.; Chen, L.C. MobileNetV2: Inverted Residuals and Linear Bottlenecks. arXiv 2019, arXiv:1801.04381. [Google Scholar]
  13. Xie, Q.; Luong, M.T.; Hovy, E.; Le, Q.V. Self-training with Noisy Student improves ImageNet classification. arXiv 2020, arXiv:1911.04252. [Google Scholar]
  14. Pogorelov, K.; Randel, K.R.; Griwodz, C.; Eskeland, S.L.; de Lange, T.; Johansen, D.; Spampinato, C.; Dang-Nguyen, D.T.; Lux, M.; Schmidt, P.T.; et al. KVASIR: A Multi-Class Image Dataset for Computer Aided Gastrointestinal Disease Detection. In Proceedings of the 8th ACM on Multimedia Systems Conference, New York, NY, USA, 20–23 June 2017; MMSys’17. pp. 164–169. [Google Scholar] [CrossRef]
  15. Borgli, H.; Thambawita, V.; Smedsrud, P.H.; Hicks, S.; Jha, D.; Eskeland, S.L.; Randel, K.R.; Pogorelov, K.; Lux, M.; Nguyen, D.T.D.; et al. HyperKvasir, a comprehensive multi-class image and video dataset for gastrointestinal endoscopy. Sci. Data 2020, 7, 283. [Google Scholar] [CrossRef] [PubMed]
  16. Varam, D.; Mitra, R.; Mkadmi, M.; Riyas, R.A.; Abuhani, D.A.; Dhou, S.; Alzaatreh, A. Wireless Capsule Endoscopy Image Classification: An Explainable AI Approach. IEEE Access 2023, 11, 105262–105280. [Google Scholar] [CrossRef]
  17. Simonyan, K.; Zisserman, A. Very Deep Convolutional Networks for Large-Scale Image Recognition. arXiv 2015, arXiv:1409.1556. [Google Scholar]
  18. Oukdach, Y.; Kerkaou, Z.; El Ansari, M.; Koutti, L.; Fouad El Ouafdi, A.; De Lange, T. ViTCA-Net: A framework for disease detection in video capsule endoscopy images using a vision transformer and convolutional neural network with a specific attention mechanism. Multimed. Tools Appl. 2024, 83, 1–20. [Google Scholar] [CrossRef]
  19. Qu, A.; Wu, Q.; Wang, J.; Yu, L.; Li, J.; Liu, J. TNCB: Tri-Net With Cross-Balanced Pseudo Supervision for Class Imbalanced Medical Image Classification. IEEE J. Biomed. Health Inform. 2024, 28, 2187–2198. [Google Scholar] [CrossRef]
  20. Ghubaish, A.; Salman, T.; Zolanvari, M.; Unal, D.; Al-Ali, A.; Jain, R. Recent Advances in the Internet-of-Medical-Things (IoMT) Systems Security. IEEE Internet Things J. 2021, 8, 8707–8718. [Google Scholar] [CrossRef]
  21. Datta Gupta, K.; Sharma, D.K.; Ahmed, S.; Gupta, H.; Gupta, D.; Hsu, C.H. A novel lightweight deep learning-based histopathological image classification model for IoMT. Neural Process. Lett. 2023, 55, 205–228. [Google Scholar] [CrossRef] [PubMed]
  22. Orlov, N.V.; Chen, W.W.; Mark Eckley, D.; Macura, T.J.; Shamir, L.; Jaffe, E.S.; Goldberg, I.G. Automatic Classification of Lymphoma Images With Transform-Based Global Features. IEEE Trans. Inf. Technol. Biomed. 2010, 14, 1003–1013. [Google Scholar] [CrossRef]
  23. Shreyas, S.; Rao, J.K. Diagnostic Decision Support for Medical Imaging and COVID-19 Image Classification on ARM Mali GPU. In Proceedings of the 2021 IEEE Globecom Workshops (GC Wkshps), Madrid, Spain, 7–11 December 2021; pp. 1–6. [Google Scholar] [CrossRef]
  24. Cohen, J.P.; Morrison, P.; Dao, L. COVID-19 image data collection. arXiv 2020, arXiv:2003.11597. [Google Scholar]
  25. Aldamani, R.; Abuhani, D.A.; Shanableh, T. LungVision: X-ray Imagery Classification for On-Edge Diagnosis Applications. Algorithms 2024, 17, 280. [Google Scholar] [CrossRef]
  26. Feltrin, F. X-ray Lung Diseases Images (9 Classes)—kaggle.com. 2023. Available online: https://www.kaggle.com/datasets/fernando2rad/x-ray-lung-diseases-images-9-classes (accessed on 10 July 2024).
  27. Pei, S.C.; Lin, C.N. Image normalization for pattern recognition. Image Vis. Comput. 1995, 13, 711–723. [Google Scholar] [CrossRef]
  28. Li, Y.; Hu, J.; Wen, Y.; Evangelidis, G.; Salahi, K.; Wang, Y.; Tulyakov, S.; Ren, J. Rethinking Vision Transformers for MobileNet Size and Speed. In Proceedings of the IEEE International Conference on Computer Vision, Paris, France, 2–6 October 2023. [Google Scholar]
  29. Cai, H.; Li, J.; Hu, M.; Gan, C.; Han, S. EfficientViT: Multi-Scale Linear Attention for High-Resolution Dense Prediction. arXiv 2024, arXiv:2205.14756. [Google Scholar]
  30. Liu, X.; Peng, H.; Zheng, N.; Yang, Y.; Hu, H.; Yuan, Y. EfficientViT: Memory Efficient Vision Transformer with Cascaded Group Attention. arXiv 2023, arXiv:2305.07027. [Google Scholar]
  31. Mehta, S.; Rastegari, M. Separable Self-attention for Mobile Vision Transformers. arXiv 2022, arXiv:2206.02680. [Google Scholar]
  32. Wang, A.; Chen, H.; Lin, Z.; Han, J.; Ding, G. RepViT: Revisiting Mobile CNN From ViT Perspective. arXiv 2024, arXiv:2307.09283. [Google Scholar]
  33. Leondgarse. leondgarse/keras_cv_attention_models: Zenodo (zenodo). Zenodo. 2022. [Google Scholar] [CrossRef]
  34. Li, Y.; Yuan, G.; Wen, Y.; Hu, J.; Evangelidis, G.; Tulyakov, S.; Wang, Y.; Ren, J. Efficientformer: Vision transformers at mobilenet speed. Adv. Neural Inf. Process. Syst. 2022, 35, 12934–12949. [Google Scholar]
  35. Mehta, S.; Rastegari, M. MobileViT: Light-weight, General-purpose, and Mobile-friendly Vision Transformer. arXiv 2022, arXiv:2110.02178. [Google Scholar]
  36. Model Optimization in TensorFlow Lite. 2024. Available online: https://www.tensorflow.org/lite/performance/model_optimization (accessed on 10 July 2024).
  37. Gholami, A.; Kim, S.; Dong, Z.; Yao, Z.; Mahoney, M.W.; Keutzer, K. A Survey of Quantization Methods for Efficient Neural Network Inference. arXiv 2021, arXiv:2103.13630. [Google Scholar]
  38. Villalobos, P.; Sevilla, J.; Besiroglu, T.; Heim, L.; Ho, A.; Hobbhahn, M. Machine Learning Model Sizes and the Parameter Gap. arXiv 2022, arXiv:2207.02852. [Google Scholar]
Figure 1. The proposed system model demonstrating the methodology used in this study, showing the dataset and the ViT-based classifiers’ training process, followed by the quantization of these classifiers for deployment on edge devices.
Applsci 14 08115 g001
Figure 2. Sample images from all 14 classes of the Kvasir-Capsule dataset.
Applsci 14 08115 g002
Figure 3. Model architecture designed for this work.
Applsci 14 08115 g003
Figure 4. ViT model performances across quantization methods in terms of their F1-scores. Two dashed lines are included to show the minimum and the maximum F1-score values across the 7 different models for easier legibility.
Applsci 14 08115 g004
Figure 5. Combined F1-score values for three types of quantization of each ViT model.
Applsci 14 08115 g005
Figure 6. Combined size values in MB for three types of quantization of each ViT model.
Applsci 14 08115 g006
Figure 7. Performance-to-size ratio for each ViT model. Models with an F1-score below 0.90 were omitted from the graph.
Applsci 14 08115 g007
Figure 8. Confusion matrices generated from running inference on a CPU.
Applsci 14 08115 g008
Table 1. Summary of existing work on Kvasir-Capsule.
PaperImages UsedBest ModelPerformanceModel Size (MB)
Varam et al. [16]Top 9 classes: 4500ViTF1-score: 0.97Not reported
Oukdach et al. [18]12 classes: 6990ViTCA-NetF1-score: 0.97Not reported
Qu et al. [19]Top 10 classes: 47,002TNCBF1-score: 0.95Not reported
Table 2. Summary of existing work on edge deployment for medical diagnostics.
PaperDatasetModelQuantizationPerformanceModel SizeInference Time
Gupta et al. [21]Malignant LymphomaReducedFireNetF32F1-score: 0.95842.8 KBNot reported
Shreya et al. [23]COVID-19 chest X-raysDDSM++F16Accuracy: 0.936Not reported280 ms
Aldamani et al. [25]X-ray lung diseasesEfficientNetB2V2QATF1-score: 0.9759.9 MB470 ms
Table 3. Class distribution of Kvasir-Capsule dataset before and after under-sampling for training.
Class NameOriginal DatasetTraining Dataset
Normal Clean Mucosa34,338500
Ileocecal Valve4189500
Reduced Mucosal View2906500
Pylorus1529500
Angiectasia866500
Ulcer854500
Foreign Body776500
Lymphangiectasia592500
Erosion506500
Blood—Fresh4460
Erythema1590
Polyp550
Blood—Hematin120
Ampulla of Vater100
Total47,2384500
Table 4. Summary of chosen models [33]. (Params: number of model parameters in millions (M). FLOPs: floating point operations per second. Input: model input shape. Top1 Acc: performance of model on ImageNet. T4 Inference: number of queries per second (qps) when testing on Tesla T4).
ModelParamsFLOPsInputTop1 AccT4 Inference
EfficientFormerV2S212.70 M1.27 G224 × 2240.820573.90 qps
EfficientViT_B03.41 M0.12 G224 × 2240.7161581.76 qps
EfficientViT_M48.80 M299 M224 × 2240.743672.89 qps
MobileViT_V2_0501.37 M0.47 G256 × 2560.702718.34 qps
MobileViT_V2_1004.90 M1.83 G256 × 2560.781591.22 qps
MobileViT_V2_17514.3 M5.52 G256 × 2560.808412.76 qps
RepViT_M118.29 M1.35 G224 × 2240.812846.68 qps
Table 5. Quantization methods in TFLite [36].
TechniqueSize ReductionAccuracy
Post-training float-16 quantizationUp to 50%Insignificant accuracy loss
Quantization-aware trainingUp to 75%Smallest accuracy loss
Table 6. F1-scores for different ViT models and quantization techniques.
Quantization Technique
Model F32 F16 QAT
EfficientFormerV2S282.5982.6025.11
EfficientViT_B090.0290.5015.65
EfficientViT_M491.9191.6989.44
MobileViT_V2_05090.3490.3370.02
MobileViT_V2_10093.9393.9385.64
MobileViT_V2_17595.3495.3494.42
RepViT_M1191.7291.7293.11
Table 7. Size comparison in MB for different ViT models and quantization techniques.
Quantization Technique
Model F32 F16 QAT
EfficientFormerV2S248.0424.2213.71
EfficientViT_B07.193.631.98
EfficientViT_M433.8117.019.09
MobileViT_V2_0505.502.891.70
MobileViT_V2_10018.989.635.22
MobileViT_V2_17554.6627.4714.36
RepViT_M1131.7215.968.46
Table 8. Percentage size comparison of F32 models to F16 and QAT models.
ModelF16 (% of F32)QAT (% of F32)
EfficientFormerV2S250.41%28.55%
EfficientViT_B050.54%27.49%
EfficientViT_M450.33%26.89%
MobileViT_V2_05052.51%30.88%
MobileViT_V2_10050.71%27.49%
MobileViT_V2_17550.26%26.27%
RepViT_M1150.33%26.68%
Table 9. Performance-to-size ratio comparison for different ViT models and quantization techniques.
Quantization Technique
Model F32 F16 QAT
EfficientFormerV2S21.723.411.83
EfficientViT_B012.5224.907.91
EfficientViT_M42.725.399.84
MobileViT_V2_05016.4331.3041.25
MobileViT_V2_1004.959.7616.42
MobileViT_V2_1751.743.476.58
RepViT_M112.895.7511.00
Table 10. Comparison of our proposed model with previous works.
PaperModelF1-ScoreParamsQuantization
[16], 2023ViT0.9700≈86 MNone
[18], 2024ViTCA-Net0.9700≈86 MNone
[19], 2024TNCB0.950012.2 MNone
Proposed solutionMobileViT_V2_1750.953414.3 MF16
Table 11. Chosen models to test on a CPU.
ModelQuantizationF1-ScoreSize (MB)Performance-to-Size Ratio
MobileViT_V2_175F160.953427.473.47
MobileViT_V2_050F160.90332.8931.30
Table 12. Results from testing both models on a CPU.
ModelQuantizationF1-ScoreInference Time (ms)
MobileViT_V2_175F160.9107677.2
MobileViT_V2_050F160.794680.8
Table 13. Comparison of best-performing models on the X-ray Lung Diseases dataset [26].
ApproachQuantizationF1-ScoreModel Size
EfficientNetV2B2 [25]QAT 0.9751 9.9 MB
MobileViT_V2_175 (ours)QAT 0.9798 14.7 MB
Disclaimer/Publisher’s Note: The statements, opinions and data contained in all publications are solely those of the individual author(s) and contributor(s) and not of MDPI and/or the editor(s). MDPI and/or the editor(s) disclaim responsibility for any injury to people or property resulting from any ideas, methods, instructions or products referred to in the content.

