Article

Geospatial and Temporal Patterns of Natural and Man-Made (Technological) Disasters (1900–2024): Insights from Different Socio-Economic and Demographic Perspectives

by
Vladimir M. Cvetković
1,2,3,*,
Renate Renner
4,
Bojana Aleksova
2,5 and
Tin Lukić
2,6
1
Department of Disaster Management and Environmental Security, Faculty of Security Studies, University of Belgrade, Gospodara Vucica 50, 11040 Belgrade, Serbia
2
Scientific-Professional Society for Disaster Risk Management, Dimitrija Tucovića 121, 11040 Belgrade, Serbia
3
International Institute for Disaster Research, Dimitrija Tucovića 121, 11040 Belgrade, Serbia
4
Safety and Disaster Studies, Chair of Thermal Processing Technology, Department of Environmental and Energy Process Engineering, Montanuniversitaet, 8700 Leoben, Austria
5
Maarif International School, Skopje Campus, Kiro Gligorov 5, 1000 Skopje, North Macedonia
6
Department of Geography, Tourism and Hotel Management, Faculty of Sciences, University of Novi Sad, Trg Dositeja Obradovića 3, 21000 Novi Sad, Serbia
*
Author to whom correspondence should be addressed.
Appl. Sci. 2024, 14(18), 8129; https://doi.org/10.3390/app14188129
Submission received: 12 August 2024 / Revised: 8 September 2024 / Accepted: 9 September 2024 / Published: 10 September 2024

Abstract

:
This pioneering study explores the geospatial and temporal patterns of natural and human-induced disasters from 1900 to 2024, providing essential insights into their global distribution and impacts. Significant trends and disparities in disaster occurrences and their widespread consequences are revealed through the utilization of the comprehensive international EM-DAT database. The results showed a dramatic escalation in both natural and man-made (technological) disasters over the decades, with notable surges in the 1991–2000 and 2001–2010 periods. A total of 25,836 disasters were recorded worldwide, of which 69.41% were natural disasters (16,567) and 30.59% were man-made (technological) disasters (9269). The most significant increase in natural disasters occurred from 1961–1970, while man-made (technological) disasters surged substantially from 1981–1990. Seasonal trends reveal that floods peak in January and July, while storms are most frequent in June and October. Droughts and floods are the most devastating in terms of human lives, while storms and earthquakes cause the highest economic losses. The most substantial economic losses were reported during the 2001–2010 period, driven by catastrophic natural disasters in Asia and North America. Also, Asia was highlighted by our research as the most disaster-prone continent, accounting for 41.75% of global events, with 61.89% of these events being natural disasters. Oceania, despite experiencing fewer total disasters, shows a remarkable 91.51% of these as natural disasters. Africa is notable for its high incidence of man-made (technological) disasters, which constitute 43.79% of the continent’s disaster events. Europe, representing 11.96% of total disasters, exhibits a balanced distribution but tends towards natural disasters at 64.54%. Examining specific countries, China, India, and the United States emerged as the countries most frequently affected by both types of disasters. The impact of these disasters has been immense, with economic losses reaching their highest during the decade of 2010–2020, largely due to natural disasters. The human toll has been equally significant, with Asia recording the most fatalities and Africa the most injuries. Pearson’s correlation analysis identified statistically significant links between socioeconomic factors and the effects of disasters. It shows that nations with higher GDP per capita and better governance quality tend to experience fewer disasters and less severe negative consequences. These insights highlight the urgent need for tailored disaster risk management strategies that address the distinct challenges and impacts in various regions. By understanding historical disaster patterns, policymakers and stakeholders can better anticipate and manage future risks, ultimately safeguarding lives and economies.

1. Introduction

In our increasingly interconnected world, grasping disasters’ geospatial and temporal patterns has become vital for effective disaster management and resilience planning [1]. Disasters, whether natural or human-induced, can have profound impacts on communities, economies, and the environment [2,3]. Environmental hazards, particularly air pollution, are of critical importance due to their role in increasing the susceptibility of populations to both natural and technological disasters. Specifically, air pollution poses direct threats to health and also compounds the effects of other environmental stressors, thereby elevating the overall risks faced by communities [4].
Advances in big data analytics, alongside the integration of various data sources, have greatly enhanced our ability to track and assess these risks [5]. For instance, the utilization of big data has enabled the merging of a wide range of environmental information, resulting in more refined risk evaluations and the formulation of more precise mitigation strategies [6]. These advancements are becoming indispensable for addressing the complex challenges posed by the convergence of air pollution with other disaster-related risks. The risk of a disaster occurring is always a combination of vulnerability and exposure due to inadequate preparation or coping capacity [7]. This underscores the necessity of delving into the complex dynamics that influence their occurrence and distribution.
Environmental events like earthquakes, floods, hurricanes, and wildfires are driven by natural and climatic forces [8,9,10,11,12,13,14,15]. The patterns of these disasters, including their frequency, intensity, and locations, have evolved over time due to shifts in climate, land usage, and population growth [16,17,18,19,20,21]. Also, trends can be uncovered and high-risk areas identified through the analysis of past data, thus improving the ability to forecast and respond to future events [22]. In contrast, man-made (technological) disasters arise from human activities such as industrial mishaps, nuclear accidents, and oil spills. These incidents often occur due to equipment failures, human and organizational mistakes [23], or weak regulatory measures. Failures can occur during the design, construction, operation or maintenance phases [24,25]. Insights into industrial operations and regulatory practices can be gained by examining when and where these disasters happen, leading to improved safety protocols and emergency response strategies [26].
Recent research has shed light on significant advancements and methodologies for understanding the geospatial and temporal patterns of natural disasters [27,28,29]. Han et al. [30], for instance, use textual records to uncover the spatial–temporal patterns of natural disasters in China. Their findings highlight critical intervals and interactions between events, offering valuable guidance for disaster prevention efforts [30]. Ghosh [31] explores the integration of various geospatial technologies and data sources in disaster management. Also, he emphasizes how AI and big data can enhance emergency responses and decision-making processes. On the other hand, Wang [32] delves into the historical patterns of marine disasters in China, providing a multiscalar analysis of their temporal changes and spatial evolution. This research helps in understanding long-term trends and impacts (Wang, 2020). Additionally, Wei et al. [33] conduct a comprehensive study on the spatial–temporal evolution and prediction of flood disasters in China over the past 500 years, highlighting critical trends and future risks. Together, these studies deepen our understanding of disaster patterns and offer valuable insights for effective disaster management and mitigation strategies.
The wealth of existing research on this subject provides crucial insights into the factors shaping these disaster patterns [32,33,34,35,36,37,38,39,40,41,42]. Geospatial analyses have revealed that some areas are particularly at risk for specific types of disasters. Factors such as the terrain, local climate, and how densely populated an area is significantly influence where these disasters occur [13]. Moreover, by studying temporal patterns, researchers can identify seasonal or cyclical trends and assess how climate change might be altering the frequency and severity of these events [43,44]. In addition, one study highlights the significant toll natural disasters can take on mental health, stressing the importance of comprehensive post-disaster intervention strategies to tackle the behavioral and psychological symptoms that follow such events [45].
Regarding this, the aim of this study is to provide a scientific description and comprehensive understanding of the patterns and impacts of natural and man-made (technological) disasters over more than a century. By analyzing the geospatial and temporal distribution of these events, this study aims to offer valuable insights that can inform future disaster risk management strategies, enhance preparedness, and ultimately contribute to reducing disaster-related losses. This research highlights the urgent need for tailored disaster risk management strategies that address the distinct challenges and impacts in various regions, thereby promoting resilience and sustainable development. A comprehensive understanding of the specific challenges and impacts encountered by different regions is crucial for developing strategies that not only bolster the resilience of these communities to future disasters but also align with broader sustainable development objectives. For example, addressing vulnerabilities related to infrastructure and socio-economic factors can foster more resilient systems that contribute to long-term sustainability and effectively reduce the risk of future disasters.

Literature Review Geospatial and Temporal Patterns of Disasters

Understanding and managing the effects of natural and man-made (technological) disasters have been significantly improved through geospatial analysis [46,47]. Analyzing historical data through geospatial techniques unveils patterns in the frequency and distribution of natural disasters worldwide [48]. This type of analysis is essential for grasping the temporal and spatial behaviors of these events, which in turn is critical for making accurate future predictions and improving disaster preparedness efforts [17,49]. Utilizing tools like remote sensing and GIS, researchers can now map out affected areas, predict potential damage, and evaluate the aftermath of these events [50]. This technological approach greatly supports efforts in disaster preparedness, effective response, and efficient recovery [17]. Geospatial technologies, including GIS and remote sensing, have proven to be highly effective tools for mapping and predicting natural disasters such as earthquakes, landslides, floods, and cyclones [47]. By utilizing these advanced technologies, researchers can accurately identify areas that are at high risk for such events.
Moreover, these tools play a vital role in developing early warning systems that can help mitigate the impact of disasters by providing timely alerts and enabling better preparedness [35,36,41,51]. Remote sensing and geospatial analyses play a crucial role in evaluating damage and monitoring recovery efforts following disasters [42,52]. For example, the use of medium-resolution imagery alongside indices like NDVI and UI has been particularly effective in assessing recovery rates after tornadoes, where severely damaged areas tend to recover more slowly [52]. Satellite-based geospatial techniques offer a dependable alternative to traditional ground-based surveys, which are often hindered by hazardous conditions and logistical difficulties [48]. These technologies enable a comprehensive assessment of disaster impacts and facilitate more efficient recovery planning [50].
Understanding the patterns, predicting future occurrences, and mitigating the impacts of natural and man-made (technological) disasters hinge significantly on temporal analysis. Andersen et al. [53] provide comprehensive guidance on conducting time-to-event analysis in observational studies, with a particular focus on hazard models and the Cox proportional hazards regression model. In another study, Tian et al. [40] introduce a framework for evaluating community resilience to multiple hazards in the Anning River basin, underscoring the significance of socio-economic factors in enhancing adaptive risk management. Melkov et al. [54] analyze geophysical data in North Ossetia, Russia, and develop a complex hazard map aimed at improving risk assessments in the region. Also, Chen et al. [55] examine the temporal assessment of disaster risk, using case studies from China to demonstrate how risk varies over time and proposing long-term mitigation strategies.
Over the past century, studies have shown a general uptick in both the frequency and intensity of natural disasters, with pronounced peaks in recent decades [37,56,57]. Tin et al. [58] found that from 1995 to 2022, there were 11,360 natural disasters, averaging 398 annually. They mentioned that Asia reported the highest number of disasters (4390) and the greatest number of fatalities (918,198). Also, hydrological disasters were the most frequent, totaling 4969, whereas geophysical disasters were the deadliest, with 770,644 deaths. Finally, they found that biological disasters, primarily affecting Africa, resulted in the highest number of injuries (2544) [58]. From another perspective, Jäger et al. [59] investigate disaster records from EM-DAT for 2000–2018 to understand multi-hazard risk patterns. Using an algorithm that considers hazard associations and their spatial and temporal overlaps, their study reveals that multi-hazard events are twice as frequent when there is at least a 25% spatial overlap and a time difference of up to 1 year. Also, they found that these events contribute to 78% of total damages, 83% of affected populations, and 69% of total fatalities [59].
In a different view, Chen et al. [60] explored the occurrence of rainstorms and floods in the Tarim Basin from 1980 to 2019. Their findings show a notable rise in these events, especially between April and September. The western and northern regions of the basin are particularly vulnerable, with severe incidents significantly impacting the damage index. Similarly, Buszta et al. [46] conducted a geospatial analysis of 9962 natural disasters from 1960 to 2018, examining their frequency and impact across different continents. This study also provides a predictive outlook on future trends, highlighting the influence of climatic factors on disaster patterns. In addition, Summers et al. [38] investigated changes in the frequency, intensity, and spatial distribution of hazards like hurricanes, tropical storms, and droughts. Their research connects these variations to climate change, using empirical data to bolster previous theories. Furthermore, Herrera and Aristizábal [61] examined the relationship between precipitation patterns and landslides in the Aburrá Valley. Their study revealed that rainfall-induced landslides are affected by macroclimatic phenomena such as ENSO, with specific hotspots identified in the valley’s eastern hills.
The geospatial and temporal distribution patterns of various disasters have been analyzed in multiple studies [37,46]. Over the past century, natural disasters like droughts, floods, and storms have generally become more frequent and severe, with a marked increase in intensity observed in recent decades [37,46,62]. Shen and Hwang [37] conducted a geospatial analysis of 9962 natural disasters occurring worldwide between 1960 and 2018, covering 39,953 locations. They found that Asia, particularly the southeastern region, was the most disaster-affected area, with countries like China, India, the Philippines, and Indonesia being heavily impacted. Also, this analysis highlighted a strong correlation between a region’s geographical location, its size, its population, and its susceptibility to specific natural disasters. For example, seismic activity was more prevalent in Asia, while storms were more common in the United States due to its diverse climate. Also, Nones et al. [63] uncovered rising trends over time in both droughts and wildfires, with their spatial distribution increasingly shaped by the effects of climate change and human activities. The study’s findings highlight how the economic damages from these disasters play a significant role in hindering the recovery process for the communities impacted. Furthermore, according to the 2023 annual report from the EM-DAT database [64], a total of 399 disasters were recorded, leading to 86,473 fatalities and impacting 93.1 million people globally. Among the most catastrophic events were the earthquake in Turkey and Syria and the severe drought in Indonesia, both of which had profound effects on human lives and the economies of the affected regions.
A comprehensive review of the literature on various disasters reveals significant trends in their frequency, distribution, and impact, underscoring the need for enhanced preparedness and mitigation strategies worldwide [63,65]. For example, a study examining the geospatial and temporal distribution of disasters revealed that floods have become more frequent in recent decades, with Asia and Africa experiencing the highest fatality rates [63]. The findings highlight the urgent need to enhance drainage infrastructure and flood protection measures in these vulnerable regions. In another study, Winsemius, Van Beek, Jongman, Ward, and Bouwman [65] developed a comprehensive framework for assessing global flood risks, validated using data from the EM-DAT database. The study employed a global hydrological model and downscaling techniques to estimate flood hazards and their impacts, which were then cross-verified with recorded flood events from EM-DAT. This methodology enabled a thorough evaluation of flood risks on a global scale, taking into account both present and future climate conditions [65].
Another study focused on utilizing the EM-DAT database to analyze global flood losses [66]. The researchers highlighted challenges in accurately capturing flood loss data, such as biased reporting and changes over time [66]. The study emphasized the critical importance of normalizing data to ensure reliable trend analysis and called for comprehensive and standardized flood data to improve disaster management efforts. On the other hand, using the EM-DAT database, one study compiled a detailed catalog and map of major flood disasters in Europe from 1950 to 2005 [67]. By providing a comprehensive overview of these events, the study significantly enhanced the understanding of flood risks, supporting more informed political and economic decisions for disaster mitigation [67]. These studies illustrate how the EM-DAT database plays a crucial role in providing vital data for analyzing flood patterns, which in turn support both global and regional flood risk assessments and inform disaster management strategies.
Geospatial data are critical for understanding and analyzing the distribution of earthquakes. One particularly intriguing study explored mutual information and clustering analysis to visualize and examine global seismic data [68]. By categorizing seismic events according to their geographic location and magnitude, the study generated intuitive maps that revealed intricate relationships within earthquake data—relationships that are often missed by traditional mapping methods [68]. Kripa et al. [69] found that WEED, a tool developed to geocode and analyze historical disaster data from the EM-DAT database, including earthquakes, allows for precise geocoding by associating latitude and longitude coordinates with disaster events. This advancement facilitates the integration of disaster data with geophysical and geospatial variables for more detailed analysis. In one study [68], global seismic data from 1962 to 2011 were analyzed using techniques such as mutual information and cluster analysis. The resulting visual maps offered an intuitive understanding of complex relationships within earthquake data that are often difficult to discern on traditional geographic maps [68]. In Indonesia, hexagonal tessellation was applied for geovisualizing earthquake data [70]. This method enhanced the clarity of epicenter density visualization, making it easier to identify patterns in the spatial distribution of earthquakes and their proximity to tectonic faults.
Another study analyzed global wildfire trends using the EM-DAT database, revealing that climate change—marked by rising temperatures and prolonged droughts—has a direct correlation with the increasing frequency and severity of wildfires [71]. The study provided vital insights into how climate change is exacerbating these disasters, underscoring the pressing need for decisive global climate action. On the other side, one study revealed a notable rise in residential fires and fire emergency situations in Serbia between 2012 and 2022 [72]. According to the results, there were 38,279 residential fires during this period, resulting in 665 fatalities, 1747 injuries, and 2134 rescues. The annual figures for fires and deaths are as follows: 2012 (946 fires/7 deaths), 2013 (836/6), 2014 (887/8), 2015 (827/5), 2016 (872/10), 2017 (899/18), 2018 (842/14), 2019 (796/10), 2020 (842/23), and 2021 (828/21) [72].
In contrast, one study utilized data from the EM-DAT database to analyze the economic impacts of different types of natural disasters [71]. The findings revealed that economic losses vary depending on the type of disaster, with earthquakes and floods causing the most significant damage [71]. While one study uses data from the EM-DAT database to analyze economic impacts, the study in [73] compares disaster damage records from two major databases, EM-DAT and DesInventar, for 70 countries from 1995 to 2013. Focusing on droughts, floods, earthquakes, and storms, it uses descriptive statistics to evaluate differences in recorded events, matched events, and large-scale events between the two databases, highlighting significant discrepancies in damage estimates. The comparison reveals that DesInventar records more events than EM-DAT for all events. However, for hand-matched events, EM-DAT reports higher mean disaster damages and a wider statistical range compared to DesInventar [73].
There is strong evidence pointing to a sharp rise in economic damages from extreme natural events, especially in temperate regions, driven by their increasing severity [56]. Patterns of droughts and floods reveal alternating positive and negative correlations over time, with a notable lag effect where floods tend to follow droughts by about 4–5 years [74]. The number of people affected by natural disasters has surged, leading to more fatalities, injuries, and property damage [74]. People’s information-seeking behavior during disasters shifts across different phases, underscoring the need for varied communication strategies before, during, and after such events [34]. To analyze the temporal and spatial distribution of disasters, researchers are increasingly turning to advanced methods like time series analysis, spatial statistics, and big data techniques [75,76].
In addition to all these studies, it has been found that some authors examine the quality of these databases. The researchers Jones et al. [77] analyzed the EM-DAT database, which records natural disasters from 1990 to 2020, and uncovered notable gaps, particularly in the data related to economic losses. They determined that the year, income classification, and type of disaster were significant predictors of these data gaps. To address these issues, they emphasized the importance of employing advanced statistical methods to minimize bias and enhance the reliability of the data [77].
Although the existing literature offers valuable insights into disaster patterns, there are still some notable gaps that need to be addressed. For example, many studies tend to focus on individual types of disasters, such as floods or earthquakes, without providing a comprehensive analysis that considers multiple disaster types within a single framework. This research intends to address that gap by examining both natural and human-made disasters over the past century. Moreover, there is a noticeable lack of studies that effectively integrate geospatial and temporal analysis to predict future disaster patterns, particularly when considering the use of emerging technologies like AI and big data. This study aims to close that gap by providing an integrated approach that could improve disaster preparedness and response strategies. Although some studies examine disaster patterns, there is a lack of research evaluating how different regions implement disaster management strategies based on these patterns. This study will explore this by offering a comparative analysis.
Recent advancements in AI and machine learning have revolutionized disaster management by enabling more precise predictions and real-time response strategies. However, integrating these technologies with traditional geospatial analysis is still in its early stages, and further research is necessary to explore their full potential in disaster risk management. While previous studies have contributed significantly to understanding disaster patterns, many are constrained by their reliance on historical data without accounting for the dynamic nature of climate change and human activities. This study aims to overcome these limitations by incorporating recent data and advanced analytical methods to provide a more accurate and comprehensive understanding of disaster risks. Also, insights from analyzing the geospatial and temporal patterns of disasters are crucial for informing policy decisions and enhancing disaster preparedness. However, more research is needed to translate these findings into practical strategies for policymakers. This study aims to contribute to this area by offering policy recommendations based on a comprehensive analysis of disaster patterns.

2. Methods

The subject of this research encompasses an extensive analysis of both natural and man-made (technological) disasters from 1900 to 2024. The primary objective is to identify geospatial and temporal patterns of these disasters, examining their frequency, distribution, and impact across various geographic regions and periods. In addition, the subject of this research is to examine the influence of various socio-economic factors, such as GDP per capita, governance quality, population density, and urbanization rate, on the distribution and consequences of disasters, including the number of affected people, deaths, and injuries.
Utilizing the EM-DAT database, this study aims to uncover significant trends and disparities in disaster occurrences and their widespread consequences on a global scale.
In a narrower sense, this research delves into the historical data of natural and man-made disasters, categorizing them by type, region, and period. It explores specific trends such as the escalation of natural disasters from 1960–1970 and man-made (technological) disasters from 1981–1990. Furthermore, it identifies seasonal trends, assesses the economic and human impacts of these disasters, and examines the specific vulnerabilities of different continents and countries.

2.1. Hypothetical Framework

This study is based on the general hypothesis that the geospatial and temporal patterns of natural and man-made (technological) disasters exhibit significant variations in frequency, distribution, and impact across different geographic regions and periods, which reflect changes in natural conditions and socio-economic factors. The specific hypotheses include the following:
H1: 
Natural disasters occur more frequently and have a greater impact on human and economic resources compared to technological disasters.
H2: 
The frequency and distribution of disasters differ between continents, with certain regions experiencing higher frequencies of specific types of disasters.
H3: 
There are significant temporal changes in the frequency of natural and technological disasters, with particular periods showing notable increases or decreases in the number of events.
H4: 
Certain natural disasters show seasonal variations in frequency, reflecting climatic and weather patterns.
H5: 
Different types of disasters have varying impacts on economic losses and human resources, with some disasters causing more severe consequences than others.
H6: 
Different socio-economic factors (GDP per capita (USD), governance quality, population density (people per km2) and urbanization rate (%)), have a significant role in influencing the distribution and consequences of disasters, including the number of affected people, deaths, and injuries.

2.2. Data Collection and Preparation

The data for this study were sourced from the international EM-DAT (Emergency Events Database). EM-DAT is a comprehensive global database that tracks and records all types of natural and human-induced (technological) disasters. It is maintained and regularly updated by the Centre for Research on the Epidemiology of Disasters (CRED) at the University of Louvain, Belgium. A diverse range of sources, including UN agencies, non-governmental organizations, reinsurance firms, research institutions, and media outlets, were used to assemble the database [78]. The dataset can be accessed directly through their website (https://www.emdat.be/, accessed on 15 June 2024).
The database contains information on disasters that have occurred worldwide since 1900 and meet at least one of the following criteria: 10 fatalities, 100 people affected, declaration of a state of emergency, and an international request for assistance. Each entry in EM-DAT includes detailed information about the disaster type, the number of affected individuals, economic losses, geographical distribution, and other relevant parameters [79]. CRED [80] outlines the various impacts of disasters as significant threats to sustainable development. Among these impacts are damages, which refer to the destruction or harm caused to property, crops, and livestock. Another crucial impact is on affected populations, including those who are rendered homeless—people whose homes are destroyed or severely damaged, necessitating immediate shelter—and others requiring urgent assistance. Additionally, the category of injuries covers individuals who suffer from physical harm, trauma, or illness that needs medical attention as a direct outcome of the disaster. Lastly, fatalities represent the tragic loss of life resulting from natural hazards.
Numerous advantages are offered by the EM-DAT database for researchers and decision-makers [81]. Its comprehensiveness and standardization have allowed for the long-term monitoring of natural and technological disasters on a global scale, making it a valuable tool for trend analysis and comparative studies across different regions [73,82]. The database is made publicly accessible, provides wide geographical coverage, and is frequently utilized as a reference source in scientific research due to the breadth and quality of its data [83].
However, certain drawbacks are also associated with EM-DAT [84]. Despite its extensive nature, generalized information with limited details on specific events may be contained within the database, potentially restricting deeper analysis [83]. The quality of the data is dependent on the sources from which they are collected, which can lead to inconsistencies between different regions [78]. Additionally, the inclusion of events is limited to those meeting specific criteria, possibly resulting in the exclusion of smaller or less severe incidents. Older data may be affected by retrospective bias, and delays in the entry of the most recent events can impact the timeliness of current trend analysis [83,85,86].
For this study, a total of 25,836 disasters from 1900 to 2024 were analyzed. The data were cleaned and prepared for analysis using the Statistical Package for the Social Sciences (IBM SPSS Statistics, Version 26, New York, NY, USA) software after being downloaded. The data preparation process included several key steps: (a) identifying and removing duplicates and missing values to ensure data accuracy and consistency; (b) converting all data into a uniform format to facilitate easier analysis and interpretation, classifying disasters by type, intensity, geographical area, and period. During the data processing phase, all numerical values were standardized to ensure consistent interpretation of results across different time periods and geographic regions. Additionally, categorical data were coded to facilitate their integration into regression models and other quantitative analyses.
More specifically stated, listwise deletion was employed to handle missing values in critical data points, while mean imputation was utilized as needed to preserve the integrity of the dataset. Outliers were detected through the use of z-scores, with those surpassing ±3 standard deviations carefully examined and removed to avoid skewing the results. Duplicates, especially those associated with identical disaster events, were identified based on matching criteria across key variables and were subsequently eliminated to prevent double-counting. The assumptions underlying the data processing, such as the assumption that missing values were missing at random (MAR) and that the exclusion of outliers would not significantly alter the observed patterns, were also documented. These measures were implemented to enhance the reliability and validity of the analysis.

Identification and Sourcing of Key Socio-Economic Indicators

In this study, key socio-economic indicators with the potential to significantly influence disaster outcomes were identified. Among these, GDP per capita was considered, as it reflects the economic capacity of individuals within a country, which can directly affect their preparedness and response to disasters. Data for this indicator were sourced from reputable institutions, including the World Bank (https://data.worldbank.org/indicator/NY.GDP.PCAP.CD, accessed on 1 September 2024) and the International Monetary Fund (IMF) (https://www.imf.org/en/Data, accessed on 1 September 2024).
Another crucial indicator was governance quality, measuring how efficiently and effectively a government manages resources and responds to crises. These data were obtained from the World Governance Indicators (WGIs) provided by the World Bank (https://info.worldbank.org/governance/wgi/, accessed on 1 September 2024). On the other hand, population density, defined as the number of people per square kilometer, was also included to gauge the potential vulnerability of regions with high population concentrations. Data on population density were gathered from sources such as Worldometer (https://www.worldometers.info/world-population/population-by-country/, accessed on 5 September 2024) and the United Nations (https://population.un.org/wpp/, accessed on 1 September 2024).
Lastly, the urbanization rate, representing the proportion of the population residing in urban areas, was analyzed because higher urbanization can enhance the disaster response efficiency but also heighten risks due to population and infrastructure concentration. Data for this indicator were collected from platforms such as Statista (https://www.statista.com/statistics/270860/urbanization-by-country/, accessed on 6 September 2024) and the World Bank (https://data.worldbank.org/indicator/sp.urb.totl.in.zs, accessed on 6 September 2024).
Following data collection, these indicators were compiled into an Excel file, with each country in the dataset assigned its corresponding socio-economic indicators. The Excel file was structured to include all relevant variables, such as total damage, number of deaths, injuries, and natural and man-made (technological) disasters. The data underwent a thorough cleaning process to ensure accuracy and completeness. This involved checking for missing values, identifying and managing outliers, and ensuring consistency across all variables. Missing data were addressed using mean imputation where applicable, while outliers identified through z-scores were carefully reviewed and processed to prevent any distortion of the results.

2.3. Analyses

Statistical analyses were performed using a two-tailed approach with a significance level set at p < 0.05, utilizing IBM SPSS Statistics (Version 26, New York, NY, USA). Pearson’s correlation was used to examine the relationship between different socio-economic factors (GDP per capita (USD), governance quality, population density (people per km2), and urbanization rate (%)) and their significant impact on the distribution and consequences of disasters, including the number of deaths, injuries, and natural disasters. Also, the assumptions for Pearson’s correlation, such as linearity, homoscedasticity, and normality of the variables, were met before conducting the analysis.
The data were analyzed using descriptive statistics to identify the geospatial and temporal patterns of natural and technological disasters. The statistical analysis included the following steps:
  • Analysis of the geographical distribution of disasters by continents for the period from 1900 to 2024. This included calculating the total number and percentage of different types of disasters on each continent. The geographical distribution was analyzed to identify regions with the highest frequency of disasters and to determine the specific characteristics of disasters in those regions, including their type, frequency, severity, and the resulting impacts on local communities and infrastructure.
  • Detailed analysis of the frequency of disasters by countries, including the identification of countries most affected by different types of disasters. The analysis included quantifying the number of events by country and assessing their impact on human and economic resources.
  • Analysis of temporal trends in the frequency of natural and technological disasters in 10- and 5-year intervals. This analysis enabled the identification of changes in the frequency and types of disasters over time, as well as the identification of periods with the highest disaster frequency.
The results are presented in tables and charts, illustrating the spatial and temporal patterns of disasters. The graphical representations included the following: (a) visualization of the geographical patterns of natural and technological disasters by continents and countries; and (b) a display of changes in the frequency of different types of disasters over time, with a particular focus on decadal and five-year intervals. The results of the analysis were validated using multiple data sources to ensure the accuracy and reliability of the findings. This included comparison with similar studies and the literature. Additionally, cross-validation methods were used to verify the consistency and reliability of the results obtained.

3. Results

The results of this study encompass a comprehensive overview of the geospatial and temporal patterns of natural and technological disasters, revealing key trends in their frequency, distribution, and impact across different geographic regions and periods. These findings provide valuable insights into the variations in and dynamics of disaster events, contributing to a better understanding of their historical patterns and informing future disaster risk management strategies.
Based on the methodological framework and study design above, the results were divided into two main sections, each with two subsections: (a) geographical distribution of natural and man-made (technological) disasters (in-depth analysis of disaster distribution by continent and country with comprehensive supporting data); and (b) temporal distribution of natural and man-made (technological) disasters (yearly and monthly trends in occurrences and consequences of natural and man-made (technological) disasters).

3.1. Geographical Distribution of Natural and Man-Made (Technological) Disasters

3.1.1. In-Depth Analysis of Disaster Distribution by Continent with Comprehensive Supporting Data

The geospatial distribution of both natural and man-made (technological) disasters across continents from 1900 to 2024 reveals significant trends and patterns in the frequency and spread of various disaster types (Table 1 and Figure 1 and Figure 2). A total of 25,836 disasters were recorded worldwide, of which 69.41% were natural disasters (16,567) and 30.59% were man-made (technological) disasters (9269). Key trends and patterns in the frequency and spread of various disaster types can be discerned through the examination of these data. Asia was found to have experienced the highest number of disasters, with 10,786 events, representing 41.75% of all recorded events. Following Asia, Africa encountered 5540 disasters (21.44%), and North America had 3575 events (13.84%). Oceania reported the fewest disasters, with 730 events, accounting for just 2.83%.
Natural disasters predominantly occurred in Oceania, where they comprised 91.51% of all recorded disasters. In North America, natural disasters constituted 75.75% of the total, while Asia and Europe had slightly lower percentages, at 61.89% and 64.54%, respectively. Africa had the smallest proportion of natural disasters at 56.21%.
In contrast, man-made (technological) disasters were most prevalent in Africa, accounting for 43.79% of all disasters on the continent. Asia followed with 38.11%, while Europe and South America reported 35.46% and 33.44%, respectively. Oceania had the lowest percentage of man-made (technological) disasters at just 8.49%. From the comprehensive data, it is evident that natural disasters dominate most continents, particularly in Oceania and North America. Despite Asia having the highest total number of disasters, it also had a significant proportion of man-made (technological) disasters (38.11%), highlighting the presence of technological accidents in the region. Africa’s notable percentage of man-made (technological) disasters (43.79%) may reflect various socio-economic factors and levels of infrastructural development (Table 1 and Figure 2).
An analysis of the geospatial distribution of both natural and man-made (technological) disasters across the continents from 1900 to 2024 reveals significant insights into regional vulnerabilities and disaster management challenges.
Natural disasters vary widely across continents, each facing unique challenges and frequencies. Here is a detailed look at the occurrences of different natural disasters (Table 2 and Figure 1 and Figure 2):
(a)
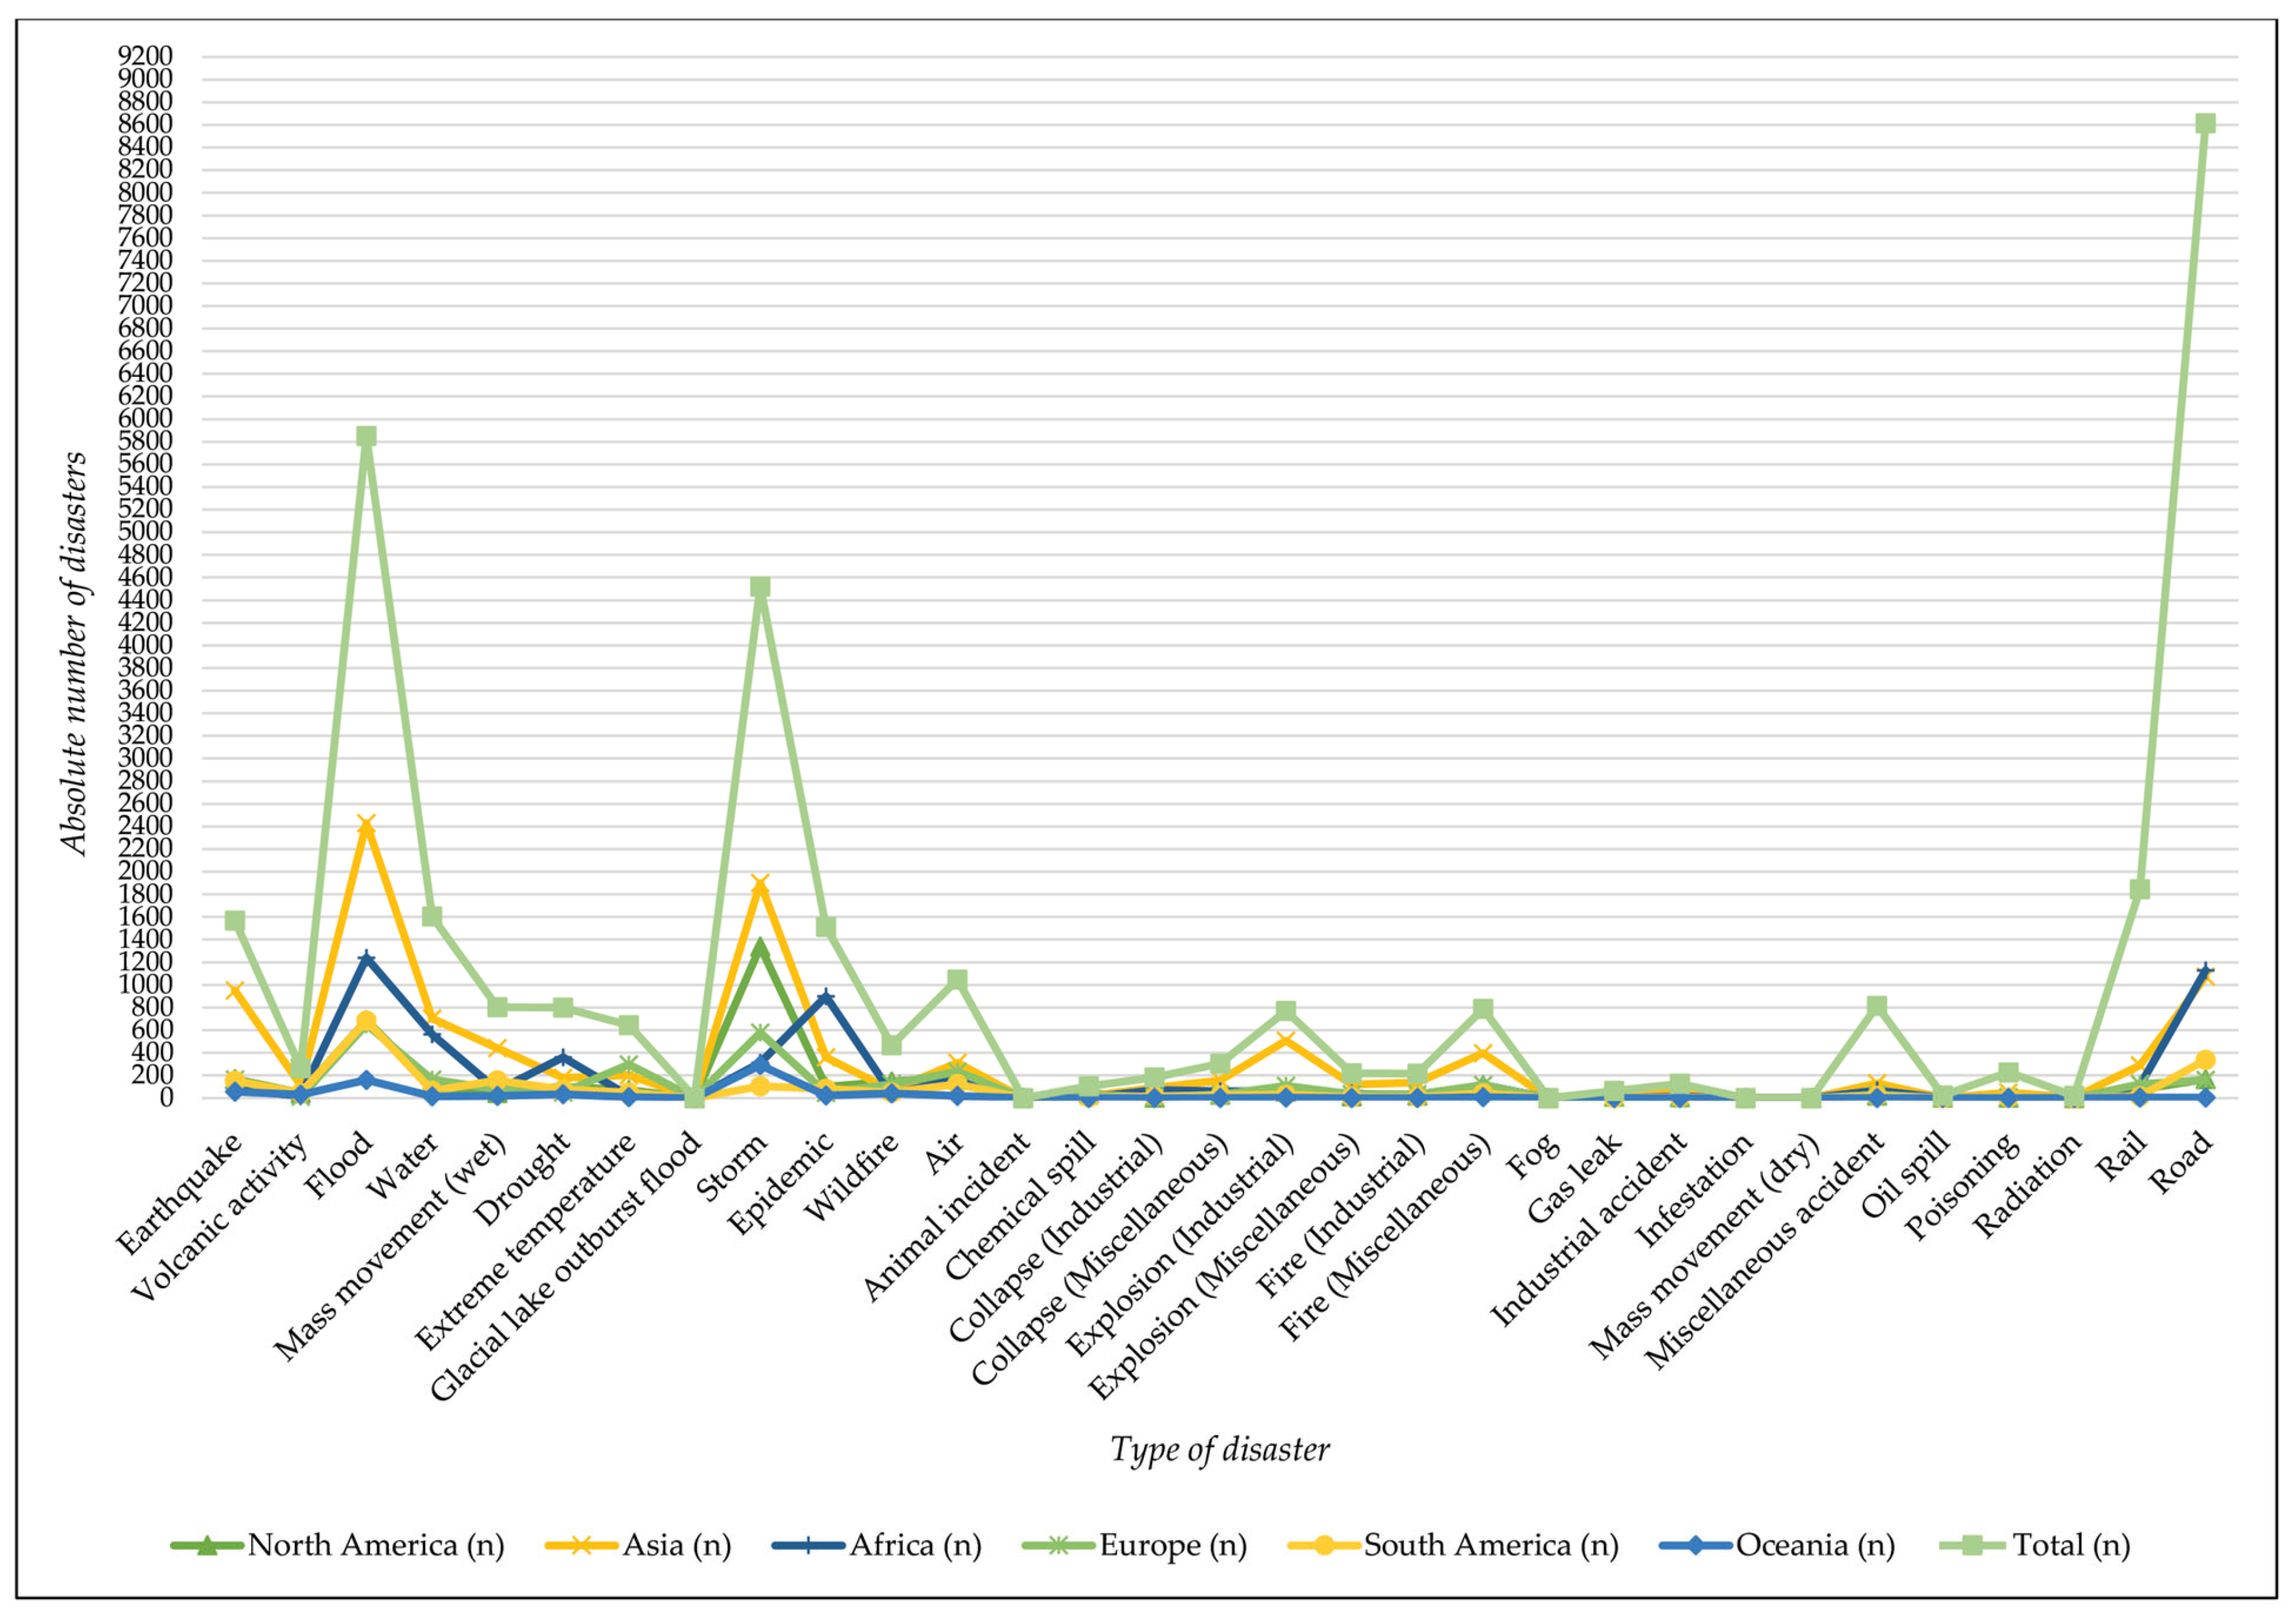
Earthquakes: Asia recorded the highest number of earthquakes (3.68%), followed by Europe (0.63%) and North America (0.65%). Oceania experienced the fewest earthquakes (0.22%);
(b)
Volcanic activity: volcanic activity was most prevalent in Asia (0.43%), while North America and South America each reported 45 events (0.17%). Europe had the least volcanic activity (0.04%);
(c)
Floods: floods were most frequent were in Asia (9.40%), with significant occurrences in Africa (4.80%) and North America (2.66%). Oceania had the fewest flood events (0.62%);
(d)
Water-related disasters (This category includes a wide range of water-related disasters, not just floods. It also covers incidents like glacial lake outburst floods and coastal erosion. The common thread is that water plays a crucial role in causing these events): these disasters were predominantly seen in Asia (2.72%), followed by Africa (2.17%) and North America (0.38%). Oceania experienced the least (0.05%);
(e)
Mass movement (wet): Asia experienced the most mass movement (wet) events (1.70%), followed by South America (0.60%) and Africa (0.26%). Oceania had the fewest (0.07%);
(f)
Drought: Africa reported the highest number of droughts (1.40%), while Asia had 0.69% and North America had 0.39% events. Oceania recorded the least, with 34 events (0.13%);
(g)
Extreme temperature: Europe led in extreme temperature events (1.15%), followed by Asia (0.77%) and North America (0.27%). On the other hand, Oceania had the fewest events (0.03%);
(h)
Storms: North America experienced the most storms (5.18%), followed by Asia (7.35%) and Europe (2.23%). South America reported the least, with 0.41 events;
(i)
Epidemics: epidemics were most common were in Africa (3.48%), followed by Asia (1.40%) and North America (0.39%). Oceania recorded the fewest, with 0.09% of events;
(j)
Wildfires: North America led in wildfire events (0.56%), followed by Europe (0.48%) and South America (0.19%). Asia had the fewest wildfires, with only 69 events (0.27%).
Man-made (technological) disasters, resulting from human activities, also show distinct patterns across continents (Table 2 and Figure 3):
(a)
Air disasters: Asia reported the highest number of air disaster events (1.21%), followed by Europe (0.90%) and North America (0.72%). Oceania had the fewest, with 0.08% of events;
(b)
Chemical spills: North America recorded the most chemical spill events (0.18%), while Asia reported 0.08% of events. Oceania had the least, with one incident (0.00%);
(c)
Industrial and miscellaneous collapses: Asia led in industrial collapses (0.34%) and miscellaneous collapses (0.60%). Africa followed by industrial collapses (0.27%) and miscellaneous collapses (0.24%);
(d)
Explosions: industrial explosions were most frequent in Asia with 509 events (1.97%), while miscellaneous explosions were also highest in Asia with 118 events (0.46%). Oceania had the fewest events in both categories, with four industrial explosions and zero miscellaneous explosions;
(e)
Fires (industrial and miscellaneous): North America recorded the most industrial fire events (0.09%) and miscellaneous fire events (0.43%). Oceania had the fewest events in both categories, with zero industrial fires and seven miscellaneous fires;
(f)
Gas leaks and oil spills: gas leaks were most common in Asia (0.15%), while oil spills were rare globally, with North America and Asia each reporting only a few events (three and two, respectively);
(g)
Poisoning and radiation events: Poisoning events were highest in Asia (0.19%), and radiation events were minimal worldwide, with North America and Asia each reporting only a few events (one and four, respectively);
(h)
Rail and road disasters: road disasters were highly prevalent in Asia (4.15%) and in Africa (4.37%). Rail disasters were more common in Asia (1.11%) and in Europe (0.47%).
These detailed distributions reveal specific regional vulnerabilities and can inform targeted disaster risk reduction strategies. For instance, Asia’s high frequency of both natural and man-made (technological) disasters highlights the need for comprehensive disaster management plans. Similarly, Africa’s significant number of man-made (technological) disasters indicates a need for improved technological safety and infrastructure development (Table 2 and Figure 3).

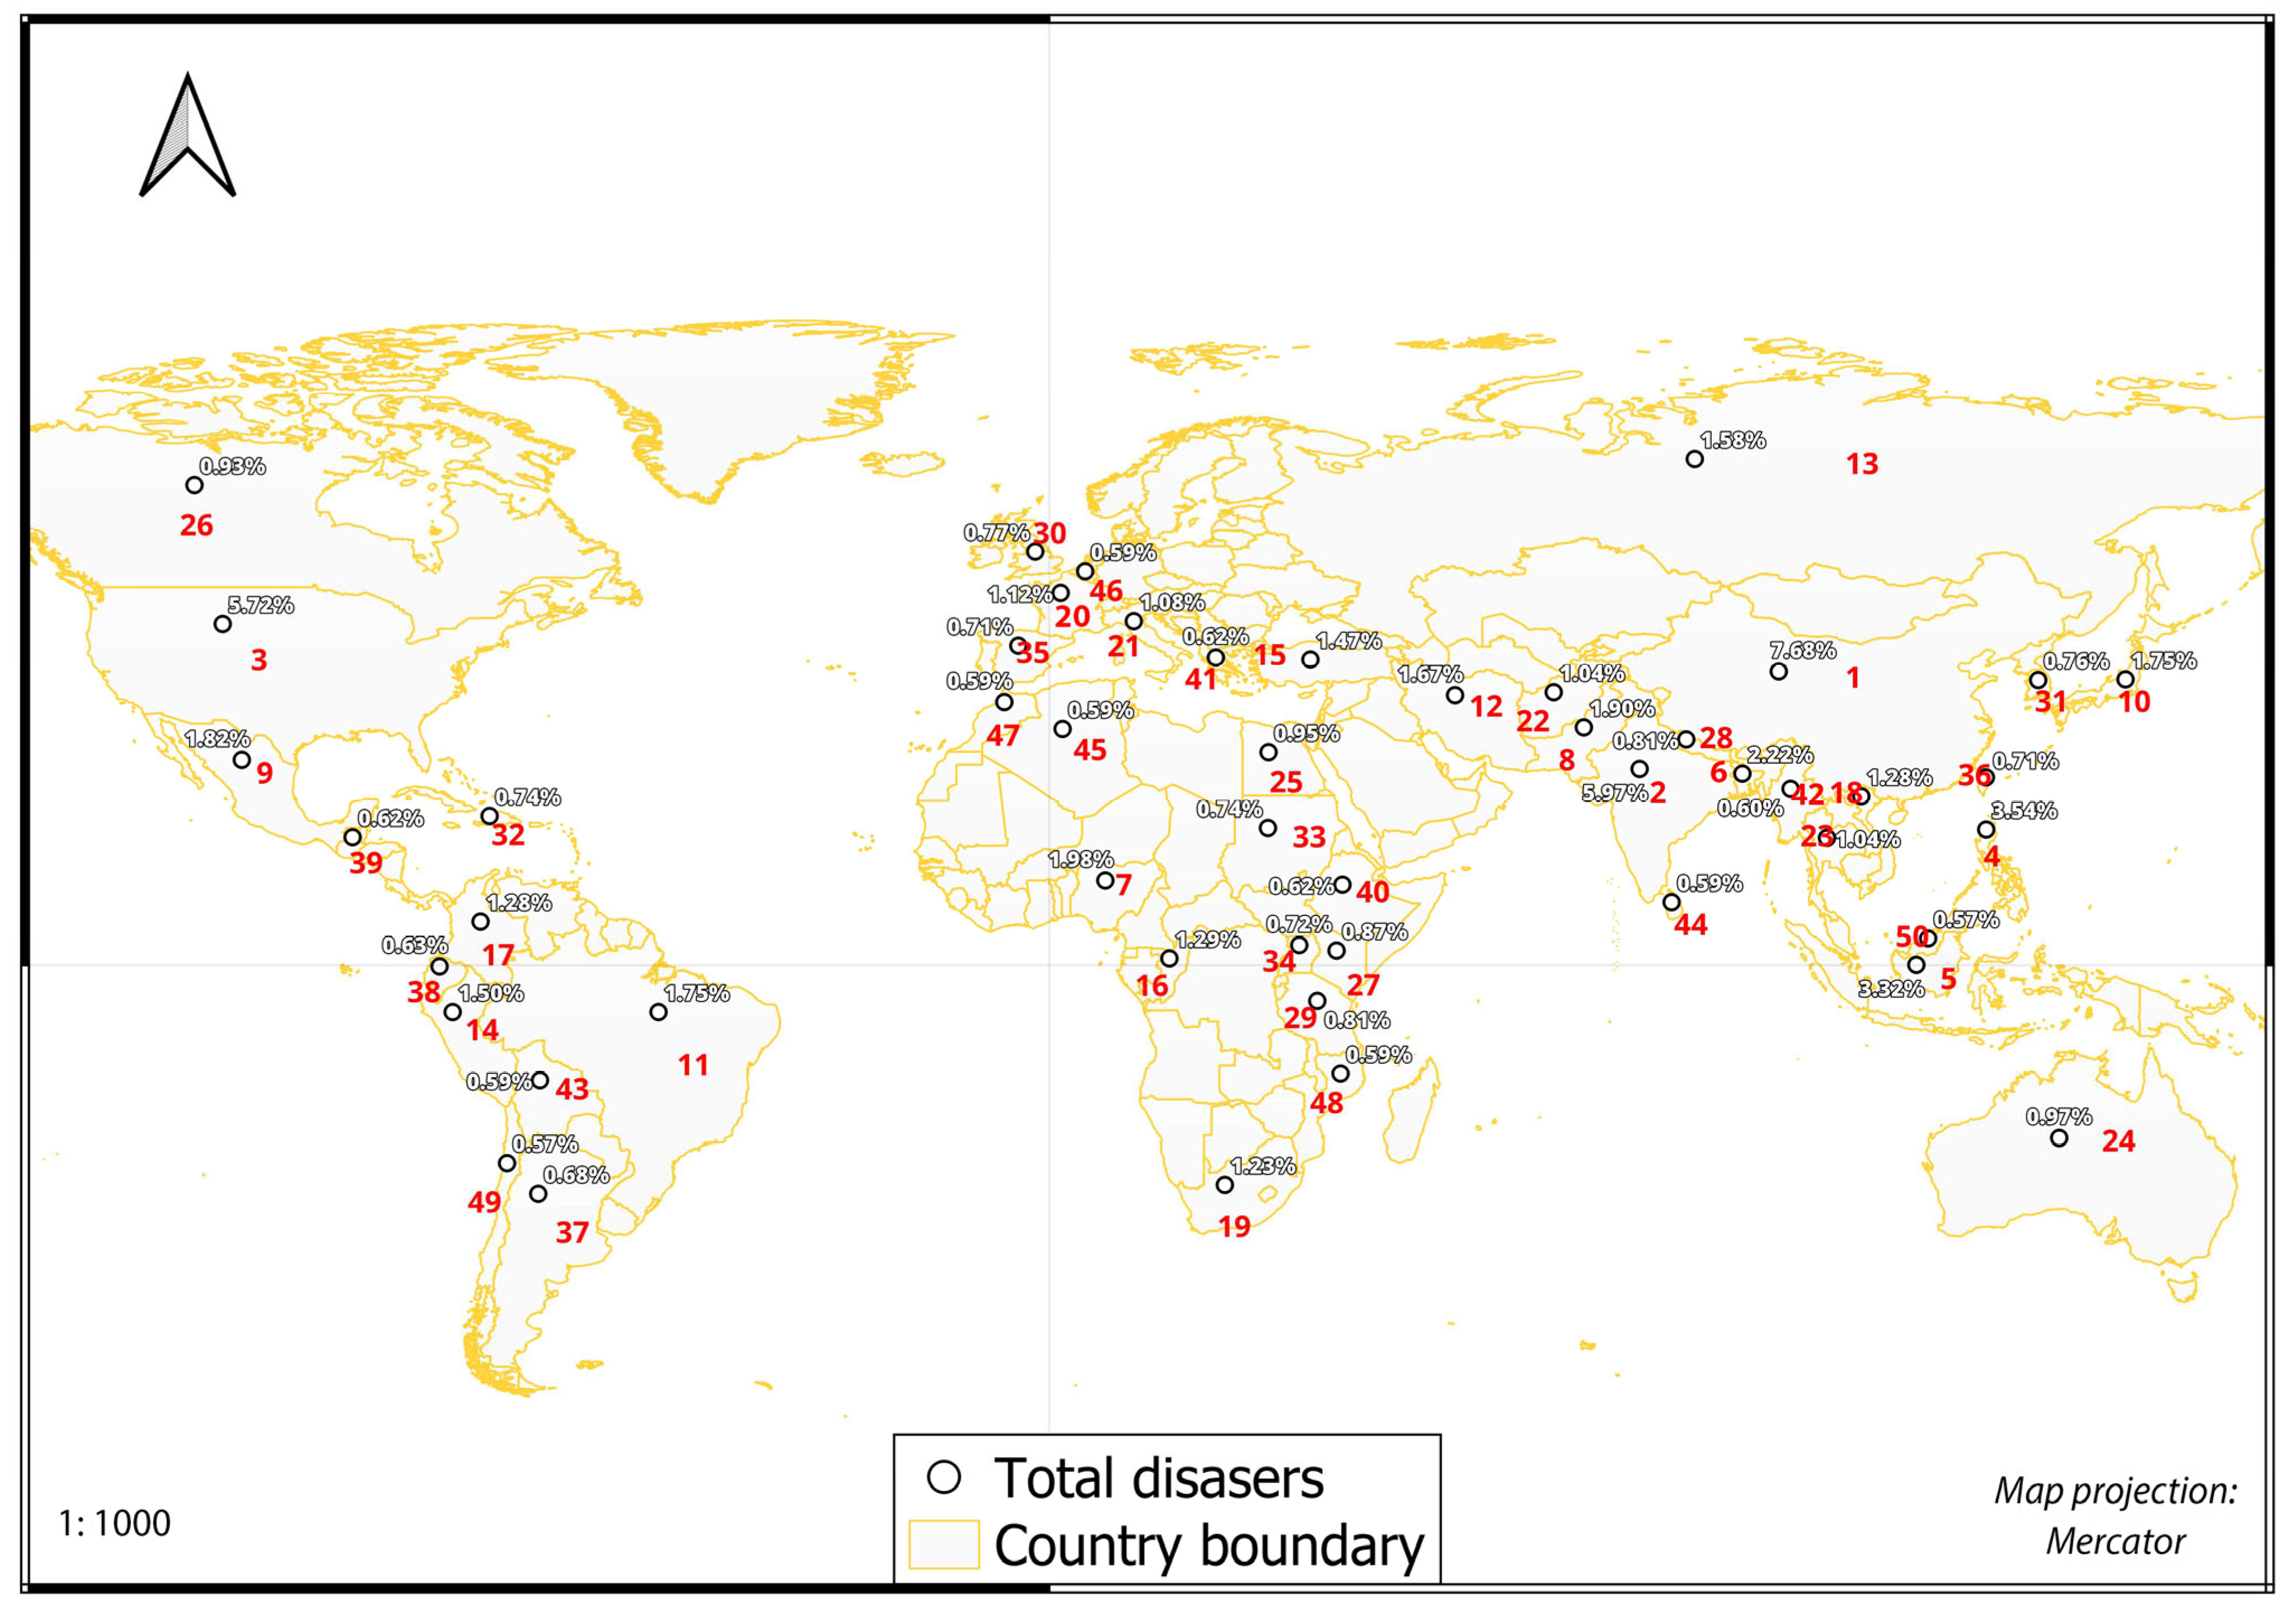
3.1.2. In-Depth Analysis of Disaster Distribution by Country with Comprehensive Supporting Data

A comprehensive overview of the distribution of total, natural, and man-made (technological) disasters by country from 1900 to 2024 highlights the most disaster-prone nations and the types of disasters they frequently encounter. Total disasters encompass all recorded events, both natural and man-made, that have occurred within a given country. This measure provides insight into the overall disaster burden each country faces and helps in identifying areas that may require enhanced disaster preparedness and mitigation efforts (Table 3 and Figure 4 and Figure 5):
(1)
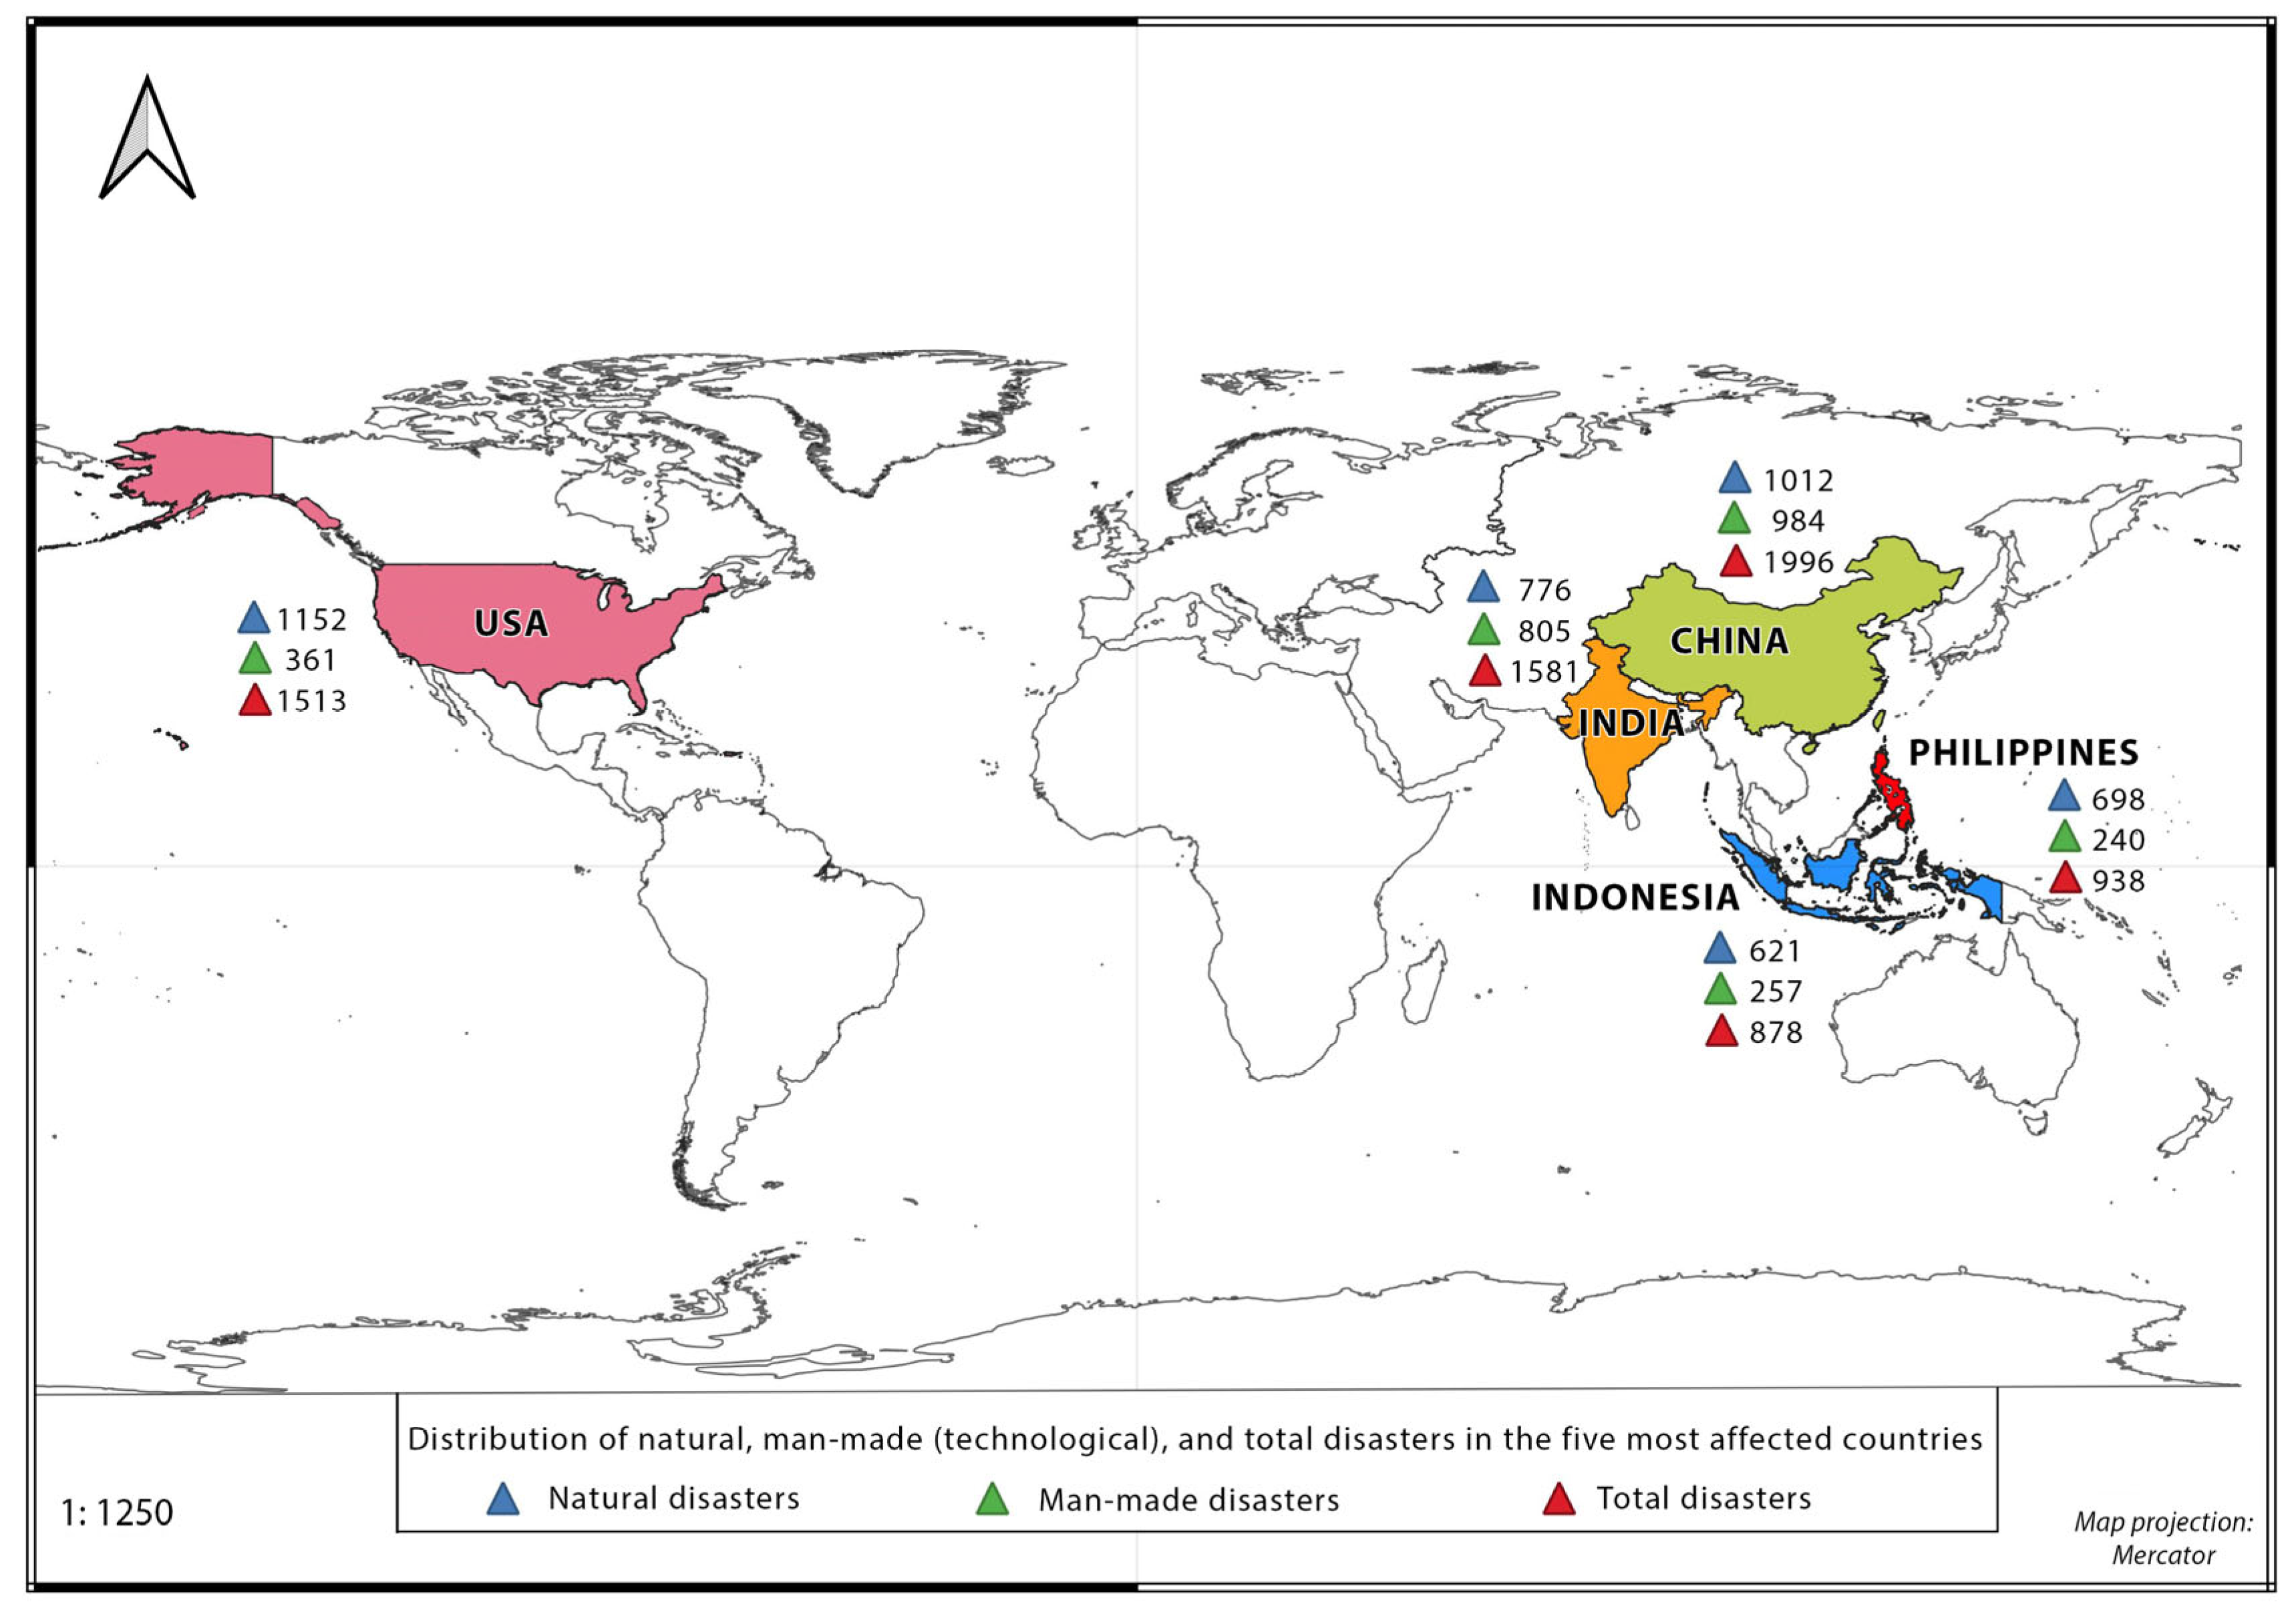
China ranks first with a total of 1996 disaster events, comprising 7.54% of the global total. Natural disasters make up 50.70% (1012 events) of China’s total, while man-made (technological) disasters account for 49.30% (984 events). The top five disasters in China included industrial accidents (15.08%), storms (14.73%), floods (14.53%), droughts (14.28%), and epidemics (14.23%);
(2)
India follows with 1581 disaster events (5.97% of the global total). Natural disasters represent 49.08% (776 events), and man-made (technological) disasters represent 50.92% (805 events). The most frequent disasters were epidemics (15.50%), industrial accidents (14.86%), droughts (14.80%), floods (14.29%), and epidemics again (14.17%);
(3)
The USA is third with 1513 disaster events (5.72% of the global total). Natural disasters dominate with 76.14% (1152 events), and man-made (technological) disasters constitute 23.86% (361 events). The top disasters included epidemics (15.27%), industrial accidents (14.87%), droughts (14.47%), floods (14.41%), and wildfires (13.88%);
(4)
The Philippines ranks fourth with 938 disaster events (3.54% of the global total). Natural disasters account for 74.41% (698 events), and man-made (technological) disasters account for 25.59% (240 events). The leading disasters were industrial accidents (16.10%), storms (14.71%), droughts (14.50%), epidemics (14.39%), and wildfires (14.18%);
(5)
Indonesia is fifth with 878 disaster events (3.32% of the global total). Natural disasters make up 70.73% (621 events), while man-made (technological) disasters account for 29.27% (257 events). The most common disasters were floods (16.40%), earthquakes (15.15%), droughts (15.03%), epidemics (14.81%), and wildfires (13.44%);
(6)
Bangladesh ranks sixth with 588 disaster events (2.22% of the global total). Natural disasters constitute 61.73% (363 events), and man-made (technological) disasters account for 38.27% (225 events). The top disasters included floods (15.99%), droughts (15.14%), industrial accidents (15.14%), epidemics (14.97%), and storms (13.27%);
(7)
Nigeria is seventh with 523 disaster events (1.98% of the global total). Man-made disasters are prevalent, accounting for 72.66% (380 events), while natural disasters make up 27.34% (143 events). The leading disasters were wildfires (16.63%), storms (16.44%), industrial accidents (14.72%), epidemics (14.53%), and droughts (13.38%);
(8)
Pakistan is eighth with 504 disaster events (1.90% of the global total). Natural disasters represent 50.40% (254 events), and man-made (technological) disasters represent 49.60% (250 events). The most frequent disasters included floods (15.08%), wildfires (15.08%), storms (14.88%), industrial accidents (14.29%), and epidemics (13.89%);
(9)
Mexico ranks ninth with 481 disaster events (1.82% of the global total). Natural disasters make up 63.20% (304 events), and man-made (technological) disasters make up 36.80% (177 events). The top disasters were wildfires (17.88%), epidemics (15.59%), floods (15.18%), droughts (13.51%), and epidemics again (12.89%);
(10)
Japan is tenth with 464 disaster events (1.75% of the global total). Natural disasters are dominant, comprising 83.84% (389 events), while man-made (technological) disasters account for 16.16% (75 events). The leading disasters included wildfires (17.24%), earthquakes (15.73%), storms (15.09%), droughts (14.44%), and industrial accidents (13.79%).
Natural disasters include events such as earthquakes, floods, droughts, storms, and other environmental phenomena (Table 3 and Figure 4, Figure 5 and Figure 6). These events are often influenced by geographical and climatic factors unique to each country. China ranks first in natural disasters with 1012 events (50.70% of its total), primarily including floods, storms, and droughts. The USA had the second-highest number of natural disaster events with 1152 (76.14% of its total), with major events being epidemics, storms, and floods. India follows with 776 natural disaster events (49.08% of its total), with frequent occurrences of epidemics, floods, and droughts. The Philippines reported 698 natural disaster events (74.41% of its total), dominated by storms, floods, and droughts. Indonesia had 621 natural disaster events (70.73% of its total), primarily floods, earthquakes, and droughts. Bangladesh experienced 363 natural disaster events (61.73% of its total), with floods, droughts, and storms being the most common. Japan reported 389 natural disaster events (83.84% of its total), with wildfires, earthquakes, and storms as the leading types. Mexico had 304 natural disaster events (63.20% of its total), with wildfires, floods, and epidemics being the most prevalent. Pakistan had 254 natural disaster events (50.40% of its total), mainly floods, wildfires, and storms. Brazil reported 283 natural disaster events (61.26% of its total), with the most common being epidemics, wildfires, and droughts (Table 3 and Figure 4, Figure 5 and Figure 6).
Man-made (technological) disasters refer to events caused by human activity, such as industrial accidents, chemical spills, and other incidents related to technological failures or human error (Table 3 and Figure 4, Figure 5 and Figure 6). Regarding this, China ranks first in man-made (technological) disasters with 984 events (49.30% of its total), dominated by industrial accidents and chemical spills. India had 805 man-made disaster events (50.92% of its total), with the leading types being industrial accidents and chemical spills. Nigeria experienced 380 man-made disaster events (72.66% of its total), with the most common being industrial accidents and fires. The USA reported 361 man-made disaster events (23.86% of its total), primarily industrial accidents and chemical spills. Indonesia had 257 man-made disaster events (29.27% of its total), mainly industrial accidents and fires. Bangladesh recorded 225 man-made disaster events (38.27% of its total), with the top events being industrial accidents and chemical spills. Russia had 239 man-made disaster events (57.31% of its total), with common types including industrial accidents and fires. Japan reported 75 man-made disaster events (16.16% of its total), primarily industrial accidents and chemical spills. Mexico experienced 177 man-made disaster events (36.80% of its total), dominated by industrial accidents and fires. Pakistan had 250 man-made disaster events (49.60% of its total), with the leading types being industrial accidents and fires (Table 3 and Figure 4, Figure 5 and Figure 6).
These insights emphasize the importance of tailoring disaster risk reduction strategies to the specific needs and vulnerabilities of each country. For instance, countries with high natural disaster frequencies, such as Japan and Australia, may prioritize early warning systems and infrastructure resilience, while those with a higher prevalence of man-made (technological) disasters, like Nigeria and Egypt, may focus on industrial safety and emergency response protocols.

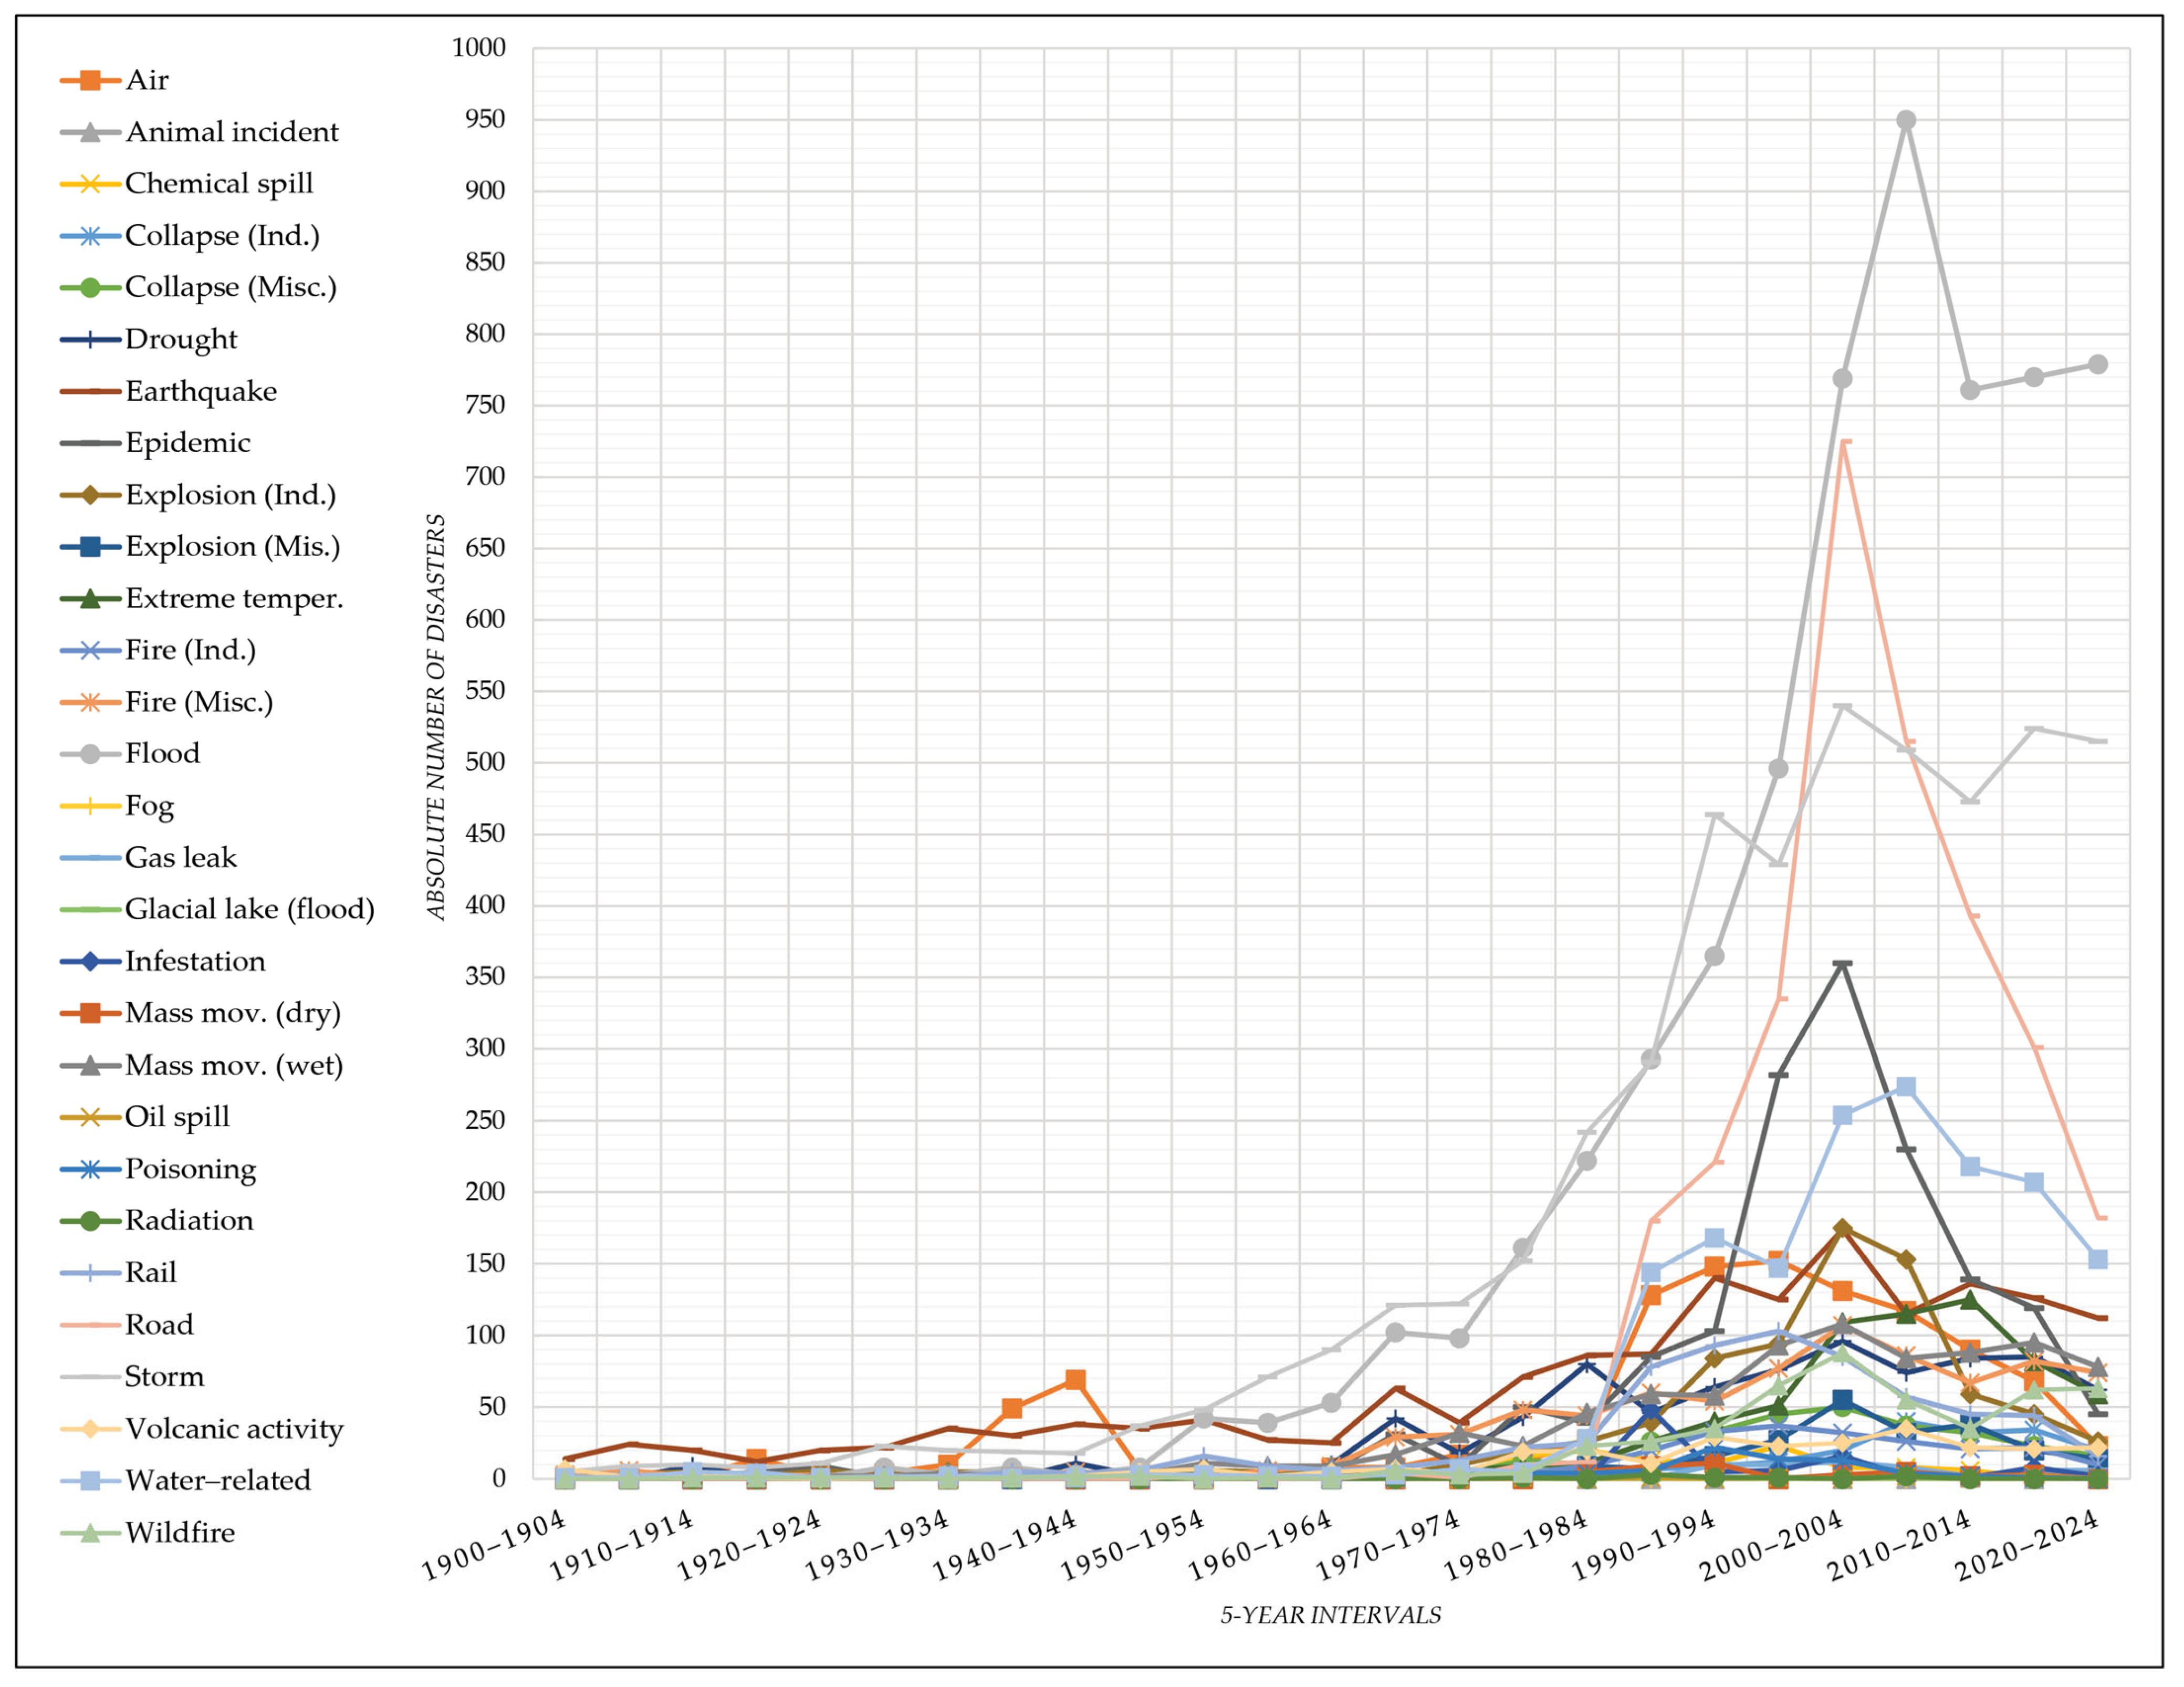
3.2. Temporal Distribution of Natural and Man-Made (Technological) Disasters

3.2.1. Yearly and Monthly Trends in Occurrences of Natural and Man-Made Disasters

A temporal analysis of natural and man-made (technological) disasters over 10-year intervals from 1900 to 2024 highlights the trends and changes in the frequency and distribution of disasters over time (Table 4 and Figure 7). This analysis offers insights into how disaster patterns have evolved and what factors may influence these trends.
(a)
From 1900–1910, there were 101 total disaster events, with natural disasters comprising 78.22% (79 events) and man-made (technological) disasters 21.78% (22 events). The overall trend was stable, with no significant change in the rate of disasters;
(b)
Between 1911–1920, a total of 121 disaster events were recorded, showing an increase of 19.57% from the previous decade. Natural disasters made up 64.46% (78 events), while man-made (technological) disasters accounted for 35.54% (43 events). This decade marks the beginning of an upward trend in disaster events;
(c)
During the 1921–1930 period, the number of disaster events increased to 132, a 7.40% rise from the previous decade. Natural disasters constituted 80.30% (106 events), and man-made (technological) disasters constituted 19.70% (26 events). The upward trend continued;
(d)
From 1931–1940, there were 217 disaster events, representing a significant increase of 42.20%. Natural disasters made up 61.29% (133 events), while man-made (technological) disasters accounted for 38.71% (84 events). This decade saw a substantial rise in the number of disasters;
(e)
In the 1941–1950 decade, the number of disasters increased to 281, an 11.73% rise from the previous decade. Natural disasters comprised 60.85% (171 events), and man-made (technological) disasters comprised 39.15% (110 events). The trend of increasing disaster events persisted;
(f)
From 1950–1960, there were 378 disaster events, marking a 10.05% increase. Natural disasters accounted for 82.01% (310 events), while man-made (technological) disasters accounted for 17.99% (68 events). This decade continued the upward trend;
(g)
The 1961–1970 period saw the number of disasters rise to 690, a 13.59% increase. Natural disasters constituted 86.09% (594 events) and man-made (technological) disasters 13.91% (96 events). The trend of increasing disasters continued;
(h)
Between 1970–1980, a total of 1144 disaster events were recorded, a 6.10% rise from the previous decade. Natural disasters made up 76.14% (871 events), while man-made (technological) disasters accounted for 23.86% (273 events). The upward trend in disaster frequency persisted;
(i)
From 1981–1990, the number of disasters significantly increased to 2718, a 5.33% rise from the previous decade. Natural disasters constituted 64.57% (1755 events), and man-made (technological) disasters 35.43% (963 events). This decade saw a substantial rise in disaster events;
(j)
In the 1991–2000 period, there were 4995 disaster events, a 1.71% increase. Natural disasters made up 59.20% (2957 events), while man-made (technological) disasters were 40.80% (2038 events). The trend of increasing disasters continued;
(k)
From 2001–2010, the number of disasters rose to 7651, a 0.70% increase. Natural disasters accounted for 58.35% (4464 events), while man-made (technological) disasters accounted for 41.65% (3187 events). This decade continued the upward trend;
(l)
Between 2011–2020, the number of disasters decreased to 5713, marking a decrease of 0.44%. Natural disasters made up 65.78% (3758 events), and man-made (technological) disasters made up 34.22% (1955 events). This decade saw the beginning of a downward trend;
(m)
From 2021–2024, there were 2323 disaster events, marking a decrease of 2.49%. Natural disasters constituted 75.20% (1747 events), and man-made (technological) disasters accounted for 24.80% (576 events). It is important to recognize that this analysis for this period is based on a period of only four years, which is notably shorter than the previous decades under review. This limited timeframe may not adequately reflect longer-term trends and could be subject to short-term fluctuations in disaster occurrences. As a result, while the data suggest a decline, it is advisable to interpret these findings with caution and avoid drawing definitive conclusions from such a brief period. (Table 4 and Figure 7).
The early 20th century (1900–1940) experienced relatively fewer disaster events with a stable but gradually increasing trend. The increase in man-made (technological) disasters began to become more noticeable during these periods. In addition, the mid-20th century (1940–1970) saw a significant rise in disaster events, with both natural and man-made (technological) disasters contributing to the increase.
Technological advancements and industrial activities likely influenced the rise in man-made (technological) disasters. Likewise, the late 20th century (1970–2000) experienced the highest increases in disaster events, particularly in the 1980s and 1990s. This period saw a peak in both natural and man-made (technological) disasters, indicating heightened vulnerability—referring to the susceptibility of communities to suffer harm—and exposure, which refers to the extent to which people, property, and infrastructure are in harm’s way (Table 4 and Figure 7).
The early 21st century (2000–2020) continued the trend of increasing disaster events, although the rate of increase began to slow down by 2010. There was a noticeable shift with a higher proportion of man-made (technological) disasters. Conversely, the most recent decade (2021–2024) shows a decreasing trend in the number of disaster events, with a significant reduction in both natural and man-made (technological) disasters. This decrease may be attributed to improved disaster management practices, early warning systems, and increased global awareness of disaster risks (Table 4 and Figure 7).
Overall, the temporal analysis revealed a dynamic pattern of disaster occurrences, with significant increases in the mid-to-late 20th century followed by a gradual decline in recent years. These trends underscore the importance of continuous improvement in disaster risk reduction and management strategies to mitigate the impact of both natural and man-made (technological) disasters (Table 4 and Figure 7).
A temporal analysis of natural and man-made (technological) disasters over 5-year intervals from 1900 to 2024 revealed trends and changes in the frequency and distribution of disasters over shorter periods (Table 5 and Figure 8). This analysis offers more granular insights into how disaster patterns have evolved and what factors may influence these trends.
From 1900 to 1905, there were 43 total disaster events, with natural disasters comprising 81.40% (35 events) and man-made (technological) disasters 18.60% (8 events). The overall trend was stable, with no significant change in the rate of disasters. Moving into the next five years, a total of 58 disaster events were recorded between 1905 and 1910, showing a 34.88% increase from the previous period. Natural disasters made up 75.86% (44 events), while man-made (technological) disasters accounted for 24.14% (14 events). From 1910 to 1915, the number of disaster events rose to 61, a 5.17% rise from the previous period. Natural disasters constituted 77.05% (47 events), and man-made (technological) disasters accounted for 22.95% (14 events). The period from 1915 to 1920 saw a slight decrease to 60 disaster events, representing a 1.64% decline. Natural disasters made up 51.67% (31 events), while man-made (technological) disasters accounted for 48.33% (29 events).
From 1920 to 1925, the number of disaster events increased again to 61, a 1.67% rise from the previous period. Natural disasters comprised 77.05% (47 events), and man-made (technological) disasters comprised 22.95% (14 events). Between 1925 and 1930, the number of disaster events rose to 71, marking a 16.39% increase. Natural disasters accounted for 83.10% (59 events), while man-made (technological) disasters accounted for 16.90% (12 events). The period from 1930 to 1935 saw the number of disasters increase to 88, a 23.94% rise. Natural disasters constituted 77.27% (68 events), and man-made (technological) disasters accounted for 22.73% (20 events). From 1935 to 1940, a significant increase to 129 disaster events was recorded, a 46.59% rise. Natural disasters made up 50.39% (65 events), while man-made (technological) disasters accounted for 49.61% (64 events). Between 1940 and 1945, there were 160 disaster events, representing a 24.03% increase. Natural disasters comprised 48.12% (77 events), and man-made (technological) disasters comprised 51.88% (83 events).
The period from 1945 to 1950 saw a decrease to 121 disaster events, marking a 24.38% decline. Natural disasters accounted for 77.69% (94 events), while man-made (technological) disasters accounted for 22.31% (27 events). Between 1950 and 1955, there were 192 disaster events, a 58.68% increase. Natural disasters made up 81.77% (157 events), and man-made (technological) disasters accounted for 18.23% (35 events). From 1955 to 1960, the number of disasters slightly decreased to 186, a 3.12% decline. Natural disasters comprised 82.26% (153 events), and man-made (technological) disasters comprised 17.74% (33 events). Between 1960 and 1965, the number of disasters increased to 238, a 27.96% rise. Natural disasters accounted for 85.71% (204 events), while man-made (technological) disasters accounted for 14.29% (34 events). From 1965 to 1970, there were 452 disaster events, a significant 89.92% increase. Natural disasters made up 86.28% (390 events), and man-made (technological) disasters accounted for 13.72% (62 events).
The period from 1970 to 1975 saw a slight decrease to 435 disaster events, a 3.76% decline. Natural disasters constituted 77.24% (336 events), and man-made (technological) disasters accounted for 22.76% (99 events). From 1975 to 1980, there were 709 disaster events, marking a 62.99% increase. Natural disasters accounted for 75.46% (535 events), while man-made (technological) disasters accounted for 24.54% (174 events). Between 1980 and 1985, the number of disasters increased to 1009, a 42.31% rise. Natural disasters comprised 76.71% (774 events), and man-made (technological) disasters comprised 23.29% (235 events). From 1985 to 1990, there were 1709 disaster events, a significant 69.38% increase. Natural disasters made up 57.40% (981 events), and man-made (technological) disasters accounted for 42.60% (728 events). Between 1990 and 1995, the number of disasters increased to 2245, a 31.36% rise. Natural disasters constituted 58.53% (1314 events), while man-made (technological) disasters accounted for 41.47% (931 events).
The period from 1995 to 2000 saw a total of 2750 disaster events, a 22.49% increase. Natural disasters accounted for 59.75% (1643 events), and man-made (technological) disasters accounted for 40.25% (1107 events). Between 2000 and 2005, the number of disasters rose to 4039, marking a 46.87% increase. Natural disasters made up 56.72% (2291 events), while man-made (technological) disasters accounted for 43.28% (1748 events). From 2005 to 2010, the number of disasters slightly decreased to 3612, a 10.57% decline. Natural disasters constituted 60.16% (2173 events), and man-made (technological) disasters accounted for 39.84% (1439 events). Between 2010 and 2015, there were 2928 disaster events, an 18.94% decrease. Natural disasters comprised 63.66% (1864 events), and man-made (technological) disasters comprised 36.34% (1064 events). From 2015 to 2020, the number of disasters slightly decreased to 2785, a 4.88% decline. Natural disasters made up 68.01% (1894 events), while man-made (technological) disasters accounted for 31.99% (891 events). Between 2020 and 2025, there were 2323 disaster events, marking a 16.59% decline. Natural disasters constituted 75.20% (1747 events), and man-made (technological) disasters comprised 24.80% (576 events) (Table 5 and Figure 8).
Short-term fluctuations in disaster occurrences, such as sudden increases or decreases in the number of events, can have a significant impact on long-term trends and must be carefully analyzed to understand their broader implications. These variations may be influenced by factors such as natural phenomena like El Niño [87], which can temporarily increase certain types of disasters like floods and droughts, or socio-political events that affect how disasters are reported and responded to. For example, advancements in early warning systems [36,88,89,90] or changes in land use policies [91,92,93] could reduce the impact of disasters in the short term, leading to a perceived decrease in their frequency. However, these fluctuations might either indicate emerging trends or simply reflect temporary deviations from the overall pattern.
As previously mentioned, a steady increase in disaster events was observed in the early 20th century, with natural disasters predominating and the rise in man-made (technological) disasters becoming more noticeable. Significant increases during 1930–1945 highlight the impact of technological advancements and urbanization. Following this, the post-World War II period saw a significant rise in disaster events, peaking around 1940–1945, followed by a slight decline likely due to post-war recovery efforts and improvements in infrastructure and disaster management.
From 1965 to 1985, there was a rapid increase in the number of disaster events, especially natural disasters. This growth was driven by factors such as population growth, urbanization, and increased industrial activity, leading to heightened exposure and vulnerability to disasters. The period between 1985 and 2005 marked the peak and subsequent stabilization of disaster events. Both natural and man-made (technological) disasters saw significant increases, reflecting the complexities of modern societal and environmental challenges.
In recent years, specifically from 2005 to 2025, there has been a gradual decline in the number of disaster events, with notable decreases in both natural and man-made (technological) disasters. This trend may be attributed to improved disaster risk reduction strategies, advancements in early warning systems, and increased global awareness and preparedness for disaster risks. These insights highlight the dynamic nature of disaster occurrences over time, emphasizing the need for continuous adaptation and improvement in disaster management practices to address both natural and man-made challenges. The periods of significant increase and subsequent decline underscore the importance of sustained efforts in building resilient communities and mitigating disaster impacts.
In addition to the observed trends, several interesting insights and considerations can be drawn from the temporal analysis of natural and man-made (technological) disasters from 1900 to 2024. The mid-20th century saw a sharp increase in man-made (technological) disasters, particularly from 1940–1945 and 1985–2005, corresponding with significant technological and industrial advancements (Table 5 and Figure 8). This period indicates that rapid industrialization and technological development can contribute to a higher incidence of man-made (technological) disasters. The gradual decline in disaster events post 2005 suggests the effectiveness of global policies, international cooperation, and enhanced disaster risk reduction (DRR) frameworks, such as the Sendai Framework for Disaster Risk Reduction adopted in 2015.
Table 6 provides a detailed look at the total number of various natural and man-made (technological) disasters recorded each decade from 1900 to 2020. This analysis sheds light on the types and frequency of different disasters over time, offering insights into how disaster patterns have evolved and revealing trends in specific types of disasters.
Earthquakes were consistently reported, with the highest number in the 2000s at 289 events, likely due to increased seismic activity or better reporting. Also, epidemics saw a sharp increase in the 1990s with 385 events and peaked in the 2000s with 590 events, reflecting global health challenges. Industrial explosions peaked in the 2000s with 328 events, while miscellaneous explosions rose to 87 events in the same decade. Extreme temperatures saw a significant rise in the 2000s with 224 events, underscoring the effects of climate change. Industrial fires peaked in the 1990s with 70 events, whereas miscellaneous fires increased steadily, peaking in the 2000s with 193 events. Floods showed a dramatic rise, peaking in the 2000s with 1719 events, indicating greater rainfall variability and extreme weather events.
Air disasters first appeared in the 1910s with 15 events, gradually increasing and peaking in the 1990s with 300 events. This trend reflects significant technological advancements and increased air traffic during that period. However, a noticeable decline occurred in the 2010s, with 158 events. Animal incidents were rarely recorded, with only one incident noted in the 2010s. Chemical spills were first documented in the 1960s with 1 event, rising to a peak in the 1990s with 34 events, then declining to 7 events in the 2010s. Industrial collapses began in the 1950s, reaching a peak in the 2000s with 60 events, while miscellaneous collapses steadily increased, peaking in the 2000s with 87 events. Droughts were consistently recorded across decades, peaking in the 2000s with 170 events, highlighting the impact of climate change.
Fog, gas leaks, and oil spills were rarely recorded but saw notable increases in certain decades, with gas leaks peaking in the 2000s with 20 events. Glacial lake outburst floods were infrequent, with a few incidents noted in recent years, pointing to climate change impacts. Infestations peaked in the 1980s with 48 events, showing occasional spikes due to ecological changes. Wet mass movements steadily increased, peaking in the 2000s with 192 events, reflecting more rainfall and landslide activity. Poisonings and radiation incidents were seldom recorded, with spikes such as poisoning incidents peaking in the 1990s with 36 events.
Road disasters significantly increased, peaking in the 2000s with 1240 events due to more vehicular traffic, while rail disasters remained steady, peaking in the 1990s with 196 events. Storms consistently increased, peaking in the 2000s with 1049 events, reflecting more frequent and intense storm activity due to climate change. Volcanic activity remained relatively stable with slight increases, peaking in the 2000s with 60 events. Water-related disasters rose significantly, peaking in the 2000s with 528 events, highlighting issues such as flooding and water scarcity. Wildfires showed a gradual rise, peaking in the 2000s with 143 events, reflecting higher temperatures and drier conditions (Table 6 and Figure 9).
The mid to late 20th century saw a sharp rise in industrial and technological disasters, reflecting industrial growth, urbanization, and increased technological activities. A noticeable increase in climate-related disasters such as floods, droughts, extreme temperatures, and wildfires in recent decades underscores the impact of climate change. The significant rise in the number of recorded disasters, particularly from the 1960s onwards, may also be due to improved reporting mechanisms, greater global awareness, and better disaster monitoring systems. The spike in epidemics and chemical spills in the late 20th and early 21st centuries highlights ongoing health and environmental challenges (Table 6 and Figure 9). Additionally, the recent decline in certain disasters, such as air disasters and some industrial incidents, suggests improvements in disaster management, safety protocols, and preparedness measures.
Table 7 provides a detailed breakdown of the total number of different natural and man-made (technological) disasters recorded in 5-year intervals from 1900 to 2024. Air disasters began to be recorded from 1910–1914 with 1 event, peaking in the 1985–1989 period with 128 events. This trend shows significant technological advancements and increased air traffic contributing to these numbers. There was a noticeable decline in recent periods, with 23 events recorded in 2021–2024. Animal incidents were rarely recorded, with only one incident noted in the 2010–2014 period (Figure 10).
Chemical spills were first recorded in the 1965–1969 period with 1 event, peaking in the 1995–1999 period with 23 events. A decline was observed in recent periods, with no events recorded in 2020–2024. Industrial collapses began in the 1950–1954 period, peaking in the 2000–2004 period with 20 events. Miscellaneous collapses showed a steady increase, peaking in the 1995–1999 period with 45 events.
Droughts were recorded consistently across the periods, peaking in the 2000–2004 period with 96 events, showing the impact of climate change and variability. Earthquakes were consistently recorded, with the highest number in the 2000–2004 period at 174 events, reflecting increased seismic activity or improved reporting. Epidemics saw a sharp increase in the 1990–1994 period with 103 events, peaking in the 2000–2004 period with 360 events, reflecting global health challenges.
Industrial explosions peaked in the 2000–2004 period with 175 events, while miscellaneous explosions rose in the 2000–2004 period with 55 events. Extreme temperatures saw a significant rise in the 2000–2004 period with 109 events, highlighting the effects of climate change. Industrial fires peaked in the 1995–1999 period with 37 events, while miscellaneous fires increased consistently, peaking in the 2000–2004 period with 107 events.
Floods experienced a dramatic increase, peaking in the 2000–2004 period with 769 events, indicating higher rainfall variability and extreme weather events. Fog, gas leaks, and oil spills were rarely recorded, with notable increases in specific periods, such as gas leaks peaking in the 1995–1999 period with 10 events. Glacial lake outburst floods were rarely recorded, with a few incidents noted in the 2020–2024 period, indicating climate change impacts.
Infestations peaked in the 1985–1989 period with 48 events, showing occasional spikes due to ecological changes. Wet mass movements showed a steady increase, peaking in the 1995–1999 period with 93 events, reflecting increased rainfall and landslide activity. Poisonings and radiation incidents were rarely recorded, with occasional spikes such as poisoning incidents peaking in the 1990–1994 period with 22 events (Table 7 and Figure 10).
Road disasters showed a significant rise, peaking in the 2000–2004 period with 725 events, reflecting increased vehicular traffic. Rail disasters showed a steady number with a peak in the 1990–1994 period at 93 events. Storms consistently increased, peaking in the 2000–2004 period with 540 events, reflecting more frequent and intense storm activity due to climate change. Volcanic activity had a relatively stable number of events with slight increases, peaking in the 2005–2009 period with 35 events.
Water-related disasters saw a significant increase, peaking in the 2000–2004 period with 254 events, highlighting water-related issues such as flooding and water scarcity. Wildfires showed a gradual increase with a peak in the 2000–2004 period at 88 events, reflecting increased temperatures and dry conditions (Table 7 and Figure 10).
Table 8 offers a detailed seasonality analysis, showcasing the number of occurrences of various disaster types by month. This analysis highlights the monthly distribution and trends of different disasters, providing insights into how these events fluctuate throughout the year (Table 8). Air disasters reach their peak in July with 744 events, suggesting increased air traffic or weather-related factors during this month. Overall, the trend is above average, with a total of 1091 events, accounting for 4.123% of all recorded disasters. Conversely, animal incidents are rarely recorded, with only one incident noted in November, resulting in a below-average trend. Chemical spills also peak in July with 86 events, possibly due to seasonal industrial activities or increased transportation, but the overall trend remains below average with 108 events, making up 0.408% of all recorded disasters. Industrial collapses peak in November with 21 events, while miscellaneous collapses hit their highest point in July with 181 events, both showing a below-average trend.
Earthquakes peak in March with 316 events, likely due to seasonal tectonic activity, with an above-average (AA) trend totaling 1617 events, which represent 6.11% of all disasters. Droughts are most frequent in February, peaking at 326 events and reflecting seasonal climatic patterns, yet their overall trend is below average (BA) with a total of 813 events, or 3.072% of all recorded disasters. Epidemics also show a significant peak in July with 701 events, pointing to seasonal health challenges. This results in an above-average trend with 1526 events, making up 5.766% of all recorded disasters (Table 8).
Industrial explosions are most frequent in July, peaking at 411 events, while miscellaneous explosions also see increased activity during the summer months, both maintaining a below-average trend. Extreme temperatures peak in July with 280 events, highlighting the impact of summer heatwaves. Despite this, the overall trend is below average, with 652 events, constituting 2.464% of all disasters. Fires, both industrial and miscellaneous, also peak in July, with 121 and 440 events, respectively, yet both trends are below average. Floods show a dramatic increase in July with 2072 events, coinciding with monsoon and heavy rainfall periods. This results in an above-average trend, totaling 5941 events, or 22.449% of all recorded disasters (Table 8).
Fog, gas leaks, and oil spills are infrequent, with specific peaks in certain months but generally below-average trends. Glacial lake outburst floods are rarely recorded, with isolated incidents in January, April, and October. Infestations peak in July with 71 events, indicating seasonal ecological changes, yet the overall trend remains below average. Wet mass movements are most common in July, peaking at 427 events, which reflects seasonal rainfall and landslide activities, whereas dry mass movements are rarely recorded, showing no clear seasonal trend. Poisonings and radiation incidents are also rare, with peaks in specific months but generally below-average trends.
Road disasters peak in July with 1326 events, reflecting increased summer travel, while rail disasters also reach their highest point in July with 453 events. The trend for road disasters is above average, whereas rail disasters trend below average.
Storms peak in July with 2146 events, indicating seasonal storm activity, resulting in an above-average trend with a total of 4751 events, or 17.953% of all recorded disasters. Volcanic activity peaks in July with 120 events, showing a slight seasonal trend but remaining below average.
Water-related disasters peaked in July with 718 events, highlighting issues like floods and water scarcity. This results in an above-average trend, totaling 1635 events, which represent 6.178% of all recorded disasters.
Wildfires also peak in July with 239 events, reflecting dry and hot summer conditions. However, the overall trend is below average, with a total of 475 events, making up 1.795% of all recorded disasters.
The seasonality analysis reveals how climate and weather patterns significantly influence disaster occurrences, with many events peaking during the summer months due to extreme weather conditions. Disasters such as air incidents, earthquakes, epidemics, road accidents, storms, and water-related disasters tend to be more frequent during certain times of the year, showing above-average trends.
For instance, many disaster types, including floods, storms, and fires, reach their highest numbers in July. This pattern reflects the impact of summer weather conditions like monsoon rains, heat waves, and dry spells. The peaks in industrial and miscellaneous disasters during the summer months suggest that increased industrial activities, travel, and other human activities contribute to higher disaster frequencies during this period.
According to the monthly analysis, the highest number of disasters is recorded in July with 9135 incidents. This month is particularly prone to disasters due to significant spikes in air disasters (744), floods (2072), storms (2146), and road disasters (1326). The heightened summer activities and extreme weather conditions contribute to the high frequency of disasters during this period. Increased travel, intense heat, and seasonal storms make July especially disaster-prone (Table 8).
Following July, March records a total of 1921 disasters. This month is notable for the high number of earthquake occurrences (316) and floods (390). Seasonal weather changes, including the transition from winter to spring, likely contribute to these numbers. Shifting temperatures can lead to increased seismic activity and the onset of spring floods.
January ranks next with 1819 disasters. This month is characterized by a high number of flood occurrences (592), alongside significant events like earthquakes (197) and extreme temperatures (98). Winter conditions and the start of the year contribute to these disaster occurrences, with heavy rainfall and cold temperatures playing a major role.
In August, 1702 disasters were recorded, with notable numbers of floods (400), storms (217), and wildfires (239). The continuation of summer conditions, including heatwaves and droughts, contributes to this high disaster rate. Hot and dry conditions often lead to wildfires, while summer storms can cause severe flooding.
February sees 1158 disasters, with significant occurrences of floods (304), earthquakes (92), and extreme temperatures (81). The winter season and its associated weather patterns, including heavy rains and cold snaps, are likely causes of these disasters. The month is also characterized by winter storms and potential flooding from snowmelt.
In June, there are 1048 disasters, with high numbers of floods (192), storms (95), and road disasters (135). The beginning of summer brings increased human activities and changing weather conditions, contributing to the disaster frequency. The month also marks the onset of hurricane season in some regions, leading to an increase in storm-related events.
October records 1029 disasters, with notable flood events (374) and storms (218). The transitional weather of autumn, including increased rainfall and the tail end of hurricane season, contributes to the high number of disasters. Cooler temperatures and changing atmospheric conditions also play a role (Table 8).
September has 878 disasters, marked by significant flood events (403) and storm occurrences (191). This reflects the continued impact of summer weather and the height of hurricane season. The end of summer often brings severe storms and heavy rains, leading to widespread flooding. In April, there are 876 disasters, with high earthquake occurrences (190) and significant flood numbers (306). The seasonal transition from winter to spring brings increased rainfall and seismic activity. Melting snow and spring rains can lead to flooding, while the earth’s tectonic movements are influenced by temperature changes.
November sees 858 disasters, with considerable numbers of floods (356) and road disasters (166). The late autumn weather, including heavy rains and early winter storms, contributes to the disaster frequency. The month also marks the beginning of winter travel, increasing the risk of road accidents. December records 742 disasters, with notable flood occurrences (262) and significant earthquake numbers (145). Winter conditions, including heavy rainfall and seismic activity, contribute to these disasters. The holiday season also sees increased travel and associated risks.
The seasonality analysis reveals that July is the most disaster-prone month, driven by summer-related weather conditions and increased human activities. March and January also show high disaster occurrences, reflecting the impact of seasonal transitions. Floods and storms are the most common disasters across all months, with significant peaks during the summer and transitional seasons. By understanding these seasonal disaster patterns, preparedness and mitigation strategies can be improved. Focusing efforts during peak months can help reduce the impact of these events and enhance response capabilities. This knowledge about the timing and frequency of various disasters can guide resource allocation, emergency planning, and public awareness campaigns, ensuring that communities are better equipped to handle the increased risk during critical periods of the year (Table 8).

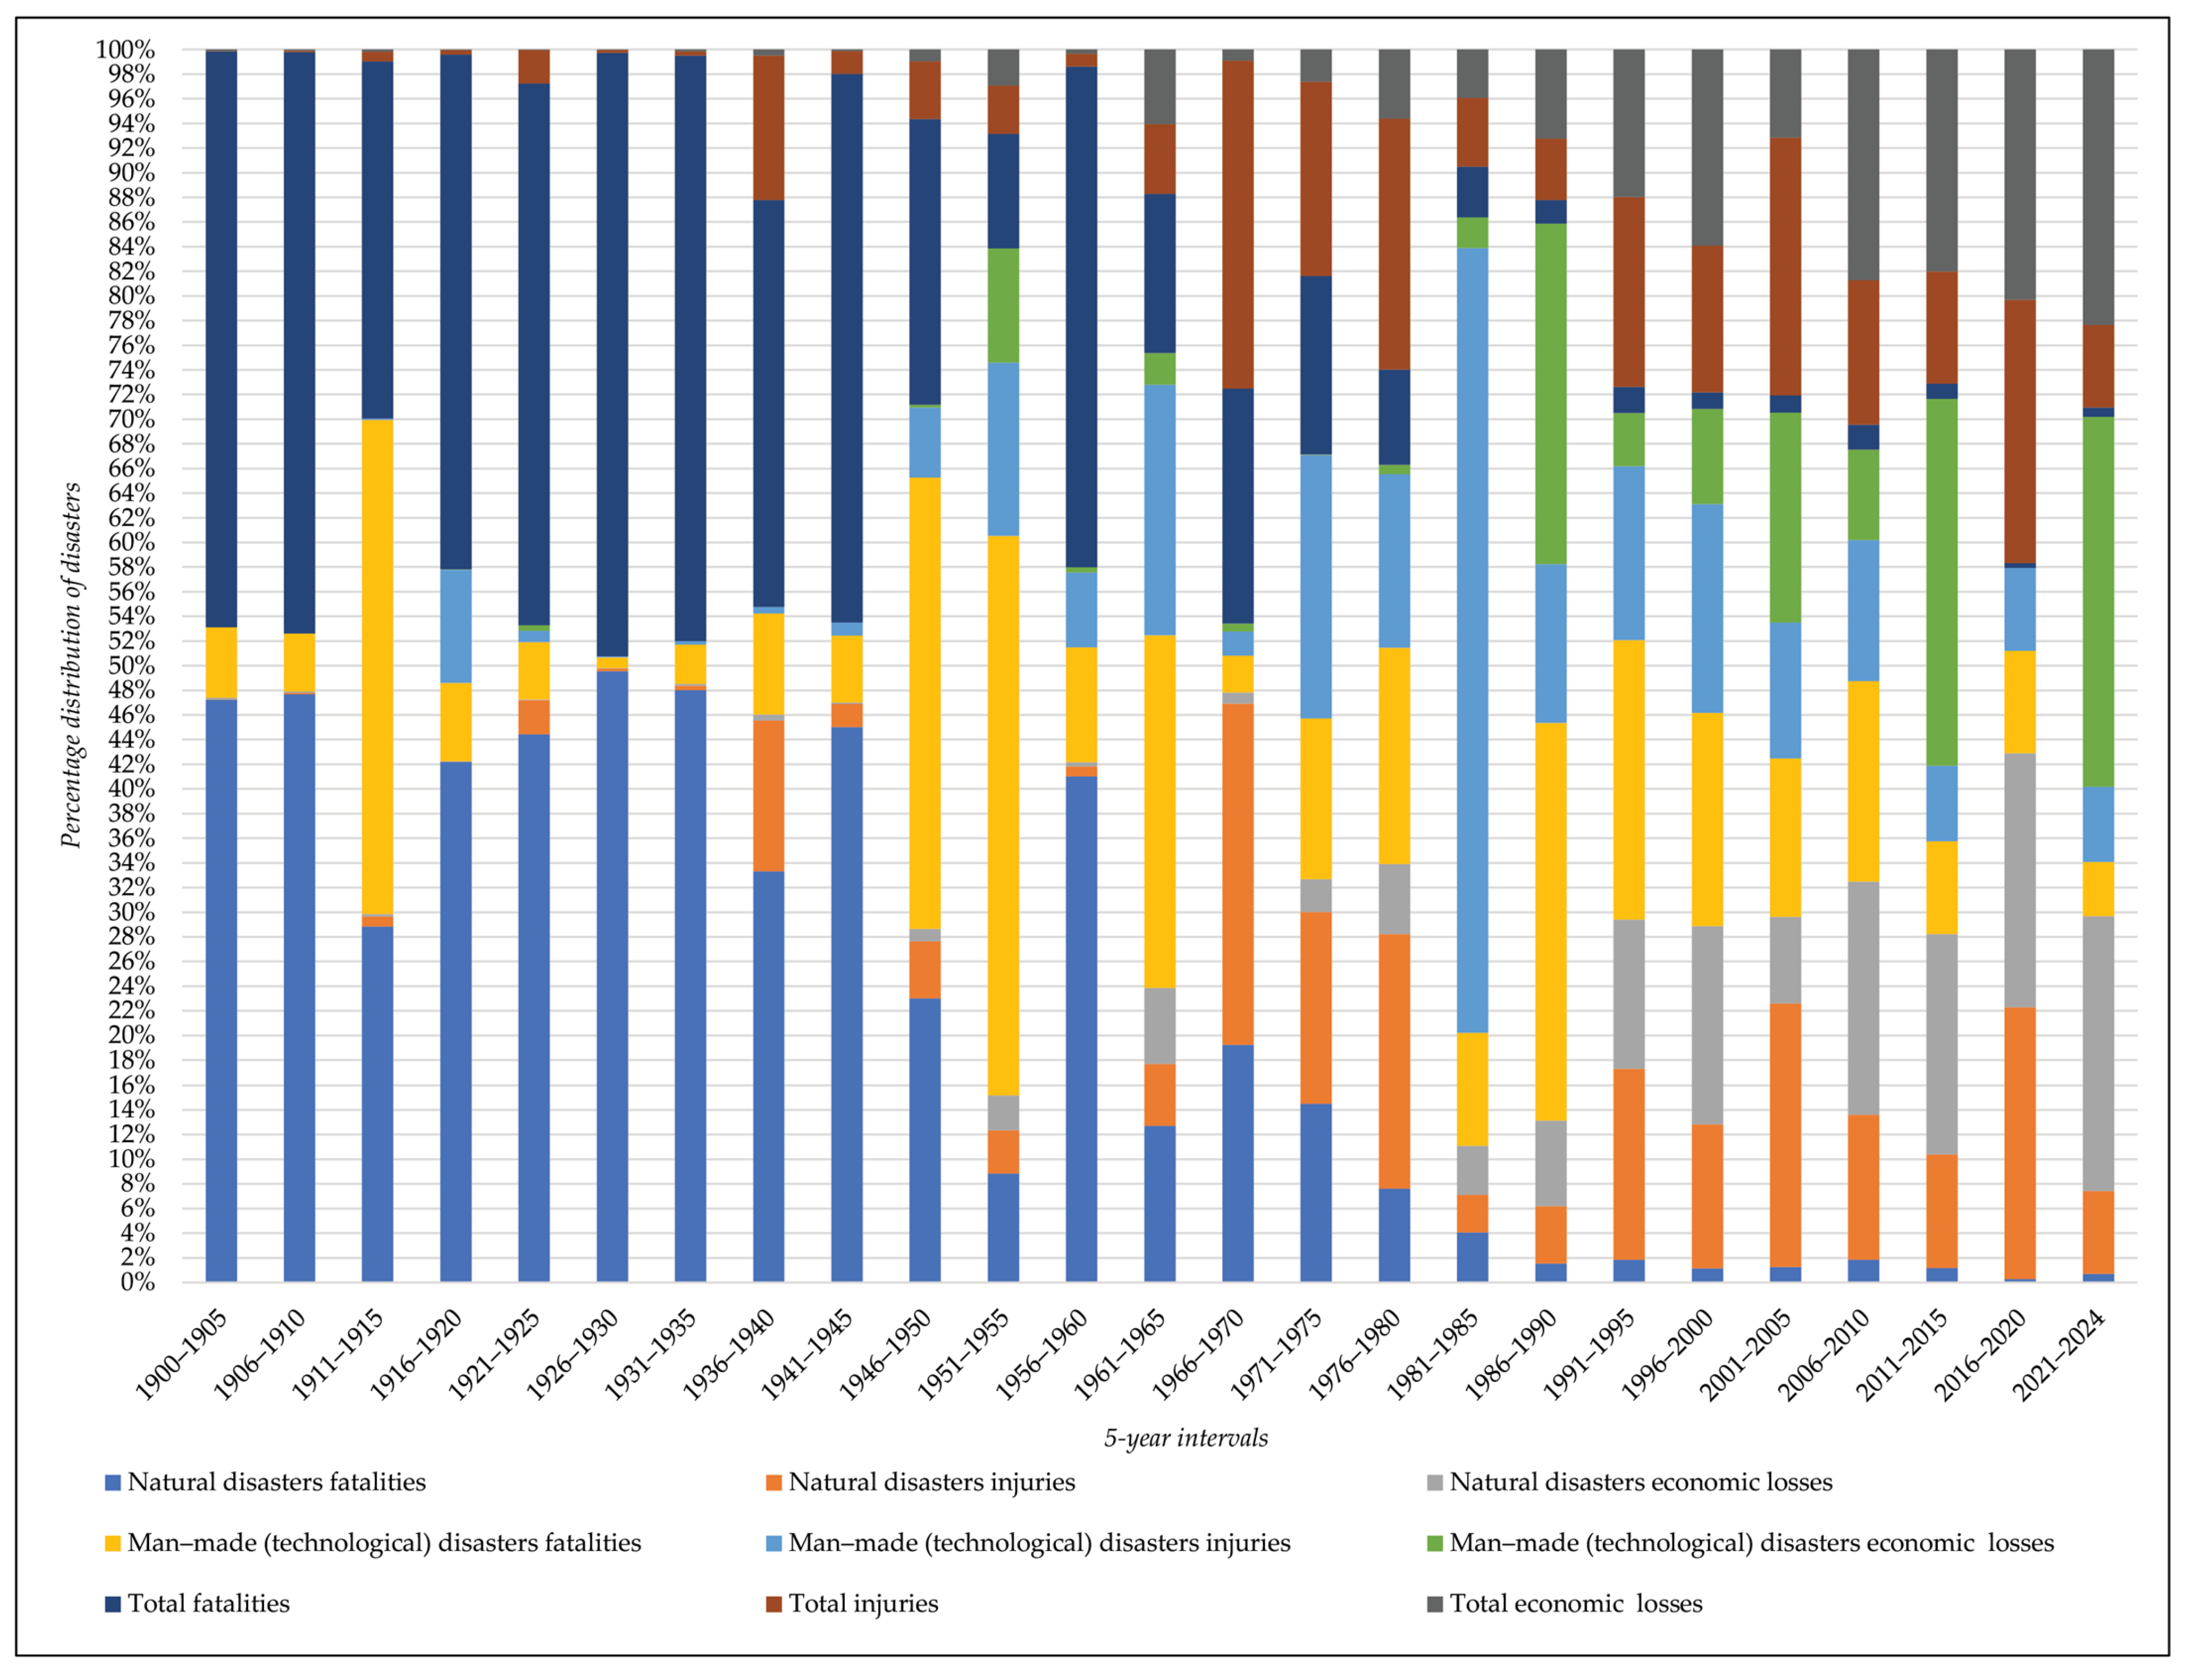
3.2.2. Yearly and Monthly Trends in Consequences of Natural and Man-Made Disasters

Providing a comprehensive analysis, Table 9 examines the impacts of natural and man-made (technological) disasters across the decades, detailing fatalities, injuries, and economic losses. This examination underscores the evolving human and economic effects of these disasters, highlighting significant trends over time.
In the early 20th century, particularly from 1900 to 1910, natural disasters caused a staggering number of fatalities, totaling 4,472,477, while injuries and economic losses were minimal. Man-made disasters during this period resulted in 5766 fatalities but had negligible economic impact.
Moving into the 1910–1920 decade, fatalities from natural disasters slightly decreased to 3,334,004, with injuries and economic losses remaining relatively low. However, man-made (technological) disasters began to show a more significant impact, with 10,752 fatalities and 9306 injuries (Table 9 and Figure 11).
The period from 1920 to 1930 saw a dramatic increase in fatalities from natural disasters, reaching 8,561,918, alongside a rise in injuries and economic losses. Man-made disasters, although still less impactful than natural ones, contributed to 7139 fatalities and 1596 injuries. The following decade, 1930–1940, saw a reduction in natural disaster fatalities to 4,629,968 but an increase in economic losses to USD 3,342,000. Man-made disasters continued to cause fatalities, albeit at a lower rate.
During the mid-20th century, from 1940 to 1950, natural disasters resulted in 3,878,897 fatalities and 69,329 injuries, with economic losses continuing to rise. Man-made disasters showed a notable increase in fatalities and injuries, reflecting the growing industrialization and technological advancements of the time. The 1950–1960 decade witnessed a further increase in economic losses from natural disasters to USD 6,090,480, although fatalities decreased to 2,127,944. Man-made disasters remained a significant cause of fatalities and injuries (Table 9 and Figure 11).
The late 20th century, particularly from 1960 to 1990, experienced significant increases in economic losses due to natural disasters. The 1960–1970 period saw USD 18,793,072 in economic losses, which further escalated to USD 183,523,629 in the 1980–1990 period. This era also marked substantial fatalities and injuries from both natural and man-made (technological) disasters. For instance, the 1980–1990 decade recorded 58,382 fatalities and 159,620 injuries from man-made (technological) disasters, indicating the increasing severity of industrial accidents (Table 9 and Figure 11).
Entering the early 21st century, the period from 2000 to 2020 witnessed the highest economic losses due to natural disasters, peaking at USD 1,706,627,174 in the 2010–2020 decade. This period also saw high numbers of fatalities and injuries, reflecting the intensified impact of disasters. Man-made disasters continued to significantly contribute to fatalities and injuries, with 97,166 fatalities and 89,617 injuries recorded in the 2000–2010 period. Recent trends from 2020 to 2030 show a significant reduction in fatalities from natural disasters compared to earlier periods, dropping to 199,314. However, economic losses remain substantial, amounting to USD 861,127,190. Man-made disasters continue to contribute significantly to fatalities and injuries, with 15,132 fatalities and 24,593 injuries recorded in this period, highlighting the persistent risk from technological and industrial activities (Table 9 and Figure 11).
Table 10 provides an in-depth look at the impacts of natural and man-made (technological) disasters over 5-year periods, detailing fatalities, injuries, and economic losses. In the early 20th century, particularly from 1900 to 1905, natural disasters resulted in significant fatalities, totaling 1,523,244, with minimal injuries and economic losses. This trend persisted into subsequent periods, with notable spikes in fatalities during 1905–1910 (2,949,233) and 1915–1920 (3,022,829). Despite these high death tolls, economic losses remained relatively low during these years.
As the mid-20th century was reached, fluctuations in fatalities and economic losses were observed. The 1920–1925 period recorded the highest fatalities of this era, with 5,065,612 lives lost due to natural disasters. Economic losses began to rise significantly during 1930–1935, reaching USD 1,629,000. During this time, man-made (technological) disasters also began to show a more substantial impact, particularly in the 1945–1950 period, which saw 5957 fatalities. The late 20th century experienced a dramatic increase in economic losses from natural disasters, peaking at USD 264,087,752 in the 1990–1995 period. This era also saw substantial fatalities and injuries from both natural and man-made (technological) disasters. The increasing industrialization and urbanization during these years contributed to the heightened impact of such events (Table 10 and Figure 12).
As the early 21st century was entered, the highest economic losses due to natural disasters were observed, with the period from 2011 to 2015 reaching USD 871,742,990. This time frame also saw a significant number of fatalities and injuries, reflecting the intensified impact of disasters. Technological advancements and population growth likely contributed to these escalating figures. Recent trends from 2021 to 2024 show a notable reduction in fatalities from natural disasters compared to earlier periods, although economic losses remain high at USD 861,127,190. Man-made disasters continue to have a significant impact, with 15,132 fatalities and 24,593 injuries recorded in this period. These insights emphasize the persistent financial and human toll of disasters, underscoring the importance of improving disaster risk reduction strategies to mitigate these impacts (Table 10 and Figure 12).
Table 11 offers a detailed summary of the consequences of different types of natural and man-made (technological) disasters from 1900 to 2024. Regarding this, air disasters resulted in 50,689 deaths (0.154%), 7620 injuries (0.068%), and USD 144.1 million in economic losses (0.003%). While these disasters had a significant human impact, the economic consequences were relatively minimal. Chemical spills, though responsible for fewer deaths (610 or 0.002%), led to substantial injuries (8773 or 0.078%) and affected over 652,981 people (0.008%), causing significant economic losses amounting to nearly USD 1.2 billion (0.027%). Industrial and miscellaneous collapses had notable impacts as well, with industrial collapses resulting in 7099 deaths (0.022%) and USD 1.335 billion in economic losses (0.03%), and miscellaneous collapses causing 14,830 deaths (0.045%) and USD 283.8 million in economic losses (0.006%).
Droughts emerged as the deadliest disaster type, accounting for 11,734,272 deaths (35.54%) and affecting nearly 3 billion individuals (34.146%), with economic losses totaling USD 257.58 billion (5.728%). Earthquakes also had a substantial impact, causing 2,407,717 deaths (7.293%) and USD 975.79 billion in economic losses (21.701%), along with 2,945,052 injuries (26.35%) and 228 million people affected (2.628%). Epidemics were significant as well, resulting in 9,622,343 deaths (29.14%) and 2,836,719 injuries (25.38%), though they had minimal economic impact.
Extreme temperatures led to 256,413 deaths (0.777%), 2,066,936 injuries (18.49%), and USD 69.47 billion in economic losses (1.545%). Fires, both industrial and miscellaneous, had considerable impacts, with miscellaneous fires causing 36,590 deaths (0.111%) and USD 3.49 billion in economic losses (0.078%), while industrial fires led to USD 2.61 billion in economic losses (0.058%). Floods were highly impactful, causing 7,011,404 deaths (21.23%), 1,398,042 injuries (12.50%), and affecting nearly 4 billion people (46.039%), with economic losses totaling USD 1.01 trillion (22.415%).
Mass movements, both dry and wet, varied in impact. Wet mass movements caused 68,636 deaths (0.208%) and USD 11.35 billion in economic losses (0.252%), while dry mass movements had a smaller impact. Miscellaneous accidents had notable consequences, causing 14,279 deaths (0.043%) and 40,666 injuries (0.364%). Oil spills had minimal impact, whereas poisoning incidents led to 3578 deaths (0.011%) and 54,442 injuries (0.487%). Although radiation incidents were rare, they caused significant economic losses (USD 2.8 billion, or 0.062%).
Storms were another major disaster type, causing 1,418,647 deaths (4.297%), 1,411,425 injuries (12.62%), and USD 1.97 trillion in economic losses (43.748%), reflecting their widespread and severe impact. Volcanic activity led to 86,935 deaths (0.263%) and USD 6.33 billion in economic losses (0.141%), affecting over 10 million individuals (0.116%). Water-related disasters caused 111,237 deaths (0.337%) and USD 77.9 million in economic losses (0.002%), while wildfires resulted in 5366 deaths (0.016%), 15,989 injuries (0.143%), and significant economic losses totaling USD 136.37 billion (3.033%) (Table 11 and Figure 13).
When ranking the impact of disasters by fatalities, droughts emerge as the deadliest, causing the highest number of deaths at 11,734,272, accounting for 35.54% of all disaster-related fatalities. Following closely are epidemics, responsible for 9,622,343 deaths, or 29.14%. Floods come in third, resulting in 7,011,404 deaths (21.23%), while earthquakes are fourth, causing 2,407,717 deaths (7.293%). Rounding out the top five, storms contribute to 1,418,647 deaths, making up 4.297% of the total (Table 11 and Figure 13).
In terms of injuries, earthquakes lead with the highest number, causing 2,945,052 injuries, representing 26.35% of all disaster-related injuries. Epidemics follow closely with 2,836,719 injuries (25.38%). Extreme temperatures rank third, causing 2,066,936 injuries (18.49%). Floods result in 1,398,042 injuries (12.50%), and storms cause 1,411,425 injuries, making up 12.62% of the total.
Looking at the number of people affected by disasters, floods have the most significant impact, affecting nearly 4 billion individuals (3,997,629,671), which is 46.039% of the total affected population. Droughts come in second, impacting almost 3 billion people (2,964,996,768), or 34.146%. Storms affect over 1.27 billion people (1,277,565,968; 14.713%), making them the third most impactful. Earthquakes are fourth, affecting over 228 million individuals (228,214,673; 2.628%), while extreme temperatures affect over 107 million people (107,678,810; 1.24%).
Regarding economic losses, storms cause the most significant financial damage, with total losses amounting to approximately USD 1.97 trillion (43.748%). Floods rank second, causing over USD 1 trillion in economic losses (1,007,889,805,000; 22.415%). Earthquakes follow, with losses of approximately USD 975.79 billion (21.701%). Droughts come in fourth, with financial damages totaling around USD 257.58 billion (5.728%), and wildfires are fifth, causing economic losses of about USD 136.37 billion (3.033%) (Table 11 and Figure 13).
This analysis underscores the profound impact of various disaster types, with droughts and floods being the most devastating in terms of human lives, while storms and earthquakes cause the highest economic losses.

4. The Impact of Socio-Economic Indicators on the Distribution and Consequences of Disasters

Based on the results of Pearson’s correlation analysis, there is a statistically significant relationship between various socio-economic indicators and the patterns, outcomes, and specific impacts of disasters, including the number of deaths, injuries, and total disasters. The analysis reveals a significant negative correlation between GDP per capita (USD) and the total number of disasters (p = 0.140, r = −0.333). This suggests that countries with a higher GDP per capita tend to experience fewer overall disasters and related impacts. This relationship could be attributed to wealthier nations’ ability to allocate more resources towards disaster prevention, mitigation, and preparedness, potentially reducing both the frequency and severity of disasters [94,95]. However, the analysis did not find a statistically significant correlation between GDP per capita and the number of people affected, deaths, injuries, natural disasters, or man-made disasters. This indicates that economic wealth alone may not directly lead to better outcomes in terms of lives saved, reduced injuries, or fewer natural disasters.
On the other hand, the quality of governance is also significantly negatively correlated with the total number of disasters (p = 0.080, r = −0.390). This suggests that higher governance quality is associated with fewer disasters overall. Effective governance likely enhances disaster management practices, including timely response and efficient resource allocation, thereby reducing the overall impact of disasters, including the number of deaths and injuries. Although the correlations with deaths (p = 0.941, r = −0.017) and injuries (p = 0.846, r = −0.045) are statistically significant, they are relatively weak. However, these findings still suggest that good governance may play a role in reducing the severity of disaster outcomes (Table 12).
Furthermore, population density (people per km2) shows a highly significant positive correlation with the number of people affected by disasters (p = 0.000, r = 0.729), indicating that areas with higher population densities are more likely to see greater numbers of people impacted by such disasters. This finding is logical, as densely populated areas naturally have more people at risk when disasters strike. There is also a significant negative correlation with deaths (p = 0.120, r = −0.350), injuries (p = 0.229, r = −0.274), and total disasters (p = 0.401, r = −0.193). These results suggest that while more individuals may be affected in high-density areas, the number of deaths, injuries, and the frequency of natural disasters may be lower. This could be due to better infrastructure and emergency services that are more readily available in urbanized regions. However, correlations with specific types of natural and man-made disasters are not statistically significant, implying that population density alone does not fully explain the occurrence of these types of disasters (Table 12).Finally, the urbanization rate (%) is significantly negatively correlated with the total number of disasters (p = 0.007, r = −0.571). This indicates that higher urbanization rates are associated with fewer disasters overall. This may be because urban areas often benefit from superior infrastructure, more robust disaster response systems, and better access to resources, all of which can mitigate the frequency and impact of disasters, including those leading to deaths, injuries, and natural disasters [96,97].
Additionally, the urbanization rate exhibits negative correlations with deaths (p = 0.612, r = −0.117), injuries (p = 0.804, r = −0.058), and natural disasters (p = 0.766, r = −0.069), although these are not statistically significant. These findings suggest that urbanized areas may be better equipped to handle disasters, leading to fewer fatalities, injuries, and natural disasters, though the results are not definitive (Table 12).

5. Discussion

The analysis of the distribution of natural and man-made (technological) disasters across continents from 1900 to 2024 reveals notable trends and patterns. Asia has experienced the highest number of disasters, accounting for 41.75% of all recorded events. This is due to the continent’s vast and diverse geography, high population density, and rapid industrialization. These factors contribute to both the frequency and impact of disasters in the region. For example, Asia’s high rate of earthquakes and floods necessitates robust mitigation strategies focusing on seismic resilience and flood management [98,99]. Additionally, the significant proportion of man-made (technological) disasters (38.11%) highlights the need for improved industrial safety and infrastructure development in rapidly urbanizing areas [24,100].
Africa, with 21.44% of the total disasters, has the highest proportion of man-made (technological) disasters (43.79%). This high percentage is linked to socio-economic factors such as inadequate infrastructure, governance challenges, and political instability, which exacerbate the risks and impacts of technological accidents and conflicts [101]. Natural disasters in Africa, such as droughts, also reflect the continent’s vulnerability to climate change, underscoring the necessity for integrated approaches addressing both natural and man-made (technological) hazards [102,103]. Furthermore, North America, which accounts for 13.84% of the total events, shows a predominance of natural disasters (75.75%), particularly storms and wildfires. This pattern is consistent with the region’s exposure to climatic extremes and varied topography, making it susceptible to a range of natural hazards [104,105]. The data suggest that strengthening early warning systems and enhancing community resilience to natural disasters should be priorities for North American disaster management strategies [89,105].
Oceania, despite having the fewest total disasters (2.83%), has the highest proportion of natural disasters (91.51%). This reflects the region’s unique geographical features, including numerous islands and coastal areas, which are highly vulnerable to natural events such as cyclones and tsunamis [99,106]. The low incidence of man-made (technological) disasters (8.49%) suggests that existing technological and industrial activities are relatively well-managed, though continued vigilance and regulation are necessary [107,108]. Europe’s balanced distribution of natural (64.54%) and man-made (35.46%) disasters reflects its diverse risk profile, influenced by both environmental factors and high levels of industrialization. The region’s experience with extreme temperatures and floods highlights the importance of adapting to climate change impacts while maintaining stringent safety standards for technological and industrial operations [93]. South America’s disaster profile, with 66.56% natural disasters and 33.44% man-made (technological) disasters, highlights the continent’s exposure to natural hazards such as floods and storms, alongside challenges related to industrial safety and urban infrastructure. The findings suggest a dual focus on environmental sustainability and industrial risk management to mitigate disaster impacts in the region [109,110].
The temporal analysis, across continents, reveals an increasing trend in disaster occurrences until the 2000s, followed by a decline in the most recent decade. This pattern may be attributed to advancements in disaster risk management practices, improved early warning systems, and greater global awareness of disaster risks [111]. However, the continuing high frequency of certain disaster types, such as floods and technological accidents, indicates the need for sustained efforts in these areas [112].
The examination of disaster distribution—both natural and man-made (technological)—across countries from 1900 to 2024 offers critical insights into the varying disaster profiles and vulnerabilities faced by different nations. This understanding is essential for developing disaster risk reduction strategies tailored to the specific needs and challenges of each country [113,114]. Countries such as China and India are at the top of the list for disaster-prone nations, a reflection of their vast geographic areas, large populations, and rapid industrial growth [115]. The significant occurrence of both natural and man-made (technological) disasters in these countries highlights the critical need to integrate disaster risk reduction into national development plans [116]. Additionally, this issue extends beyond national borders, presenting a global international challenge and responsibility [117]. Disasters do not stop at national borders, making this a substantial political, economic, and diplomatic challenge [108,118].
Natural disasters are particularly prevalent in countries like the USA, the Philippines, and Japan due to their geographical and climatic conditions [119]. The USA’s high frequency of natural disasters, dominated by events such as storms and wildfires, reflects the country’s exposure to extreme weather patterns and varied topography [120]. Similarly, the Philippines and Japan, located in seismically active regions and frequently hit by typhoons, face significant natural disaster risks [121]. These findings emphasize the need for robust early warning systems, resilient infrastructure, and effective emergency response mechanisms [88].
Countries with a high proportion of man-made (technological) disasters, such as Nigeria and Egypt, often face these events due to factors like industrialization, inadequate regulatory frameworks, and socio-economic challenges [122]. The high incidence of industrial accidents and chemical spills in these regions highlights the urgent need to improve industrial safety standards and enhance regulatory oversight [122], as well as to assess safety culture—the way things are actually carried out—e.g., by using maturity models [123]. Additionally, the socio-economic context, including political instability and lack of infrastructure, exacerbates the risk and impact of technological disasters [124].
The varied disaster profiles across different countries indicate the necessity for region-specific disaster management strategies [91]. For instance, countries with a high frequency of natural disasters should focus on enhancing climate resilience and investing in disaster-resilient infrastructure. In contrast, nations with a significant number of technological disasters should prioritize industrial safety measures, regulatory reforms, and capacity building in emergency response [125].
The temporal analysis shows an increasing trend in disaster occurrences until the early 2000s, followed by a decline, suggesting improvements in global disaster management practices [126]. However, the continuing high frequency of certain disaster types, such as floods and industrial accidents, indicates that ongoing efforts are necessary to address these persistent risks [127].
The temporal analysis of natural and man-made (technological) disasters over 10-year intervals from 1900 to 2024 reveals significant trends and shifts in the frequency and distribution of disasters, providing valuable insights into how these patterns have evolved over time. During the early 20th century (1900–1940), disaster events were relatively scarce, with a stable yet gradually increasing trend. From 1900 to 1910, the rate of disaster occurrences remained stable, predominantly driven by natural disasters. However, the period from 1910 to 1920 saw a noticeable increase in total disaster events, marking the onset of an upward trend. This trend persisted through the 1920s and 1930s, with both natural and man-made (technological) disasters contributing to the rise. Technological advancements and increased industrial activities during these decades likely played a role in the rise of man-made (technological) disasters [128].
Rapid urbanization and population growth, especially in the latter half of the 20th century, have increased the exposure and vulnerability of populations to disasters [129]. Urban areas, with dense populations and critical infrastructure, often face higher risks, leading to the observed peaks in disaster events during these periods [130]. The improvement in early warning systems and communication technologies has likely contributed to the decrease in disaster events post 2005, enabling better preparedness, timely evacuations, and effective disaster response, thus reducing the overall impact and frequency of disasters [131]. The changing communication strategies for warnings (e.g., impact warnings) also attempt to achieve more adequate prevention measures by their target group [132]. In the meantime, great efforts are being made to make warnings comprehensible and to formulate vulnerabilities and recommendations for action [133,134,135,136].
The mid-20th century (1940–1970) experienced a significant surge in disaster events. The decade from 1940 to 1950 witnessed a substantial rise in both natural and man-made (technological) disasters. This increase is attributed to the rapid industrialization and urbanization that characterized the post-World War II era. The growth of industrial activities and technological development led to higher incidences of industrial accidents and other man-made (technological) disasters [137,138]. However, they also lead to new risks and the need to redefine socially accepted risk [139]. Additionally, the rise in natural disasters could be linked to environmental changes and improved reporting and documentation of such events [140]. The influence of climate change is evident in the increasing frequency and severity of natural disasters such as floods, storms, and extreme temperatures in the late 20th and early 21st centuries [140]. Climate change adaptation and mitigation strategies are crucial to addressing these challenges and reducing future disaster risks [141]. Additionally, different regions experience varying types of disasters, influenced by geographical, climatic, and socio-economic factors [92]. This highlights the importance of localized DRR strategies tailored to specific regional needs and vulnerabilities rather than a one-size-fits-all approach [142,143].
The late 20th century (1970–2000) marked the highest increases in disaster events, particularly in the 1980s and 1990s. This period saw a peak in both natural and man-made (technological) disasters, indicating heightened vulnerability and exposure to various hazards. The 1980s, in particular, witnessed a dramatic rise in disaster occurrences, reflecting the impact of global environmental changes, increased population density, and further industrialization. The 1990s continued this trend, with significant contributions from both natural events like floods and technological incidents such as industrial explosions. The early 21st century (2000–2020) continued the trend of increasing disaster events, although the rate of increase began to slow down by the 2010s. This period saw a higher proportion of man-made (technological) disasters, reflecting ongoing industrial growth and technological advancements [143].
However, the most recent decade (2020–2030) shows a decreasing trend in the number of disaster events, with a significant reduction in both natural and man-made (technological) disasters. This decline may be attributed to improved disaster management practices, advancements in early warning systems, and increased global awareness of disaster risks. The trend of decreasing disaster events in recent years underscores the importance of building community resilience and capacity [144]. Community-based DRR initiatives, education, and training programs have empowered local populations to better prepare for and respond to disasters [145]. Enhanced data collection, reporting mechanisms, and increased transparency in documenting disaster events have contributed to a more accurate and comprehensive understanding of disaster trends [146]. This improved data availability facilitates better analysis, planning, and decision-making [147].
The analysis of the consequences of natural and man-made (technological) disasters over 5-year intervals from 1900 to 2024 provides significant insights into how the impacts of these events on human lives and economies have evolved. Throughout the 20th century and into the 21st century, natural disasters have consistently caused substantial fatalities [148], with significant fluctuations in the number of deaths over different periods. Economic losses due to natural disasters have also increased markedly over the decades, reflecting the growing complexity and interconnectedness of modern societies [149]. The increased urbanization and industrialization in the mid-20th century contributed to higher economic losses as infrastructure and economic activities expanded [150].
Disaster occurrences from 1900 to 2024 have shown fluctuations that can be traced back to significant historical events [151], technological advancements [128,152,153], and socio-political changes [35,154]. For instance, the surge in disaster events during the 1911–1920 period likely stemmed from the global upheaval caused by World War I and the Spanish flu pandemic [155], which disrupted both industrial activity and societal stability. Likewise, the notable rise in disasters between 1931 and 1940 can be linked to the economic struggles of the Great Depression [156], which curtailed government spending on infrastructure and disaster preparedness, coupled with the escalation of industrial and military activities in the lead-up to World War II. The 1961–1970 period experienced an increase in disasters, driven by rapid industrialization, urbanization, and environmental changes associated with the Green Revolution, as well as the Cold War’s nuclear arms race [157]. The significant uptick in disasters during the 1981–1990 decade is connected to the global expansion of industrial activities, often in the absence of adequate environmental regulations [158], with the Chernobyl nuclear disaster [151] serving as a stark example of technological failure. Moving forward, the slight increase in disaster events from 2001 to 2010 coincided with rising global awareness of climate change [159] and improvements in disaster monitoring and reporting technologies, likely resulting in more comprehensive disaster records. Finally, the observed decrease in disaster events during the 2011–2020 period may be a reflection of global disaster risk reduction efforts, such as the Sendai Framework [160], along with advances in early warning systems and emergency response capabilities [36,88,89,90], although this decline may not be uniform across all regions or types of disasters. Also, as mentioned, this limited timeframe may not adequately reflect longer-term trends and could be subject to short-term fluctuations in disaster occurrences
Man-made disasters, while initially causing fewer fatalities and economic losses, began to have a more pronounced impact as industrialization and technological advancements progressed [153]. The mid-20th century marked a period where the consequences of industrial accidents and technological failures became more evident, contributing to a notable increase in fatalities and injuries [161]. This trend continued into the late 20th century, with significant economic impacts arising from these disasters. The late 20th and early 21st centuries saw dramatic increases in economic losses from both natural and man-made (technological) disasters. This period reflects the dual influence of technological advancements and environmental changes [152]. On one hand, industrial growth and technological development introduced new risks and vulnerabilities, leading to severe industrial accidents and technological failures [162]. On the other hand, climate change and environmental degradation have exacerbated the frequency and intensity of natural disasters, resulting in higher economic losses and a greater number of affected individuals [163].
In recent years, there has been a noticeable reduction in fatalities from natural disasters, which can be attributed to improved disaster management practices [148], early warning systems [90], and global initiatives aimed at reducing disaster risk [164]. Despite this progress, economic losses remain substantial, underscoring the ongoing vulnerability of modern societies to both natural and man-made (technological) disasters [165]. Several key factors have influenced these temporal trends: the growth of industries and urban areas has increased the potential for industrial accidents and technological failures, contributing to the rising impact of man-made (technological) disasters [154]; the increasing frequency and severity of climate-related disasters, such as floods, droughts, and extreme temperatures, reflect the broader impacts of climate change [166]; while technological growth has brought numerous benefits, it has also introduced new risks, leading to significant industrial accidents and chemical spills [167].
The increase in recorded disaster impacts from the 1960s onwards can be partly attributed to better reporting mechanisms and increased global awareness of disaster risks [168,169,170]. The decline in fatalities from natural disasters in recent years highlights the effectiveness of global policies and disaster risk reduction frameworks, which have enhanced preparedness and resilience [171,172]. Given the findings from our study, it is clear that future urban development needs to emphasize the integration of cutting-edge sustainable planning techniques along with robust infrastructure systems [173]. This is essential to reduce the risks and lessen the impacts of both natural and man-made disasters. The increasing likelihood of multi-disaster events, such as epidemics, underscores the urgent need for cities to not only adopt disaster-resilient strategies but also to revisit and potentially revise urban design regulations [174]. By applying strategies specifically designed to tackle the complex interactions between the socio-economic, demographic, and environmental factors we have identified, cities can build lasting resilience and adaptability to the growing frequency and intensity of disasters [1,16,49,71,111]. These efforts should be in line with global disaster risk reduction initiatives and backed by forward-thinking policies that encourage risk-aware development at both local and regional levels [81,114,116,142,170].
On the other hand, managing land use effectively is essential for analyzing disaster risks, particularly in light of urban growth and evolving environmental conditions [175]. Recent research [176,177], which employs advanced data analytics and machine learning to track changes in land cover, provides valuable insights into how these shifts can affect disaster risks. These technologies allow for more accurate forecasting of land cover dynamics and their potential impact on both natural and man-made disasters [178,179]. By integrating such cutting-edge approaches, urban planners can take a proactive stance on land use management, reducing disaster risks [180].
This study acknowledges several limitations that may impact the generalizability and accuracy of its findings: (a) while the EM-DAT database is extensive, it may contain inconsistencies or gaps, particularly for earlier periods or less documented regions, which could affect the accuracy of historical trends; (b) certain regions, especially those with less robust disaster reporting systems, may have underreported disaster occurrences and impacts, potentially introducing biases in the analysis; (c) the broad time span of the analysis, from 1900 to 2024, encompasses changes in data collection methods, reporting standards, and technological advancements, which may result in inconsistencies within the dataset; (d) categorizing disasters as either natural or man-made might oversimplify the complex interactions and overlapping nature of some events, such as those exacerbated by human activities like climate change (e.g., the influence of natural hazards/disasters on the occurrence of man-made (technological) disasters); (e) estimating economic losses from disasters involves considerable uncertainties due to varying methodologies, inflation adjustments, and the inherent difficulties in capturing indirect and long-term economic effects; (f) measuring the human impact, in terms of fatalities and injuries, is challenging due to differences in reporting standards, cultural perceptions, and the availability of reliable health and demographic data; (g) the rarity of certain events, which might occur only once every 100 or 500 years, presents significant challenges for trend analysis; due to their infrequent nature, it becomes difficult to identify clear patterns or trends within the study period. Therefore, it is essential to interpret the results with caution when considering these rare but impactful occurrences.

6. Recommendations

To effectively tackle the various challenges and impacts identified in this study, the following table, Table 13, presents a comprehensive set of recommendations aimed at enhancing disaster risk reduction (DRR) strategies. These measures are categorized by their implementation level—national or local—and their short-term and long-term applicability. This structured approach ensures that both immediate and sustainable actions are taken to mitigate the risks and impacts of natural and man-made (technological) disasters.
Also, this table provides a detailed overview of the recommended measures, stressing the importance of integrating these strategies into national development plans, enhancing early warning systems, promoting climate resilience, and strengthening industrial safety. Furthermore, it underscores the significance of community-based disaster management, investment in research and development, and fostering public–private partnerships to build a more resilient society.

7. Conclusions

The analysis of the geospatial and temporal patterns of natural and man-made (technological) disasters from 1900 to 2024 provides significant insights into these events’ global distribution and impact. This research reveals that Asia is the most affected continent, with the highest number of disasters, indicating the need for robust risk mitigation strategies, particularly concerning seismic resilience and flood management. Africa faces a high percentage of man-made (technological) disasters, emphasizing the need for improved industrial safety and infrastructure, while natural disasters such as droughts are exacerbated by climate change. North America predominantly records natural disasters, particularly storms and wildfires, highlighting the importance of strengthening early warning systems and community resilience. Oceania, despite having the fewest total disasters, reports a high proportion of natural disasters due to its unique geographical characteristics. Europe shows a balanced distribution of natural and man-made (technological) disasters, underscoring the importance of adapting to climate change and maintaining high industrial safety standards. South America faces significant natural disasters such as floods and storms, alongside challenges related to industrial safety.
The temporal analysis indicates an increasing trend in disaster occurrences until the 2000s, followed by a decline in the last decade, possibly due to advancements in disaster risk management practices, improved early warning systems, and greater global awareness of disaster risks. Despite progress, the high frequency of certain disaster types, such as floods and technological accidents, indicates the need for continuous efforts in these areas. A detailed analysis of the consequences of natural and man-made (technological) disasters over five-year intervals provides significant insights into the evolution of these events’ impacts on human lives and economies. Natural disasters have consistently caused substantial fatalities and economic losses, while man-made (technological) disasters, initially less significant, have become more pronounced with industrialization and technological development. Recent trends show a reduction in fatalities from natural disasters, attributed to improved disaster management practices, early warning systems, and global initiatives aimed at reducing disaster risk.
Regarding the testing of the hypotheses, the first hypothesis was confirmed, as natural disasters accounted for 69.41% of the total number of disasters, causing greater economic losses and human casualties compared to man-made (technological) disasters. The second hypothesis was supported by significant geographical differences in the frequency and type of disasters, with Asia being the most affected continent and Africa having the highest percentage of man-made (technological) disasters. The third hypothesis was validated through the identification of significant temporal changes in disaster frequency, peaking in the periods 1990–2000 and 2000–2010, while the last decade saw a decline in the total number of events. The fourth hypothesis was proven by seasonal variations, with floods peaking in January and July, and storms being most frequent in June and October. Finally, the fifth hypothesis was confirmed, as different types of disasters had varying impacts on economic losses and human resources, with earthquakes and storms causing the greatest economic losses, while droughts and floods were the most deadly for human lives. These findings underscore the need for tailored disaster risk management strategies in different regions.
The Pearson correlation analysis underscores that socio-economic factors, particularly population density and urbanization rate, play a significant role in influencing the distribution and consequences of disasters, including the number of deaths, injuries, and natural disasters. Higher population density is linked to a greater number of individuals affected, while higher urbanization rates and better governance are associated with a reduction in the overall number of disasters, deaths, and injuries. These insights emphasize the importance of considering socio-economic contexts in disaster risk management, highlighting the need for tailored strategies to enhance community resilience.
This study contributes to the understanding of the global distribution and impact of natural and man-made (technological) disasters through a historical context. It provides a foundation for further research in disaster risk reduction (DRR), particularly in the context of climate change and urbanization. Identifying specific geographical and socio-economic factors contributing to the frequency and severity of disasters can help develop theoretical models and predictive tools for risk management. This study’s results can serve as a reference point for future quantitative and qualitative analyses exploring the effectiveness of various DRR strategies and policies.
The findings have direct implications for policymakers and practitioners in disaster risk management. It is recommended that countries with high natural disaster risks, such as China, India, and the USA, focus efforts on strengthening infrastructure resilience, improving early warning systems, and enhancing emergency response plans. For regions with high man-made disaster risks, such as Nigeria and Egypt, improving industrial safety, regulatory frameworks, and emergency response capacities is crucial. This study highlights the need for integrated approaches that combine natural and technological risk management. It is recommended to develop comprehensive strategies encompassing prevention, preparedness, response, and recovery, focusing on reducing vulnerabilities and enhancing community resilience to disasters. Additionally, implementing educational programs and raising public awareness about disaster risks can significantly contribute to reducing the negative impacts of these events.

Author Contributions

V.M.C. conceived the original idea for this study and developed the study design. V.M.C. and R.R. contributed to the analysis and interpretation of the data. T.L. made a significant contribution by drafting the introduction. V.M.C., R.R. and B.A. drafted the discussion, and V.M.C., T.L. and R.R. composed the conclusions. V.M.C., T.L., R.R. and B.A. critically reviewed the data analysis and contributed to revising and finalizing the manuscript. All authors have read and agreed to the published version of the manuscript.

Funding

This research was funded by the Scientific–Professional Society for Disaster Risk Management, Belgrade (https://upravljanje-rizicima.com/, accessed on 20 July 2024), and the International Institute for Disaster Research (https://idr.edu.rs/, accessed on 20 July 2024), Belgrade, Serbia. Tin Lukić gratefully acknowledges the support of the Ministry of Science, Technological Development and Innovation of the Republic of Serbia (grants nos. 451-03-66/2024-03/200125 and 451-03-65/2024-03/200125) and the Provincial Secretariat for Higher Education and Scientific Research of Vojvodina (Serbia), no. 000871816 2024 09418 003 000 000 001 04 002 (GLOMERO), under Program 0201 and Program Activity 1012.

Institutional Review Board Statement

Not applicable.

Informed Consent Statement

Not applicable.

Data Availability Statement

Data are contained within the article.

Conflicts of Interest

The authors declare no conflicts of interest.

References

  1. Cvetković, V.; Šišović, V. Understanding the Sustainable Development of Community (Social) Disaster Resilience in Serbia: Demographic and Socio-Economic Impacts. Sustainability 2024, 16, 2620. [Google Scholar] [CrossRef]
  2. Cvetković, V.; Nikolić, N.; Lukić, T. Exploring Students’ and Teachers’ Insights on School-Based Disaster Risk Reduction and Safety: A Case Study of Western Morava Basin, Serbia. Safety 2024, 10, 50. [Google Scholar] [CrossRef]
  3. Cvetković, V. Disaster Risk Management; Scientific-Professional Society for Disaster Risk Management: Belgrade, Serbia, 2024. [Google Scholar]
  4. Mak, H.W.L.; Laughner, J.L.; Fung, J.C.H.; Zhu, Q.; Cohen, R.C. Improved satellite retrieval of tropospheric NO2 column density via updating of air mass factor (AMF): Case study of Southern China. Remote Sens. 2018, 10, 1789. [Google Scholar] [CrossRef]
  5. Calza, F.; Parmentola, A.; Tutore, I. Big data and natural environment. How does different data support different green strategies? Sustain. Futures 2020, 2, 100029. [Google Scholar] [CrossRef]
  6. Lei, Y. Enhancing environmental management through big data: Spatial analysis of urban ecological governance and big data development. Front. Environ. Sci. 2024, 12, 1358296. [Google Scholar] [CrossRef]
  7. UNISDR. UNISDR, Terminology on Disaster Risk Terminology on Disaster Risk Reduction; The United Nations International Strategy for Disaster Reduction: Geneva, Switzerland, 2017. [Google Scholar]
  8. Iftikhar, A.; Iqbal, J. The Factors responsible for urban flooding in Karachi (A case study of DHA). Int. J. Disaster Risk Manag. 2023, 5, 81–103. [Google Scholar] [CrossRef]
  9. Starosta, D. Raised Under Bad Stars: Negotiating a culture of disaster preparedness. Int. J. Disaster Risk Manag. 2023, 5, 1–16. [Google Scholar] [CrossRef]
  10. Zareian, M. Social capitals and earthquake: A Study of different districts of Tehran, Iran. Int. J. Disaster Risk Manag. 2023, 5, 17–28. [Google Scholar] [CrossRef]
  11. Islam, F. Anticipated Role of Bangladesh Police in Disaster Management Based on the Contribution of Bangladesh Police during the Pandemic COVID-19. Int. J. Disaster Risk Manag. 2023, 5, 45–56. [Google Scholar] [CrossRef]
  12. Ulal, S.; Saha, S.; Gupta, S.; Karmakar, D. Hazard risk evaluation of COVID-19: A case study. Int. J. Disaster Risk Manag. 2023, 5, 81–101. [Google Scholar] [CrossRef]
  13. El-Mougher, M.M.; Abu Sharekh, S.A.M.; Abu Ali, R.F.; Zuhud, E.A.A. Risk Management of Gas Stations that Urban Expansion Crept into in the Gaza Strip. Int. J. Disaster Risk Manag. 2023, 5, 13–27. [Google Scholar] [CrossRef]
  14. Mohammed, E.-M.; Maysaa, J. International experiences in sheltering the Syrian refugees in Germany and Turkey. Int. J. Disaster Risk Manag. 2022, 4, 1–15. [Google Scholar]
  15. Sergey, K.; Gennadiy, N. Methodology for the risk monitoring of geological hazards for buildings and structures. Int. J. Disaster Risk Manag. 2022, 4, 41–49. [Google Scholar]
  16. Dukiya, J.J.; Benjamine, O. Building resilience through local and international partnerships, Nigeria experiences. Int. J. Disaster Risk Manag. 2021, 3, 11–24. [Google Scholar] [CrossRef]
  17. Cvetković, V.M.; Tanasić, J.; Ocal, A.; Kešetović, Ž.; Nikolić, N.; Dragašević, A. Capacity Development of Local Self-Governments for Disaster Risk Management. Int. J. Environ. Res. Public Health 2021, 18, 10406. [Google Scholar] [CrossRef]
  18. Thennavan, E.; Ganapathy, G.; Chandrasekaran, S.; Rajawat, A.S. Probabilistic rainfall thresholds for shallow landslides initiation—A case study from The Nilgiris district, Western Ghats, India. Int. J. Disaster Risk Manag. 2020, 2, 1–14. [Google Scholar] [CrossRef]
  19. Kaur, B. Disasters and exemplified vulnerabilities in a cramped Public Health Infrastructure in India. Int. J. Disaster Risk Manag. 2020, 2, 15–22. [Google Scholar] [CrossRef]
  20. Al-ramlawi, A.; El-Mougher, M.; Al-Agha, M.R. The Role of Al-Shifa Medical Complex Administration in Evacuation & Sheltering Planning. Int. J. Disaster Risk Manag. 2020, 2, 19–36. [Google Scholar]
  21. Chakma, U.K.; Hossain, A.; Islam, K.; Hasnat, G.T.; Management, H.K. Water crisis and adaptation strategies by tribal community: A case study in Baghaichari Upazila of Rangamati District in Bangladesh. Int. J. Disaster Risk Manag. 2020, 2, 37–46. [Google Scholar] [CrossRef]
  22. Smith, K. Environmental Hazards: Assessing Risk and Reducing Disaster; Routledge: New York, NY, USA, 2013. [Google Scholar]
  23. Mearns, K. Chapter Four—Human Factors in the Chemical Process Industries. In Methods in Chemical Process Safety; Khan, F., Ed.; Elsevier: Amsterdam, The Netherlands, 2017; Volume 1, pp. 149–200. [Google Scholar]
  24. Lukić, T.; Gavrilov, M.B.; Marković, S.B.; Komac, B.; Zorn, M.; Mlađan, D.; Đoržević, J.; Milanović, M.; Vasiljević, Đ.A.; Vujičić, M.D. Classification of natural disasters between the legislation and application: Experience of the Republic of Serbia. Acta Geogr. Slov.-Geogr. Zb. 2013, 53, 150–164. [Google Scholar]
  25. Mannan, S. (Ed.) Lees’ Loss Prevention in the Process Industries, 3rd ed.; Butterworth-Heinemann: Burlington, VT, USA, 2005. [Google Scholar]
  26. Perrow, C. Normal Accidents: Living with High Risk Technologies; Princeton University Press: Princeton, NJ, USA, 2011. [Google Scholar]
  27. Lukić, T.; Marić, P.; Hrnjak, I.; Gavrilov, M.B.; Mladjan, D.; Zorn, M.; Komac, B.; Milošević, Z.; Marković, S.B.; Sakulski, D. Forest fire analysis and classification based on a Serbian case study. Acta Geogr. Slov. 2017, 57, 51–63. [Google Scholar] [CrossRef]
  28. Lukic, T.; Bjelajac, D.; Fitzsimmons, K.E.; Markovic, S.B.; Basarin, B.; Mladan, D.; Micic, T.; Schaetzl, R.J.; Gavrilov, M.B.; Milanovic, M. Factors triggering landslide occurrence on the Zemun loess plateau, Belgrade area, Serbia. Environ. Earth Sci. 2018, 77, 519. [Google Scholar] [CrossRef]
  29. Basarin, B.; Lukić, T.; Mesaroš, M.; Pavić, D.; Đorđević, J.; Matzarakis, A. Spatial and temporal analysis of extreme bioclimate conditions in Vojvodina, Northern Serbia. Int. J. Climatol. 2018, 38, 142–157. [Google Scholar] [CrossRef]
  30. Han, A.; Yuan, W.; Yuan, W.; Zhou, J.; Jian, X.; Wang, R.; Gao, X. Mining Spatial-Temporal Frequent Patterns of Natural Disasters in China Based on Textual Records. Information 2024, 15, 372. [Google Scholar] [CrossRef]
  31. Ghosh, C. GIS and Geospatial Studies in disaster management. In International Handbook of Disaster Research; Springer: Berlin/Heidelberg, Germany, 2023; pp. 701–708. [Google Scholar]
  32. Wang, X. Temporal changes and spatial pattern evolution of marine disasters in China from 1736 to 1911 based on geospatial models: A multiscalar analysis. J. Coast. Res. 2020, 108, 83–88. [Google Scholar]
  33. Wei, C.; Guo, B.; Zhang, H.; Han, B.; Li, X.; Zhao, H.; Lu, Y.; Meng, C.; Huang, X.; Zang, W. Spatial–temporal evolution pattern and prediction analysis of flood disasters in China in recent 500 years. Earth Sci. Inform. 2022, 15, 265–279. [Google Scholar]
  34. Rahmi, R.; Joho, H.; Shirai, T. An analysis of natural disaster-related information-seeking behavior using temporal stages. J. Assoc. Inf. Sci. Technol. 2019, 70, 715–728. [Google Scholar]
  35. Ruiz, I.; Faria, S.H.; Neumann, M.B. Climate change perception: Driving forces and their interactions. Environ. Sci. Policy 2020, 108, 112–120. [Google Scholar] [CrossRef]
  36. Sättele, M. Quantifying the Reliability and Effectiveness of Early Warning Systems for Natural Hazards. Ph.D. Thesis, Technische Universität München, Munich, Germany, 2015. [Google Scholar]
  37. Shen, G.; Hwang, S.N. Spatial–Temporal snapshots of global natural disaster impacts Revealed from EM-DAT for 1900–2015. Geomat. Nat. Hazards Risk 2019, 10, 912–934. [Google Scholar] [CrossRef]
  38. Summers, J.K.; Lamper, A.; McMillion, C.; Harwell, L.C. Observed changes in the frequency, intensity, and spatial patterns of nine natural hazards in the United States from 2000 to 2019. Sustainability 2022, 14, 4158. [Google Scholar] [CrossRef]
  39. Tanasić, J.; Cvetković, V. The Efficiency of Disaster and Crisis Management Policy at the Local Level: Lessons from Serbia; Scientific-Professional Society for Disaster Risk Management: Belgrade, Serbia, 2024. [Google Scholar]
  40. Tian, C.-S.; Fang, Y.-P.; Yang, L.E.; Zhang, C.-J. Spatial-temporal analysis of community resilience to multi-hazards in the Anning River basin, Southwest China. Int. J. Disaster Risk Reduct. 2019, 39, 101144. [Google Scholar]
  41. Vibhas, S.; Bismark, A.G.; Ruiyi, Z.; Anwaar, M.A.; Rajib, S. Understanding the barriers restraining effective operation of flood early warning systems. Int. J. Disaster Risk Manag. 2019, 1, 1–19. [Google Scholar]
  42. Wagner, M.A.; Myint, S.W.; Cerveny, R.S. Geospatial assessment of recovery rates following a tornado disaster. IEEE Trans. Geosci. Remote Sens. 2012, 50, 4313–4322. [Google Scholar]
  43. Makwana, N. Disaster and its impact on mental health: A narrative review. J. Fam. Med. Prim. Care 2019, 8, 3090–3095. [Google Scholar] [CrossRef] [PubMed]
  44. Augusterfer, E.F.; Mollica, R.F.; Lavelle, J. Leveraging technology in post-disaster settings: The role of digital health/telemental health. Curr. Psychiatry Rep. 2018, 20, 88. [Google Scholar] [PubMed]
  45. Stanley, S.A.R.; Bulecza, S.; Gopalani, S.V. Psychological impact of disasters on communities. Annu. Rev. Nurs. Res. 2012, 30, 89–123. [Google Scholar]
  46. Buszta, J.; Wójcik, K.; Guimarães Santos, C.A.; Kozioł, K.; Maciuk, K. Historical analysis and prediction of the magnitude and scale of natural disasters globally. Resources 2023, 12, 106. [Google Scholar] [CrossRef]
  47. Neelakantan, R. Geo-environment and related Disasters—A Geo-spatial Approach. J. Environ. Nanotechnol. 2019, 8, 1–5. [Google Scholar]
  48. Zheng, Z.; Zhong, Y.; Wang, J.; Ma, A.; Zhang, L. Building damage assessment for rapid disaster response with a deep object-based semantic change detection framework: From natural disasters to man-made disasters. Remote Sens. Environ. 2021, 265, 112636. [Google Scholar] [CrossRef]
  49. Cvetković, V. A Predictive Model of Community Disaster Resilience based on Social Identity Influences (MODERSI). Int. J. Disaster Risk Manag. 2023, 5, 57–80. [Google Scholar] [CrossRef]
  50. Cvetković, V.; Milojković, B.; Stojković, D. Analysis of geospatial and temporal distribution of earthquakes as natural disasters. Vojn. Delo 2014, 66, 166–185. [Google Scholar] [CrossRef]
  51. Cools, J.; Innocenti, D.; O’Brien, S. Lessons from flood early warning systems. Environ. Sci. Policy 2016, 58, 117–122. [Google Scholar] [CrossRef]
  52. Myint, S.W.; Yuan, M.; Cerveny, R.S.; Giri, C. Categorizing natural disaster damage assessment using satellite-Based geospatial techniques. Nat. Hazards Earth Syst. Sci. 2008, 8, 707–719. [Google Scholar] [CrossRef]
  53. Kragh Andersen, P.; Pohar Perme, M.; van Houwelingen, H.C.; Cook, R.J.; Joly, P.; Martinussen, T.; Taylor, J.M.G.; Abrahamowicz, M.; Therneau, T.M. Analysis of time-to-event for observational studies: Guidance to the use of intensity models. Stat. Med. 2021, 40, 185–211. [Google Scholar] [CrossRef]
  54. Melkov, D.; Zaalishvili, V.; Burdzieva, O.; Kanukov, A. Temporal and spatial geophysical data analysis in the issues of natural hazards and risk assessment (in example of North Ossetia, Russia). Appl. Sci. 2022, 12, 2790. [Google Scholar] [CrossRef]
  55. Chen, N.; Zhang, Z.; Ma, Y.; Chen, A.; Yao, X. Assessment and clustering of temporal disaster risk: Two case studies of China. Intell. Decis. Technol. 2022, 16, 247–261. [Google Scholar] [CrossRef]
  56. Coronese, M.; Lamperti, F.; Keller, K.; Chiaromonte, F.; Roventini, A. Evidence for sharp increase in the economic damages of extreme natural disasters. Proc. Natl. Acad. Sci. USA 2019, 116, 21450–21455. [Google Scholar] [CrossRef]
  57. Cvetković, V.; Dragicević, S. Spatial and temporal distribution of natural disasters. J. Geogr. Inst. Jovan Cvijic SASA 2014, 64, 293–309. [Google Scholar] [CrossRef]
  58. Tin, D.; Cheng, L.; Le, D.; Hata, R.; Ciottone, G. Natural disasters: A comprehensive study using EMDAT database 1995–2022. Public Health 2024, 226, 255–260. [Google Scholar] [CrossRef]
  59. Jäger, W.S.; de Ruiter, M.C.; Tiggeloven, T.; Ward, P.J. What can we learn from global disaster records about multi-hazards and their risk dynamics? Nat. Hazards Earth Syst. Sci. Discuss. 2024, 2024, 1–31. [Google Scholar]
  60. Chen, B.; Chen, K.; Wang, X.; Wang, X. Spatial and Temporal Distribution Characteristics of Rainstorm and Flood Disasters Around Tarim Basin. Pol. J. Environ. Stud. 2022, 31, 2029–2037. [Google Scholar] [CrossRef] [PubMed]
  61. Herrera, D.; Aristizábal, E. Spatial and Temporal Distribution of Precipitation and Its Relationship with Landslides within the Aburrá Valley, Northern Colombian Andes; Copernicus Meetings: Vienna, Austria, 2024. [Google Scholar]
  62. Peng, Y.; Song, J.; Cui, T.; Cheng, X. Temporal–Spatial variability of atmospheric and hydrological natural disasters during recent 500 years in Inner Mongolia, China. Nat. Hazards 2017, 89, 441–456. [Google Scholar] [CrossRef]
  63. Nones, M.; Hamidifar, H.; Shahabi-Haghighi, S.M.B. Exploring EM-DAT for depicting spatiotemporal trends of drought and wildfires and their connections with anthropogenic pressure. Nat. Hazards 2024, 120, 957–973. [Google Scholar] [CrossRef]
  64. CRED. EM-DAT 2023 Annual Report: Executive Summary. 2023. Available online: https://files.emdat.be/reports/2023_EMDAT_report.pdf (accessed on 15 June 2024).
  65. Winsemius, H.C.; Van Beek, L.P.H.; Jongman, B.; Ward, P.J.; Bouwman, A. A framework for global river flood risk assessments. Hydrol. Earth Syst. Sci. 2013, 17, 1871–1892. [Google Scholar] [CrossRef]
  66. Kron, W.; Steuer, M.; Löw, P.; Wirtz, A. How to deal properly with a natural catastrophe database–analysis of flood losses. Nat. Hazards Earth Syst. Sci. 2012, 12, 535–550. [Google Scholar] [CrossRef]
  67. Barredo, J.I. Major flood disasters in Europe: 1950–2005. Nat. Hazards 2007, 42, 125–148. [Google Scholar] [CrossRef]
  68. Machado, J.A.T.; Lopes, A.M. Analysis and visualization of seismic data using mutual information. Entropy 2013, 15, 3892–3909. [Google Scholar] [CrossRef]
  69. Kripa, R.M.; Ramesh, N.; Boos, W.R. Wrangler for the Emergency Events Database: A tool for geocoding and analysis of a global disaster dataset. arXiv 2022, arXiv:2208.12634. [Google Scholar]
  70. Dharmawan, R.D.; Suharyadi; Farda, N.M. Geovisualization using hexagonal tessellation for spatiotemporal earthquake data analysis in Indonesia. In Proceedings of the Soft Computing in Data Science: Third International Conference, SCDS 2017, Yogyakarta, Indonesia, 27–28 November 2017; pp. 177–187. [Google Scholar]
  71. Kyne, D.; Kyei, D. Understanding Associations between Disasters and Sustainability, Resilience, and Poverty: An Empirical Study of the Last Two Decades. Sustainability 2024, 16, 7416. [Google Scholar] [CrossRef]
  72. Cvetković, V.; Dragašević, A.; Protić, D.; Janković, B.; Nikolić, N.; Milošević, P. Fire Safety Behavior Model for Residential Buildings: Implications for Disaster Risk Reduction. Int. J. Disaster Risk Reduct. 2022, 75, 102981. [Google Scholar] [CrossRef]
  73. Panwar, V.; Sen, S. Disaster damage records of EM-DAT and DesInventar: A systematic comparison. Econ. Disasters Clim. Chang. 2020, 4, 295–317. [Google Scholar] [CrossRef]
  74. Peng, Y.; Long, S.; Ma, J.; Song, J.; Liu, Z. Temporal-spatial variability in correlations of drought and flood during recent 500 years in Inner Mongolia, China. Sci. Total Environ. 2018, 633, 484–491. [Google Scholar] [CrossRef]
  75. Martínez–Álvarez, F.; Morales–Esteban, A. Big data and natural disasters: New approaches for spatial and temporal massive data analysis. Comput. Geosci. 2019, 129, 38–39. [Google Scholar] [CrossRef]
  76. Ge, X.; Yang, Y.; Chen, J.; Li, W.; Huang, Z.; Zhang, W.; Peng, L. Disaster prediction knowledge graph based on multi-source spatio-temporal information. Remote Sens. 2022, 14, 1214. [Google Scholar] [CrossRef]
  77. Jones, R.L.; Guha-Sapir, D.; Tubeuf, S. Human. and economic impacts of natural disasters: Can we trust the global data? Sci. Data 2022, 9, 572. [Google Scholar] [CrossRef]
  78. Huggel, C.; Raissig, A.; Rohrer, M.; Romero, G.; Diaz, A.; Salzmann, N. How useful and reliable are disaster databases in the context of climate and global change? A comparative case study analysis in Peru. Nat. Hazards Earth Syst. Sci. 2015, 15, 475–485. [Google Scholar] [CrossRef]
  79. Delforge, D.; Below, R.; Speybroeck, N. Natural Hazards & Disasters: An Overview of the First Half of 2022; CRED Disasters, Ed.; UC Louvain: Ottignies-Louvain-la-Neuve, Belgium, 2022. [Google Scholar]
  80. Guha-Sapir, D.; Centre for Research on the Epidemiology of Disasters (CRED); UC Louvain. The Emergency Events Database (EM-DAT); Centre for Research on the Epidemiology of Disasters: Brussels, Belgium, 2020. [Google Scholar]
  81. Cuthbertson, J.; Archer, F.; Robertson, A.; Rodriguez-Llanes, J.M. Improving disaster data systems to inform disaster risk reduction and resilience building in Australia: A comparison of databases. Prehospital Disaster Med. 2021, 36, 511–518. [Google Scholar] [CrossRef] [PubMed]
  82. Rosvold, E.L.; Buhaug, H. GDIS, a global dataset of geocoded disaster locations. Sci. Data 2021, 8, 61. [Google Scholar] [CrossRef]
  83. Moriyama, K.; Sasaki, D.; Ono, Y. Comparison of global databases for disaster loss and damage data. J. Disaster Res. 2018, 13, 1007–1014. [Google Scholar] [CrossRef]
  84. Jones, R.L.; Kharb, A.; Tubeuf, S. The untold story of missing data in disaster research: A systematic review of the empirical literature utilising the Emergency Events Database (EM-DAT). Environ. Res. Lett. 2023, 18, 103006. [Google Scholar] [CrossRef]
  85. Gall, M.; Borden, K.A.; Cutter, S.L. When do losses count? Six fallacies of natural hazards loss data. Bull. Am. Meteorol. Soc. 2009, 90, 799–810. [Google Scholar] [CrossRef]
  86. Lin, Y.C.; Khan, F.; Jenkins, S.F.; Lallemant, D. Filling the disaster data gap: Lessons from cataloging Singapore’s past disasters. Int. J. Disaster Risk Sci. 2021, 12, 188–204. [Google Scholar] [CrossRef]
  87. Nobre, G.G.; Muis, S.; Veldkamp, T.I.E.; Ward, P.J. Achieving the reduction of disaster risk by better predicting impacts of El Niño and La Niña. Prog. Disaster Sci. 2019, 2, 100022. [Google Scholar] [CrossRef]
  88. Ebi, K.L.; Schmier, J.K. A stitch in time: Improving public health early warning systems for extreme weather events. Epidemiol. Rev. 2005, 27, 115–121. [Google Scholar] [CrossRef] [PubMed]
  89. Garcia, C.; Fearnley, C.J. Evaluating critical links in early warning systems for natural hazards. Environ. Hazards 2012, 11, 123–137. [Google Scholar] [CrossRef]
  90. Quansah, J.E.; Engel, B.; Rochon, G.L. Early warning systems: A review. J. Terr. Obs. 2010, 2, 5. [Google Scholar]
  91. Buck, K.D.; Summers, K.J.; Hafner, S.; Smith, L.M.; Harwell, L.C. Development of a multi-hazard landscape for exposure and risk interpretation: The PRISM approach. Curr. Environ. Eng. 2019, 6, 74–94. [Google Scholar] [CrossRef]
  92. Mata-Lima, H.; Alvino-Borba, A.; Pinheiro, A.; Mata-Lima, A.; Almeida, J.A. Impacts of natural disasters on environmental and socio-economic systems: What makes the difference? Ambiente Soc. 2013, 16, 45–64. [Google Scholar] [CrossRef]
  93. Wilby, R.L.; Keenan, R. Adapting to flood risk under climate change. Prog. Phys. Geogr. 2012, 36, 348–378. [Google Scholar] [CrossRef]
  94. Kahn, M.E. The death toll from natural disasters: The role of income, geography, and institutions. Rev. Econ. Stat. 2005, 87, 271–284. [Google Scholar] [CrossRef]
  95. Henderson, L.J. Emergency and disaster: Pervasive risk and public bureaucracy in developing nations. Public Organ. Rev. 2004, 4, 103–119. [Google Scholar] [CrossRef]
  96. Yabe, T.; Rao, P.S.C.; Ukkusuri, S.V. Regional differences in resilience of social and physical systems: Case study of Puerto Rico after Hurricane Maria. Environ. Plan. B Urban Anal. City Sci. 2021, 48, 1042–1057. [Google Scholar] [CrossRef]
  97. Hartama, D.; Mawengkang, H.; Zarlis, M.; Sembiring, R.W. Smart City: Utilization of IT resources to encounter natural disaster. J. Phys. Conf. Ser. 2017, 890, 012076. [Google Scholar] [CrossRef]
  98. Kumar, A.; Lang, D.H.; Ziar, H.; Singh, Y. Seismic Vulnerability Assessment of Non-Structural Components-Methodology, Implementation Approach and Impact Assessment in South and Central Asia. J. Earthq. Eng. 2022, 26, 1300–1324. [Google Scholar] [CrossRef]
  99. Cerulli, D.; Scott, M.; Aunap, R.; Kull, A.; Pärn, J.; Holbrook, J.; Mander, Ü. The role of education in increasing awareness and reducing impact of natural hazards. Sustainability 2020, 12, 7623. [Google Scholar] [CrossRef]
  100. Nawaz, A.; Su, X.; Din, Q.M.U.; Khalid, M.I.; Bilal, M.; Shah, S.A.R. Identification of the h&s (Health and safety factors) involved in infrastructure projects in developing countries-a sequential mixed method approach of OLMT-project. Int. J. Environ. Res. Public Health 2020, 17, 635. [Google Scholar] [CrossRef]
  101. Eriksson, P.E.; Olander, S.; Szentes, H.; Widén, K. Managing short-term efficiency and long-term development through industrialized construction. Constr. Manag. Econ. 2014, 32, 97–108. [Google Scholar] [CrossRef]
  102. Busby, J.W.; Smith, T.G.; Krishnan, N. Climate security vulnerability in Africa mapping 3.0. Political Geogr. 2014, 43, 51–67. [Google Scholar] [CrossRef]
  103. Moyo, E.; Nhari, L.G.; Moyo, P.; Murewanhema, G.; Dzinamarira, T. Health effects of climate change in Africa: A call for an improved implementation of prevention measures. Eco-Environ. Health 2023, 2, 74–78. [Google Scholar] [CrossRef]
  104. Forzieri, G.; Feyen, L.; Russo, S.; Vousdoukas, M.; Alfieri, L.; Outten, S.; Migliavacca, M.; Bianchi, A.; Rojas, R.; Cid, A. Multi-hazard assessment in Europe under climate change. Clim. Chang. 2016, 137, 105–119. [Google Scholar] [CrossRef]
  105. Harper, S.L.; Cunsolo, A.; Babujee, A.; Coggins, S.; De Jongh, E.; Rusnak, T.; Wright, C.J.; Aguilar, M.D. Trends and gaps in climate change and health research in North America. Environ. Res. 2021, 199, 111205. [Google Scholar] [CrossRef] [PubMed]
  106. Satyanarayana, B.; Van der Stocken, T.; Rans, G.; Kodikara, K.A.S.; Ronsmans, G.; Jayatissa, L.P.; Husain, M.-L.; Koedam, N.; Dahdouh-Guebas, F. Island-wide coastal vulnerability assessment of Sri Lanka reveals that sand dunes, planted trees and natural vegetation may play a role as potential barriers against ocean surges. Glob. Ecol. Conserv. 2017, 12, 144–157. [Google Scholar] [CrossRef]
  107. Pidgeon, N.; O’Leary, M. Man-made disasters: Why technology and organizations (sometimes) fail. Saf. Sci. 2000, 34, 15–30. [Google Scholar] [CrossRef]
  108. Shen, G.; Zhou, L.; Xue, X.; Zhou, Y. The risk impacts of global natural and technological disasters. Socio-Econ. Plan. Sci. 2023, 88, 101653. [Google Scholar] [CrossRef]
  109. Tseng, C.-P.; Chen, C.-W. Natural disaster management mechanisms for probabilistic earthquake loss. Nat. Hazards 2012, 60, 1055–1063. [Google Scholar] [CrossRef]
  110. Alcántara-Ayala, I. Geomorphology, natural hazards, vulnerability and prevention of natural disasters in developing countries. Geomorphology 2002, 47, 107–124. [Google Scholar] [CrossRef]
  111. Glago, F.J. Flood disaster hazards; causes, impacts and management: A state-of-the-art review. In Natural Hazards-Impacts, Adjustments and Resilience; IntechOpen: London, UK, 2021; pp. 29–37. [Google Scholar]
  112. Munawar, H.S.; Hammad, A.W.A.; Waller, S.T. Remote sensing methods for flood prediction: A review. Sensors 2022, 22, 960. [Google Scholar] [CrossRef]
  113. Raikes, J.; Smith, T.F.; Baldwin, C.; Henstra, D. Disaster risk reduction and climate policy implementation challenges in Canada and Australia. Clim. Policy 2022, 22, 534–548. [Google Scholar] [CrossRef]
  114. Hicks, A.; Barclay, J.; Chilvers, J.; Armijos, M.T.; Oven, K.; Simmons, P.; Haklay, M. Global mapping of citizen science projects for disaster risk reduction. Front. Earth Sci. 2019, 7, 226. [Google Scholar] [CrossRef]
  115. Pucher, J.; Peng, Z.R.; Mittal, N.; Zhu, Y.; Korattyswaroopam, N. Urban transport trends and policies in China and India: Impacts of rapid economic growth. Transp. Rev. 2007, 27, 379–410. [Google Scholar] [CrossRef]
  116. Carby, B. Integrating disaster risk reduction in national development planning: Experience and challenges of Jamaica. Environ. Hazards 2018, 17, 219–233. [Google Scholar] [CrossRef]
  117. Stanganelli, M. A new pattern of risk management: The Hyogo Framework for Action and Italian practise. Socio-Econ. Plan. Sci. 2008, 42, 92–111. [Google Scholar] [CrossRef]
  118. Wang, J.-J. Post-disaster cross-nation mutual aid in natural hazards: Case analysis from sociology of disaster and disaster politics perspectives. Nat. Hazards 2013, 66, 413–438. [Google Scholar] [CrossRef]
  119. Yumul, G.P., Jr.; Cruz, N.A.; Servando, N.T.; Dimalanta, C.B. Extreme weather events and related disasters in the Philippines, 2004–2008: A sign of what climate change will mean? Disasters 2011, 35, 362–382. [Google Scholar] [CrossRef] [PubMed]
  120. Rauscher, N.; Werner, W. Why Has. Catastrophe Mitigation Failed in the US? ZPB Z. Für Polit. 2022, 8, 149–173. [Google Scholar]
  121. Iuchi, K.; Jibiki, Y.; Solidum, R., Jr.; Santiago, R. Natural hazards governance in the Philippines. In Oxford Research Encyclopedia of Natural Hazard Science; Oxford University Press: Oxford, UK, 2019. [Google Scholar]
  122. Mashi, S.A.; Oghenejabor, O.D.; Inkani, A.I. Disaster risks and management policies and practices in Nigeria: A critical appraisal of the National Emergency Management Agency Act. Int. J. Disaster Risk Reduct. 2019, 33, 253–265. [Google Scholar] [CrossRef]
  123. Goncalves Filho, A.P.; Waterson, P. Maturity models and safety culture: A critical review. Saf. Sci. 2018, 105, 192–211. [Google Scholar] [CrossRef]
  124. Prothi, A.; Chhabra Anand, M.; Kumar, R. Adaptive Pathways for Resilient Infrastructure in an Evolving Disasterscape. Sustain. Resilient Infrastruct. 2023, 8, 3–4. [Google Scholar] [CrossRef]
  125. Prior, T.; Herzog, M.; Kaderli, T.; Roth, F. International Civil Protection: Adapting to New Challenges; ETH Zurich: Zürich, Switzerland, 2016. [Google Scholar]
  126. Cutter, S.L.; Finch, C. Temporal and spatial changes in social vulnerability to natural hazards. Proc. Natl. Acad. Sci. USA 2008, 105, 2301–2306. [Google Scholar] [CrossRef]
  127. Krausmann, E.; Cozzani, V.; Salzano, E.; Renni, E. Industrial accidents triggered by natural hazards: An emerging risk issue. Nat. Hazards Earth Syst. Sci. 2011, 11, 921–929. [Google Scholar] [CrossRef]
  128. Evan, W.M.; Manion, M. Minding the Machines: Preventing Technological Disasters; Prentice Hall Professional: Hoboken, NJ, USA, 2002. [Google Scholar]
  129. Brauch, H.G. Urbanization and natural disasters in the Mediterranean: Population growth and climate change in the 21st century. Build. Safer Cities 2003, 149, 149–164. [Google Scholar]
  130. Forzieri, G.; Bianchi, A.; e Silva, F.B.; Herrera, M.A.M.; Leblois, A.; Lavalle, C.; Aerts, J.C.J.H.; Feyen, L. Escalating impacts of climate extremes on critical infrastructures in Europe. Glob. Environ. Chang. 2018, 48, 97–107. [Google Scholar] [CrossRef] [PubMed]
  131. Harrison, S.; Potter, S.; Prasanna, R.; Doyle, H.E.; Johnston, D. Identifying the Impact-Related Data Uses and Gaps for Hydrometeorological Impact Forecasts and Warnings. Weather. Clim. Soc. 2022, 14, 155–176. [Google Scholar] [CrossRef]
  132. Bean, H.; Sutton, J.; Liu, B.F.; Madden, S.; Wood, M.M.; Mileti, D.S. The study of mobile public warning messages: A research review and agenda. Rev. Commun. 2015, 15, 60–80. [Google Scholar] [CrossRef]
  133. Dengler, L.; Goltz, J.; Fenton, J.; Miller, K.; Wilson, R. Building tsunami-resilient communities in the United States: An example from California. TsuInfo Alert 2011, 13, 1–14. [Google Scholar]
  134. Shahriar, H.; Zulkernine, M. Mitigating program security vulnerabilities: Approaches and challenges. ACM Comput. Surv. 2012, 44, 1–46. [Google Scholar] [CrossRef]
  135. Waugh, J.D. Neighborhood Watch: Early Detection and Rapid Response to Biological Invasion along US Trade Pathways; IUCN: Gland, Switzerland, 2009. [Google Scholar]
  136. Brauch, H.G. Concepts of security threats, challenges, vulnerabilities and risks. In Coping with Global Environmental Change, Disasters and Security: Threats, Challenges, Vulnerabilities and Risks; Springer: Berlin/Heidelberg, Germany, 2011; pp. 61–106. [Google Scholar]
  137. Coleman, L. Frequency of man-made disasters in the 20th century. J. Contingencies Crisis Manag. 2006, 14, 3–11. [Google Scholar] [CrossRef]
  138. Granot, H. The dark side of growth and industrial disasters since the Second World War. Disaster Prev. Manag. An. Int. J. 1998, 7, 195–204. [Google Scholar] [CrossRef]
  139. Zinn, J.O. Towards a better understanding of risk-taking: Key concepts, dimensions and perspectives. Health Risk Soc. 2015, 17, 99–114. [Google Scholar] [CrossRef]
  140. Bouwer, L.M. Have disaster losses increased due to anthropogenic climate change? Bull. Am. Meteorol. Soc. 2011, 92, 39–46. [Google Scholar] [CrossRef]
  141. Lei, Y.; Wang, J.A. A preliminary discussion on the opportunities and challenges of linking climate change adaptation with disaster risk reduction. Nat. Hazards 2014, 71, 1587–1597. [Google Scholar] [CrossRef]
  142. Peters, K.; Peters, L.E.R.; Twigg, J.; Walch, C. Disaster Risk Reduction Strategies; Overseas Development Institute: London, UK, 2019. [Google Scholar]
  143. Klein, J.A.; Tucker, C.M.; Steger, C.E.; Nolin, A.; Reid, R.; Hopping, K.A.; Yeh, E.T.; Pradhan, M.S.; Taber, A.; Molden, D. An integrated community and ecosystem-based approach to disaster risk reduction in mountain systems. Environ. Sci. Policy 2019, 94, 143–152. [Google Scholar] [CrossRef]
  144. Albright, E.A.; Crow, D.A. Capacity building toward resilience: How communities recover, learn, and change in the aftermath of extreme events. Policy Stud. J. 2021, 49, 89–122. [Google Scholar] [CrossRef]
  145. Walia, A. Community based disaster preparedness: Need for a standardized training module. Aust. J. Emerg. Manag. 2008, 23, 68–73. [Google Scholar]
  146. Haddow, G.; Haddow, K.S. Disaster Communications in A Changing Media World; Butterworth-Heinemann: Oxford, UK, 2013. [Google Scholar]
  147. Curtis, C.; Scheurer, J. Planning for sustainable accessibility: Developing tools to aid discussion and decision-making. Prog. Plan. 2010, 74, 53–106. [Google Scholar]
  148. Alexander, D. The study of natural disasters, 1977–1997: Some reflections on a changing field of knowledge. Disasters 1997, 21, 284–304. [Google Scholar] [CrossRef]
  149. Scott, A.J. A World in Emergence: Cities and Regions in the 21st Century; Edward Elgar Publishing: Cheltenham and Camberley, UK, 2012. [Google Scholar]
  150. Brunn, S.D.; Williams, J.F.; Zeigler, D.J. Cities of the World: World Regional Urban Development; Rowman & Littlefield: Lanham, MD, USA, 2003. [Google Scholar]
  151. Smith, J.T.; Beresford, N.A. Chernobyl: Catastrophe and Consequences; Springer: Berlin/Heidelberg, Germany, 2005; Volume 310. [Google Scholar]
  152. Ahmad, N.; Youjin, L.; Žiković, S.; Belyaeva, Z. The effects of technological innovation on sustainable development and environmental degradation: Evidence from China. Technol. Soc. 2023, 72, 102184. [Google Scholar]
  153. Haddad, E.; Alcalá, P.F.A.; Gouveia, J.L.N. Environmental and technological disasters and emergencies. Luiz Augusto C Galvão Jacobo Finkelman 2011, 629, 547–572. [Google Scholar]
  154. de Souza Porto, M.F.; de Freitas, C.M. Major chemical accidents in industrializing countries: The socio-political amplification of risk. Risk Anal. 1996, 16, 19–29. [Google Scholar] [CrossRef] [PubMed]
  155. Flecknoe, D.; Charles Wakefield, B.; Simmons, A. Plagues & wars: The ‘Spanish Flu’ pandemic as a lesson from history. Med. Confl. Surviv. 2018, 34, 61–68. [Google Scholar]
  156. Rothermond, D. Global Impact of the Great Depression; Routledge London: London, UK, 1996. [Google Scholar]
  157. Davis, T.C. Stages of Emergency: Cold War Nuclear Civil Defense; Duke University Press: Durham, NC, USA, 2007. [Google Scholar]
  158. Liu, L.; Jiang, J.; Bian, J.; Liu, Y.; Lin, G.; Yin, Y. Are environmental regulations holding back industrial growth? Evidence from China. J. Clean. Prod. 2021, 306, 127007. [Google Scholar] [CrossRef]
  159. Knight, K.W. Public awareness and perception of climate change: A quantitative cross-national study. Environ. Sociol. 2016, 2, 101–113. [Google Scholar] [CrossRef]
  160. Faivre, N.; Sgobbi, A.; Happaerts, S.; Raynal, J.; Schmidt, L. Translating the Sendai Framework into action: The EU approach to ecosystem-based disaster risk reduction. Int. J. Disaster Risk Reduct. 2018, 32, 4–10. [Google Scholar] [CrossRef]
  161. Duarte Santos, F.; Duarte Santos, F. Anthropocene, Technosphere, Biosphere, and the Contemporary Utopias. In Time, Progress, Growth and Technology: How Humans and the Earth Are Responding; Springer: Berlin/Heidelberg, Germany, 2021; pp. 381–542. [Google Scholar]
  162. Trautman, L.J.; Ormerod, P.C. Industrial cyber vulnerabilities: Lessons from Stuxnet and the Internet of Things. U. Miami L. Rev. 2017, 72, 761. [Google Scholar] [CrossRef]
  163. Keim, M.E. The role of public health in disaster risk reduction as a means for climate change adaptation. Glob. Clim. Chang. Hum. Health Sci. Pract. 2015, 35, 35–76. [Google Scholar]
  164. Mal, S.; Singh, R.B.; Huggel, C.; Grover, A. Introducing linkages between climate change, extreme events, and disaster risk reduction. In Climate Change, Extreme Events and Disaster Risk Reduction: Towards Sustainable Development Goals; Springer: Berlin/Heidelberg, Germany, 2018; pp. 1–14. [Google Scholar]
  165. Wagner, P.; Reich, M.R. Regions of Risk: A Geographical Introduction to Disasters. Technol. Hazards 2014, 91, 410. [Google Scholar]
  166. Clarke, B.; Otto, F.; Stuart-Smith, R.; Harrington, L. Extreme weather impacts of climate change: An attribution perspective. Environ. Res. Clim. 2022, 1, 012001. [Google Scholar] [CrossRef]
  167. Duffey, R.; Saull, J. Know the Risk: Learning from Errors and Accidents: Safety and Risk in Today’s Technology; Elsevier: Amsterdam, The Netherlands, 2002. [Google Scholar]
  168. Brooks, N.; Adger, N.W. Country level risk measures of climate-related natural disasters and implications for adaptation to climate change. Clim. Res. 2003, 24, 115–123. [Google Scholar]
  169. Schipper, L.; Pelling, M. Disaster risk, climate change and international development: Scope for, and challenges to, integration. Disasters 2006, 30, 19–38. [Google Scholar] [CrossRef]
  170. Berg, M.; De Majo, V. Understanding the global strategy for disaster risk reduction. Risk Hazards Crisis Public Policy 2017, 8, 147–167. [Google Scholar] [CrossRef]
  171. Bankoff, G.; Frerks, G.; Hilhorst, D. Mapping Vulnerability: Disasters, Development and People; Routledge: New York, NY, USA, 2013. [Google Scholar]
  172. Hannigan, J. Disasters without Borders: The International Politics of Natural Disasters; John Wiley & Sons: Hoboken, NJ, USA, 2013. [Google Scholar]
  173. Chai, J.; Wu, H.-Z. Prevention/mitigation of natural disasters in urban areas. Smart Constr. Sustain. Cities 2023, 1, 4. [Google Scholar] [CrossRef]
  174. Wang, J. Vision of China’s future urban construction reform: In the perspective of comprehensive prevention and control for multi disasters. Sustain. Cities Soc. 2021, 64, 102511. [Google Scholar] [CrossRef]
  175. Ul Din, S.; Mak, H.W.L. Retrieval of land-use/land cover change (LUCC) maps and urban expansion dynamics of Hyderabad, Pakistan via Landsat datasets and support vector machine framework. Remote Sens. 2021, 13, 3337. [Google Scholar] [CrossRef]
  176. Liu, Y.; Zhong, Y.; Ma, A.; Zhao, J.; Zhang, L. Cross-resolution national-scale land-cover mapping based on noisy label learning: A case study of China. Int. J. Appl. Earth Obs. Geoinf. 2023, 118, 103265. [Google Scholar] [CrossRef]
  177. Zafar, Z.; Zubair, M.; Zha, Y.; Fahd, S.; Nadeem, A.A. Performance assessment of machine learning algorithms for mapping of land use/land cover using remote sensing data. Egypt. J. Remote Sens. Space Sci. 2024, 27, 216–226. [Google Scholar] [CrossRef]
  178. Barros, J.L.; Tavares, A.O.; Santos, P.P. Land use and land cover dynamics in Leiria City: Relation between peri-urbanization processes and hydro-geomorphologic disasters. Nat. Hazards 2021, 106, 757–784. [Google Scholar] [CrossRef]
  179. Lupo, F.; Reginster, I.; Lambin, E.F. Monitoring land-cover changes in West Africa with SPOT Vegetation: Impact of natural disasters in 1998–1999. Int. J. Remote Sens. 2001, 22, 2633–2639. [Google Scholar] [CrossRef]
  180. Mallma, S.F.T. Mainstreaming land use planning into disaster risk management: Trends in Lima, Peru. Int. J. Disaster Risk Reduct. 2021, 62, 102404. [Google Scholar] [CrossRef]
Figure 1. Geospatial distribution of natural and man-made (technological) disasters by continent (1900–2024).
Applsci 14 08129 g001
Figure 2. Geospatial distribution of natural and man-made (technological) disasters by continent (1900–2024).
Applsci 14 08129 g002
Figure 3. Distribution of individual natural and man-made (technological) disasters by continent (1900–2024).
Applsci 14 08129 g003
Figure 4. Distribution of total disasters by country (Rang, with red numbers) in percentage for the period 1900–2024.
Applsci 14 08129 g004
Figure 5. Distribution of total, natural, and man-made (technological) disasters for the top five countries (Rang) for the period 1900–2024.
Applsci 14 08129 g005
Figure 6. Distribution of total, natural, and man-made (technological) disasters by country (1900–2024).
Applsci 14 08129 g006
Figure 7. Temporal analysis of natural and man-made (technological) disasters in 10-year intervals (1900–2024).
Applsci 14 08129 g007
Figure 8. Temporal analysis of natural and man-made (technological) disasters in 5-year intervals (1900–2024).
Applsci 14 08129 g008
Figure 9. Total number of different natural and man-made (technological) disasters worldwide by decade (1900–2024).
Applsci 14 08129 g009
Figure 10. Total number of different natural and man-made (technological) disasters by 5-year periods (1900–2024).
Applsci 14 08129 g010
Figure 11. Consequences of natural and man-made (technological) disasters by decades (1900–2024).
Applsci 14 08129 g011
Figure 12. Consequences of natural and man-made (technological) disasters by 5-year periods (1900–2024).
Applsci 14 08129 g012
Figure 13. Percentage distribution of natural and man-made (technological) disaster consequences by type (1900–2024).
Applsci 14 08129 g013
Table 1. Geospatial distribution of natural and man-made (technological) disasters by continent (1900–2024).
ContinentTotal DisastersNatural DisastersMan-Made (Tech.) Disasters
n%n%n%
North America357513.84270875.7586724.25
Asia10,78641.75667561.89411138.11
Africa554021.44311456.21242643.79
Europe309111.96199564.54109635.46
South America21148.18140766.5670733.44
Oceania7302.8366891.51628.49
Total25,83610016,56769.41926930.59
Table 2. Distribution of individual natural and man-made (technological) disasters by continent (1900–2024).
Disaster TypeNorth
America
AsiaAfricaEuropeSouth AmericaOceaniaTotal
(n)(%)(n)(%)(n)(%)(n)(%)(n)(%)(n)(%)(n)(%)
Earthquake1670.659513.68750.291630.631540.60570.2215676.07
Volcanic activity450.171120.43190.07110.04450.17320.122641.00
Flood6882.6624299.4012404.806502.526852.651600.62585222.65
Water-related990.387032.725612.171630.63630.24140.0516036.19
Mass movement (wet)450.174401.70680.26770.301550.60180.078033.10
Drought1020.391790.693611.40490.19740.29340.137993.09
Extreme temperature700.272000.77200.082971.15480.1980.036432.49
Glacial lake outburst flood00.0030.0100.0010.0000.0000.0040.01
Storm13385.1818997.353111.205762.231050.412901.12451917.49
Epidemic1000.393611.408993.48440.17840.33240.0915125.86
Wildfire1450.56690.27380.151230.48490.19410.164651.81
Air1870.723121.211690.652330.901240.48210.0810464.04
Animal incident00.0000.0000.0000.0000.0000.0000.00
Chemical spill470.18200.0840.02290.1130.0110.001040.40
Collapse (industrial)30.01880.34700.2770.03150.0600.001830.71
Collapse (miscellaneous)290.111560.60610.24300.12250.1020.013031.18
Explosion (industrial)570.225091.97590.231080.42320.1240.027692.98
Explosion (miscellaneous)170.071180.46400.15350.14100.0400.002200.86
Fire (industrial)220.091370.53150.06350.1470.0300.002160.85
Fire (miscellaneous)1110.433951.531170.451170.45420.1670.037893.05
Fog00.0000.0000.0000.0000.0000.0000.00
Gas leak130.05380.1500.00100.0400.0010.00620.24
Industrial accident70.03890.34160.0650.0280.0310.001260.48
Infestation00.0000.0000.0000.0000.0000.0000.00
Mass movement (dry)00.0000.0000.0000.0000.0000.0000.00
Miscellaneous accident230.091290.50680.26310.12190.0710.008132.10
Oil spill30.0120.0100.0020.0110.0000.00240.03
Poisoning60.02500.1960.02100.0440.0200.002280.29
Radiation10.0040.0200.0000.0010.0000.00180.01
Rail740.292881.111110.431220.47150.0650.0218452.38
Road1680.6510734.1511294.371590.623381.3150.02861611.21
Table 3. Distribution of total, natural, and man-made (technological) disasters by country (1900–2024).
Country (Rang)Total
Disasters
Natural
Disasters
Man-Made (Tech.)
Disasters
Top 5 Disasters by Country
(n)(%)(n)(%)(n)(%)1st2nd3rd4th5th
1. China19967.54101250.7098449.30IA (15.08)S (14.73)F (14.53)D (14.28)E (14.23)
2. India15815.9777649.0880550.92E (15.50)IA (14.86)D (14.80)F (14.29)E (14.17)
3. USA15135.72115276.1436123.86E (15.27)IA (14.87)D (14.47)F (14.41)W (13.88)
4. Philippines9383.5469874.4124025.59IA (16.10)S (14.71)D (14.50)E (14.39)W (14.18)
5. Indonesia8783.3262170.7325729.27F (16.40)E (15.15)D (15.03)E (14.81)W (13.44)
6. Bangladesh5882.2236361.7322538.27F (15.99)D (15.14)IA (15.14)E (14.97)S (13.27)
7. Nigeria5231.9814327.3438072.66W (16.63)S (16.44)IA (14.72)E (14.53)D (13.38)
8. Pakistan5041.9025450.4025049.60F (15.08)W (15.08)S (14.88)IA (14.29)E (13.89)
9. Mexico4811.8230463.2017736.80W (17.88)E (15.59)F (15.18)D (13.51)E (12.89)
10. Japan4641.7538983.847516.16W (17.24)E (15.73)S (15.09)D (14.44)IA (13.79)
11. Brazil4621.7528361.2617938.74E (15.15)IA (15.15)W (14.94)D (14.72)F (14.50)
12. Iran4421.6726559.9517740.05D (17.87)E (15.61)W (15.16)IA (14.48)F (13.35)
13. Russia4171.5817842.6923957.31E (17.27)W (15.35)S (15.11)D (14.63)IA (13.43)
14. Peru3971.5021754.6618045.34F (15.87)E (15.37)E (14.36)S (14.11)IA (13.85)
15. Türkiye3901.4721755.6417344.36D (16.67)IA (15.13)W (15.13)S (14.36)F (13.33)
16. Congo3421.2915545.3218754.68S (17.54)W (14.91)D (14.04)IA (14.04)E (13.45)
17. Colombia3391.2823268.4410731.56IA (16.52)E (16.22)D (14.45)E (14.45)S (14.45)
18. Viet Nam3381.2826478.117421.89S (16.86)E (16.57)D (15.98)W (15.38)F (14.79)
19. South Africa3261.2312939.5719760.43D (16.56)S (15.64)F (14.72)IA (14.72)E (14.42)
20. France2961.1220368.589331.42W (20.27)IA (14.53)E (14.19)D (13.85)S (13.51)
21. Italy2851.0818765.619834.39F (17.54)IA (17.54)S (15.44)D (13.68)E (13.33)
22. Afghanistan2741.0421979.935520.07E (17.88)F (16.06)S (14.60)D (14.23)W (13.14)
23. Thailand2741.0417262.7710237.23E (20.07)W (17.88)E (13.50)S (13.14)D (12.77)
24. Australia2570.9722386.773413.23E (17.51)D (15.18)F (14.01)S (14.01)E (13.23)
25. Egypt2520.953614.2921685.71E (20.24)E (15.08)IA (13.89)W (13.49)S (12.70)
26. Canada2460.9315362.209337.80F (17.89)D (15.04)S (14.23)E (13.82)IA (13.82)
27. Kenya2310.8712654.5510545.45IA (17.75)F (16.88)E (16.02)S (13.85)D (13.42)
28. Nepal2150.8113964.657635.35E (18.14)S (16.74)D (14.88)E (14.88)IA (12.56)
29. Tanzania2140.8112257.019242.99W (20.56)IA (16.36)E (14.49)F (14.49)E (13.08)
30. Great Britain2040.7710551.479948.53E (19.12)E (15.69)F (15.69)D (14.22)W (13.24)
31. Rep. Korea2020.7613265.357034.65E (17.82)F (17.82)W (14.85)E (13.86)IA (13.37)
32. Haiti1960.7413870.415829.59W (18.37)IA (17.35)E (14.80)F (13.78)E (13.27)
33. Sudan1960.7410855.108844.90IA (18.88)S (18.37)F (15.82)D (14.29)E (12.76)
34. Uganda1910.7211158.128041.88S (17.80)F (16.23)E (15.18)IA (13.61)D (12.57)
35. Spain1880.7111259.577640.43F (17.55)E (14.89)E (14.36)S (14.36)W (13.83)
36. Taiwan1870.7113672.735127.27IA (18.18)W (14.97)F (14.44)D (13.90)E (13.37)
37. Argentina1800.6813172.784927.22W (19.44)E (18.33)D (14.44)F (13.33)IA (13.33)
38. Ecuador1660.6311971.694728.31E (15.06)E (15.06)F (15.06)W (15.06)IA (13.86)
39. Guatemala1650.6212776.973823.03W (16.97)D (15.76)S (15.76)E (13.94)E (13.33)
40. Ethiopia1630.6212777.913622.09D (20.25)E (17.18)E (14.72)F (14.72)S (14.11)
41. Greece1630.6211168.105231.90S (19.02)E (16.56)W (15.95)E (14.11)IA (12.27)
42. Myanmar1590.608955.977044.03E (18.24)D (17.61)F (15.09)IA (14.47)S (13.21)
43. Bolivia1570.5911271.344528.66F (15.92)IA (14.65)W (14.65)D (14.01)E (14.01)
44. Sri Lanka1570.5913183.442616.56E (21.02)W (15.92)S (14.65)D (14.01)E (13.38)
45. Algeria1560.599359.626340.38E (16.03)W (16.03)S (15.38)D (14.74)F (14.74)
46. Belgium1560.597246.158453.85E (17.31)IA (17.31)E (14.74)D (14.10)F (14.10)
47. Morocco1560.596340.389359.62W (17.31)E (16.67)IA (16.03)S (16.03)D (11.54)
48. Mozambique1560.5912580.133119.87D (19.23)E (15.38)F (15.38)W (14.74)S (13.46)
49. Chile1520.5712582.242717.76F (18.42)E (15.79)D (14.47)E (14.47)W (13.16)
50. Malaysia1520.5710971.714328.29IA (21.05)S (19.74)F (15.79)D (13.82)W (13.82)
Note: industrial accident (IA); storm (S); flood (F); drought (D); epidemic (E); wildfire (W); earthquake (E).
Table 4. Temporal analysis of natural and man-made (technological) disasters in 10-year intervals (1900–2024): trend assessments and insights.
DecadeNatural
Disasters
Man-Made
(Technological)
Disasters
TotalTrend
(n)(%)(n)(%)(n)(%)Rate (%)
1900–19107978.222221.781010.38Stable (0.00%)
1911–19207864.464335.541210.46Increasing (19.57%)
1921–193010680.302619.701320.50Increasing (7.40%)
1931–194013361.298438.712170.82Increasing (42.20%)
1941–195017160.8511039.152811.06Increasing (11.73%)
1951–196031082.016817.993781.43Increasing (10.05%)
1961–197059486.099613.916902.61Increasing (13.59%)
1971–198087176.1427323.8611444.32Increasing (6.10%)
1981–1990175564.5796335.43271810.27Increasing (5.33%)
1991–2000295759.20203840.80499518.87Increasing (1.71%)
2001–2010446458.35318741.65765128.91Increasing (0.70%)
2011–2020375865.78195534.22571321.59Decreasing (−0.44%)
2021–2024174775.2057624.8023238.78Decreasing (−2.49%)
Table 5. Temporal analysis of natural and man-made (technological) disasters in 5-year intervals (1900–2024).
Period
(5-Year Intervals)
Natural
Disasters
Man-Made
(Technological)
Disasters
TotalTrend
(n)(%)(n)(%)(n)(%)(%)
1900–19053581.40818.60430.16Stable (0.00%)
1906–19104475.861424.14580.22Increasing (34.88%)
1911–19154777.051422.95610.23Increasing (5.17%)
1916–19203151.672948.33600.23Decreasing (−1.64%)
1921–19254777.051422.95610.23Increasing (1.67%)
1926–19305983.101216.90710.27Increasing (16.39%)
1931–19356877.272022.73880.33Increasing (23.94%)
1936–19406550.396449.611290.49Increasing (46.59%)
1941–19457748.128351.881600.60Increasing (24.03%)
1946–19509477.692722.311210.46Decreasing (−24.38%)
1951–195515781.773518.231920.73Increasing (58.68%)
1956–196015382.263317.741860.70Decreasing (−3.12%)
1961–196520485.713414.292380.90Increasing (27.96%)
1966–197039086.286213.724521.71Increasing (89.92%)
1971–197533677.249922.764351.64Decreasing (−3.76%)
1976–198053575.4617424.547092.68Increasing (62.99%)
1981–198577476.7123523.2910093.81Increasing (42.31%)
1986–199098157.4072842.6017096.46Increasing (69.38%)
1991–1995131458.5393141.4722458.48Increasing (31.36%)
1996–2000164359.75110740.25275010.39Increasing (22.49%)
2001–2005229156.72174843.28403915.26Increasing (46.87%)
2006–2010217360.16143939.84361213.65Decreasing (−10.57%)
2011–2015186463.66106436.34292811.06Decreasing (−18.94%)
2015–2020189468.0189131.99278510.52Decreasing (−4.88%)
2020–2024174775.2057624.8023238.78Decreasing (−16.59%)
Table 6. Total number of different natural and man-made (technological) disasters worldwide by decade (1900–2024).
Disaster Type1900–19101911–19201921–19301931–19401941–19501951–19601961–19701971–19801981–19901991–20002001–20102011–20202021–2024Total
Air0157597561629155300248158231091
Animal incident00000000000101
Chemical spill00000011733341670108
Collapse (indust.)000003021221606620184
Collapse (miscell.)1320047163678875516305
Drought41042130526112614017016962813
Earthquake383242657368881101732652892621121617
Epidemic56102323759124385590258451526
Explosion (industrial)579108116306517832810426787
Explosion100000031643875814222
Extreme temperature000208915379122420759652
Fire (industrial)100011162970584310220
Fire (miscell.)934587387910413119314974804
Flood649111181155259515861171915317795941
Fog00000100000001
Gas leak00001005220208662
Glacial lake outburst flood00000000000044
Infestation010110044811189295
Mass mov. (dry)30010120141185045
Mass mov. (wet)1246420265510515119218378827
Oil spill00000001112308
Poisoning000002171036173076
Radiation00000101322009
Rail2626102514351031961428916646
Road00000341119255612406941822882
Storm141834395511921127453389310499975154751
Volcanic activity83137912233152604322274
Water-related2923455121723155284251531635
Wildfire02214167491001439763475
Total10012113221627837869111212688494174905624228126,061
Table 7. Total number of different natural and man-made (technological) disasters by 5-year periods (1900–2024).
Disaster
Type
1900–19041905–19091910–19141915–19191920–19241925–19291930–19341935–19391940–19441945–19491950–19541955–19591960–19641965–19691970–19741975–19791980–19841985–19891990–19941995–19992000–20042005–20092010–20142015–20192020–2024
Air001143410496963388171227128148152131117906823
Animal incident0000000000000000000000100
Chemical spill000000000000011162013112388610
Collapse (ind.)0000000000120002579122040323420
Collapse (misc.)01121100001343313102633455037322316
Drought319131201120010421843804664769674848562
Earthquake142420122022353038354127256339718687140125174115136126112
Epidemic231591111220631950398510328236023013911945
Explosion (ind.)14526355266533102026398494175153594526
Explosion (mis.)10000000000000219716275532382014
Extreme temper.0000000200534569112640511091151258259
Fire (ind.)100000000101102492033373226212210
Fire (misc.)36123123531692931484460547710786678274
Flood332218383842395310298161222293365496769950761770779
Fog0000000000100000000000000
Gas leak0000000010000023201010128266
Glacial lake (flood)0000000000000000000000004
Infestation001000101000001304856162182
Mass mov. (dry)12000001000120005911035230
Mass mov. (wet)011122421311991732234659589310884889578
Oil spill0000000000000001010102120
Poisoning0000000000110134462214134210
Radiation0000000000010001031102000
Rail11150215461696813222578931038557454416
Road0000000000300411012180221335725515393301182
Storm59108112320191837487190121122152242291464429540509473524515
Volcanic activity71210121257257419201129232535222122
Water-related115411211332237528144168147254274218207153
Wildfire0011110122010634232635658855356263
Total861141221201221421762563182383843724749088481394199033864434544879107070574655024562
Table 8. Seasonality analysis showing the number of occurrences of each disaster type by month.
Disaster TypeJanFebMarAprMayJunJulAugSepOctNovDecTotalTrend
(n)(%)
Air362040662616744393130241910914.123AA
Animal incident00000000001010.004BA
Chemical spill02170086332221080.408BA
Collapse (industrial)771318176629692191840.695BA
Collapse (miscellaneous)15121414711181152131383051.153BA
Drought44326773430184664404361308133.072BA
Earthquake19792316190483720118591328314516176.11AA
Epidemic6375754249220701573883794415265.766AA
Explosion (industrial)24233270393041134262546277872.974BA
Explosion (miscellaneous)12813131099920167782220.839BA
Extreme temperature988135341010280491156336522.464BA
Fire (industrial)7611166712181198102200.831BA
Fire (miscellaneous)38354460192044035242630338043.038BA
Flood5923043903062901922072400403374356262594122.449AA
Fog00000010000010.004BA
Gas leak02210282861210620.234BA
Glacial lake outburst flood01010010010040.015BA
Impact00100000000010.004BA
Industrial accident (general)86415864011641171260.476BA
Infestation0802007183102950.359BA
Mass movement (dry)2100103710120450.17BA
Mass movement (wet)51614344341942741232924318273.125A
Miscellaneous accident162123335158515141420152761.043BA
Oil spill10010120102080.03BA
Poisoning0581005601311760.287BA
Radiation00010062000090.034BA
Rail131328441311453247171946462.441BA
Road166951401281091351326189153158166117288210.89AA
Storm345184344259349952146217191218211192475117.953AA
Volcanic activity17251176712049310192741.035BA
Water-related94721061526262718757184895016356.178AA
Wildfire26152821151223955202011134751.795BA
Note: AA—above average; A—average; BA—below average.
Table 9. Number of consequences of natural and man-made (technological) disasters by decade (1900–2024).
DecadeNatural DisastersMan-Made (Tech.) DisastersTotal
FatalitiesInjuriesEconomic LossesFatalitiesInjuriesEconomic LossesFatalitiesInjuriesEconomic Losses
1900–19104,472,47725491,373,8005766204,478,24325511,373,800
1911–19203,334,0042955600,00010,752930625003,344,75612,261602,500
1921–19308,561,918109,1091,004,23071391596100,0008,569,057110,7051,104,230
1931–19404,629,968112,4033,342,000557951104,635,547112,9143,342,000
1941–19503,878,89769,3293,136,70011,165225860003,890,06271,5873,142,700
1951–19602,127,94424,6426,090,48010,9796241218,0002,138,92330,8836,308,480
1961–19701,751,347784,52218,633,10064465155159,9721,757,793789,67718,793,072
1971–1980998,508552,54153,753,22517,24422,80976,1931,015,752575,35053,829,418
1981–1990796,062317,353183,523,62958,382159,6206,469,293854,444476,973189,992,922
1991–2000527,4131,588,807701,281,22486,14980,1744,410,769613,5621,668,981705,691,993
2001–2010839,4183,282,010892,099,16297,16689,61714,746,682936,5843,371,627906,845,844
2011–2020503,4003,241,4771,706,627,17462,71559,37520,969,701566,1153,300,8521,727,596,875
2021–2024199,314627,655861,127,19015,13224,59316,750,000214,446652,248877,877,190
Notes: fatalities: the total number of deaths; injuries: the total number of injured individuals; economic losses: represented in thousands of US dollars.
Table 10. Consequences of natural and man-made (technological) disasters by 5-year periods (1900–2024).
5-Year
Period
Natural DisastersMan-Made (Tech.) DisastersTotal
FatalitiesInjuriesEconomic LossesFatalitiesInjuriesEconomic
Losses
FatalitiesInjuriesEconomic
Losses
1900–19051,523,244251535,0002230201,525,474253535,000
1906–19102,949,2332298838,8003536002,952,7692298838,800
1911–1915311,1752828275,0005232200316,4072848275,000
1916–19203,022,829127325,0005520928625003,028,3499413327,500
1921–19255,065,612103,900663,00064121500100,0005,072,024105,400763,000
1926–19303,496,3065209341,2307279603,497,0335305341,230
1931–19353,772,10090451,629,000302132403,775,12193691,629,000
1936–1940857,868103,3581,713,00025581870860,426103,5451,713,000
1941–19453,569,72448,9091,325,5005208118103,574,93250,0901,325,500
1946–1950309,17320,4201,811,200595710776000315,13021,4971,817,200
1951–195586,80211,2433,775,18053771949178,00092,17913,1923,953,180
1956–19602,041,14213,3992,315,3005602429240,0002,046,74417,6912,355,300
1961–1965124,66716,1198,163,8813394281849,759128,06118,9378,213,640
1966–19701,626,680768,40310,469,21930522337110,2131,629,732770,74010,579,432
1971–1975623,353218,95315,582,333677912,9903843630,132231,94315,586,176
1976–1980375,155333,58838,170,89210,465981972,350385,620343,40738,243,242
1981–1985633,887155,97984,139,47217,264140,392761,976651,151296,37184,901,448
1986–1990162,175161,37499,384,15741,11819,2285,707,317203,293180,602105,091,474
1991–1995299,078818,151264,087,75244,15832,1201,363,916343,236850,271265,451,668
1996–2000228,335770,656437,193,47241,99148,0543,046,853270,326818,710440,240,325
2001–2005435,6582,437,898331,597,22554,14354,20911,607,124489,8012,492,107343,204,349
2006–2010403,760844,112560,501,93743,02335,4083,139,558446,783879,520563,641,495
2011–2015418,7561,087,793871,742,99032,71031,14020,964,701451,4661,118,933892,707,691
2016–202084,6442,153,684834,884,18430,00528,2355000114,6492,181,919834,889,184
2021–2024199,314627,655861,127,19015,13224,59316,750,000214,446652,248877,877,190
Notes: fatalities: the total number of deaths; injuries: the total number of injured individuals; economic losses: represented in thousands of US dollars.
Table 11. Summary of disaster consequences by type, including total counts and percentage contributions (1900–2024).
Disaster TypeDeathsInjuredAffectedDamage (‘000 USD)
(n)(%)(n)(%)(n)(%)(n)(%)
Air50,6890.15476200.06888460.0144,1000.003
Animal incident120.000.050.000.0
Chemical spill6100.00287730.078652,9810.0081,198,9540.027
Collapse (industrial)70990.02224500.02233530.01,335,0000.03
Collapse (miscellaneous)14,8300.04513,0240.117309,5140.004283,8000.006
Drought11,734,27235.54320.02,964,996,76834.146257,581,6745.728
Earthquake2,407,7177.2932,945,05226.35228,214,6732.628975,785,91621.701
Epidemic9,622,34329.142,836,71925.3850,095,8290.57770.0
Explosion (industrial)36,8140.11241,8500.374864,3410.0140,421,6740.899
Explosion (miscellaneous)76240.02319,2310.172137,5270.002619,1000.014
Extreme temperature256,4130.7772,066,93618.49107,678,8101.2469,468,3431.545
Fire (industrial)55220.01752110.047465,3620.0052,608,0050.058
Fire (miscellaneous)36,5900.11124,0220.2151,368,3830.0163,485,4700.078
Flood7,011,40421.231,398,04212.503,997,629,67146.0391,007,889,80522.415
Fog40000.01200.000.000.0
Gas leak29060.009116,2801.04513,9320.00630,0000.001
Glacial lake outburst flood4390.001240.088,4240.001210,0000.005
Impact00.014910.013301,4910.00333,0000.001
Industrial accident (general)52070.01615520.014135,9870.0029,960,4070.222
Infestation00.000.02,802,2000.032229,2000.005
Mass movement (dry)44860.0143730.00323,1170.0209,0000.005
Mass movement (wet)68,6360.20812,7050.11416,823,5020.19411,347,0440.252
Miscellaneous accident (general)14,2790.04340,6660.3641,880,0520.02240000.0
Oil spill10.01200.00129,1370.030,0000.001
Poisoning35780.01154,4420.487648,5220.00700.0
Radiation860.019580.0181,064,2010.0122,800,0000.062
Rail28,7300.08761,7440.552109,4530.001903,0000.02
Road68,8120.20849,1840.4456,3060.00177000.0
Storm1,418,6474.2971,411,42512.621,277,565,96814.7131,967,141,98443.748
Volcanic activity86,9350.26326,5640.23810,032,6580.1166,327,9120.141
Water-related111,2370.33713,1300.117149,2560.00277,9000.002
Wildfire53660.01615,9890.14318,531,5820.213136,368,0303.033
Total33,015,284100.011,176,609100.08,683,181,851100.04,496,501,025100.0
Table 12. Pearson’s correlation results for socio-economic indicators in the distribution and consequences of disasters.
VariablesAffectedDeathsInjuriesTotal
Disasters
Natural
Disasters
Man-Made
Disaster
Sig.rSig.rSig.rSig.rSig.rSig.r
GDP per capita (USD)0.0550.4240.6990.0900.7540.0730.140−0.333 *0.4230.1850.7480.075
Governance quality0.1170.3520.941−0.017 *0.846−0.045 *0.080−0.390 *0.4860.1610.6210.114
Population density (people per km2)0.000 *0.7290.120−0.350 *0.229−0.274 *0.401−0.193 *0.8600.0410.8940.031
Urbanization rate (%)0.1200.3500.612−0.117 *0.804−0.058 *0.007 *−0.571 *0.766−0.0690.3670.208
* p ≤ 0.05.
Table 13. Comprehensive recommendations for disaster risk reduction measures and implementation strategies.
RecommendationDescriptionShort-TermLong-TermNationalLocal
Integration of disaster risk reductionIntegrate strategies for disaster risk reduction into the overall national development agenda
Enhancement of early warning systemsEnhance early warning systems through investments in advanced technology, infrastructure improvements, and comprehensive training programs
Promotion of climate resilienceFocus on climate resilience by adopting sustainable practices and implementing green infrastructure projects
Strengthening industrial safetyUpgrade safety protocols and strengthen regulatory frameworks governing industrial operations
Community-based disaster risk managementEmpower communities by providing education, training, and opportunities for active involvement in disaster management
Investing in research and developmentPromote research and development to discover innovative solutions for reducing disaster risks on the basis of a better understanding of the interconnections of risks
Regional cooperation and information sharingFoster international cooperation and improve data sharing mechanisms for more effective disaster preparedness and response
Adapting infrastructure and urban planningConstruct resilient infrastructure and apply sustainable urban planning methods to reduce disaster impacts
Public awareness and education campaignsRaise public awareness and improve education about disaster risks and preparedness measures
Regular assessment and update of plansPeriodically review and revise disaster management plans based on updated data and emerging threats
Improvement of seismic resilienceEmphasize the construction and retrofitting of buildings to be earthquake-resistant, particularly in vulnerable areas
Flood management and mitigationImplement effective flood control systems, including dams, levees, and enhanced drainage networks
Sustainable agriculture practicesEncourage agricultural practices and other methods that reduce vulnerability to droughts and climate-related disasters
Enhancing health systemsEnhance health infrastructure to provide better responses to epidemics and other public health crises
Technological upgrades for disaster monitoringInvest in cutting-edge technologies for real-time disaster monitoring and early detection capabilities
Capacity building for emergency respondersContinuously train and equip emergency responders to increase their efficiency and effectiveness during crises
Improving urban infrastructureDesign urban infrastructure to be resilient against both natural and man-made (technological) disasters
Implementing comprehensive risk assessmentsConduct comprehensive risk assessments to identify vulnerabilities and prioritize mitigation strategies
Developing cross-sectoral and cross-national DRR strategiesCoordinate disaster risk reduction activities across various sectors, such as healthcare, agriculture, and transportation
Strengthening legal and institutional frameworksStrengthen legal and institutional frameworks to support robust disaster risk management practices
Fostering public–private partnershipsPromote public–private partnerships to leverage resources and expertise in disaster risk reduction initiatives
Grouping disaster mitigation measuresTailor disaster mitigation measures to specific types of disasters, including floods, earthquakes, and industrial accidents
Enhancing community resilience programsDevelop educational and training programs to enhance community resilience and disaster preparedness
Improving data collection and analysisImprove data collection and analysis to gain a deeper understanding of disaster trends and inform policy decisions. Improve standardized data collection and analysis
Increasing funding for DRR initiativesSecure consistent funding for disaster risk reduction programs to ensure their long-term success and sustainability
Note: an upward arrow (↑) indicates a focus on national-level implementation; a downward arrow (↓) indicates a focus on local-level implementation; a checkmark (✓) indicates immediate action or short-term implementation.
Disclaimer/Publisher’s Note: The statements, opinions and data contained in all publications are solely those of the individual author(s) and contributor(s) and not of MDPI and/or the editor(s). MDPI and/or the editor(s) disclaim responsibility for any injury to people or property resulting from any ideas, methods, instructions or products referred to in the content.

