
Detachment Energy Evaluation in Nano-Particle Cleaning Using Lateral Force Microscopy

 , ,
, ,  ,
,
Abstract
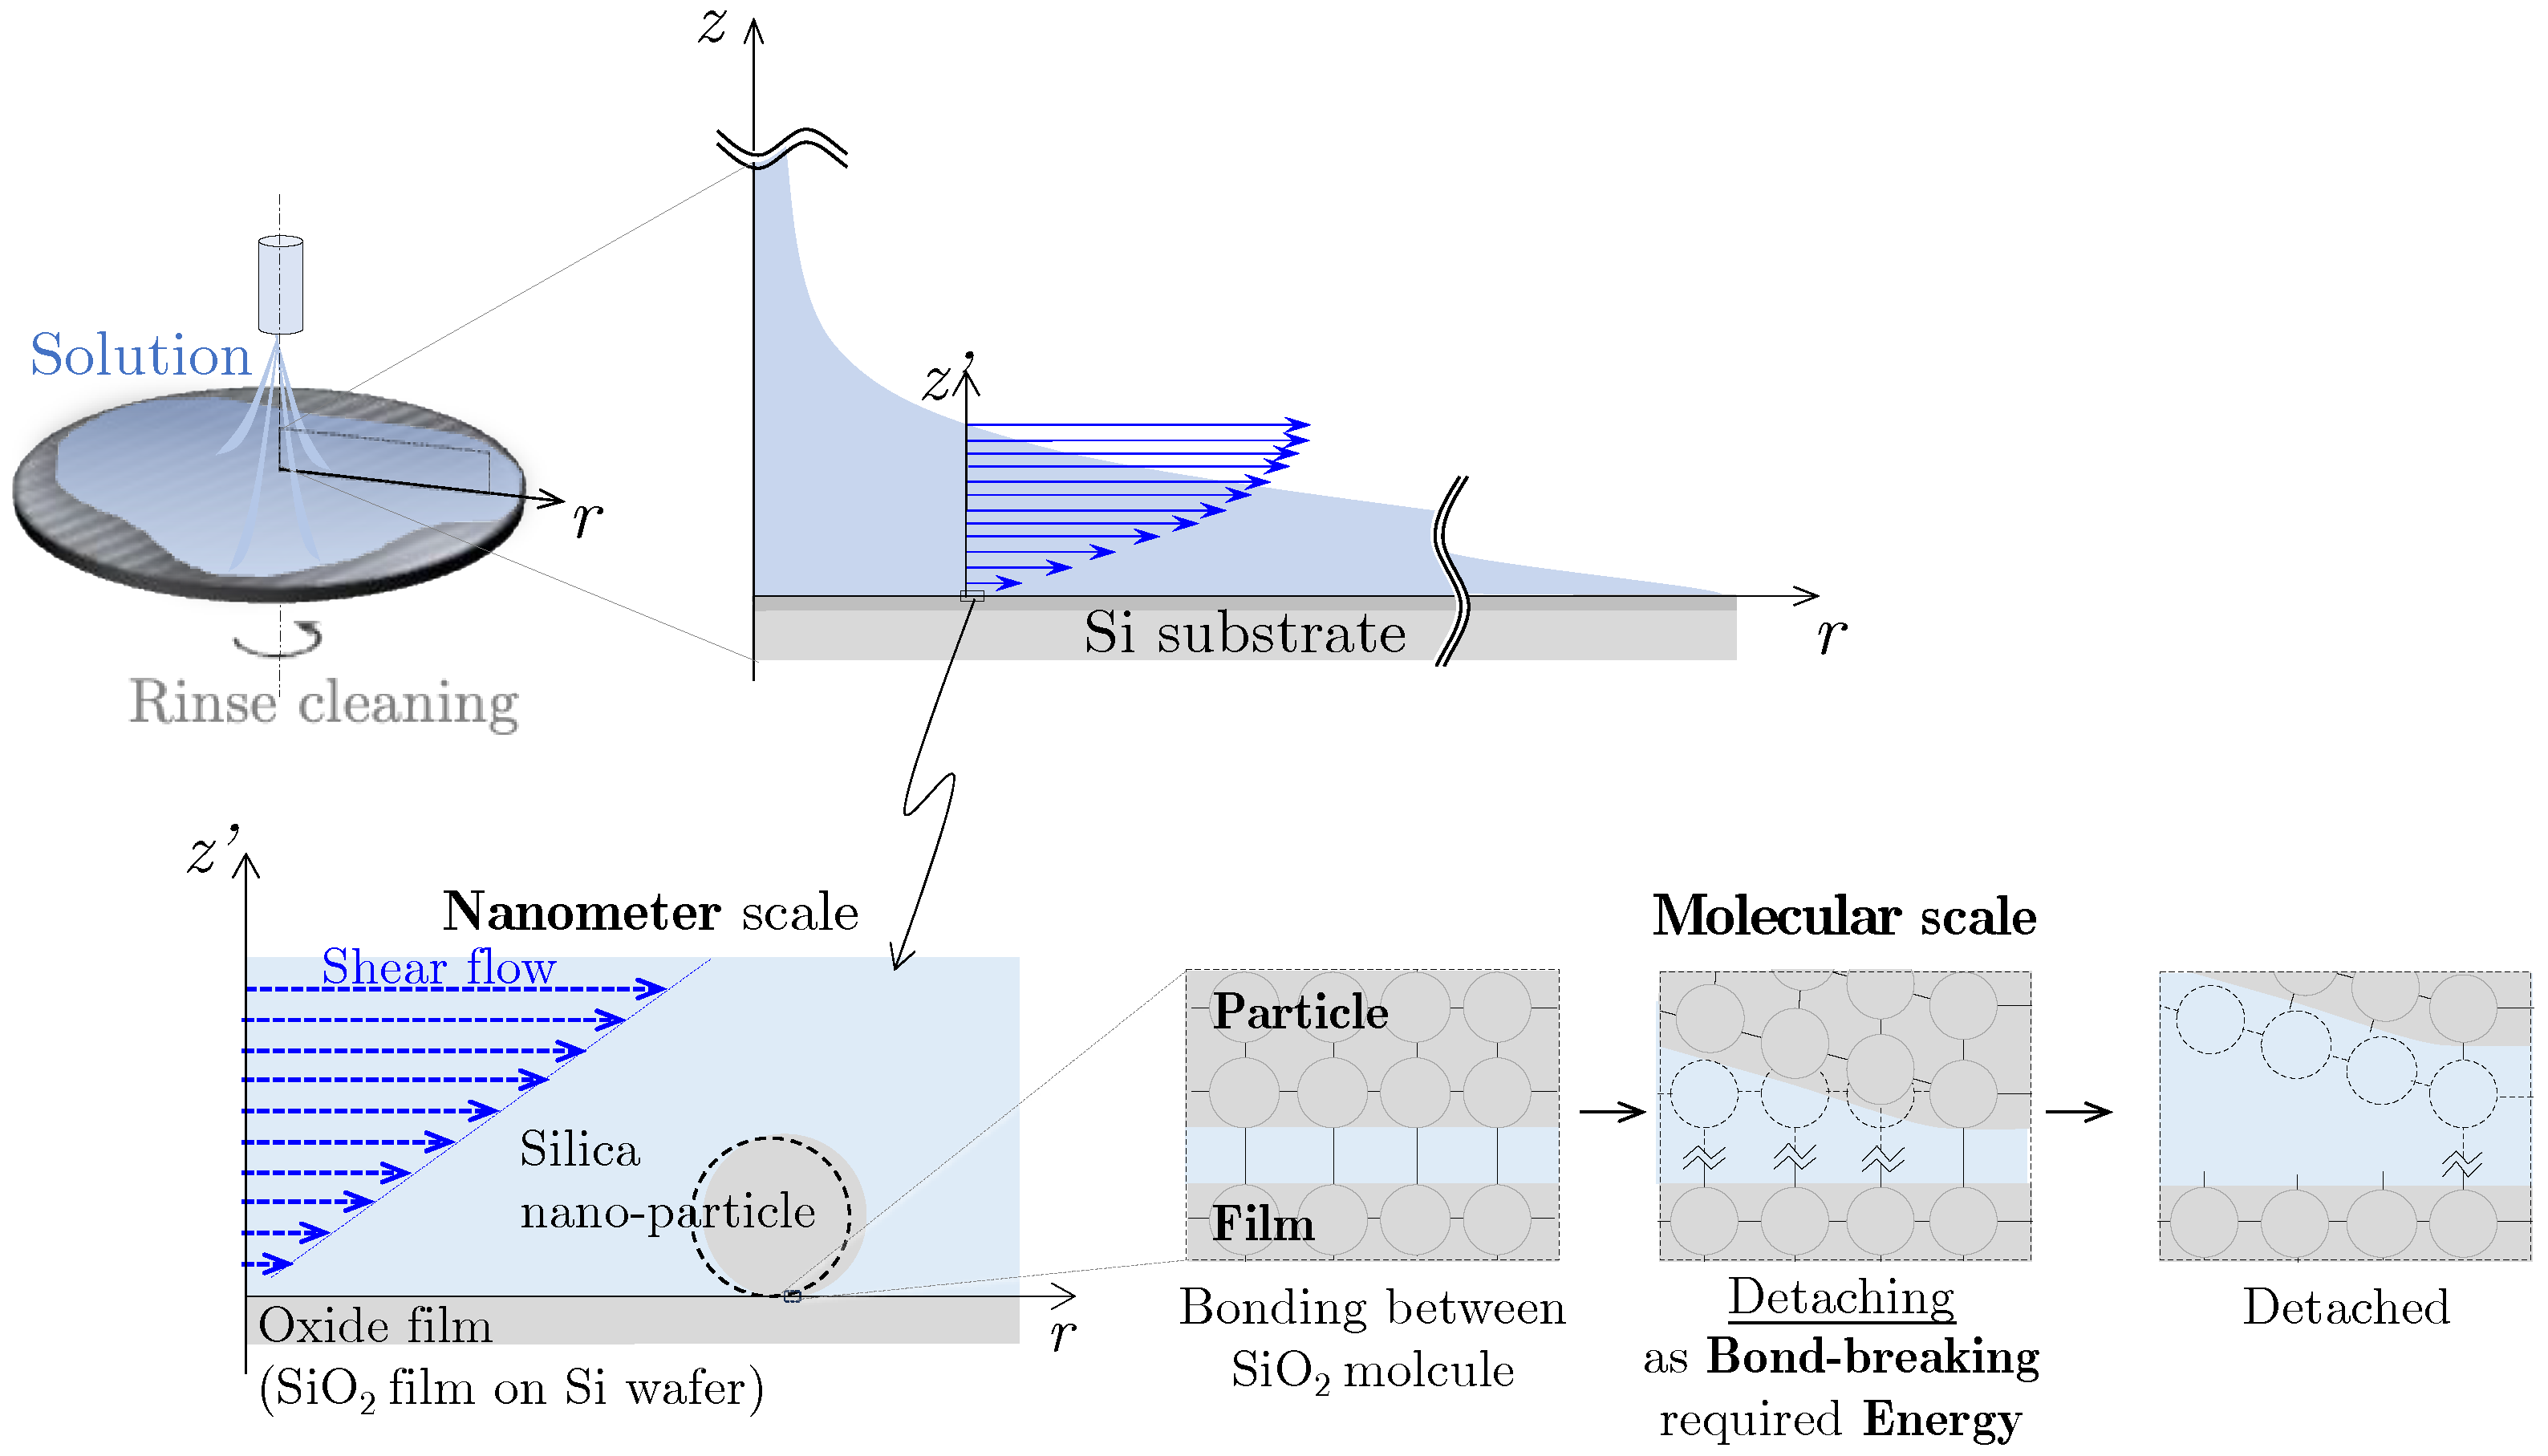
:1. Introduction
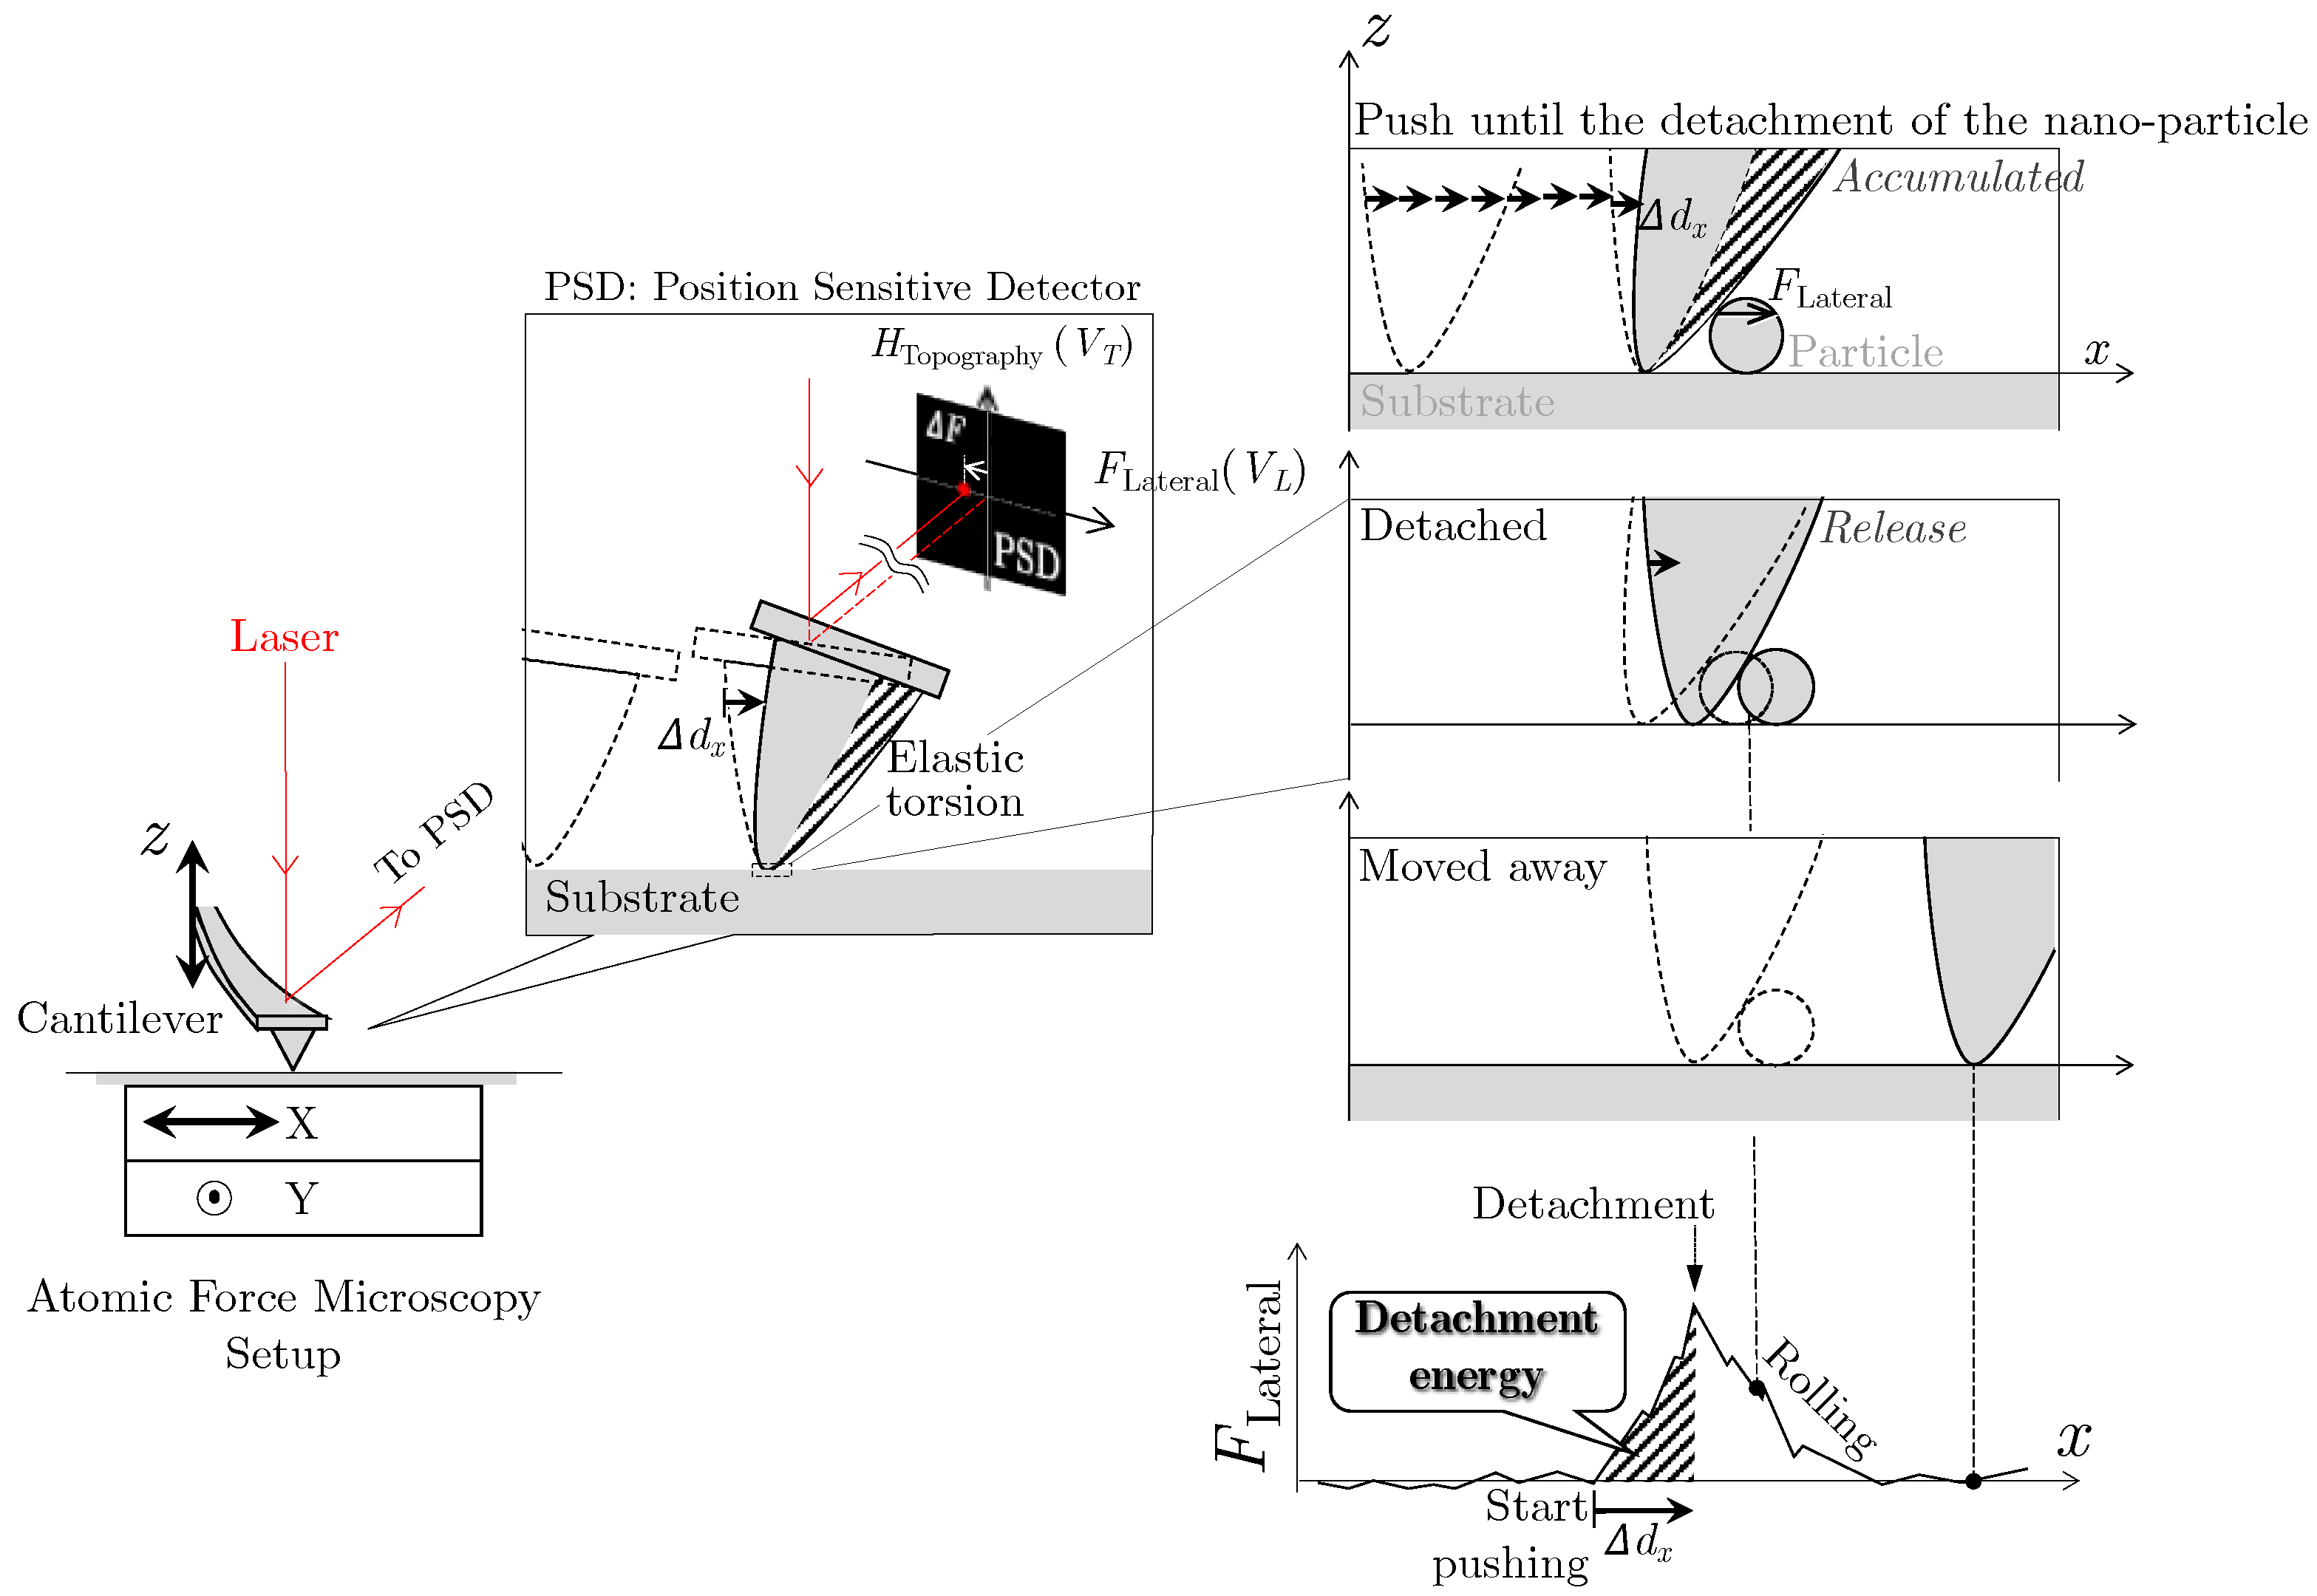
2. Measurement Method of Nano-Particle Detachment Energy Using Lateral Force Microscopy
3. Experimental Results of Detachment Energy for Various-Sized Silica Particles from an Oxide Film Surface
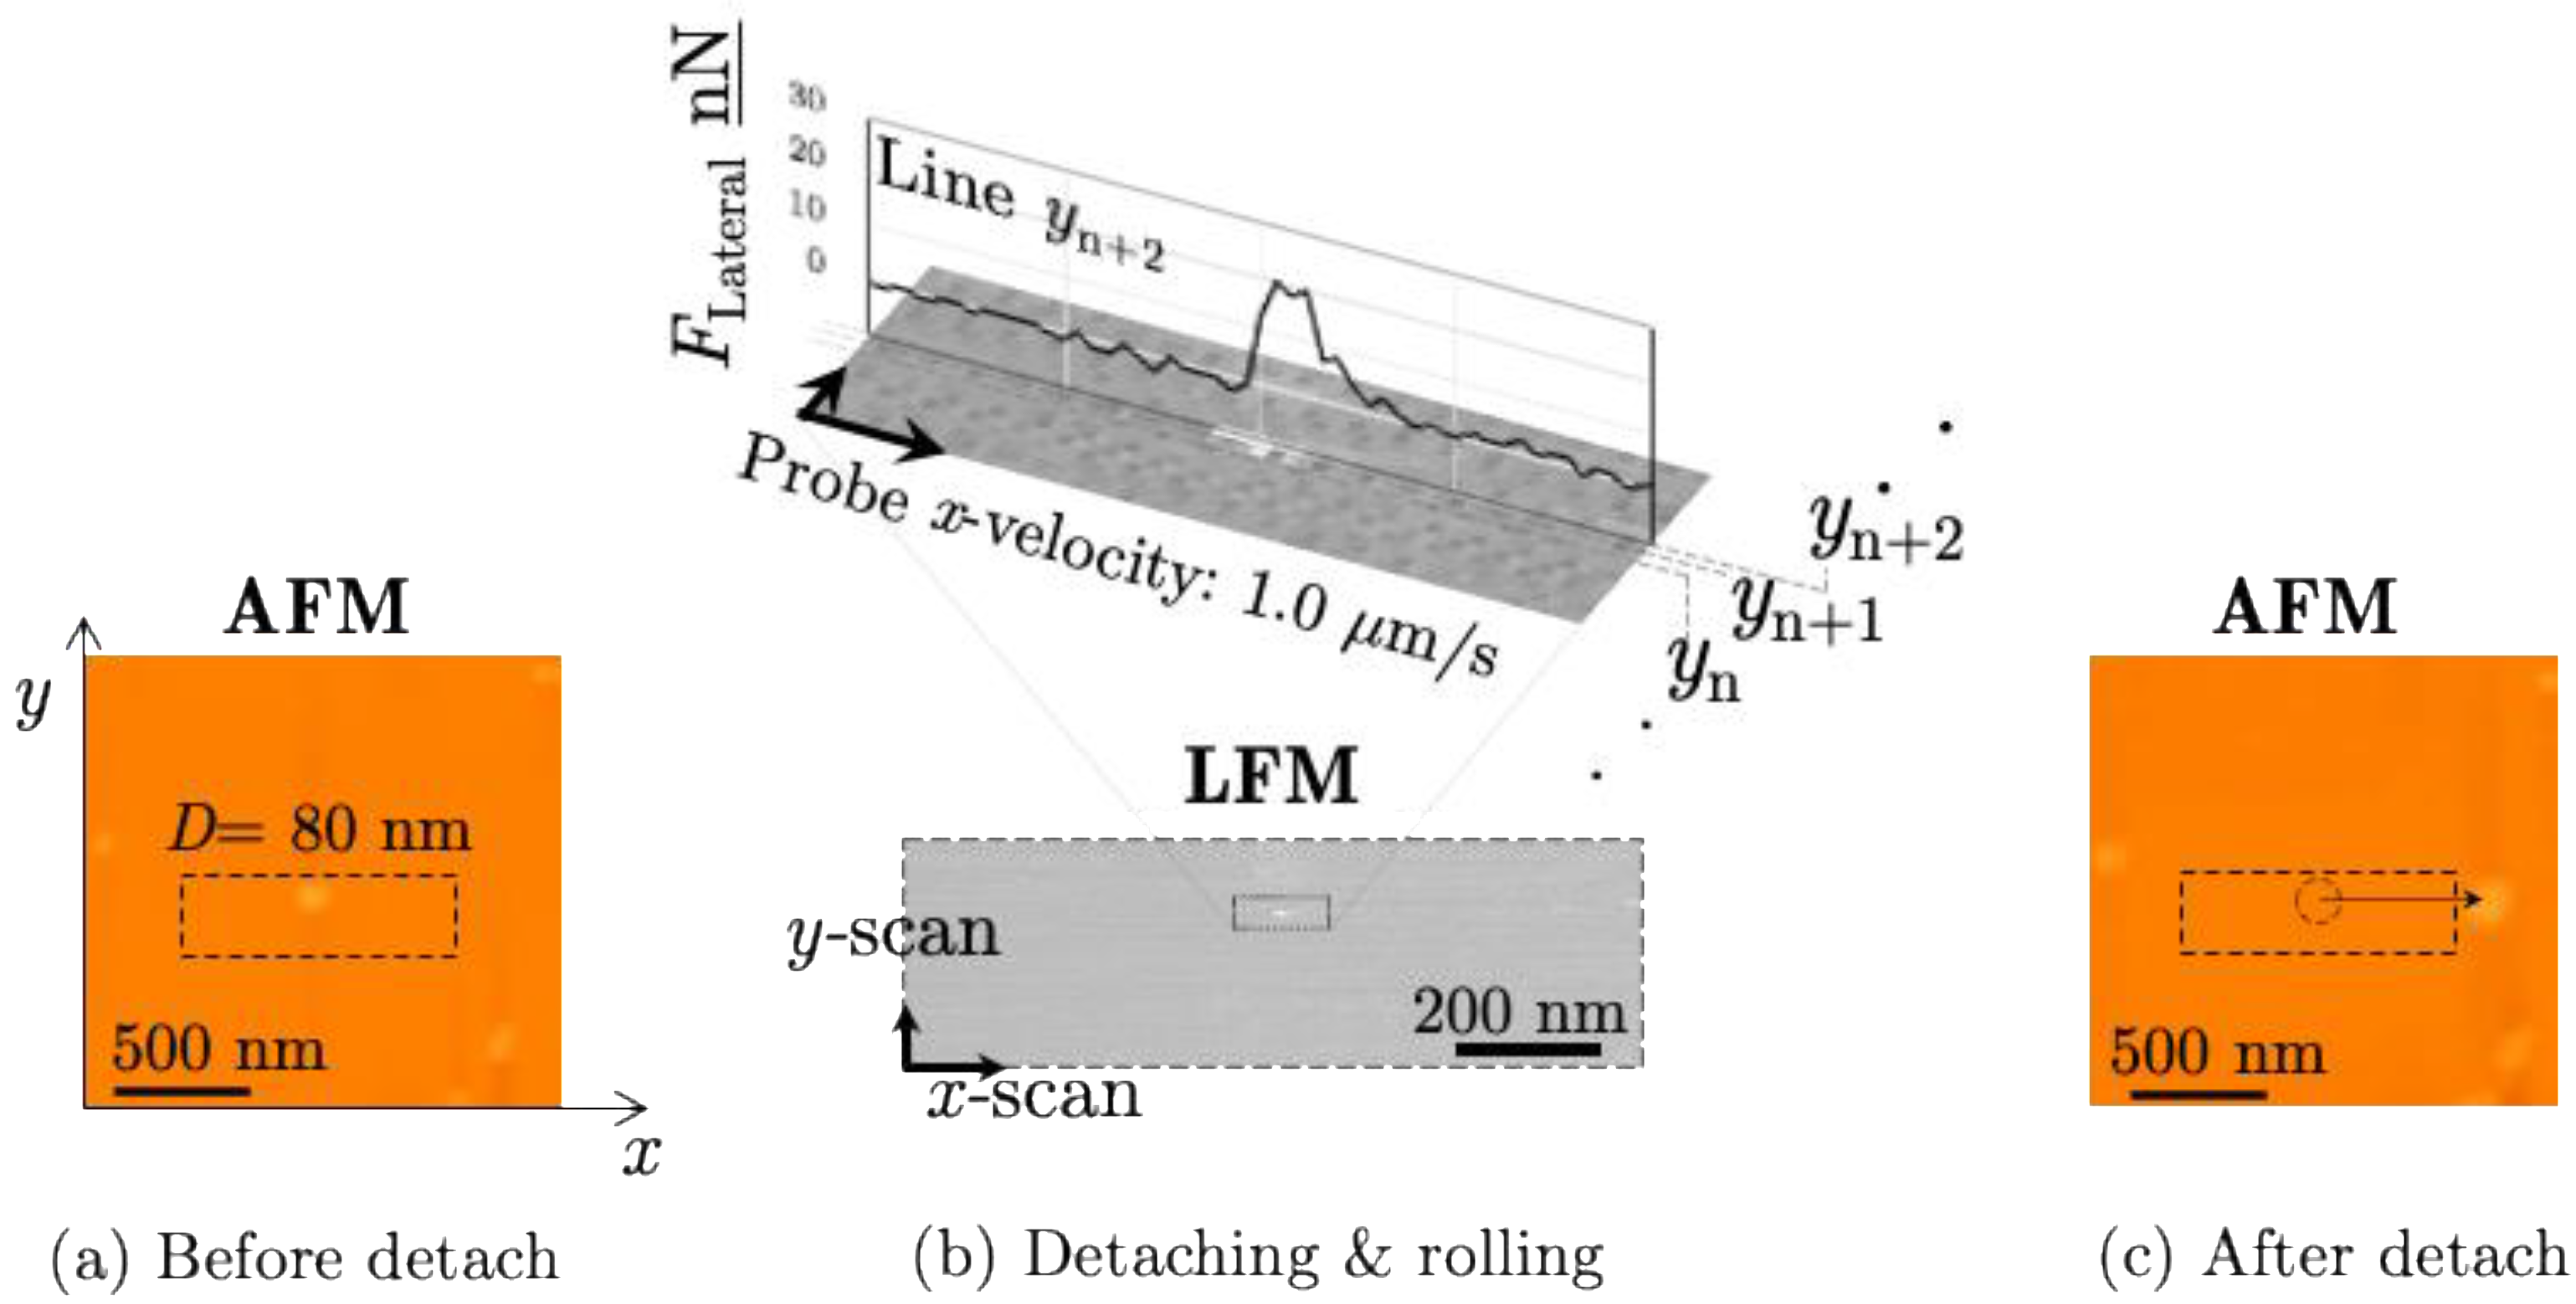
3.1. Measurand of the Force Required to Detach
3.2. Measurements of the Detachment Energy
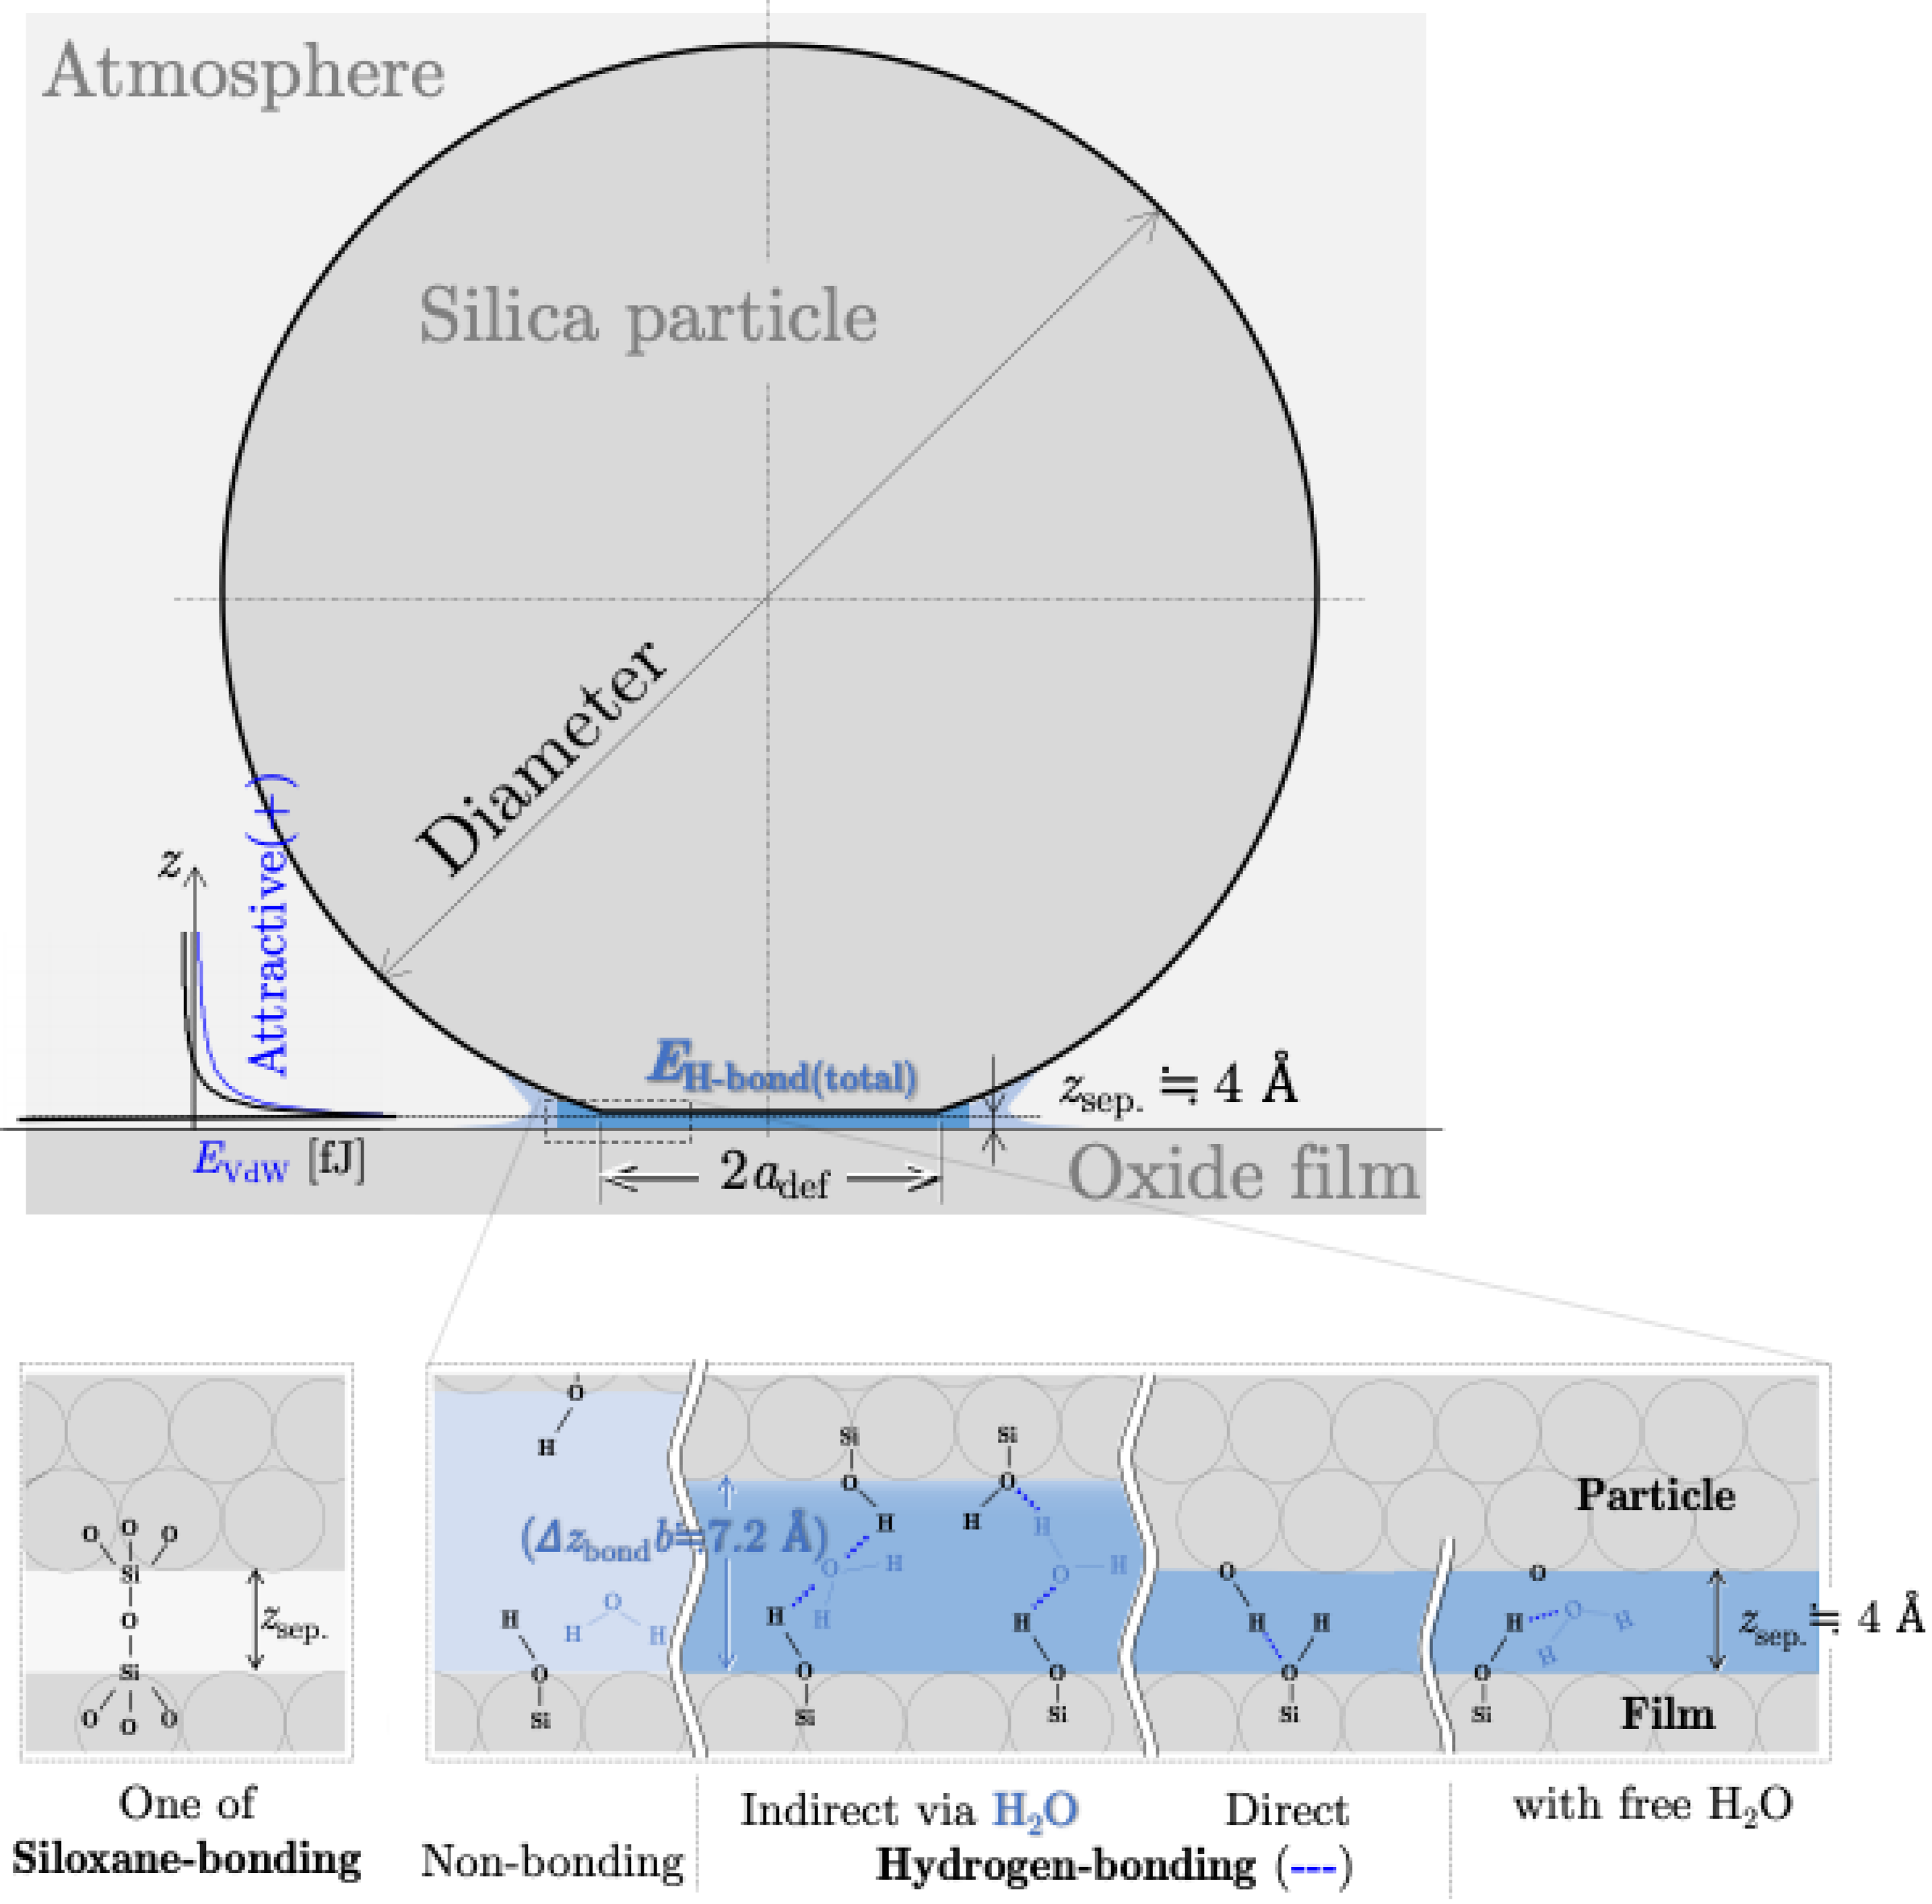
4. Theoretical Calculation of Interaction Energy
4.1. Potential Energy of Siloxane Bonds
4.2. Potential Energy of Hydrogen Bonds
4.3. Potential Energy of van der Waals Interaction
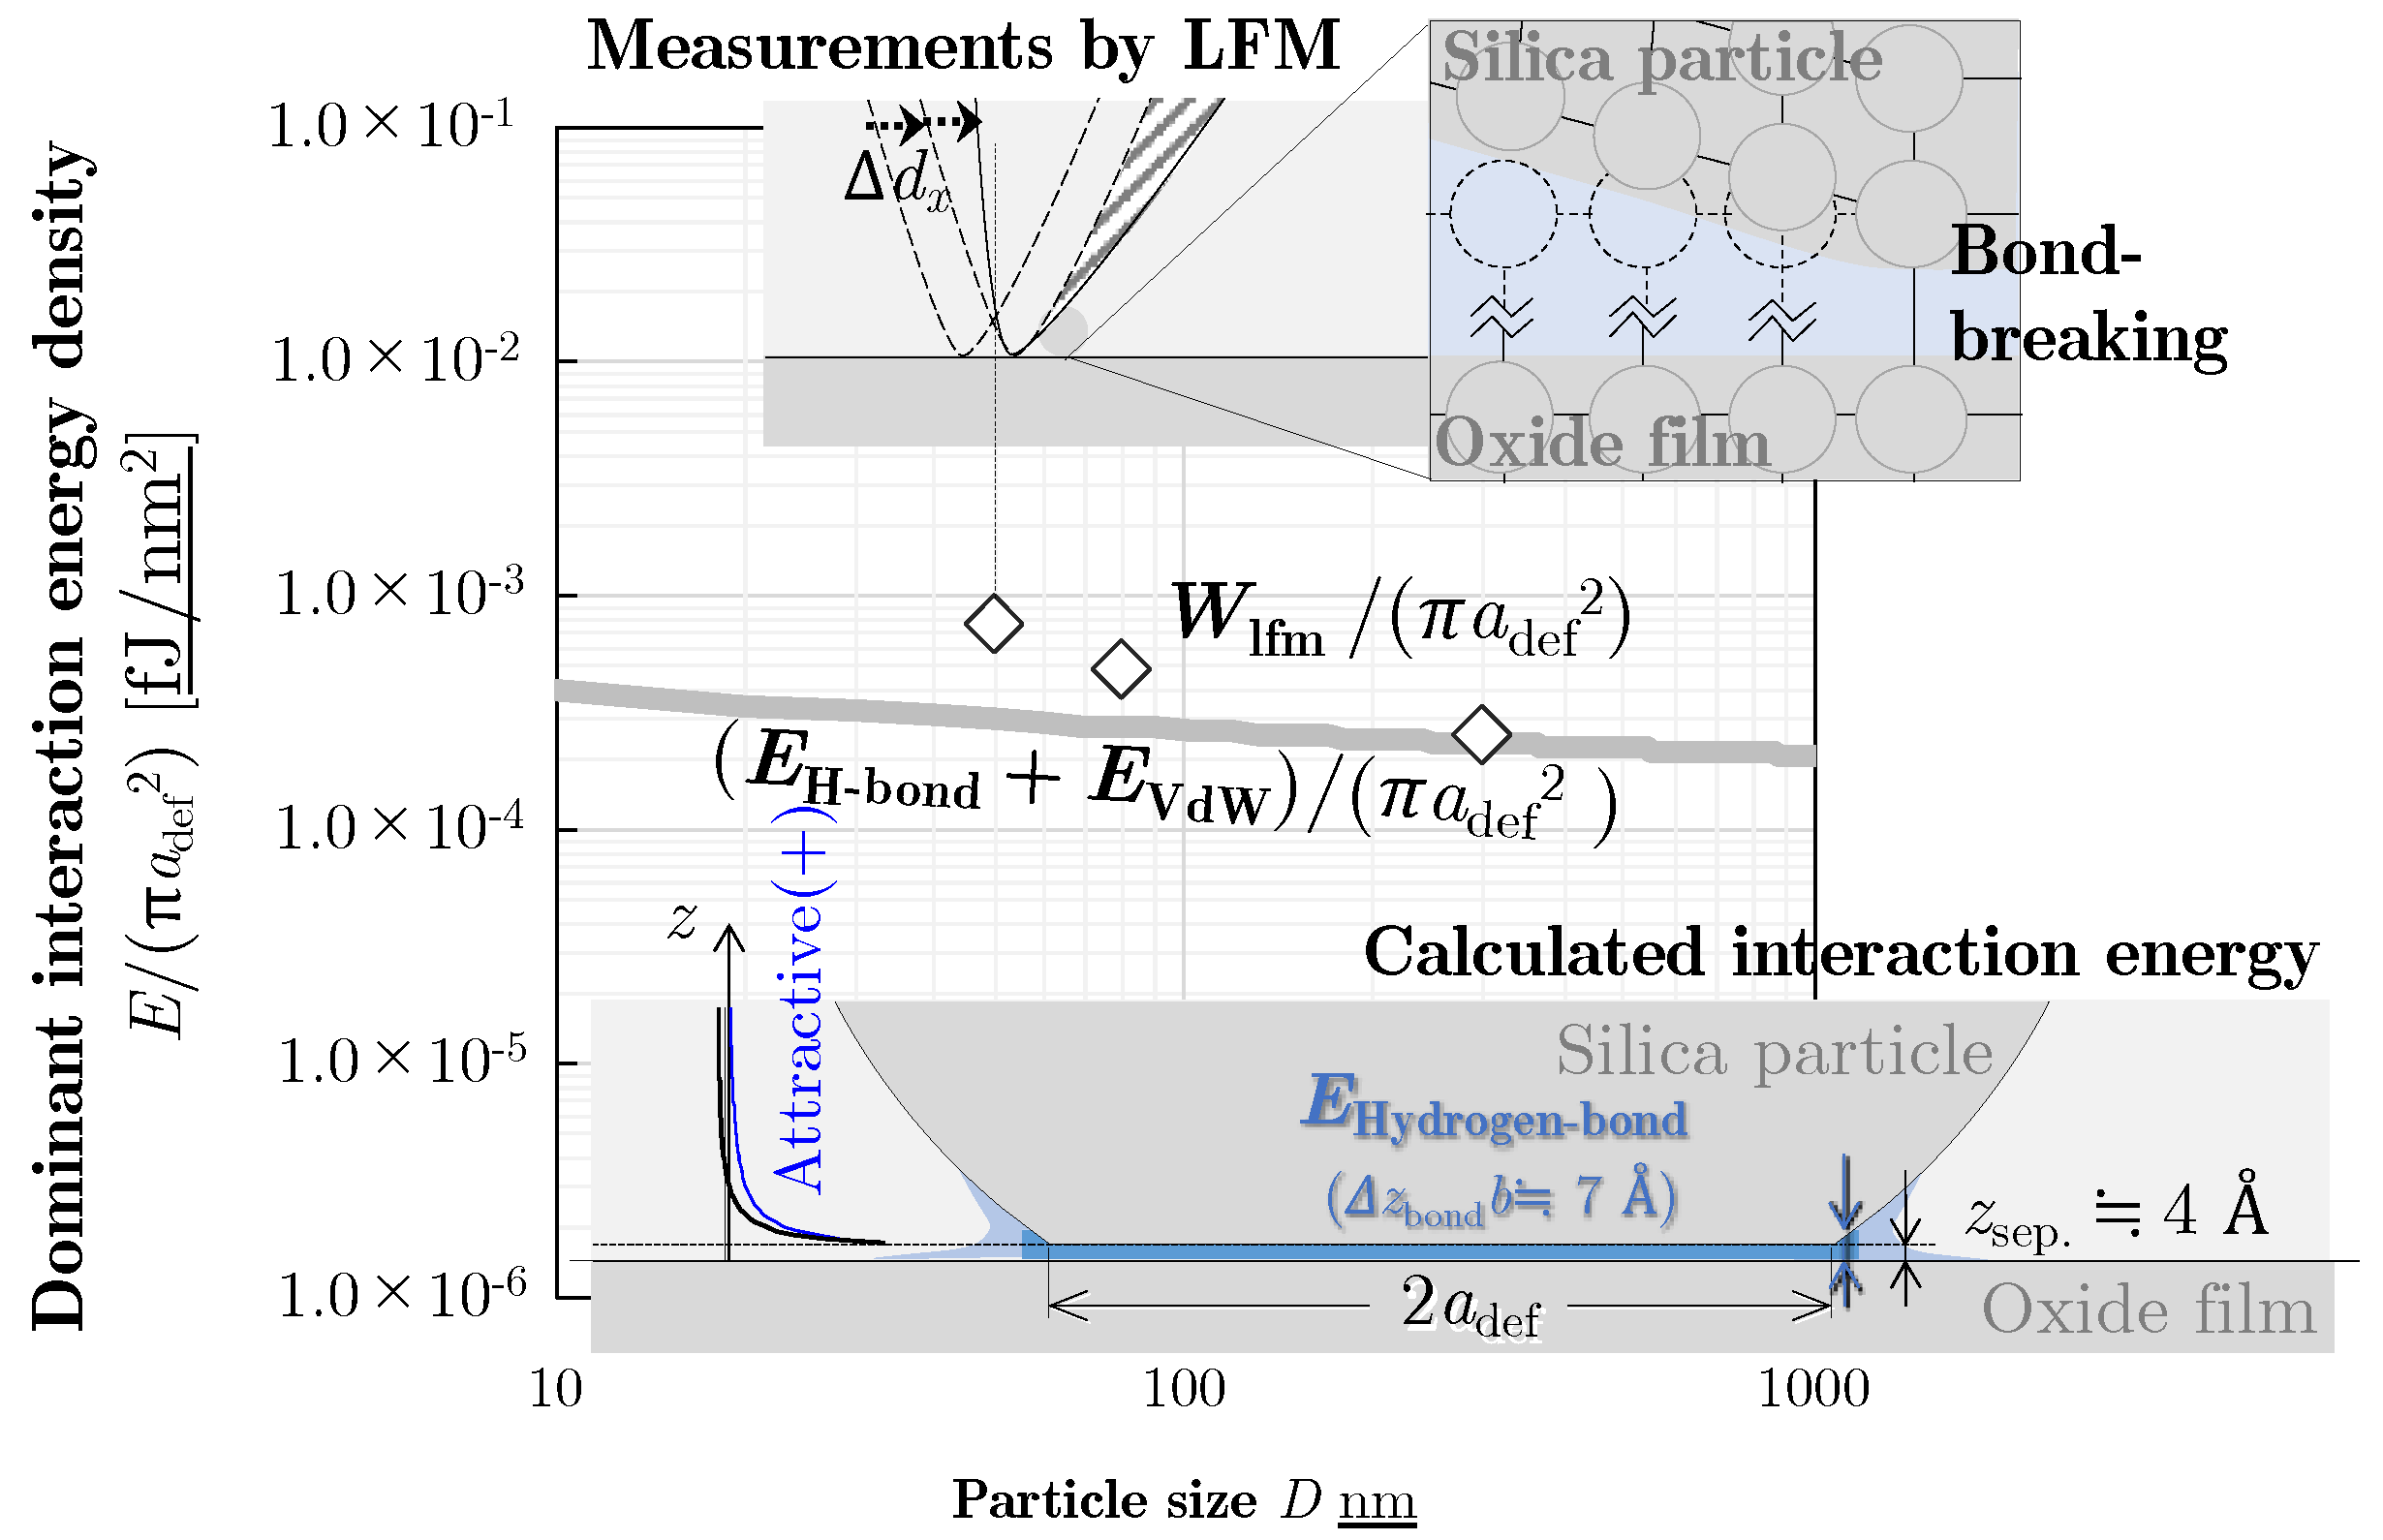
4.4. Dominant Interaction Energy for Detachment
5. Discussion
6. Conclusions
Supplementary Materials
Author Contributions
Funding
Institutional Review Board Statement
Informed Consent Statement
Data Availability Statement
Acknowledgments
Conflicts of Interest
References
- Yield Enhancement. International Roadmap for Device and Systemstm 2021 Update; IEEE: New York, NY, USA, 2021; pp. 3–4, 14. [Google Scholar]
- Reinhardt, K.A.; Kern, W. Handbook of Silicon Wafer Cleaning Technology, 3rd ed.; Elsevier: Amsterdam, The Netherlands; William Andrew: Norwich, NY, USA, 2018; pp. 254–260, 662–663. [Google Scholar]
- Seo, J. Challenges and solutions for post-CMP cleaning at device and interconnect levels. In Advances in Chemical Mechanical Planarization (CMP); Elsevier: Amsterdam, The Netherlands, 2022; pp. 503–532. [Google Scholar]
- Sanders, D.P. Advances in Patterning Materials for 193 nm Immersion Lithography. Chem. Rev. 2007, 110, 321–360. [Google Scholar] [CrossRef] [PubMed]
- Chen, Y.; Tang, J.; Mikhaylichenko, E.; Brown, B.; Redeker, F. Chemical mechanical cleaning for CMP defect reduction, Applied Materials. In Proceedings of the 2016 China Semiconductor Technology International Conference (CSTIC), Shanghai, China, 13–14 March 2016; IEEE: Piscataway, NJ, USA, 2016. [Google Scholar]
- Manzonie, A.; Buley, T.; Chu, J.-n.; Kulus, M. CMP slurry optimization for advanced nodes. Solid State Technol. 2016, 59, 20–23. [Google Scholar]
- Temple, P.A. Total internal reflection microscopy. a surface inspection technique. Appl. Opt. 1981, 20, 2656–2664. [Google Scholar] [CrossRef] [PubMed]
- Ambrose, E.J. A surface Constant Microscope for the study of Cell Movements. Nature 1956, 178, 1194. [Google Scholar] [CrossRef] [PubMed]
- Takahashi, S.; Nakajima, R.; Miyoshi, T.; Takaya, Y.; Takamasu, K. Development of an evanescent light measurement system for Si wafer microdefect detection. Key Eng. Mater. 2005, 295, 15–21. [Google Scholar] [CrossRef]
- Kimura, K.; Suzuki, K.; Khajornrungruang, P. Study on fine particle behavior in slurry flow between wafer and polishing pad as a material removal process in CMP. In Proceedings of the ICPT 2012—International Conference on Planarization/CMP Technology, Grenoble, France, 15–17 October 2012; pp. 345–350. [Google Scholar]
- Idei, Y.; Khajornrungruang, P.; Kimura, K. Observation of Slurry Fine Particle Motion in CMP process. In Proceedings of the JSPE Kyushu Branch, Tokyo, Japan, 22–23 November 2009; p. 11. (In Japanese). [Google Scholar]
- Khajornrungruang, P.; Dean, P.J.; Babu, S.V. Study on dynamic observation of sub-50 nm sized particles in water using evanescent field with a compact and mobile apparatus. In Proceedings of the ASPE2014 Annual Meeting, Boston, MA, USA, 11 September 2014; pp. 73–77. [Google Scholar]
- Khajornrungruang, P.; Korkmaz, S.; Angshuman, P.; Suzuki, K.; Kimura, K.; Babu, S.V. Light scattering model for individual sub-100-nm particle size determination in an evanescent field. Jpn. J. Appl. Phys. 2016, 55, 06JG02. [Google Scholar] [CrossRef]
- Terayama, Y.; Khajornrungruang, P.; Suzuki, K.; Kusatsu, K.; Hamada, S.; Wada, Y.; Hiyama, H. Real Time Nanoscale Cleaning Phenomenon Observation during PVA brush Scrubbing By Evanescent Field. ECS Trans. 2019, 92, 191–197. [Google Scholar] [CrossRef]
- Terayama, Y.; Khajornrungruang, P.; Suzuki, K.; Kusatsu, K.; Hamada, S.; Wada, Y.; Hiyama, H. Observation of Approach-to-surface of PVA brush in Cleaning by Evanescent Field. In Proceedings of the ICPT2019—International Conference on Planarization/CMP Technology, Hsinchu, Taiwan, 15–18 September 2019; pp. 60–61. [Google Scholar]
- Terayama, Y.; Khajornrungruang, P.; Suzuki, K.; Mori, R.; Hamada, S.; Wada, Y.; Hiyama, H. Real Time Nanoscale Cleaning Phenomenon Observation During Enforcing MHz Wave By Evanescent Field. ECS Trans. 2022, 108, 17–23. [Google Scholar] [CrossRef]
- Khajornrungruang, P.; Terayama, Y.; Hamada, S.; Wada, Y.; Hiyama, H. Phenomenon Observation on Activated Fluid Flow for Cleaning Sub-100 nm particles on a Silica Glass Substrate Surface by Evanescent Microscopy. In Proceedings of the ICPE—International Conference on Precision Engineering, Nara, Japan, 28 November–2 December 2022. C292. [Google Scholar]
- Terayama, Y.; Khajornrungruang, P.; Suzuki, K.; Fujishima, H.; Hamada, S.; Wada, Y.; Hiyama, H. Direct observation of removal of SiO2 nano-particles from silica surfaces: An evanescent field microscopy study and shear flow acting moment. Jpn. J. Appl. Phys. 2023, 62, SH8004. [Google Scholar] [CrossRef]
- Xu, K.; Vos, R.; Vereecke, G.; Doumen, G.; Fyen, W.; Mertens, P.W.; Heyns, M.M.; Vinckier, C.; Fransaer, J.; Kovacs, F. Fundamental study of the removal mechanisms of nano-sized particles using brush scrubber cleaning. J. Vac. Sci. Technol. B Microelectron. Nanometer Struct. 2005, 23, 2160–2175. [Google Scholar] [CrossRef]
- Xu, Q.; Li, M.; Zhang, L.; Niu, J.; Xia, Z. Dynamic Adhesion Forces between Microparticles and Substrates in Water. Langmuir 2014, 30, 11103–11109. [Google Scholar] [CrossRef] [PubMed]
- Shima, S.; Satomi, S.; Takatoh, C.; Wada, Y.; Fukunaga, A.; Sobukawa, H. Measurement of Removal Force in DI-Water for Fine Particles with Sub-nanoNewton Resolution. In Proceedings of the ICPT2017, Leuven, Belgium, 11–13 October 2017. [Google Scholar]
- Ranaweera, C.K.; Babu, S.V.; Hamada, S.; Seo, J. Measurement of the force required to move ceria particles from SiO2 surface using lateral force microscopy. Mater. Res. 2022, 37, 1789–1797. [Google Scholar] [CrossRef]
- Asay, D.B.; Kim, S.H. Direct force balance method for atomic microscopy lateral force calibration. Rev. Sci. Instrum. 2006, 77, 043903. [Google Scholar] [CrossRef]
- Schwaderer, P.; Funk, E.; Achenbach, F.; Weis, J.; Bräuchle, C.; Michaelis, J. Single-Molecule Measurement of the Strength of a Siloxane Bond. Langmuir 2008, 24, 1343. [Google Scholar] [CrossRef]
- Bowen, J.; Rossetto, H.L.; Kendall, K. Adhesion between silica surfaces due to hydrogen bonding. Surf. Topogr. Metrol. Prop. 2016, 4, 034001. [Google Scholar] [CrossRef]
- Wu, X.; Sacher, E.; Sacher, E. The effects of hydrogen bonds on the adhesion of inorganic oxide particles on hydrophilic silicon surfaces. J. Appl. Phys. 1999, 86, 1744–1748. [Google Scholar] [CrossRef]
- Bergna, H.E.; Wilmington, D. The Colloid Chemistry of Silica—Chapter 1: An overview. Adv. Chem. Am. Chem. Soc. 1994, 1–47. [Google Scholar] [CrossRef]
- Zhuravlev, L.T. Concentration of Hydroxyl Groups on the Surface of Amorphous Silicas. Langmuir 1987, 3, 316–318. [Google Scholar] [CrossRef]
- Visser, J. On Hamaker constants: A comparison between Hamaker constants and Lifshitz van der Waals constants. Adv. Colloid Interface Sci. 1972, 3, 331–363. [Google Scholar] [CrossRef]
- Dahneke, B. The influence of flattening on the adhesion of particles. J. Colloid Interface Sci. 1972, 40, 1–13. [Google Scholar] [CrossRef]
- Mittal, K.L.; Bowling, R.A. A Theoretical Review of Particle Adhesion. Part. Surf. 1988, 1, 129–142. [Google Scholar]
- Johnson, K.L.; Kendall, K.; Roberts, A.D. Surface energy and the contact of elastic solids. Proc. R. Soc. Lond. Ser. A 1971, 324, 301. [Google Scholar]
- Vo, T.; Reeder, B.; Damone, A.; Newell, P. Effect of Domain Size, Boundary, and Loading Conditions on Mechanical Properties of Amorphous Silica: A Reactive Molecular Dynamics Study. Nanomaterials 2019, 10, 54. [Google Scholar] [CrossRef] [PubMed]
- Sharpe, W.N.; Pulskamp, J.; Gianola, D.S.; Eberl, C.; Polcawich, R.G.; Thompson, R.J. Strain Measurements of Silicon Dioxide Microspecimens by Digital Imaging Processing. Exp. Mech. 2007, 47, 649–658. [Google Scholar] [CrossRef]
- Liu, G.; Zhang, C.; Zhao, M.; Guo, W.; Luo, Q. Comparison of Nanomaterials with Other Unconventional Materials Used as Additives for Soil Improvement in the Context of Sustainable Development: A Review. Nanomaterials 2021, 11, 15. [Google Scholar] [CrossRef]
- Tabor, D. Surface Forces and Surface Interactions. J. Colloid Interface Sci. 1977, 58, 2. [Google Scholar]


| Potential Energy of Bonding Interaction | |||
| Siloxane bond energy [24] | ES-bond@ ≥ 200 [°C] | kJ/mol | 444 |
| Hydrogen bond energy [25] | EH-bond@ ≤ 200 [°C] | kJ/mol | 20.9 |
| OH group concentration [26,27,28] | ρOH@ ≤ 200 [°C] | OH/nm2 | 4.6 ± 0.6 |
| (μmol/m2) | (7.64 ± 1.0) | ||
| Total length of bond chain with forming probability b [26] | |||
| SiO2/SiO2 interaction | Δzbondb | Å | ≒7.2 |
| Potential energy of van der Waals interaction | |||
| Hamaker constant [29] | |||
| SiO2–atmosphere–SiO2 | A@atmosphere | ×10−20 J | 6.00 |
| SiO2 @atmosphere | ASiO2@atmosphere | ×10−20 J | 6.00 |
| Separated distance between the particle and the film [30,31] | |||
| zsep | Å | 4 | |
| Contact radius calculation by JKR theory | |||
| Elastic modulus (SiO2/SiO2) [32] | K | N/m2 | 4.9 × 10¹⁰ |
| Poisson’s ratio [33] | νSiO2 | − | 0.2 |
| Young’s modulus [33,34] | ESiO2 | GPa | 70 |
| Diameter [nm] | ES-bond(total) [fJ] | EH-bond(total) [fJ] | Sarea [nm2] | adef [nm] |
|---|---|---|---|---|
| 10 | 0.13 | 0.01 | 38 | 2.2 |
| 100 | 1.92 | 0.09 | 567 | 10.4 |
| 1000 | 32.5 | 1.53 | 9595 | 48.3 |
| Diameter [nm] | EVdW [fJ] | adef [nm] |
|---|---|---|
| 10 | 1.32 × 10⁻⁴ | 0.5 |
| 100 | 1.39 × 10⁻³ | 2.1 |
| 1000 | 1.56 × 10⁻² | 9.9 |
| Diameter [nm] | Wlfm [fJ] | Es-bond(total) [fJ] | EH-bond(total) [fJ] | EVdW [fJ] |
|---|---|---|---|---|
| 50 | 0.10 | 0.84 | 0.04 | 6.81 × 10⁻⁴ |
| 80 | 0.13 | 1.47 | 0.07 | 1.11 × 10⁻³ |
| 300 | 0.37 | 7.30 | 0.34 | 4.36 × 10⁻³ |
Disclaimer/Publisher’s Note: The statements, opinions and data contained in all publications are solely those of the individual author(s) and contributor(s) and not of MDPI and/or the editor(s). MDPI and/or the editor(s) disclaim responsibility for any injury to people or property resulting from any ideas, methods, instructions or products referred to in the content. |
© 2024 by the authors. Licensee MDPI, Basel, Switzerland. This article is an open access article distributed under the terms and conditions of the Creative Commons Attribution (CC BY) license (https://creativecommons.org/licenses/by/4.0/).
Share and Cite
Terayama, Y.; Khajornrungruang, P.; Seo, J.; Hamada, S.; Wada, Y.; Hiyama, H. Detachment Energy Evaluation in Nano-Particle Cleaning Using Lateral Force Microscopy. Appl. Sci. 2024, 14, 8145. https://doi.org/10.3390/app14188145
Terayama Y, Khajornrungruang P, Seo J, Hamada S, Wada Y, Hiyama H. Detachment Energy Evaluation in Nano-Particle Cleaning Using Lateral Force Microscopy. Applied Sciences. 2024; 14(18):8145. https://doi.org/10.3390/app14188145
Chicago/Turabian StyleTerayama, Yutaka, Panart Khajornrungruang, Jihoon Seo, Satomi Hamada, Yutaka Wada, and Hirokuni Hiyama. 2024. "Detachment Energy Evaluation in Nano-Particle Cleaning Using Lateral Force Microscopy" Applied Sciences 14, no. 18: 8145. https://doi.org/10.3390/app14188145