Article

Effects of Water-Reducing Agents on the Mechanical Properties of Foamed Phosphogypsum

1
School of Materials Science and Engineering, Tianjin Chengjian University, Tianjin 300384, China
2
China Building Materials Academy Co., Ltd., Beijing 100024, China
*
Author to whom correspondence should be addressed.
Appl. Sci. 2024, 14(18), 8147; https://doi.org/10.3390/app14188147
Submission received: 2 August 2024 / Revised: 3 September 2024 / Accepted: 6 September 2024 / Published: 11 September 2024
(This article belongs to the Special Issue Resource Utilization of Solid Waste and Circular Economy)

Abstract

:
In the present experiment, two types of water-reducing agents, naphthalene (FDN) and polycarboxylic acid (PCE), were selected, and their effects on the mechanical properties of foamed phosphogypsum were evaluated. It was shown that when the water-reducing agent contents were increased, the strength of the foamed phosphogypsum first increased and then gradually decreased, and that the dry density of the foamed phosphogypsum first decreased and then gradually increased. The FDN samples had better mechanical properties and a lower dry density than the PCE samples. The effect of the water-reducing agent dose on the apparent viscosity and shear stress of the phosphogypsum slurries was in the order of 0% > 0.4% > 0.3% > 0.5% > 0.2% > 0.1%. The apparent viscosity and shear stress of the gypsum slurry mixed with 0.4% FDN or PCE were the highest. FDN and PCE both enlarged the pore size distribution range, increased the size and proportion of large pores, and decreased the total pore content of foamed phosphogypsum; however, the effect of PCE was more significant. The foamed phosphogypsum slurry mixed with 0.4% FDN had the highest total pore content. Among the samples, the total pore content of foamed phosphogypsum A was able to reach 91% and the total pore content of foamed phosphogypsum B reached 77%; the lowest proportion of large pores for foamed phosphogypsum A and B separately reached 17% and 7%, respectively. The water-reducing agents mainly reduced the water consumption of the phosphogypsum slurries; improved the viscosity and shear stress of the slurries; affected the stability of the foam in the gypsum slurries; influenced the pore size and distribution in the foamed phosphogypsum samples; and caused a difference in the strength and dry density of the foamed phosphogypsum samples. The viscosity of the gypsum slurry doped with 0.4% FDN better matched that of the foam; therefore, it had the highest macro-strength and the lowest dry density.

1. Introduction

Phosphogypsum is a by-product of phosphate fertilization. According to statistics, approximately 4–6 tons of phosphogypsum are produced from 1 ton of phosphoric acid. This large amount of phosphogypsum occupies land resources and causes pollution to the surrounding environment, seriously restricting the green development of the phosphate industry. Therefore, the resource utilization of phosphogypsum has become the focus of the Government and the phosphate industry [1,2,3,4,5,6,7,8].
Paper gypsum boards are one of the main absorption media of phosphogypsum. When phosphogypsum is used as the gypsum base raw material in paper gypsum boards, it can alleviate the pressure of efficient resource utilization for phosphogypsum and solve the shortage problem of gypsum resources. Therefore, under current green, low-carbon, and other strict environmental requirements, it is of great significance to carry out the research and production of phosphogypsum paper boards [9,10,11].
Phosphogypsum paper boards are mainly composed of a phosphogypsum board core and a protective paper [12,13,14]. During the preparation of gypsum board cores, to save production energy consumption and reduce cost, water-reducing agents are often added to ensure that gypsum slurries keep a certain fluidity with reduced water consumption [15,16,17,18,19,20]. Moreover, the decrease in the water consumption of gypsum slurries increases their surface density; thus, foaming agents are used to reduce the surface density of gypsum boards [21,22,23,24,25,26,27]. Water-reducing agents and foaming agents are indispensable raw materials in the production of paper gypsum boards. Superplasticizers and foam are highly active organic materials. When they work together in gypsum slurries, strong chemical interactions occur between them. If the degree of interactions between them is small, they manifest little influence on the macro-performance of the gypsum board core. On the contrary, if the interaction degree is strong, they yield an adverse effect on the macro-performance of the gypsum board core. Feng, Julian et al. [28] analyzed the interaction between the foaming agent and the water-reducing agent for desulfurized gypsum and found that the effect of the foaming agent on 0.3% of FDN was less than that on 0.1% of PCE. Although the effects of foaming agents on water-reducing agents are considered during the preparation of gypsum slurries, the influences of water-reducing agents on the formation and distribution of foam are generally neglected, causing the poor stability of paper gypsum boards [29,30]. Zeng, Z. et al. [31] studied the compatibility between different water-reducing agents and phosphogypsum-based cementitious materials, including the dependence of mechanical properties and rheological properties. The test results showed that the FDN has strong compatibility with the gypsum-based cementitious materials of phosphorus buildings. Gao, F. et al. [32] studied the effects of polycarboxylic acid and sulfonated melamine superplasticizer on the fluidity, setting time, and dry compression strength of phosphogypsum; the results showed that the 0.48% dosage of polycarboxylic acid was more suitable for phosphogypsum. However, in these studies, foamed phosphogypsum was not considered. Zhang, Y. et al. [33] studied the effects of hydroxypropyl methyl cellulose ether (HPMC) on the rheological properties, pore structure and mechanical properties of EPS–phosphorus gypsum composite paste. The results showed that, with the increase in HPMC content, the yield stress and plastic viscosity of paste increase gradually and that the pore structure and mechanical properties of gypsum paste are improved. The optimum HPMC content for EPS–phosphorus gypsum composite slurry is 0. 20%. Wang, J. [34] focused on the preparation of foamed phosphogypsum and the effect of silicone on the properties of foamed phosphogypsum. However, the effects of water-reducing agents on the mechanical properties of foamed phosphogypsum were not considered. Hence, to improve the stability of phosphogypsum paper boards, two types of water-reducing agents, naphthalene and polycarboxylic acid, were selected in the present work to study their effects on the mechanical properties of foamed phosphogypsum. The effects of the water-reducing agents on foamed phosphogypsum were discussed based on the correlation between the bubble size distribution in the foam and the slurry viscosity. This research aims to provide theoretical and technical support for the development of light phosphogypsum paper boards and lay a theoretical foundation for the efficient resource utilization of phosphogypsum.

2. Experimental Section

2.1. Materials

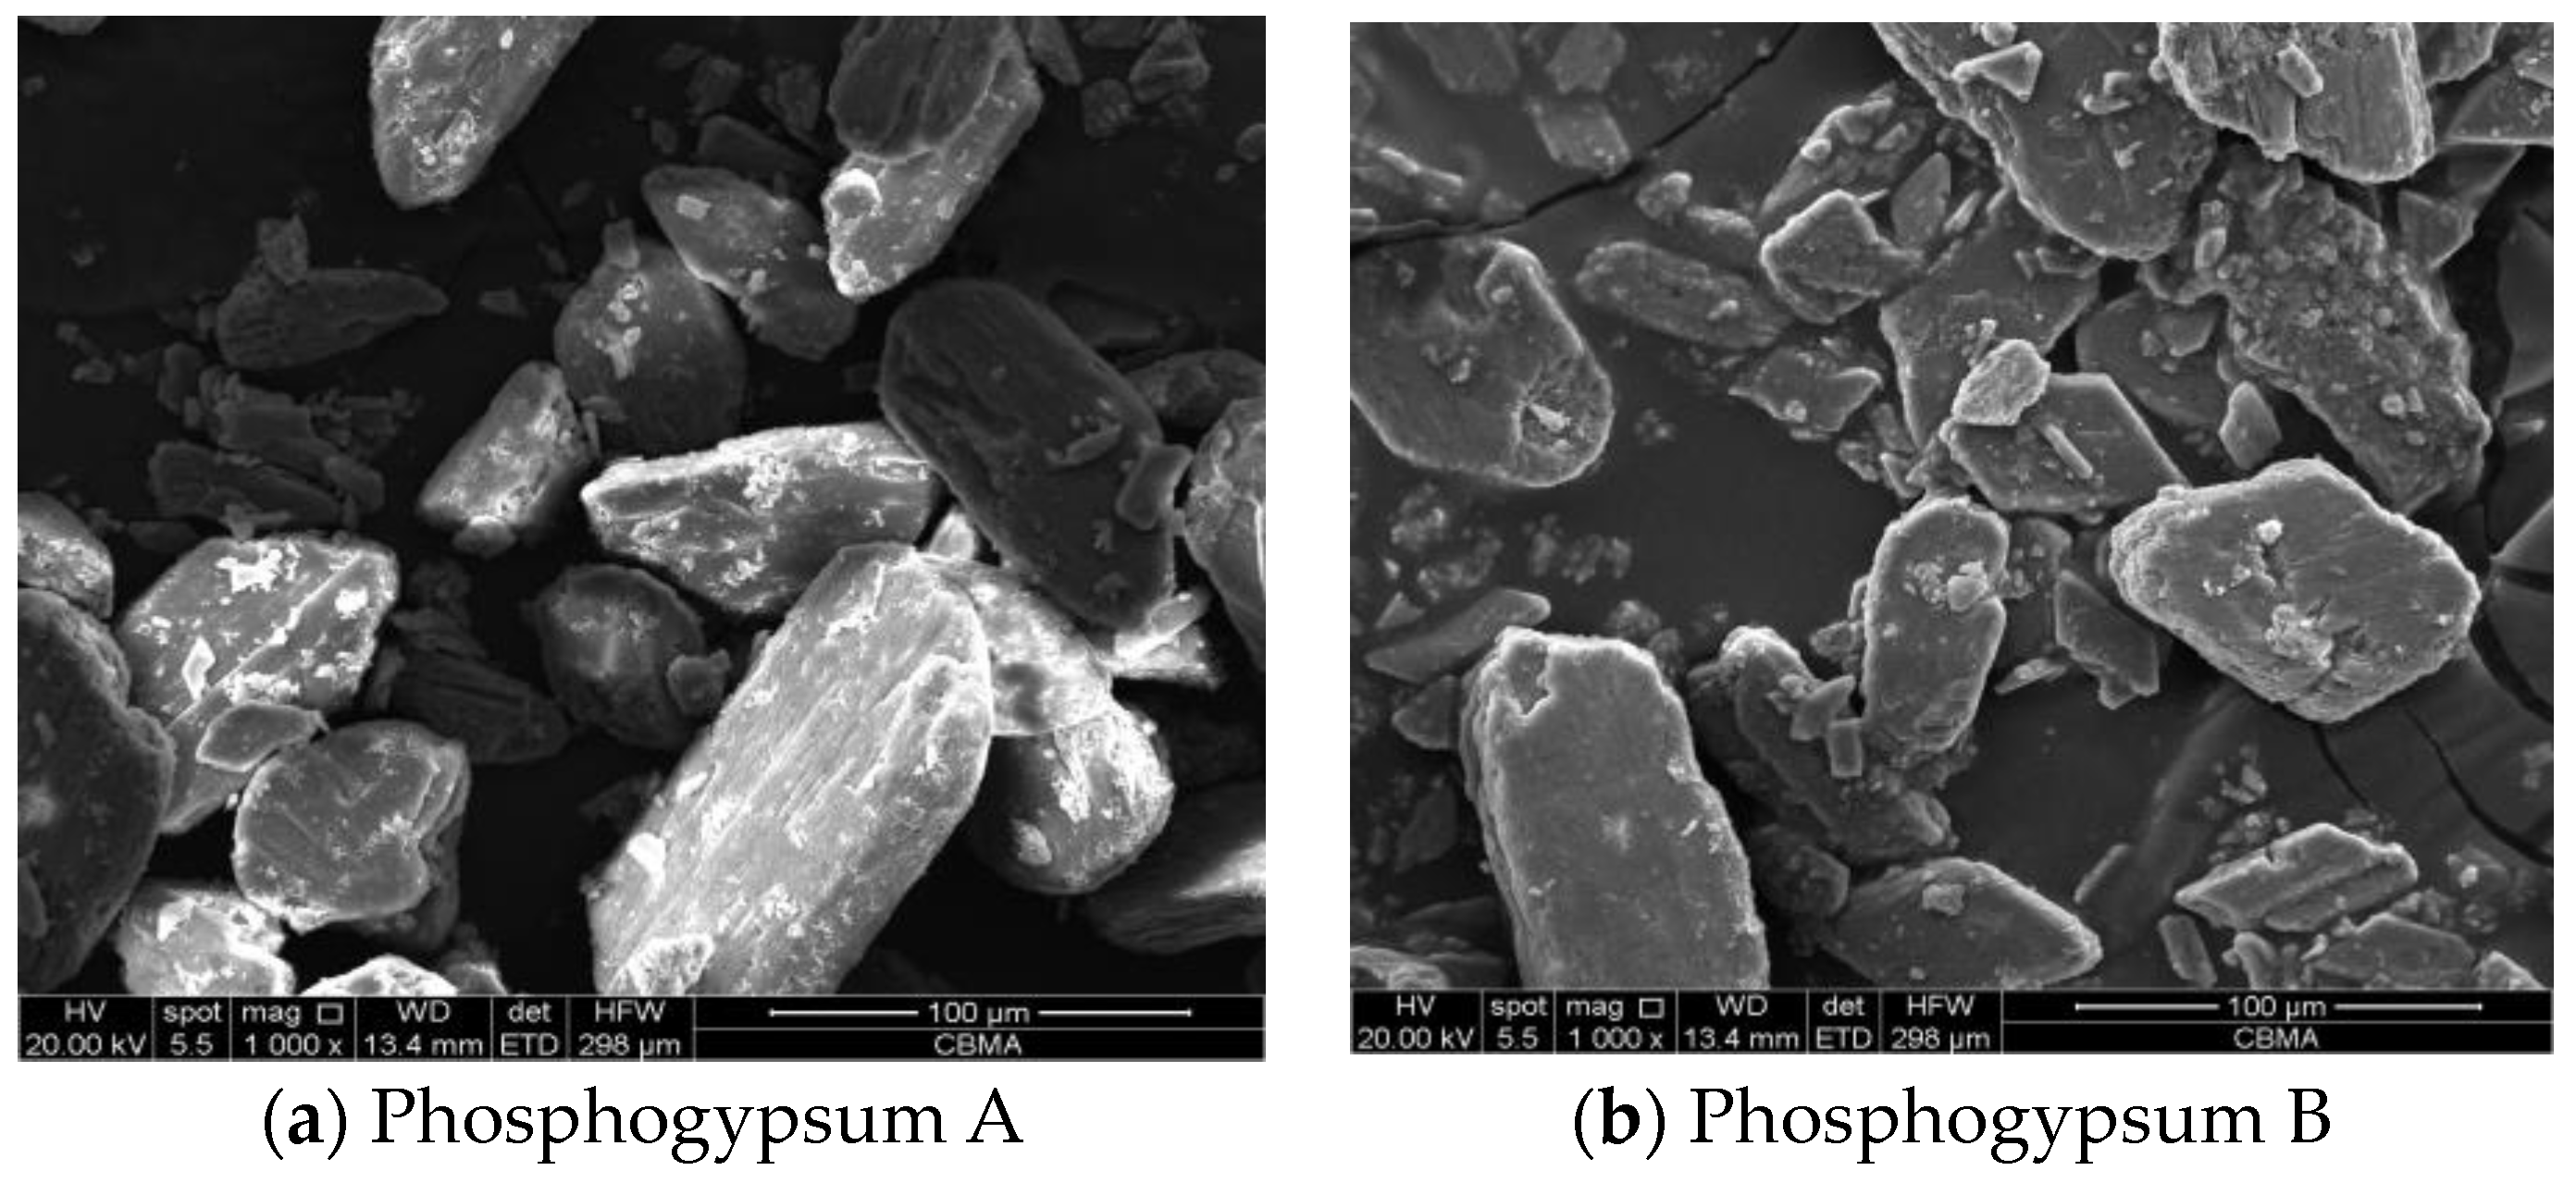
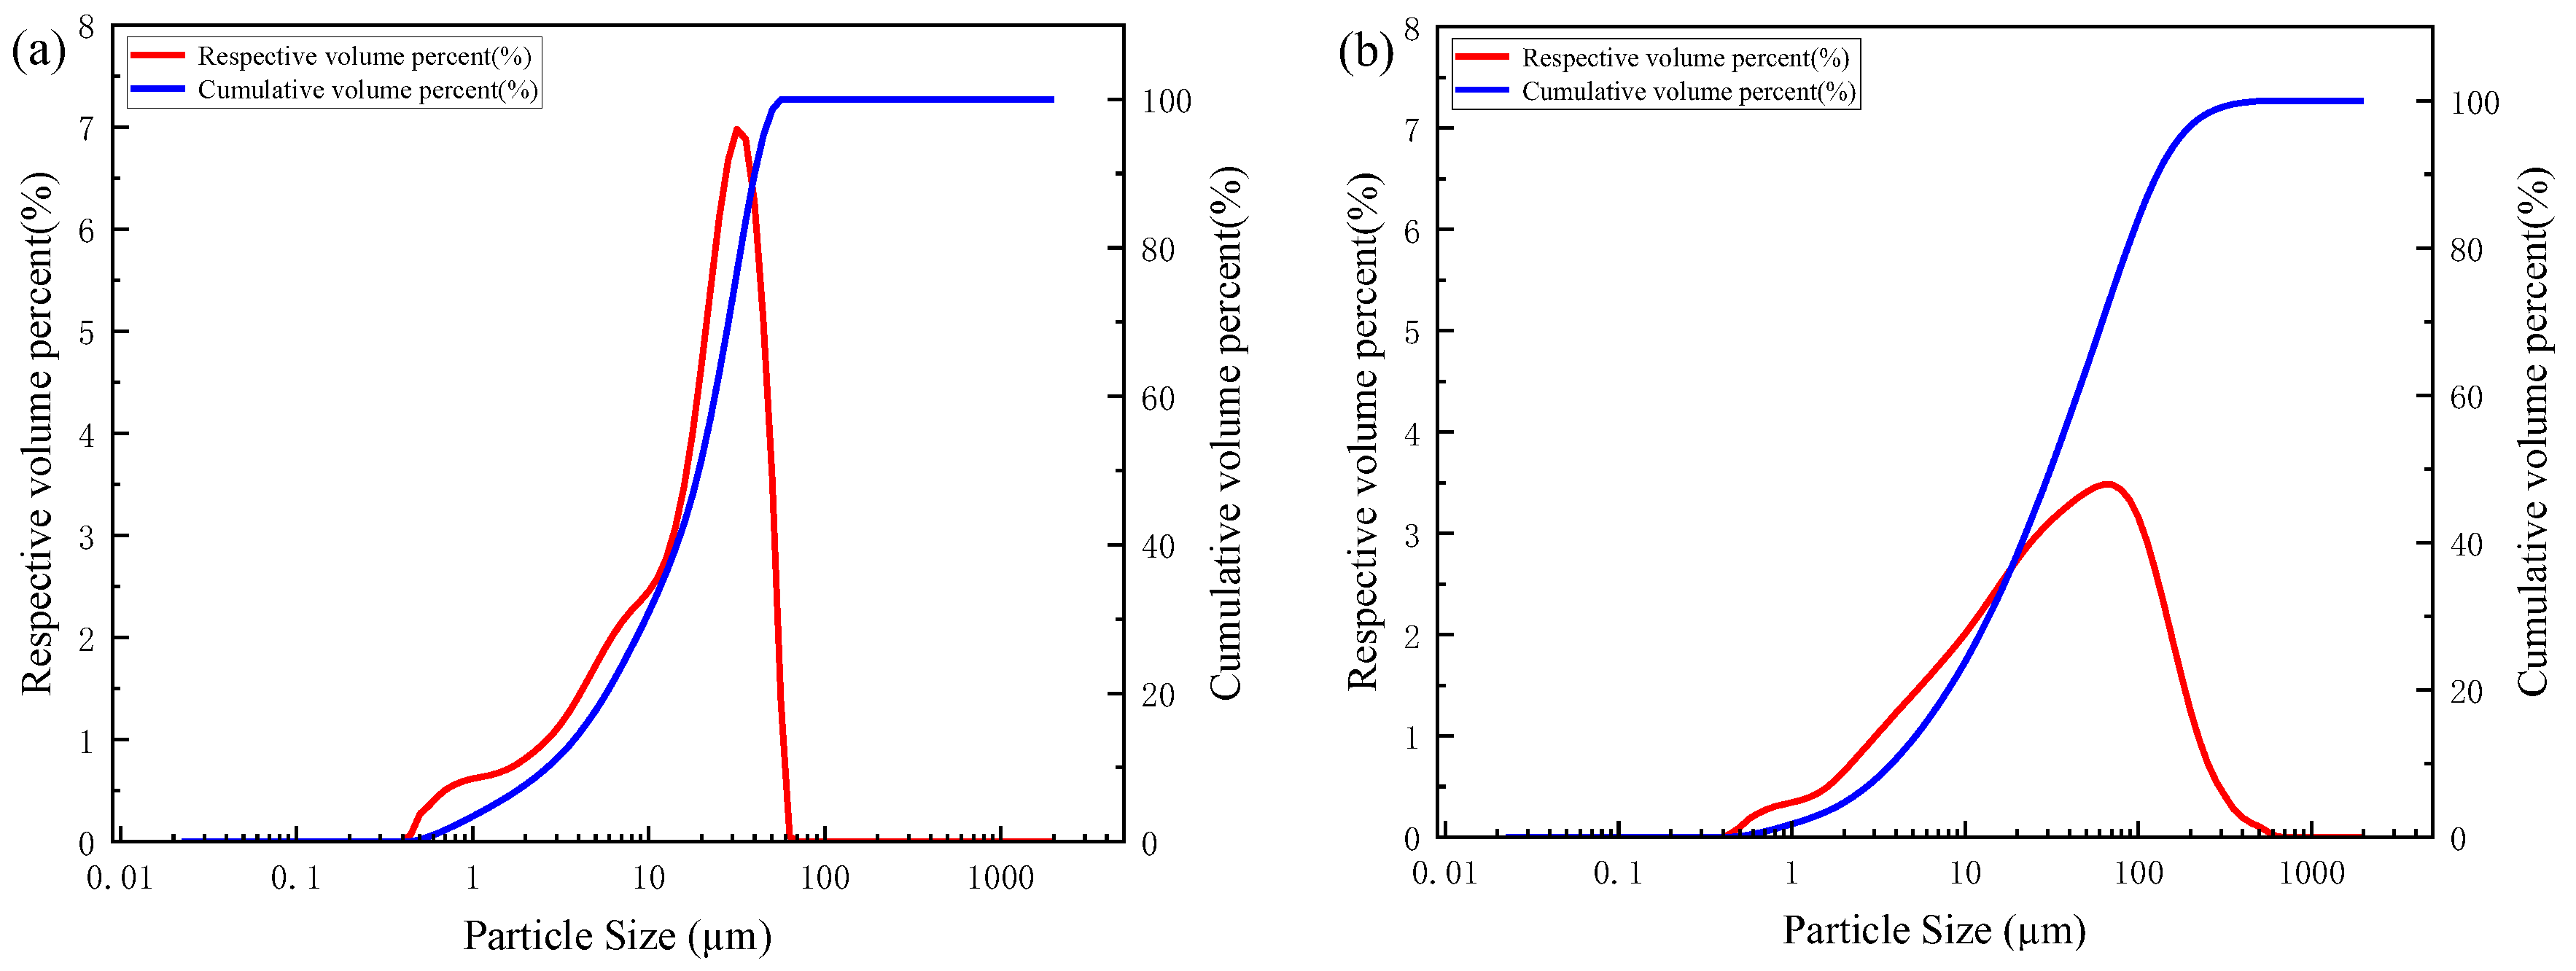
Phosphogypsum A and B samples were produced in Hubei Province, China, and their chemical composition and phase composition are presented in Table 1 and Figure 1, respectively. In Figure 1, (a) and (b) both show broadened diffraction peaks at 14.8°, 25.7°, and 29.7°, corresponding to the (101), (110) and (202) crystal face of CaSO4·0.5H2O, respectively. Both had a strong peak strength of 29.7°, indicating that CaSO4·0.5H2O mainly existed in the (202) crystal face and presented a plate-like crystal structure. The SEM image is shown in Figure 2, which shows that the phosphogypsum exhibits irregular layers of plate-like structures. The particle size distribution characteristics of the phosphogypsum samples are presented in Figure 3 and Table 2, and their physical and mechanical properties are listed in Table 3. Sodium dodecyl sulfate, a K12-type foaming agent, was procured from Kao (Japan). Naphthalene (water-reducing agent; FDN) was produced in Tianjin (China); its water reduction rate was 23%. Polycarboxylic acid (superplasticizer; PCE) was purchased from Shandong (China); its water reduction rate was 27%. Pure tap water was used for sample mixing.

2.2. Sample Preparation

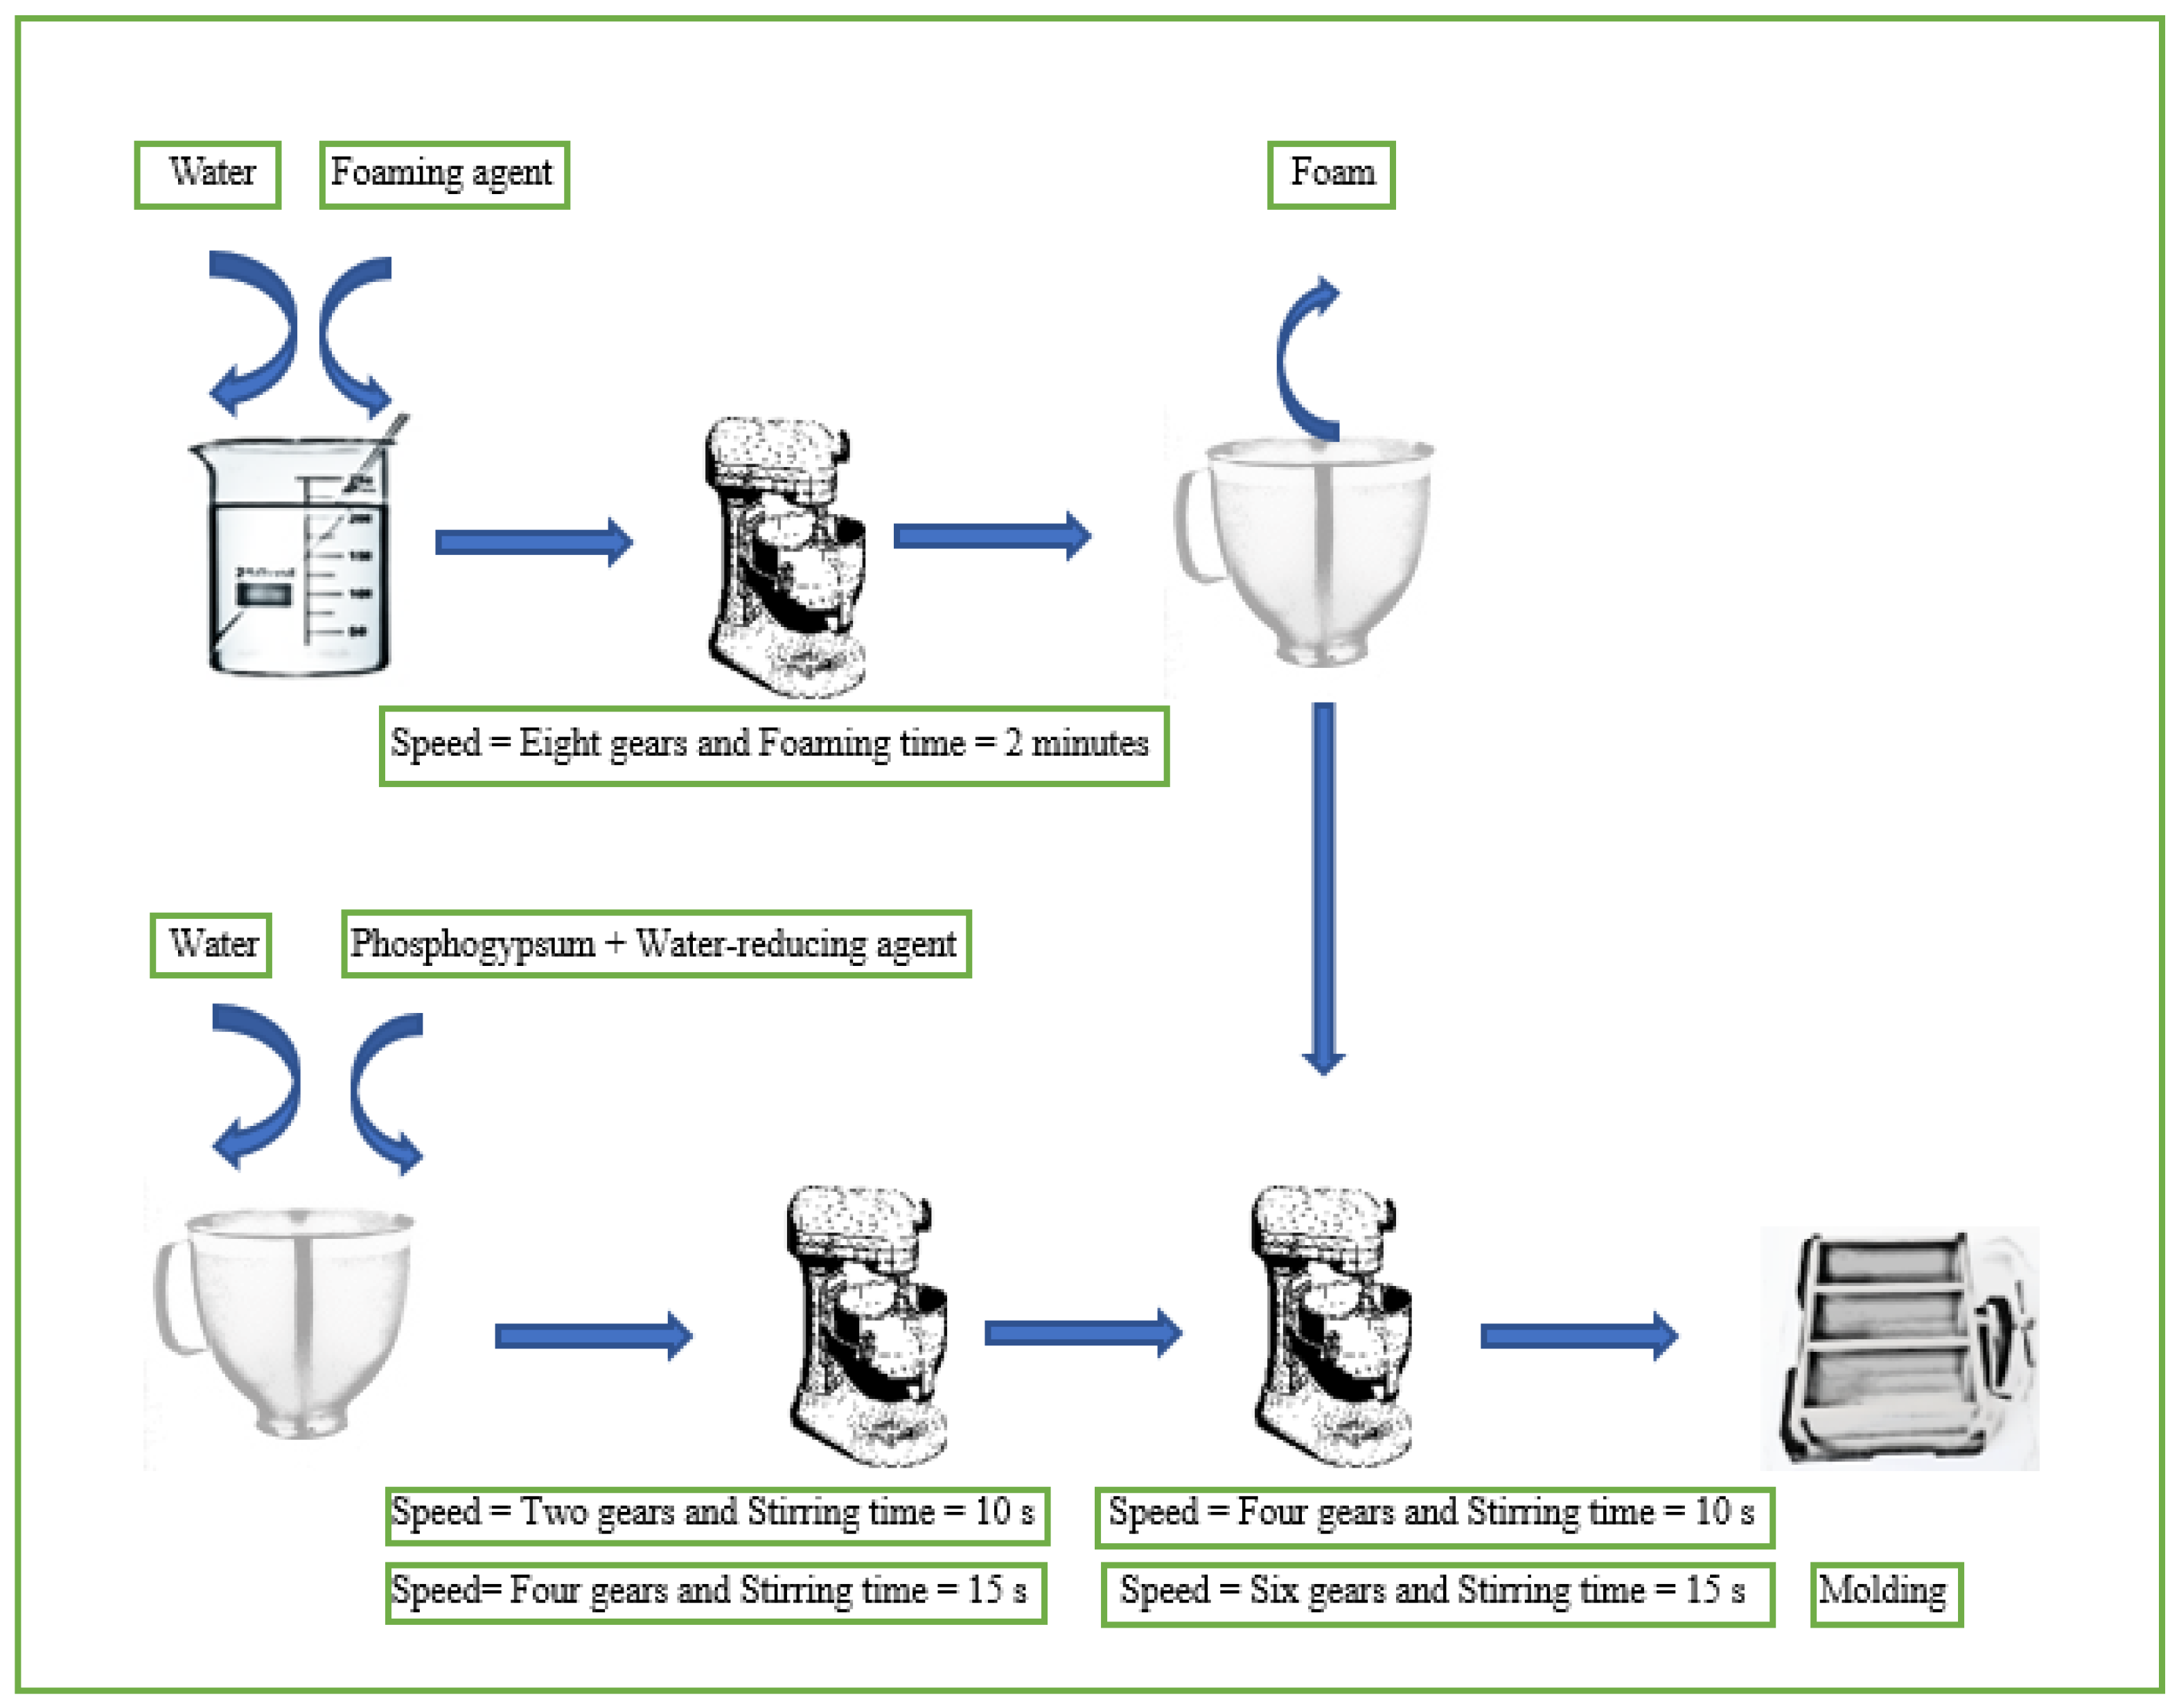
Preparation of foam: The foaming agent and purified water were weighed at a ratio of 1:250 and poured into a mixing pot (pot A).
The rotational speed of the mixer was set to eight gears; pot A was quickly removed after 2 min of stirring.
Preparation of phosphogypsum slurries: The contents of the water-reducing agent were 0.1%, 0.2%, 0.3%, 0.4%, and 0.5% of the total gypsum content.
According to the GB/T17669.3-1999 Standard [35] the fluidity of gypsum slurries should reach 180 ± 5 mm. The water/gypsum ratio and fluidity of the phosphogypsum A and B samples are presented in Table 4. Pure water, the water-reducing agent, and phosphogypsum powder were poured into a mixing pot (pot B) similar to pot A. The rotational speed of the mixer was first set to two gears for a stirring time of 10 s. Then, the corresponding values were adjusted to four gears and 15 s, respectively.
Preparation of foamed phosphogypsum samples: The as-prepared foam with a mass of 5% of the total phosphogypsum content was poured into pot B. The rotational speed of the mixer was first set to four gears for a stirring time of 10 s. Then, the corresponding values were adjusted to six gears and 15 s, respectively. The evenly mixed foamed phosphogypsum was then quickly poured into a mold of 40 mm × 40 mm × 160 mm in size. The wet strength, absolute dry strength, and dry density of the gypsum samples were then determined according to the GB/T17669.3-1999 Standard,.
Furthermore, to characterize the microstructure of phosphogypsum samples, 20 mm × 20 mm × 20 mm samples were made; the hydration of these samples was terminated after 2 h and the samples were placed in a sealed container for future use. The flowchart of the foamed phosphogypsum sample preparation is shown in Figure 4.

2.3. Test Methods

The rheological properties of the phosphogypsum slurries were measured using a TADHR-3 rheometer (Waters Corporation, Newcastle, DE, USA) under a shear stress range of 0–325 Pa, a shear rate range of 0–200 s−1, and a viscosity range of 1 × 10⁻³–3 × 10⁵ Pa. The pore structure characteristics of the foamed phosphogypsum samples were tested using a Mack AutoPore V 9600 mercury injection instrument (Micromeritics Instruments Corporation, Norcross, GA, USA).

3. Results and Discussion

3.1. Effect of the Water-Reducing Agents on the Mechanical Properties of the Foamed Phosphogypsum Samples

It can be seen in Table 5 that, under the action of both FDN and PCE, the development trends of the 2 h strength and absolute dry strength of the phosphogypsum A samples were almost similar. With the increase in the water-reducing agent content, the strength of the phosphogypsum A samples first increased and then gradually decreased. When the content of FDN or PCE was 0.4%, the 2 h strength and absolute dry strength of the phosphogypsum A samples reached a maximum. However, the 2 h strength and absolute dry strength of the foamed phosphogypsum samples mixed with FDN were higher than those of the samples mixed with PCE under the same water-reducing agent content. It is evident from Table 6 that under the action of both FDN and PCE, the strength development law of the phosphogypsum B samples was similar to that of the phosphogypsum A samples. However, in comparison to PCE, FDN yielded a more significant effect on the strength of the foamed phosphogypsum samples; when the FDN content was 0.4%, the strength of the corresponding sample was much higher than that of the sample with the same amount of PCE. These results indicate that there was an optimal dosage of the water-reducing agents for the foamed phosphogypsum samples. In this experiment, the optimal dosage of the PCE and FDN was selected as 0.4%. The foamed phosphogypsum samples mixed with FDN had a higher strength than the samples mixed with PCE.

3.2. Effect of the Water-Reducing Agents on the Dry Density of the Foamed Phosphogypsum Samples

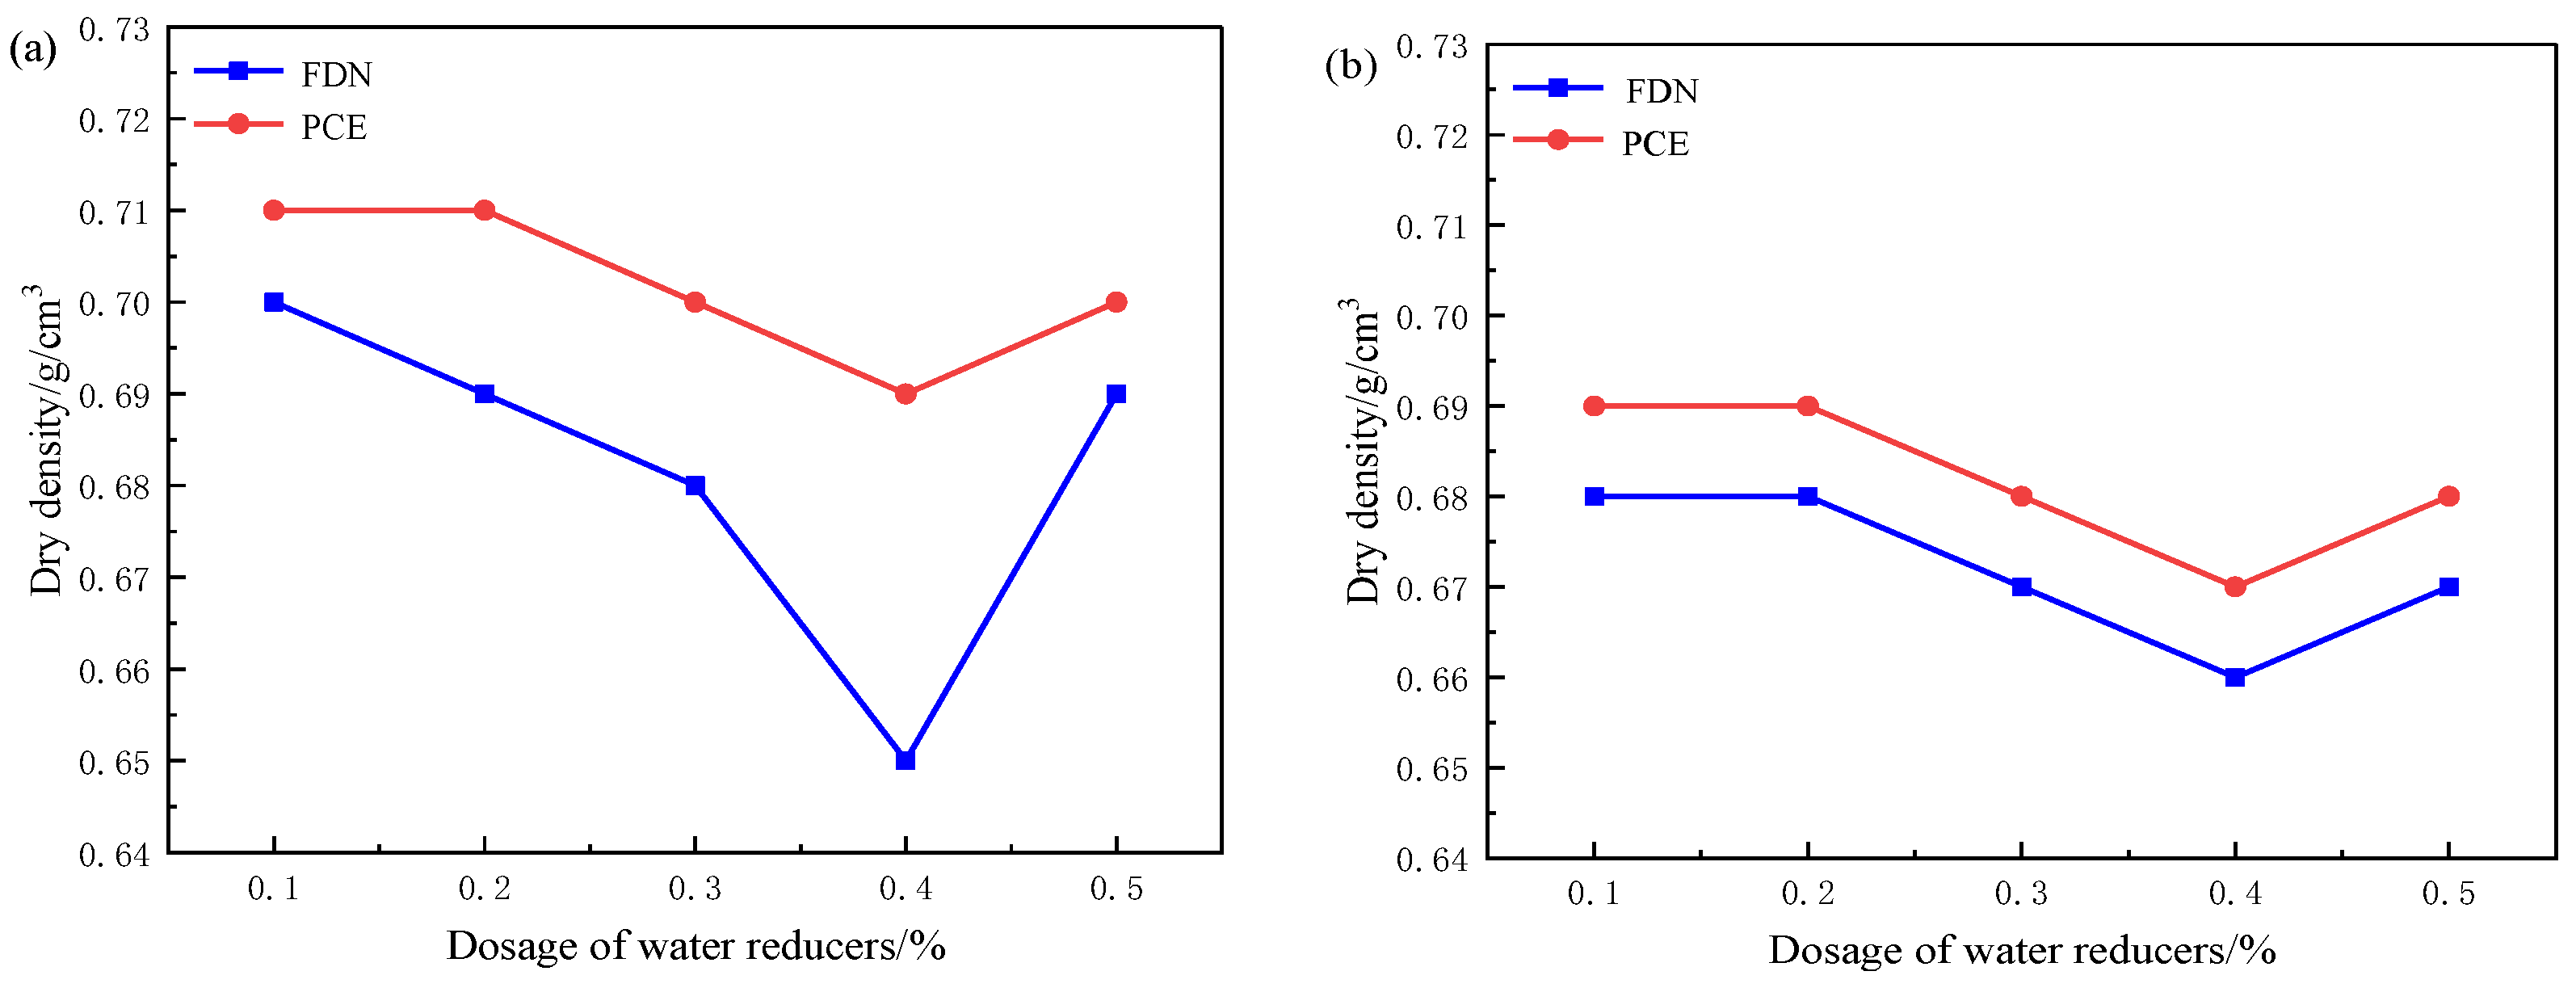
Figure 5 presents the dry densities of the foamed phosphogypsum A and B samples with different water-reducing agent dosages. The dry density of the foamed phosphogypsum samples first decreased and then increased when the water-reducing agent contents were increased. The dry density of the samples was found to be the lowest when the water-reducing agent content was 0.4%. The lowest dry densities of the phosphogypsum A and B samples doped with FDN were 0.65 g/cm3 and 0.66 g/cm3, respectively. The samples doped with FDN had lower dry densities than the foamed phosphogypsum samples mixed with PCE with the same water-reducing agent contents.

3.3. Discussion on the Effect of the Water-Reducing Agents on the Foamed Phosphogypsum Sample

The addition of water-reducing agents manifests a certain effect on the rheology of gypsum slurries; the bubble size distribution in foam is strongly correlated with the rheology of gypsum slurries. Therefore, in this section, the effects of the water-reducing agents on the rheological properties of the phosphogypsum slurries are discussed.

3.3.1. Effect of the Water-Reducing Agents on the Rheological Properties of the Foamed Phosphogypsum Slurries

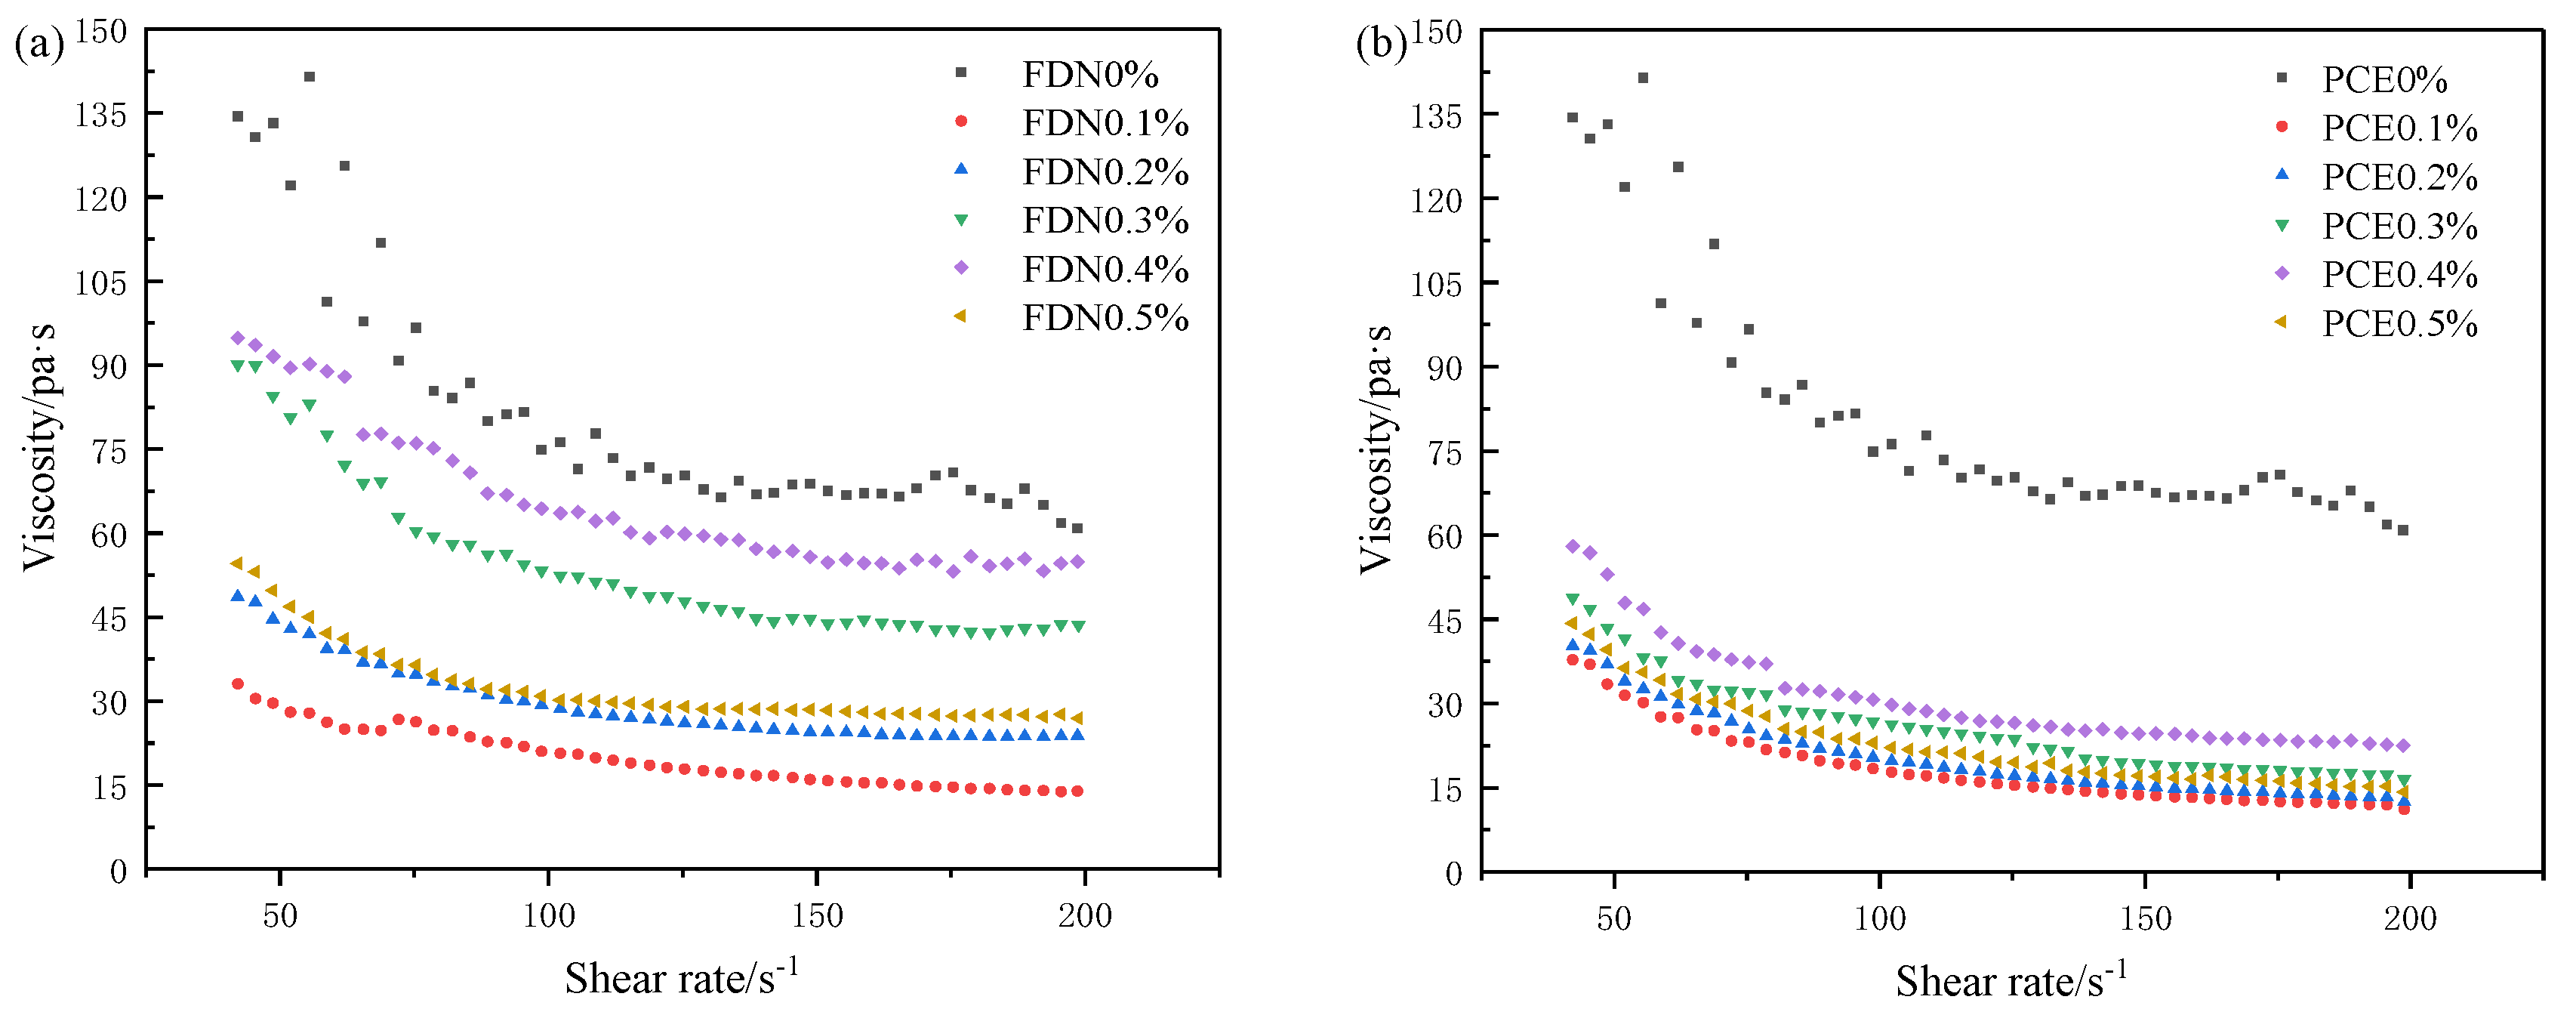
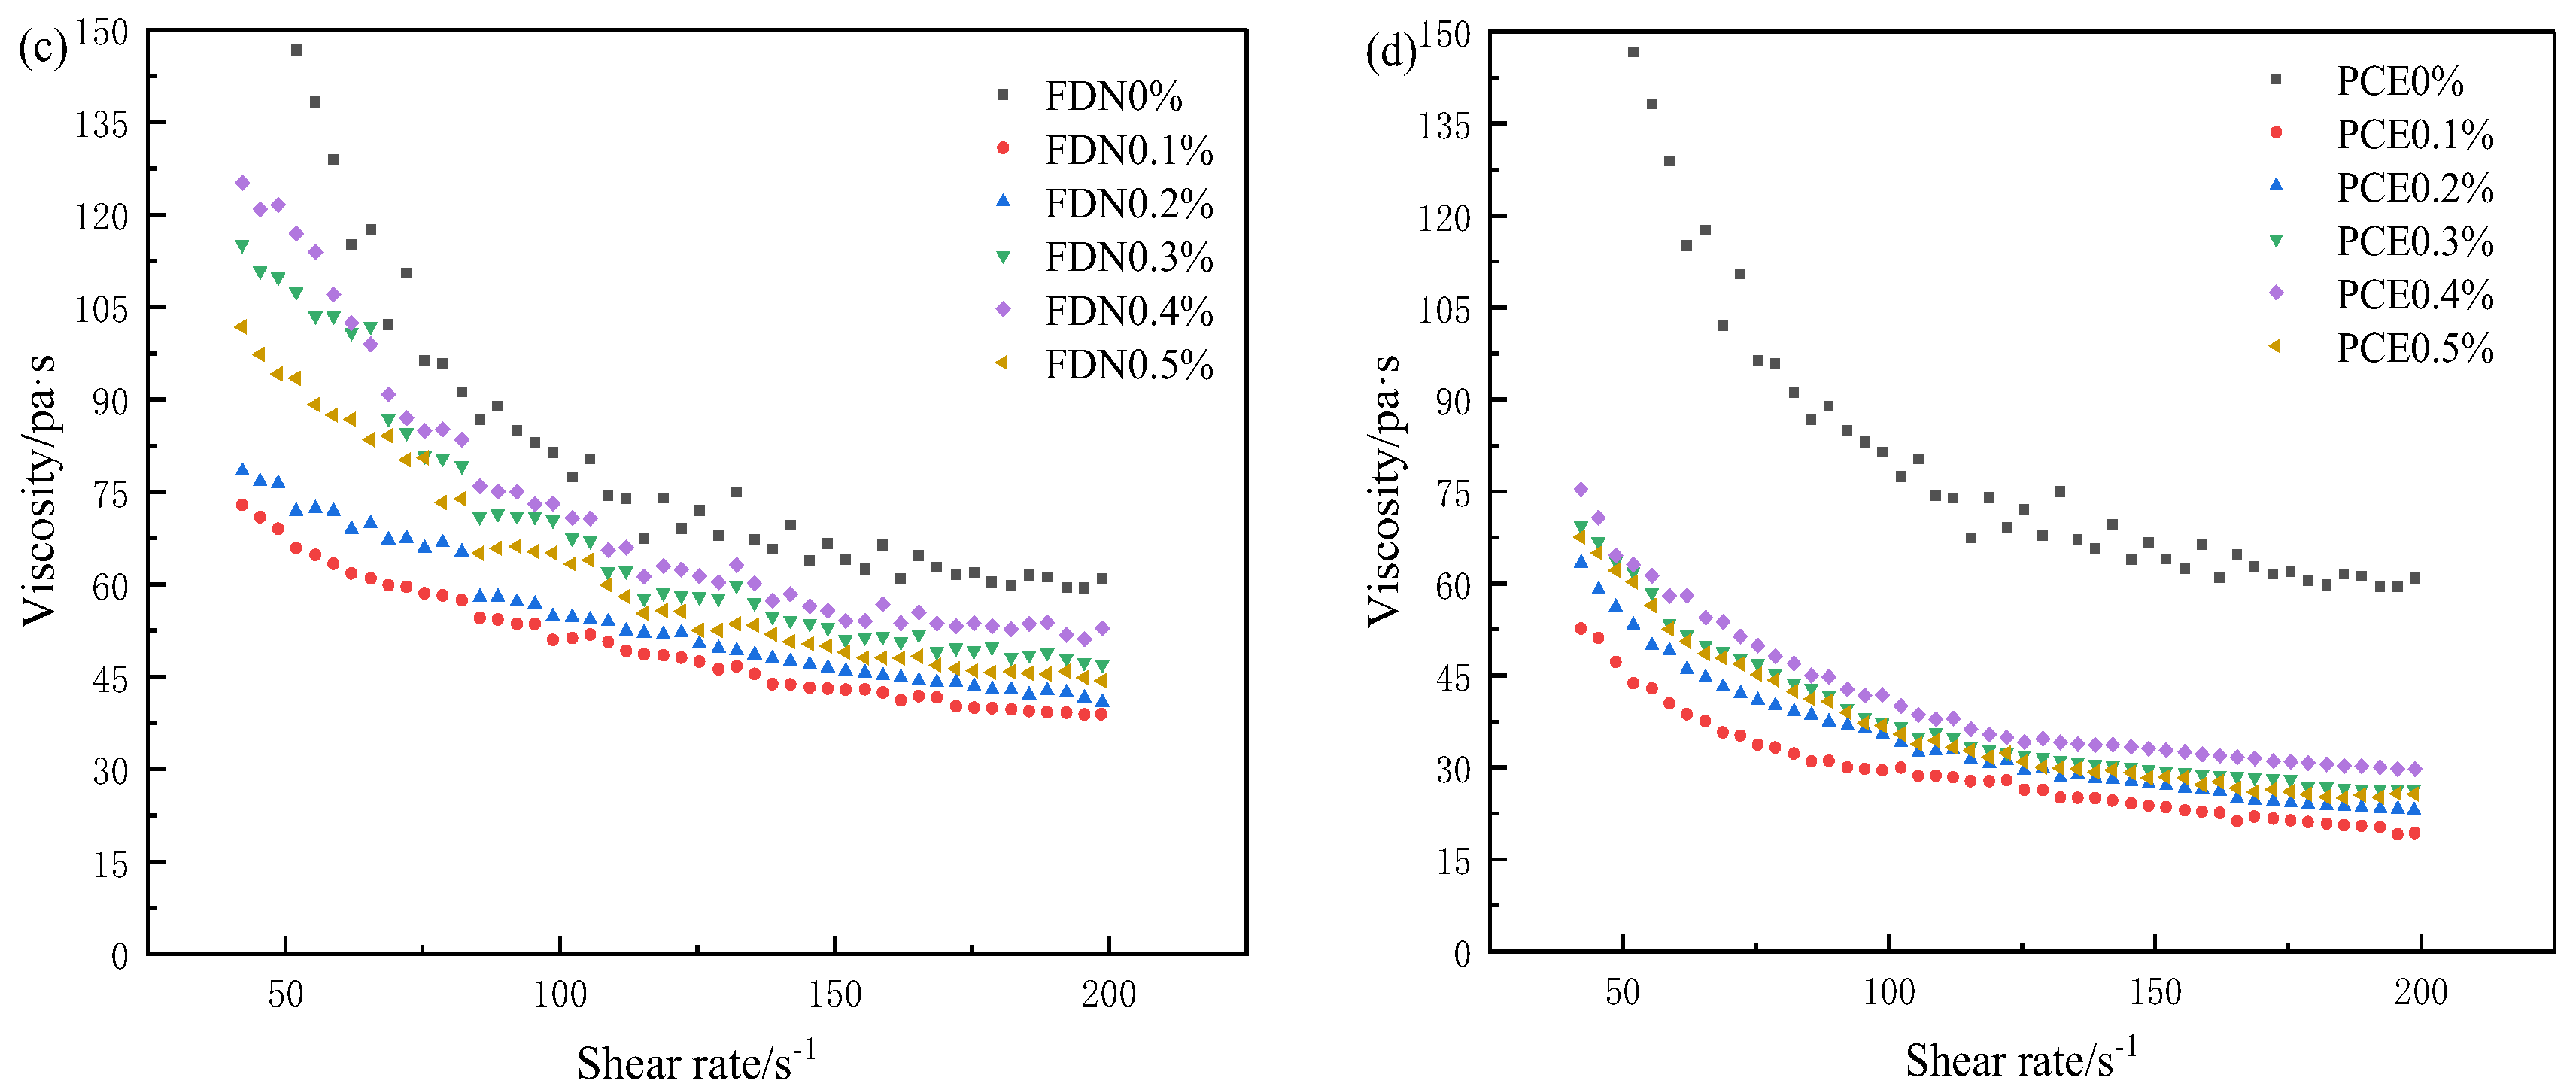
Figure 6 and Figure 7 display the apparent viscosity curves and shear stress curves of the foamed phosphogypsum A and B pastes mixed with different water-reducing agents, respectively. It can be seen in Figure 6 that the apparent viscosity of the phosphogypsum slurries gradually and rapidly decline with the increase in the shear rate under the same water-reducing agent content. When the shear rate was in the range of 1–50 s−1, the apparent viscosity of the slurries significantly decreased. When the shear rate was large, the variation in the apparent viscosity tended to be flat. At the same shear rate, the effect of the water-reducing agent content on the apparent viscosity of the phosphogypsum slurries was in the order of 0% > 0.4% > 0.3% > 0.5% > 0.2% > 0.1%. In comparison to the apparent viscosity of the phosphogypsum slurry doped with 0.4% PCE, the apparent viscosity of the slurry mixed with 0.4% FDN was closer to that of the slurry with no water-reducing agent.
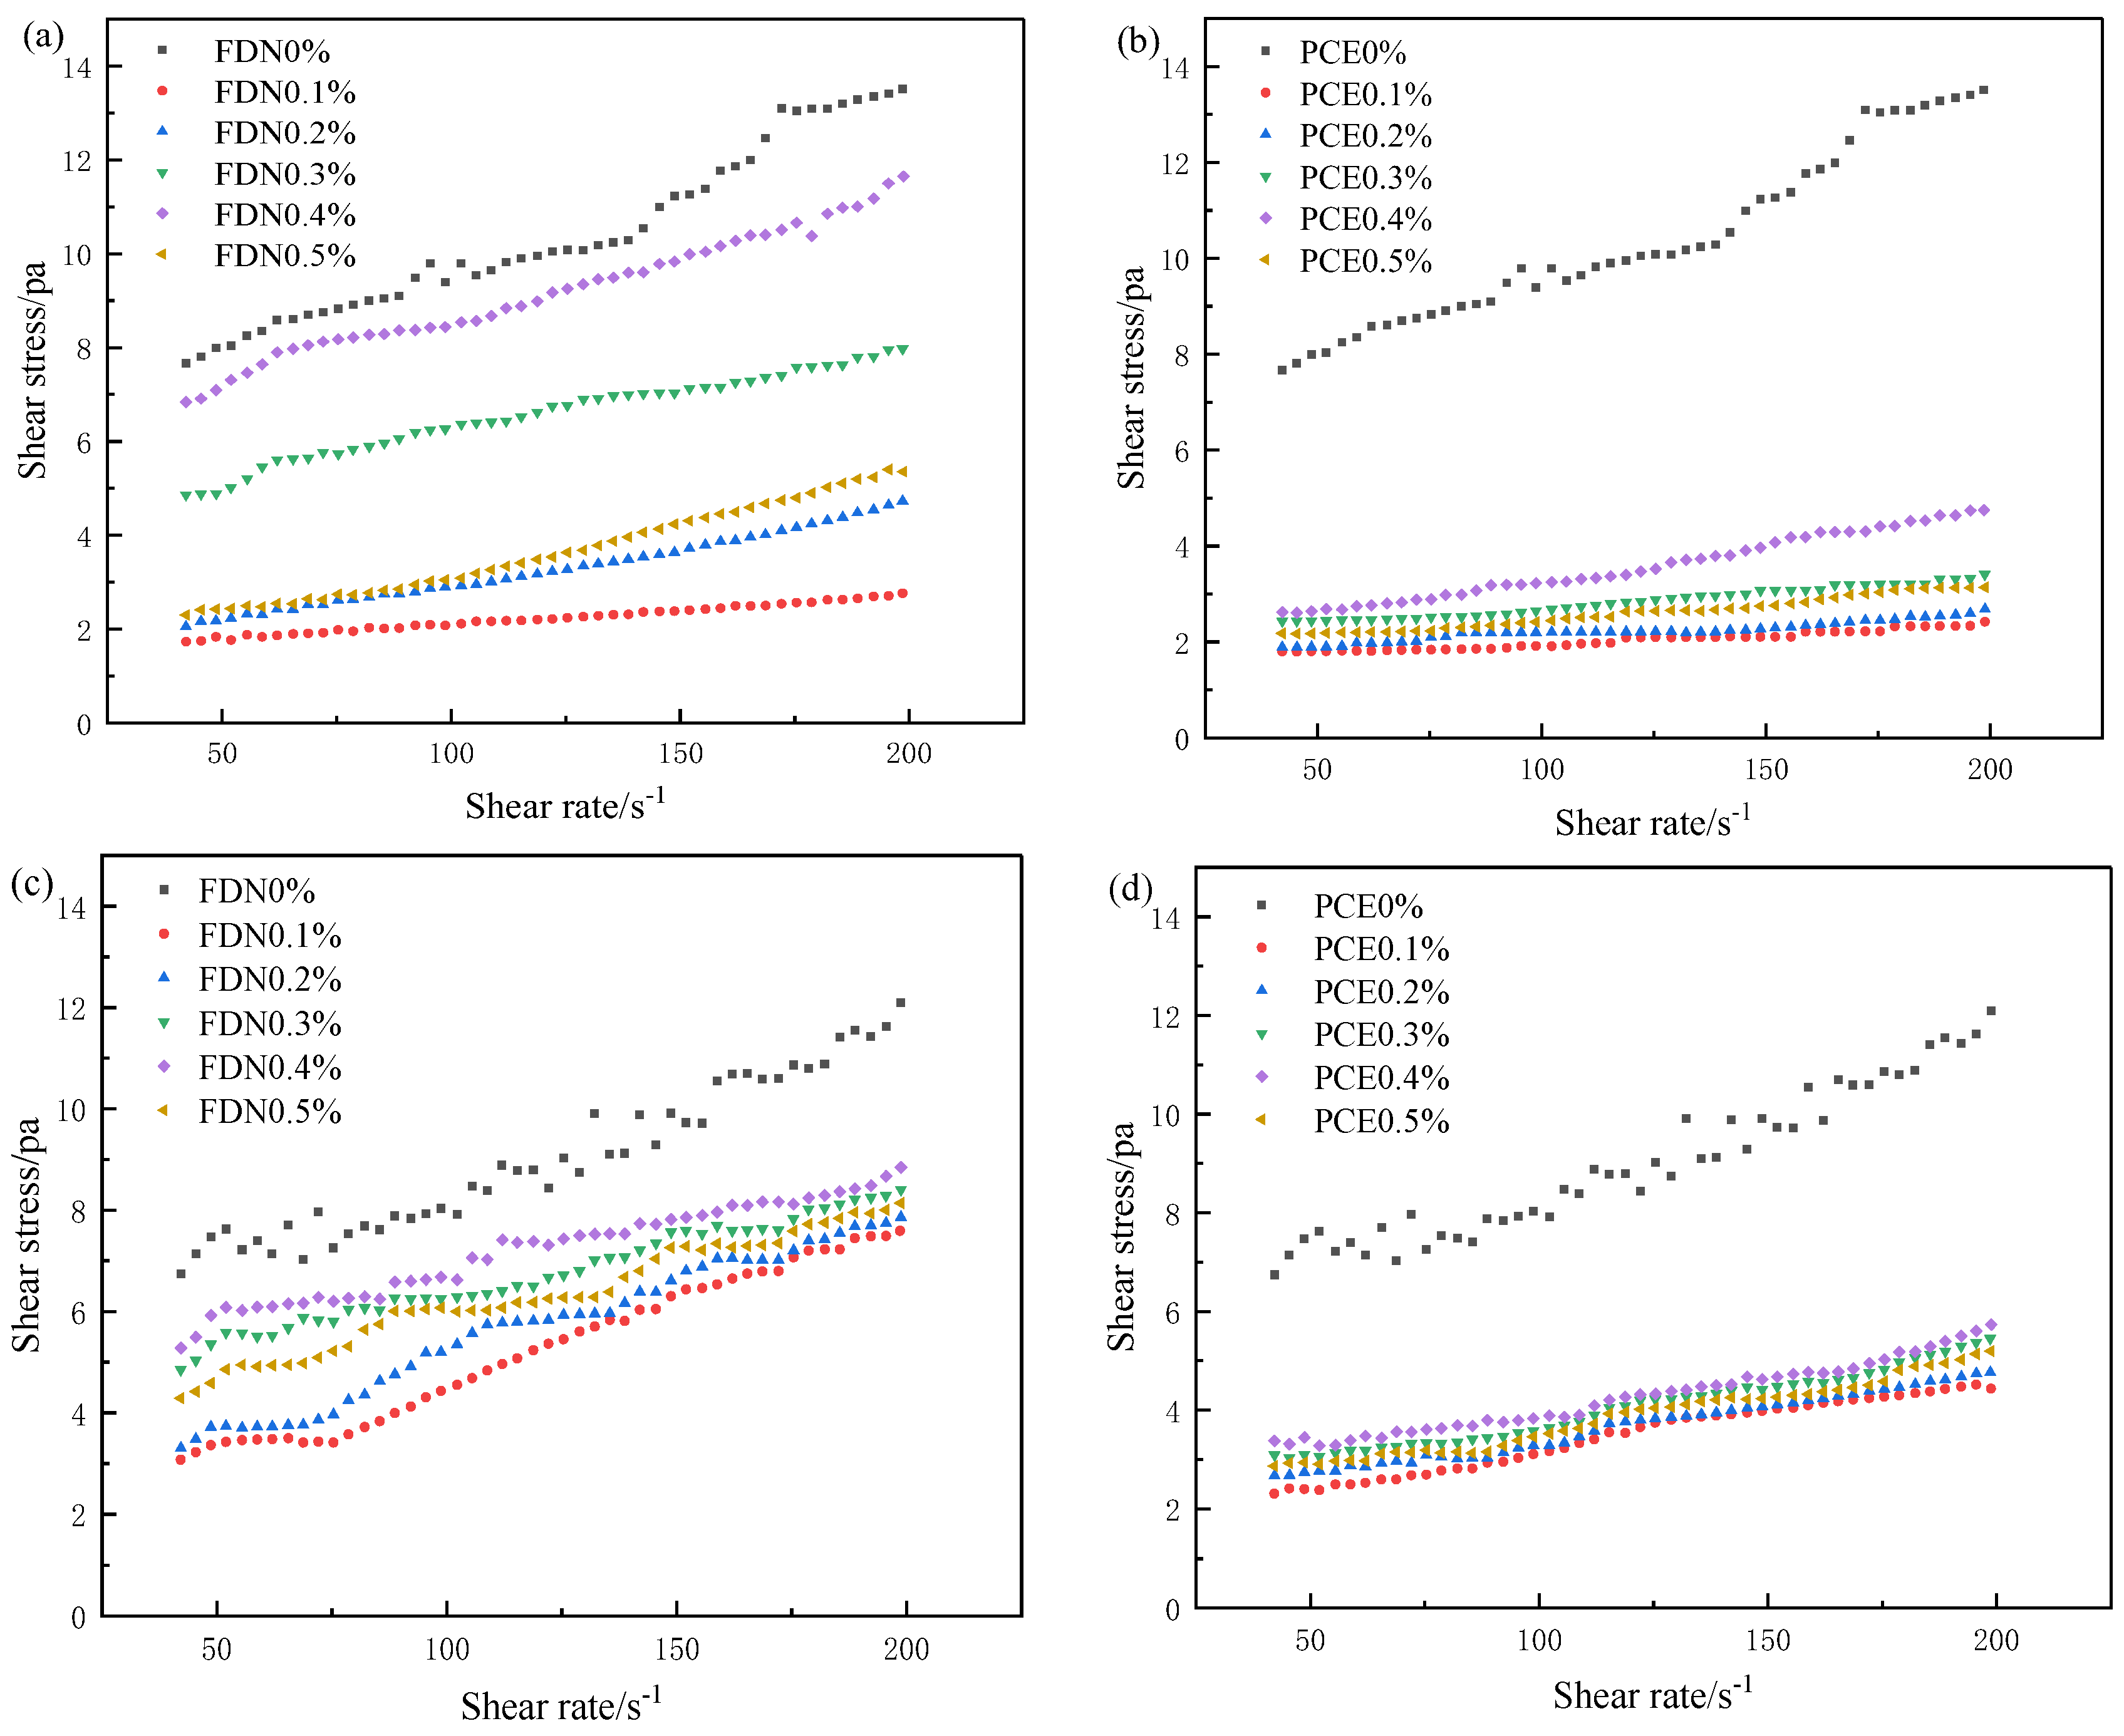
Figure 7 reveals an approximately linear relationship between the shear stress and shear rate of the slurries. The shear stress of the slurries increased with the increase in the shear rate under the same water-reducing agent amount. At the same shear rate, the effect of the water-reducing agent content on the shear stress of the phosphogypsum slurries was in the order of 0% > 0.4% > 0.3% > 0.5% > 0.2% > 0.1%. In comparison to the shear stress of the phosphogypsum slurry doped with 0.4% PCE, the shear stress of the slurry mixed with 0.4% FDN was closer to that of the slurry with no water-reducing agent. With the increase in the water-reducing agent content from 0.1% to 0.4%, the water consumption of the gypsum slurries significantly decreased, causing an increase in the viscosity of the slurries; thus, greater shear force was required to maintain the same shear flow rate. When the water-reducing agent content was 0.5%, the water consumption of the gypsum slurry was between 0.2% and 0.3%. Therefore, the apparent viscosity and shear stress of the phosphogypsum slurries mixed with 0.4% of the water-reducing agents were closer to those of the slurry with no water-reducing agent. The phosphogypsum slurries mixed with PCE had lower apparent viscosity and shear stress than the slurries doped with FDN under the same water-reducing agent dosage due to their slow coagulation by PCE.

3.3.2. Effect of the Water-Reducing Agents on the Pore Structure Distribution of the Foamed Phosphogypsum Samples

Figure 8 displays the pore size distribution curves of the foamed phosphogypsum samples doped with FDN and PCE. The pore size of both foamed phosphogypsum samples followed a bimodal distribution; the pore size distribution was mainly concentrated in the range of 100–3000 nm. FDN and PCE both enlarged the pore size distribution range of foamed phosphogypsum and increased the size and proportion of large pores; however, the influence of PCE was found to be more significant. The large pore size in the foamed phosphogypsum samples doped with PCE was around 100,000 nm, whereas the corresponding value in the foamed phosphogypsum samples doped with FDN was around 10,000 nm. The peak heights in the pore distribution curves shown in Figure 8 represent the proportions of pores with corresponding sizes. It is noticeable from Figure 8d that the peak height of macropores increased in the phosphogypsum B samples doped with PCE, indicating that PCE significantly increased the proportion of macropores. In addition, the water-reducing agent content had a significant effect on pore size distribution. When the dosages of FDN and PCE were both 0.4%, the pore proportions of 100–3000 nm were the highest, whereas the pore proportions of 1000 nm and 10,000 nm in the corresponding samples were the lowest.
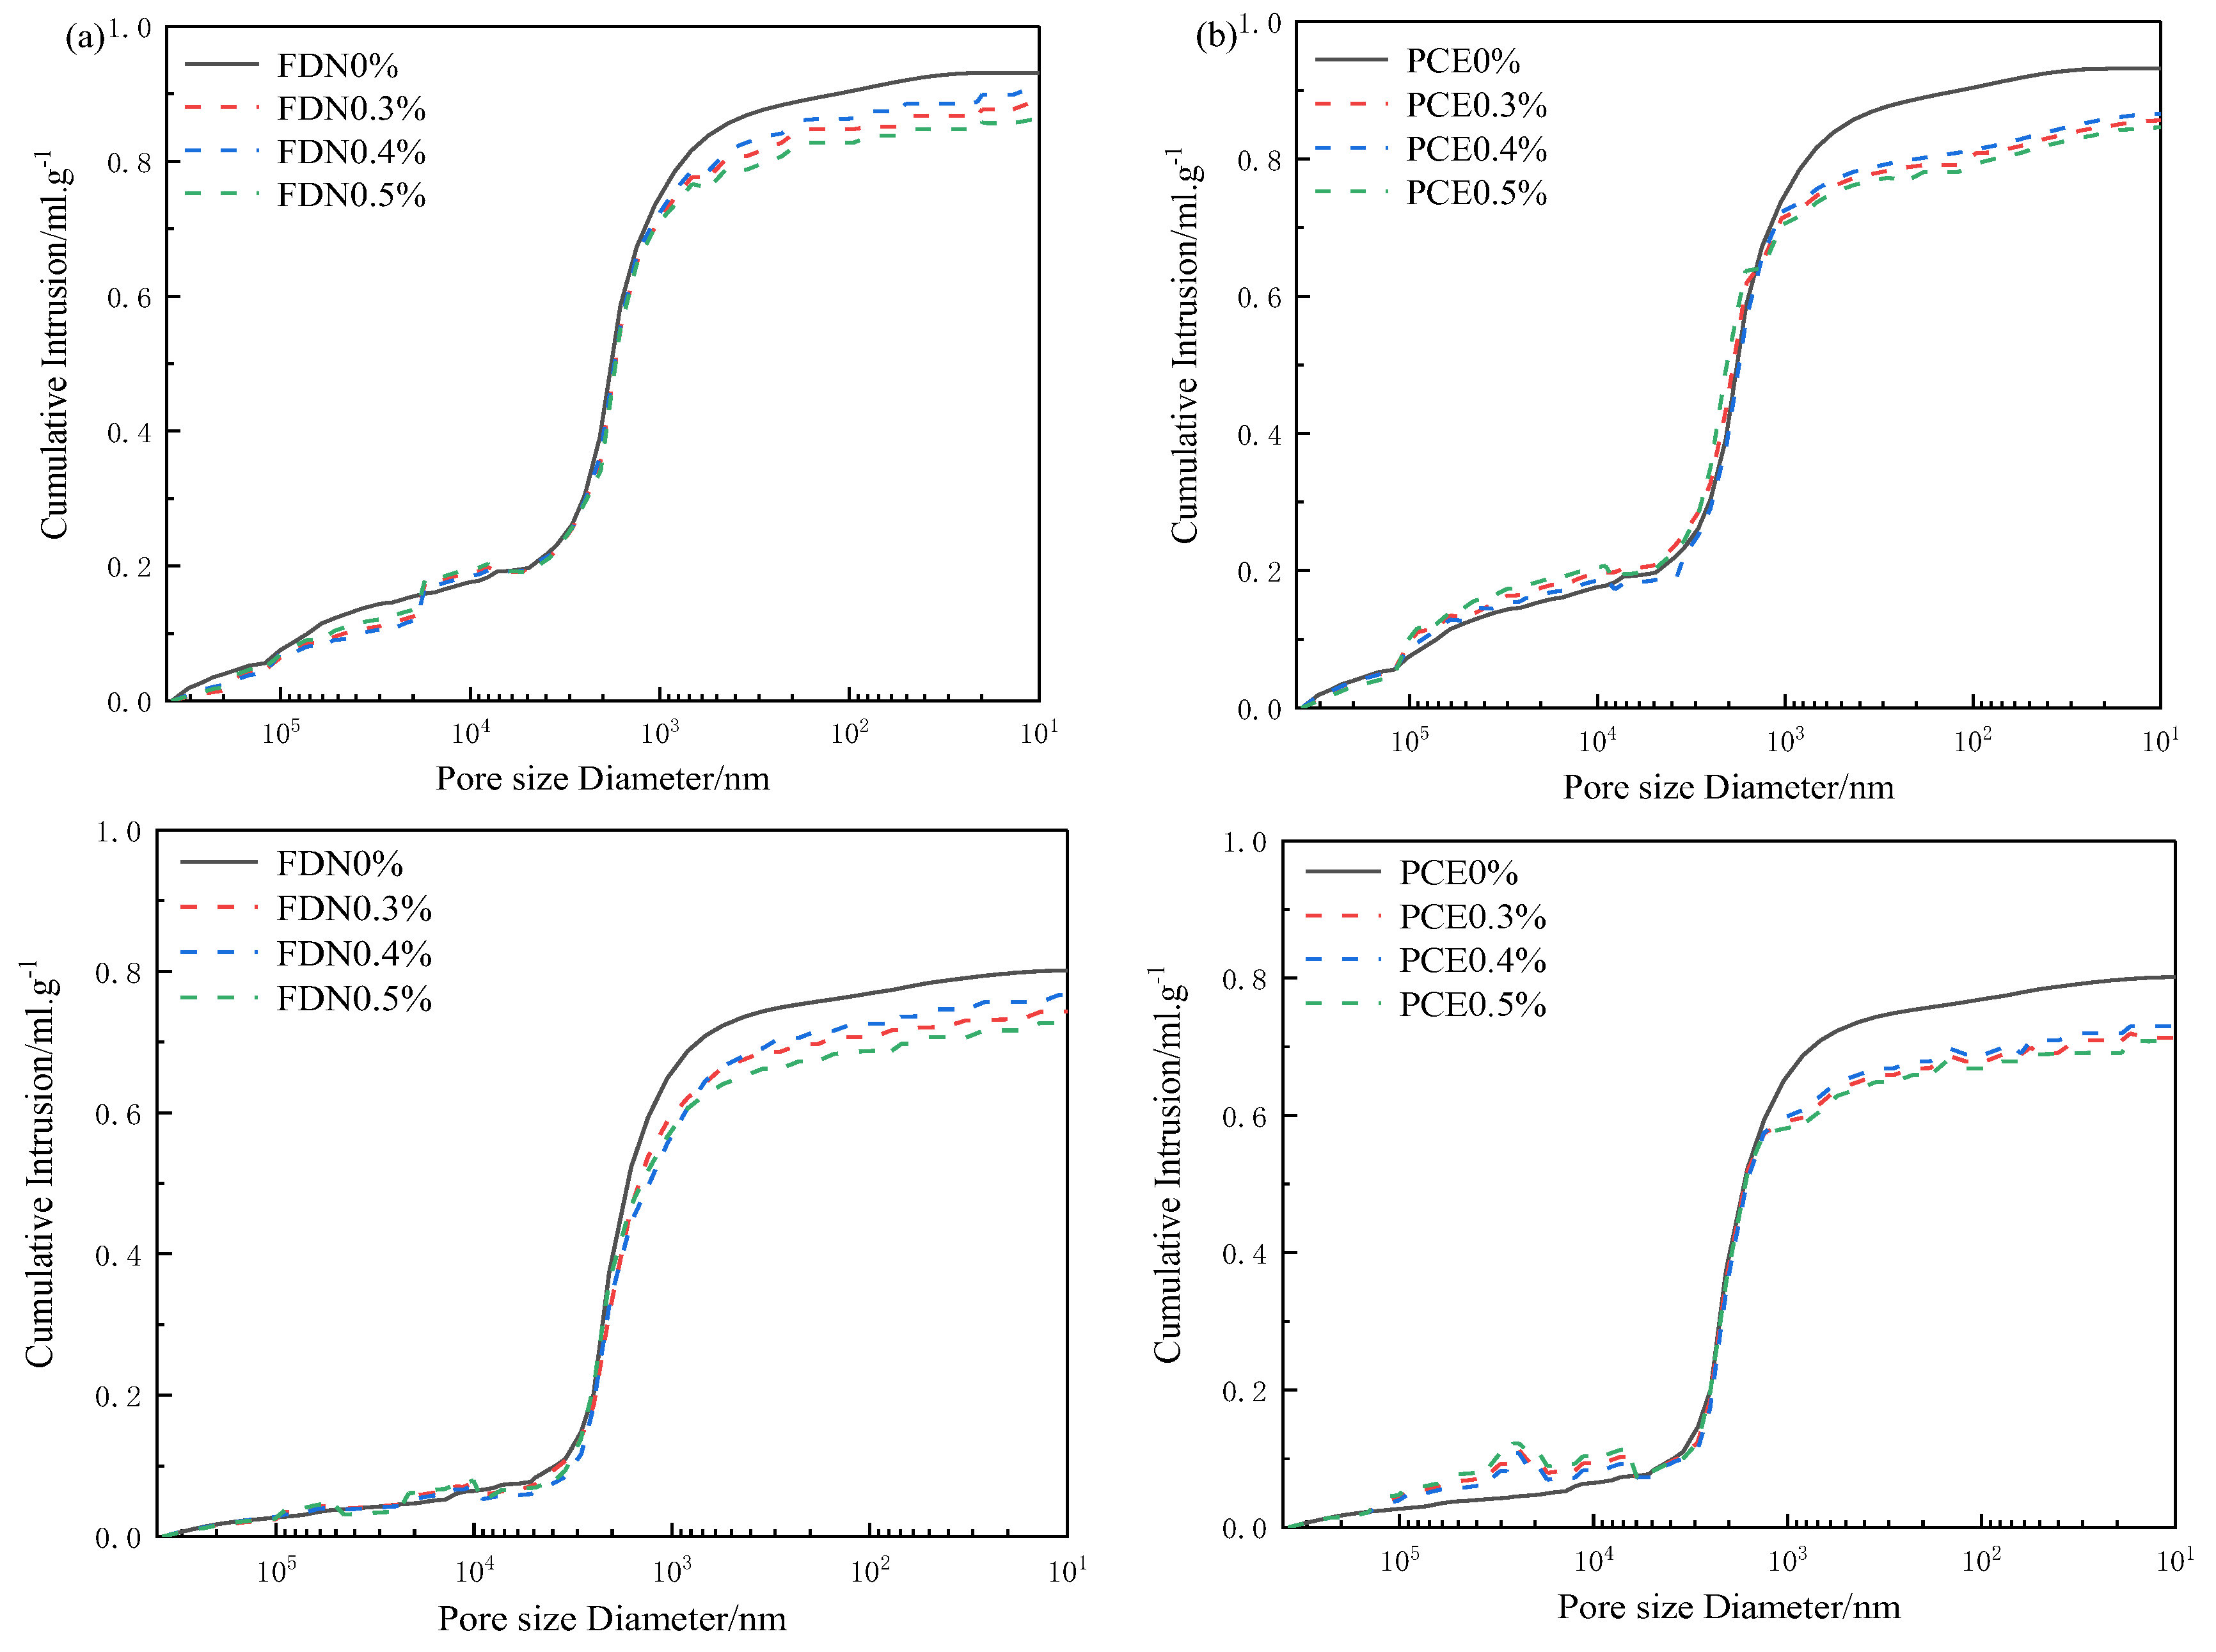
Figure 9 exhibits the cumulative pore size distribution curves of the foamed phosphogypsum samples doped with FDN and PCE. FDN and PCE both reduced the total pore amount in foamed phosphogypsum; however, the effect of PCE was found to be more significant. The total pore content in the corresponding sample was the highest when the content of FDN or PCE was 0.4%. These results indicate that the type and dosage of the water-reducing agents had significant effects on the total pore content and the distribution of different pore sizes in the foamed phosphogypsum.
Figure 10 is a cross-sectional view of the foamed phosphogypsum. It can be clearly seen that the sample doped with FDN has a smaller macroscopic pore size and more stomatal content than the sample with PCE.

3.4. Discussion

It can be concluded that the types and dosages of water-reducing agents have a significant effect on the properties of foamed phosphogypsum; the effects vary greatly between PCE and FDN. Compared with PCE, the match between FDN and foamed phosphogypsum is better; the optimal content of FDN is 0.4%.
Compared with the foamed phosphogypsum doped with PCE, the water consumption of the foamed phosphogypsum doped with FDN was significantly lower, which meant that the viscosity and shear stress of the slurry doped with FDN were larger, the foam was tightly wrapped by the gypsum slurry, and the foam flow range was relatively small. Therefore, the foamed phosphogypsum doped with FDN had a relatively low proportion of large pores and a large number of uniformly distributed medium pores; hence, the foamed phosphogypsum samples doped with FDN had a lower dry density and higher strength. The foamed phosphogypsum slurry mixed with 0.4% FDN consumed the least amount of water; hence, its viscosity and shear stress were relatively large. Moreover, the slurry mixed with 0.4% FDN had the lowest number of large pores and the highest number of medium pores; thus, it yielded the best mechanical properties. The water-reducing agents mainly reduced the water consumption of the phosphogypsum slurries; changed the viscosity and shear stress of the gypsum slurries; affected the stability of foam in the gypsum slurries; changed the pore size and distribution in the gypsum slurries; and influenced the strength, dry density, and other macro-properties of the foamed phosphogypsum samples. The viscosity of the gypsum slurry doped with 0.4% FDN better matched that of the foam; therefore, it had the highest macro-strength and the lowest dry density.

4. Conclusions

(1) When the water-reducing agent content was increased, the strength of the foamed phosphogypsum first increased and then decreased and the dry density of the foamed phosphogypsum first decreased and then gradually increased. There was an optimal dosage range for water-reducing agent in phosphogypsum. The optimal content of FDN and PCE in this experiment was found to be 0.4%. Compared to PCE, FDN is a better match for the foamed phosphogypsum slurry;
(2) The effect of the water-reducing agent content on the apparent viscosity and shear stress of the phosphogypsum slurries was in the order of 0% > 0.4% > 0.3% > 0.5% > 0.2% > 0.1%. The phosphogypsum slurry doped with 0.4% FDN had higher apparent viscosity and shear stress than the slurry mixed with 0.4% PCE;
(3) FDN and PCE both enlarged the pore size distribution, increased the size and proportion of large pores, and decreased the total pore content of foamed phosphogypsum; however, the influences of PCE were found to be more significant. The foamed phosphogypsum slurry mixed with 0.4% FDN had the highest total pore content. Among the samples, the total pore content of foamed phosphogypsum A reached 91%, and the total pore content of foamed phosphogypsum B reached 77%. The lowest proportion of large pores was 17% for foamed phosphogypsum A and 7% for foamed phosphogypsum B;
(4) The water-reducing agents mainly reduced the water consumption of the phosphogypsum slurries; improved the viscosity and shear stress of the slurries; influenced the stability of foam in the gypsum slurries; changed the pore size and distribution in the phosphogypsum slurries; and affected the strength and dry density of the foamed phosphogypsum samples. The viscosity of the gypsum slurry doped with 0.4% FDN better matched that of the foam, having the highest macro-strength and the lowest dry density.

Author Contributions

Conceptualization, J.Y.; methodology, J.Y. and H.W.; validation, J.Y. and H.W.; writing—original draft preparation, J.Y.; writing—editing, J.Y. and H.W.; review, H.Y. and J.G.; formal analysis, F.W. and H.Y.; data curation, F.W.; Chart processing, J.G.; funding acquisition, H.W. All authors have read and agreed to the published version of the manuscript.

Funding

This study was funded by the 14th Five-Year “National Key Research and Development Plan Project” (Grant No. 2022YFC3902704).

Data Availability Statement

Data are contained within the article.

Acknowledgments

We would like to express our heartfelt gratitude to China Building Materials Academy Co., Ltd. for providing the experimental instruments and workstations, as well as to Gao Chunyong and Zhao Ruixia for their contributions to the experimental research.

Conflicts of Interest

Hongxia Wang, Fade Wu and Junhua Guo were employed by the company China Building Materials Academy Co., Ltd. Jian Yu and Haiyan Yudeclare that the research was conducted in the absence of any commercial or financial relationships.

References

  1. Awad, S.; Essam, M.; Boukhriss, A.; Kamar, M.; Midani, M. Properties, Purification, and Applications of Phosphogypsum: A Comprehensive Review Towards Circular Economy. Mater. Circ. Econ. 2024, 6, 9. [Google Scholar] [CrossRef]
  2. Bellefqih, H.; Bourgier, V.; Bilal, E.; Dumitraş, D.-G.; Marincea, Ş.; Mazouz, H.; Haneklaus, N. Effect of HPO42− and brushite on gypsum reactivity and implications for utilization of phosphogypsum in plaster production. J. Clean. Prod. 2024, 451, 142013. [Google Scholar]
  3. Li, W.; Ma, L.; Qiu, S.; Yin, X.; Dai, Q.; Du, W. Sustainable Utilization of Phosphogypsum in Multi-Solid Waste Recycled Aggregates: Environmental Impact and Economic Viability. Sustainability 2024, 16, 1161. [Google Scholar] [CrossRef]
  4. Guan, Q.; Wang, Z.; Zhou, F.; Yu, W.; Yin, Z.; Zhang, Z.; Chi, R.; Zhou, J. The Impurity Removal and Comprehensive Utilization of Phosphogypsum: A Review. Materials 2024, 17, 2067. [Google Scholar] [CrossRef] [PubMed]
  5. Saadaoui, E.; Ghazel, N.; Ben Romdhane, C.; Massoudi, N. Phosphogypsum: Potential uses and problems–a review. Int. J. Environ. Stud. 2017, 74, 558–567. [Google Scholar] [CrossRef]
  6. Rashad, A.M. Phosphogypsum as a construction material. J. Clean. Prod. 2017, 166, 732–743. [Google Scholar] [CrossRef]
  7. Zhou, Y.; He, B. Status quo and suggestions for comprehensive utilization of phosphogypsum in China. Phosphate Fertil. Compd. Fertil. 2023, 38, 11–16. [Google Scholar]
  8. Chernysh, Y.; Yakhnenko, O.; Chubur, V.; Roubík, H. Phogypsum recycling: A review of environmental issues, current trends, and prospects. Appl. Sci. 2021, 11, 1575. [Google Scholar] [CrossRef]
  9. Yang, Z. Steadily promote the comprehensive utilization of phosphogypsum to help realize the implementation of the “double carbon” strategy. Phosphate Fertil. Compd. Fertil. 2023, 38, 4. [Google Scholar]
  10. Zhou, J.; Li, X.; Zhao, Y.; Shu, Z.; Wang, Y.; Zhang, Y.; Shen, X. Preparation of paper-free and fiber-free plasterboard with high strength using phosphogypsum. Constr. Build. Mater. 2020, 243, 118091. [Google Scholar] [CrossRef]
  11. Dong, Z.; Zhai, Y.; Ren, Z.; Yan, B. Research Progress on Resource Utilization of Phosphogypsum Building Materials. Inorg. Chem. Ind. 2022, 54, 5–9. [Google Scholar]
  12. Jang, M.; Kang, C.-S.; Moon, J.H. Estimation of 222Rn release from the phosphogypsum board used in housing panels. J. Environ. Radioact. 2005, 80, 153–160. [Google Scholar] [CrossRef]
  13. Murali, G.; Azab, M. Recent research in utilization of phosphogypsum as building materials. J. Mater. Res. Technol. 2023, 25, 960–987. [Google Scholar] [CrossRef]
  14. Prasad, M.N.V. Resource potential of natural and synthetic gypsum waste. In Environmental Materials and Waste; Academic Press: Cambridge, MA, USA, 2016; pp. 307–337. [Google Scholar]
  15. Zhao, X.; Xu, G. Research on the application of polycarboxylate superplasticizer in the production of gypsum materials. Chem. Eng. Equip. 2021, 3–4+24. [Google Scholar] [CrossRef]
  16. Pundir, A.; Garg, M.; Singh, R. Evaluation of properties of gypsum plaster-superplasticizer blends of improved performance. J. Build. Eng. 2015, 4, 223–230. [Google Scholar] [CrossRef]
  17. Cao, W.; Yi, W.; Yin, S.; Peng, J.; Li, J. A novel low-density thermal insulation gypsum reinforced with superplasticizers. Constr. Build. Mater. 2021, 278, 122421. [Google Scholar] [CrossRef]
  18. Neuville, M.; Bossis, G.; Persello, J.; Volkova, O.; Boustingorry, P.; Mosquet, M. Rheology of a gypsum suspension in the presence of different superplasticizers. J. Rheol. 2012, 56, 435–451. [Google Scholar] [CrossRef]
  19. Zhi, Z.; Ma, B.; Tan, H.; Guo, Y.; Jin, Z.; Yu, H.; Jian, S. Effect of competitive adsorption between polycarboxylate superplasticizer and hydroxypropylmethyl cellulose on rheology of gypsum paste. J. Mater. Civ. Eng. 2018, 30, 04018141. [Google Scholar] [CrossRef]
  20. Zhang, M.; Wang, L.; Zhang, X.; Mi, X.; Sun, F.; Fang, Z.; Pei, M. Effect of Polycarboxylate Superplasticizer Modified by Sodium Hypophosphite on the Properties of β-Calcium Sulfate Hemihydrate. J. Mater. Civ. Eng. 2023, 35, 04022362. [Google Scholar] [CrossRef]
  21. Capasso, I.; Pappalardo, L.; Romano, R.A.; Iucolano, F. Foamed gypsum for multipurpose applications in building. Constr. Build. Mater. 2021, 307, 124948. [Google Scholar] [CrossRef]
  22. Zhao, Y. Optimal Design and Performance of Gypsum Foaming Agent and Foamed Gypsum. Master’s Thesis, East China University of Science and Technology, Shanghai, China, 2018. [Google Scholar]
  23. Zhong, Z.; Chen, Y.; Zhao, H.; Kang, X. Effect of Foaming Agent on Physical and Mechanical Properties of Foamed Phosphogypsum. J. Mater. Civ. Eng. 2024, 36, 04023611. [Google Scholar] [CrossRef]
  24. Çolak, A. Density and strength characteristics of foamed gypsum. Cem. Concr. Compos. 2000, 22, 193–200. [Google Scholar] [CrossRef]
  25. Bazelova, Z.; Pach, L.; Lokaj, J. Effect of surface active substance concentration on the properties of foamed and non-foamed gypsum. Ceramics-Silikáty 2010, 54, 379–385. [Google Scholar]
  26. Isern, E.R.; Messing, G.L. Messing. Direct foaming and seeding of highly porous, lightweight gypsum. J. Mater. Res. 2016, 31, 2244–2251. [Google Scholar] [CrossRef]
  27. Mortada, N.; Phelipot-Mardelé, A.; Lanos, C. Impact of surfactant type on performances of gypsum foams. In CIGOS 2021, Emerging Technologies and Applications for Green Infrastructure: Proceedings of the 6th International Conference on Geotechnics, Civil Engineering and Structures, Ha Long, Vietnam, 28–29 October 2021; Springer: Singapore, 2022. [Google Scholar]
  28. Feng, J.; Chen, H.; Zhou, M.; Wang, X.; Yang, Q.; Wang, L.; Song, C. Discussion on the compatibility of gypsum board admixtures. In Proceedings of the China Building Materials Federation Gypsum Building Materials Branch (Preparation) Annual Meeting and the Fourth National Gypsum Technology Exchange Conference and Exhibition Proceedings, Wuhan, China, 19 April 2009; Gypsum Building Materials Branch of China Building Materials Federation (in preparation), Editorial Department of Gypsum Building Materials: Beijing, China; Technology Center of Beijing New Group Building Materials Co., Ltd.: Beijing, China, 2009. [Google Scholar]
  29. Xing, T.; Qu, S.; Wu, J. Main factors influencing the batching process of gypsum board. New Build. Mater. 2021, 48, 109–112. [Google Scholar]
  30. Shen, R. Interaction of admixtures in the production of gypsum board on paper. Juye 2014, 7, 59–63. [Google Scholar]
  31. Zeng, Z.; Zhao, Z.; Quan, S.; Wu, J.; Liang, Y.; Luan, Y. Study on Compatibility between Superplasticizer and Phosphor Building Gypsum-Based Cementitious Material. Non-Met. Mines 2017, 40, 32–35. [Google Scholar]
  32. Gao, F.; Zhao, Z.; Quan, S.; Zhang, W.; Yao, Y.; Luan, Y. Different Water Reducing Agents on the Properties of beta Type Building Phosphogypsum. Bull. Chin. Ceram. Soc. 2017, 36, 960–964+978. [Google Scholar]
  33. Zhang, Y.; Dai, S.; Ma, B.; Sun, Z.; Li, Y. Study on the regulation of slurry rheology in EPS-phosphogypsum composite system. Bull. Chin. Ceram. 2020, 39, 206–212+218. [Google Scholar]
  34. Wang, J. Preparation and Basic Properties of Foamed Phosphogypsum Lightweight Materials; Harbin Institute of Technology: Harbin, China, 2016. [Google Scholar]
  35. Zheng, J.; Wang, Z.; Liu, Y. GB/T 9776—2008 Revision Instructions for Building Gypsum. New Build. Mater. 2009, 36, 13–16. [Google Scholar]
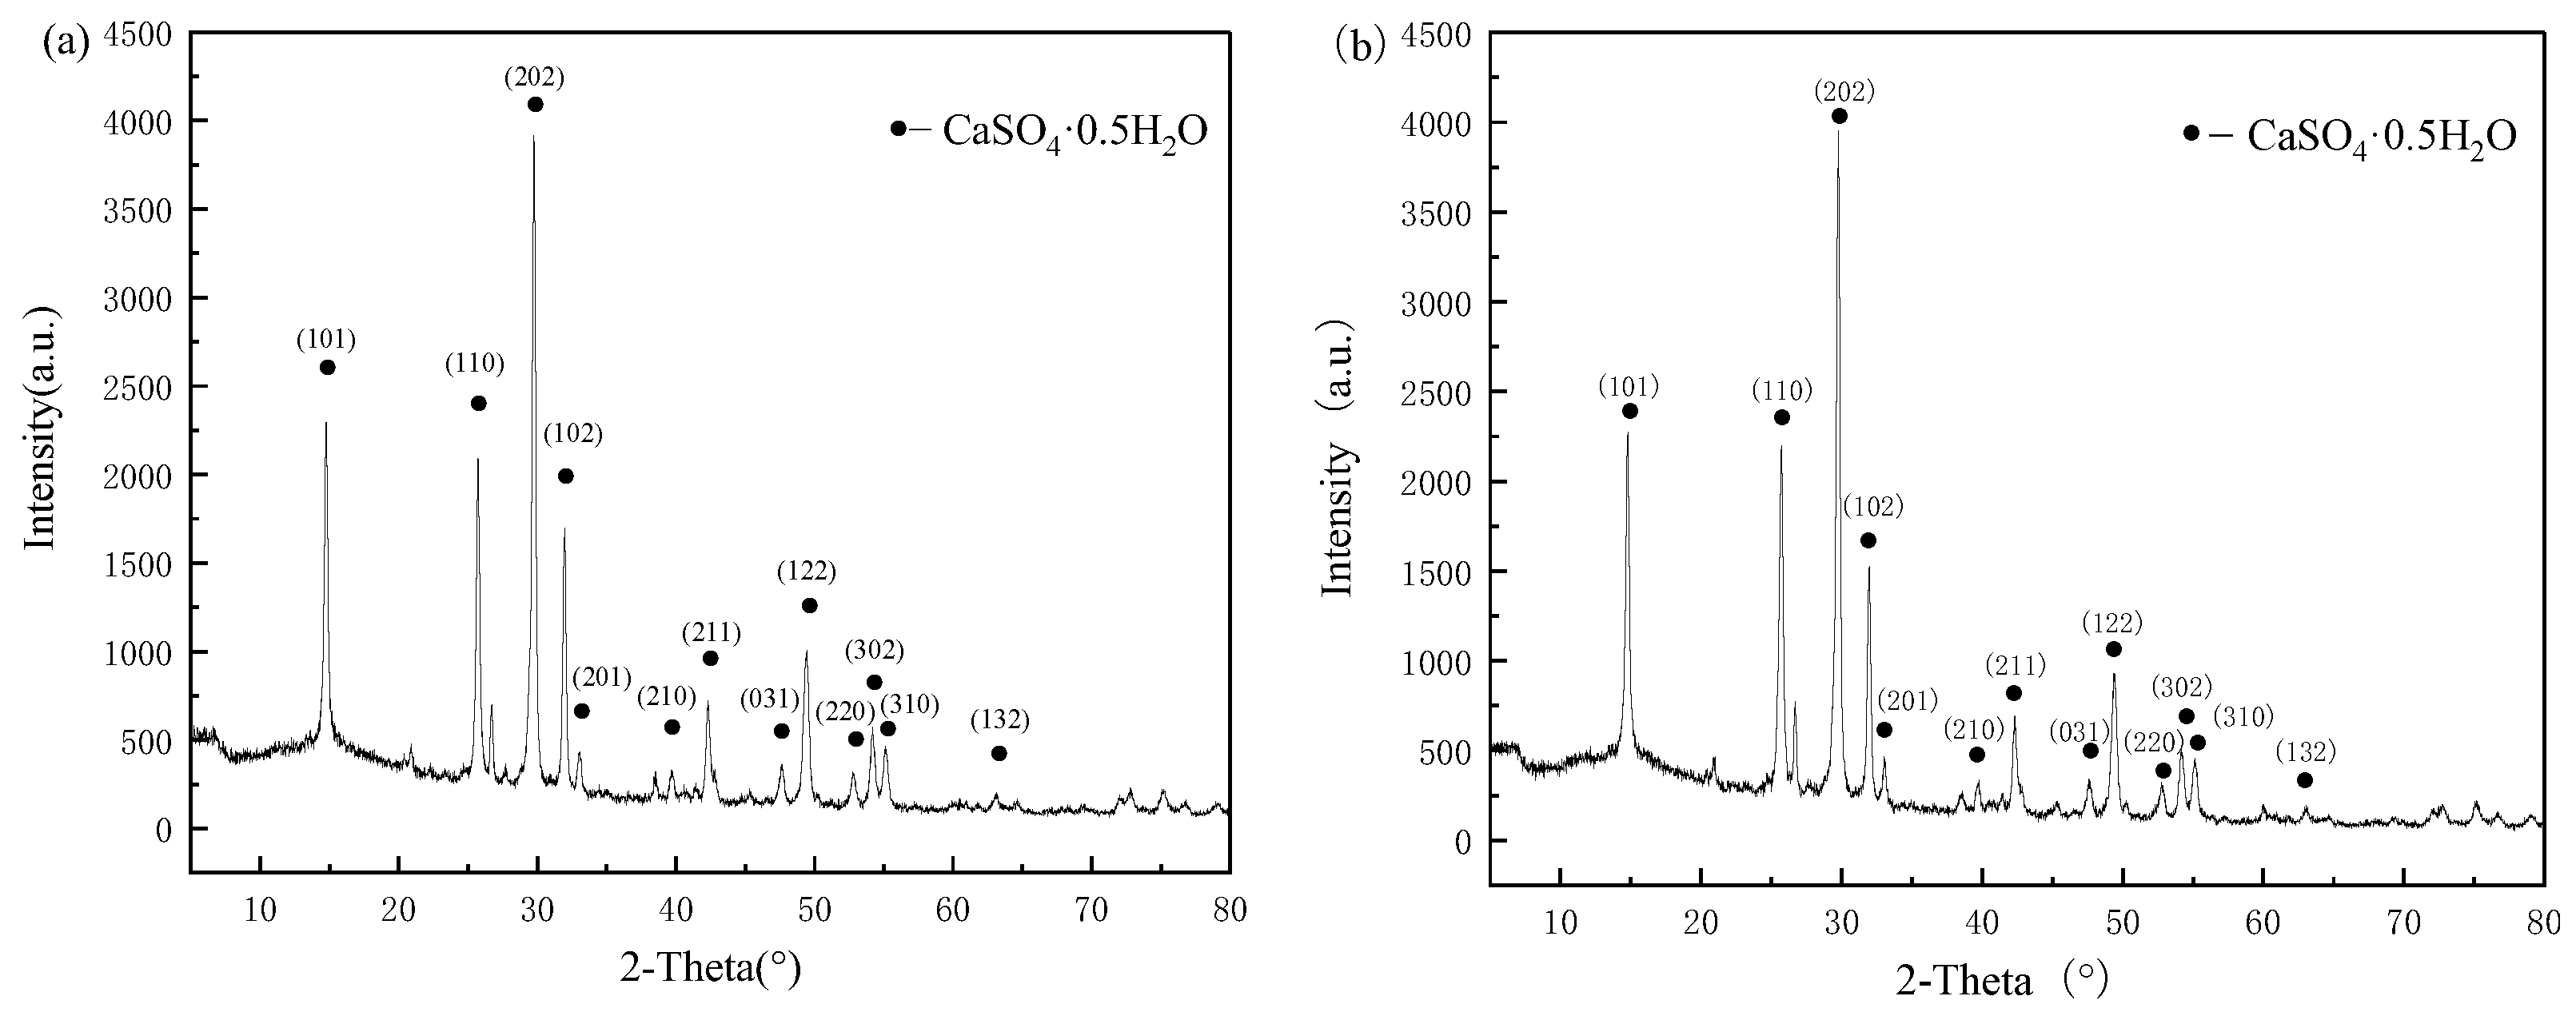
Figure 1. XRD patterns of the phosphogypsum samples. (a) Phosphogypsum A. (b) Phosphogypsum B.
Applsci 14 08147 g001
Figure 2. SEM image of a phosphogypsum samples.
Applsci 14 08147 g002
Figure 3. Particle size distribution curves of the phosphogypsum samples. (a) Phosphogypsum A. (b) Phosphogypsum B.
Applsci 14 08147 g003
Figure 4. Flowchart of the foamed phosphogypsum sample preparation.
Applsci 14 08147 g004
Figure 5. Dry densities of the foamed phosphogypsum samples with different water-reducing agent dosages. (a) Phosphogypsum A. (b) Phosphogypsum B.
Applsci 14 08147 g005
Figure 6. Apparent viscosity curves of the phosphogypsum slurries mixed with different water-reducing agents. (a) Phosphogypsum A doped with FDN. (b) Phosphogypsum A doped with PCE. (c) Phosphogypsum B doped with FDN. (d) Phosphogypsum B doped with PCE.
Applsci 14 08147 g006aApplsci 14 08147 g006b
Figure 7. Shear stress curves of the phosphogypsum slurries mixed with different water-reducing agents. (a) Phosphogypsum A doped with FDN. (b) Phosphogypsum A doped with PCE. (c) Phosphogypsum B doped with FDN. (d) Phosphogypsum B doped with PCE.
Applsci 14 08147 g007
Figure 8. Pore size distribution curves of the foamed phosphogypsum samples mixed with different water-reducing agents. (a) Phosphogypsum A doped with FDN. (b) Phosphogypsum A doped with PCE. (c) Phosphogypsum B doped with FDN. (d) Phosphogypsum B doped with PCE.
Applsci 14 08147 g008aApplsci 14 08147 g008b
Figure 9. Cumulative pore size distribution curves of the foamed phosphogypsum samples mixed with different water-reducing agents. (a) Phosphogypsum A doped with FDN. (b) Phosphogypsum A doped with PCE. (c) Phosphogypsum B doped with FDN. (d) Phosphogypsum B doped with PCE.
Applsci 14 08147 g009
Figure 10. Cross-sectional view of foamed phosphogypsum.
Applsci 14 08147 g010
Table 1. Chemical composition of phosphogypsum powder.
SampleChemical Composition (wt.%)
Na2OMgOAl2O3SiO2P2O5SO3K2OCaOTiO2Fe2O3SrOFOthers
A0.120.220.26.771.0949.80.3439.60.160.510.170.011.01
B0.370.120.775.651.248.90.2140.30.140.420.10.71.12
Table 2. Particle size distribution characteristics of the phosphogypsum samples.
Sampled (0.1; μm)d (0.5; μm)d (0.9; μm)Specific Surface Area (m2/kg)
A2.64819.28439.997963
B3.77631.191128.867660
Table 3. Physical properties of the phosphogypsum samples.
SampleStandard Thickness (%)Initial Setting Time (min)Final Setting Time (min)Two-Hour Flexural Strength (MPa)Absolute Flexural Strength (MPa)Two-Hour Compressive Strength (MPa)Absolute Compressive Flexural Strength (MPa)
A0.763.206.202.74.24.811.8
B0.763.155.202.53.34.39.0
Table 4. Water/gypsum (W/G) ratio and fluidity of the phosphogypsum.
TypeW/C RatioFluidity (mm)
A0.760180
A-0.1%FDN0.690178
A-0.1%PCE0.720178
A-0.2%FDN0.680178
A-0.2%PCE0.700180
A-0.3%FDN0.670180
A-0.3%PCE0.690178
A-0.4%FDN0.660178
A-0.4%PCE0.680178
A-0.5%FDN0.675180
A-0.5%PCE0.695180
B0.760180
B-0.1%FDN0.700178
B-0.1%PCE0.720178
B-0.2%FDN0.670178
B-0.2%PCE0.700180
B-0.3%FDN0.650180
B-0.3%PCE0.690178
B-0.4%FDN0.640178
B-0.4%PCE0.680178
B-0.5%FDN0.660180
B-0.5%PCE0.695180
Table 5. Mechanical properties of the foamed phosphogypsum A samples with different water-reducing agent dosages.
SampleDosage of
Water Reducer (%)
Two-Hour Flexural Strength (MPa)Absolute Flexural Strength (MPa)Two-Hour Compressive Strength (MPa)Absolute Compressive Flexural Strength (MPa)
Phosphogypsum A doped with FDN0.10.91.881.422.95
Phosphogypsum A doped with PCE0.10.891.731.362.90
Phosphogypsum A doped with FDN0.20.921.891.433.00
Phosphogypsum A doped with PCE0.20.91.821.382.95
Phosphogypsum A doped with FDN0.30.961.941.493.15
Phosphogypsum A doped with PCE0.30.921.881.443.05
Phosphogypsum A doped with FDN0.40.981.961.523.25
Phosphogypsum A doped with PCE0.40.941.921.473.15
Phosphogypsum A doped with FDN0.50.941.921.463.10
Phosphogypsum A doped with PCE0.50.911.851.413.00
Table 6. Mechanical properties of the foamed phosphogypsum B samples with different water-reducing agent dosages.
SampleDosage of
Water Reducer (%)
Two-Hour Flexural Strength (MPa)Absolute Flexural Strength (MPa)Two-Hour Compressive Strength (MPa)Absolute Compressive Flexural Strength (MPa)
Phosphogypsum B doped with FDN0.10.731.161.12.13
Phosphogypsum B doped with PCE0.10.691.051.081.84
Phosphogypsum B doped with FDN0.20.741.171.152.16
Phosphogypsum B doped with PCE0.20.701.11.102.06
Phosphogypsum B doped with FDN0.30.81.291.232.33
Phosphogypsum B doped with PCE0.30.721.211.142.14
Phosphogypsum B doped with FDN0.40.821.481.282.60
Phosphogypsum B doped with PCE0.40.731.251.162.20
Phosphogypsum B doped with FDN0.50.771.231.192.22
Phosphogypsum B doped with PCE0.50.711.161.122.10
Disclaimer/Publisher’s Note: The statements, opinions and data contained in all publications are solely those of the individual author(s) and contributor(s) and not of MDPI and/or the editor(s). MDPI and/or the editor(s) disclaim responsibility for any injury to people or property resulting from any ideas, methods, instructions or products referred to in the content.