

Machine Learning for Prediction of Cognitive Deterioration in Patients with Early Parkinson’s Disease

 , , ,
, , ,  , , and
Abstract
:1. Introduction
2. Related Works
3. Materials and Methods
3.1. Database
3.2. Pre-Processing
3.3. Experimental Setup
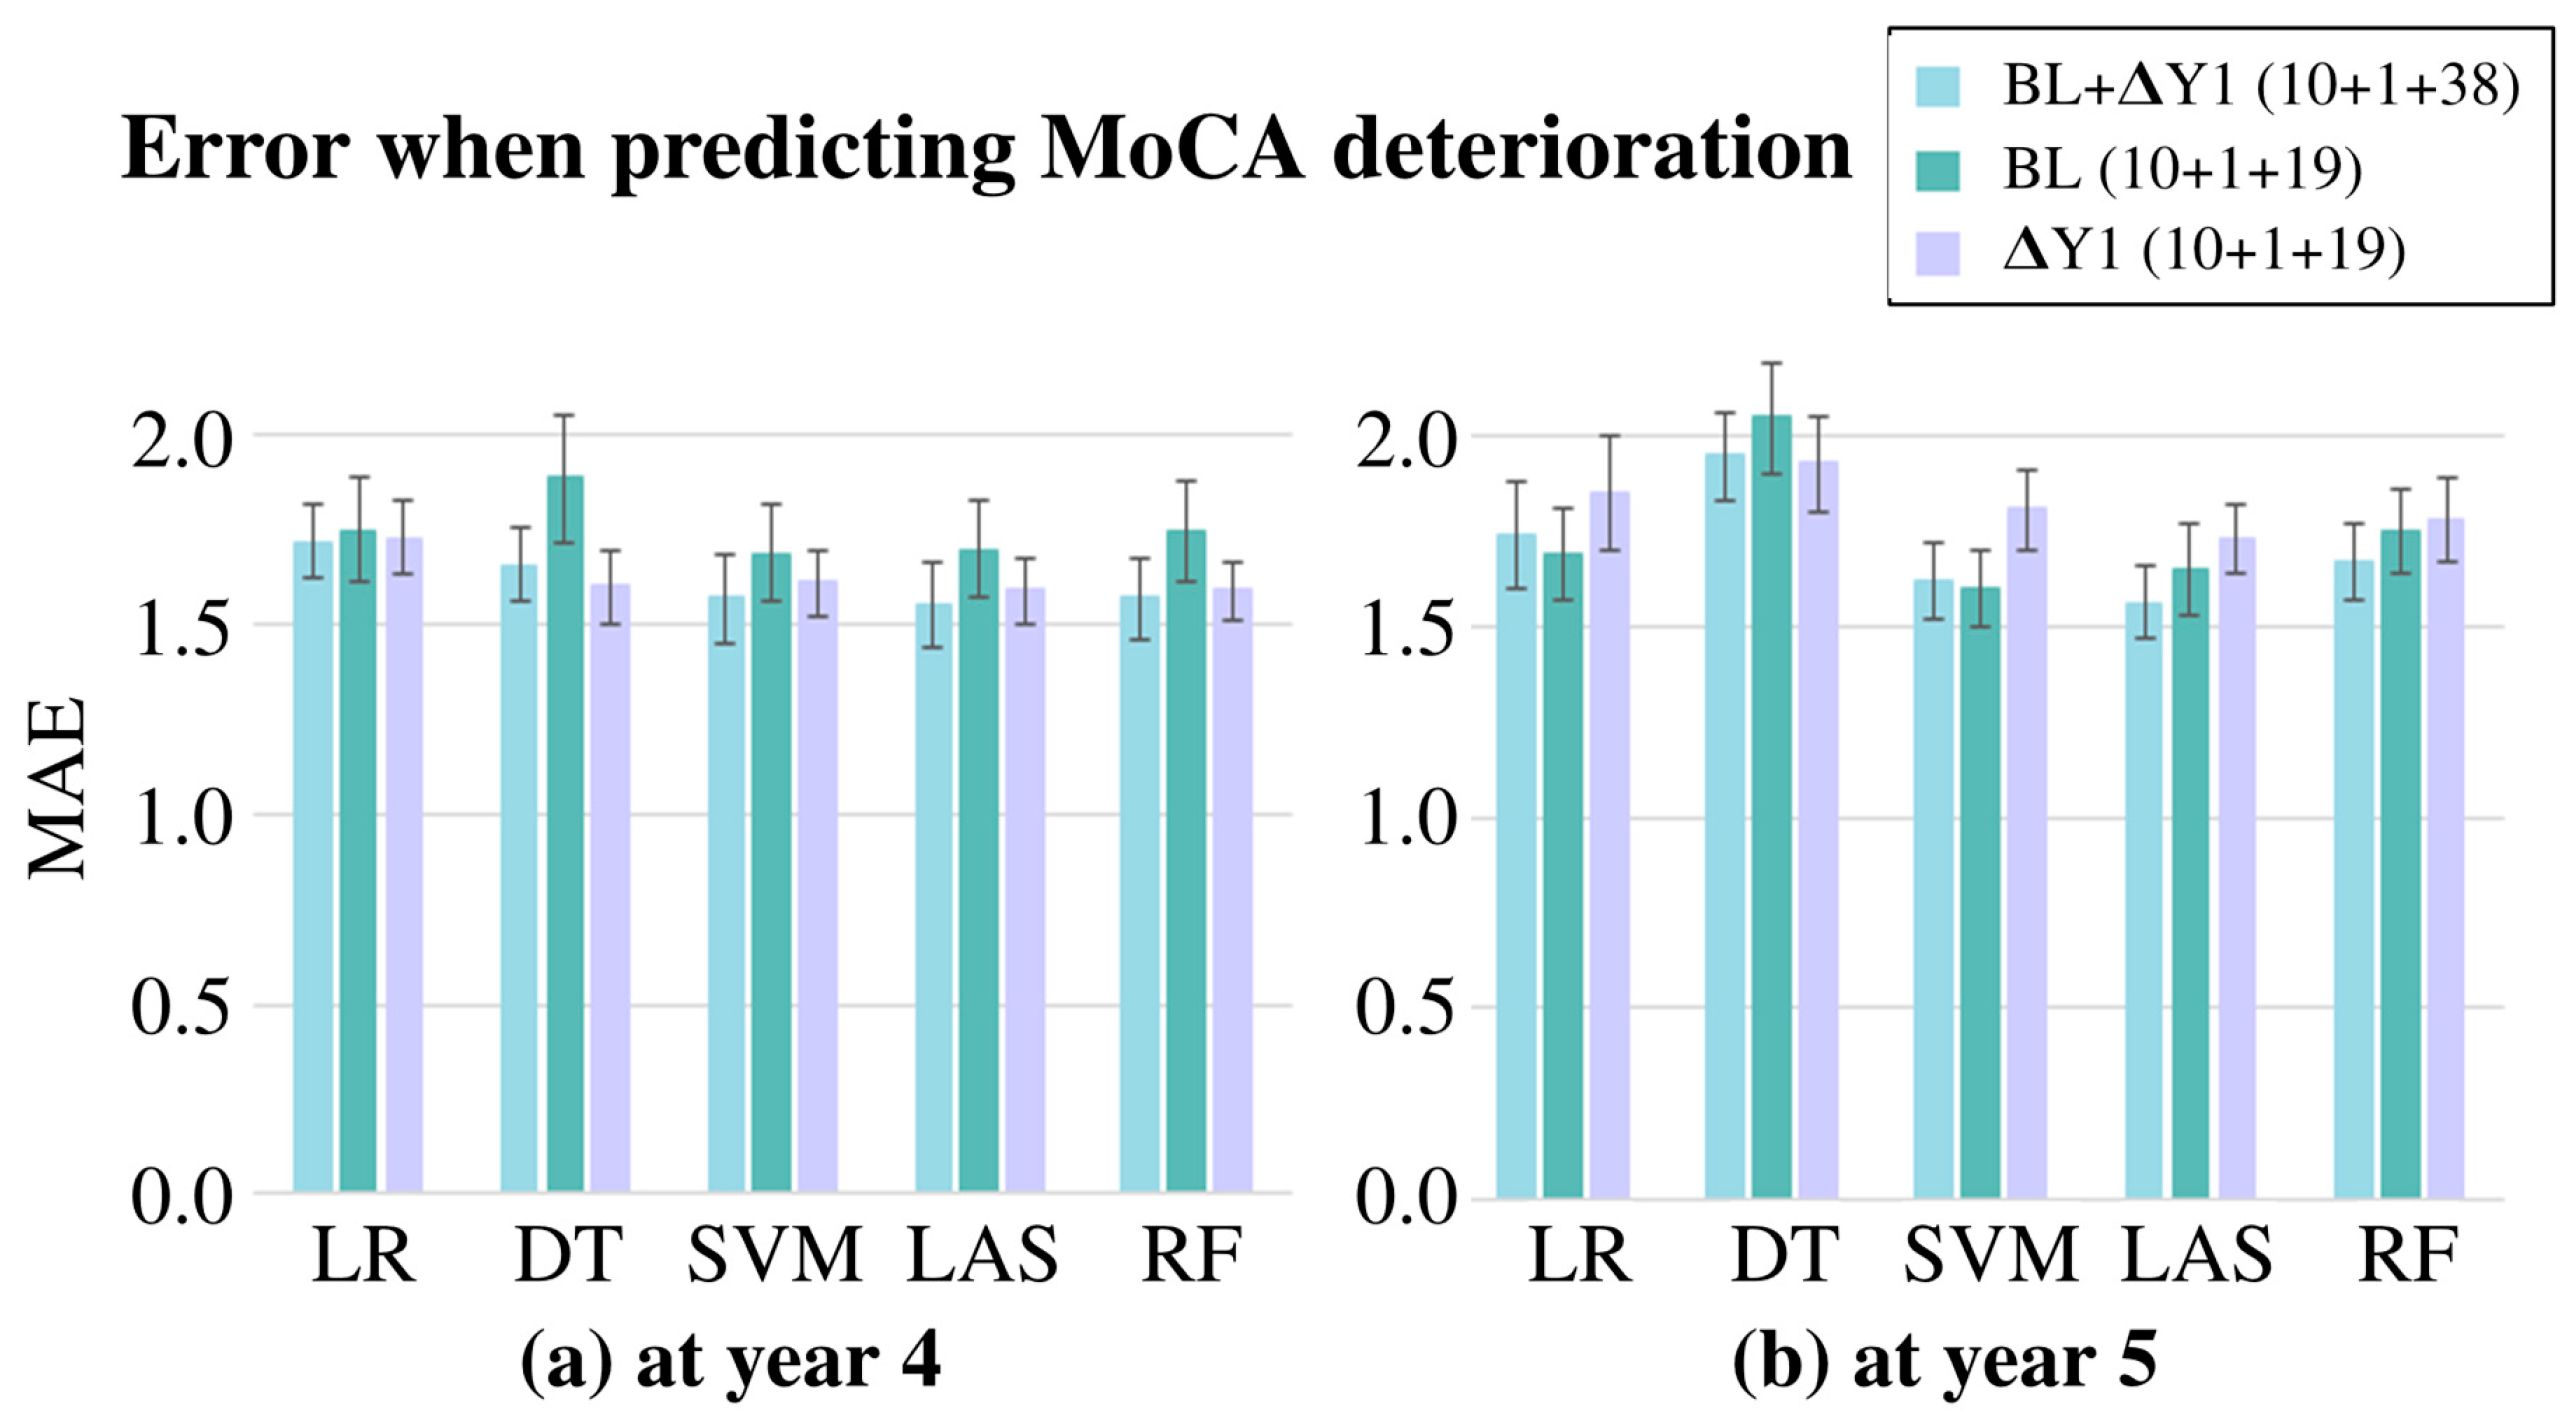
4. Results
5. Discussion
6. Conclusions
Author Contributions
Funding
Institutional Review Board Statement
Informed Consent Statement
Data Availability Statement
Conflicts of Interest
Appendix A. Test and Questionnaires
- The University of Pennsylvania Smell Identification Test (UPSIT) is a standardized test used to evaluate a person’s sense of smell. It consists of 40 microencapsulated odorants embedded in a “scratch and sniff” booklet. The subject must identify each odorant from a list of four possible choices.
- The Movement Disorder Society-Unified Parkinson’s Disease Rating Scale (MDS-UPDRS) is a clinical tool used to assess the motor and non-motor symptoms of PD. It consists of four parts: Part I evaluates non-motor experiences of daily living, Part II assesses motor experiences of daily living, Part III is a motor examination, and Part IV evaluates motor complications related to treatment.
- The Hoehn and Yahr (HY) scale is a system commonly used to describe the progression of PD based on the severity of symptoms. It classifies the disease into five stages, ranging from Stage 1 (unilateral involvement only) to Stage 5 (wheelchair-bound or bedridden unless aided).
- The Rapid Eye Movement Sleep Behavior Disorder Screening Questionnaire (RBDSQ) is used to assess the presence and severity of the Rapid Eye Movement (REM) sleep behavior disorder (RBD), a condition characterized by the absence of normal muscle paralysis during REM sleep, leading to movements and behaviors during sleep that can be harmful. The RBDSQ consists of 10 questions related to RBD symptoms and behaviors, with a score calculated based on the responses.
- The Epworth Sleepiness Scale (ESS) is a questionnaire used to assess a person’s likelihood of falling asleep during various daily activities. The individual rates their likelihood of falling asleep in eight different situations on a scale of 0–3.
- The Scale for Outcomes in Parkinson’s Disease - Autonomic (SCOPA-AUT) is a clinical assessment tool used to evaluate the severity of autonomic dysfunction in PD patients. It consists of 25 items assessing symptoms related to autonomic function, including cardiovascular, gastrointestinal, genitourinary, thermoregulatory, and pupillomotor functions.
- The Hopkins Verbal Learning Test-Revised (HVLT-R) is a neuropsychological test used to assess verbal memory and learning abilities. It involves the presentation of 12 words over three learning trials, followed by a delayed recall trial after 20–30 min and a recognition trial where the patient identifies the previously presented words from a list that includes distractors.
- The Benton Judgement of Line Orientation Test (BJLOT) is a neuropsychological assessment that measures an individual’s ability to perceive and reproduce the orientation of lines in space. The test consists of 30 black-and-white illustrations of line pairs, with the individual asked to match the angles to one of several response options.
- The Semantic Fluency Test (SFT) is a neuropsychological test that assesses a person’s ability to produce words belonging to a specific category, such as animals or fruits.
- Letter Number Sequencing (LNS) is a cognitive assessment test that evaluates an individual’s working memory and attention. The examiner reads a series of alternating letters and numbers aloud, and the individual is then asked to repeat them back in numerical and alphabetical order.
- The Symbol Digit Modalities Test (SDMT) is a neuropsychological test that assesses cognitive processing speed and attention. The subject is given a key that pairs specific numbers with corresponding abstract symbols. They are then presented with a series of symbols and asked to match each symbol to its corresponding number as quickly and accurately as possible within a fixed time frame.
- The State-Trait Anxiety Inventory (STAI) is a psychological assessment tool used to measure anxiety in individuals. The inventory consists of two sets of 20 items each, measuring two different aspects of anxiety: State Anxiety, which refers to an individual’s current feelings of anxiety, and Trait Anxiety, which refers to their general tendency to be anxious across different situations.
- The Geriatric Depression Scale (GDS) is a screening tool used to identify depression in older adults. It consists of 30 yes/no questions that evaluate the presence and severity of depressive symptoms, such as feelings of sadness or worthlessness, a loss of interest in activities, and changes in appetite and sleep patterns.
- The Questionnaire for Impulsive-Compulsive Disorders (QUIP) is a self-administered questionnaire that assesses the presence and severity of symptoms related to impulse control disorders and compulsive behaviors in individuals with PD. The QUIP consists of 19 questions that evaluate the presence of four types of behaviors: pathological gambling, hypersexuality, compulsive buying, and binge eating.
Appendix B. Hyperparameters
- The function used to evaluate the quality of a split is referred to as the criterion. Its supported criteria include squared_error, which calculates the mean squared error equivalent to the variance reduction and minimizes the L2 loss by using the mean of each terminal node. Another criterion is friedman_mse, which computes the mean squared error while incorporating Friedman’s improvement score for evaluating potential splits. Lastly, absolute_error determines the mean absolute error and minimizes the L1 loss by using the median of each terminal node.
- The maximum depth of the tree (max_depth) specifies how deep the tree can grow. If set to None, the tree will continue to expand until all leaves are pure or until each leaf has fewer than the specified min_samples_split samples (see below). Alternately, the tree depth can be explicitly set to values such as 2, 4, 6, 8, or 10.
- The Max_features hyperparameter determines the number of features to evaluate when identifying the optimal split. If set to None, all features are considered. If set to sqrt, then max_features is the square root of the total number of features.
- The Min_samples_leaf hyperparameter specifies the minimum number of samples that must be present in a leaf node. The possible values were 1, 2, or 4.
- The Min_samples_split hyperparameter defines the minimum number of samples necessary to divide an internal node. The options for this setting were 2, 5, or 10.
- The kernel type, which transforms the input data into higher-dimensional spaces. The polynomial kernel, denoted as poly, raises the input features to a specified degree, allowing the SVM to learn complex, non-linear decision boundaries. The Radial Basis Function (RBF) kernel, or rbf, measures the distance between samples in a Gaussian-distributed space, effectively managing non-linear separations even when the data have no clear boundaries. Lastly, the sigmoid kernel mimics the behavior of a neural network’s activation function, transforming the feature space according to a logistic function.
- The kernel coefficient, known as gamma, which has possible values of 1, 0.1, 0.01, and 0.001
- The regularization parameter, referred to as C, with choices of 0.1, 1, 10, and 100.
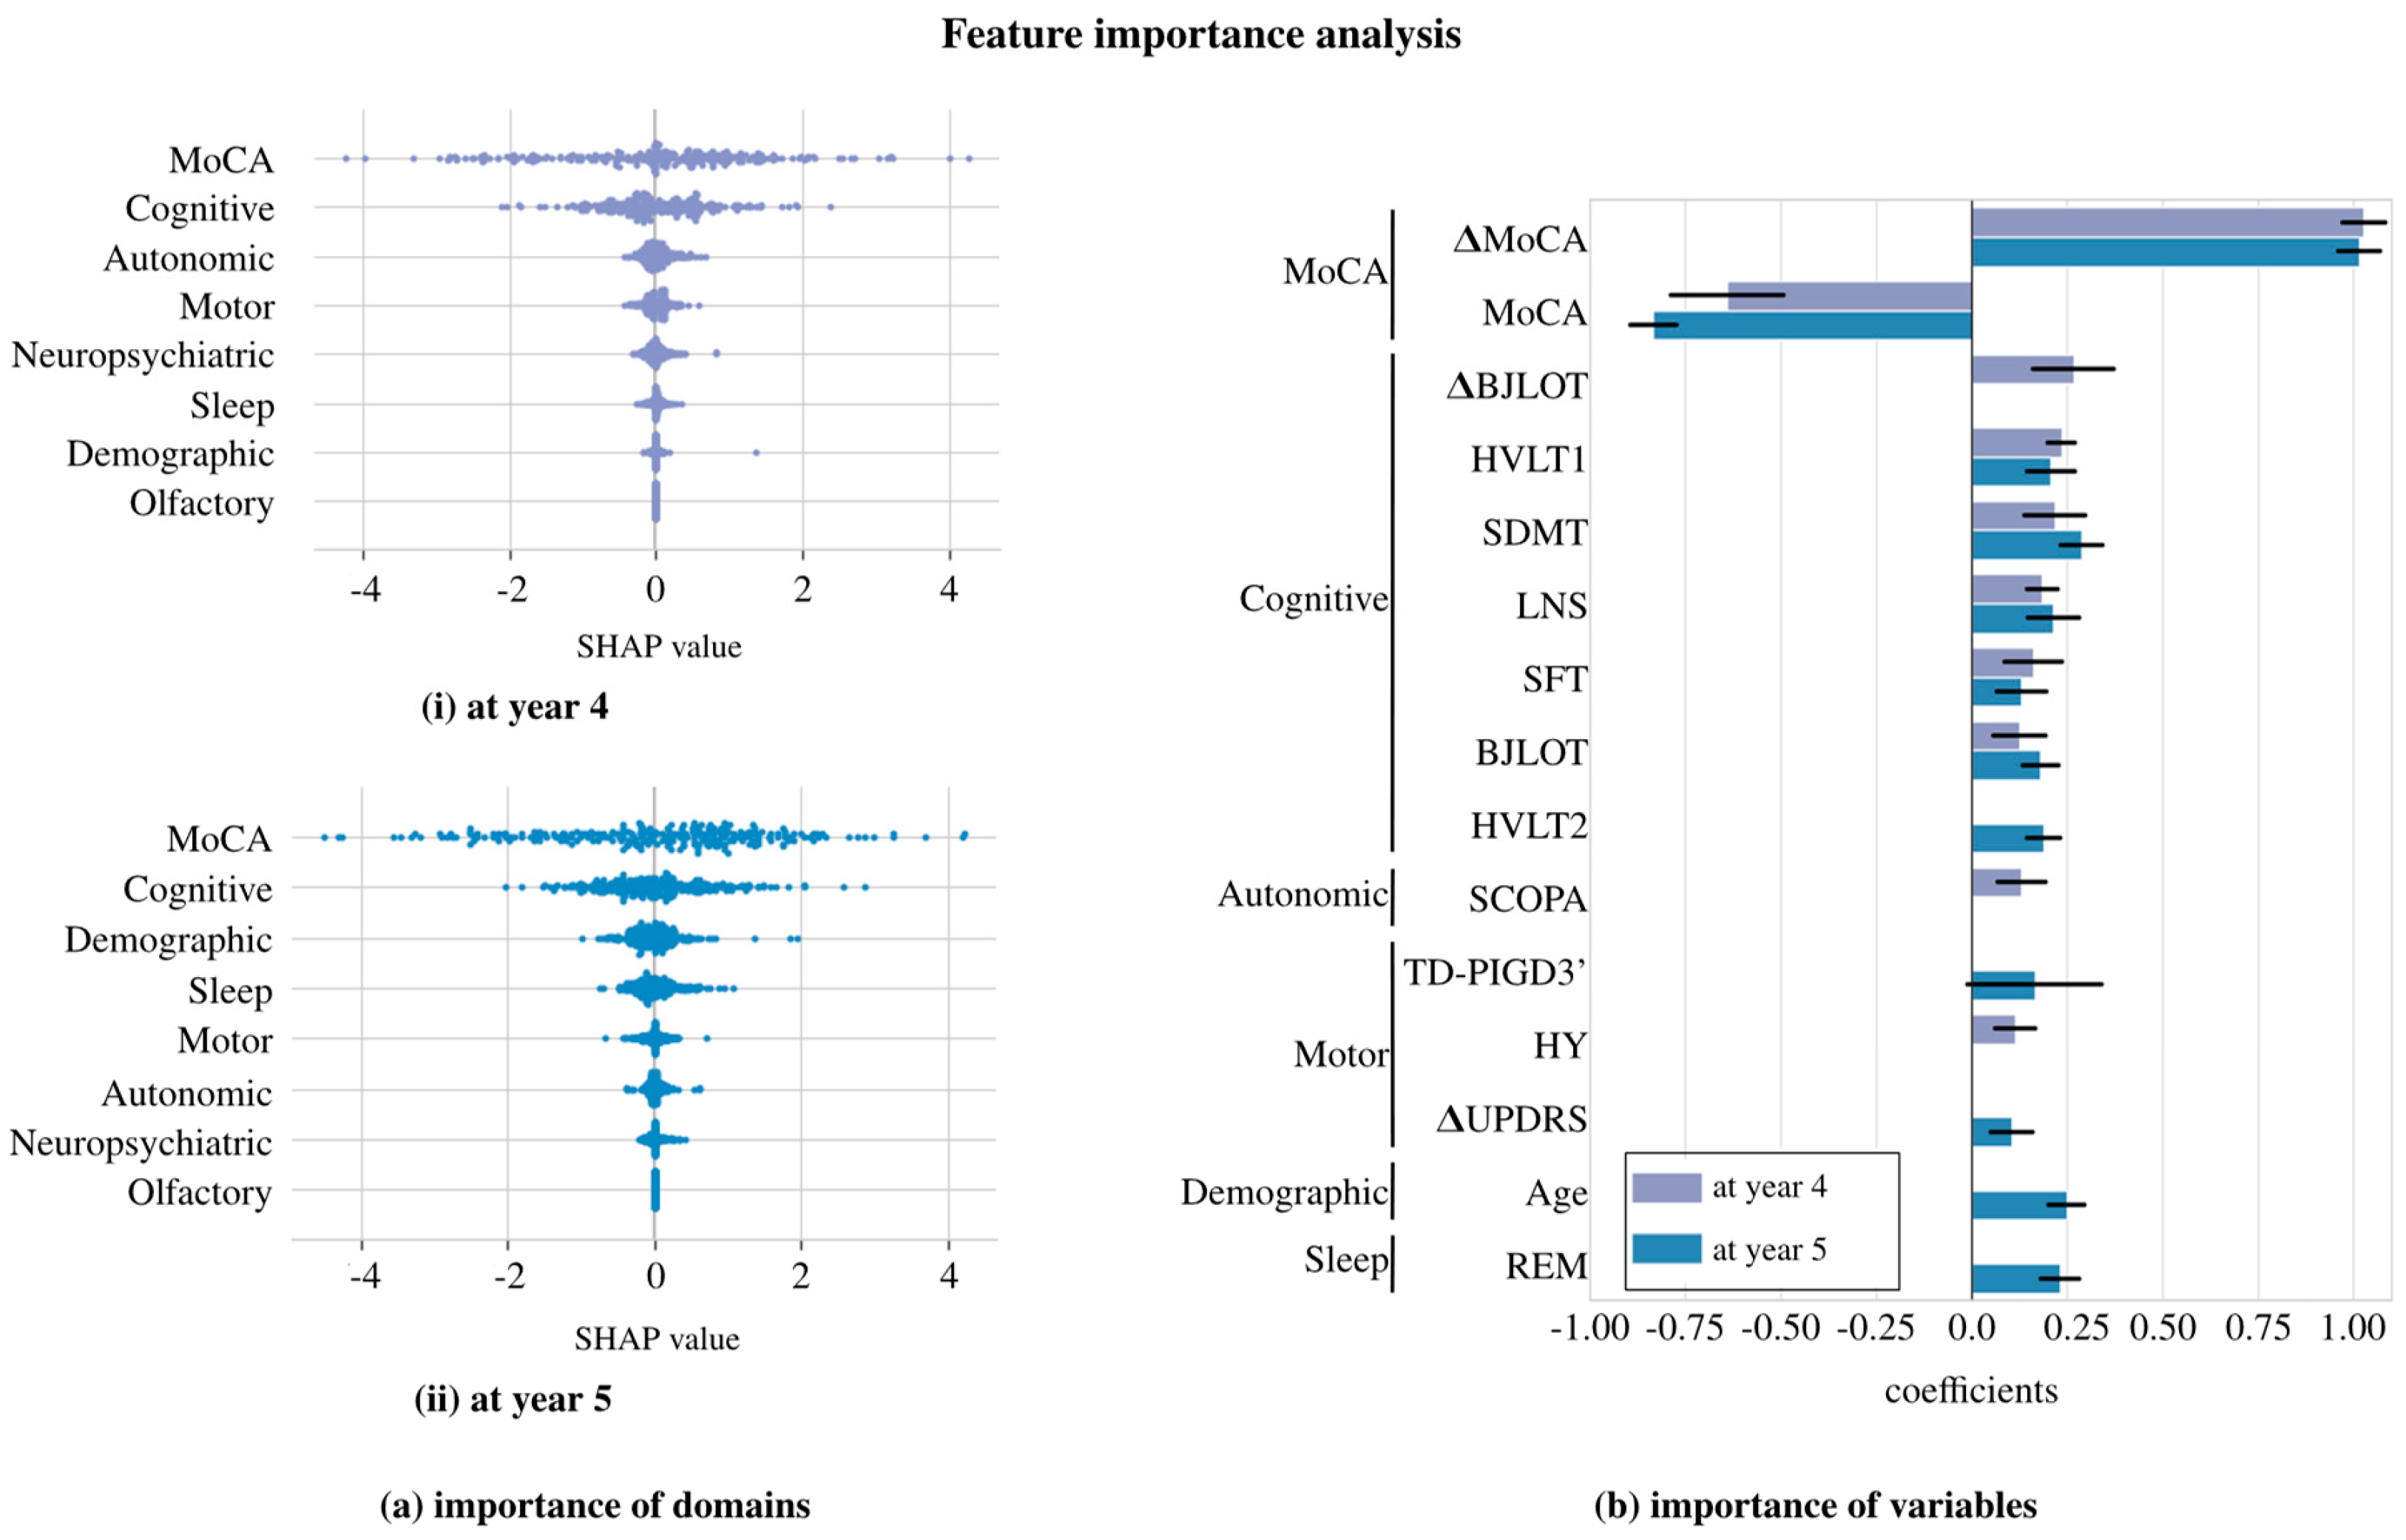
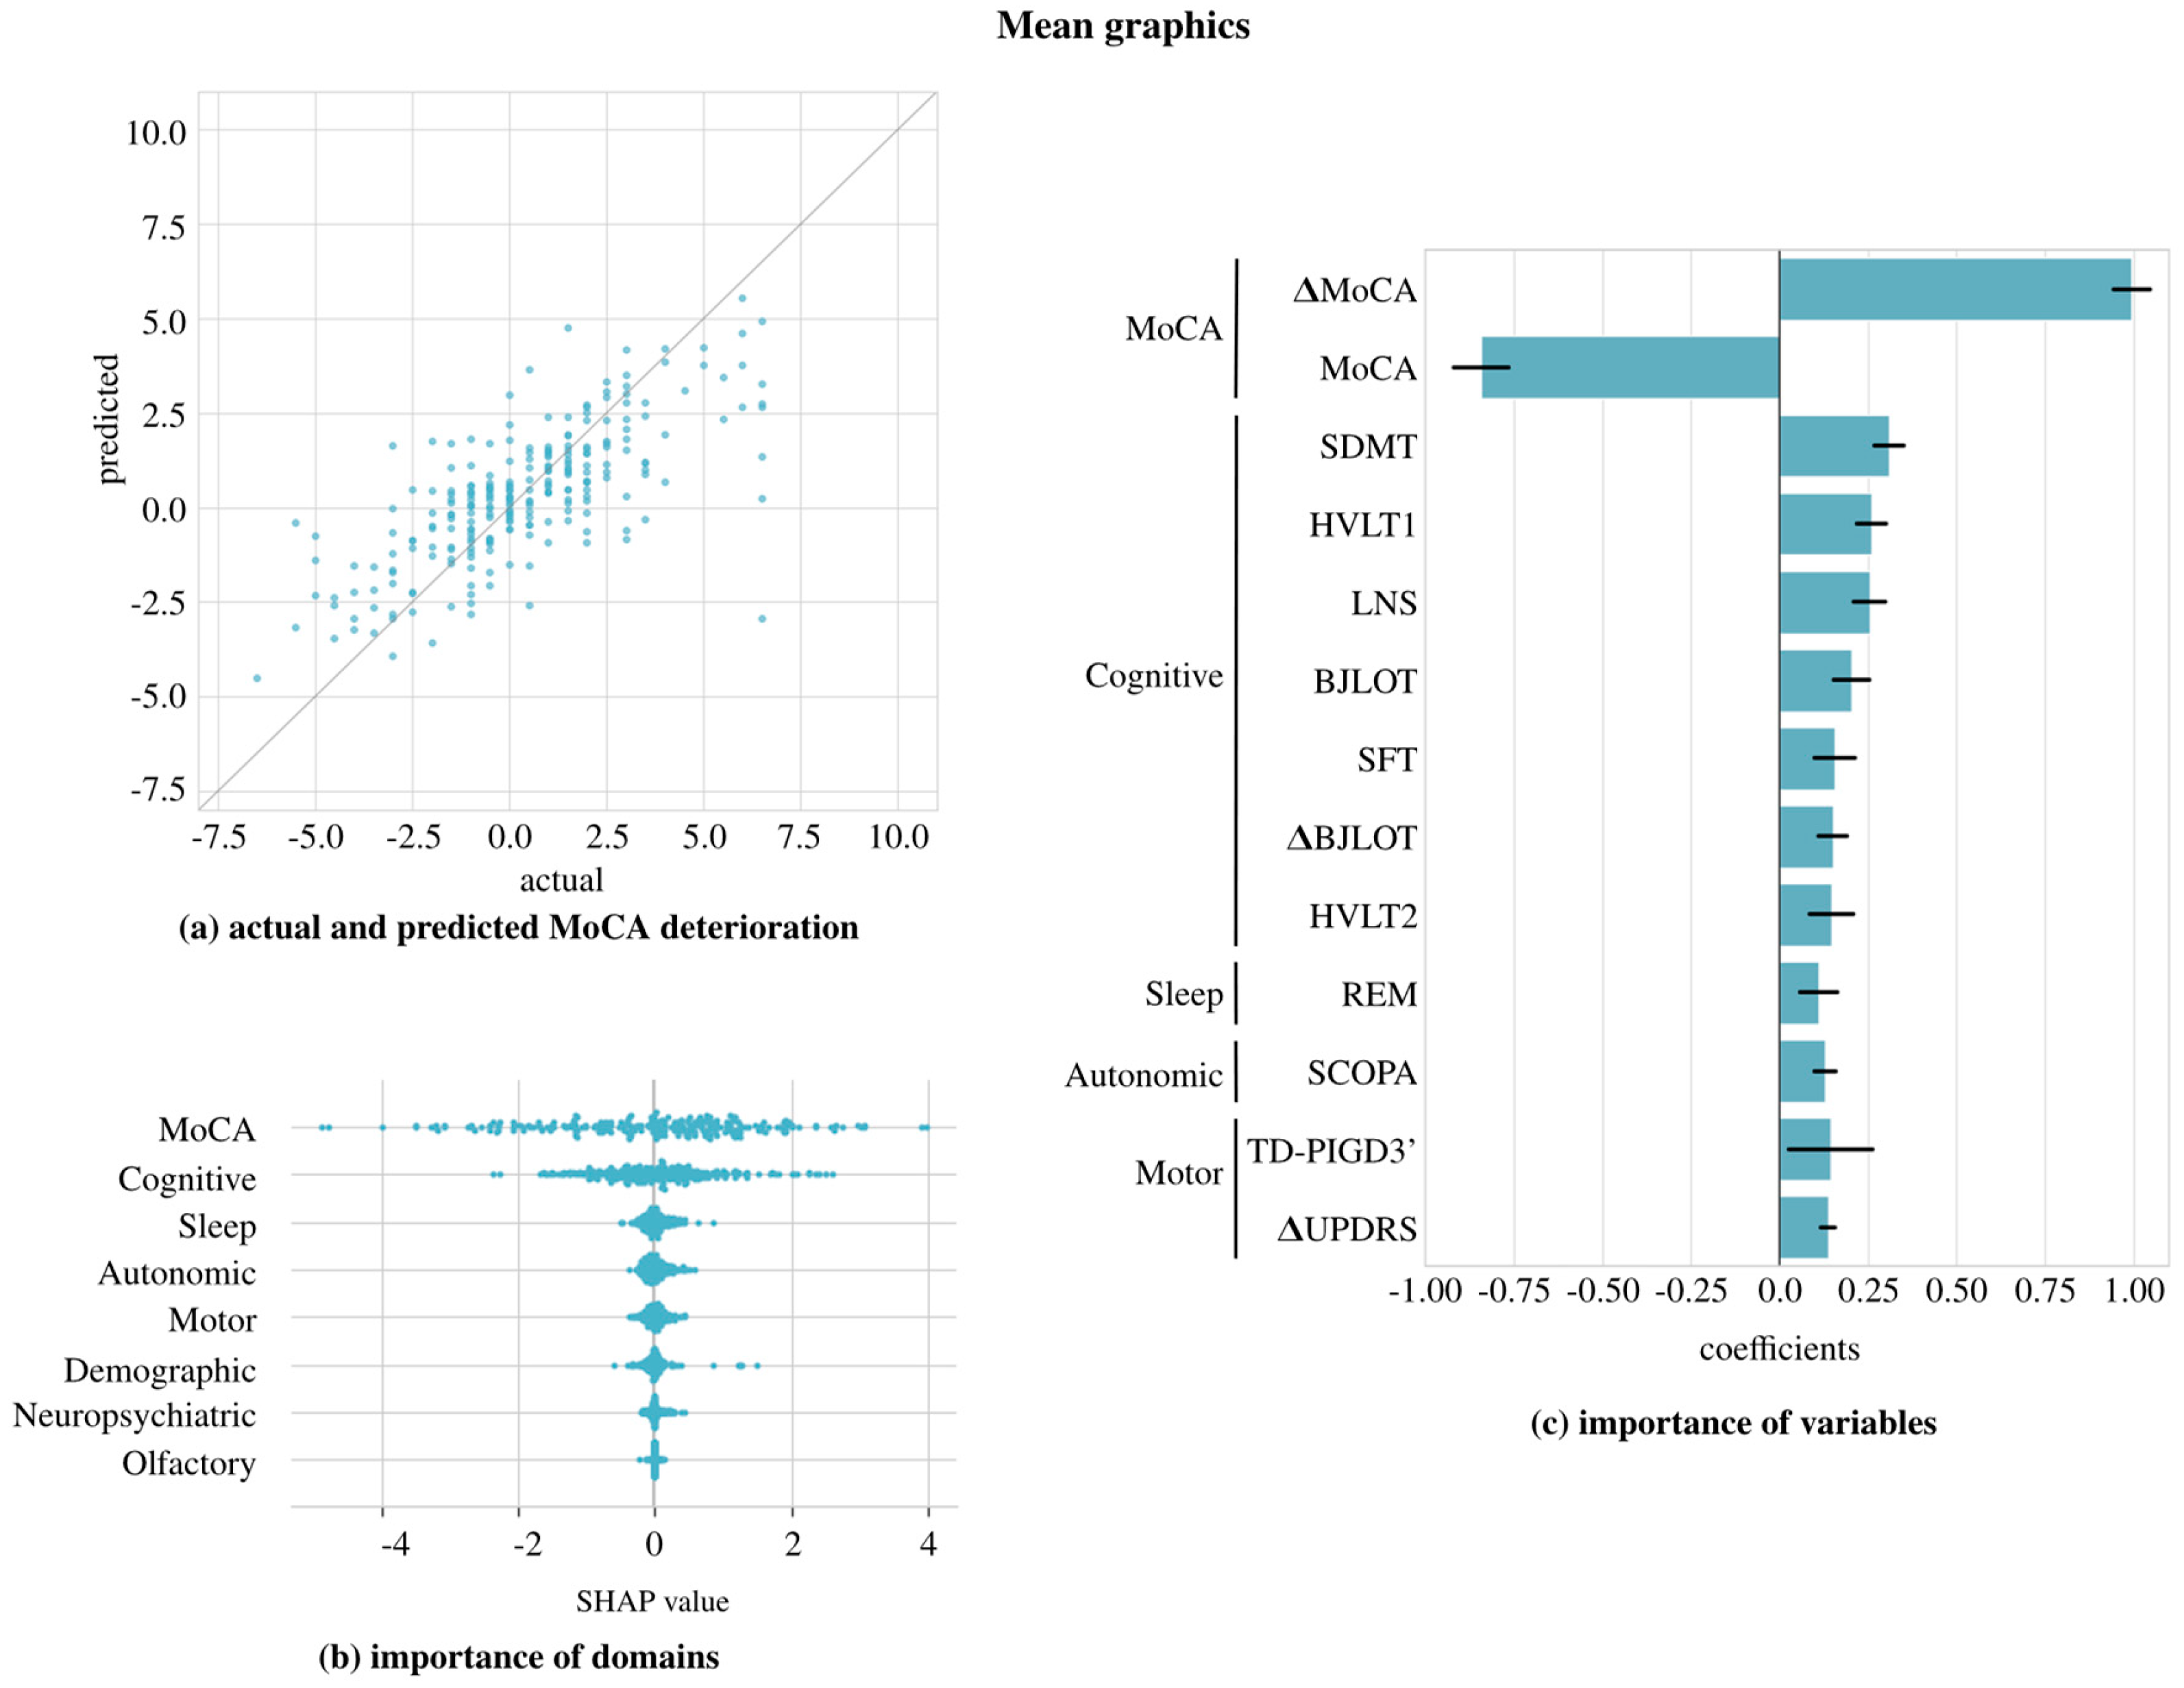
Appendix C. SHAP
References
- Arshad, H.; Tayyab, M.; Bilal, M.; Akhtar, S.; Abdullahi, A. Trends and Challenges in harnessing big data intelligence for health care transformation. Artif. Intell. Intell. Syst. 2024, 220–240. [Google Scholar] [CrossRef]
- Aarsland, D.; Andersen, K.; Larsen, J.; Lolk, A.; Nielsen, H.; Kragh-Sørensen, P. Risk of dementia in Parkinson’s disease: A community-based, prospective study. Neurology 2001, 56, 730–736. [Google Scholar] [CrossRef] [PubMed]
- Aarsland, D.; Kurz, M.W. The epidemiology of dementia associated with Parkinson’s disease. Brain Pathol. 2010, 20, 633–639. [Google Scholar] [CrossRef] [PubMed]
- Aarsland, D.; Batzu, L.; Halliday, G.M.; Geurtsen, G.J.; Ballard, C.; Ray Chaudhuri, K.; Weintraub, D. Parkinson disease-associated cognitive impairment. Nat. Rev. Dis. Prim. 2021, 7, 47. [Google Scholar] [CrossRef] [PubMed]
- Hoops, S.; Nazem, S.; Siderowf, A.; Duda, J.; Xie, S.; Stern, M.; Weintraub, D. Validity of the MoCA and MMSE in the detection of MCI and dementia in Parkinson disease. Neurology 2009, 73, 1738–1745. [Google Scholar] [CrossRef] [PubMed]
- Gramotnev, G.; Gramotnev, D.K.; Gramotnev, A. Parkinson’s disease prognostic scores for progression of cognitive decline. Sci. Rep. 2019, 9, 17485. [Google Scholar] [CrossRef] [PubMed]
- Nguyen, A.A.; Maia, P.D.; Gao, X.; Damasceno, P.F.; Raj, A. Dynamical role of pivotal brain regions in Parkinson symptomatology uncovered with deep learning. Brain Sci. 2020, 10, 73. [Google Scholar] [CrossRef] [PubMed]
- Marek, K.; Jennings, D.; Lasch, S.; Siderowf, A.; Tanner, C.; Simuni, T.; Coffey, C.; Kieburtz, K.; Flagg, E.; Chowdhury, S.; et al. The Parkinson progression marker initiative (PPMI). Prog. Neurobiol. 2011, 95, 629–635. [Google Scholar] [CrossRef]
- Harvey, J.; Reijnders, R.A.; Cavill, R.; Duits, A.; Köhler, S.; Eijssen, L.; Rutten, B.P.; Shireby, G.; Torkamani, A.; Creese, B.; et al. Machine learning-based prediction of cognitive outcomes in de novo Parkinson’s disease. npj Park. Dis. 2022, 8, 150. [Google Scholar] [CrossRef]
- Gorji, A.; Fathi Jouzdani, A. Machine learning for predicting cognitive decline within five years in Parkinson’s disease: Comparing cognitive assessment scales with DAT SPECT and clinical biomarkers. PLoS ONE 2024, 19, e0304355. [Google Scholar] [CrossRef]
- Salmanpour, M.R.; Shamsaei, M.; Saberi, A.; Setayeshi, S.; Klyuzhin, I.S.; Sossi, V.; Rahmim, A. Optimized machine learning methods for prediction of cognitive outcome in Parkinson’s disease. Comput. Biol. Med. 2019, 111, 103347. [Google Scholar] [CrossRef] [PubMed]
- Hosseinzadeh, M.; Gorji, A.; Fathi Jouzdani, A.; Rezaeijo, S.M.; Rahmim, A.; Salmanpour, M.R. Prediction of Cognitive decline in Parkinson’s Disease using clinical and DAT SPECT Imaging features, and Hybrid Machine Learning systems. Diagnostics 2023, 13, 1691. [Google Scholar] [CrossRef] [PubMed]
- Almgren, H.; Camacho, M.; Hanganu, A.; Kibreab, M.; Camicioli, R.; Ismail, Z.; Forkert, N.D.; Monchi, O. Machine learning-based prediction of longitudinal cognitive decline in early Parkinson’s disease using multimodal features. Sci. Rep. 2023, 13, 13193. [Google Scholar] [CrossRef] [PubMed]
- Ostertag, C.; Visani, M.; Urruty, T.; Beurton-Aimar, M. Long-term cognitive decline prediction based on multi-modal data using Multimodal3DSiameseNet: Transfer learning from Alzheimer’s disease to Parkinson’s disease. Int. J. Comput. Assist. Radiol. Surg. 2023, 18, 809–818. [Google Scholar] [CrossRef] [PubMed]
- Dalrymple-Alford, J.; MacAskill, M.; Nakas, C.; Livingston, L.; Graham, C.; Crucian, G.; Melzer, T.; Kirwan, J.; Keenan, R.; Wells, S.; et al. The MoCA: Well-suited screen for cognitive impairment in Parkinson disease. Neurology 2010, 75, 1717–1725. [Google Scholar] [CrossRef] [PubMed]
- Ojeda, N.; Del Pino, R.; Ibarretxe-Bilbao, N.; Schretlen, D.J.; Pena, J. Montreal Cognitive Assessment Test: Normalization and standardization for Spanish population. Rev. Neurol. 2016, 63, 488–496. [Google Scholar] [CrossRef] [PubMed]
- Deb, K.; Pratap, A.; Agarwal, S.; Meyarivan, T. A fast and elitist multiobjective genetic algorithm: NSGA-II. IEEE Trans. Evol. Comput. 2002, 6, 182–197. [Google Scholar] [CrossRef]
- Martínez-Morales, J.; Palacios, E.; Carrillo, G.V. Modeling of internal combustion engine emissions by LOLIMOT algorithm. Procedia Technol. 2012, 3, 251–258. [Google Scholar] [CrossRef]
- Bergstra, J.; Yamins, D.; Cox, D. Making a science of model search: Hyperparameter optimization in hundreds of dimensions for vision architectures. In Proceedings of the International Conference on Machine Learning, PMLR, Atlanta, GA, USA, 17–19 June 2013; pp. 115–123. Available online: https://proceedings.mlr.press/v28/bergstra13.html (accessed on 11 August 2024).
- Bergstra, J.; Bardenet, R.; Bengio, Y.; Kégl, B. Algorithms for hyper-parameter optimization. Adv. Neural Inf. Process. Syst. 2011, 24, 2546–2554. [Google Scholar] [CrossRef]
- Lundberg, S.M.; Lee, S.I. A unified approach to interpreting model. Adv. Neural Inf. Process. Syst. 2017, 30. [Google Scholar] [CrossRef]


| Data | Values at Baseline | Values at First Year |
|---|---|---|
| Demographic | ||
| Age at enrollment | ||
| Years of education | ||
| Sex (female/male) | (%) / | |
| Family history of PD (1st/ No 1st degree family with PD) | (%) / | |
| Duration of PD from diagnosis to enrollment (months) | ||
| Race (white/black/ asian/other) | (%) // / | |
| Olfactory | ||
| UPSIT score | ||
| Motor (in OFF stage) | ||
| MDS-UPDRS I, II, and III score | ||
| TD-PIGD classification (TD/PIGD/Indeterminate) | (%) // | (%) // |
| HY Stage (1/2) | (%) / | (%) / |
| Sleep | ||
| RBDSQ score | ||
| ESS score | ||
| Autonomic | ||
| SCOPA-AUT score | ||
| Cognitive | ||
| MoCA score (adjusted for education) | ||
| HVLT-R immediate/ total recall | ||
| HVLT-R discrimination recognition | ||
| HVLT-R retention | ||
| BJLOT score | ||
| SFT score | ||
| LNS score | ||
| SDMT score | ||
| Neuropsychiatric | ||
| STAI score | ||
| GDS score | ||
| QUIP score |
| Year 4 | Year 5 | Mean | |
|---|---|---|---|
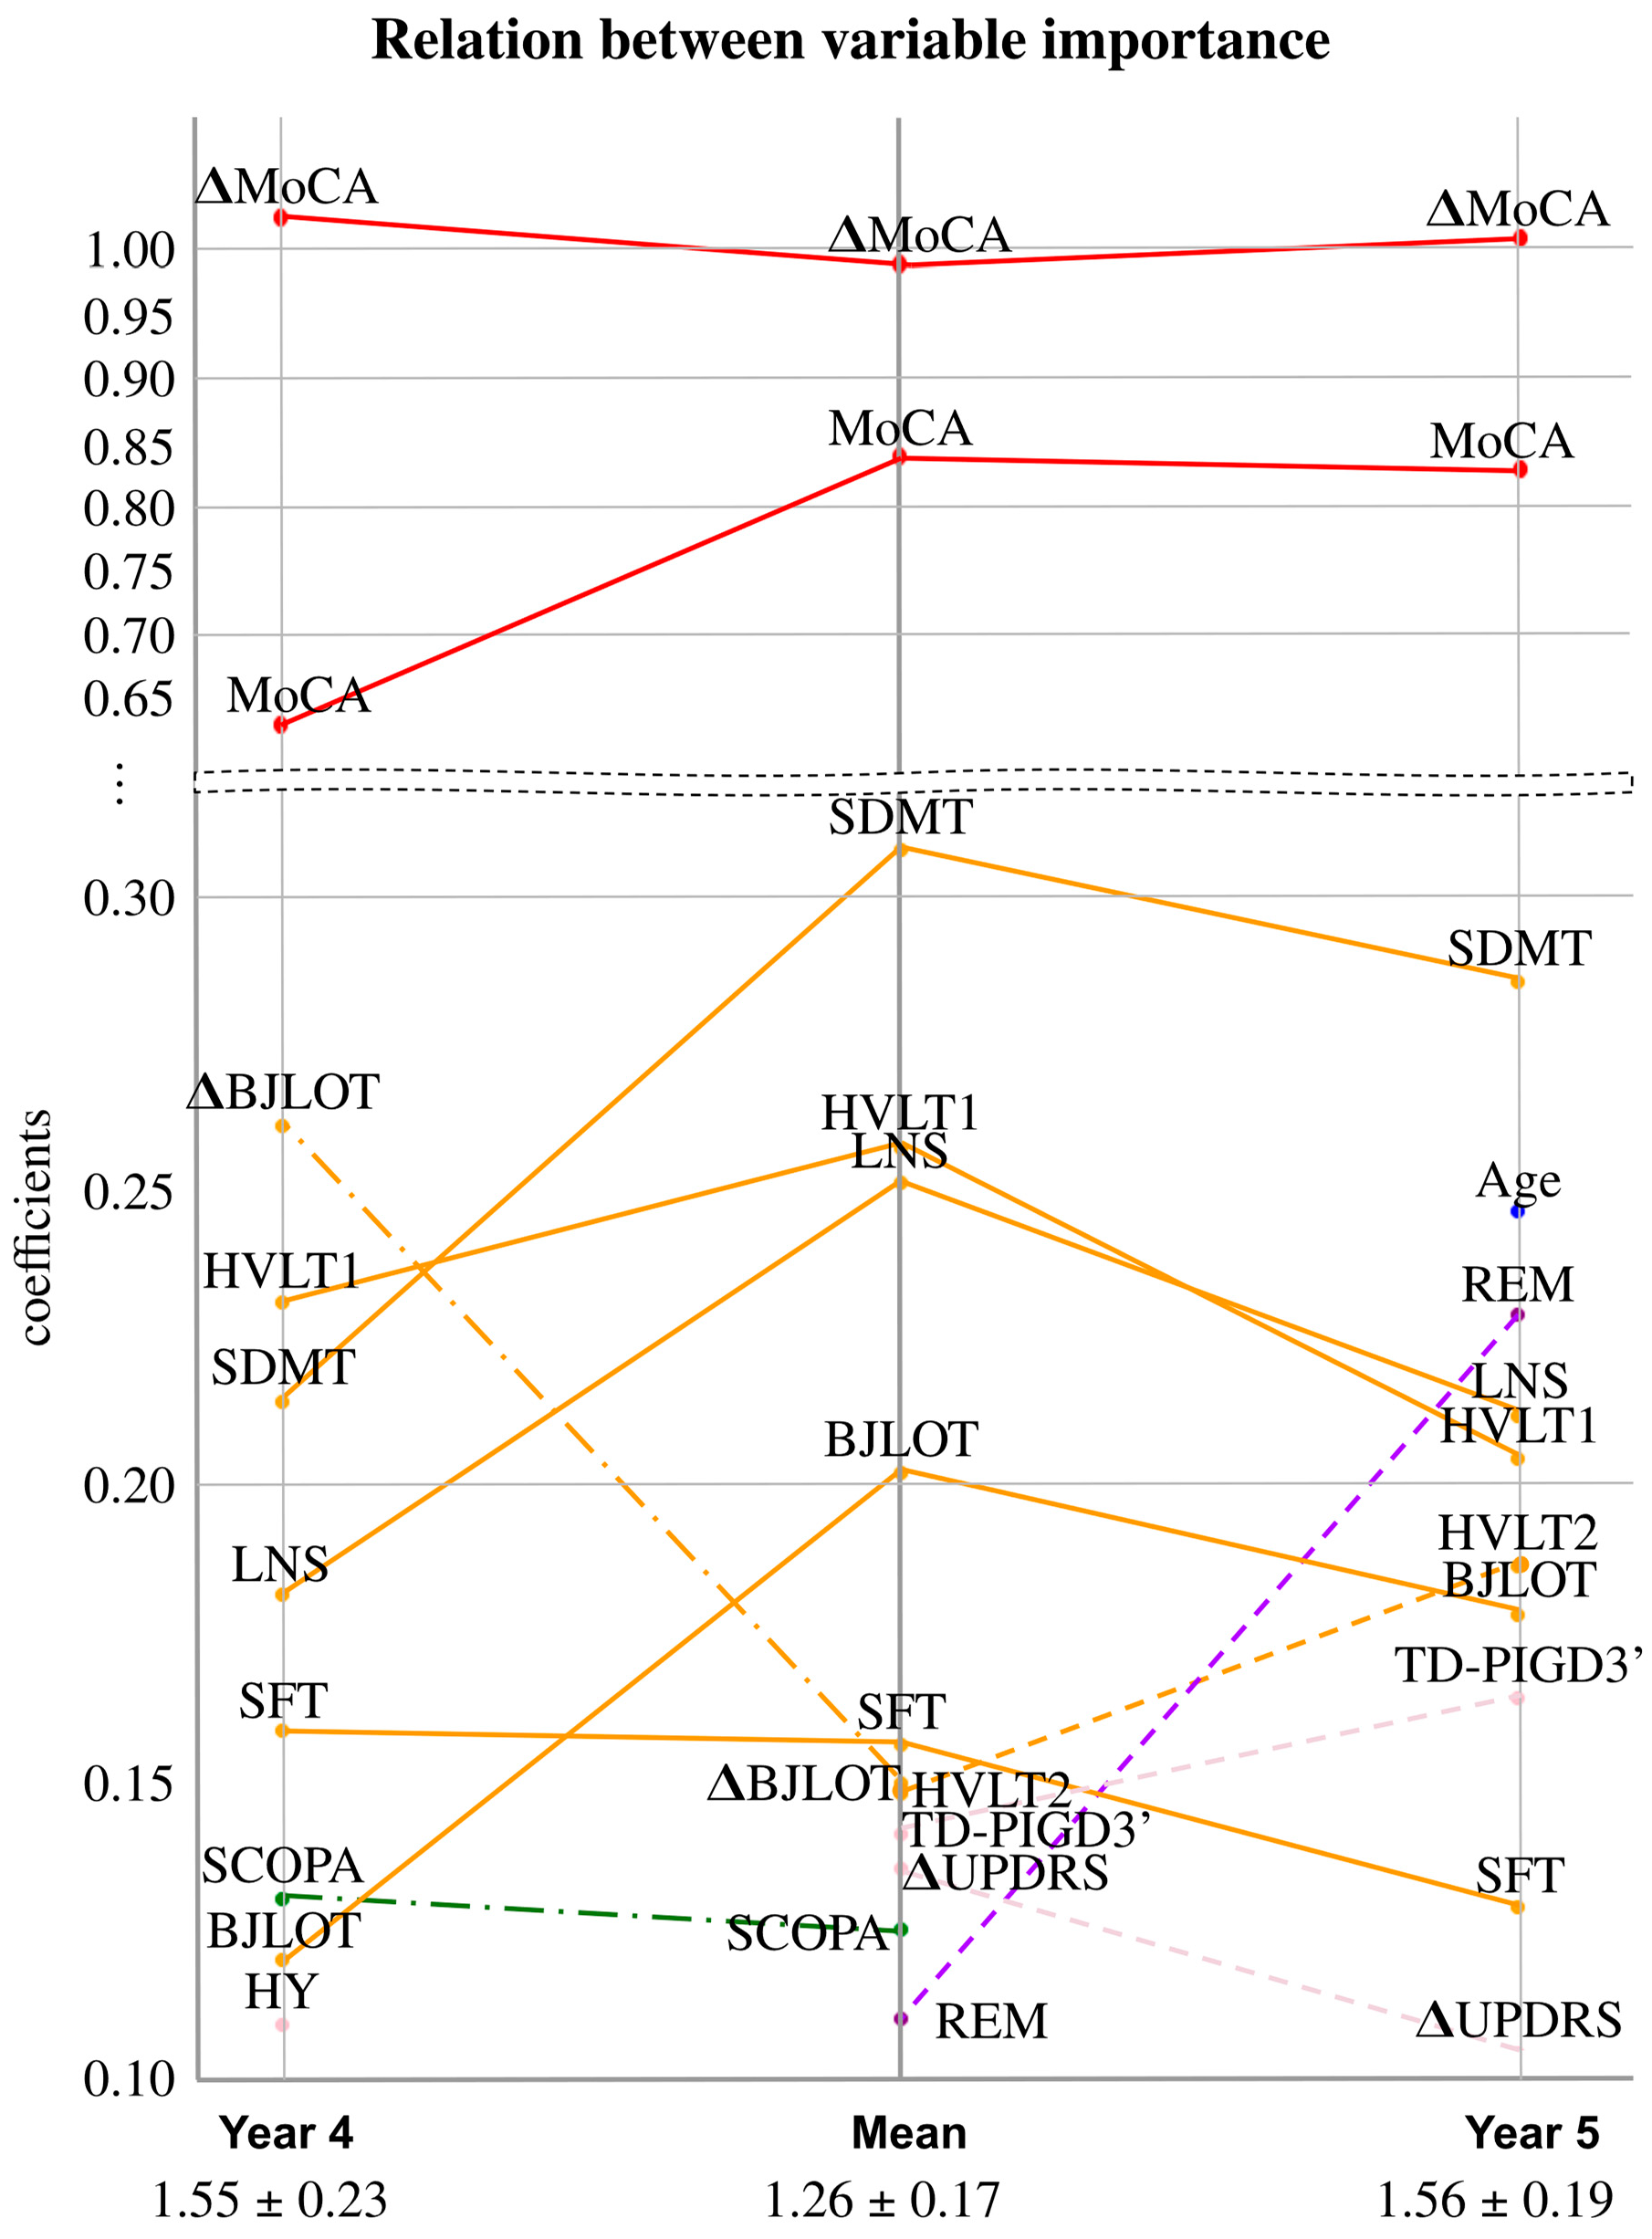
| MAE |
Disclaimer/Publisher’s Note: The statements, opinions and data contained in all publications are solely those of the individual author(s) and contributor(s) and not of MDPI and/or the editor(s). MDPI and/or the editor(s) disclaim responsibility for any injury to people or property resulting from any ideas, methods, instructions or products referred to in the content. |
© 2024 by the authors. Licensee MDPI, Basel, Switzerland. This article is an open access article distributed under the terms and conditions of the Creative Commons Attribution (CC BY) license (https://creativecommons.org/licenses/by/4.0/).
Share and Cite
Martinez-Eguiluz, M.; Arbelaitz, O.; Gurrutxaga, I.; Muguerza, J.; Gomez-Esteban, J.C.; Gabilondo, I.; Murueta-Goyena, A. Machine Learning for Prediction of Cognitive Deterioration in Patients with Early Parkinson’s Disease. Appl. Sci. 2024, 14, 8149. https://doi.org/10.3390/app14188149
Martinez-Eguiluz M, Arbelaitz O, Gurrutxaga I, Muguerza J, Gomez-Esteban JC, Gabilondo I, Murueta-Goyena A. Machine Learning for Prediction of Cognitive Deterioration in Patients with Early Parkinson’s Disease. Applied Sciences. 2024; 14(18):8149. https://doi.org/10.3390/app14188149
Chicago/Turabian StyleMartinez-Eguiluz, Maitane, Olatz Arbelaitz, Ibai Gurrutxaga, Javier Muguerza, Juan Carlos Gomez-Esteban, Iñigo Gabilondo, and Ane Murueta-Goyena. 2024. "Machine Learning for Prediction of Cognitive Deterioration in Patients with Early Parkinson’s Disease" Applied Sciences 14, no. 18: 8149. https://doi.org/10.3390/app14188149