Article

Comparison of PM10 Levels in Three of the Most Polluted Cities in Romania over the Periods Related to Lower Traffic—Implications for Human Health

by
George-Bogdan Burghelea
1,2,*,
Luminita Mărmureanu
3,
Gabriela Iorga
1,4 and
Bogdan Antonescu
1,5
1
Faculty of Physics, University of Bucharest, 405 Atomiștilor, Măgurele, 077125 Bucharest, Romania
2
“Horia Hulubei” National Institute for R&D in Physics and Nuclear Engineering, 30 Reactorului, 077125 Măgurele, Romania
3
National Institute for Research and Development in Forestry “Marin Drăcea”, 128 Eroilor Boulevard, 077030 Voluntari, Romania
4
Faculty of Chemistry, University of Bucharest, 4–12 Regina Elisabeta Boulevard, 030018 Bucharest, Romania
5
National Institute for Earth Physics, 12 Călugăreni, 077125 Măgurele, Romania
*
Author to whom correspondence should be addressed.
Appl. Sci. 2024, 14(18), 8169; https://doi.org/10.3390/app14188169
Submission received: 10 July 2024 / Revised: 6 September 2024 / Accepted: 9 September 2024 / Published: 11 September 2024
(This article belongs to the Special Issue Atmospheric Pollutants: Dispersion and Environmental Behavior)

Abstract

:
The COVID-19 pandemic has provided an opportunity to examine the impact of reduced human activity on air quality. This study assesses the levels of particulate matter (PM10) in three cities—Bucharest, Brașov, and Iași—during the pandemic restrictions in 2020, comparing them with data from the pre-pandemic period (2017–2019) and post-lockdown period (2021–2022). The results show a significant decrease in PM10 levels during the lockdown, which is closely associated with reduced traffic and mobility. Notably, while PM10 concentrations initially spiked at the beginning of 2020, they markedly declined following the enforcement of lockdown measures, during which mobility to workplaces in these cities decreased by about 60% in Bucharest, 50% in Brașov, and 45% in Iași. Health risks related to PM10 exposure were evaluated using the hazard quotient method, following EU and WHO guidelines. Despite the reduction in pollution levels in 2020, the findings suggest long-term human health risks for residents of these cities. This research highlights the critical need for sustainable strategies to address air quality issues in urban areas and protect public health.

1. Introduction

Air pollution is defined by the presence of harmful substances in the atmosphere, such as sulfur oxide (SOx), nitrogen oxide (NOx), ground-level ozone (O3), carbon monoxide (CO), and particulate matter (PM), which are generally absent in clean air. These pollutants increase health risks and degrade the quality of life. Two major long-range sources that can contribute to the particulate matter levels sufficiently to impact air quality over vast regions are wildfires [1], which predominantly produce smoke [2], and desert areas [3], which supply mineral dust. Depending on the extent, location, duration, and intensity of the fire, as well as the movement of air masses and meteorological conditions, plumes of mineral dust or smoke can travel thousands of kilometers from their sources. Due to the Sahara desert’s proximity to Europe, North Africa is a significant source of dust plumes affecting the region [3]. Locally, PM pollution sources are primarily linked to traffic, local industry, and residential heating, with their effects varying seasonally. Traffic emissions are a major source of PM, particularly in urban environments [4]. Local industries, such as concrete manufacturing, also contribute to elevated PM levels. Additionally, residential heating becomes increasingly significant during colder months, with the impact varying based on the type of fuel used, such as biomass, gas, or waste [5]. Aerosol source identification relies on various modeling approaches, which are crucial for understanding the impact of different sources on PM levels. The two main approaches are receptor-oriented and source-oriented models. Receptor-oriented methods, such as Cluster Analysis (CA), Canonical Correlation Analysis (CCA), Principal Component Analysis (PCA), Positive Matrix Factorization (PMF), and Non-Parametric Wind Regression (NWR), use pollutant data to identify source profiles and assess local influences. In contrast, source-oriented models, including Eulerian and Lagrangian types, simulate pollutant dispersion and track particles to analyze emissions and transport processes [6]. However, receptor-oriented methods often require a significant number of additional parameters [6].
Pollution by PM, particularly PM10, particles less than 10 microns in aerodynamic diameter, is a critical air pollution issue in urban areas due to its significant adverse effects on public health and overall living standards [7]. PM10 originates from a wide range of emission sources, including the combustion of coal, biomass, gasoline, oil, and diesel fuel. Additionally, PM10 includes dust from agriculture, wildfires, industrial processes, construction activities, resuspended dust from roads and soil, and natural sources like pollen. The chemical composition of PM10 is notably complex, generally comprising of carbonaceous species, soot, inorganic ions, and various elements. This composition varies significantly depending on the geographic location and specific emission sources. While PM10 contains a multitude of chemical compounds, only a few are considered hazardous to human health. Among these, polycyclic aromatic hydrocarbons (PAHs) and certain heavy metals (such as Cd, Pb, Ni, As, Tl, and Hg) are of particular concern due to their carcinogenic and mutagenic properties. PAHs are primarily formed during the incomplete combustion of organic materials at high temperatures, while heavy metals are emitted from a variety of sources, including coal and biomass combustion, vehicular traffic, and industrial activities [8]. In addition to these well-known sources, the burning of waste materials containing polyethylene terephthalate (PET), such as clothing and food packaging, is a significant contributor to PM10 pollution, particularly in Romania. Moreover, there is compelling evidence that the frequent burning of used furniture in major Romanian cities also contributes to elevated PM10 levels [5].
A study by de Bruyn and de Vries [9] estimated that the average cost of air pollution in Europe is EUR 1250 per person annually, representing 3.9% of the average urban income. The same analysis projects that air pollution costs in Romania could reach EUR 3000 per person, accounting for 8–10% of average urban income. In 2018, Bucharest ranked second among 432 cities analyzed for air pollution-related economic losses, with an estimated annual cost of EUR 6.35 billion, just below London’s losses. The study by de Bruyn and de Vries [9] covered cities with a combined population exceeding 130 million and total losses of EUR 166 billion. In Romania, Bucharest bears the highest welfare-related financial losses due to air pollution, estimated at EUR 6.35 billion annually, followed by Timișoara at EUR 542 million and Brașov at EUR 496 million.
Given the significant increase in health costs and the future economic implications of air pollution, it is crucial to explore its profound health impacts. Clinical observations and research studies provide compelling evidence of the detrimental effects of air pollution on human health. In high-population healthcare facilities, an increase in cardiovascular and respiratory conditions has been observed in recent years, with seasonal fluctuations likely linked to air pollution levels [10,11,12]. Specifically, studies have established a strong correlation between the incidence of asthma and chronic obstructive pulmonary disease (COPD) and prolonged exposure to pollutants [13]. In Romania, research has confirmed a direct relationship between hospital admissions and rising levels of air pollution, underscoring the urgency of addressing this public health crisis. For instance, in a recent study, Mahler [14] used PM2.5 and PM10 data from the Airly [15] platform in Bucharest and correlated these with hospitalization data for chronic diseases (respiratory, cardiovascular, cerebrovascular, and metabolic) obtained from the Romanian National Institute of Public Health (RNIPH) [16]. The study, covering the period from 20 August 2018 to 1 June 2022, revealed a significant statistical association: for every 10 µg m−3 increase in PM2.5 and PM10 levels, hospital admissions for respiratory and cardiovascular conditions surged by 40–60%, cumulatively resulting in nearly 2000 additional admissions per disease over the study period. This research highlights the direct, proportional impact of air pollution on health, demonstrating that elevated levels of particulate matter significantly increase hospital admissions for a range of chronic diseases, including respiratory and cardiovascular conditions, strokes, and diabetes. Notably, an 85% reduction in such hospitalizations was observed in Bucharest between April and May 2020, likely due to the COVID-19 pandemic restrictions [14].
The lockdown periods in Europe during the COVID-19 pandemic presented a unique opportunity to study air pollution in highly populated urban areas [17]. The significant reduction in human activity and transportation during these lockdowns led to a notable decrease in emissions, enabling researchers to investigate the impact of reduced anthropogenic activities on air quality in unprecedented ways [18,19]. This exceptional situation offered valuable data for analyzing the relationship between human actions and air pollution levels, providing critical insights for future environmental policies and urban planning strategies [20]. Studies conducted during the lockdown periods revealed substantial improvements in air quality, with marked decreased levels of nitrogen dioxide (NO2), particulate matter (PM2.5 and PM10), and other pollutants [21,22,23]. However, these studies also indicated that while NO2 concentrations significantly decreased due to the lockdown measures, there was a concurrent increase in ozone (O3) pollution in urban areas. A recent study [24] utilized TROPOMI and MODIS satellite data to analyze the spatial distribution and temporal variation of aerosol optical depth (AOD) over eastern China, with a specific focus on the impacts of the COVID-19 lockdown. The research highlights significant reductions in AOD during the lockdown period, driven by decreased human activities, alongside seasonal variations influenced by meteorological conditions. These findings underscore the potential benefits of reducing pollutant emissions on a global scale and highlight the need for sustainable practices to mitigate the adverse effects of air pollution on human health and the environment [25,26]. Overall, the pandemic served as a valuable case study, emphasizing the importance of understanding the anthropogenic influence on air quality and the effectiveness of emission reduction strategies [27].
This study aimed to capitalize on the unique opportunity presented by the COVID-19 pandemic to analyze the impact of anti-spread measures on PM10 pollution levels during the lockdown. The research covered the period from 1 January 2017 to 31 December 2022, which includes both periods of regular commercial, traffic, and industrial activity (2017–2019 and 2021–2022), as well as the pandemic year of 2020 [28]. The results were analyzed in the context of the traffic restriction policies put in place by the government during the pandemic year of 2020. To date, no study in Romania has conducted a comparative analysis of PM10 levels across the three largest cities, which are targeted by the European Commission’s air quality infringement procedure, while specifically comparing the pandemic year 2020 [29]. This study sought to fill this gap in the literature, providing valuable insights into the relationship between the pandemic, air pollution, and human health within the Romanian context. Additionally, this study aimed to investigate the elevated PM10 levels detected during the lockdown on 27 March 2020.
Building on the insights gained from the COVID-19 lockdown’s impact on air quality, it is important to address the broader challenges faced by countries with less experience in air pollution monitoring, particularly in Eastern Europe. In contrast to Western European nations, Romania began systematic air quality monitoring relatively late, only after the fall of the Iron Curtain. The national air quality monitoring network was established in Bucharest in late 2004 and gradually expanded across the country. Despite these efforts, Romania, like other countries such as Croatia and Ireland, has struggled to fully align with EU Directives and WHO guidelines on air quality within a short timeframe [30].
While Romania’s legislation now mirrors EU air quality policy, the practical implementation has been less successful. Iorga (2021) provides an in-depth discussion of the various factors contributing to Romania’s lag in adopting the EU acquis on air quality [31]. A significant challenge has been the limited experience in developing monitoring capacity, leading to outdated infrastructure, gaps in data series, limited information about the chemical composition of particulate matter, and insufficient funding for the maintenance and operation of monitoring devices, including human resources. These issues have frequently resulted in Romania facing infringement procedures from the European Commission for exceeding permissible levels of particulate matter and nitrogen oxides.
The cities of Bucharest, Brașov, and Iași are among the most polluted in Romania and are under scrutiny by the European Commission due to their high levels of PM10 pollution. This context underscores the importance of the present study, which not only addresses the immediate impacts of the COVID-19 lockdown on air quality but also offers insights that may be valuable for other countries facing similar challenges in air quality management and compliance.
This article is structured as follows. The metropolitan regions, observational data used, methodology, and statistical techniques applied to time series are all introduced in Section 2. The results are presented and discussed in Section 3. Section 3.1 examines the evolution of PM10 pollution during traffic restrictions and normal conditions. Section 3.2 provides an assessment of PM10 levels based on absolute and relative corrections. The findings from the Kruskal–Wallis analysis are detailed in Section 3.3. Section 3.4 discusses the impact of air pollution on human health during the study period. Section 4 provides a comprehensive discussion of the results, and the final section summarizes the conclusions of this paper.

2. Materials and Methods

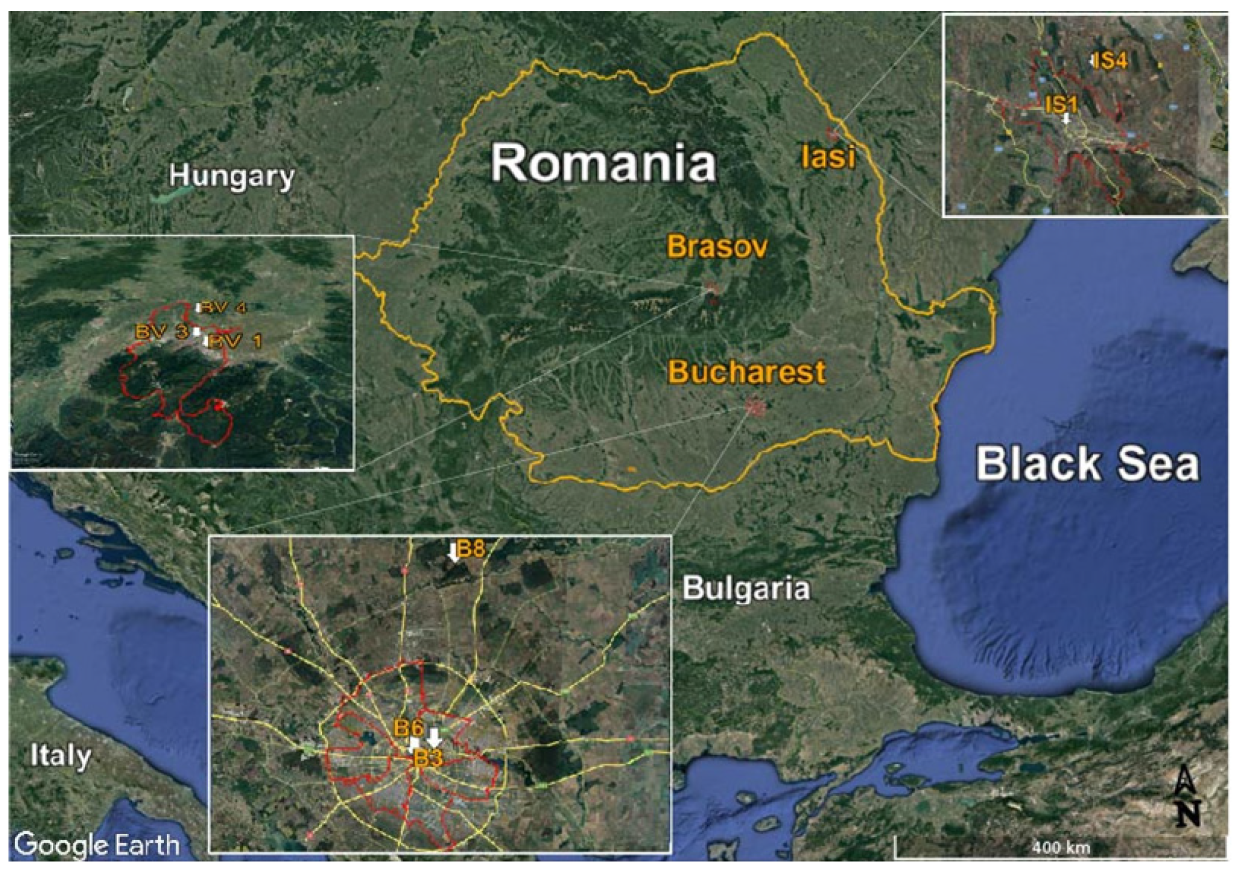
2.1. Study Areas and the Monitoring Stations

In this study, three metropolitan areas—Bucharest, Brașov, and Iași—were analyzed for the period from 1 January 2017 to 31 December 2022 to assess PM10 levels in relation to different traffic restrictions implemented during the COVID-19 pandemic (Figure 1). Bucharest, the capital of Romania, covers an area of over 200 km2 and is located on an open plain with a temperate continental climate typical of the region. The city has a population of approximately 2,149,018 [32]. Bucharest experiences relatively mild winters with minimal snowfall and high temperatures and hot summers with low rainfall. The city frequently encounters high pollution episodes, primarily due to emissions from power plants, heavy traffic, numerous small-scale industries, and domestic activities. Additionally, seasonal agricultural practices, such as biomass burning on the outskirts of the municipality, further contribute to the city’s air pollution [4,33]. Previous studies have also highlighted the impact of long-range transport pollution, particularly dust, on Bucharest’s air quality [34].
This study utilized data series from two traffic-type monitoring stations, Mihai Bravu (B-3) and Cercul Militar (B-6), selected for their distinct urban locations. The B-3 station is located along a wide avenue, while the B-6 station is situated in a canyon-like area surrounded by tall buildings. These locations represent different urban topographies and traffic conditions, offering a comprehensive perspective on air pollution in Bucharest. Additionally, data from the regional background station, Balotești (B-8), were included in the analysis. The B-8 station is located in a plain area, 24 km from the city center, and is not directly influenced by traffic emissions or urban activities (Table 1). By comparing data from the B-3, B-6, and B-8 stations, this study aimed to differentiate between urban and regional air pollution levels and to evaluate the impact of traffic and urban activities on air quality in Bucharest.
Brașov, a city with approximately 283,912 inhabitants [32], is the capital of the county bearing the same name, located in central Romania within the Transylvania region. The city has a temperate continental climate and is surrounded by mountains, leading to slightly lower temperatures in its valley areas. Brașov is the third most polluted city in Romania and is currently facing an infringement procedure initiated by the European Union due to significant pollution issues. The main contributors to the city’s pollution include road traffic, non-compliant construction sites, and industrial activities. Air quality monitoring in Brașov is conducted at seven stations, including one EMEP (European Monitoring and Evaluation Programme) station. To evaluate the impact of urban structure, traffic, and industrial activities on air quality in Brașov, this study considered data from two traffic stations with different characteristics: BV-1, located in a canyon-like area surrounded by high-rise buildings, and BV-3, situated in a less densely built area near the train station. Additionally, data from the BV-4 station, a suburban background station located approximately 8.5 km outside the city, was included in the analysis (Table 1). This multi-station approach allows for a comprehensive assessment of how urban structure, traffic, and industrial activities affect air quality in Brașov.
Iași, the capital city of the county with the same name, is located in the Moldova region of Romania and experiences a pronounced continental climate. During winter, air masses from the north and northeast often result in blizzards. With a population of approximately 610,937 [32], Iași faces significant pollution challenges and is currently under an infringement procedure. The city has repeatedly exceeded the PM10 limit value of 50 µg m−3 due to various factors, including a lack of green spaces, non-compliant construction activities, road traffic, and the long-range transport of pollutants [32]. Air quality monitoring in Iași is conducted at six fixed locations, categorized as traffic, industrial, urban background, suburban, and regional stations. For this study, data were collected from two monitoring stations: the traffic-type station Pod de Piatra (IS-1), located in the city center, and the regional-type station Aroneanu (IS-4), situated outside the city and not directly influenced by industrial activities (Table 1).

2.2. Air Pollution Data

PM10 mass concentrations from traffic and background stations were obtained from the Air Quality monitoring website [35]. The daily mean PM10 values were further processed to assess the impact of traffic. To provide a more objective comparison and to highlight how the pandemic affected air quality, data from 1 January 2017 to 31 December 2022 were analyzed. The years 2017, 2018, 2019, 2021, and 2022 served as control years, and the same analytical methods used for 2020 were applied to these years, as well.
During the COVID-19 pandemic in Romania, the government imposed various restrictions that impacted normal activities and pollution levels. Four distinct periods were identified in 2020: one without restrictions, termed Business as Usual (BAU) (1 January–15 March), and three with varying levels of traffic and social activity restrictions based on government decisions. These periods were Lockdown (16 March–15 May), Alert status with traffic restrictions (Alert 1, 16 May–15 August), and Alert status with normal traffic but limited social activities (Alert 2, 16 August–13 December). These periods were used to segment and compare the PM10 concentration time series.
To accurately assess the impact of traffic restrictions on PM10 concentrations, two approaches were employed: absolute and relative correction, following the methodology described by Van Poppel et al. [36]. Absolute correction (delta PM10) involves subtracting the background concentration from the mass concentration measured at a traffic station (Equation (1)), while relative correction (ratio PM10) refers to expressing the ratio of the mass concentration at a traffic station to the concentration at the background station (Equation (2)). These corrections help minimize the influence of background variations and eliminate the effects of fugitive PM10 intrusions from distant sources, such as dust or smoke.
d e l t a   P M 10 = P M 10 t r a f f i c P M 10 b a c k g r o u n d
r a t i o   P M 10 = P M 10 t r a f f i c P M 10 b a c k g r o u n d

2.3. Mobility Data

The assessment of human behavior was based on data available from Google Community Mobility Reports [37]. For the studied areas, data were available starting from 12 February 2020. The reported data involved changes in movement by geographical area and time for different categories of society, including retail and recreation areas, grocery and pharmacy stores, parks, public transport stations, workplaces, and residential areas. The reference period, chosen before the COVID-19 lockdown, represents typical traffic and human behavior patterns. This period, from 3 January to 6 February 2020, was selected because it did not include any significant events such as concerts, festivals, or public gatherings, making it representative of normal human activities. These data could be useful in cases where no consistent traffic flow information is available, as in the cases of limited experience in air quality monitoring [31].

2.4. Data Analysis

The pollutant data were not uniformly distributed, making the standard deviation unsuitable for estimating data errors. As a result, the standard error of the mean (SEM) was used instead. SEM is calculated using random samples from the original population and provides an estimate of the variability of potential sample means, much like how the standard deviation (SD) estimates the variability of individual observations. However, SEM is sensitive to extreme values and to the sample size. Typically, there is less variability in the sample mean values compared with the original population because mean values are used in the calculation of SEM. This indicates that SEM measures the precision with which the sample mean (M) estimates the population mean (μ). Therefore, SEM serves as an indicator of the degree of uncertainty in the mean estimate and is commonly used to calculate the confidence interval (Equations (3) and (4)):
S E M = S D n ,
95 % C I = M ± 1.96 × S E M ,
where SD is the sample standard deviation, n is the sample size, and CI represents the confidence interval [38].
To assess whether the levels of PM10 pollution attributed to traffic were influenced by the national lockdown declared by the government on 15 March 2020, we employed non-parametric statistical methods. These methods, including the Kruskal–Wallis test, are appropriate for non-normally distributed data sets and do not require the assumption of normality [39]. The primary objective of the Kruskal–Wallis test is to determine whether independent samples, each containing observations from populations with inherent uncertainty, have similar medians. This would indicate that the populations under study, despite their variability, are statistically similar.
This method relies on rank order, where all data points across groups are ranked together, and the test evaluates whether the ranks differ significantly between groups. By using ranks, the Kruskal–Wallis test is less sensitive to outliers and the specific distribution of data within groups, making it a robust alternative to ANOVA in situations where the data do not meet the assumptions of normality. The null hypothesis tested was that there are no significant differences between the median PM10 values in 2020 and the corresponding medians for the control period, which includes data from 2017–2019 and 2021–2022 for each time interval determined by the governmental restrictions.

2.5. Human Health Risk Assessment

Human Health risk was assessed using an approach described previously [40,41] computing the hazard quotient (HQ), as shown in Equations (5) and (6):
H Q = E C T V ,
E C = C A × E T × E F × E D A T ,
where ET, EF, and ED are constants and are considered according to EPA guidelines [42].
The parameters considered for the assessment of hazard quotient are as follows: EC represents the exposure concentration; TV is the toxicity value for PM10 concentration; CA is the PM10 monthly average concentration, ET represents the exposure time expressed as hours per day, considered as 24 h; EF represents the exposure frequency (350 days/year); ED represents the exposure duration (30 years for adults); and AT is the averaging time calculated as 30 × 365 days/year × 24 h/day. In this study, for the toxicity values, we assumed the EU and WHO annual limits and recommendations for PM10 [43].

3. Results

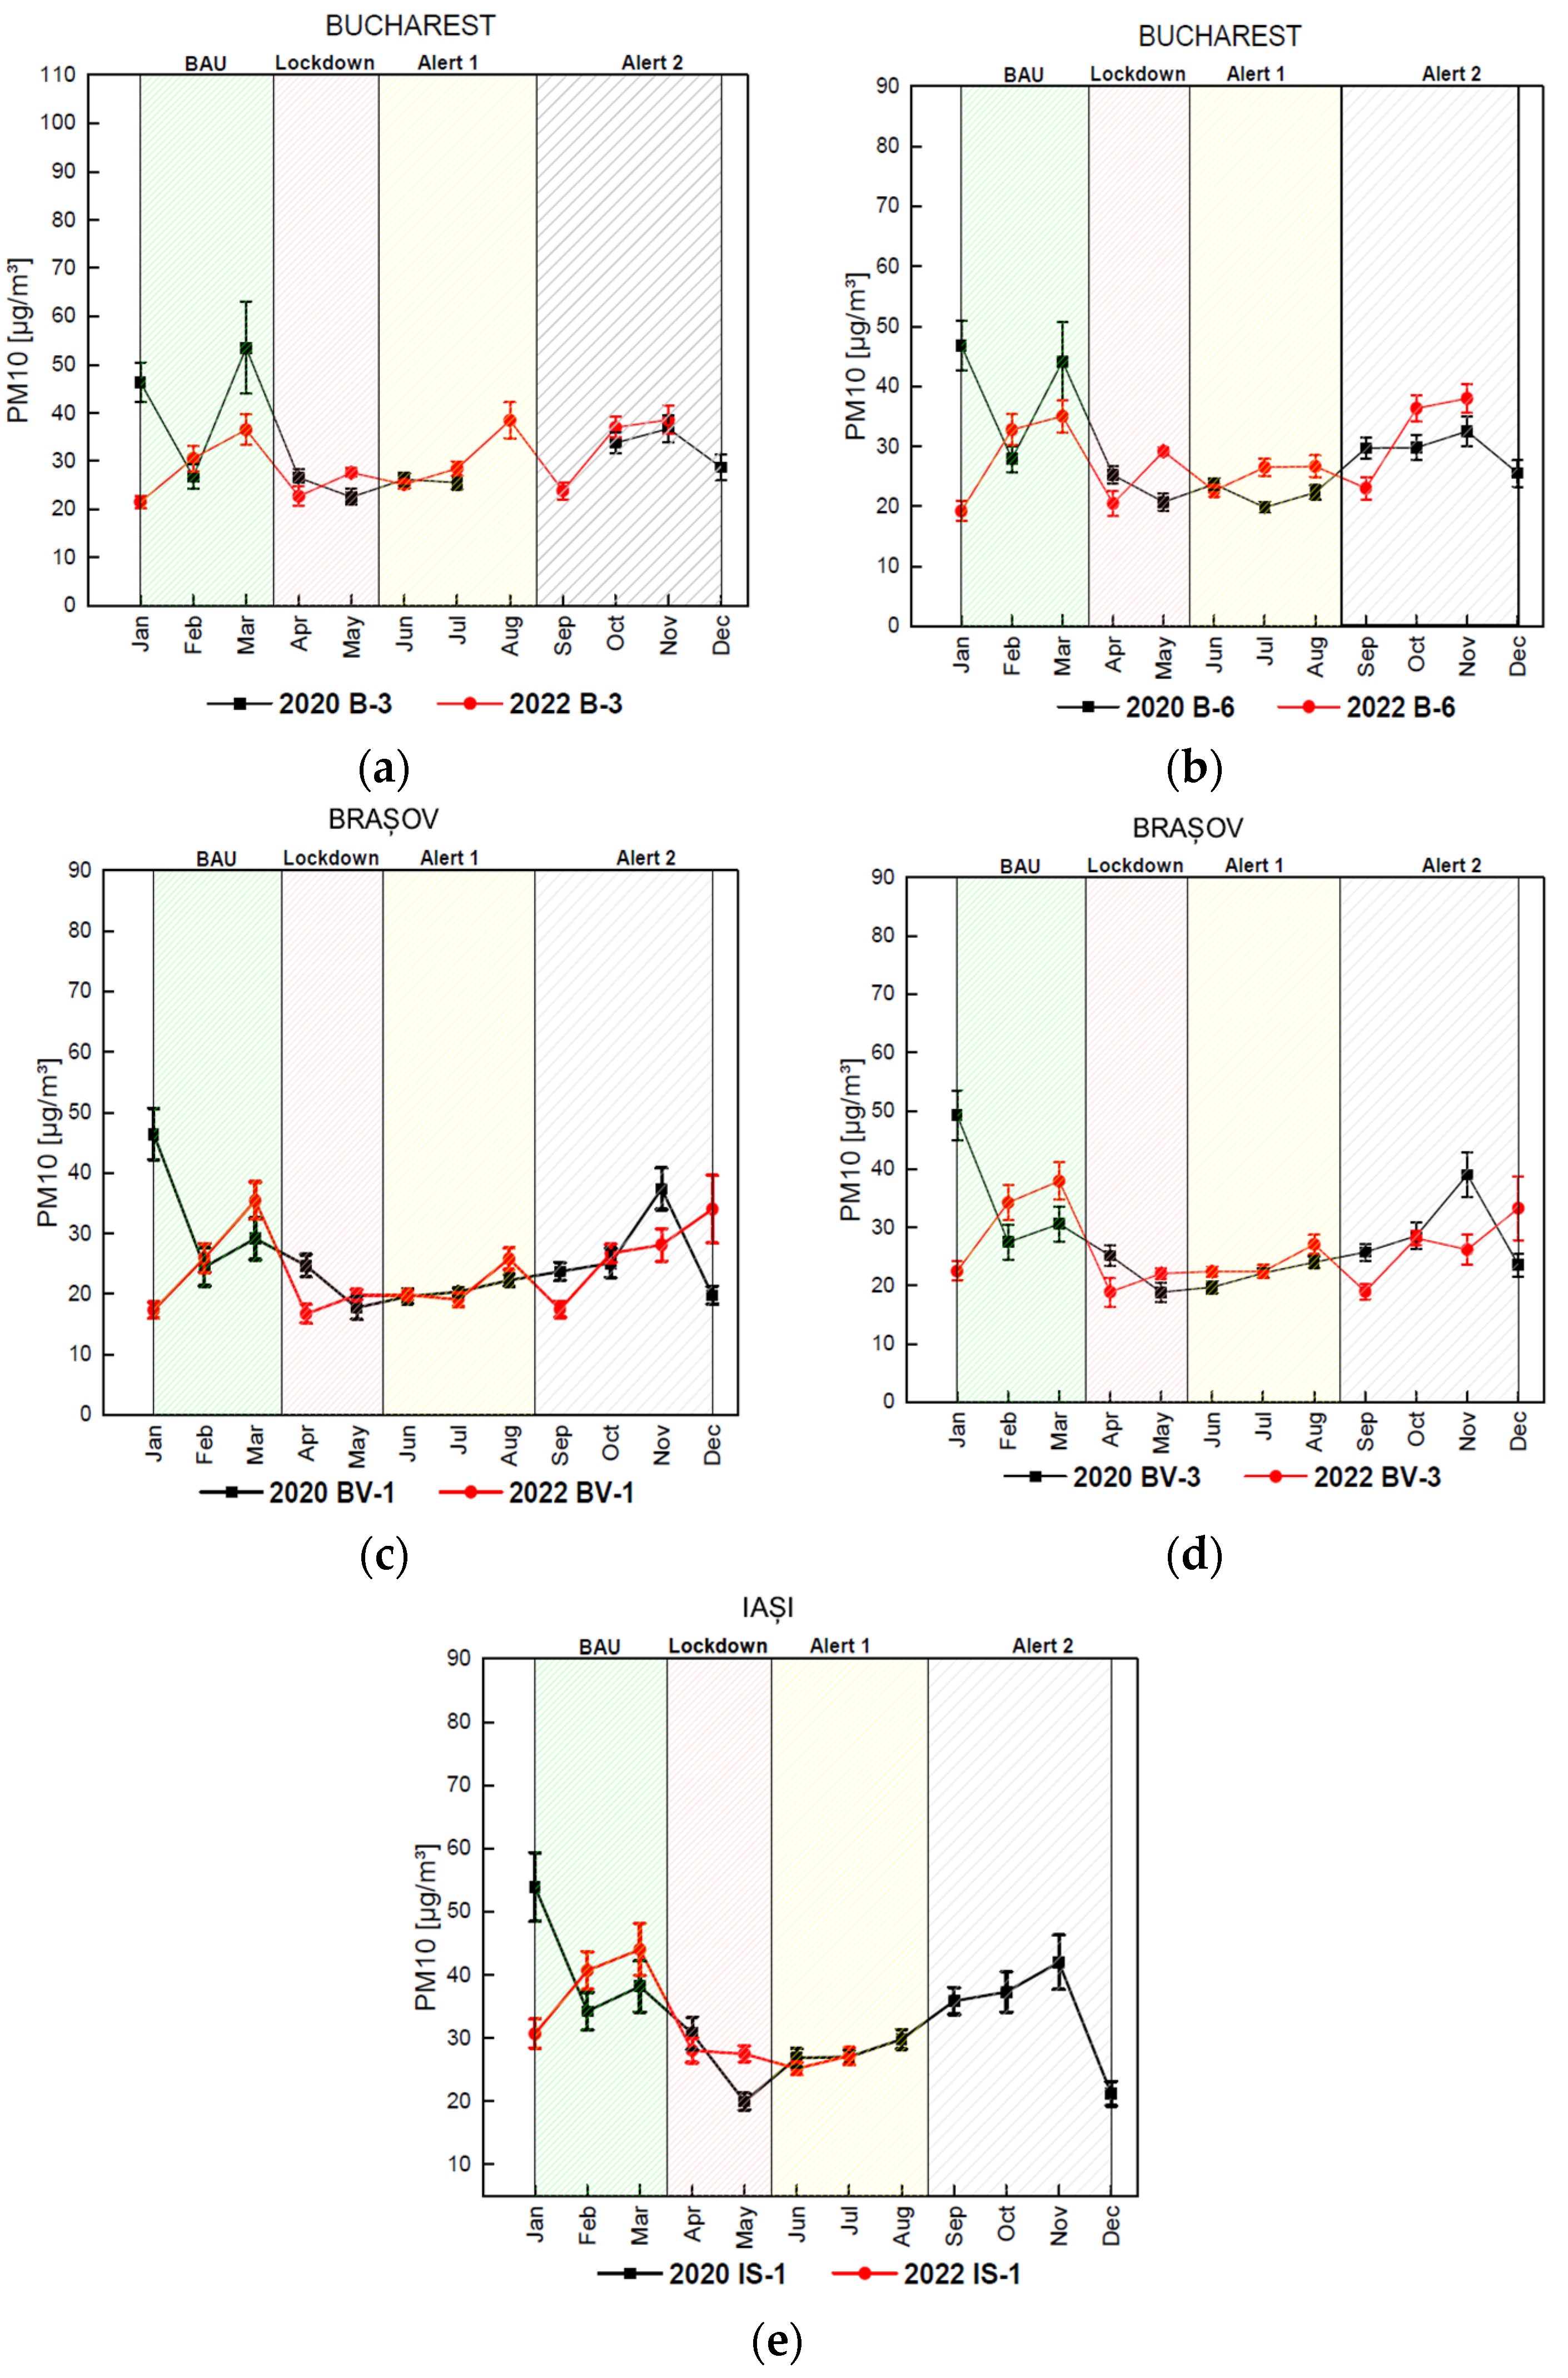
3.1. Evolution of PM10 Pollution during Traffic Restrictions and Normal Conditions

The following analysis provides a detailed examination of PM10 pollution behavior in Bucharest, Brașov, and Iași during the traffic restrictions imposed in 2020 compared with 2022, which was considered a normal traffic year.
Figure 2 presents the monthly averages of 24 h PM10 mass concentrations derived from raw time series collected in 2020 and 2022 at traffic monitoring locations across all three cities.
At the Bucharest B-3 traffic station (Figure 2a), the highest PM10 concentration in 2020 was recorded in March at 53.46 µg m−3, coinciding with the COVID-19 lockdown period. In comparison, the maximum concentration in 2022 was 38.58 µg m−3, recorded in November. Similar values for both years were observed only in June, corresponding to the Alert 1 restrictions. Starting in March, which marks the beginning of the national lockdown, there was a noticeable decrease in monthly average PM10 concentrations in 2020 compared with 2022. The annual PM10 trends for both years are similar, though with slight variations, with the minimum concentrations recorded in May 2020 (22.55 µg m−3) and January 2022 (21.55 µg m−3). Data from the B-6 traffic station (Figure 2b) reveal a maximum PM10 concentration of 44.16 µg m−3 in March 2020, while the maximum in 2022 was 38 µg m−3 in November, consistent with the trends observed at the B-3 station. The lowest concentrations were recorded in May 2020 (19.85 µg m−3) and January 2022 (19.22 µg m−3). A clear decline in PM10 concentrations was evident during 2020, particularly during the COVID-19 restrictions, mirroring the trend observed at the B-3 station.
At the Brașov BV-1 traffic station (Figure 2c), the maximum PM10 concentration in 2020 was 46.46 µg m−3, recorded in January before the COVID-19 restrictions during BAU the period. In 2022, the maximum concentration was 35.41 µg m−3, which was recorded in March. Similar values for both years were measured as early as June, corresponding to the Alert 1 restrictions. For the Brașov BV-3 traffic station (Figure 2d), the maximum PM10 concentration in 2020 was 49.25 µg m−3, which was recorded in January before the COVID-19 restrictions during the BAU period. In 2022, the maximum concentration was 37.94 µg m−3, which was recorded in March.
Figure 2e shows averaged data from the Iași IS-1 traffic station, with monthly PM10 behavior like those in Bucharest. Lower concentrations were measured in 2022 compared with 2020. The lowest PM10 concentrations were recorded in May 2020 (19.95 µg m−3) and June 2022 (25.17 µg m−3). Due to missing data for the last five months of 2022, a comparison for the Alert 2 period is not possible. After analyzing the raw data for the years 2017 to 2019, it was discovered that the PM10 values were significantly higher than those of the pandemic year 2020 [40] and comparable to the year 2022, which was also shown as an example in Figure 3.
However, the direct comparison of monthly averages between these two years does not provide conclusive evidence of lower PM10 concentrations in 2020 compared with 2022. As an example, at Bucharest B-3 station, PM10 mean mass concentration in April 2020 was 26.31 µg m−3 (95% CI: 22.09–29.72 µg m−3), while in April 2022, the PM10 mean value was 22.74 µg m−3 (95% CI: 20.12–25.35 µg m−3). The same observation applies to Iași, whose PM10 mean in April 2020 was 30.76 µg m−3 (95% CI: 25.82–35.70 µg m−3), while in April 2022, the PM10 mean value was 28.05 µg m−3 (95% CI: 24.26–31.83 µg m−3). Various factors, such as meteorological conditions (e.g., temperature and thermal inversion) and local and/or regional air pollution sources, can influence PM10 concentrations. These confounding factors make it challenging to directly compare monthly averages to determine changes in concentrations over time.
During the COVID-19 pandemic, various restrictions led to changes in human mobility patterns in the studied cities, which may have influenced pollution concentrations. As no traffic volume data were available for the investigated periods, data obtained from Google COVID-19 Community Mobility Reports [37] were used as proxies to observe human behavioral changes. Figure S1 in Supplementary Material shows the recorded human behavior in Bucharest, Brașov, and Iași during the specified periods. More specifically, for Bucharest (Figure S1a), during the lockdown period imposed by the authorities, there was a decrease in mobility at the workplaces of over 60% compared with the baseline; at the same time, the residential activities increased to about 22% in some days. Figure S1b shows a decrease of more than 80% for activities related to visiting shops, retail establishments, grocery stores, and pharmacies. For Brașov (Figure S1c), a decrease in mobility to the workplaces of about 50% could be observed during the lockdown, while the residential activities increased by approximately 23%. In Figure S1d, a decrease of more than 70% compared with the reference value for activities related to visiting shops, retail establishments, grocery stores, and pharmacies could be observed. In the case of Iasi, Figure S1e shows that during the lockdown period, there was a decrease in mobility to the workplace of about 45% compared with the baseline, while residential activities increased by about 18%. In Figure S1f, a decrease of more than 70% compared with the reference value for activities related to visiting shops, retail establishments, grocery stores, and pharmacies can be observed on some days. These patterns in Figure S1 emphasize the reduced levels of activity during the period of isolation (lockdown) and a gradual return to regular activities as usual. These data might be considered as a proxy for understanding the decline in PM10 concentrations.

3.2. PM10 Assessment Based on Absolute and Relative Correction

To minimize the influence of various confounding factors when averages are used to compare air pollution by PM10, we employed the methodology described in Section 2. Figure 3 illustrates the variation in PM10 mass concentrations at traffic stations after subtracting background levels (as described in the Section 2) to compare the differences between 2020 and 2022, during which restrictions were imposed due to the COVID-19 pandemic. As the year 2020 was divided into four periods based on the restrictions implemented by national authorities in response to the pandemic, we analyzed the average PM10 concentrations for each period in 2020 and the corresponding periods in 2022 to assess the impact of these restrictions on urban air pollution. The annual average PM10 concentrations were calculated using the available daily data for each year.
Figure 3 presents the frequency distribution of the difference between the background station and the traffic station for the B-6 station in Bucharest. The levels in 2020 are higher than those in 2022 during the BAU period, which is the timeframe prior to the implementation of COVID-19 pandemic restrictions. During the Lockdown period, the values were lower in 2020 compared with 2022 due to the imposed traffic restrictions. The same trend was maintained for the subsequent Alert 1 and Alert 2 periods. To observe the evolution of the restrictions imposed by government authorities, only one station was used. Table 2 demonstrates that during the BAU period of the pandemic year 2020, the pollution levels were high. Further, due to the Lockdown restrictions, the degree of pollution decreased and remained lower during the Alert 1 and Alert 2 periods compared with the reference year 2022. A comparison could not be made for Brașov stations BV-1 and BV-3 during Alert 1 and Alert 2, as well as for Iași station IS-1 during Alert 2, due to the lack of data for processing from the year 2022.
Figure 3. The frequency distributions obtained from differences between the traffic stations and the background stations (absolute correction), which correspond to the B-6 station in Bucharest, carried out during the specified periods.
Applsci 14 08169 g003
Figure 4 illustrates the frequency distribution of the ratio between the traffic station B-6 and the background station B-8 in Bucharest. Ratio values greater than one indicate that at a certain measurement site, the concentrations are higher compared with the background values. During the Business as Usual (BAU) period, which is the time frame prior to the imposition of COVID-19 pandemic restrictions in 2020, the values are higher compared with those in 2022. In the Lockdown period, the values were lower in 2020 due to the implemented traffic restrictions, in contrast to the year 2022. The same trend was observed for the subsequent Alert 1 and Alert 2 periods. Table 3 demonstrates that in the first BAU period of the pandemic year 2020, the pollution levels were high in Bucharest. However, due to the Lockdown restrictions, the degree of pollution decreased and remained lower in the Alert 1 and Alert 2 periods compared with the reference year 2022. A comparison could not be made for Brașov stations BV-1 and BV-3 during Alert 1 and Alert 2, as well as for Iași station IS-1 during Alert 2, owing to the absence of data for processing from the year 2022.

3.3. Kruskal–Wallis Analysis

To identify the impact of traffic on PM10 pollution levels, a one-way analysis of variance using the Kruskal–Wallis test was performed [44]. Station B-3 is positioned along a wide avenue, while station B-6 is located in a canyon-like area with high traffic, surrounded by tall buildings. These differences are also highlighted by the PM10 mass concentrations shown in Table 4 and Table 5.
Table 4 presents p-values after the Kruskal–Wallis statistical evaluation was applied to the differences between traffic stations and background stations for the metropolitan cities of Bucharest, Brașov, and Iași. The analysis reveals that during the Business as Usual (BAU) period and the Lockdown period, there is a significant difference between the concentrations of PM10 across all stations of interest. A similar behavior can be noticed during the Alert 1 and Alert 2 periods. These findings suggest that the restrictions imposed on traffic had a beneficial influence on PM10 levels in the studied metropolitan areas. There are two exceptions. The first one was recorded during BAU at BV-3, which is located near the main train station of Brașov. The second one was observed during Alert 2 at BV-1 when there were no traffic restrictions.
Table 5 illustrates the results of the Kruskal–Wallis statistical evaluation applied to the ratio between traffic stations and background stations for the metropolitan areas of Bucharest, Brașov, and Iași. The analysis reveals that during the Business as Usual (BAU) period, the values are significantly higher compared with those observed during the Lockdown period. Subsequently, an increase in the ratio is observed during the Alert 1 and Alert 2 periods, coinciding with the resumption of traffic activities. These findings indicate that traffic restrictions have a notable influence on PM10 levels in the studied metropolitan areas. Three exceptions occurred, namely for B-3 during Alert 1, IS-1 during Alert 1, and BV-1 during Alert 2. Both methods involving the Kruskal–Wallis approach indicated that the hard traffic restrictions during the Lockdown period had a significant influence on PM10 pollution levels in all three cities analyzed.

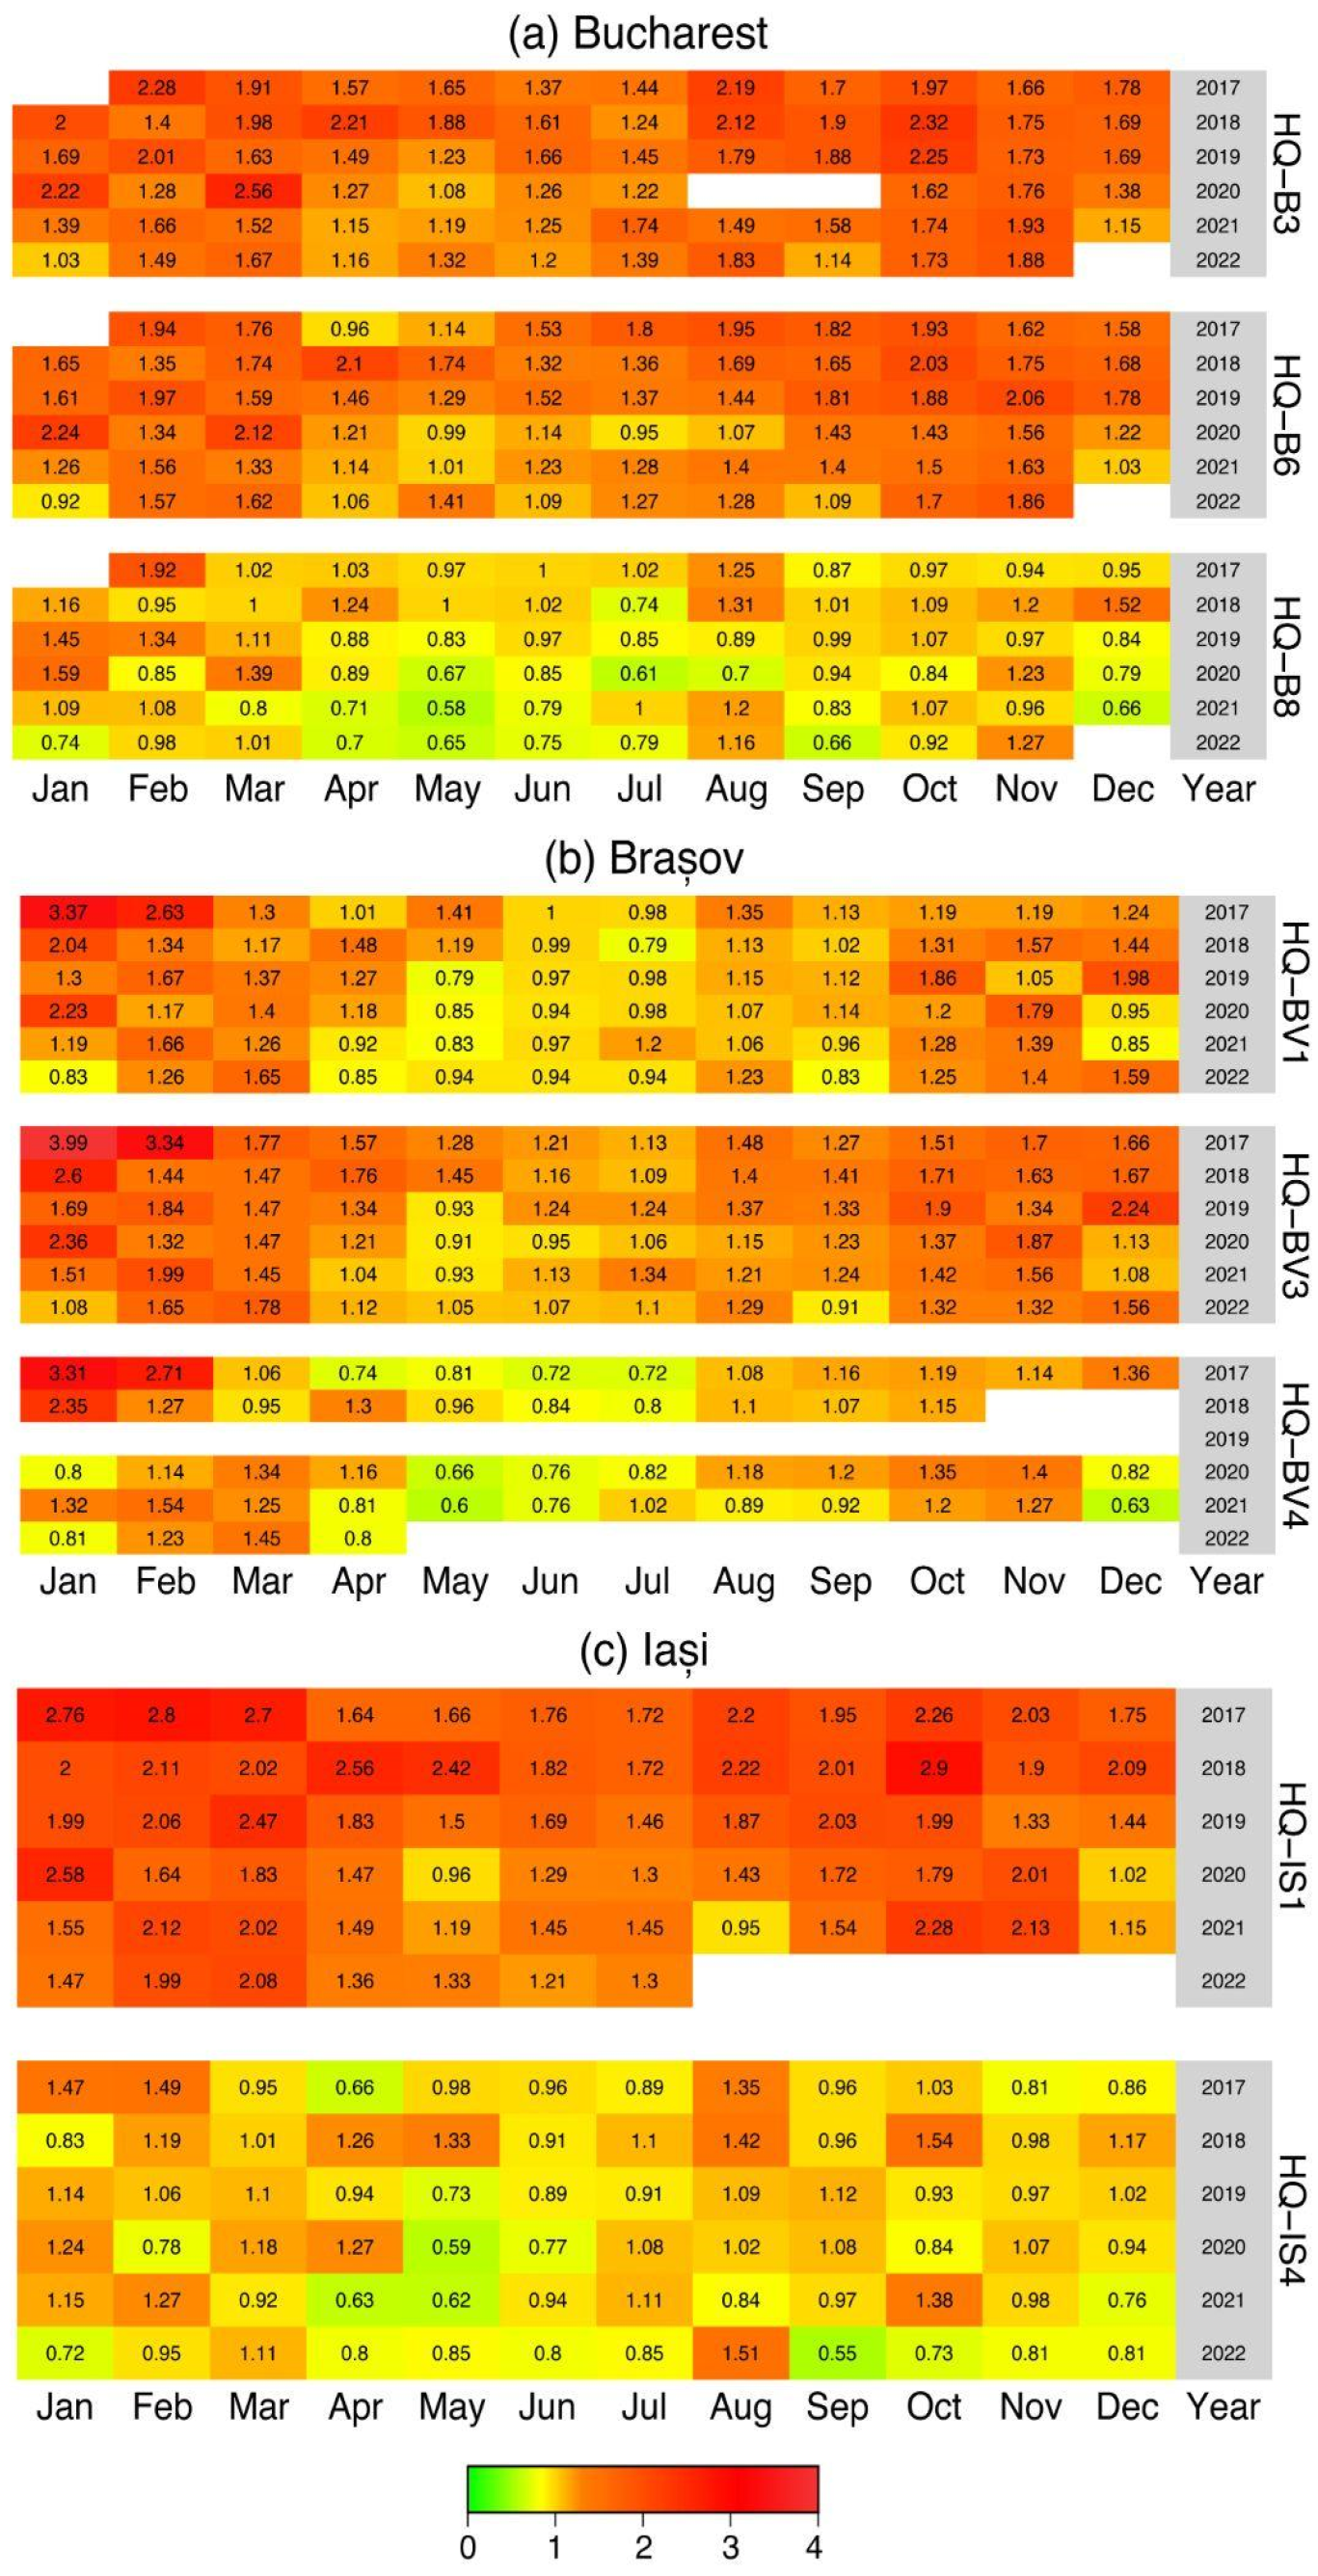
3.4. Human Health Risk

The hazard quotient (HQ) values were estimated for the adult group to determine the non-carcinogenic risk associated with PM10 in the ambient air of Bucharest, Brașov, and Iași. The human health risk was calculated based on exposure concentrations from 2017 to 2022. Two scenarios are presented in Figure 5 and Figure S2 considering the new WHO recommendations [45] and EU limit for PM10. Higher values were observed when the toxicity value was set according to the 2021 WHO recommendation for PM10 (HQ2). In line with previous studies, values greater than 1 are associated with potential non-carcinogenic chronic health risks [40,41]. Figure 5a illustrates an example of the human health risk assessment, focusing on the Bucharest metropolitan area, using data from traffic stations B-3 and B-6, as well as background station B-8.
In accordance with EU regulations, the hazard quotient (HQ1) values for Bucharest were calculated as follows: between 0.69 and 1.14 in 2017, 0.62 and 1.16 in 2018, 0.62 and 1.13 in 2019, 0.58 and 0.97 in 2021, and 0.52 and 0.94 in 2022, and these are presented in Figure S2. At station B-3, the reference value was exceeded in February and August 2017, April, August, and October 2018, and October 2019. However, it is noteworthy that the reference level was not surpassed in the years following the COVID-19 pandemic. Similarly, at station B6, the benchmark was exceeded in April and October 2018 and November 2019, with the same pattern observed at station B-3 in 2021 and 2022. In Bucharest, during 2020, HQ1 > 1 was obtained in January, before the implementation of COVID-19 restrictions, and in March.
In the worst-case scenario (HQ2), determined using the WHO recommendation, the benchmark was exceeded every month for traffic station B-3 in Bucharest. A similar pattern was observed at station B-6, with a few minor exceptions in April 2017, May and July 2020, and January 2022. Furthermore, exceedances were recorded at the background station in at least two of the months examined. For station B-3, the HQ2 values ranged from 1.03 to 2.28 in the research years, with a maximum value of 2.56 in March 2020. For station B-6, the HQ2 values ranged from 0.92 to 2.24. At the background station, HQ2 values of less than 1 were recorded in 8 months during 2020, indicating lower pollution levels.
The positions of stations B-3 and B-6 differ significantly, with B-3 located next to a large avenue and B-6 situated in a canyon-like area surrounded by tall buildings. In accordance with EU regulations and WHO recommendations, it is observed that station B6 exhibits lower values of HQ < 1. Although PM10 levels are mostly within the legislative limits, the high HQ computed based on the WHO toxic limit reveals a serious potential risk for chronic pathologies. In 2020, lower HQ values were obtained in both scenarios, suggesting a potential benefit from traffic restrictions. However, these reductions were not sufficient to significantly improve the potential risk related to non-carcinogenic chronic health effects. For all cities, a higher risk is recorded during the cold season, which is associated with an increased concentration of PM10.

4. Discussion

During the pandemic, numerous studies conducted across countries worldwide examined the impact of restrictions on air pollution [46,47,48]. Most studies reported a decrease in pollutant concentrations [49], although some noted increases in pollution or a mixed effect [48]. However, the urban atmosphere is influenced by various factors, including traffic, industrial activities, construction, and dust-containing particulate matter that can travel both short and long distances. In the present study, we demonstrate that simply comparing different time periods is insufficient to fully understand the extent of pollution reduction. Meteorological factors can significantly influence atmospheric dilution and accumulation processes, complicating the assessment of pollution levels. Additionally, special events such as long-range transport can also impact local pollution. To minimize these influential factors, in the present study, the data series of PM10 mass concentrations were analyzed to understand the impact of the COVID-19 pandemic restriction during 2020 on air pollution and human health using a long-time reference period before (2017–2019) and after (2021–2022) the pandemic. This approach leads to more convincing results, showing that the lockdown measures led to a significant decrease in air pollution levels in all three cities, thus highlighting the correlation between traffic and air quality in cities. A gradual increase in PM10 concentrations was observed after the lockdown period once the traffic in cities returned to normal. Similarly, at the global level, significant reductions in PM10 and PM2.5 concentrations were observed during the lockdown period. For instance, Chadwick et al. (2021) reported a 71% decrease in PM2.5 in Salt Lake County [47], while they found reductions in PM10 of 21% in Delhi and 15% in São Paulo compared with 2019 levels.
Some previous studies hypothesized that small changes in PM10 concentrations could be related to residential activity and an increase in domestic fuel consumption in residential areas [50]. However, the lack of detailed traffic data in cities can complicate the interpretation of these findings. The Google Community Mobility Report data were used to interpret the influence of human activities on air pollution by PM10. Thus, the mobility in these three Romanian cities during the lockdown period decreased by about in Bucharest (50% Brasov, 45% Iasi). At the same time, the residential activities increased by approximately 22% in Bucharest (23% Brasov, 18% Iasi), indicating an increase in the number of people working from home. There was also a reduction of 80% in Bucharest (70% Brasov, 70% Iasi) in the visits to shops and establishments. The impact on park activities was uncertain because these activities also depend on other factors, such as weather conditions.
Concerning the health risks associated with exposure to PM10, the results using the hazard quotient method indicated that there is a long-term risk for cancer in these cities due to exposure to PM10. Even if the PM10 levels were reduced during 2020, this was not enough to reduce the chronic health risks during cold months in all three cities. In contrast, similar studies conducted over a 10-year period (2009–2019) in Cluj-Napoca, a major city in northern Romania, indicate that PM10 concentrations pose significant concerns according to WHO recommendations. These exposure levels correspond to an HQ between 0.5 and 3.2, consistently above 1, with higher risks identified during the colder months [40].
However, long-range transport can also influence the health risk. The important event occurred on 27–28 March 2020, conducted to PM10 levels exceeding the limits imposed by the European Commission’s Directive 2008/50/EC in Bucharest, Brașov, and Iași, with concentrations approximately four times higher than the permitted levels of 50 µg m−3 per day [51]. In Bucharest and Brașov, a maximum concentration of 171 µg m−3 was recorded, while Iași registered a maximum concentration of 91 µg m−3 during this period. Identification of dust intrusions over Romania and other European countries can be performed using the DREAM8-assim model, a method currently used in the air quality field to identify and forecast these large-scale events [52] (Supplementary Material, Figure S3). The output of the DREAM8-assim model [53] for surface dust concentration showed a high dust particle intrusion over Romania, with an estimated concentration greater than 200 µg m−3. Previous studies on this event have associated the dust intrusion source with the Aralkum desert from Kazakhstan [54]. The event under discussion is a unique and significant incursion of mineral dust that originated on 27 March 2020. This event period was characterized by a number of atmospheric anomalies that were not all related, including an intense, prolonged, and widespread eastern circulation that was relatively uncommon at these latitudes due to fundamental dynamic constraints and the SARS-CoV-2 lockdown [49]. Furthermore, atmospheric dynamics affect dust activity in central Asia both directly and indirectly [55].
This special event of dust intrusion in March 2020 significantly impacted HQ values, leading to unusually high levels. In Bucharest, the HQ2 ranged from 1.39 to 2.56, recording the highest values, while in Brașov and Iași, HQ2 fluctuated between 1.18 and 1.47, all exceeding the benchmark limit of 1. In particular, there is evidence of an increasing number of events with dust and smoke coming from long distances over Romania that lead, therefore, to high peaks of PM [56]. In this light, when such pollution episodes span over a longer time, it is very likely the hazard quotient will increase.
Bodor et al. (2022) performed a study of eight large regions in Romania, calculating the health risk for all-cause mortality associated with short-term PM10 exposure [57]. They used a methodology different from the present study, based on averages of PM10 mass concentrations by region. They showed the higher excess risk is in the Bucharest region, while the lowest excess risk was found in the western regions, in areas without industrial pollution. Because people living in densely populated cities like Bucharest, Brașov, and Iași are more exposed to higher levels of PM10 than the regional average, they are, therefore, more likely exposed to a higher risk, as the hazard quotient (HQ1 and HQ2) in the present study indicates.
The cancer risk (CR), the hazard quotient (HQ) from particle-bound metal concentrations and the epidemiology-based excess risk (ER) were comparatively estimated by Chalvatzaki et al. (2019) in three European cities (Athens, Kuopio, Lisbon) [58]. They found that HQ, due to the inhalation of particle-bound metals, was lower than the acceptable level (<1), but ER and attributable fraction for PM10 and PM2.5 were higher in Lisbon compared with Athens and Kuopio due to higher ambient concentrations measured in this city. The cancer risk was higher than acceptable in some situations. To investigate these aspects in Romanian cities, further analyses are necessary, and they will be carried out in the future.
This study shows the importance of implementing efficient and sustainable measurements for reducing air pollution and thus reducing the impact on human health. The COVID-19 pandemic shed light on how reducing activities such as traffic can improve air quality in cities. Even if this strict traffic restriction cannot be applied in normal conditions, there are other measures that can be implemented to improve air quality. These measures include the use of electric vehicles, the enhancement of public transportation systems and the creation of more green spaces in cities. At the same time, it is important to provide information to communities about health hazards associated with air pollution, involve the citizens in activities that can reduce these risks, and construct an environmental protection culture. These can include the engagement of the public in citizen science projects such as monitoring the air quality.

5. Conclusions

The present study gives an overview of the changes in air pollution by PM10 in the three most polluted cities in Romania: Bucharest, Brașov, and Iaşi. The PM10 mass concentrations analyzed span five years of data, from 2017 to 2022. Outputs can be summarized as follows:
-
The enhancement of the air quality can be achieved by reducing the impact of traffic.
-
Despite the significant reduction, the results indicated that there is a potential non-carcinogenic chronic health risk in these cities due to the exposure to PM10, as indicated by the hazard quotient method, especially during cold months
-
The approach involved the non-parametric Kruskal–Wallis test and the two corrections (absolute and relative) in order to minimize the confounding factors influencing the rejecting/accepting null hypothesis. This approach can be applied to other urban areas facing high levels of air pollution, where the traffic is responsible for elevated contribution in the investigated regions. The approach is practical and easy to implement in situations where limited data are available.
While this study offers valuable insights for decision-makers regarding PM10 concentration behavior under reduced traffic conditions in three major cities, it has limitations related to the limited number of pollutants considered. A broader assessment (e.g., CA, CCA, PMF) that includes multiple pollutants and meteorological parameters (e.g., NO2, SO2, wind speed, wind direction) would provide a more comprehensive understanding of overall pollutant concentrations, sources, and associated health risks. Another limitation of the present study is related to the lack of data regarding traffic volume, as used in other studies [59,60]. In the present paper, we also show that Google Mobility Data might serve as a good indicator of the reduction in human activities, particularly vehicular traffic. However, the association between mobility and PM10 concentrations is not straightforward due to the non-linear and multifactorial nature of air pollution and human behavior. The decrease in traffic, as suggested by mobility data, plays a significant role, but the overall effect on PM10 levels can be modulated by other sources and atmospheric processes. Therefore, while the Google Mobility Data does not fully explain the variations in PM10 concentrations, it is essential to contextualize the observed changes and understand the partial contribution of reduced traffic to the overall air quality. This highlights the importance of considering multiple factors when analyzing the impact of human behavior on air pollution.

Supplementary Materials

The following supporting information can be downloaded at: https://www.mdpi.com/article/10.3390/app14188169/s1, Figure S1: Anthropogenic activity percent changes from business as usual in 2020 for Bucharest (a,b), Brașov (c,d) and Iași (e,f) for different COVID-19 restrictions; Figure S2: Hazard quotient (HQ1) in (a) Bucharest, (b) Brașov, (a) Iași EU- regulations; Figure S3: Surface dust concentration from Southeast European Virtual Climate Change Center based on DREA8-assim model valid at 27 March 0900 UTC.

Author Contributions

L.M. and G.I. designed this research. G.-B.B. and L.M. performed the data analysis. G.I. and B.A. contributed to the data analysis and interpretation. The written article was prepared by G.-B.B. and L.M., with input from all other co-authors. All authors have read and agreed to the published version of the manuscript.

Funding

George Bogdan BURGHELEA was supported by the University of Bucharest PhD research grant. Gabriela IORGA acknowledges the support from NO Grants 2014–2021, under Project EEA-RO-NO-2019-0423, contract no 31/01.09.2020. Luminita MARMUREANU acknowledges the support from Romanian National Core Program Contract FORCLIMSOC Programme Contract No. 12N/2023, project PN 23090101, 23090202, partially through the project “Cresterea capacitatii si performantei institutionalea INCDS ‘Marin Dracea’ in activitatea de CDI-CresPerfInst” (Contract 34PFE/30.12.2021). This work was also possible thanks to the collaboration with IFIN-HH and its membership in the ANELIS-PLUS project.

Institutional Review Board Statement

Not applicable.

Informed Consent Statement

Not applicable.

Data Availability Statement

The original contributions presented in the study are included in the article; further inquiries can be directed to the corresponding authors.

Acknowledgments

Meteorology data were provided by the National Meteorological Agency, and air pollution data were provided by the National Air Quality Monitoring Network www.calitateaer.ro accessed on 15 January 2023. Information about the inhabitants was taken from the website of the National Institute of Statistics, www.insse.ro accessed on 23 January 2024 and the Barcelona dust forecast center for BSC-DREAM8b and NMBM/BSC-Dust models, available at https://ess.bsc.es/bsc-dust-daily-forecast accessed on 20 January 2024 used in this publication.

Conflicts of Interest

The authors declare no conflicts of interest.

References

  1. Leino, K.R.M.; Wüstholz, V. The Dafny Integrated Development Environment. Electron. Proc. Theor. Comput. Sci. 2014, 149, 3–15. [Google Scholar] [CrossRef]
  2. Adam, M.; Fragkos, K.; Solomos, S.; Belegante, L.; Andrei, S.; Talianu, C.; Mărmureanu, L.; Antonescu, B.; Ene, D.; Nicolae, V.; et al. Methodology for Lidar Monitoring of Biomass Burning Smoke in Connection with the Land Cover. Remote Sens. 2022, 14, 4734. [Google Scholar] [CrossRef]
  3. Țîmpu, S.; Sfîcă, L.; Dobri, R.-V.; Cazacu, M.-M.; Nita, A.-I.; Birsan, M.-V. Tropospheric Dust and Associated Atmospheric Circulations over the Mediterranean Region with Focus on Romania’s Territory. Atmosphere 2020, 11, 349. [Google Scholar] [CrossRef]
  4. Mărmureanu, L.; Vasilescu, J.; Slowik, J.; Prévôt, A.S.H.; Marin, C.A.; Antonescu, B.; Vlachou, A.; Nemuc, A.; Dandocsi, A.; Szidat, S. Online Chemical Characterization and Source Identification of Summer and Winter Aerosols in Măgurele, Romania. Atmosphere 2020, 11, 385. [Google Scholar] [CrossRef]
  5. Hoffer, A.; Meiramova, A.; Tóth, Á.; Jancsek-Turóczi, B.; Kiss, G.; Rostási, Á.; Levei, E.A.; Marmureanu, L.; Machon, A.; Gelencsér, A. Assessment of the contribution of residential waste burning to ambient PM10 concentrations in Hungary and Romania. Atmos. Chem. Phys. 2024, 24, 1659–1671. [Google Scholar] [CrossRef]
  6. Mircea, M.; Calori, G.; Pirovano, G.; Belis, C.A. European Guide on Air Pollution Source Apportionment for Particulate Matter with Source Oriented Models and Their Combined Use with Receptor Models; EUR 30082 EN; Publications Office of the European Union: Luxembourg, 2020. [Google Scholar] [CrossRef]
  7. Papanastasiou, D.K.; Melas, D. Climatology and impact on air quality of sea breeze in an urban coastal environment. Int. J. Climatol. 2009, 29, 305–315. [Google Scholar] [CrossRef]
  8. Zapletal, M.; Cudlín, P.; Khadka, C.; Křůmal, K.; Mikuška, K.; Cigánková, H.; Polášek, M. Characteristics and Sources of PAHs, Hopanes, and Elements in PM10 Aerosol in Tulsipur and Charikot (Nepal). Water Air Soil Pollut. 2022, 233, 486. [Google Scholar] [CrossRef]
  9. CE Delft. Health Costs of Air Pollution in European Cities and the Linkage with Transport Report; CE Delft: Delft, The Netherlands, 2020; Available online: www.cedelft.eu (accessed on 15 February 2024).
  10. Gan, W.; Koehoorn, M.; Davies, H.; Demers, P.; Tamburic, L.; Brauer, M. Long-term exposure to traffic-related air pollution and the risk of coronary heart disease hospitalization and mortality. Epidemiology 2011, 22, S30. [Google Scholar] [CrossRef]
  11. Kelly, F.J.; Fussell, J.C. Air pollution and public health: Emerging hazards and improved understanding of risk. Environ. Geochem. Health 2015, 37, 631–649. [Google Scholar] [CrossRef]
  12. Ghorani-Azam, A.; Riahi-Zanjani, B.; Balali-Mood, M. Effects of air pollution on human health and practical measures for prevention in Iran. J. Res. Med. Sci. 2016, 21, 65. [Google Scholar] [CrossRef]
  13. Tiotiu, A.I.; Novakova, P.; Nedeva, D.; Chong-Neto, H.J.; Novakova, S.; Steiropoulos, P.; Kowal, K. Impact of Air Pollution on Asthma Outcomes. Int. J. Environ. Res. Public Health 2020, 17, 6212. [Google Scholar] [CrossRef] [PubMed]
  14. Mahler, B.; Băiceanu, D.; Panciu, T.C.; Florea, R.M.; Iorga, A.L.; Gnat, M.; German, C.F.; Pârvu, S.; Paraschiv, D.; Manea, D.; et al. Air Pollutants and Their Impact on Chronic Diseases—A Retrospective Study in Bucharest, Romania. Atmosphere 2023, 14, 867. [Google Scholar] [CrossRef]
  15. Airly Platform. Available online: www.airly.org (accessed on 24 February 2024).
  16. Romanian National Institute of Public Health (RNIPH) Web Page. Available online: https://insp.gov.ro/ (accessed on 24 March 2024).
  17. Rugani, B.; Caro, D. Impact of COVID-19 outbreak measures of lockdown on the Italian Carbon Footprint. Sci. Total Environ. 2020, 737, 139806. [Google Scholar] [CrossRef] [PubMed]
  18. Berman, J.D.; Ebisu, K. Changes in U.S. air pollution during the COVID-19 pandemic. Sci. Total Environ. 2020, 739, 139864. [Google Scholar] [CrossRef]
  19. Zambrano-Monserrate, M.A.; Ruano, M.A.; Sanchez-Alcalde, L. Indirect effects of COVID-19 on the environment. Sci. Total Environ. 2020, 728, 138813. [Google Scholar] [CrossRef]
  20. Nakada, L.Y.K.; Urban, R.C. COVID-19 pandemic: Impacts on the air quality during the partial lockdown in São Paulo state, Brazil. Sci. Total Environ. 2020, 730, 139087. [Google Scholar] [CrossRef]
  21. Sicard, P.; de Marco, A.; Agathokleous, E.; Feng, Z.; Xu, X.; Paoletti, E.; Rodriguez, J.J.D.; Calatayud, V. Amplified ozone pollution in cities during the COVID-19 lockdown. Sci. Total Environ. 2020, 735, 139542. [Google Scholar] [CrossRef]
  22. Sharma, S.; Zhang, M.; Anshika; Gao, J.; Zhang, H.; Kota, S.H. Effect of restricted emissions during COVID-19 on air quality in India. Sci. Total Environ. 2020, 728, 138878. [Google Scholar] [CrossRef]
  23. Grange, S.K.; Lee, J.D.; Drysdale, W.S.; Lewis, A.C.; Hueglin, C.; Emmenegger, L.; Carslaw, D.C. COVID-19 lockdowns highlight a risk of increasing ozone pollution in European urban areas. Atmos. Chem. Phys. 2021, 21, 4169–4185. [Google Scholar] [CrossRef]
  24. Levelt, P.F.; Stein Zweers, D.C.; Aben, I.; Bauwens, M.; Borsdorff, T.; De Smedt, I.; Eskes, H.J.; Lerot, C.; Loyola, D.G.; Romahn, F.; et al. Air quality impacts of COVID-19 lockdown measures detected from space using high spatial resolution observations of multiple trace gases from Sentinel-5P/TROPOMI. Atmos. Chem. Phys. 2022, 22, 10319–10351. [Google Scholar] [CrossRef]
  25. Gautam, S. The influence of COVID-19 on air quality in India: A boon or inutile. Bull. Environ. Contamin. Toxicol. 2020, 104, 724–726. [Google Scholar] [CrossRef] [PubMed]
  26. Muhammad, S.; Long, X.; Salman, M. COVID-19 pandemic and environmental pollution: A blessing in disguise? Sci. Total Environ. 2020, 728, 138820. [Google Scholar] [CrossRef] [PubMed]
  27. Bao, R.; Zhang, A. Does lockdown reduce air pollution? Evidence from 44 cities in northern China. Sci. Total Environ. 2020, 731, 139052. [Google Scholar] [CrossRef] [PubMed]
  28. Military Ordinance No. 3 of 24.03.2020 on Measures to Prevent the Spread of COVID-19. Romanian Government Web Page. Available online: https://www.mai.gov.ro/ordonanta-militara-nr-3-din-24-03-2020-privind-masuri-de-prevenire-a-raspandirii-covid-19/ (accessed on 24 March 2024). (In Romanian)
  29. European Commission. October Infringements Package: Key Decisions. 2020. Available online: https://ec.europa.eu/commission/presscorner/detail/en/inf_20_1687 (accessed on 25 March 2024).
  30. Samardžija, V.; Dukes, A. (Eds.) Communicating Integration Impact in Croatia and Ireland; Institute for International Relations—IMO: Zagreb, Croatia; Institute for International and European Affairs—IIEA: Dublin, Ireland, 2008. [Google Scholar]
  31. Iorga, G. Air pollution and environmental policies, EU and Romania: Where we stand, what the data reveals, what should be done in the future? In Europeanization of Environmental Policies and their Limitations: Capacity Building; Todor, A., Helepciuc, F.E., Eds.; Springer Nature Switzerland AG: Cham, Switzerland, 2021; 23p, ISBN 978-3-030-68585-0. [Google Scholar] [CrossRef]
  32. Romanian National Institute of Statistics. Available online: http://statistici.insse.ro:8077/tempo-online/#/pages/tables/insse-table (accessed on 23 January 2024).
  33. Marin, M.; Vlase, S.; Ellahi, R.; Bhatti, M.M. On the Partition of Energies for the Backward in Time Problem of Thermoelastic Materials with a Dipolar Structure. Symmetry 2019, 11, 863. [Google Scholar] [CrossRef]
  34. Mărmureanu, L.; Marin, C.A.; Andrei, S.; Antonescu, B.; Ene, D.; Boldeanu, M.; Vasilescu, J.; Viţelaru, C.; Cadar, O.; Levei, E. Orange Snow—A Saharan Dust Intrusion over Romania during Winter Conditions. Remote Sens. 2019, 11, 2466. [Google Scholar] [CrossRef]
  35. Romanian National Air Quality Monitoring Network Database. Available online: www.calitateaer.ro (accessed on 15 January 2023).
  36. Van Poppel, M.; Peters, J.; Levei, E.A.; Mărmureanu, L.; Moldovan, A.; Hoaghia, M.A.; Varaticeanu, C.; Van Laer, J. Mobile measurements of black carbon: Comparison of normal traffic with reduced traffic conditions during COVID-19 lock-down. Atmos. Environ. 2023, 297, 119594. [Google Scholar] [CrossRef]
  37. Google Community Mobility Reports. Available online: https://www.google.com/covid19/mobility/ (accessed on 1 February 2022).
  38. Barde, M.; Barde, P. What to use to express the variability of data: Standard deviation or standard error of mean? Perspect. Clin. Res. 2012, 3, 113. [Google Scholar] [CrossRef]
  39. Sherwani, R.A.K.; Shakeel, H.; Awan, W.B.; Faheem, M.; Aslam, M. Analysis of COVID-19 data using neutrosophic Kruskal Wallis H test. BMC Med. Res. Methodol. 2021, 21, 215. [Google Scholar] [CrossRef]
  40. Levei, L.; Hoaghia, M.-A.; Roman, M.; Marmureanu, L.; Moisa, C.; Levei, E.A.; Ozunu, A.; Cadar, O. Temporal Trend of PM10 and Associated Human Health Risk over the Past Decade in Cluj-Napoca City, Romania. Appl. Sci. 2020, 10, 5331. [Google Scholar] [CrossRef]
  41. Yunesian, M.; Rostami, R.; Zarei, A.; Fazlzadeh, M.; Janjani, H. Exposure to high levels of PM2.5 and PM10 in the metropolis of Tehran and the associated health risks during 2016–2017. Microchem. J. 2019, 150, 104174. [Google Scholar] [CrossRef]
  42. US Environmental Protection Agency. Risk Assessment Guidance for Superfund Volume I, Human Health Evaluation Manual, Part F, Supplement Guidance for Inhalation Risk Assessment; Office of Emergency and Remedial Response: Washington, DC, USA, 2011. Available online: https://www.epa.gov/sites/production/files/2015-09/documents/partf_200901_final.pdf (accessed on 2 February 2024).
  43. World Health Organization (WHO). Ambient Air Pollution: A Global Assessment of Exposure and Burden of Disease. 2016. Available online: http://apps.who.int/iris/bitstream/10665/250141/1/9789241511353-eng.pdf?ua = 1 (accessed on 2 February 2024).
  44. Nataliia, H.; Volodymyr, Z.; Halyna, Z. Distinction the determinants of the COVID-19 epidemic process using the Kruskal-Wallis One-Way analysis of variance. In Proceedings of the 19th International Scientific and Practical Conference “Innovative Approaches to Solving Scientific Problems”, Tokyo, Japan, 16–19 May 2023. [Google Scholar]
  45. World Health Organization. WHO Global Air Quality Guidelines: Particulate Matter (PM2.5 and PM10), Ozone, Nitrogen Dioxide, Sulfur Dioxide and Carbon Monoxide; World Health Organization: Geneva, Switzerland, 2021. [Google Scholar]
  46. Said, S.; Salah, Z.; Hassan, I.A. COVID-19 Lockdown: Impact on PM10 and PM2.5 in Six Megacities in the World Assessed Using NASA’s MERRA-2 Reanalysis. Asian J. Atmos. Environ. 2022, 16, 2021146. [Google Scholar] [CrossRef]
  47. Chadwick, E.; Le, K.; Pei, Z.; Sayahi, T.; Rapp, C.; Butterfield, A.E.; Kelly, K.E. Understanding the effect of COVID-19 on particle pollution using a low-cost sensor network. J. Aerosol. Sci. 2021, 155, 105766. [Google Scholar] [CrossRef] [PubMed]
  48. Varotsos, C.; Christodoulakis, J.; Kouremadas, G.A.; Fotaki, E.F. The Signature of the Coronavirus Lockdown in Air Pollution in Greece. Water Air Soil Pollut. 2021, 232, 119. [Google Scholar] [CrossRef] [PubMed]
  49. Tositti, L.; Brattich, E.; Cassardo, C.; Morozzi, P.; Bracci, A.; Marinoni, A.; Di Sabatino, S.; Porcù, F.; Zappi, A. Development and evolution of an anomalous Asian dust event across Europe in March 2020. Atmos. Chem. Phys. 2020, 4047–4073. [Google Scholar] [CrossRef]
  50. Hörmann, S.; Jammoul, F.; Kuenzer, T.; Stadlober, E. Separating the impact of gradual lockdown measures on air pollutants from seasonal variability. Atmos. Pollut. Res. 2021, 12, 84–92. [Google Scholar] [CrossRef]
  51. European Parliament: Directive 2008/50/EC of the European Parliament and of the Council of 21 May 2008 on Ambient Air Quality and Cleaner Air for Europe, European Commission, Brussels, Belgium. 2008. Available online: https://eur-lex.europa.eu/eli/dir/2008/50/oj (accessed on 30 November 2021).
  52. Al-Dabbagh, S.K.; Almusawi, V.; Alknani, B.A. Verification of Some Weather Elements Forecasts from BSC-DREAM8b V2 Model. IOP Conf. Ser. Earth Environ. Sci. 2023, 1223, 012008. [Google Scholar] [CrossRef]
  53. Miclean, M.; Cadar, O.; Levei, E.A.; Roman, R.; Ozunu, A.; Levei, L. Metal (Pb, Cu, Cd, and Zn) Transfer along Food Chain and Health Risk Assessment through Raw Milk Consumption from Free-Range Cows. Int. J. Environ. Res. Public Health 2019, 16, 4064. [Google Scholar] [CrossRef]
  54. Šikoparija, B. Desert dust has a notable impact on aerobiological measurements in Europe. Aeolian Res. 2020, 47, 100636. [Google Scholar] [CrossRef]
  55. Zhang, X.X.; Claiborn, C.; Lei, J.Q.; Vaughan, J.; Wu, S.X.; Li, S.Y.; Liu, L.Y.; Wang, Z.F.; Wang, Y.D.; Huang, S.Y.; et al. Aeolian dust in Central Asia: Spatial distribution and temporal variability. Atmos. Environ. 2020, 238, 117734. [Google Scholar] [CrossRef]
  56. Mihalache, B.; Colt, M.; Stefan, S.; Iorga, G. New insights into the air quality of an industrial petrochemical urban area. Part 2: Temporal pattern, trends and pollution episodes. 2024; manuscript in preparation. [Google Scholar]
  57. Bodor, K.; Szép, R.; Bodor, Z. The human health risk assessment of particulate air pollution (PM2.5 and PM10) in Romania. Toxicol. Rep. 2022, 9, 556–562. [Google Scholar] [CrossRef]
  58. Chalvatzaki, E.; Chatoutsidou, S.E.; Lehtomäki, H.; Almeida, S.M.; Eleftheriadis, K.; Hänninen, O.; Lazaridis, M. Characterization of Human Health Risks from Particulate Air Pollution in Selected European Cities. Atmosphere 2019, 10, 96. [Google Scholar] [CrossRef]
  59. Turek, T.; Diakowska, E.; Kaminska, J.A. Has COVID-19 lockdown affected on air quality?—Different time scale case study in Wroclaw, Poland. Atmosphere 2021, 12, 1549. [Google Scholar] [CrossRef]
  60. Aggoune-Mtalaa, W.; Laib, M. Analyzing air pollution and traffic data in urban areas in Luxembourg. Smart Cities 2023, 6, 929–943. [Google Scholar] [CrossRef]
Figure 1. Map showing Romania and the three urban areas with a focus on Bucharest, Brașov, and Iași areas. Air quality monitoring stations used in the present study are indicated with white arrows. Traffic stations are within the red administrative shape of a specific city, and regional background stations appear out of the red shape (B-8, IS-4, BV-4).
Applsci 14 08169 g001
Figure 2. Monthly average PM10 values for traffic stations from Bucharest (a,b), Brașov (c,d), and Iași (e). The black line represents the PM10 monthly mean for 2020; the red line represents the PM10 monthly mean for 2022. Error bars represent SEM.
Applsci 14 08169 g002
Figure 4. The frequency distributions obtained from the ratio between the traffic stations and the background stations (relative correction), which correspond to the B-6 station in Bucharest, carried out during the specified periods.
Applsci 14 08169 g004
Figure 5. Hazard quotient (HQ2) in Bucharest, WHO recommendations.
Applsci 14 08169 g005
Table 1. Monitoring stations in Bucharest, Brașov, and Iași included in the present study.
Station CodeStation TypeLatitudeLongitudeElevation (m)
Bucharest
B-3traffic44.441° N26.151° E81
B-6traffic44.429° N26.120° E80
B-8background, regional44.617° N26.116° E94
Brașov
BV-1traffic45.637° N25.631° E599
BV-3traffic45.659° N25.616° E599
BV-4suburban45.718° N25.624° E518
Iași
IS-1traffic47.157° N27.574° E50
IS-4background, regional47.199° N27.545° E165
Table 2. Variations of the differences in PM10 mass concentrations (absolute correction) over the defined periods between the traffic stations and the corresponding regional background stations in Bucharest, Brașov, and Iași.
STATIONB-3B-6BV-1BV-3IS-1
YEARS2020202220202022202020222020202220202022
BAU15.659.3713.076.891.872.834.888.0120.8317.86
LOCKDOWN10.4812.288.019.790.851.051.544.287.1415.02
ALERT 110.2611.087.028.971.57-4.18-8.688.77
ALERT 212.4713.759.1312.282.95-5.31-13.89-
Table 3. Variations of ratio PM10 (relative correction) between traffic stations and the corresponding regional background stations in Bucharest, Brașov, and Iași.
STATIONB-3B-6BV-1BV-3IS-1
YEARS20202022202020222020Years2020202220202022
BAU1.902.032.041.881.391.301.601.602.432.20
LOCKDOWN1.581.871.451.631.261.161.291.311.401.87
ALERT 11.801.791.581.631.15-1.35-1.741.59
ALERT 21.781.801.571.731.24-1.38-1.89-
Table 4. The p-value of the Kruskal–Wallis test between the year 2020 and the period of Business as Usual in the reference years 2017–2019 and 2021–2022, through the differences of the traffic stations and the background stations from the metropolitan cities of Bucharest, Brașov, and Iași. Asterisks indicate statistical significance.
Period/StationB-3B-6BV-1BV-3IS-1
BAU0.8310.0570.5900.032 *0.804
LOCKDOWN0.005 *0.044 *0.006 *0.000 *0.000 *
ALERT 10.021 *0.000 *0.002 *0.000 *0.000 *
ALERT 20.000 *0.000 *0.21580.007 *0.000 *
Table 5. The p-value of the Kruskal–Wallis test between the year 2020 and the period of Business as Usual in the reference years 2017–2019 and 2021–2022, through the ratio of the traffic stations and the background stations from the metropolitan cities of Bucharest, Brașov, and Iași. Asterisks indicate statistical significance.
Period/StationB-3B-6BV-1BV-3IS-1
BAU0.7500.0570.1290.621 *0.167
LOCKDOWN0.001 *0.022 *0.022 *0.000 *0.000 *
ALERT 10.9320.006 *0.008 *0.000 *0.436 *
ALERT 20.038 *0.000 *0.1890.016 *0.030 *
Disclaimer/Publisher’s Note: The statements, opinions and data contained in all publications are solely those of the individual author(s) and contributor(s) and not of MDPI and/or the editor(s). MDPI and/or the editor(s) disclaim responsibility for any injury to people or property resulting from any ideas, methods, instructions or products referred to in the content.

