Abstract
Based on the Xiaolangdi North Bank Irrigation Area Project, this study combines numerical simulation and BP neural network methods to investigate the sensitivity of tunnel soil and its parameter inversion under continuous heavy rainfall. The research results indicate that changes in water-level and soil strength parameters have a significant impact on the deformation of tunnel surrounding rock. By comparing the sensitivity factors of different parameters, the main parameter sensitivities affecting the displacement of tunnel surrounding rock were determined to be water level, internal friction angle, and cohesion. The mechanical characteristics of the tunnel construction process were analyzed using finite difference method numerical analysis software FLAC3D, and the results were used as a sample dataset for inversion analysis. Through neural network inverse analysis based on orthogonal design method, the cohesion and internal friction angle of loess layer ④, loess layer ④-1, and loess layer ⑤ were determined, and the data of groundwater level elevation were obtained. Field applications proved the effectiveness and rationality of this method.
1. Introduction
Long-term heavy rainfall poses significant challenges to the stability and safe operation of tunnels. During tunnel construction, the interplay between the seepage and stress fields emerges as a critical determinant of tunnel safety [1,2,3]. Particularly under extreme weather conditions such as heavy rainfall, this interaction becomes more pronounced and often leads to safety issues in underground engineering projects such as diversion tunnels. Scholars both domestically and internationally have conducted extensive research on the stability of tunnels under seepage effects. He et al. [4] used numerical simulation to study the impact of rainfall erosion on the stability of loess tunnels, demonstrating that erosion softening is the main influencing factor affecting the stability of loess tunnel excavation. Tu et al. [5] proposed a three-dimensional continuous-discrete method to simulate face failure to study the effects of seepage on face stability during tunnel excavation. Li et al. [6] analyzed, using numerical simulation, the changes in the radius of the failure zone under different calculation conditions as a function of pore water pressure and excavation radius and discussed the influence of dynamic unloading disturbance on the surrounding rock failure zone. Xie et al. [7] studied and analyzed the deformation of tunnel lining and the variation of pore water pressure during tunnel excavation based on a fluid–solid coupling model.
Moreover, the use of neural networks for sensitivity analysis of tunnel parameters has become increasingly popular. Zhu Jianglin and Chen Qiunan [8], using Flac3d and BP neural networks, conducted displacement inverse analysis of the main mechanical parameters of rock surrounding tunnels, obtaining sensitivities of various mechanical parameters of tunnel surrounding rock. Khamesi et al. [9] proposed a new parameter inversion method using fuzzy systems and numerical simulation. Xiao Mingqing et al. [10] proposed an inversion analysis method based on parameter sensitivity analysis and BP neural networks, obtaining reliable soil parameters. Liu Chun et al. [11] obtained a tunnel displacement inverse analysis model through LM algorithm-improved BP neural network theory and numerical simulation and inversely obtained the key physical and mechanical parameters of the surrounding rock based on field survey displacement data. Zhou Guannan et al. [12] used the fast convergence characteristics of genetic algorithms for the BP neural network inversion of rock mass parameters, resulting in accurate deformation predictions. Ling Tonghua et al. [13] obtained training samples using orthogonal and uniform experimental design methods, improved the standard particle swarm algorithm, and established a nonlinear relationship between the parameters to be inverted and the measured displacement values using this neural network, with small errors between calculated and measured displacement values. Wang et al. [14] conducted sensitivity analysis of creep parameters of the surrounding rock in soft rock tunnels using BP neural networks based on the IA-BP algorithm. Zhang Zhihua et al. [15] conducted inversion analysis of subway shield tunnel soil mechanics parameters using a combined research method of sensitivity analysis and numerical simulation, and field applications ultimately proved the effectiveness and rationality of this method. Han et al. [16] obtained a nonlinear relationship between tunnel surrounding rock displacement and inverse analysis parameters using artificial neural networks and FLAC3D 6.00 software, and they proposed a new intelligent inverse analysis method combining genetic algorithms. Han Xiao et al. [17] applied FLAC3D software to establish a numerical calculation model for the underground chamber excavation process considering both time and space effects, and used the sensitivity analysis method in system analysis to analyze the sensitivity of elastic modulus, internal friction angle, and cohesion on the stress and displacement of the surrounding rock mass.
Thus, the integration of numerical simulation and BP neural networks to obtain inverse analysis methods holds significant importance for diversion tunnel projects. In this study, taking the No.1 tunnel of the Xiaolangdi North Bank Irrigation Area Main Channel as an example and utilizing FLAC3D as the research tool, we conducted an analysis of the effects of continuous heavy rainfall on tunnel deformation characteristics and the sensitivity of numerical calculation model parameters. We revealed the variations of water level, soil cohesion, and internal friction angle under continuous heavy rainfall conditions, obtained sensitivity rankings, and combined with orthogonal design and BP neural networks, we conducted displacement inverse analysis of water level and soil mechanics parameters to obtain more reasonable and accurate values.
2. Engineering Overview
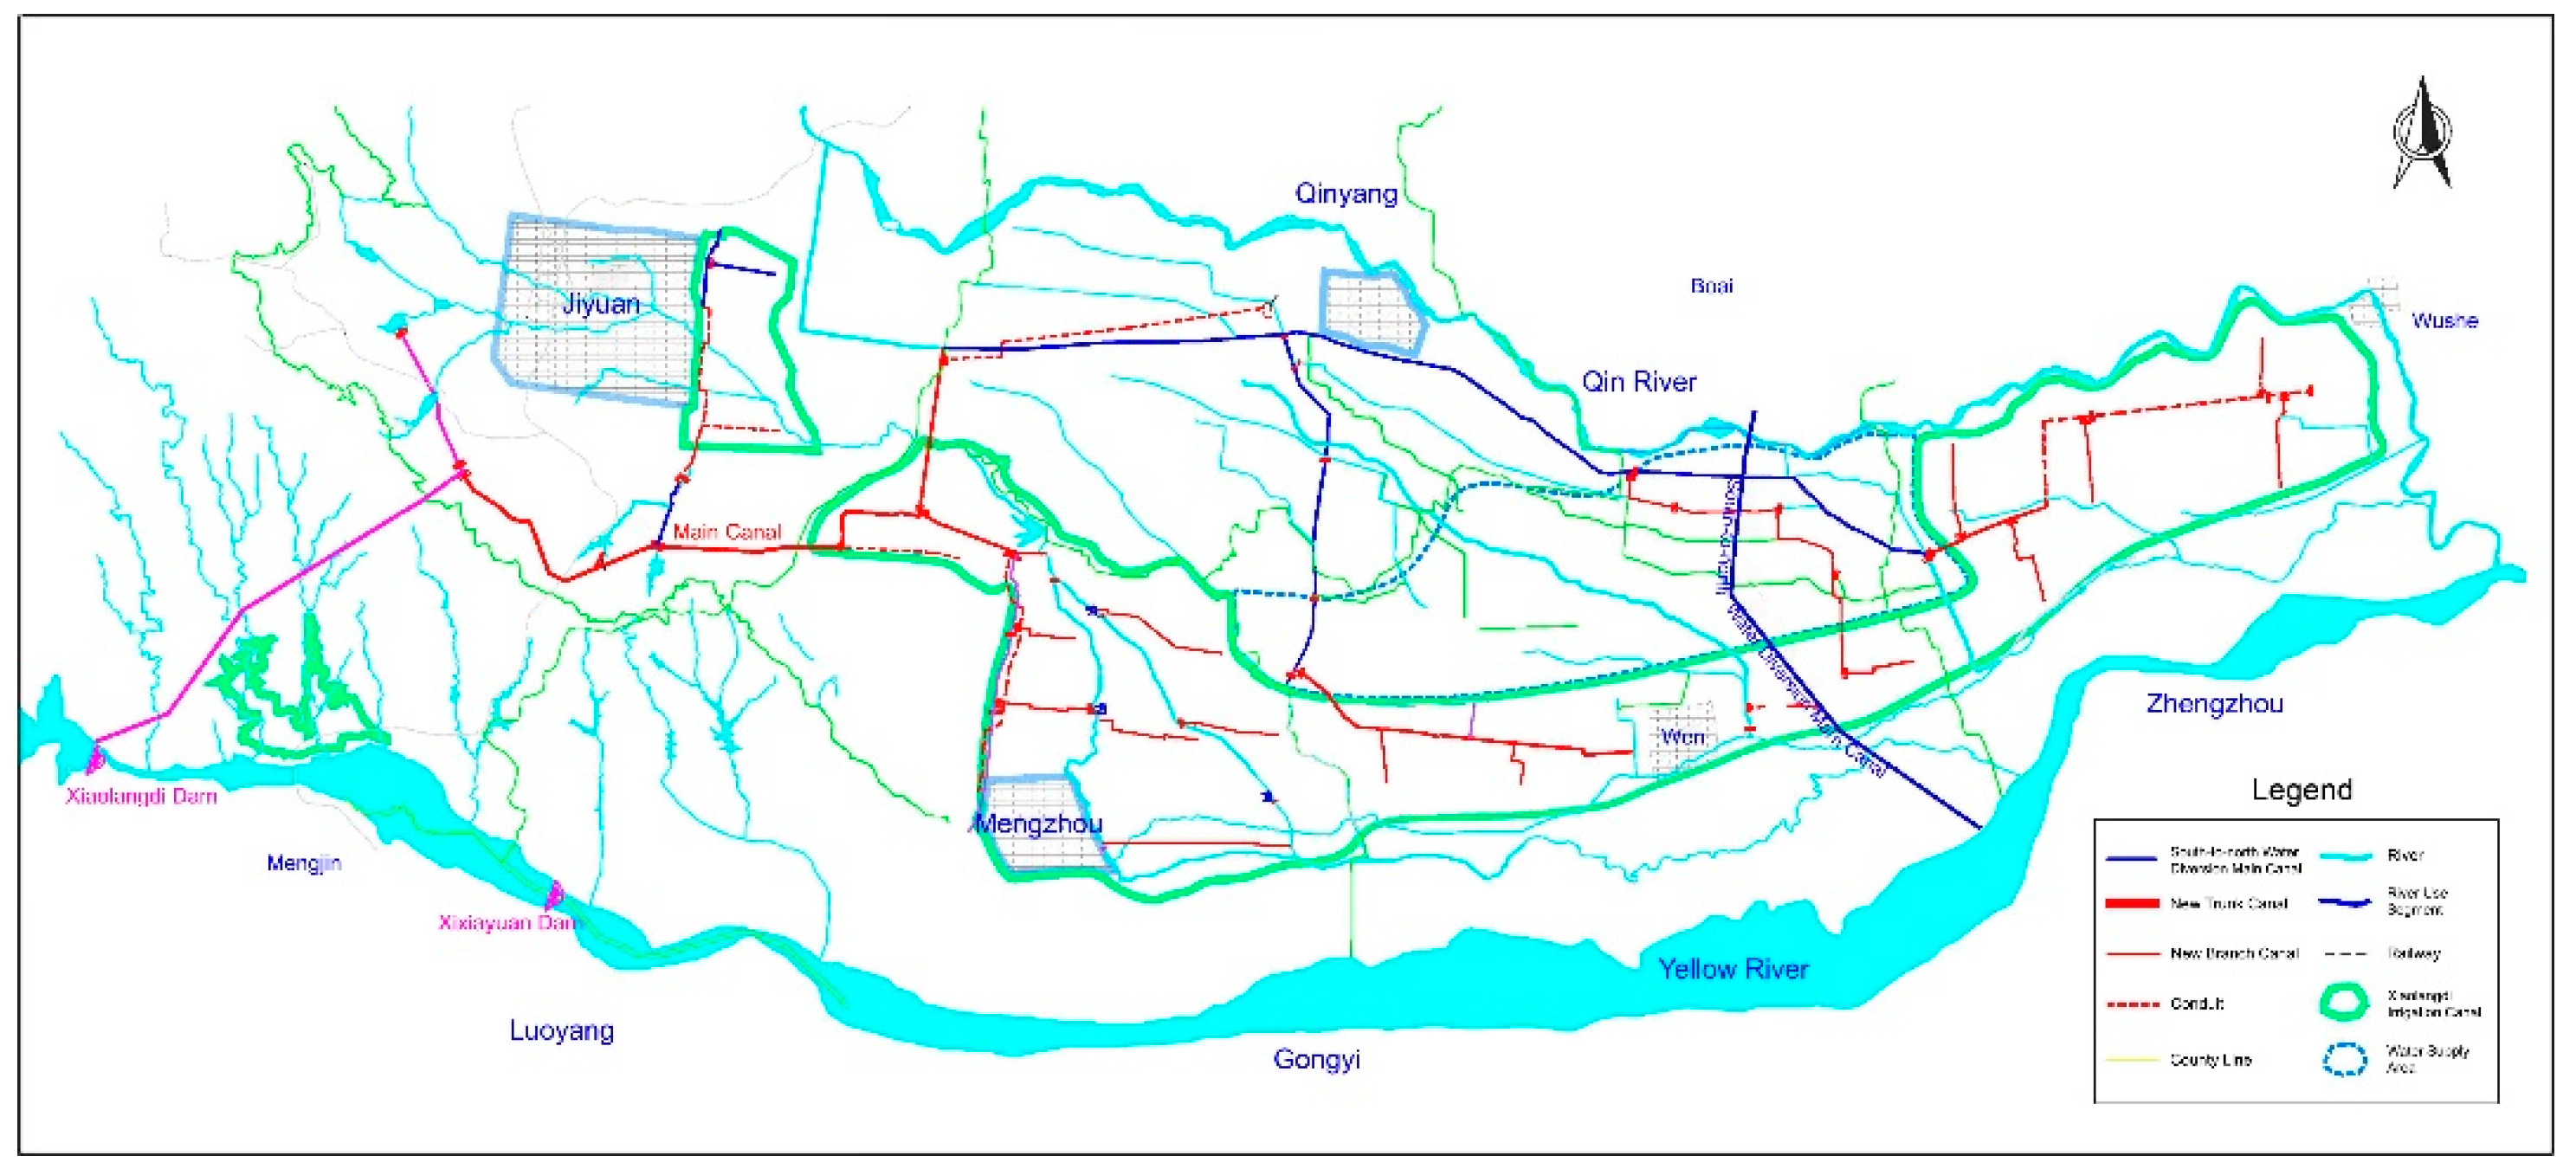
The Xiaolangdi North Bank Irrigation Area in Henan Province is located on the north bank of the Yellow River northeast of the Xiaolangdi Reservoir. It encompasses Jiyuan, Qinyang, and Mengzhou, bordering the Yellow River on the south and the Qinhe River on the north. Geographically, it lies between 112°30′ to 113° east longitude and 34°52′ to 35°5′ north latitude. The western boundary of the irrigation area is marked by the main trunk canal and several primary and secondary canals to the east, while the northern boundary is defined by the Guangli main trunk canal. To the east, it extends to the county boundaries of Qinyang with Bo’ai and Wenxian, and Mengzhou with Wenxian, and to the south it ends at the Yellow River embankment in Mengzhou. The irrigation area measures approximately 41.0 km east to west and 21.0 km north to south, as shown in Figure 1.

Figure 1.
Location map of the study area.
In 2021, the periods of concentrated and sustained rainfall from July to August had a significant impact on the hydrological dynamics of the Xiaolangdi North Bank Irrigation Area in Jiyuan City, Qinyang City, and Mengzhou City. This phenomenon led to a significant increase in soil moisture within a certain depth range of the surface, approaching saturation. Due to the predominantly hilly terrain and sloping plains in the aforementioned areas, coupled with the lag effect of groundwater flow, the groundwater level notably rose from August until October, posing varying degrees of risk to ongoing construction projects such as the Xiaolangdi North Bank Irrigation Area.
Taking the No.1 tunnel of the Xiaolangdi North Bank Irrigation Area Main Channel as an example, it is located in a rocky hill area with significant terrain undulations along its route. The elevation of the ground generally ranges from 213 m to 249 m, with the surface mainly consisting of gentle hills and inter-ridge depressions, many of which have been transformed into terraced fields. According to surveys, the revealed lithology mainly consists of the second section of the Eocene Lushi Formation and the middle Pleistocene eolian and slope alluvial loess. Sandstone, or sandy mudstone, within the research area typically develops pores and fractures, generally exhibiting weak to poor permeability and water richness. Mudstone typically features a network of fractures, mostly in a closed state, with generally poor permeability and water richness. The upper loess generally exhibits weak to moderate permeability. The differential permeability between soil layers and soft rocks, as well as between sandstone and mudstone, results in distinct water-rich characteristics at soil–rock interfaces or sandstone–mudstone interfaces during surface rainfall infiltration, or groundwater runoff. The groundwater is of the infiltration–runoff exploitation type, primarily receiving atmospheric precipitation infiltration, lateral runoff, irrigation, and surface (river, stream, canal, etc.) water infiltration recharge, with discharge mainly through evaporation, artificial extraction, and lateral runoff.
3. Numerical Simulation
3.1. Model Parameters
Utilizing the on-site construction plan, a three-dimensional numerical computational physical model was established using FLAC3D. Suitable model boundaries are selected based on specifications and actual conditions. The model boundaries are set as follows: the upper surface is a free boundary, and all other boundaries are fixed against displacement. The model applies an elastoplastic theory and uses the Mohr–Coulomb criterion within its constitutive framework. The parameters for soil and support are provided in Table 1.

Table 1.
Parameters of soil and support.
Based on the measured terrain on site, a three-dimensional numerical model was established for the section from station ZG20+375 to ZG20+425. The model dimensions are 60 m wide, 40 m long, and extend from the ground surface to an elevation of 160 m, comprising a total of 203,364 elements and 200,431 nodes.
The numerical analysis primarily simulates the process from the advanced grouting of small pipes to excavation up to station ZG20+400. The excavated area is supported by steel arches spaced every 0.5 m intervals and sprayed with a 20 cm thick concrete layer. During the calculation process, cable elements are used to simulate the advanced small pipes. The small pipes are inserted at an angle of 5°, with a length of 5 m, longitudinal overlapping length of 1 m, and spacing of 0.4 m. The three-dimensional computational model is shown in Figure 2.
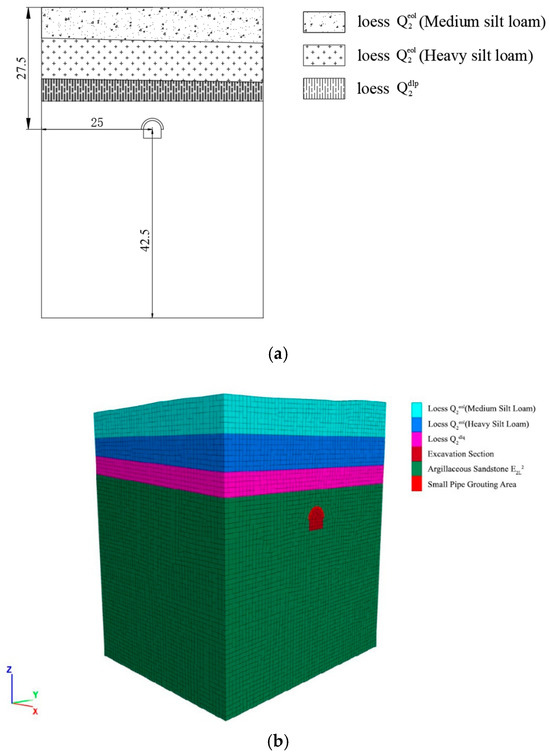
Figure 2.
Stratigraphic information and tunnel 3D model diagram. (a) Tunnel and stratigraphic distribution map (unit: m), (b) 3D computational model.
3.2. Analysis of Numerical Calculation Results
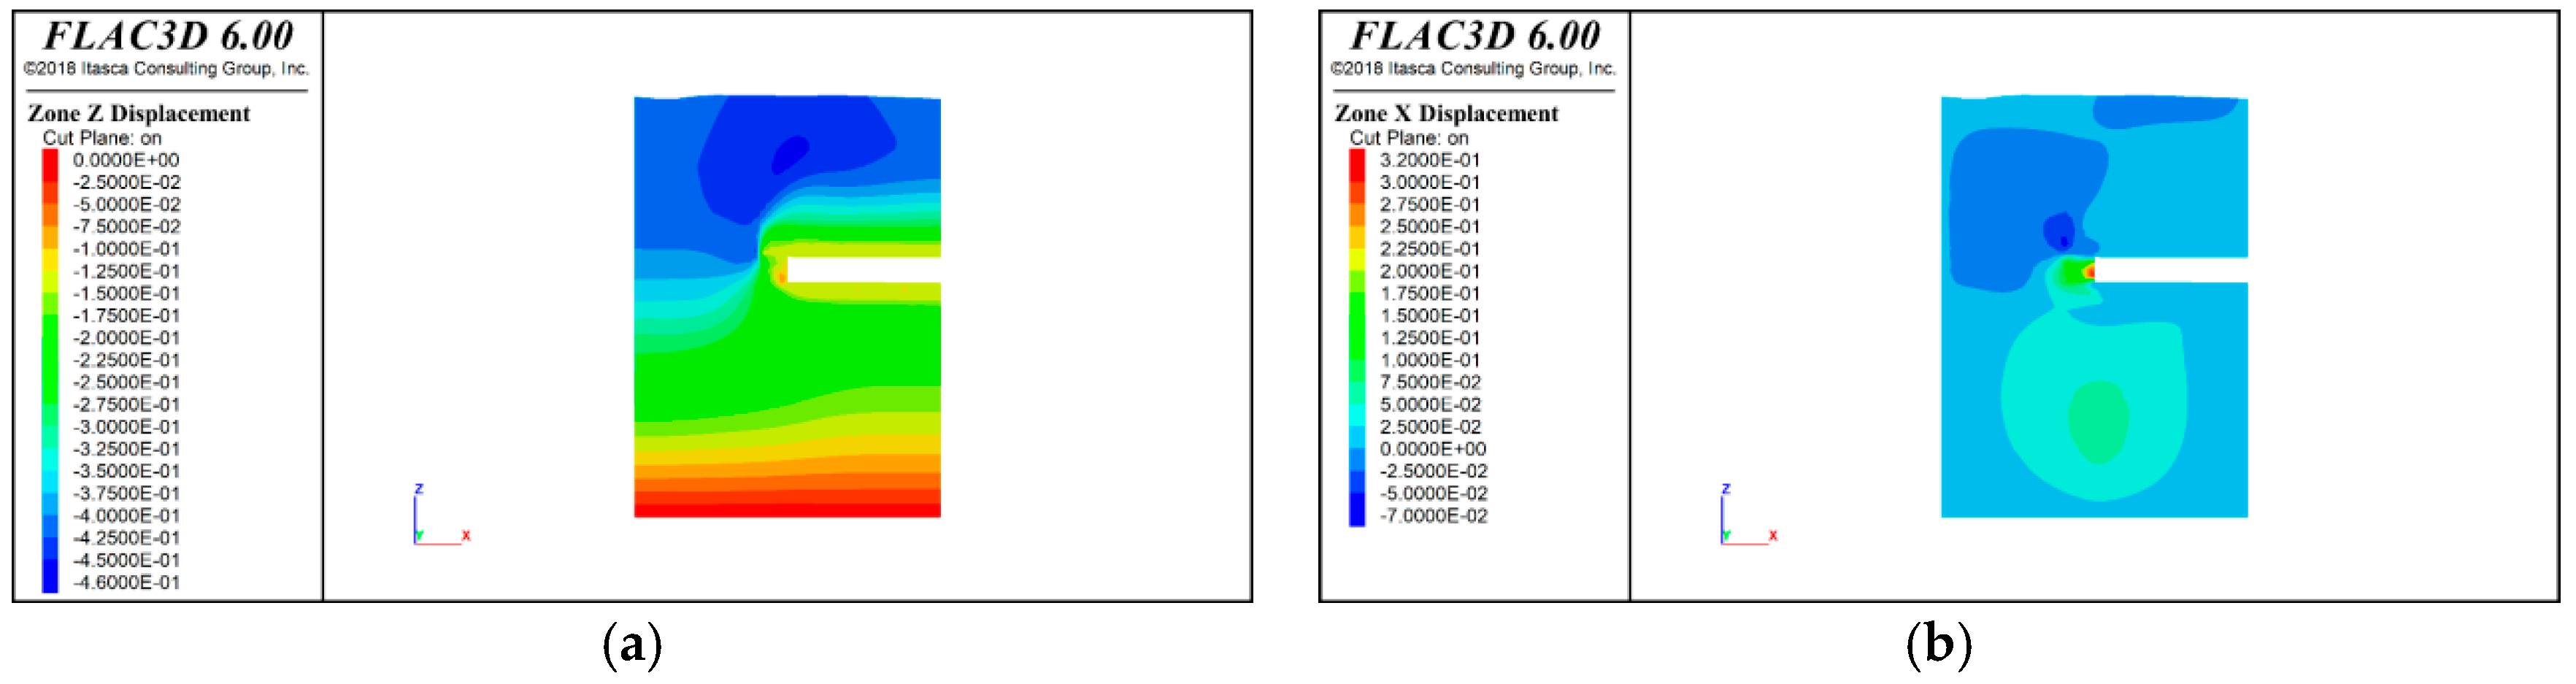
For the scenario with a water level of 215 m, numerical simulation calculations were performed on Tunnel No.1 of the main channel. The settlement data of the overburden soil after tunneling were obtained. Taking the calculation result with the maximum deformation as an example, the vertical and horizontal displacements of the model are shown in Figure 3.
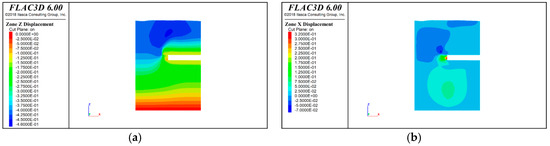
Figure 3.
Model calculation results. (a) Vertical direction (Z direction), (b) horizontal direction (X direction).
From the simulation results, it can be observed that after excavation of the tunnel to station ZG20+400, there is approximately 0.46 m of settlement deformation at the top of the tunnel, and about 0.32 m of horizontal displacement at the face.
3.3. Analysis of Results under Different Conditions
Based on the parameters set in the model and relevant engineering experience, the water level (h), cohesion (c), and friction angle (φ) were determined as the main influencing factors. According to these influencing factors, numerous numerical simulations of tunnel excavation were conducted to understand the displacement variations of the tunnel when the main influencing factors change. Two of the three influencing factors were fixed while the remaining one was treated as a variable for calculation. The specific calculation schemes are outlined in Table 2.
Table 2.
Variation of model parameters.
- (1)
- Relationship between Displacement and Water Level Changes
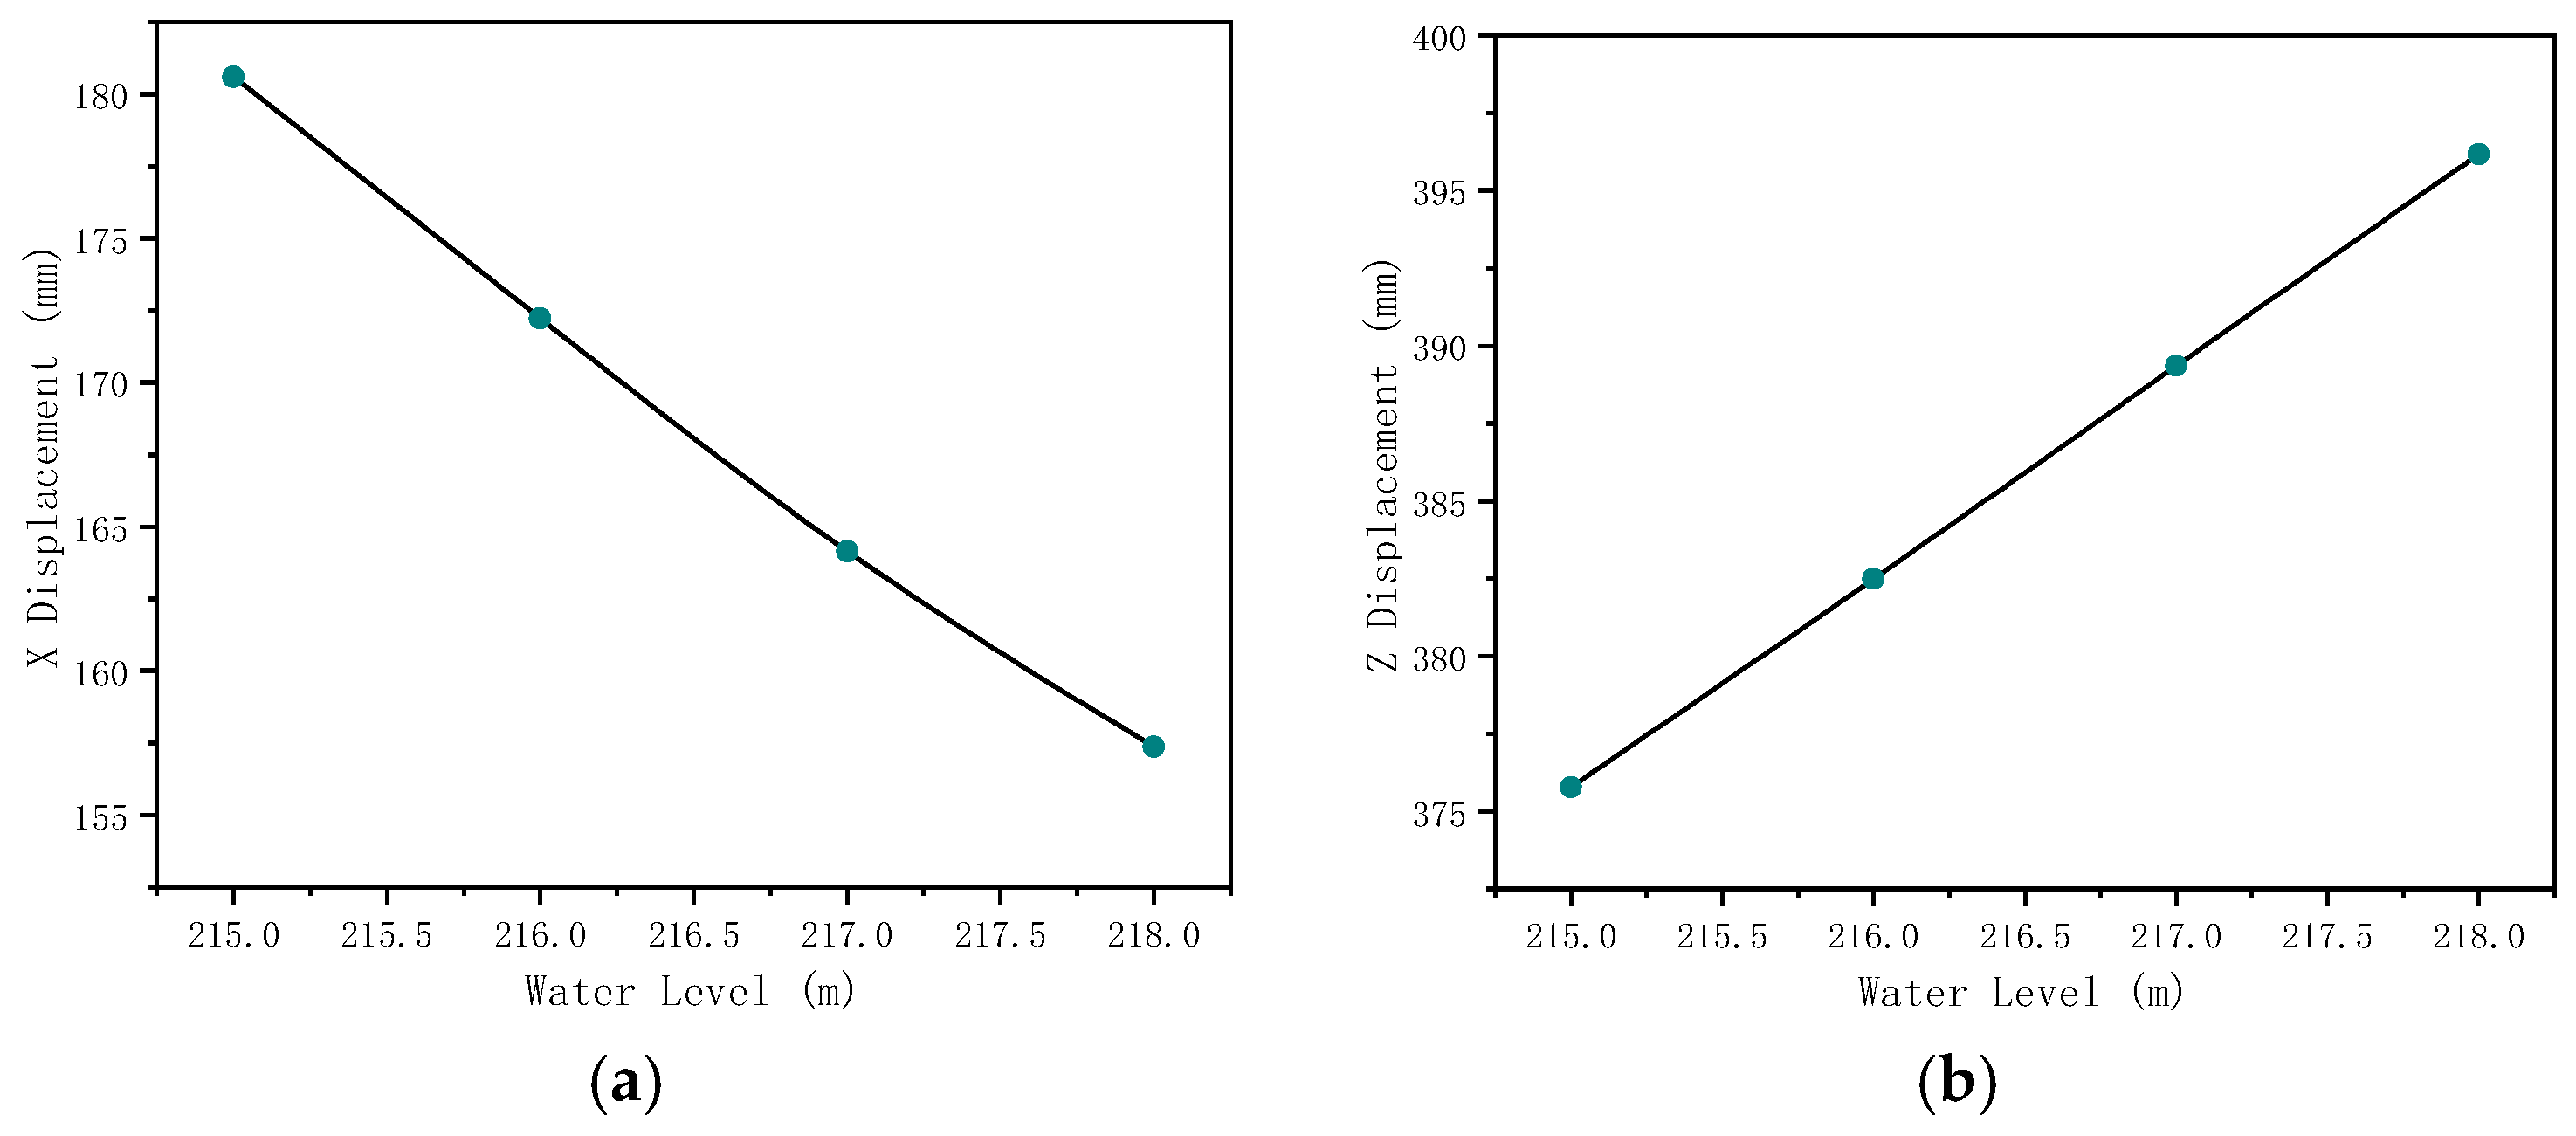
The relationship between displacement and water level changes is illustrated in Figure 4. From the simulation results, it can be observed that the groundwater level significantly influences both the X and Z displacements of the surrounding rock of the tunnel, exhibiting an approximately linear trend. As the groundwater level increases, the X displacement of the surrounding rock of the tunnel shows an approximately linear decrease, while the Z displacement exhibits an approximately linear increase.
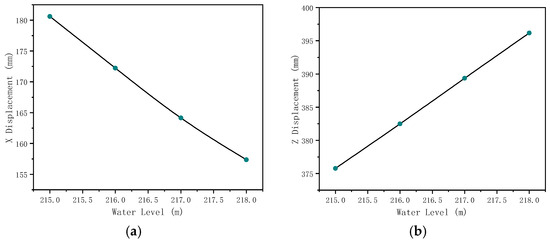
Figure 4.
Influence of water level variation on displacement. (a) Horizontal direction (X direction), (b) vertical direction (Z direction).
- (2)
- Relationship between Displacement and Friction Angle
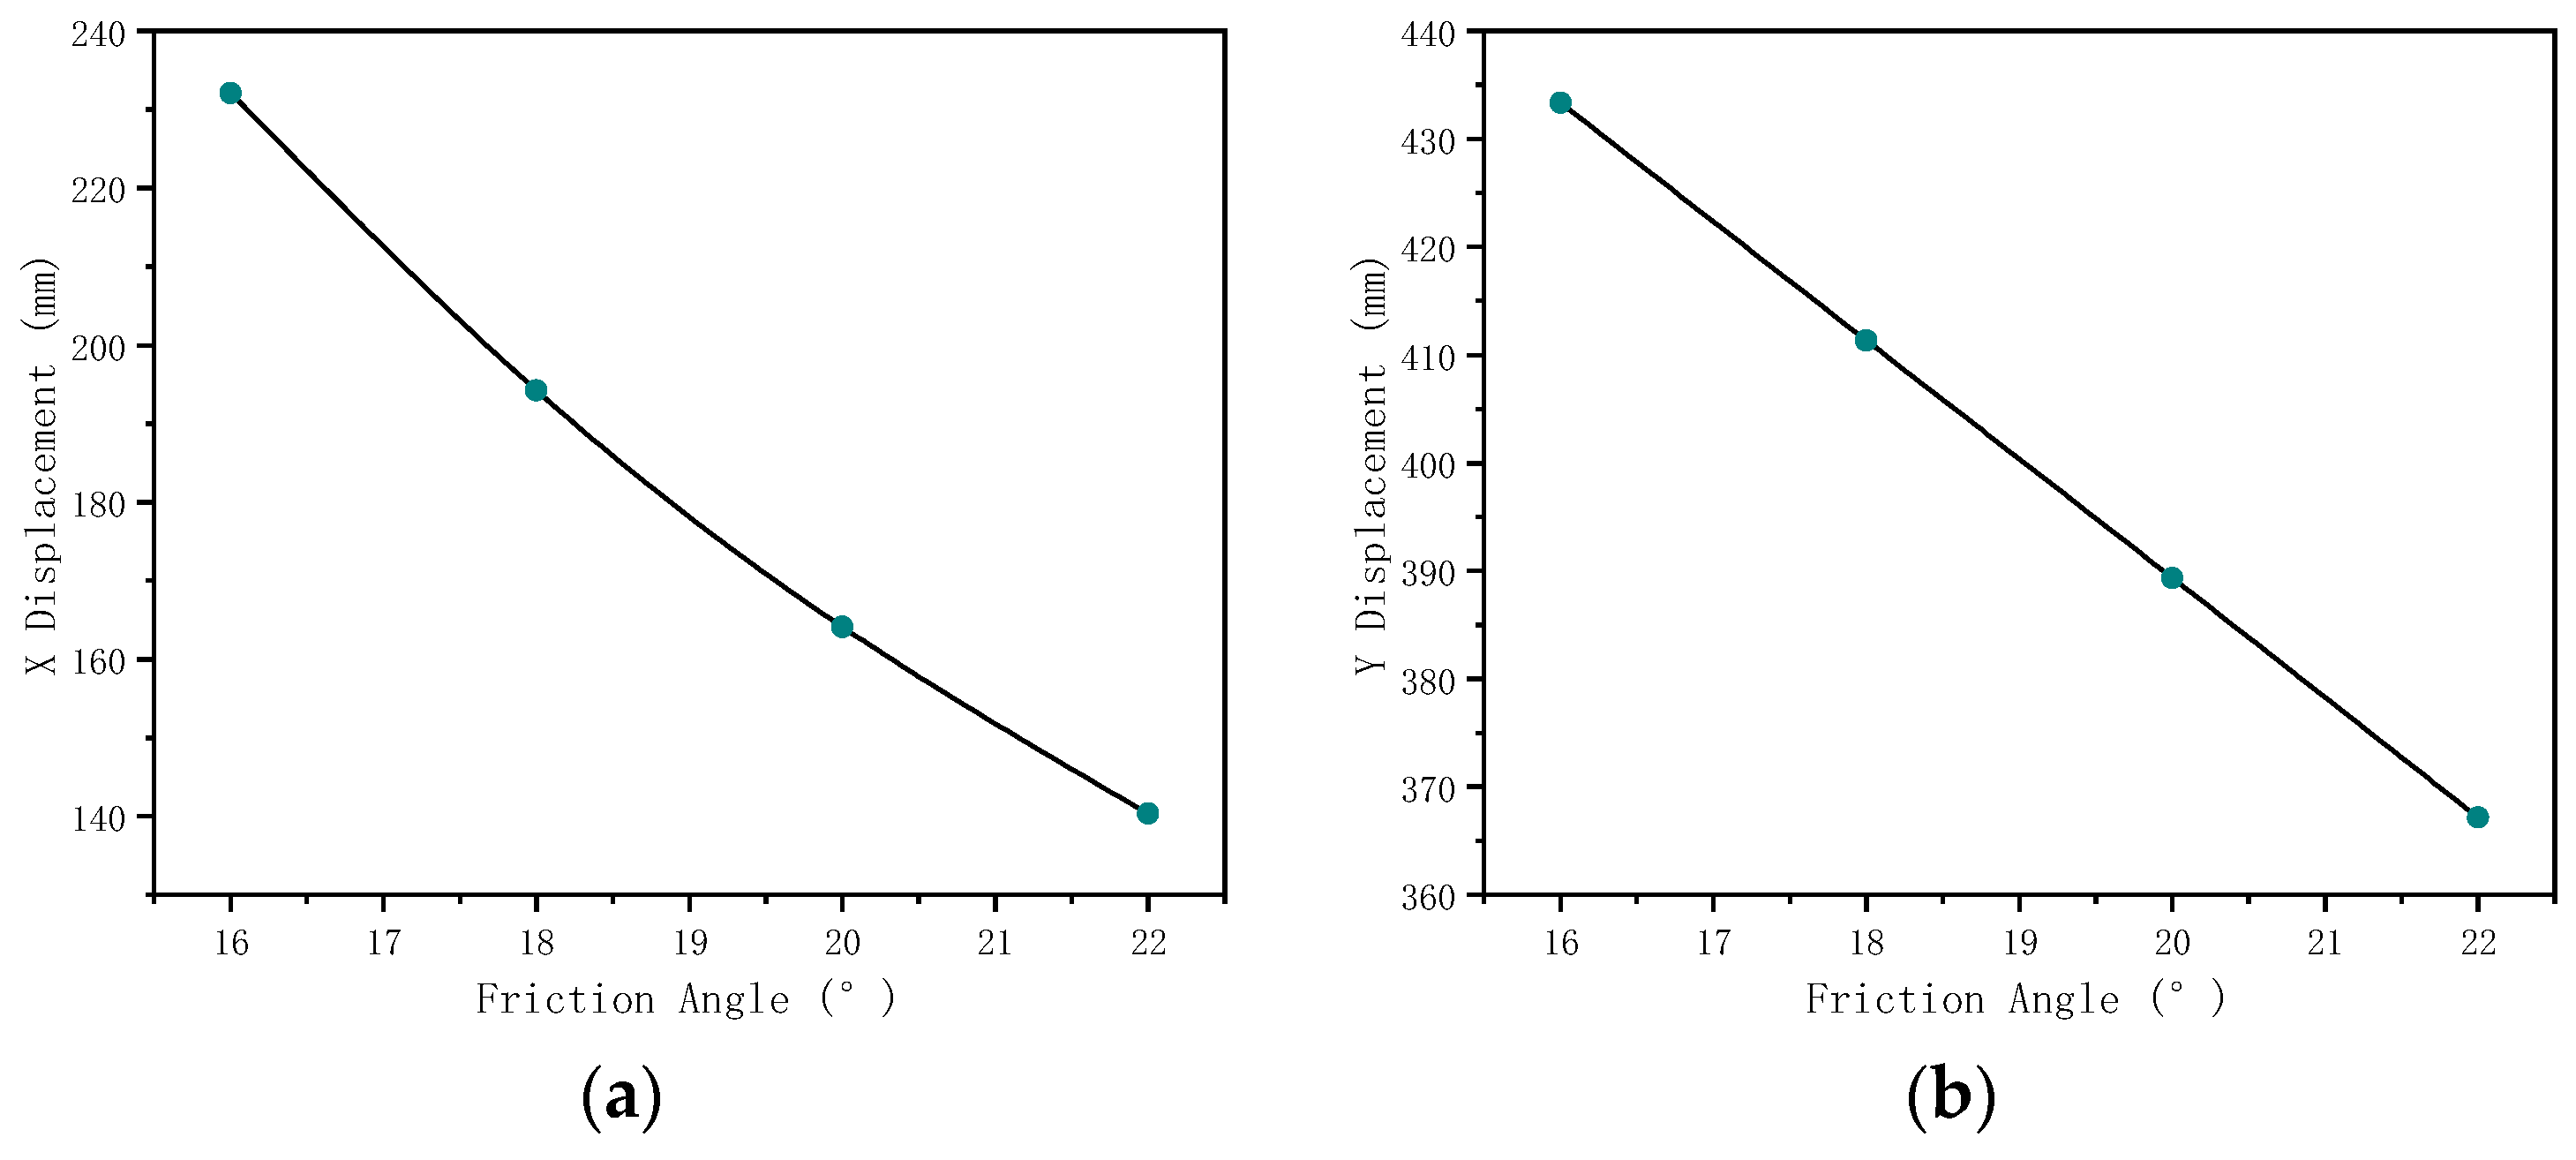
The relationship between displacement and friction angle is depicted in Figure 5. It can be observed that the friction angle significantly influences the deformation of the surrounding rock of the tunnel. As the friction angle increases, both the X and Z displacements exhibit an approximately linear decrease. When the friction angle increases from 16° to 22°, the X displacement of the surrounding rock of the tunnel decreases from 235 mm to 138 mm, and the Z displacement decreases from 432 mm to 367 mm.
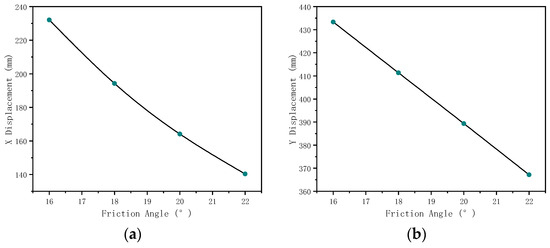
Figure 5.
Influence of friction angle variation on displacement. (a) Horizontal direction (X direction), (b) vertical direction (Z direction).
- (3)
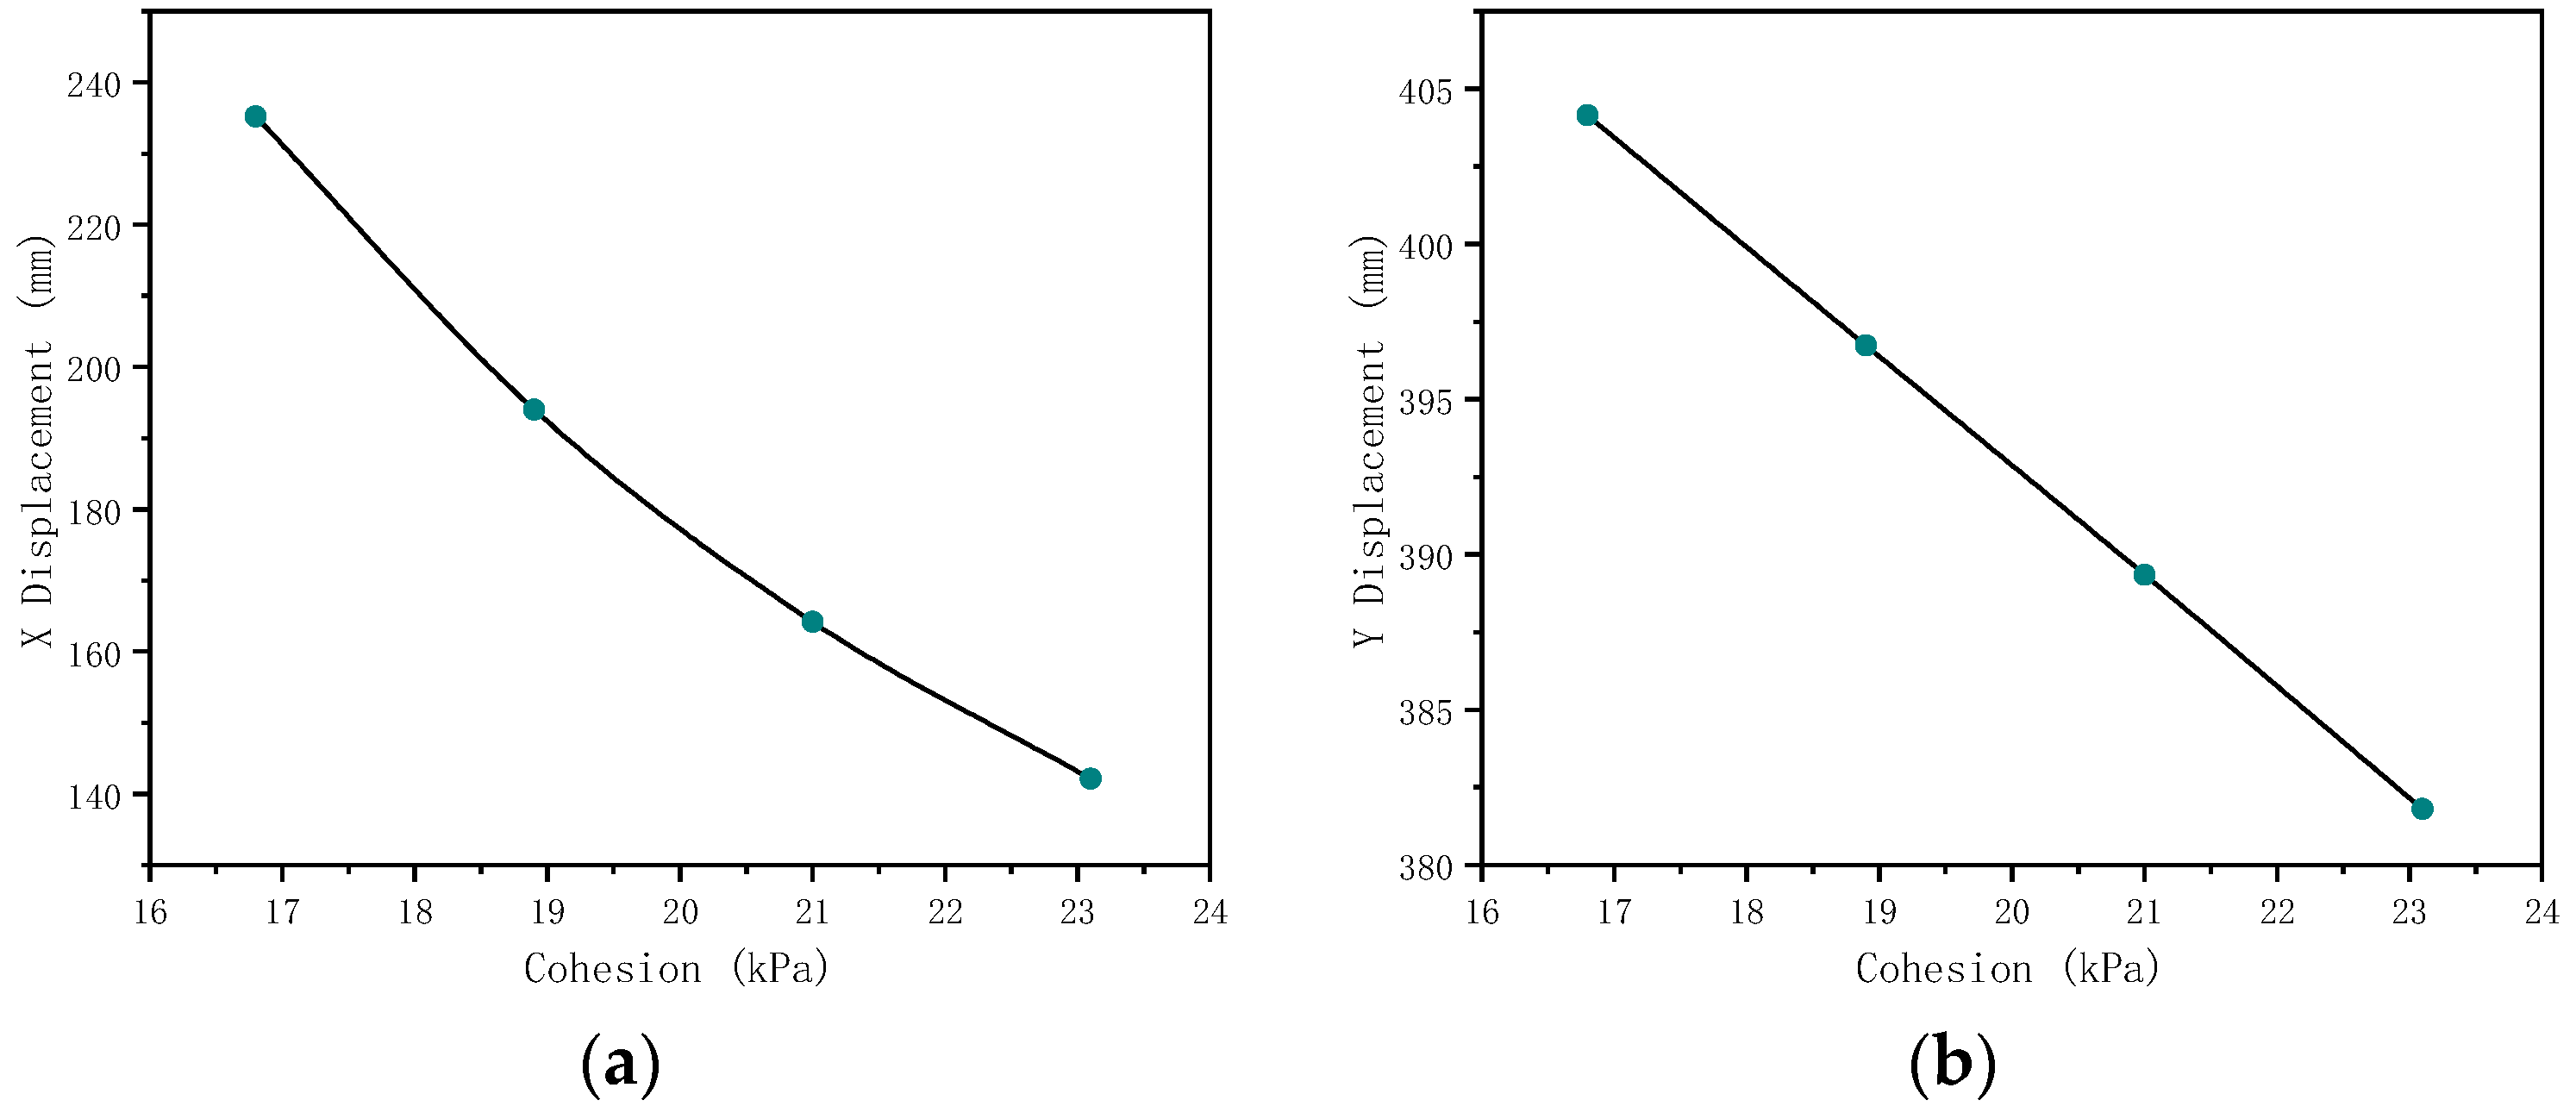
- Relationship between Displacement and Cohesion
The relationship between displacement and cohesion is illustrated in Figure 6. From the simulation results, it can be observed that cohesion also significantly influences both the X and Z displacements of the surrounding rock of the tunnel. As the cohesion increases, both the X and Z displacements exhibit an approximately linear decrease. When the cohesion increases from 16.8 kPa to 23.1 kPa, the X displacement of the surrounding rock of the tunnel decreases from 238 mm to 138 mm, and the Z displacement decreases from 433 mm to 364 mm.
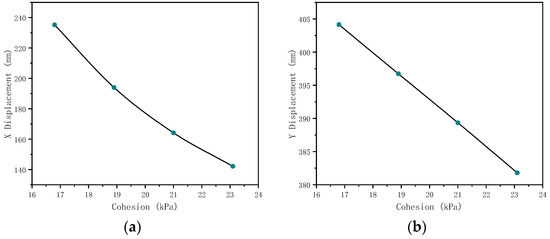
Figure 6.
Influence of cohesion variation on displacement. (a) Horizontal direction (X direction), (b) vertical direction (Z direction).
4. Parameter Sensitivity Analysis
In conjunction with the numerical computation model established using FLAC3D, the main physical–mechanical parameters involved in each soil layer include elastic modulus (E), Poisson’s ratio (μ), cohesion (c), and internal friction angle (φ), totaling 16 parameters. If each parameter were to be inversely computed one by one, the workload would be immense and the calculation challenging. Therefore, it is necessary to conduct a sensitivity analysis on various factors affecting the surface deformation to identify sensitive factors, thereby determining primary and secondary mechanical parameters. Sensitivity analysis assesses parameters of varying sensitivity to ensure the reliability and accuracy of numerical computations.
Sensitivity analysis is a fundamental method within the realm of systems analysis. It assumes that a system consists of system characteristics P and its n factors, represented as P = f(x1, x2, x3, …, xn). Starting with a baseline state P* = f(x1*, x2*, x3*, …, xn*), each factor is varied within its possible range of values to study and predict the impact of these factor variations on the system characteristic P. If a small change in xi can cause a significant change in P, it indicates that P is sensitive to xi, and xi is considered a highly sensitive parameter of system characteristic P; otherwise, it is a low sensitivity parameter. To facilitate comparative analysis of sensitivity between factors, it is necessary to normalize the factors in the system.
The definition of sensitivity Sk is delineated as follows [18,19]:
When the value of is small, Sk can be approximately represented as the following:
where denotes the sensitivity of factor , where k = 1, 2, …, n; represens the relative change rate of the system characteristic; indicates the relative change rate of a certain factor.
Only one factor is varied at a time while keeping other factors constant. The baseline values and variation ranges for each factor are provided in Table 3. An analysis is conducted on the influence of water level (h), cohesion (c), and friction angle (φ) on surface deformation. The surface deformation values under each set of parameters are obtained. Using the sensitivity defined in Equation (1), the sensitivity of each parameter is calculated, as shown in Table 4.
Table 3.
Baseline values and variation ranges for each parameter.
Table 4.
Sensitivity of each parameter to surface deformation.
From Table 4, it can be observed that among the three parameters in the tunnel model, the sensitivity to water level variation is remarkably high at 3.7899, indicating it has the most significant impact on surface deformation. Following water level, the friction angle φ exhibits considerable sensitivity, while cohesion c is the least sensitive. Water level variation is much more sensitive compared to the other parameters, followed by the friction angle. Hence, special attention should be given to the selection of water level values. To obtain more reasonable and accurate values for the soil mechanics parameters, this study chose to inverse calculate seven parameters: friction angles(φ1, φ2, φ3) and cohesion(c1, c2, c3) for layers ④, ④-1, and ⑤, along with water level (h).
5. Orthogonal Design-Based Neural Network Inverse Analysis
5.1. Forward Calculation Scheme with Orthogonal Design
With reference to the range of mechanical parameters derived from geological exploration and laboratory experiments during the project’s initial phase, the ranges of forward calculation values for each parameter were determined. The factors were divided into 10 distinct levels, as depicted in Table 5. An orthogonal experimental design method was used to design different numerical calculation schemes for the factors, determining various combinations of mechanical parameters. These combinations served as inputs for finite difference calculations to obtain the surface settlement values after tunnel excavation. A total of 50 experiments were conducted, and the resulting sets of mechanical parameters and corresponding surface displacement changes were used as training samples for the BP neural network, as shown in Table 6.
Table 5.
Division of levels for each factor.
Table 6.
Training samples for neural network.
5.2. Artificial Neural Network Inverse Analysis
The design principles of the BP neural network are as follows:
- (1)
- Input and output layers: According to the research objectives, a mature artificial neural network structure is trained to infer the values of water level and physical-mechanical parameters of the soil based on the surface subsidence. The input layer consists of one neuron representing the surface subsidence, while the output layer consists of seven neurons representing the friction angle, cohesion, and water level of three different soil layers, outputting a seven-dimensional vector.
- (2)
- Hidden layer: Previous research and applications showed that any function can be approximated to arbitrary precision by a three-layer neural network. Therefore, this model sets the hidden layer to one. The number of neurons in the hidden layer is calculated using the following formula:where n1 represents the number of neurons in the hidden layer; m represents the number of output neurons; n represents the number of input neurons; a is a constant between 1 and 10. In this network structure, n = 1, m = 7. The number of neurons in the hidden layer of the network model was calculated to be between 3 and 13. Different numbers of neurons in the hidden layer were selected for network training. Through testing, it was found that when n1 = 10, the system error is minimal, and the training effect is ideal. The schematic diagram of the neural network model is shown in Figure 7.
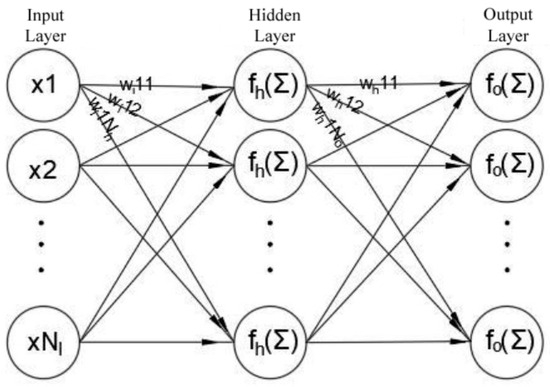 Figure 7. Schematic diagram of the neural network model.
 - (3)
- The process of neural network inverse analysis
Using the BP neural network for the inversion analysis of tunnel soil mechanics parameters involves the following basic steps [20,21,22]: ① Determine the parameters to be inverted and the experimental scheme through the systematic sensitivity analysis method and orthogonal experimental method; ② solve the forward problem using finite difference software to obtain samples reflecting the input–output relationship; ③ design a BP network to learn and train the above samples to determine an appropriate network structure; ④ apply the trained BP neural network to simulate the measured displacement and obtain the values of tunnel soil mechanics parameters.
5.3. Result Analysis
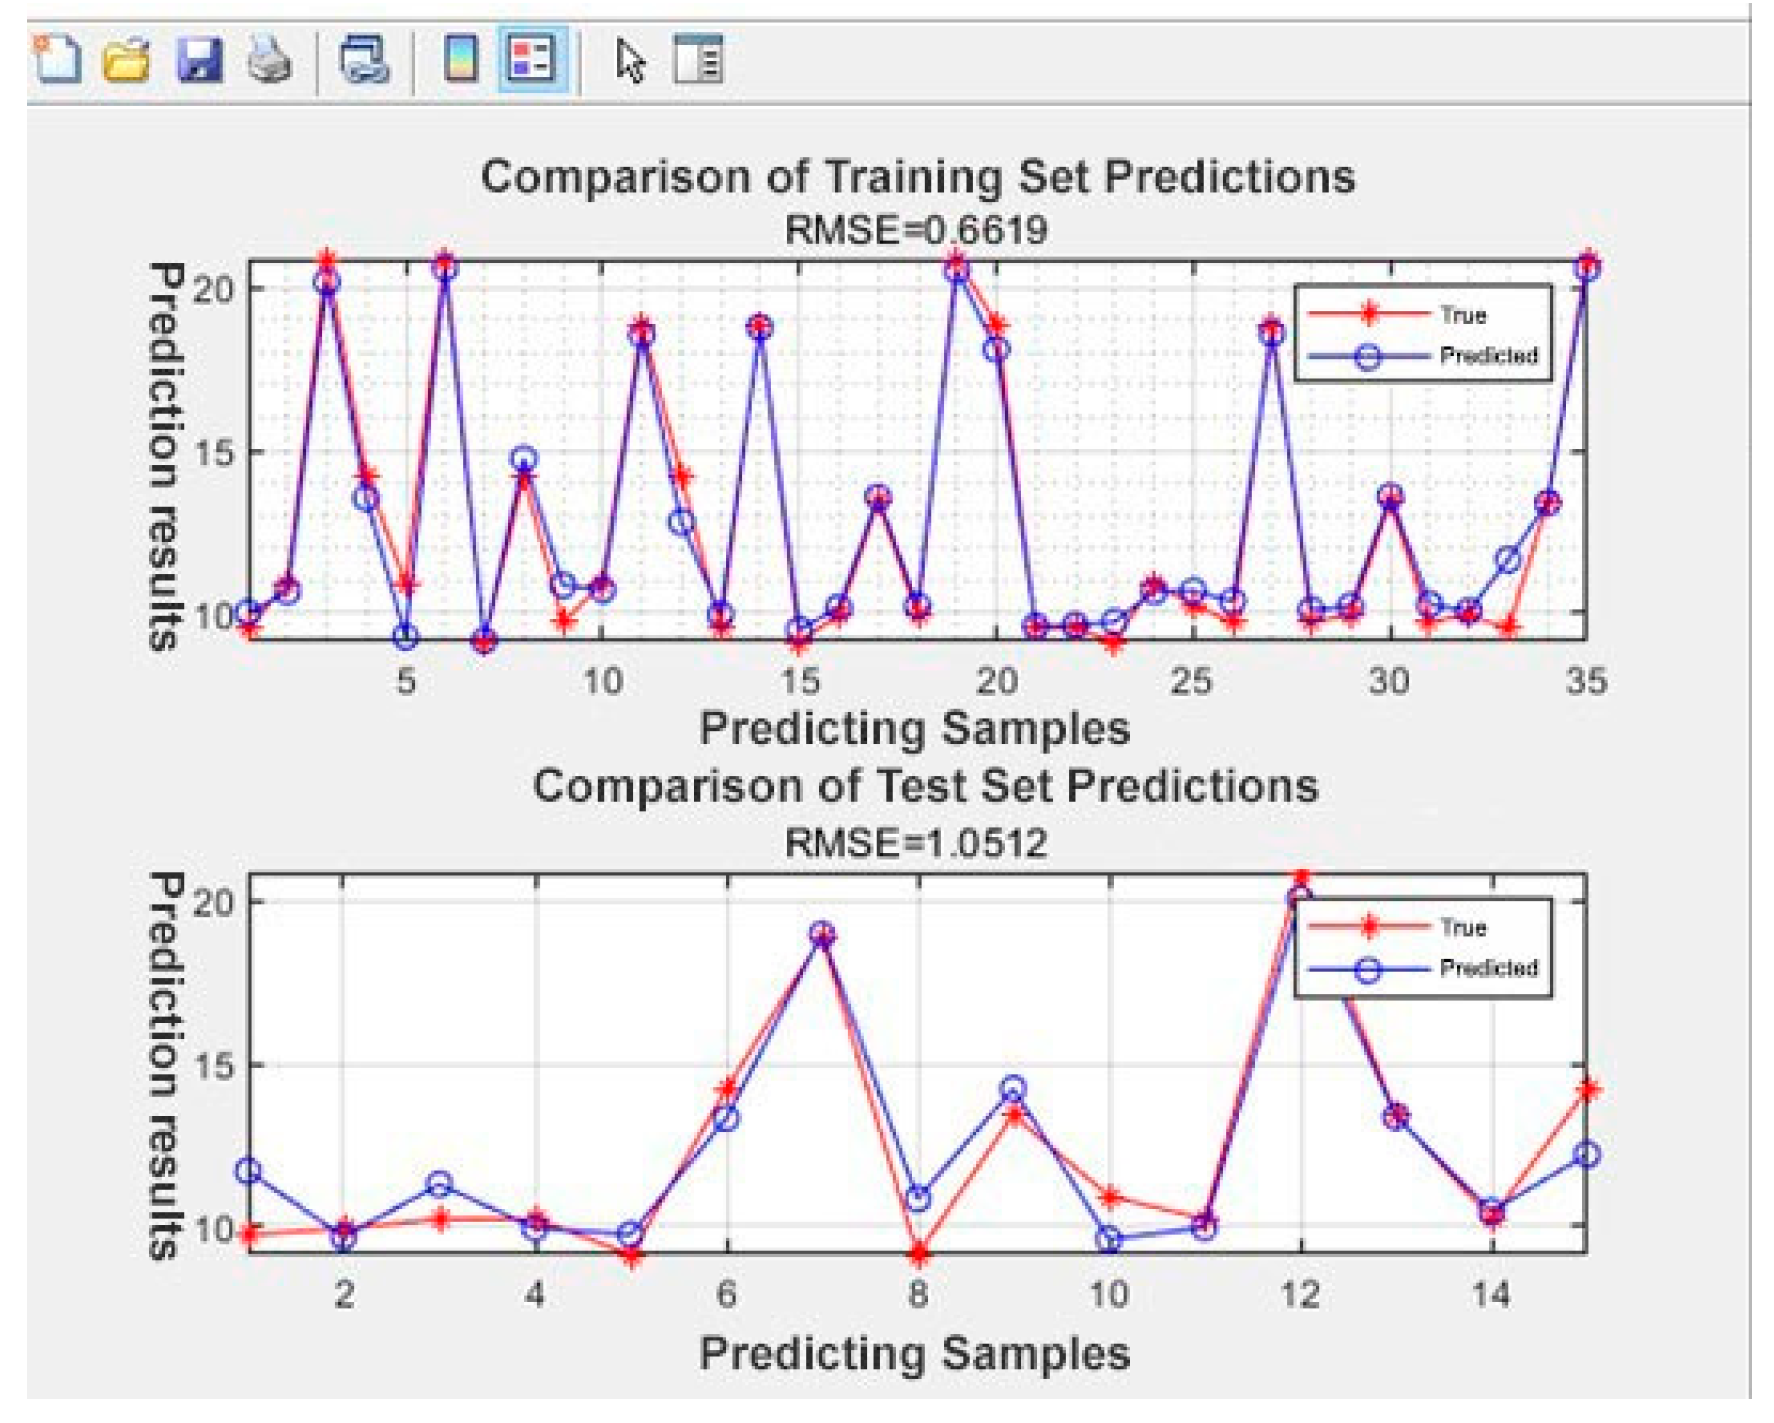
Using the samples to train the BP network, the selected soil physical mechanics parameters are the input vectors, and the settlement of monitoring points on the ground is the output vector. The ‘tansig’ function is selected for activation in the hidden layer, and the ‘logsig’ function is selected for activation in the output layer. The network training adopts the ‘traingdx’ algorithm. After 11 iterations, the neural network converged, achieving a small error. The predicted results for the training set and the testing set are shown in Figure 8.
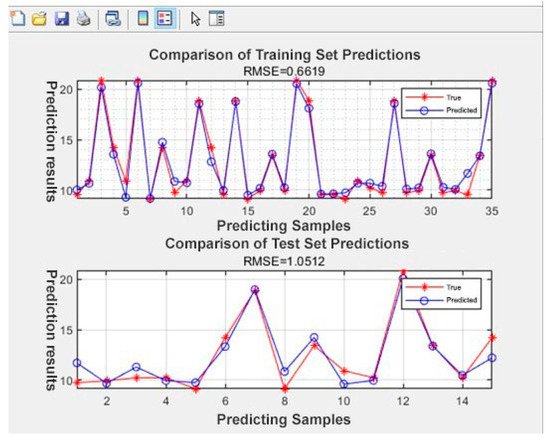
Figure 8.
Comparison of predicted results for training and testing sets.
Selecting the vertical surface displacement u0 = 0.5 (m) and using u0 as an input value into the trained and mature BP neural network, the output results obtained are the selected soil mechanics parameters and water level heights, represented as R = [53.346; 29.129; 30.838; 14.716; 22.189; 3.163; 223.402]. Substituting the inversion results into the forward model established by FLAC3D, the corresponding displacement of the monitoring point is recalculated as u0* = 0.548 m. The forward calculation of the vertical displacement is shown in Figure 9.
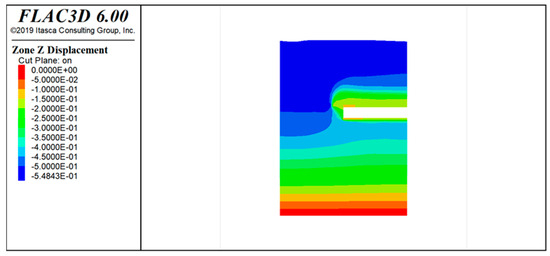
Figure 9.
Contour plot of the forward calculation of vertical displacement.
Table 7 shows the error analysis of the monitored points’ actual values compared to the calculated values. As shown in the table, the relative error between the displacement calculated using the inversion method and the measured displacement is not significantly different, generally within an acceptable range. Therefore, it can be inferred that the various physical–mechanical parameters obtained from the soil inversion are as follows: c1 = 53.346 kPa, φ1 = 29.129°, c2 = 30.838 kPa, φ2 = 14.716°, c3 = 22.189 kPa, φ3 = 3.163°, h = 223.402 m.
Table 7.
Analysis of error between calculated and measured displacement at monitoring points.
6. Conclusions
This study took the No. 1 tunnel of the main canal in the Xiaolangdi North Bank Irrigation Area as an example, and conducted inversion of its soil parameters and water level based on numerical simulation and back-analysis of BP neural network. The following conclusions were drawn:
- (1)
- By numerically simulating the effects of changes in groundwater level and soil parameters on displacement, it was found that groundwater level and soil parameters have a significant impact on the deformation of tunnel surrounding rocks. As the groundwater level rises, the horizontal direction (X direction) displacement of the tunnel surrounding rocks gradually decreases, while the vertical direction (Z direction) displacement gradually increases. With the increase of soil cohesion and internal friction angle, both the horizontal direction (X direction) and vertical direction (Z direction) displacements show a trend of approximate linear decrease.
- (2)
- Through sensitivity analysis of the tunnel parameters, the main influencing parameters and secondary influencing parameters that conform to the actual situation of the project were determined: changes in water level had the most significant impact on surface deformation, followed by the internal friction angle, and the least sensitive was the cohesion.
- (3)
- Parameter inversion analysis provided the following values: cohesion (c1) for loess ④ is 53.346 kPa with an internal friction angle (φ1) of 29.129°, cohesion (c2) for loess ④-1 is 30.838 kPa with an internal friction angle (φ2) of 14.716°, and cohesion (c3) for loess ⑤ is 22.189 kPa with an internal friction angle (φ3) of 3.163°. The groundwater level elevation is 223.402 m. Comparison with field survey results indicated that the calculated values were generally within the specified range provided in the survey report, confirming the reliability of the results.
- (4)
- Comparing the predicted settlement values of the BP neural network with the settlement values calculated by finite element analysis, the absolute error is 0.048 m, and the relative error is 9.6%. The calculation accuracy meets the requirements, and the method has a relatively small relative error compared with the field measurement values. The simulation results are consistent with the actual situation, which verifies the rationality and effectiveness of the method.
Author Contributions
Conceptualization, Z.Z.; Methodology, Y.L., J.D. and B.W.; Software, C.W.; Investigation, B.W.; Resources, Y.L. and Z.Z.; Data curation, B.W.; Writing—original draft, C.W.; Writing—review & editing, C.W.; Visualization, Z.Z. and C.W.; Supervision, Y.L. and J.D.; Project administration, J.D.; Funding acquisition, J.D. All authors have read and agreed to the published version of the manuscript.
Funding
This research work is sponsored by the Henan Province 2022 Water Science and Technology Project (Grant No. GG202268), the Key Research and Development Project of Henan Province (Grant No. 241111322900), the National Key Research and Development Project of China (Grant Nos. 2019YFC1509704 and 2019YFC1509701), the National Natural Science Foundation of China (Grant Nos. U1704243, 41741019 and 41977249), Henan Provincial Science and Technology Research Project (Grant Nos. 192102310006 and 232102320035), Key Research Projects of Higher Education Institutions in Henan Province (Grant No. 24A410003).
Institutional Review Board Statement
Not applicable.
Informed Consent Statement
Not applicable.
Data Availability Statement
The original contributions presented in the study are included in the article, further inquiries can be directed to the corresponding author.
Conflicts of Interest
Authors Yongxin Li, Zhimin Zhang and Bobo Wang were employed by the Henan Water Conservancy Survey Co., Ltd. The remaining authors declare that the research was conducted in the absence of any commercial or financial relationships that could be construed as a potential conflict of interest.
References
- Luo, Y.; Yang, J.; Xie, Y.; Fu, J.; Zhang, C. Investigation on Evolution Mechanism and Treatment of Invert Damage in Operating Railway Tunnels under Heavy Rainfall. Bull. Eng. Geol. Environ. 2024, 83, 160. [Google Scholar] [CrossRef]
- Zhang, Z.; Huang, M.; Pan, Y.; Li, Z.; Ma, S.; Zhang, Y. Time-Dependent Analyses for Ground Movement and Stress Field Induced by Tunnelling Considering Rainfall Infiltration Mechanics. Tunn. Undergr. Space Technol. 2022, 122, 10378. [Google Scholar] [CrossRef]
- Fan, C.; Luan, D.; Bu, R.; Sheng, Z.; Wang, F.; Huang, X. Can Heavy Rainfall Affect the Burning and Smoke Spreading Characteristics of Fire in Tunnels? Int. J. Heat Mass Transf. 2023, 207, 123927. [Google Scholar] [CrossRef]
- He, W. Excavation Stability Analysis of Long Span Calcareous Cemented Loess Tunnel under Water Erosion. Chin. J. Undergr. Space Eng. 2021, 17, 311–318. (In Chinese) [Google Scholar]
- Tu, S.; Li, W.; Zhang, C.; Wang, L.; Jin, Z.; Wang, S. Seepage Effect on Progressive Failure of Shield Tunnel Face in Granular Soils by Coupled Continuum-Discrete Method. Comput. Geotech. 2024, 166, 106009. [Google Scholar] [CrossRef]
- Li, L.; Tu, W.; Zhou, Z.; Shi, S.; Zhang, M.; Chen, Y. Dynamic Unloading Instability Mechanism of Underground Cavern Based on Seepage-Damage Coupling. KSCE J. Civ. Eng. 2020, 24, 1620–1631. [Google Scholar] [CrossRef]
- Xie, G.; Wang, Y.; Lei, H. Numerical Simulation of Excavation of a Highway Underpass Tunnel Based on FLAC3D Fluid-Solid Coupling. Road Traffic Technol. (Appl. Technol. Ed.) 2019, 15, 287–289. (In Chinese) [Google Scholar]
- Zhu, J.; Chen, Q. Sensitivity Analysis and Intelligent Inversion of Mechanical Parameters of Surrounding Rock of Baishui Tunnel. J. Hunan Univ. Arts Sci. (Nat. Sci. Ed.) 2019, 31, 85–89. (In Chinese) [Google Scholar]
- Khamesi, H.; Torabi, S.; Mirzaei-Nasirabad, H.; Ghadiri, Z. Improving the Performance of Intelligent Back Analysis for Tunneling Using Optimized Fuzzy Systems: Case Study of the Karaj Subway Line 2 in Iran. J. Comput. Civ. Eng. 2016, 29, 05014010. [Google Scholar] [CrossRef]
- Xiao, M.; Liu, H.; Peng, C.; Gong, S.; Yang, P. Back Analysis of Deep Soft Soil Parameters Based on Neural Network. Chin. J. Undergr. Space Eng. 2017, 13, 279–286. (In Chinese) [Google Scholar]
- Liu, C.; Zhou, S.; Liu, H. Research on Back Analysis of Tunnel Displacement Based on Improved BP Neural Network. Highway 2021, 66, 385–392. (In Chinese) [Google Scholar]
- Zhou, G.; Sun, Y.; Jia, P. Application of Genetic Algorithm Based BP Neural Network to Parameter Inversion of Surrounding Rock and Deformation Prediction. Mod. Tunn. Technol. 2018, 55, 107–113. (In Chinese) [Google Scholar]
- Ling, T.; Qin, J.; Song, Q.; Hua, F. Intelligent Displacement Back-Analysis Based on Improved Particle Swarm Optimization and Neural Network and Its Application. J. Railw. Sci. Eng. 2020, 17, 2181–2190. (In Chinese) [Google Scholar]
- Wang, J.; Sun, J.; Kou, H.; Lin, Y. Multiparameter Inversion Early Warning System of Tunnel Stress-Seepage Coupling Based on IA-BP Algorithm. Adv. Civ. Eng. 2021, 2021, 1566693. [Google Scholar] [CrossRef]
- Zhang, Z.; Zhou, C.; Xia, Z.; Miao, G.; Zhang, D.; Jiang, N. Sensitivity Analysis and Orthogonal Backward Analysis of Soil Parameters for Subway Tunnel. J. Cent. South Univ. (Sci. Technol.) 2013, 44, 2488–2493. (In Chinese) [Google Scholar]
- Han, U.; Choe, C.; Hong, K.; Han, H. Intelligent Back Analysis of Geotechnical Parameters for Time-Dependent Rock Mass Surrounding Mine Openings Using Grey Verhulst Model. J. Cent. South Univ. 2021, 28, 3099–3116. [Google Scholar] [CrossRef]
- Han, X.; Chen, B.; Xu, Y.; Li, R. Sensitivity Analysis of Mechanical Parameters in Excavation of Soil Caverns. J. North China Univ. Water Resour. Electr. Power (Nat. Sci. Ed.) 2019, 40, 76–82. (In Chinese) [Google Scholar]
- Li, J.; Sun, W.; Su, G.; Zhang, Y. An Intelligent Optimization Back-Analysis Method for Geomechanical Parameters in Underground Engineering. Appl. Sci. 2022, 12, 5861. [Google Scholar] [CrossRef]
- Zheng, F.; Jiang, A.; Guo, X.; Min, Q.; Yin, Q. Back Analysis of Surrounding Rock Parameters of Large-Span Arch Cover Station Based on GP-DE Algorithm. Appl. Sci. 2022, 12, 12590. [Google Scholar] [CrossRef]
- Li, H.; Chen, W.; Tan, X. Displacement-Based Back Analysis of Mitigating the Effects of Displacement Loss in Underground Engineering. J. Rock Mech. Geotech. Eng. 2023, 15, 2626–2638. [Google Scholar] [CrossRef]
- Liu, K.; Liu, B. Intelligent Information-Based Construction in Tunnel Engineering Based on the GA and CCGPR Coupled Algorithm. Tunn. Undergr. Space Technol. 2019, 88, 113–128. [Google Scholar] [CrossRef]
- Li, S.; Yang, J.; Hao, W.; Shang, Y. Intelligent Back-Analysis of Displacements Monitored in Tunneling. Int. J. Rock Mech. Min. Sci. 2006, 43, 1118–1127. [Google Scholar] [CrossRef]


Disclaimer/Publisher’s Note: The statements, opinions and data contained in all publications are solely those of the individual author(s) and contributor(s) and not of MDPI and/or the editor(s). MDPI and/or the editor(s) disclaim responsibility for any injury to people or property resulting from any ideas, methods, instructions or products referred to in the content. |
© 2024 by the authors. Licensee MDPI, Basel, Switzerland. This article is an open access article distributed under the terms and conditions of the Creative Commons Attribution (CC BY) license (https://creativecommons.org/licenses/by/4.0/).