Article

Combining Eye-Tracking Technology and Subjective Evaluation to Determine Building Facade Color Combinations and Visual Quality

1
College of Communication and Art Design, University of Shanghai for Science and Technology, Shanghai 200093, China
2
Architecture and Environmental Design Field, Major of Art and Environment, Arts Studies, Graduate School, Kyoto University of The Arts, 2-116 Kitashirakawa Uryuzancho, Sakyo Ward, Kyoto 606-8271, Japan
*
Author to whom correspondence should be addressed.
Appl. Sci. 2024, 14(18), 8227; https://doi.org/10.3390/app14188227
Submission received: 1 August 2024 / Revised: 7 September 2024 / Accepted: 9 September 2024 / Published: 12 September 2024
(This article belongs to the Special Issue Latest Research on Eye Tracking Applications)

Abstract

:

Featured Application

Exploring the visual quality of architectural color combinations through eye physiological feedback using eye-tracking technology.

Abstract

Architectural colors significantly influence urban culture, city imagery, regional vitality, and residential experiences. Previous studies have demonstrated that appropriate architectural colors can enhance urban vitality, but research on multicolored buildings remains limited. This study examines the relationship between hue, color variations, and visual quality by cross-verifying eye-tracking physiological indicators with subjective assessments. Using digital models of old residential buildings in Shanghai’s Yangpu District, different color combinations were applied to explore real-world architectural color impacts. Results showed that blue and green combinations reduced visual pressure and created a calming space, while purple combinations were rated highly in both visual perception and subjective evaluations. Brightness differences notably influenced visual quality more than hue differences. However, larger hue variations, when paired with suitable brightness and saturation contrasts, also achieved better visual evaluations. This study fills a research gap by providing mathematical support for color combinations in architectural design, improving visual comfort and enhancing urban vitality.

1. Introduction

1.1. Research Status of Architectural Color

Urban color plays a crucial role in urban spaces, significantly influencing a city’s image, attractiveness, and addressing specific economic and practical issues [1]. Additionally, it conveys materiality, spatial context, and cultural significance [2]. As a key component of urban color, architectural color holds significant value in creating visually appealing cities due to its distinct visual characteristics [3]. With the continuous evolution of society, the demand for aesthetic sensitivity in the appearance of residential buildings has further increased [4]. Architectural color is highly flexible in its expressiveness, and the color choices for individual buildings are based on a comprehensive consideration of external factors. Beyond their ornamental and decorative functions, unified, harmonious, and stable color combinations play a decisive role in shaping the surrounding environment and influencing people’s emotions. The harmony and diversity of building facade colors significantly affect people’s perceptions and preferences regarding the urban environment [3].
Architectural color also functions as a form of cultural capital, offering innovative approaches to the sustainable development of culture [5]. Collette and Nguyen revealed how appropriate architectural color plays a fundamental role in maintaining the identity of specific environments in the face of cultural homogenization driven by globalization [6]. The symbolic value embedded in architectural color enhances the identity and cultural recognition of the built environment through the “color–emotion association” mechanism [7]. Beyond its cultural significance, well-applied architectural color can improve consumer preferences, thereby increasing its economic value [8]. Consequently, the visual quality of architectural color plays a crucial role in regional development.
Currently, scholars are researching architectural color from various perspectives. J. Wang et al. [4] analyzed the quantity and proportion of different color attributes at various evaluation levels by incorporating subjective evaluation factors, systematically identifying the characteristics of the three elements of residential building color. Gou [9] researched the spatial attributes of color configuration, highlighting the importance of color layout and visual hierarchy in architectural design. Hogg et al. [10], Shi et al. [11], Z. Wang [12] and Zarghami et al. [13] from a humanistic perspective, explored the relationship between the three elements of color and visual preferences, providing theoretical support for architectural color renewal. Existing research on architectural color primarily focuses on color selection, color proportion, and subjective analysis of color elements [14]. Various studies have shown that warm color schemes can achieve better visual effects in residential buildings [4], the evaluation of residential buildings decreases with lower brightness [15], and high-saturation colors can cause visual discomfort [11]. In China, architectural color reflects spatial configuration through its hierarchical structure [9].
In addition to the color elements of building facades, colors themselves possess various attributes and planning principles [16]. For instance, the harmony, diversity, and comfort of color combinations are closely linked to visual quality [17]. However, current research on the harmony of color combinations requires further exploration. Therefore, systematic studies of color combinations and their impact on the visual quality of multicolored buildings could offer new research potential [18].

1.2. Visual Quality

Visual quality is defined as environmental characteristics that are conducive to visual comfort [19]. It is a critical aspect of urban planning [20], playing a vital role in shaping a city’s image and significantly enhancing the overall livability of urban areas [21]. Visual comfort serves as a key indicator for measuring visual quality and is one of the quantifiable metrics that directly reflect it. The visual quality of a city greatly influences public appreciation of the urban environment [22].
In natural landscapes, Mundher et al. [23] described and measured visual quality by considering both the visual characteristics and comfort of urban natural landscapes, integrating objective and subjective factors. This research provided urban planners with theoretical support for preserving urban natural landscapes. Ma et al. [24] explored the relationship between plant mechanisms, color, and visual aesthetic quality by studying the colors of vegetation in urban spaces, aiming to enhance the visual quality of urban streets. Z. Zhang et al. [25] examined the relationship between the color composition elements of forest landscapes and the estimated scenic beauty values from a macro-perspective, establishing an evaluation framework for assessing the visual quality of forest landscapes.
In architectural landscapes, numerous studies have focused on the visual quality of various building types, including historic preservation buildings, commercial buildings, and residential structures. These studies examine the relationship between the physical design elements of building facades and visual quality, aiming to enhance the overall visual comfort of urban streets. Bu et al. [26] investigated the balance of visual comfort between new high-rise buildings and historic structures, with the goal of better protecting historic buildings amidst rapid urban development. Zanon et al. [19] conducted simulations of light comfort in indoor built environments to explore the relationship between lighting conditions and the visual quality of indoor spaces. Other studies, focusing on aspects such as the visual comfort of advertising signs, plant colors and combinations, and lighting environments [22,24,26,27], propose more targeted strategies—based on the user perspective—to improve regional visual quality.
Mundher et al. [23] explicitly proposed defining and interpreting urban forest aesthetics based on the classification of visual characteristics of urban forests. The correlation between the visual quality of forest colors and the scenic beauty of forests has already been confirmed in previous studies [25]. Additionally, Ma et al. [24] found that street plant landscapes with red hues tend to achieve higher visual landscape quality.
Previous studies have systematically examined the visual quality of various visual elements. However, old residential buildings, as a significant part of the urban visual landscape [4], have rarely been the focus of color-related visual quality research. Therefore, this study focuses on the colors of aging residential buildings in urgent need of renovation, systematically analyzing the visual quality of their colors.

1.3. Evolution of Research Techniques

Objective and quantitative research on visual quality is becoming increasingly important in urban planning [28] (Appendix A). Previous studies have relied on user evaluations within specific geographical areas to assess visual perception quality. However, subjective evaluations are influenced by constantly changing psychological preferences and experiences [29]. The lack of robust generalizability in empirical surveys based on subjective evaluations makes them unsuitable for supporting more rigorous visual quality research.
The widespread application of computer technology has created new data landscapes, providing quantitative tools for detailed studies of color and visual quality. Compared to traditional urban color research methods, these tools can efficiently process larger volumes of data than manual methods, thereby expanding the scope of research [14]. Long and Liu [30] utilized street view images to explore the relationship between the urban green view index and visual comfort, aiming to guide future street greening planning. Cheng et al. [20] employed street view technology combined with metrics, such as regional saturation, visual entropy, green view index, sky index, and sky openness index, to measure the visual quality of urban landscapes. Hu et al. [31] used machine learning and human–machine adversarial models to assess residents’ perceptions of urban neighborhood visual quality. Verma et al. [32] collected visual and audio files, employing deep learning and standard algorithms to measure perceptions of audiovisual environments within urban areas.
Previous studies that have integrated various metrics for urban visual quality have validated the feasibility of using street view data and machine learning in visual quality research. While these methods offer a reliable approach for comprehensive quantitative analysis in urban color studies, macro-level color research based on big data often lacks insight into the psychological cognition of individual users regarding spatial colors. This presents potential limitations for research on visual perception.

1.4. Advantages of Eye-Tracking Technology

With advancements in physiological and psychological research, methods for obtaining emotion feedback based on physiological indicators have emerged as a new quantitative research approach [33]. In recent years, eye-tracking has become a common tool in psychological experiments, used to better understand the psychological drivers behind behavior [34]. Eye-tracking provides objective measurements of users’ cognitive processes through non-invasive methods [35], offering insights into problem-solving, behavioral reasoning, mental imagery, and search strategies [35]. By recording the objective movements of the eyes, eye-tracking technology precisely captures the rapid cognitive processing of the environment and provides quantitative data for analyzing this process [36,37]. This allows researchers to intuitively understand visual cognitive processing, from spatial elements to behavioral decision-making, thereby enhancing the objectivity and effectiveness of cognitive psychological analysis. The extensive use of eye-tracking technology in consumer behavior research has further substantiated its connections with psychology and behavioral science [38,39]. Consequently, in recent years, eye-tracking technology has been increasingly applied in areas such as physiological evaluation metrics [40] and environmental experience [41].
In urban studies, eye-tracking technology provides quantifiable metrics for visual behavior in urban environments. Gao et al. [42], Hasse & Weber [43], J. Li et al. [44] and N. Li et al. [45] used eye-tracking technology to explore the relationship between urban visual elements and visual perception by analyzing the visual behavior characteristics of subjects. Z. Li et al. [46] and Lv et al. [47] combined eye-tracking technology with the semantic differential method to investigate the multidimensional relationship between urban landscapes and visual quality. These studies have shown that well-considered architectural colors, facade designs, landscape richness, transparency, and layering significantly enhance the visual quality of urban environments [42,43,44,46,47].
These studies have confirmed the feasibility of using eye-tracking technology as a cognitive tool for assessing the built environment. By exploring subjective physiological indicators in depth, they have helped to explain the psychological principles and mechanisms underlying the appeal of urban landscapes. Additionally, they have clarified the correlation between eye movement behavior and psychological perception assessments [42], which holds innovative significance for interdisciplinary research on urban color and visual perception. The heterogeneity of landscapes in urban environments further supports the idea that significant differences impact attention capture during decision-making, which in turn reflects the degree of visual preference [48].

1.5. Research Questions and Objectives

In real-world architecture, residential buildings, with which residents interact frequently and for extended periods, often lack proper color planning [49]. This deficiency negatively impacts residents’ psychological well-being in their daily lives and commutes [4], reducing the overall living experience. Recently, an increasing number of scholars have focused on the impact of architectural color on users’ emotions, leading to more in-depth research in this area. In China, the study of architectural color is still in an exploratory phase, with most research concentrating on monochromatic buildings. These studies typically involve organizing architectural colors in various ways and collecting user feedback. However, the prevalence of buildings with poorly planned combined color schemes is starting to disrupt the overall aesthetic tone of cities [4], diminishing residents’ quality of life. There is an urgent need for systematic theoretical support to guide the reorganization and renovation of color combinations in urban architecture.
This study involved on-site visits to old residential buildings in the Yangpu District of Shanghai, analyzing the relationship between facade color elements, eye-tracking metrics, and subjective evaluations. The aim was to explore the potential application of eye-tracking metrics in studying architectural color combinations, with the objective of developing an analytical framework for the visual perception of multicolored residential buildings by integrating eye-tracking data with subjective evaluation metrics. Using two-tone buildings as experimental subjects, this study quantitatively analyzes the relationship between color element differences and visual quality. Additionally, through eye-tracking experiments, the study explores how differences in color elements impact visual quality, expressing these effects more precisely through mathematical models. The study raises the following questions:
(1)
Can eye-tracking metrics serve as new indicators for evaluating architectural color combinations?
(2)
How can the relationship between architectural color combinations and visual quality be quantitatively analyzed? What is the relationship between the two?
(3)
What common characteristics are shared by color combinations that receive high visual quality evaluations?

2. Materials and Methods

2.1. Research Subject

This study, based on color differences in architectural color combinations (total color difference, brightness difference, chroma difference, and hue difference), integrated eye-tracking metrics with subjective color preferences to introduce new dimensions for measuring color visual quality in existing research. Focusing on residential buildings, we systematically explain the relationship between eye-tracking physiological indicators, color selection, and color differences. The findings aim to provide insights for urban and architectural color planning (Figure 1). In selecting color combinations, to avoid overlooking those that might yield heterogeneous conclusions, all possible color combinations were included in the experiment. To ensure the generalizability and objectivity of the conclusions, we also assessed participants’ visual comfort and preferences. This approach allowed us to maintain the diversity of color combinations while gaining insights into subjective opinions, which will be further analyzed alongside objective eye-tracking metrics.

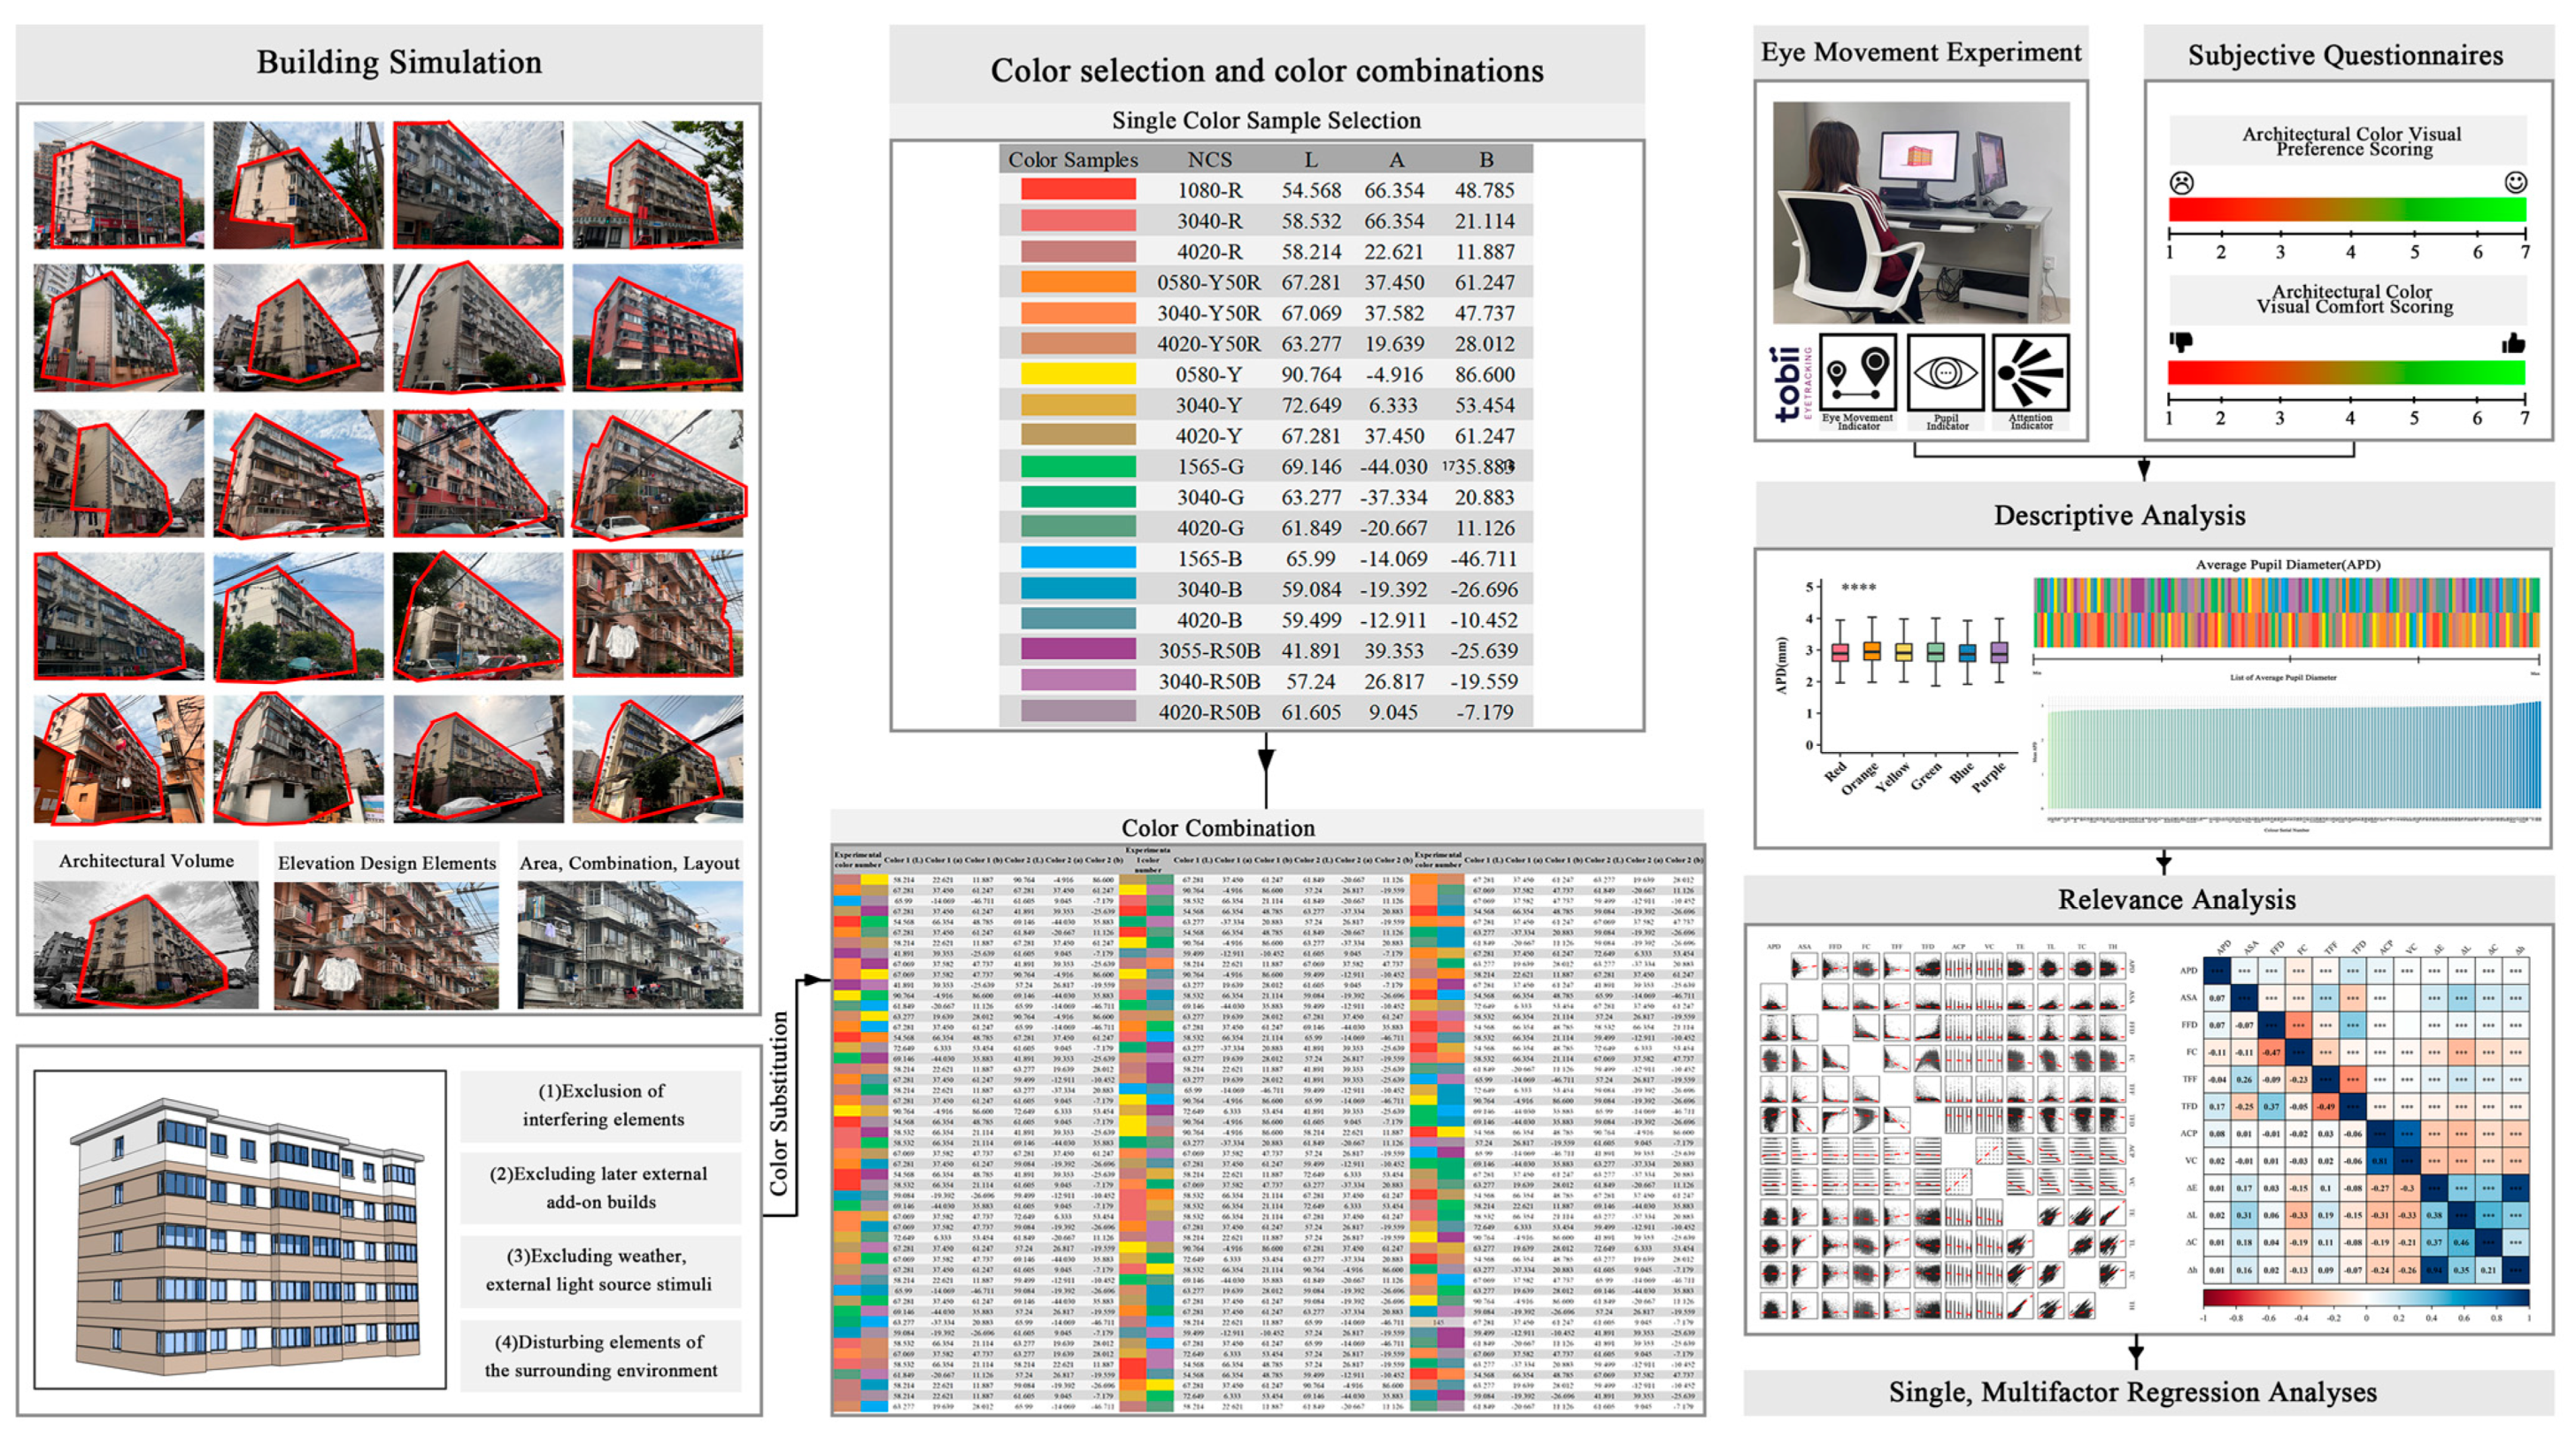
2.2. Color Selection

The color selection method used in [50] study has been shown to comprehensively reflect the color preferences of subjects, and we adopted this method for our research. We utilized the Natural Color System (NCS) and selected six hues (red, orange, yellow, green, blue, and purple). Based on the Munsell color system, 18 different monochromatic samples were chosen at specific intervals, referencing 3 key color attributes: hue, brightness, and chroma. These 18 monochromatic samples were displayed in the CIELAB color space using color values (L, a, and b values; Figure 2). The 18 color samples were then combined to create 153 different color combinations, which were applied to building surfaces for experimentation (Appendix B) [50]. To avoid missing any combinations that might yield heterogeneous results, all possible color combinations were included in the experiment. Additionally, to objectively compare the visual perception and subjective evaluation of different color combinations, we calculated the total color difference (Equation (1)), brightness difference (Equation (2)), saturation difference (Equation (3)), and hue difference (Equation (4)) between the two colors in the simulated building images using the CIELAB color difference formula, based on different color elements [50]. In this formula, L represents lightness, a represents the color range from green to red, and b represents the color range from blue to yellow:
Δ E a b * = L 1 * L 2 * 2 + a 1 * a 2 * 2 + b 1 * b 2 * 2
Δ L a b * = L 1 * L 2 *
Δ C a b * = a 1 * 2 + b 1 * 2 a 2 * 2 + b 2 * 2 Δ h a b *
Δ h a b * = Δ E a b * 2 + Δ L a b * 2 Δ C a b * 2
  • Δ E a b * : The   total   color   difference   between   Color   1   and   Color   2 .
  • Δ L a b * : The   brightness   difference   between   Color   1   and   Color   2 .
  • Δ C a b * : The   saturation   difference   between   Color   1   and   Color   2 .
  • Δ h a b * : The   hue   difference   between   Color   1   and   Color   2 .
Figure 2. Color selection: monochrome color samples and color values.
Applsci 14 08227 g002

2.3. Simulation of Experimental Subjects

Most existing old residential buildings in China were constructed between the 1970s and 1990s and have been in use for over 40 years. As a result, the overall community environment has deteriorated, functions have become outdated, pipelines have aged, and the quality of living has declined. Through on-site visits to various residential communities in the Yangpu District of Shanghai, key elements, such as building volume, architectural forms, facade design elements, and the area and design methods of different components, were extracted. Based on these observations, a building measuring 24,000 mm × 11,000 mm × 15,000 mm was designed, reflecting the most prevalent Soviet-style row housing of that era, resulting in a five-story row housing unit.
Simulated images can create virtual experimental scenarios, allowing for controlled testing conditions and providing low-cost color combination options for individual buildings. This approach offers both convenience and cost-effectiveness for the overall experimental design. Therefore, SketchUp 2020 software was used for modeling, and Photoshop 2020 was employed to apply 153 different color combinations to the building unit (Figure 3).

2.4. Subjects

The aesthetic preferences of college students generally align with those of the broader public [46,51,52]. For this experiment, 52 students from the University of Shanghai for Science and Technology were randomly selected as participants. Their professional backgrounds included architecture, urban planning, landscape architecture, management, economics, and environmental engineering. Of the participants, 35.4% were male and 64.6% were female, with an age range of 18 to 30 years. Specifically, 95.8% were aged 18 to 25, and 4.2% were aged 25 to 30. Regional and cultural diversity were also considered, as most participants were from various cities, such as Shanghai (47.9%), Jiangsu (14.5%), Jiangxi (14.5%), and Henan (10.4%). All participants had normal color vision and were seeing the experimental images for the first time. Four students were excluded from the study due to a sampling rate below 70%, which affected the reliability of their data.

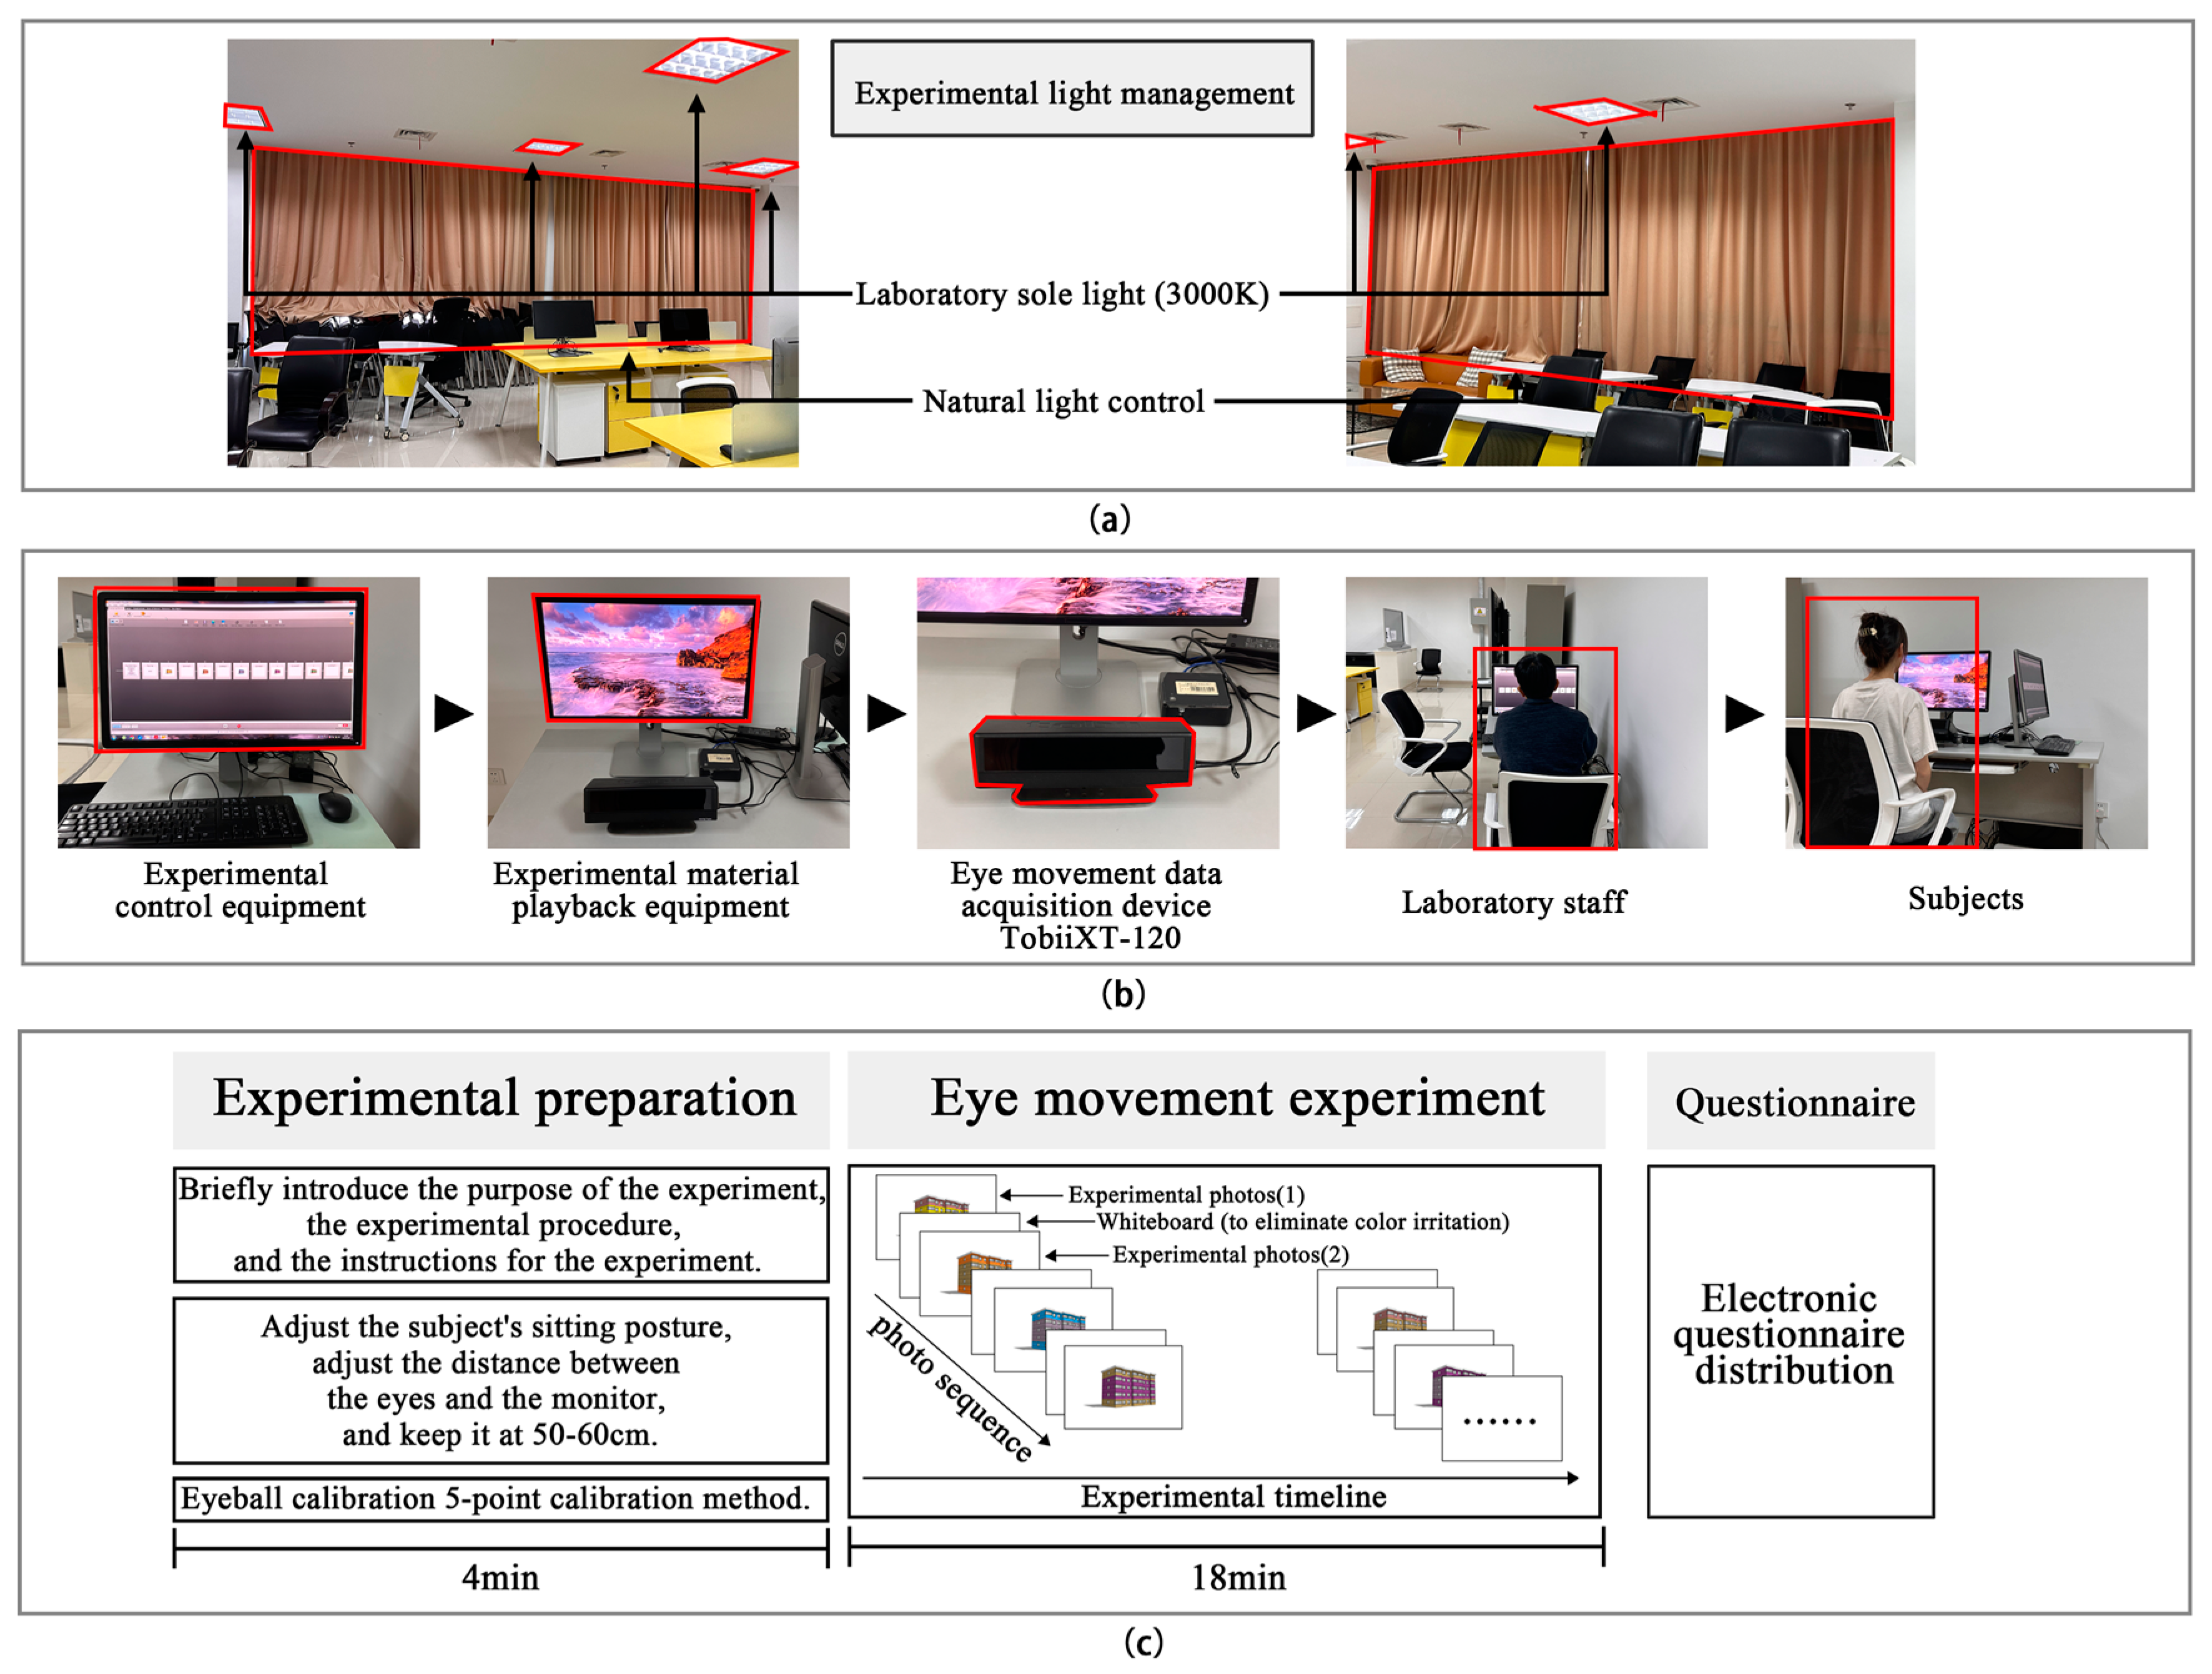
2.5. Experimental Environment, Experimental Equipment, and Experimental Procedures

The experiment was conducted in a laboratory at the Shanghai Institute of Technology. To avoid interference with eye-tracking data collection, natural light was controlled, and indoor lighting served as the sole light source (Figure 4a). The Tobii-X120 eye tracker, manufactured by Tobii in Switzerland, was used to collect eye-tracking data from participants. Experimental materials were displayed on a secondary monitor with dimensions of 17 inches (1024 × 768 dpi). The experimenters observed and performed calibration and data collection using Tobii-x2-60 software on the main monitor (Figure 4b).
After familiarizing participants with the experimental setup, the staff verbally explained the experiment’s purpose, requirements, and overall procedure. Once participants understood these aspects, initial eye calibration procedures were conducted before starting the experiment. During the experiment, the secondary monitor automatically displayed 153 color images, each for 5 s. Between each image, a blank screen was shown for 2 s to minimize color visual stimuli and reduce eye fatigue among participants. After the eye-tracking experiment concluded, a questionnaire was distributed to gather participants’ subjective evaluations of the building colors (Figure 4c).

2.6. Selection of Eye-Tracking Data Metrics

During scene viewing, eye movements can be divided into two relatively independent stages: fixation and saccade [45]. In this experiment, six eye movement behavior characteristics were selected to observe architectural color combinations (Table 1). TFF reflects the visual attractiveness and alertness of the participants. The combination of APD and ASA measures the visual stimulus level, indicating the comfort of the color combinations for the participants [53]. FFD, FC, and TFD track annotation behavior, reflecting the participants’ preferences for architectural color combinations [54].

2.7. Subjective Data Collection

This study gathered participants’ subjective color perceptions of the experimental objects using a rating scale. Simultaneously, participants filled out an electronic questionnaire, where the order of building colors matched the sequence in the eye-tracking experiment. Participants rated the visual comfort and visual preference of each color combination based on their subjective perceptions. The questionnaire employed a 7-point Likert scale, with scores ranging from 1 to 7 (Appendix C). A score of 1 indicated “very uncomfortable” or “strongly dislike”, while a score of 7 indicated “very comfortable” or “strongly like” (Table 2).

2.8. Data Processing and Analysis

Data preprocessing, management, and analysis were conducted using R v4.3.2 software. Inter-group differences for each experimental color group (assuming normal distribution) were tested using ANOVA. To examine the correlation between eye-tracking and subjective evaluation metrics with ΔE, ΔL, ΔC, and Δh, correlation analysis was performed. For regression analysis, eye-tracking and subjective evaluation metrics were treated as dependent variables, while color element differences were treated as independent variables. Based on the trend of the dependent variables relative to the independent variables, linear regression models were established for pairs of variables that exhibited a linear relationship. Multi-factor regression models were developed for each eye-tracking and subjective evaluation metric with the image’s ΔE, ΔL, ΔC, and Δh. Two-sided tests were used in this study, with p ≤ 0.05 indicating statistically significant differences.
The experiment collected eye-tracking indices and subjective evaluation data from 48 participants for 153 sets of images, resulting in a total of 58,752 datasets. The ANOVA p-values for the different color hue groups of the participants’ APD, ASA, FFD, FC, TFF, TFD, ACP, and VC were all less than 0.05, indicating significant changes in these eye-tracking metrics as the building color differences in ΔE, ΔL, ΔC, and Δh varied.

3. Results

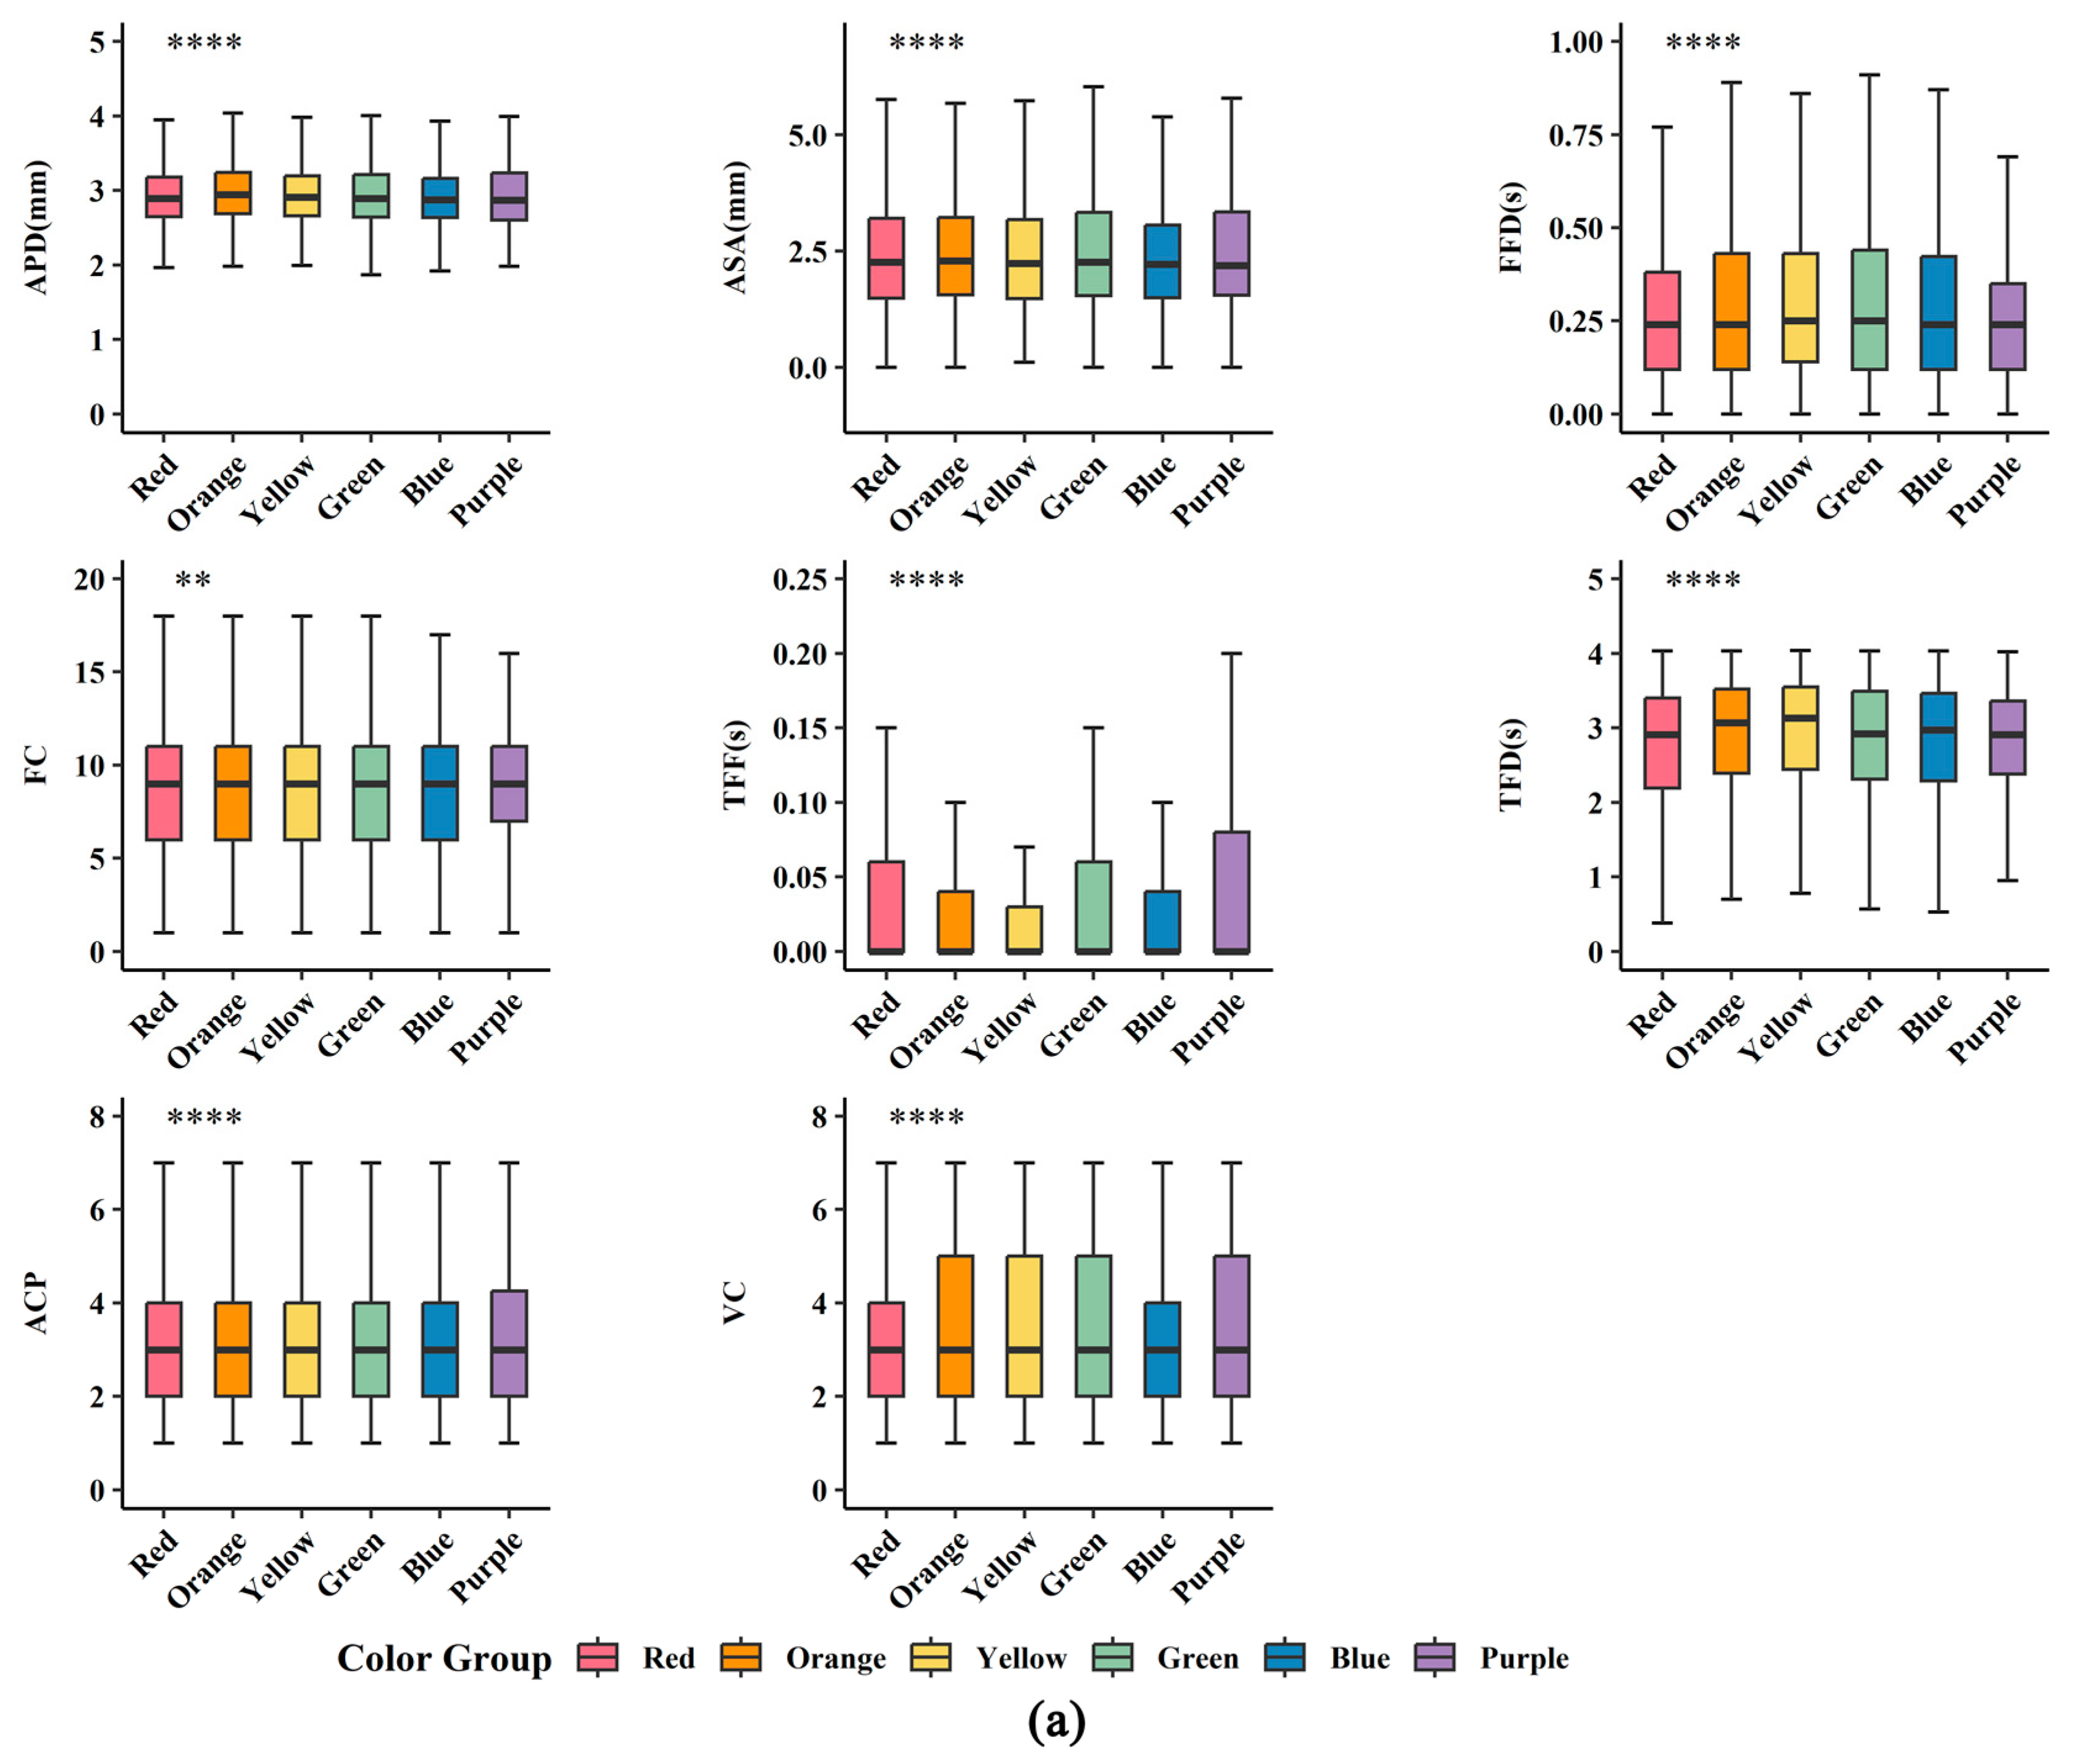
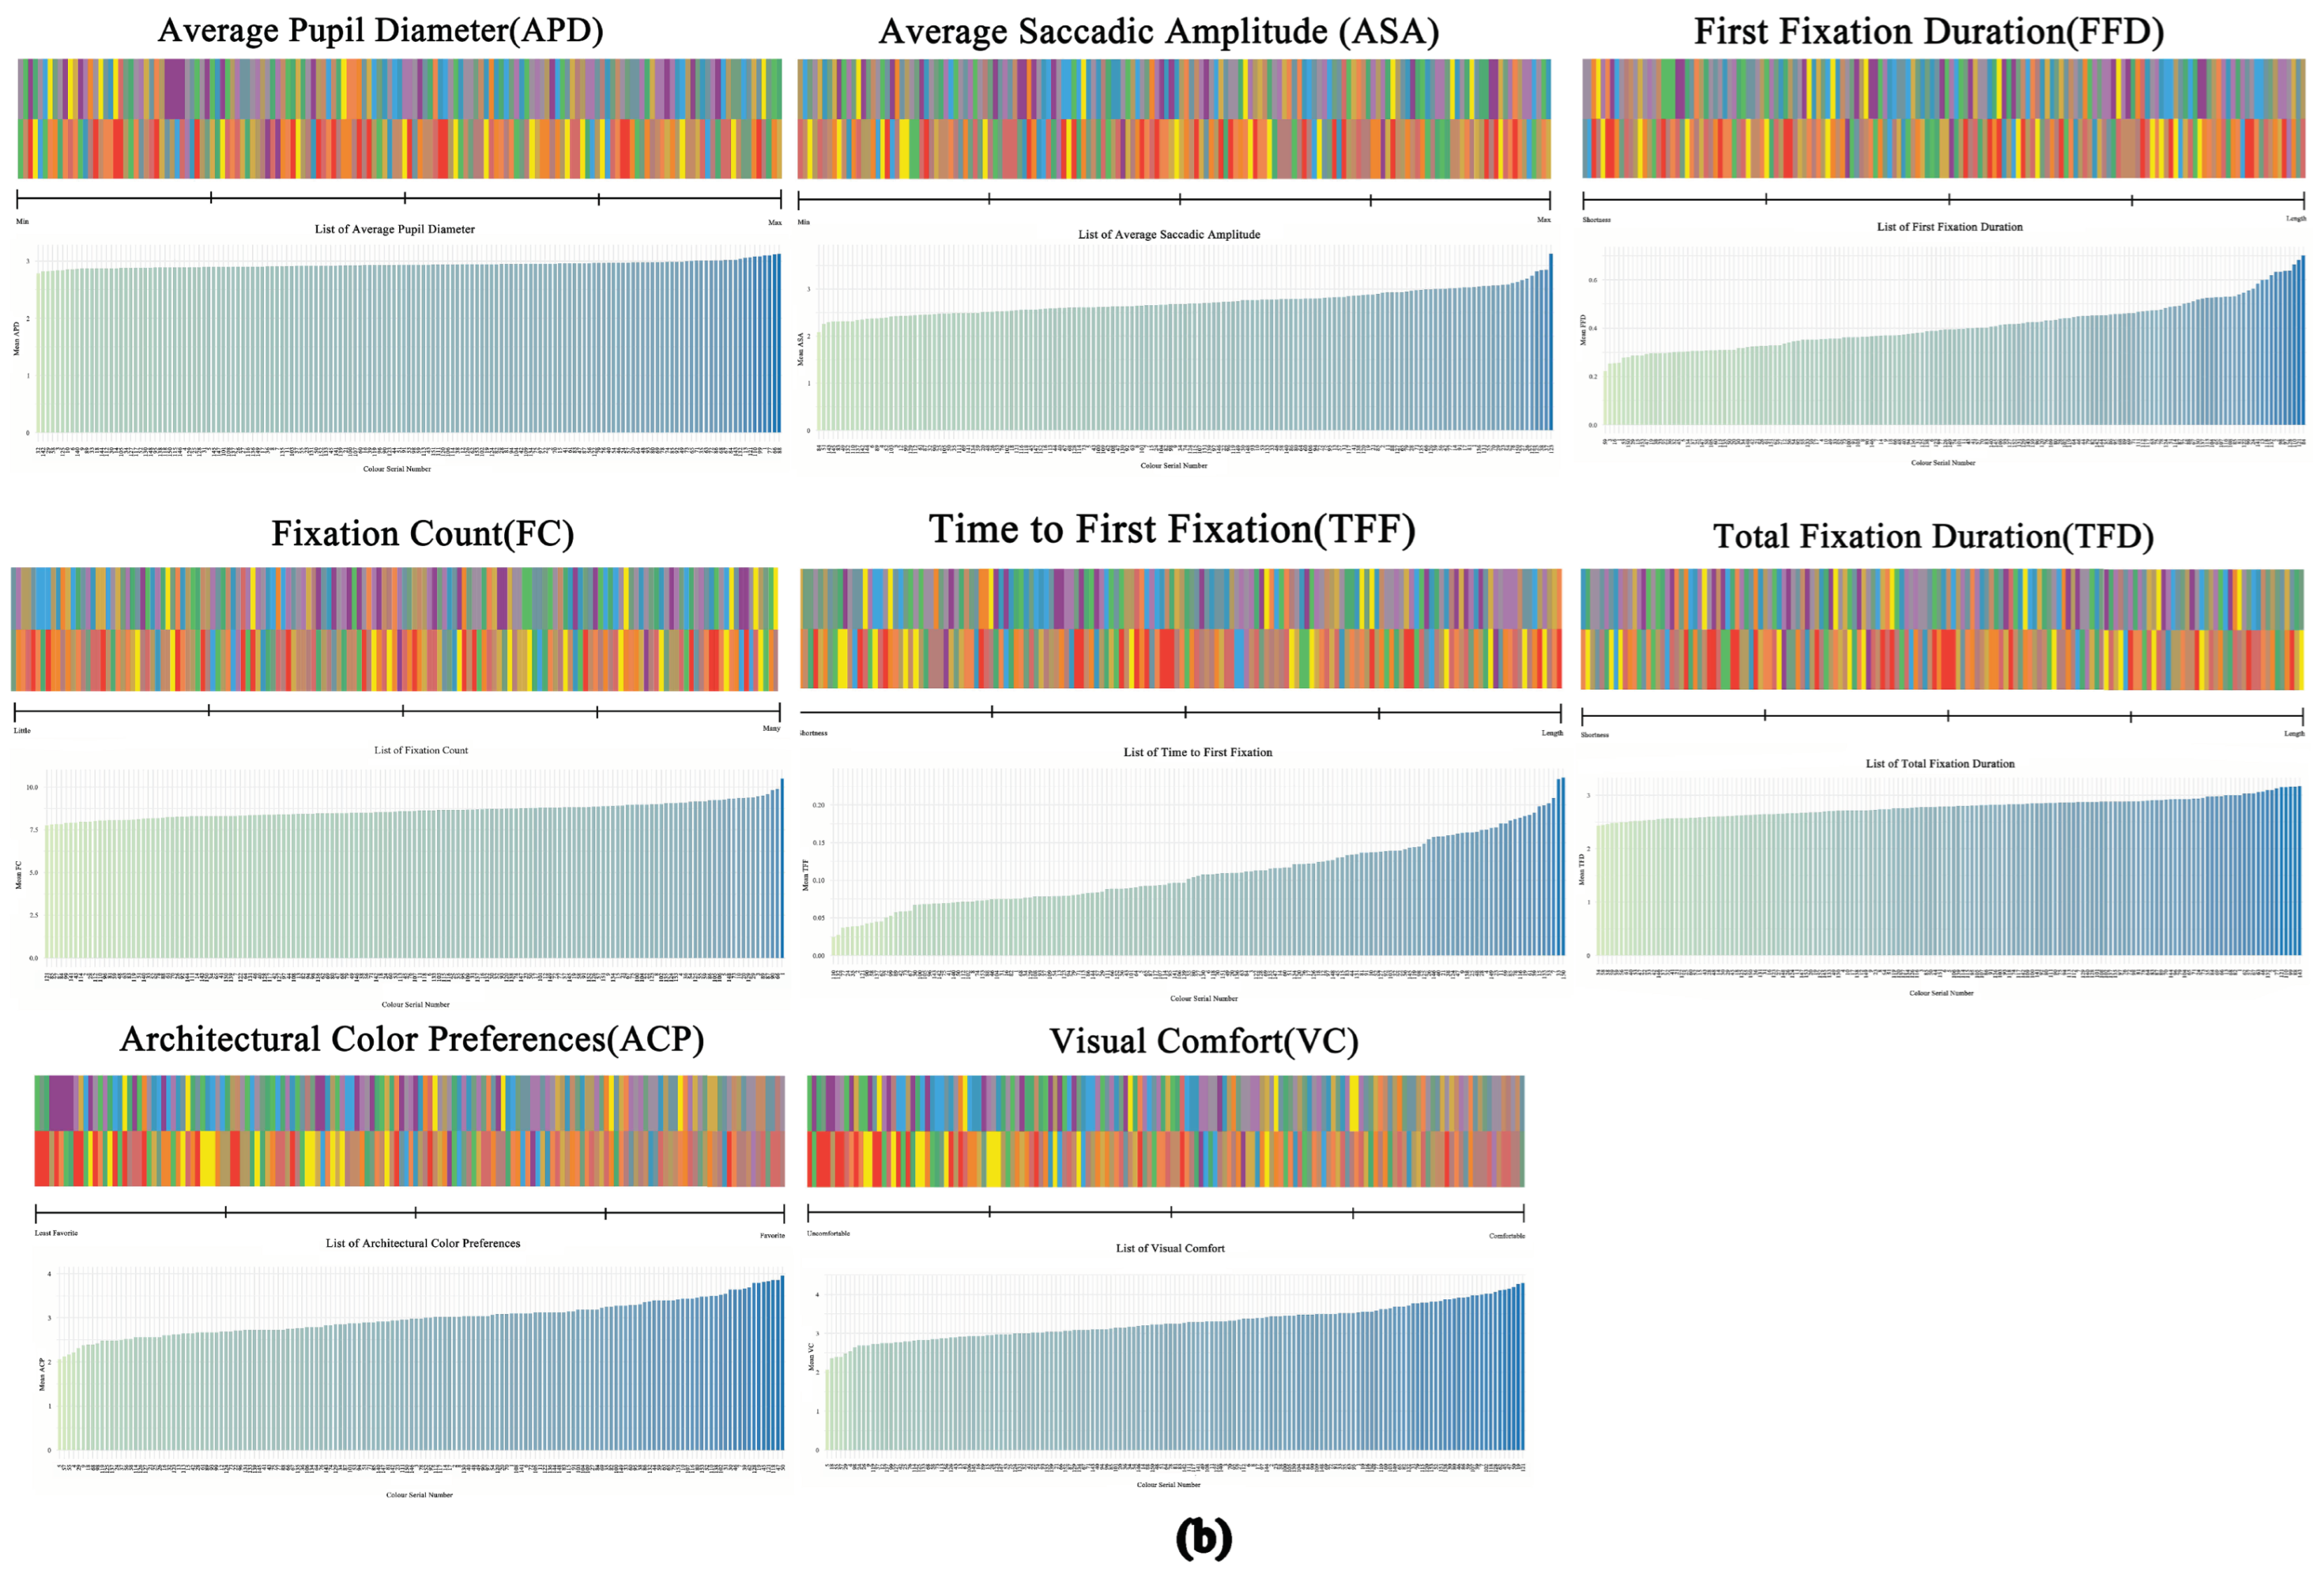
3.1. Descriptive Analysis

By categorizing each experimental color combination according to hue and plotting box plots, comparisons of various metrics across different hues were observed (Figure 5a). Additionally, the 153 color combinations were ranked for each experimental metric based on their values (Figure 5b), providing a more intuitive representation of the relationship between color element differences and the various metrics. As shown in Figure 5, differences in APD, ASA, FFD, FC, TFF, TFD, ACP, and VC among participants were evident across different hues.
In the warm color group, the orange color combinations exhibited higher mean values for APD, ASA, and VC (2.97 mm, 2.29 mm, and 3.01, respectively), while the mean value for FFD was lower (0.24 s). The values for FC and VC showed significant fluctuations, whereas TFD and ACP displayed smaller fluctuations. In the yellow color group, the color combinations had higher mean values for FFD, TFD, and VC (0.25 s, 3.13 s, and 3.01, respectively). The values for FC and VC showed significant fluctuations, while TFF, TFD, and ACP exhibited smaller fluctuations.
In the intermediate color group, the purple color combinations exhibited higher mean values for FC and VC (9.1 and 3.01, respectively) and lower mean values for ASA and FFD (2.19 mm and 0.24 s, respectively). The values for TFF, ACP, and VC showed significant fluctuations, while FFD, TFD, and FC displayed smaller fluctuations.
In the cool color group, the blue color combinations exhibited lower mean values for APD and ASA (2.90 mm and 2.19 mm, respectively). TFD values showed significant fluctuations, while APD, ASA, TFF, ACP, and VC displayed smaller fluctuations. In the green color group, the color combinations had a higher mean value for FFD (0.25 s). The values for TFF, TFD, and VC showed significant fluctuations, while ACP showed smaller fluctuations.

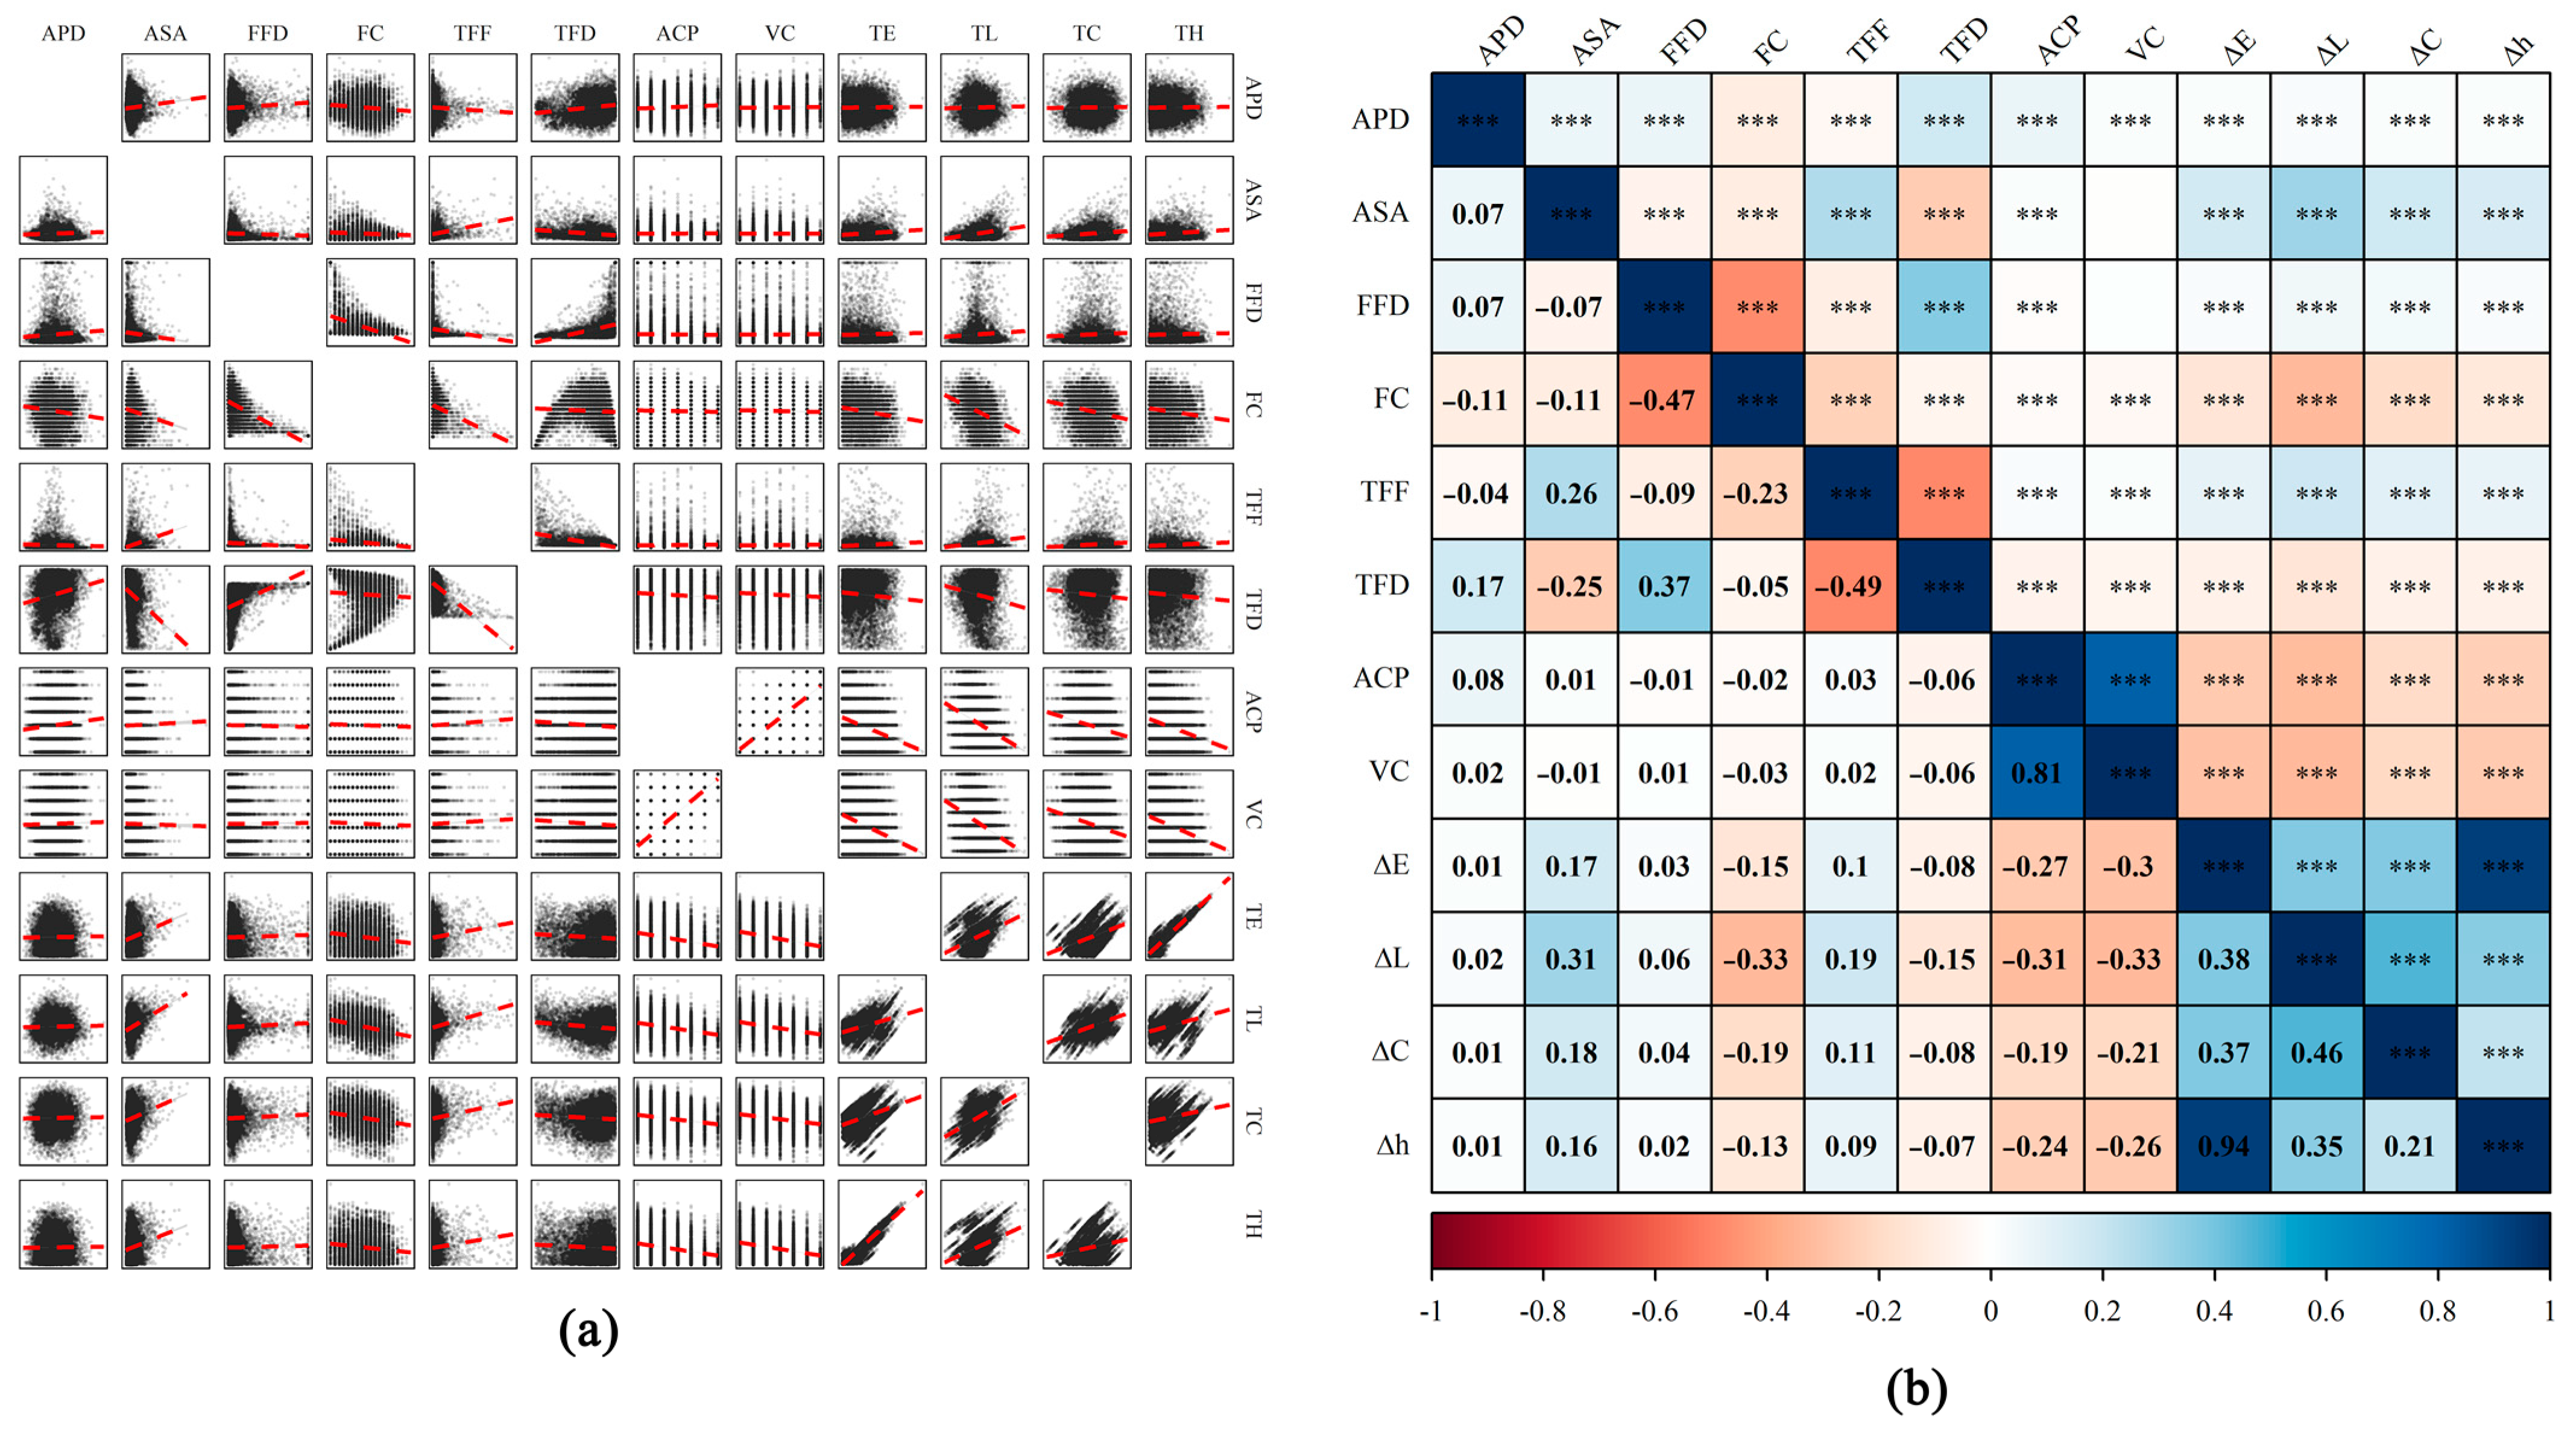
3.2. Correlation Analysis

The color element differences in ΔE, ΔL, ΔC, and Δh showed a positive linear correlation with APD, ASA, FFD, and TFF (p < 0.05) and a negative linear correlation with FC, TFD, and ACP (p < 0.05; Figure 6a).
To develop an evaluation model for comfortable colors, this study analyzed the correlation between eye-tracking and subjective evaluation metrics with ΔE, ΔL, ΔC, and Δh (Figure 6b). The calculations indicated that APD had a relatively low overall correlation with ΔE, ΔL, ΔC, and Δh (0.01, 0.02, 0.01, and 0.01). ASA showed a strong correlation with ΔL (0.31) and a relatively strong correlation with ΔE, ΔC, and Δh (0.17, 0.18, and 0.16). FFD demonstrated a moderate correlation with ΔL and ΔC (0.06 and 0.04), with weaker correlations for the other variables. FC showed a strong correlation with ΔL (−0.33) and a relatively strong correlation with ΔE, ΔC, and Δh (−0.15, −0.19, and −0.13). TFF had a relatively strong correlation with ΔE, ΔL, ΔC, and Δh (0.1, 0.19, 0.11, and 0.09). TFD exhibited a moderate correlation with ΔE, ΔL, ΔC, and Δh (−0.08, −0.15, −0.08, and −0.07). ACP showed a strong correlation with ΔE, ΔL, ΔC, and Δh (−0.27, −0.31, −0.19, and −0.24). VC also showed a strong correlation with ΔE, ΔL, ΔC, and Δh (−0.3, −0.33, −0.21, and −0.26).
It is important to note that ΔE, ΔL, ΔC, and Δh showed a strong correlation with the subjective evaluation metrics ACP and FC, and a relatively strong correlation with the eye-tracking metrics ASA, FC, TFF, and TFD. They exhibited a moderate correlation with FFD, while APD showed a notable correlation only with ΔL.

3.3. Regression Analysis

Each eye-tracking and subjective evaluation metric was treated as the dependent variable, with ΔE, ΔL, ΔC, and Δh as the independent variables. Based on the trends observed in Figure 6, linear regression models were established for pairs of variables that exhibited linear changes. First, single-factor regression models were created. When the regression coefficients of these models showed statistical significance, multi-factor regression models were subsequently developed (Table 3).
In the single-factor linear regression models established between the color element differences and the eye-tracking metrics and subjective comfort, all regression coefficients were statistically significant (Table 3). To develop a mathematical model for the relationship between ΔE, ΔL, ΔC, Δh, and user visual comfort, multi-factor linear regression analysis models were created, resulting in fitted equations. These equations revealed the trends in variations between the color metrics and the eye-tracking metrics, clarifying the impact of different colors on visual comfort.
This study established multi-factor linear regression models to predict APD, VD, FC, TFD, VC, and ACP based on differences in color elements. The R2 values and regression coefficients of these models were tested and found to be statistically significant (p < 0.05; Table 4).
In the regression model for APD, the influence of ΔL was positive; when ΔL increased by 1 unit, APD decreased by less than 0.001 units. In the regression model for ASA, the influences of ΔL, ΔC, and Δh were positive. When these variables increased by 1 unit, the ASA value increased by 0.034, 0.003, and 0.002 units, respectively. In the regression model for FFD, the influences of ΔL and ΔC were positive; when ΔL and ΔC increased by 1 unit, the FFD value increased by 0.002 and less than 0.001 units, respectively. In the regression model for FC, the influences of ΔE, ΔL, and ΔC were negative; when these variables increased by 1 unit, the FC value decreased by 0.011, 0.064, and 0.004 units, respectively. Conversely, the influence of Δh was positive; when Δh increased by 1 unit, the FC value increased by 0.009 units. In the regression model for TFF, the influences of ΔE, ΔL, and ΔC were positive. When these variables increased by 1 unit, the TFF value increased by less than 0.001, 0.003, and 0.001 units, respectively. In the regression model for TFD, the influences of ΔE and ΔL were negative; when these variables increased by 1 unit, the TFD value decreased by 0.002 and 0.008 units, respectively. In the regression model for ACP, the influences of ΔE and ΔL were negative; when these variables increased by 1 unit, the ACP value decreased by 0.016 and 0.023 units, respectively. Conversely, the influence of Δh was positive; when Δh increased by 1 unit, the ACP value increased by 0.006 units. In the regression model for VC, the influences of ΔE and ΔL were negative; when these variables increased by 1 unit, the VC value decreased by 0.019 and 0.025 units, respectively. Conversely, the influence of Δh on VC was positive; when Δh increased by 1 unit, the VC value increased by 0.008 units.

3.4. Summary

3.4.1. The Relationship between Hue and Visual Perception Evaluation

In the warm color spectrum, building color combinations involving red had significantly lower VC and ACP values compared to other color combinations (Figure 6). Red is associated with high arousal levels and is generally linked to active emotions such as anger, excitement, and passion [55]. These characteristics contrast with the intended architectural attributes of residential buildings and can negatively impact visual quality by intensifying emotional responses in users. In contrast, the orange and yellow groups exhibited significantly higher FFD, TFD, and VC values compared to the red group, indicating that orange and yellow tones are more stable and are generally associated with positive emotions, such as pleasure and happiness [55]. As a result, visual preference for color combinations in the orange and yellow hues was significantly higher than that for the red group.
As hues transition from warm to cool, users’ emotions shift from high activity to low activity. Purple, as a transitional color between warm and cool tones, exhibited the highest FC value. Participants showed a greater preference for building color combinations in purple tones, with visual quality rated higher than other hue combinations. The ACP mean was also the highest among the different color groups, indicating a stronger overall preference for purple color combinations. However, it is important to note that while the ACP mean for purple color combinations was higher than that of other color groups, the variability was significant, suggesting that participants may provide polarized visual quality evaluations for purple combinations.
In the natural color spectrum, the green and blue groups exhibited higher average visual quality indicators than the warm color groups. The green group showed higher FFD and VC values compared to the blue group, indicating that the visual quality of the green group was superior. More participants preferred building color combinations that included green. Conversely, the blue group had lower mean values for APD and ASA compared to the other color groups.

3.4.2. The Relationship between ΔE, ΔL, ΔC, Δh, and Visual Perception Evaluation

In the correlation analysis, ΔE showed a strong correlation with ACP and VC, and a moderate correlation with ASA, FC, and TFF. This suggests that excessive total color difference significantly reduced users’ subjective color evaluations and visual preferences, leading to visual fatigue.
ΔL showed a strong correlation with ASA, FC, ACP, and VC, and a moderate correlation with TFF and TFD. This indicates that excessive brightness differences caused significant visual stimulation, which can substantially lower users’ visual perception evaluations when viewing buildings.
ΔC showed a moderate correlation with ASA, FC, TFF, ACP, and VC. This suggests that excessive chroma differences not only reduced the subjective color evaluation of residential buildings but also increased visual fatigue and cognitive load, thereby lowering the overall visual quality of the buildings.
Δh showed a strong correlation with ACP and VC, and a moderate correlation with ASA, FC, TFF, and TFD. This indicates that excessive hue differences significantly impacted users’ subjective evaluation of color combinations and, to some extent, reduced the visual quality of residential buildings, leading to visual fatigue.
In the regression analysis of different models, ΔE strongly influenced certain eye-tracking metrics and subjective color evaluations. ΔL affected all eye-tracking metrics and subjective evaluations in every model. Additionally, in some models, the extreme values of the regression coefficients for eye-tracking metrics were higher for ΔL than for ΔE. ΔC affected eye-tracking metrics only in specific regression models, with overall regression coefficients remaining relatively low. Notably, Δh showed a positive influence on eye-tracking metrics related to visual preference and subjective color evaluation, with relatively high regression coefficients. This suggests that appropriately increasing Δh may improve the visual quality of residential buildings and enhance the living experience.

4. Discussion

4.1. Insights into Color Selection Related to Hue Factors

In traditional studies, the warm color groups of orange and yellow have been considered the optimal choice for residential building colors due to their high visual quality [4,56,57]. However, in this study, among the six hues examined, the purple group had significantly higher mean values for FC, ACP, and VC compared to the orange and yellow groups. This suggests that the color combinations in the purple group provided superior visual stimulation and subjective color preference. In the subjective metric ACP, the purple group exhibited a large range of variation. Therefore, when using purple in building color combinations, it is essential to consider users’ acceptance of the color, as well as the local cultural context and its tolerance for purple.
Furthermore, factors shaping urban color environments include natural and climatic characteristics, as well as the interplay between color and form [16]. The green and blue spaces, represented by “ecological spaces” and “environmental spaces”, have been shown to influence the associations between physiological and psychological health outcomes [58] and positively impact residents’ sense of well-being [17]. Additionally, the sky view factor and the visibility of natural greenery have been shown to significantly affect neighborhood vitality.
In this study, for the first time, blue-colored groups, as revealed through eye-tracking physiological indicators, demonstrated lower average values and smaller numerical fluctuations in response to visual stimuli compared to other color hues. This suggests that blue, as an architectural decorative tone, can create a calming atmosphere that promotes relaxation, inner security, and confidence [59]. In urban color planning, for certain individuals or specific residential locations, selecting color combinations from the blue group can help reduce visual pressure, lower cognitive burden, and emphasize the differentiation of neighborhood characteristics.

4.2. Experimental Insights into Color Element Differences

Through regression analysis of ΔE, ΔL, ΔC, and Δh using eye-tracking data and subjective questionnaires, we found the following:
(1) Residential colors with medium to high brightness and medium to low saturation often receive higher color evaluations [4,50,60]. Further studies have explored architectural color combinations, finding that higher brightness contrast increases visual fatigue [58]. When accent and auxiliary colors fall within the dark range (low ΔL), the public may develop negative emotions toward these combinations [61], which can affect the vitality of streets in the area. This experiment indicated that ΔL had a more significant impact compared to other color difference factors (ΔE, ΔC, and Δh) on both user visual stimulation and subjective visual evaluations. Regression models further revealed that, in various models related to visual and subjective preferences, the regression coefficient of ΔL was higher than that of other color difference factors, indicating a stronger and more precise connection between ΔL and subjective visual quality.
(2) In fields such as art appreciation, consumer decision-making, and targeted information retrieval, numerous studies have shown that a larger Δh tends to increase user visual attention, enhance visual perception, and boost consumer engagement [38,62,63]. However, this study found that Δh had a relatively smaller impact on visual perception compared to other color difference elements, based on eye-tracking data and visual perception evaluations. Additionally, its influence on subjective ratings was not particularly significant. Thus, it can be observed that in the field of architectural colors, Δh does not play as significant a role in visual perception ratings as it does in other domains. Conversely, when the ΔL and ΔC values of architectural color combinations are kept close, combinations with a larger Δh can still improve the visual quality of architectural color compositions, thereby enhancing the vitality of the streetscape.
(3) In experiments exploring harmonious complementary landscapes, vibrant plant colors, such as oranges and yellows, can play a more significant role, even when combined with cooler tones [64]. This study’s regression results similarly indicated that in architectural color research, a certain degree of Δh can enhance subjective evaluations of buildings. This may be because moderate color contrast can elevate users’ EEG activity levels [65]. Previous studies have demonstrated a strong correlation between EEG activity and visual comfort [66]. Therefore, it can be inferred that controlling a certain degree of Δh in architectural color combinations can effectively enhance the visual quality of buildings and improve the residential experience, creating better spatial dynamics.

4.3. Strengths and Limitations of This Study

This study focused on dual-tone architectural color combinations, exploring differences in perceptual quality under various combinations by examining the relationships between color element differences, eye-tracking metrics, and subjective evaluations. Current architectural color experiments often emphasize single colors, which diverge from the reality of residential color schemes in China. By focusing on dual-tone architectural colors, this study breaks away from the limitations of previous research on color experimental samples. Through regression analysis, we precisely delineated and explained the specific impact levels of color element differences, providing accurate data support for research on dual-tone architectural color combinations.
Previous architectural color studies often used open-ended scales to gather subjective evaluations from participants. However, subjective expressions of color preferences can be influenced by factors such as individual education, geographic location, and cultural background [6], leading to inconsistencies between physiological responses and subjective evaluations. This study introduced eye-tracking as a physiological indicator to bypass the subjective processing of color perception, directly collecting users’ visual feedback on color stimuli to validate subjective evaluations. The aim was to enhance the accuracy and representativeness of experimental data. It should be acknowledged that, although eye-tracking experiments have improved the accuracy of color perception to some extent, human visual perception and subjective preferences cannot be fully captured through a single eye-tracking technique [15]. Future research should incorporate a broader range of physiological indicators, such as EEG, skin conductance, and blood oxygen levels, to conduct a more comprehensive quantitative analysis of color perception.
Additionally, this study preliminarily validated that eye-tracking metrics can serve as evaluation indicators for measuring color visual quality. However, relying on a single experiment may not accurately capture individual preferences. Previous eye-tracking studies have shown that FC and FFD can reflect participants’ preferences to some extent regarding experimental stimuli [46,67]. Despite this, color combinations with excessive Δh and ΔL tend to elicit heightened physiological attention [38,68], which is not necessarily driven by preference [65]. Therefore, future eye-tracking experiments in the field of color should focus on identifying the specific causes behind eye movement indicators. Comprehensive data metrics are crucial for color-related visual quality studies to fully understand individual visual experiences.
During the experiment, the focus was on investigating the relationship between color combinations and visual quality, so only architectural units were selected as the experimental subjects. Factors such as the surrounding ancillary buildings, community environment, sky view factor, and green view index were not considered in evaluating the visual quality of individual buildings. In future research on the overall community environment, it will be necessary to adopt a more comprehensive approach, considering various influencing factors to assess their impact on the visual quality of architectural color combinations.
This experiment also has certain regional limitations. The architectural styles used as subjects were based on a survey of old residential buildings in the Shanghai area. It is undeniable that the architectural forms of old residential buildings vary across different regions of China. Therefore, the generalizability of the experimental conclusions requires further validation through color studies conducted in other regions. Additionally, the extent to which cultural background influences individual color perception remains under-researched and lacks quantifiable studies. Incorporating color perception data from users with diverse cultural backgrounds is essential to enhance the generalizability of the study’s conclusions.

5. Conclusions

In this study, through the combination of eye-tracking technology and subjective color evaluation, two-tone architectural monoliths were used as research objects. Mathematical models were established to examine the relationships between two-tone color combinations, visual quality, and subjective evaluation using single-factor and multi-factor regression models. By collecting various eye-tracking data and color evaluation scores from participants, the study explored the impact of two-tone color combinations on visual quality and subjective evaluations. This provides mathematical support and multidimensional perspectives for the updating of architectural colors, addressing a research gap in existing studies that primarily focus on monochromatic colors. The findings offer more practical and targeted advice for color planning in street areas, contributing to the creation of a more vibrant and pleasant neighborhood environment.
Additionally, through a mathematical model analyzing color element differences in relation to visual quality and subjective evaluation, this study revealed the specific impact of color element differences on architectural colors, providing more scientific references for the future selection of architectural color combinations. Compared to previous methods that explored architectural color evaluation through open-ended questions, this study more accurately captured participants’ subconscious reactions to color combinations by integrating eye-tracking experiments. This approach reduced the influence of subjective bias on experimental results, thereby improving the reliability of the overall data feedback [69].
Moreover, new measurement indicators were introduced for studying the visual quality of multicolored buildings, exploring the potential of incorporating eye-tracking metrics into the rating system for the color visual quality of multicolored residential buildings. The visual quality evaluation framework for multicolored buildings was initially constructed by combining physiological indicators with subjective evaluations. A humanistic perspective was also introduced, providing a new measurement dimension for studying the relationship between color and neighborhood vitality, while enhancing the research framework for street vitality.

Author Contributions

Conceptualization, M.S.; methodology, M.S. and Y.H.; software, M.S. and Y.H.; validation, M.S. and Y.H.; formal analysis, M.S. and Y.H.; investigation, M.S.; resources, M.S.; data curation, M.S.; writing—original draft preparation, M.S. and Y.H.; writing—review and editing, M.S. and Y.H.; visualization, M.S. and Y.H.; supervision, Y.H.; project administration, Y.H.; funding acquisition, Z.W. All authors have read and agreed to the published version of the manuscript.

Funding

The authors received no specific funding for this work.

Institutional Review Board Statement

Not applicable.

Informed Consent Statement

Not applicable.

Data Availability Statement

The original contributions presented in the study are included in the article, further inquiries can be directed to the corresponding author.

Conflicts of Interest

The authors declare that they have no known competing financial interests or personal relationships that could have appeared to influence the work reported in this paper.

Appendix A. Methods and Research Variables

ThemeUse CaseMethodsData Analysis
Building colorColors of old residential facades in Shanghai, China/AHP hierarchical analysis[4]
Color geography, the relationship between color and architectural formLiterature search/[9]
Color and visual perceptionQuestionnaire, fNIRS extraction of hemodynamic responsesDescriptive analysis[11]
Xuzhou historical building color planOn-site measurement, color card comparison/[56]
Color planning for Shanghai Historic Landscape DistrictExpert scoring, questionnairesDescriptive analysis[12]
Tall building height and color and perceived psychological repairQuestionnaires, measurement of psychological variables of recoveryDescriptive analysis, Pearson’s correlation, multiple regression, and analysis of variance (ANOVA)[13]
Evaluation of architectural color combinationsQuestionnaireDescriptive analysis, regression analysis[50]
Visual
quality
Visual quality of natural landscapes within citiesPhotographic model simulation of streetscapes, questionnairesScenic beauty estimation (SBE), Wilcoxon signed-rank test[24]
Relationship between forest color and landscape aesthetics estimatesArcGIS and FRAGSTATS extraction of spatial indices of color platesOne-way analysis of variance (ANOVA) and partial correlation analysis were used[25]
Visual quality of historic buildings and surrounding buildingsQuestionnaireOne-way ANOVA, multiple linear regression analyses[26]
Visual quality of indoor light environments in buildingsSimulation of indoor modelsRelative weight calculation[19]
Visual quality of street outdoor billboardsPhoto surveyR.G.B bivariate histogram calculation[22]
Visual comfort and preference in specific indoor scenesForced-choice approach to psychophysical experiments/[27]
Quality of visual perception of urban streetsStreet view imaging technologySalience detection algorithm combining simple priorities (SDSP)[20]
Perception of visual and auditory landscapes in urban environmentsCustomized deep learning (DL) models/[32]
Eye
movement technique
Evaluation of visual behavioral characteristics and psychological perception of forest water feature spacesEye-tracking techniques and psycho-perceptual questionnairesWilcoxon rank sum test, T test, correlation analysis[42]
Balance and visual aesthetics of building facade compositionsEye-tracking technology (building facade elements)Descriptive analysis[43]
Proportion of landscape elements and residents’ evaluation of the attractiveness of urban complexesEye-tracking techniques (landscape element composition), online questionnairesDescriptive analysis, correlation analysis[44]
Visual behavioral characteristics of built heritage and what factors influence visual perceptionEye movement techniques (visual search paths, gaze ratios)Descriptive analysis, correlation analysis[45]
Influences on the visual characteristics of spatial elements in traditional Chinese commercial neighborhoodsEye-tracking techniques (streetscape elements), semantic differentiationDescriptive analysis, correlation analysis[46]
Key factors and landscape elements of concern in urban parksEye movement technology (green vision)Descriptive analysis, correlation analysis[67]
Color elements and visual comfort in metro spaceEye-tracking techniques (color in indoor environments), questionnairesCorrelation analysis, regression analysis[54]

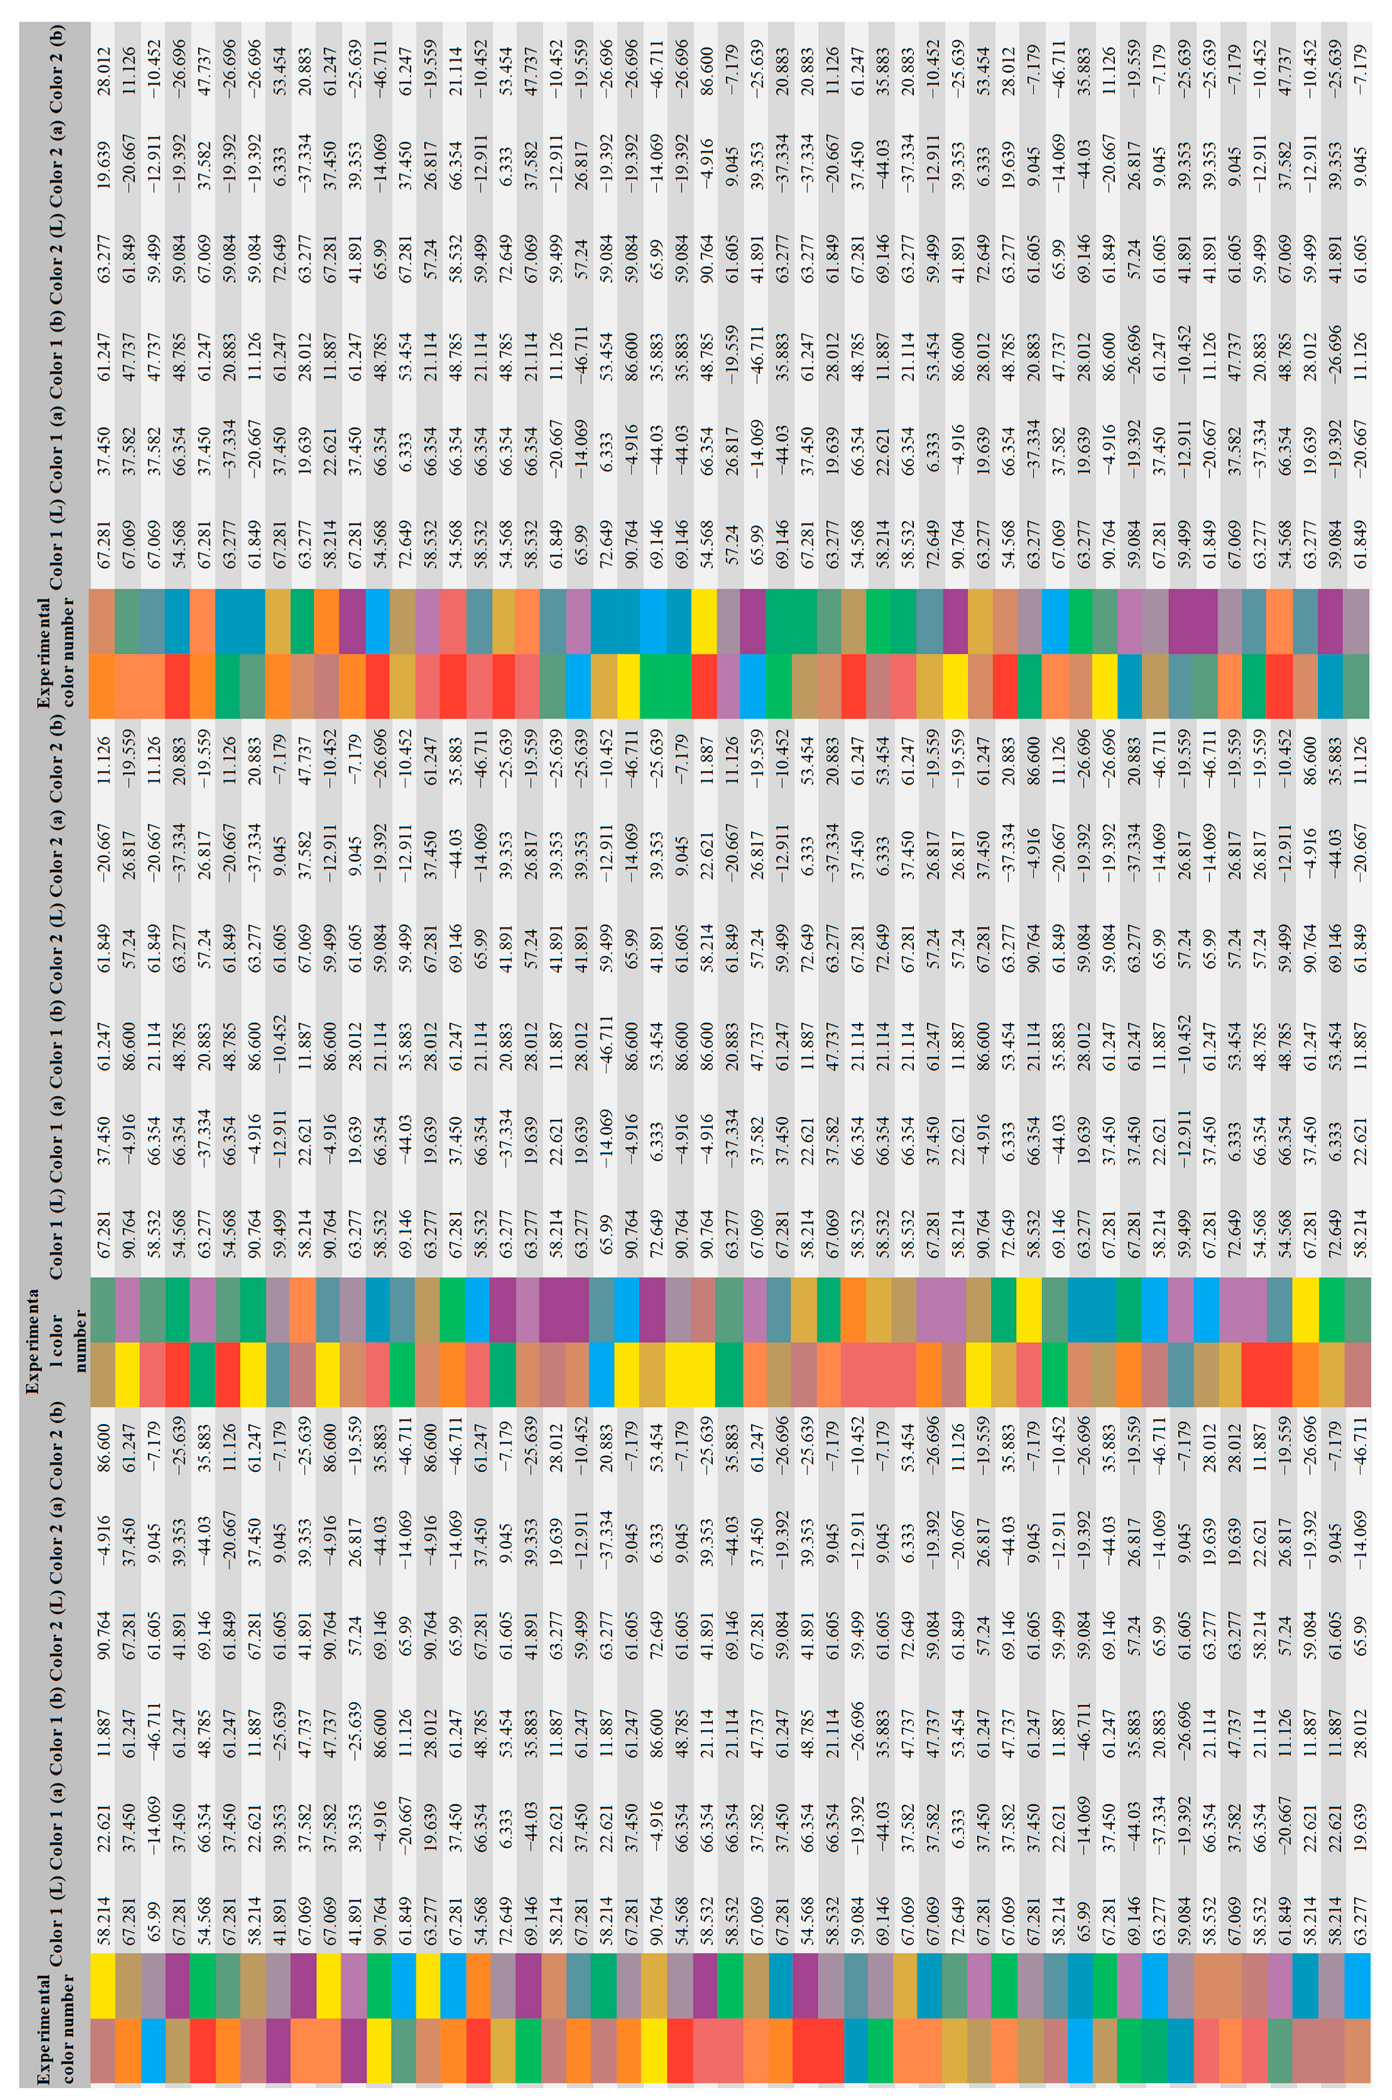
Appendix B. Color Combination and Color Value Correspondence

Applsci 14 08227 i001

Appendix C. Questionnaire

Architectural Color Visual Comfort Score(1) very uncomfortable
(2) less comfortable
(3) slightly uncomfortable
(4) general
(5) slightly comfortable
(6) more comfortable
(7) very comfortable
Architectural color visual preference scoring(1) very much disliked
(2) less favorable
(3) slightly disliked
(4) general
(5) slightly preferred
(6) prefer
(7) favorite

References

  1. Anter, K.F. Forming Spaces with Colour and Light: Trends in Architectural Practice and Swedish Colour Research. Colour Des. Creat. 2008, 2, 1–10. [Google Scholar]
  2. Jaglarz, A. Perception of Color in Architecture and Urban Space. Buildings 2023, 13, 2000. [Google Scholar] [CrossRef]
  3. Askari, A.H.; Soltani, S. Contribution of Building Façades to Attractive Streetscapes: Study of Two Main Streets in Kuala Lumpur City. JDBE 2018, 18, 29–40. [Google Scholar] [CrossRef]
  4. Wang, J.; Zhang, L.; Gou, A. Study of the Color Characteristics of Residential Buildings in Shanghai. Color Res. Appl. 2021, 46, 240–257. [Google Scholar] [CrossRef]
  5. Xu, Z.; Zheng, X. Roadmap of Moving Urban Colour toward Cultural Sustainability in China. Color Res. Appl. 2021, 46, 222–239. [Google Scholar] [CrossRef]
  6. Odetti, J.V. The Study of Color as a Component of Urban Cultural Construction: A Theoretical Reflection and Methodological Proposal. Color Res. Appl. 2023, 48, 453–467. [Google Scholar] [CrossRef]
  7. Manav, B. Color-emotion Associations, Designing Color Schemes for Urban Environment-architectural Settings. Color Res. Appl. 2017, 42, 631–640. [Google Scholar] [CrossRef]
  8. Chen, K.; Lin, H.; Chen, Y.-J.; Xu, Y.; Ding, S.; Guo, Y.; You, S. Do Consumers Have Colour Aesthetic Preferences for the Facade Materials of Condominium Buildings? Buildings 2024, 14, 557. [Google Scholar] [CrossRef]
  9. Gou, A. Method of Urban Color Plan Based on Spatial Configuration. Color Res. Appl. 2013, 38, 65–72. [Google Scholar] [CrossRef]
  10. Hogg, J.; Goodman, S.; Porter, T.; Mikellides, B.; Preddy, D.E. Dimensions and Determinants of Judgements of Colour Samples and a Simulated Interior Space by Architects and Non-Architects. Br. J. Psychol. 1979, 70, 231–242. [Google Scholar] [CrossRef]
  11. Shi, Y.; Tu, Y.; Wang, L.; Zhu, N.; Zhang, D. How Visual Discomfort Is Affected by Colour Saturation: A fNIRS Study. IEEE Photonics J. 2022, 14, 1–7. [Google Scholar] [CrossRef]
  12. Wang, Z.; Sun, H.; Li, J. Research on Architectural Color and Visual Comfort in Historic Landscape Areas. Buildings 2023, 13, 1004. [Google Scholar] [CrossRef]
  13. Zarghami, E.; Ghanbaran, A.; Karimimoshaver, M.; Saadativaghar, P. Effect of Height and Color of Tall Buildings on the Perceived Psychological Restoration of Residents. J. Archit. Plan. Res. 2019, 36, 321–342. [Google Scholar]
  14. Zhai, Y.; Gong, R.; Huo, J.; Fan, B. Building Façade Color Distribution, Color Harmony and Diversity in Relation to Street Functions: Using Street View Images and Deep Learning. ISPRS Int. J. Geo-Inf. 2023, 12, 224. [Google Scholar] [CrossRef]
  15. Wang, Z.; Shen, M.; Huang, Y. Exploring the Impact of Facade Color Elements on Visual Comfort in Old Residential Buildings in Shanghai: Insights from Eye-Tracking Technology. Buildings 2024, 14, 1758. [Google Scholar] [CrossRef]
  16. Vasiljevic-Tomic, D.; Maric, I. Colour in the City: Principles of Nature-Climate Characteristics. Facta Univ. Archit. Civ. Eng. 2011, 9, 315–323. [Google Scholar] [CrossRef]
  17. Wan, J.; Zhou, Y.; Li, Y.; Su, Y.; Cao, Y.; Zhang, L.; Ying, L.; Deng, W. Research on Color Space Perceptions and Restorative Effects of Blue Space Based on Color Psychology: Examination of the Yijie District of Dujiangyan City as an Example. Int. J. Environ. Res. Public Health 2020, 17, 3137. [Google Scholar] [CrossRef]
  18. Serra, J.; García, Á.; Torres, A.; Llopis, J. Color Composition Features in Modern Architecture. Color Res. Appl. 2012, 37, 126–133. [Google Scholar] [CrossRef]
  19. Zanon, S.; Callegaro, N.; Albatici, R. A Novel Approach for the Definition of an Integrated Visual Quality Index for Residential Buildings. Appl. Sci. 2019, 9, 1579. [Google Scholar] [CrossRef]
  20. Cheng, L.; Chu, S.; Zong, W.; Li, S.; Wu, J.; Li, M. Use of Tencent Street View Imagery for Visual Perception of Streets. ISPRS Int. J. Geo-Inf. 2017, 6, 265. [Google Scholar] [CrossRef]
  21. Bharmoria, R.; Sharma, V. Analyzing the Urban Sustainable Development Impact of Degraded Visual Quality on Streetscape Causing Visual Variation: A Case of Dharamshala, Himachal Pradesh. Environ. Dev. Sustain. 2024. [Google Scholar] [CrossRef]
  22. Adam, M.; Al-Sharaa, A.; Ab Ghafar, N.; Mundher, R.; Abu Bakar, S.; Alhasan, A. The Effects of Colour Content and Cumulative Area of Outdoor Advertisement Billboards on the Visual Quality of Urban Streets. ISPRS Int. J. Geo-Inf. 2022, 11, 630. [Google Scholar] [CrossRef]
  23. Mundher, R.; Abu Bakar, S.; Al-Helli, M.; Gao, H.; Al-Sharaa, A.; Mohd Yusof, M.J.; Maulan, S.; Aziz, A. Visual Aesthetic Quality Assessment of Urban Forests: A Conceptual Framework. Urban Sci. 2022, 6, 79. [Google Scholar] [CrossRef]
  24. Ma, B.; Hauer, R.J.; Xu, C. Effects of Design Proportion and Distribution of Color in Urban and Suburban Green Space Planning to Visual Aesthetics Quality. Forests 2020, 11, 278. [Google Scholar] [CrossRef]
  25. Zhang, Z.; Qie, G.; Wang, C.; Jiang, S.; Li, X.; Li, M. Relationship between Forest Color Characteristics and Scenic Beauty: Case Study Analyzing Pictures of Mountainous Forests at Sloped Positions in Jiuzhai Valley, China. Forests 2017, 8, 63. [Google Scholar] [CrossRef]
  26. Bu, X.; Chen, X.; Wang, S.; Yuan, Y.; Han, C. The Influence of Newly Built High-Rise Buildings on Visual Impact Assessment of Historic Urban Landscapes: A Case Study of Xi’an Bell Tower. J. Asian Archit. Build. Eng. 2022, 21, 1304–1319. [Google Scholar] [CrossRef]
  27. Wang, Q.; Xu, H.; Zhang, F.; Wang, Z. Influence of Color Temperature on Comfort and Preference for LED Indoor Lighting. Optik 2017, 129, 21–29. [Google Scholar] [CrossRef]
  28. Markopoulos, E.; Goonetilleke, R.S.; Ho, A.G.; Luximon, Y. (Eds.) Advances in Creativity, Innovation, Entrepreneurship and Communication of Design: Proceedings of the AHFE 2021 Virtual Conferences on Creativity, Innovation and Entrepreneurship, and Human Factors in Communication of Design, USA, 25–29 July 2021; Lecture Notes in Networks and Systems; Springer International Publishing: Cham, Switzerland, 2021; Volume 276, ISBN 978-3-030-80093-2. [Google Scholar]
  29. Sarasso, P.; Neppi-Modona, M.; Sacco, K.; Ronga, I. “Stopping for Knowledge”: The Sense of Beauty in the Perception-Action Cycle. Neurosci. Biobehav. Rev. 2020, 118, 723–738. [Google Scholar] [CrossRef]
  30. Long, Y.; Liu, L. How Green Are the Streets? An Analysis for Central Areas of Chinese Cities Using Tencent Street View. PLoS ONE 2017, 12, e0171110. [Google Scholar] [CrossRef] [PubMed]
  31. Hu, K.; Xu, Z.; Wang, X.; Wang, Y.; Li, H.; Zhang, Y. Research on Street Color Environment Perception Based on CEP-KASS Framework. Buildings 2023, 13, 2649. [Google Scholar] [CrossRef]
  32. Verma, D.; Jana, A.; Ramamritham, K. Predicting Human Perception of the Urban Environment in a Spatiotemporal Urban Setting Using Locally Acquired Street View Images and Audio Clips. Build. Environ. 2020, 186, 107340. [Google Scholar] [CrossRef]
  33. Csikszentmihalyi, M.; Larson, R. The Ecology of Adolescent Activity and Experience. J. Youth Adolesc. 1977, 6, 281–294. [Google Scholar] [CrossRef] [PubMed]
  34. Worthy, D.A. An Examination of the Effects of Eye-Tracking on Behavior in Psychology Experiments. Behav. Res. Methods 2024, 56, 6812–6825. [Google Scholar] [CrossRef] [PubMed]
  35. Mele, M.L.; Federici, S. Gaze and Eye-Tracking Solutions for Psychological Research. Cogn. Process. 2012, 13, 261–265. [Google Scholar] [CrossRef] [PubMed]
  36. Hamamé, C.M.; Vidal, J.R.; Perrone-Bertolotti, M.; Ossandón, T.; Jerbi, K.; Kahane, P.; Bertrand, O.; Lachaux, J.-P. Functional Selectivity in the Human Occipitotemporal Cortex during Natural Vision: Evidence from Combined Intracranial EEG and Eye-Tracking. NeuroImage 2014, 95, 276–286. [Google Scholar] [CrossRef]
  37. Yarbus, A.L. Eye Movements and Vision; Springer US: Boston, MA, USA, 1967; ISBN 978-1-4899-5381-0. [Google Scholar]
  38. Bix, L.; Seo, W.; Sundar, R.P. The Effect of Colour Contrast on Consumers’ Attentive Behaviours and Perception of Fresh Produce. Packag. Technol. Sci. 2013, 26, 96–104. [Google Scholar] [CrossRef]
  39. Siegrist, M. Consumers’ Food Selection Behaviors in Three-Dimensional (3D) Virtual Reality. Food Res. Int. 2019, 117, 50–59. [Google Scholar] [CrossRef]
  40. Shoval, N.; Schvimer, Y.; Tamir, M. Real-Time Measurement of Tourists’ Objective and Subjective Emotions in Time and Space. J. Travel Res. 2018, 57, 3–16. [Google Scholar] [CrossRef]
  41. Scott, N.; Zhang, R.; Le, D.; Moyle, B. A Review of Eye-Tracking Research in Tourism. Curr. Issues Tour. 2019, 22, 1244–1261. [Google Scholar] [CrossRef]
  42. Gao, Y.; Sun, X.M.; Zhang, T.; Zhan, H. Analysis on the Characteristics of Eye Movement and the Evaluation of Psychological Perception for Forest Waterscape Space. IOP Conf. Ser. Earth Environ. Sci. 2021, 626, 012007. [Google Scholar] [CrossRef]
  43. Hasse, C.; Weber, R. Eye Movements on Facades: The Subjective Perception of Balance in Architecture and Its Link to Aesthetic Judgment. Empir. Stud. Arts 2012, 30, 7–22. [Google Scholar] [CrossRef]
  44. Li, J.; Zhang, Z.; Jing, F.; Gao, J.; Ma, J.; Shao, G.; Noel, S. An Evaluation of Urban Green Space in Shanghai, China, Using Eye Tracking. Urban For. Urban Green. 2020, 56, 126903. [Google Scholar] [CrossRef]
  45. Li, N.; Zhang, S.; Xia, L.; Wu, Y. Investigating the Visual Behavior Characteristics of Architectural Heritage Using Eye-Tracking. Buildings 2022, 12, 1058. [Google Scholar] [CrossRef]
  46. Li, Z.; Sun, X.; Zhao, S.; Zuo, H. Integrating Eye-Movement Analysis and the Semantic Differential Method to Analyze the Visual Effect of a Traditional Commercial Block in Hefei, China. Front. Archit. Res. 2021, 10, 317–331. [Google Scholar] [CrossRef]
  47. Lv, J.; Xu, X.; Ding, N. Research on the Quantitative Method of Cognitive Loading in a Virtual Reality System. Information 2019, 10, 170. [Google Scholar] [CrossRef]
  48. Orquin, J.L.; Loose, S.M. Attention and Choice: A Review on Eye Movements in Decision Making. Acta Psychol. 2013, 144, 190–206. [Google Scholar] [CrossRef] [PubMed]
  49. Guo, H.Y.; Cai, Y.N. China’s Urban Architecture and Environmental Color Practicein in Ten Years. AMM 2012, 174–177, 2512–2515. [Google Scholar] [CrossRef]
  50. Li, K.; Zheng, Z.; Wang, P.; Yan, W. Research on the Colour Preference and Harmony of the two-colour Combination Buildings. Color Res. Appl. 2022, 47, 980–991. [Google Scholar] [CrossRef]
  51. De La Fuente Suárez, L.A. Subjective Experience and Visual Attention to a Historic Building: A Real-World Eye-Tracking Study. Front. Archit. Res. 2020, 9, 774–804. [Google Scholar] [CrossRef]
  52. Kiefer, P.; Giannopoulos, I.; Raubal, M.; Duchowski, A. Eye Tracking for Spatial Research: Cognition, Computation, Challenges. Spat. Cogn. Comput. 2017, 17, 1–19. [Google Scholar] [CrossRef]
  53. Wang, H.; Tang, J.; Xu, P.; Chen, R.; Yao, H. Research on the Influence Mechanism of Street Vitality in Mountainous Cities Based on a Bayesian Network: A Case Study of the Main Urban Area of Chongqing. Land 2022, 11, 728. [Google Scholar] [CrossRef]
  54. Zhang, L.; Li, X.; Li, C.; Zhang, T. Research on Visual Comfort of Color Environment Based on the Eye-Tracking Method in Subway Space. J. Build. Eng. 2022, 59, 105138. [Google Scholar] [CrossRef]
  55. Hanada, M. Correspondence Analysis of Color–Emotion Associations. Color Res. Appl. 2018, 43, 224–237. [Google Scholar] [CrossRef]
  56. Hong, X.; Ji, X.; Wu, Z. Architectural Colour Planning Strategy and Planning Implementation Evaluation of Historical and Cultural Cities Based on Different Urban Zones in Xuzhou (China). Color Res. Appl. 2022, 47, 424–453. [Google Scholar] [CrossRef]
  57. Wang, J.; Zhang, L.; Gou, A. Study on the Preference of City Color Image Selection Based on the Logistic Model: A Case Study of Shanghai. Color Res. Appl. 2020, 45, 542–557. [Google Scholar] [CrossRef]
  58. Labib, S.M.; Lindley, S.; Huck, J.J. Spatial Dimensions of the Influence of Urban Green-Blue Spaces on Human Health: A Systematic Review. Environ. Res. 2020, 180, 108869. [Google Scholar] [CrossRef]
  59. Kaya, N.; Crosby, M. Color Associations with Different Building Types: An Experimental Study on American College Students. Color Res. Appl. 2006, 31, 67–71. [Google Scholar] [CrossRef]
  60. Gou, A.; Wang, J. Research on the Location Characters of Urban Color Plan in China. Color Res. Appl. 2008, 33, 68–76. [Google Scholar] [CrossRef]
  61. He, F. Gender Differences in Color Perceptions and Preferences of Urban Façades Based on a Virtual Comparison. Build. Environ. 2023, 245, 110907. [Google Scholar] [CrossRef]
  62. Brychtova, A.; Coltekin, A. An Empirical User Study for Measuring the Influence of Colour Distance and Font Size in Map Reading Using Eye Tracking. Cartogr. J. 2016, 53, 202–212. [Google Scholar] [CrossRef]
  63. Massaro, D.; Savazzi, F.; Di Dio, C.; Freedberg, D.; Gallese, V.; Gilli, G.; Marchetti, A. When Art Moves the Eyes: A Behavioral and Eye-Tracking Study. PLoS ONE 2012, 7, e37285. [Google Scholar] [CrossRef]
  64. Zhang, L.; Dempsey, N.; Cameron, R. ‘Blossom Buddies’—How Do Flower Colour Combinations Affect Emotional Response and Influence Therapeutic Landscape Design? Landsc. Urban Plan. 2024, 248, 105099. [Google Scholar] [CrossRef]
  65. Abromavičius, V.; Serackis, A. Eye and EEG Activity Markers for Visual Comfort Level of Images. Biocybern. Biomed. Eng. 2018, 38, 810–818. [Google Scholar] [CrossRef]
  66. Lu, M.; Hu, S.; Mao, Z.; Liang, P.; Xin, S.; Guan, H. Research on Work Efficiency and Light Comfort Based on EEG Evaluation Method. Build. Environ. 2020, 183, 107122. [Google Scholar] [CrossRef]
  67. Gholami, Y.; Taghvaei, S.H.; Norouzian-Maleki, S.; Mansouri Sepehr, R. Identifying the Stimulus of Visual Perception Based on Eye-Tracking in Urban Parks: Case Study of Mellat Park in Tehran. J. For. Res. 2021, 26, 91–100. [Google Scholar] [CrossRef]
  68. Forbes, S.H.; Plunkett, K. Colour Perception Changes with Basic Colour Word Comprehension. Dev. Sci. 2023, 26, e13406. [Google Scholar] [CrossRef]
  69. Babiker, A.; Faye, I.; Prehn, K.; Malik, A. Machine Learning to Differentiate Between Positive and Negative Emotions Using Pupil Diameter. Front. Psychol. 2015, 6, 1921. [Google Scholar] [CrossRef]
Figure 1. Research framework.
Applsci 14 08227 g001
Figure 3. Overview of experimental subjects.
Applsci 14 08227 g003
Figure 4. Laboratory environment, equipment, and personnel: (a) laboratory ambient light control, (b) experimental equipment, and (c) experimental procedure.
Applsci 14 08227 g004
Figure 5. (a) Box plots of participants’ APD, ASA, FFD, FC, TFF, TFD, ACP, and VC across different hue groups (the middle line represents the median, the upper and lower bounds of the box represent the 25th and 75th percentiles, respectively, and the upper and lower ends of the whiskers represent the 5th and 95th percentiles, respectively). **: p ≤ 0.01; ****: p ≤ 0.0001. (b) The colour combination is sorted by different indicators and their corresponding values.
Applsci 14 08227 g005aApplsci 14 08227 g005b
Figure 6. The correlation analysis between ΔE, ΔL, ΔC, and Δh and eye-tracking metrics and subjective comfort metrics APD, ASA, FFD, FC, TFF, TFD, ACP, and VC is depicted in the figures: (a) scatter plot matrix and (b) correlation analysis chart, with Pearson correlation coefficients. ***: p < 0.001.
Applsci 14 08227 g006
Table 1. Meaning of eye movement indicators.
Eye Movement IndexAbbreviationsMeaning
First Fixation DurationFFD (s)The duration of the first fixation within the area of interest, representing the ease or difficulty of recognizing or finding attractiveness of the experimental object.
Fixation CountFC (count)The sum of all fixation durations within the area of interest, representing the level of interest of the participants toward the experimental object.
Time to First FixationTFF (s)The time taken by the participants to first fixate on an area of interest, i.e., the duration until the first entry into the area of interest. It represents the visual saliency of the experimental material.
Total Fixation DurationTFD (s)The sum of the durations of all fixations within the area of interest. It represents the level of interest the participants have in the experimental stimulus.
Average Pupil DiameterAPD (mm)It directly reflects the level of visual stimulation perceived by the participants toward the stimuli.
Average Saccadic AmplitudeASA (degrees)The average distance between saccades, typically measured in degrees of visual angle. Eye movements, facilitated by involuntary saccades, help alleviate visual fatigue and reflect the ease of information processing by the participants in the experiment.
Table 2. Questionnaire for subjective evaluation of color comfort on building facades.
Evaluation IndicatorsAbbreviations Subjective Rating
Architectural Color PreferencesACP1234567
Visual ComfortVC1234567
Table 3. Single-factor regression models of color elements with eye-tracking metrics and subjective comfort.
Unstandardized CoefficientsStandardized Coefficients
VariableFactorsβSEβtSig.
APDΔE<0.001<0.0010.0133.2070.001
ΔL0.001<0.0010.0225.398<0.001
ΔC<0.001<0.0010.0143.3290.001
Δh<0.001<0.0010.0112.7650.006
ASAΔE0.012<0.0010.16740.988<0.001
ΔL0.038<0.0010.30677.756<0.001
ΔC0.013<0.0010.17643.219<0.001
Δh0.012<0.0010.15738.334<0.001
FFDΔE0.001<0.0010.0286.721<0.001
ΔL0.002<0.0010.0614.425<0.001
ΔC0.001<0.0010.04510.794<0.001
Δh0.001<0.0010.0235.49<0.001
FCΔE−0.0190.001−0.148−36.253<0.001
ΔL−0.0690.001−0.326−83.298<0.001
ΔC−0.0230.001−0.189−46.572<0.001
Δh−0.0160.001−0.127−31.068<0.001
TFFΔE0.001<0.0010.09623.199<0.001
ΔL0.004<0.0010.18946.492<0.001
ΔC0.001<0.0010.11127.051<0.001
Δh0.001<0.0010.08620.855<0.001
TFDΔE−0.003<0.001−0.078−18.837<0.001
ΔL−0.008<0.001−0.15−36.749<0.001
ΔC−0.003<0.001−0.079−19.115<0.001
Δh−0.002<0.001−0.07−17.001<0.001
ACPΔE−0.015<0.001−0.268−67.297<0.001
ΔL−0.029<0.001−0.311−79.059<0.001
ΔC−0.011<0.001−0.19−46.815<0.001
Δh−0.014<0.001−0.24−59.762<0.001
VCΔE−0.017<0.001−0.297−75.171<0.001
ΔL−0.032<0.001−0.326−83.474<0.001
ΔC−0.012<0.001−0.207−51.088<0.001
Δh−0.016<0.001−0.264−66.089<0.001
Table 4. Multi-factor regression models of color element differences with eye-tracking metrics and subjective comfort.
Unstandardized CoefficientsStandardized Coefficients
VariableFactorsβSEβtSig.
APDIntercept2.9440.004 687.156<0.001
ΔE<0.001<0.0010.0120.8310.406
ΔL<0.001<0.0010.023.971<0.001
ΔC<0.001<0.0010.0020.3350.738
Δh>−0.001<0.001−0.007−0.5030.615
ASAIntercept3.2930.022 153.04<0.001
ΔE0.0020.0010.0221.6570.097
ΔL0.0340.0010.2757.769<0.001
ΔC0.003<0.0010.0366.904<0.001
Δh0.0020.0010.0332.5470.011
FFDIntercept0.4510.007 67.425<0.001
ΔE<0.001<0.0010.0080.550.582
ΔL0.002<0.0010.0510.114<0.001
ΔC<0.001<0.0010.023.708<0.001
Δh>−0.001<0.001−0.006−0.4760.634
FCIntercept7.3790.036 203.959<0.001
ΔE−0.0110.002−0.089−6.71<0.001
ΔL−0.0640.001−0.303−65.304<0.001
ΔC−0.0040.001−0.03−5.925<0.001
Δh0.0090.0020.075.48<0.001
TFFIntercept0.1720.004 47.659<0.001
ΔE<0.001<0.0010.0322.3110.021
ΔL0.003<0.0010.1735.145<0.001
ΔC<0.001<0.0010.0234.234<0.001
Δh<0.001<0.001−0.009−0.6670.505
TFDIntercept2.6480.01 262.649<0.001
ΔE−0.002<0.001−0.048−3.4530.001
ΔL−0.008<0.001−0.141−28.945<0.001
ΔC<0.001<0.001−0.001−0.1930.847
Δh0.001<0.0010.0251.860.063
ACPIntercept2.9120.016 181.793<0.001
ΔE−0.0160.001−0.28−21.385<0.001
ΔL−0.023<0.001−0.247−53.705<0.001
ΔC<0.001<0.0010.0061.1110.267
Δh0.0060.0010.1098.645<0.001
VCIntercept3.2510.016 198.37<0.001
ΔE−0.0190.001−0.331−25.594<0.001
ΔL−0.025<0.001−0.252−55.491<0.001
ΔC<0.001<0.0010.0050.9930.321
Δh0.0080.0010.13510.867<0.001
Disclaimer/Publisher’s Note: The statements, opinions and data contained in all publications are solely those of the individual author(s) and contributor(s) and not of MDPI and/or the editor(s). MDPI and/or the editor(s) disclaim responsibility for any injury to people or property resulting from any ideas, methods, instructions or products referred to in the content.

