Article

Tin–Phosphorus Alloy: The Impact of Temperature on Alloy Formation and the Influence of the Dross Amount on the Solder Bath Surface

Faculty of Industrial Technologies in Puchov, Alexander Dubcek University of Trencin, I.Krasku 491/30, 020 01 Puchov, Slovakia
*
Author to whom correspondence should be addressed.
Appl. Sci. 2024, 14(18), 8257; https://doi.org/10.3390/app14188257
Submission received: 20 June 2024 / Revised: 29 August 2024 / Accepted: 2 September 2024 / Published: 13 September 2024
(This article belongs to the Section Mechanical Engineering)

Abstract

:
The restriction of lead content in alloys for the production of solder, based on the Directive of the European Parliament and of the Council of the European Union of 8 June 2011, which is also known as RoHS (Restriction of the use of certain Hazardous Substances in electrical and electronic equipment), had a very positive impact on research into lead-free solder alloys, as well as on the economic impact of the production of solders. It opened the door to issues relating to the mechanical properties of lead-free solders and the microhardness of formed joints, with the aim of increasing their quality and efforts to reduce production costs. In addition to the production efficiency increase, without the need for the manual removal of so-called slagging, the moderation of oxide formation on the melt surface, standing for an increase in the yield of the total amount of solder, represents one of the many factors influencing the production of lead-free alloys for tin-based soldering. This work deals with the issues of material selection for the production of lead-free solders. Temperature affects the formation of different phases when there is a change in the concentration of the elements involved because it can be a negative aspect for soldering. Therefore, it is necessary to have detailed knowledge on the entire process that takes place during temperature changes.

1. Introduction

The stability of tin-based phases above their melting point (232 °C) in atmospheric oxygen is very low, and a change can be observed with the naked eye. Melt with a tin content of at least 99% in the batch is silvery shiny at the beginning of the process, and, after only a few minutes, the surface acquires a matte finish due to the formation of a layer of oxides on its surface. The oxide layer is mainly a problem in lead-free wave soldering, in cases where a lead-free solder alloy is applied on the surface of PCB boards. The formation of oxides in this case causes a large loss of molten solder, increasing the total cost of production. Due to the fact that the density of lead-free tin-based solder in the liquid state is almost the same as oxides at the surface (density of molten tin is 6.980 kg/m3, density of SnO2 is 7.010 kg/m3, and SnO is 6.450 kg/m3), it is very difficult to separate slag from the melt [1]. The moderation of or reduction in slag formation on the surface of the tin melt is possible either due to the absence of oxygen access or through the addition of phosphorus to the batch [2,3]. Red phosphorus is very reactive and ignites at a lower temperature in comparison with the melting point of tin, and, therefore, it is necessary to add it in the form of a pre-alloy Sn-P to the melt. The production of this pre-alloy requires compliance with the temperature and amount of phosphorus, i.e., precise steps of loading the furnace under strict safety measures. In addition to the need to use safety features, such as a protective suit, protective shield, and gloves resistant to high temperatures, it is also necessary to ensure adequate ventilation. Based on studies in the specialized literature, it was found that by adding pre-alloy Sn-P to the melt of tin alloys, the number of oxides on its surface could be significantly reduced [4,5,6].

2. Materials and Methods

The design of the material and experimental methods is based on theoretical and practical knowledge. The experimental part consisted of two parts:
  • The preparation of samples of the SnP2 alloy under laboratory conditions;
  • An analysis of the dross amount formed on the solder bath surface.

2.1. Preparation of Samples of the SnP2 Alloy under Laboratory Conditions

Tin with 99.98% purity was used to create the SnP2 alloy (content of elements in the alloy—Sn 98%, P 2%) in the form of cut tin wire with a 5 mm diameter and stabilized P4 red phosphorus in the form of dust for synthesis. The measured weight of tin before the formation of the alloy was 490 g, and the measured weight of P4 phosphorus was 10 g. To create an intermediate layer between tin and phosphorus, due to their different melting points (Sn 232 °C, P4 586 °C), fine silica sand mixed with bentonite in a ratio of 1:1 was used. This technological process was chosen based on the experience of the previous experiment and the effort to create an Sn-P alloy. Without the formation of an intermediate layer separating the two components entering the melting process, phosphorus, due to its relatively low burning point (240 °C), would burn out before a chemical bond between it and tin can be formed and before it could form the desired Sn-P-based alloy. The batch consisted of the following layers (Figure 1) to obtain optimum results:
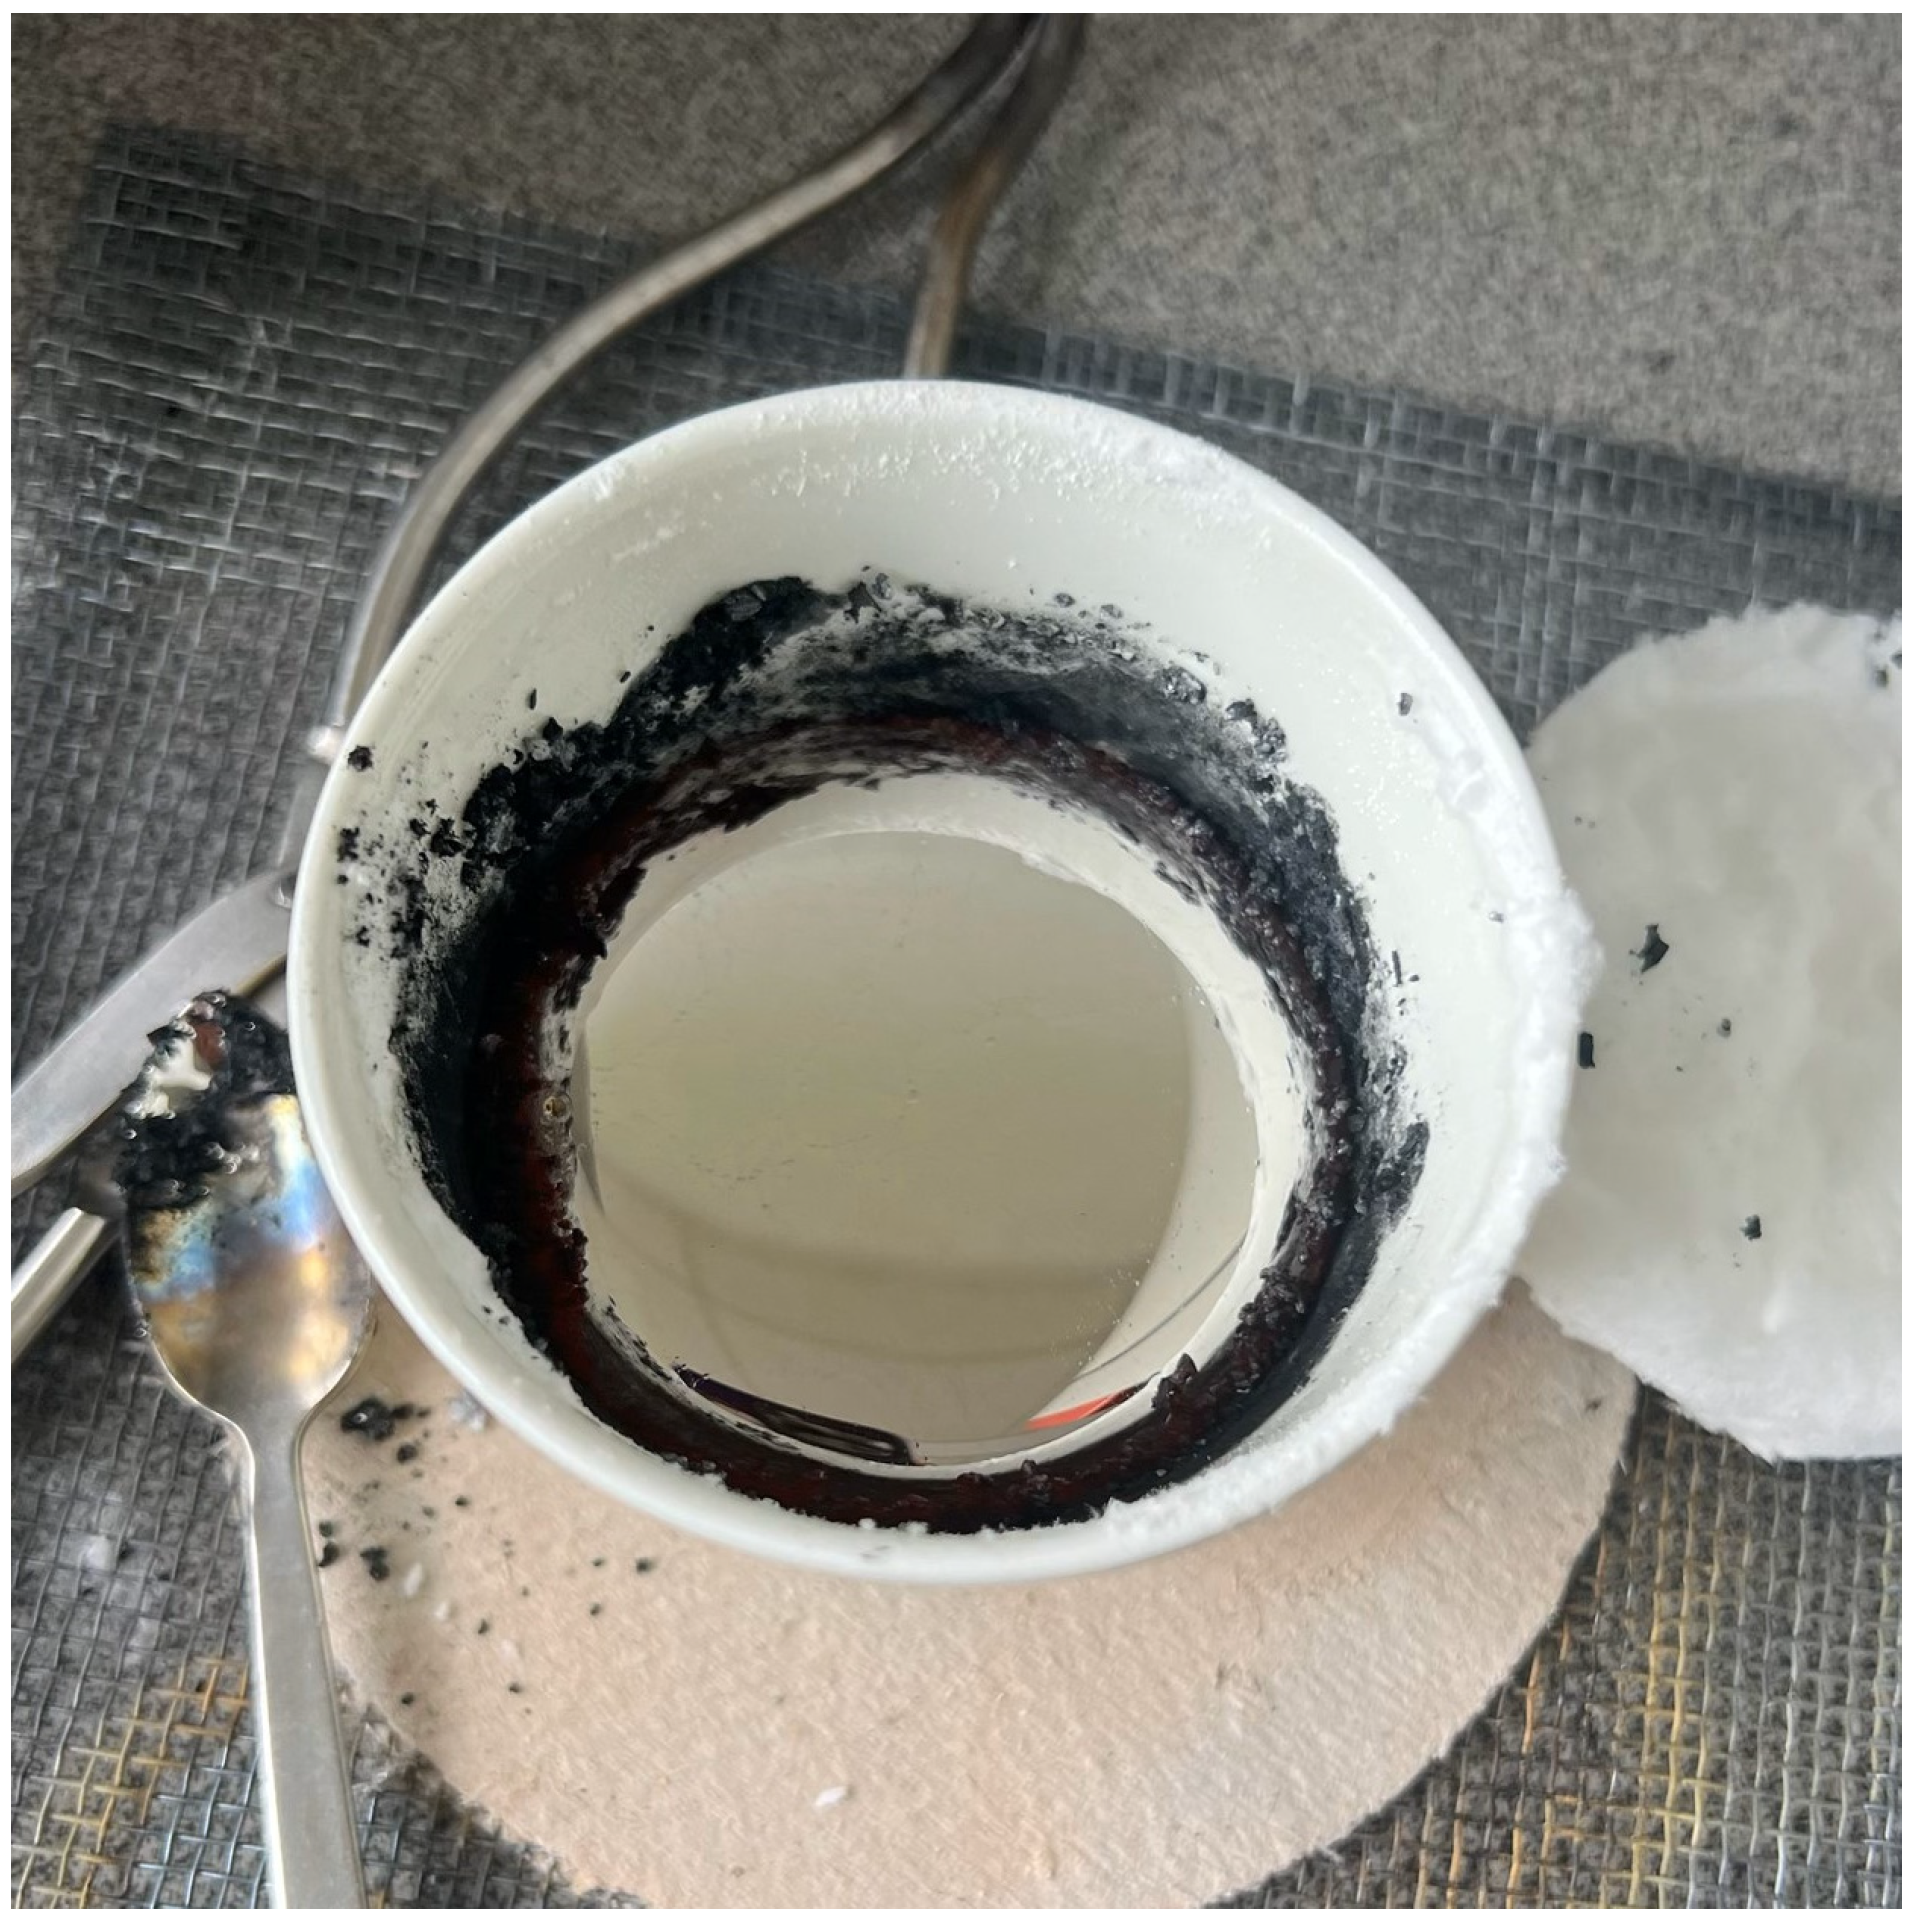
  • A total of 10 g of P4 (Figure 1A) red phosphorus in form of dust, stored in a vacuum desiccator;
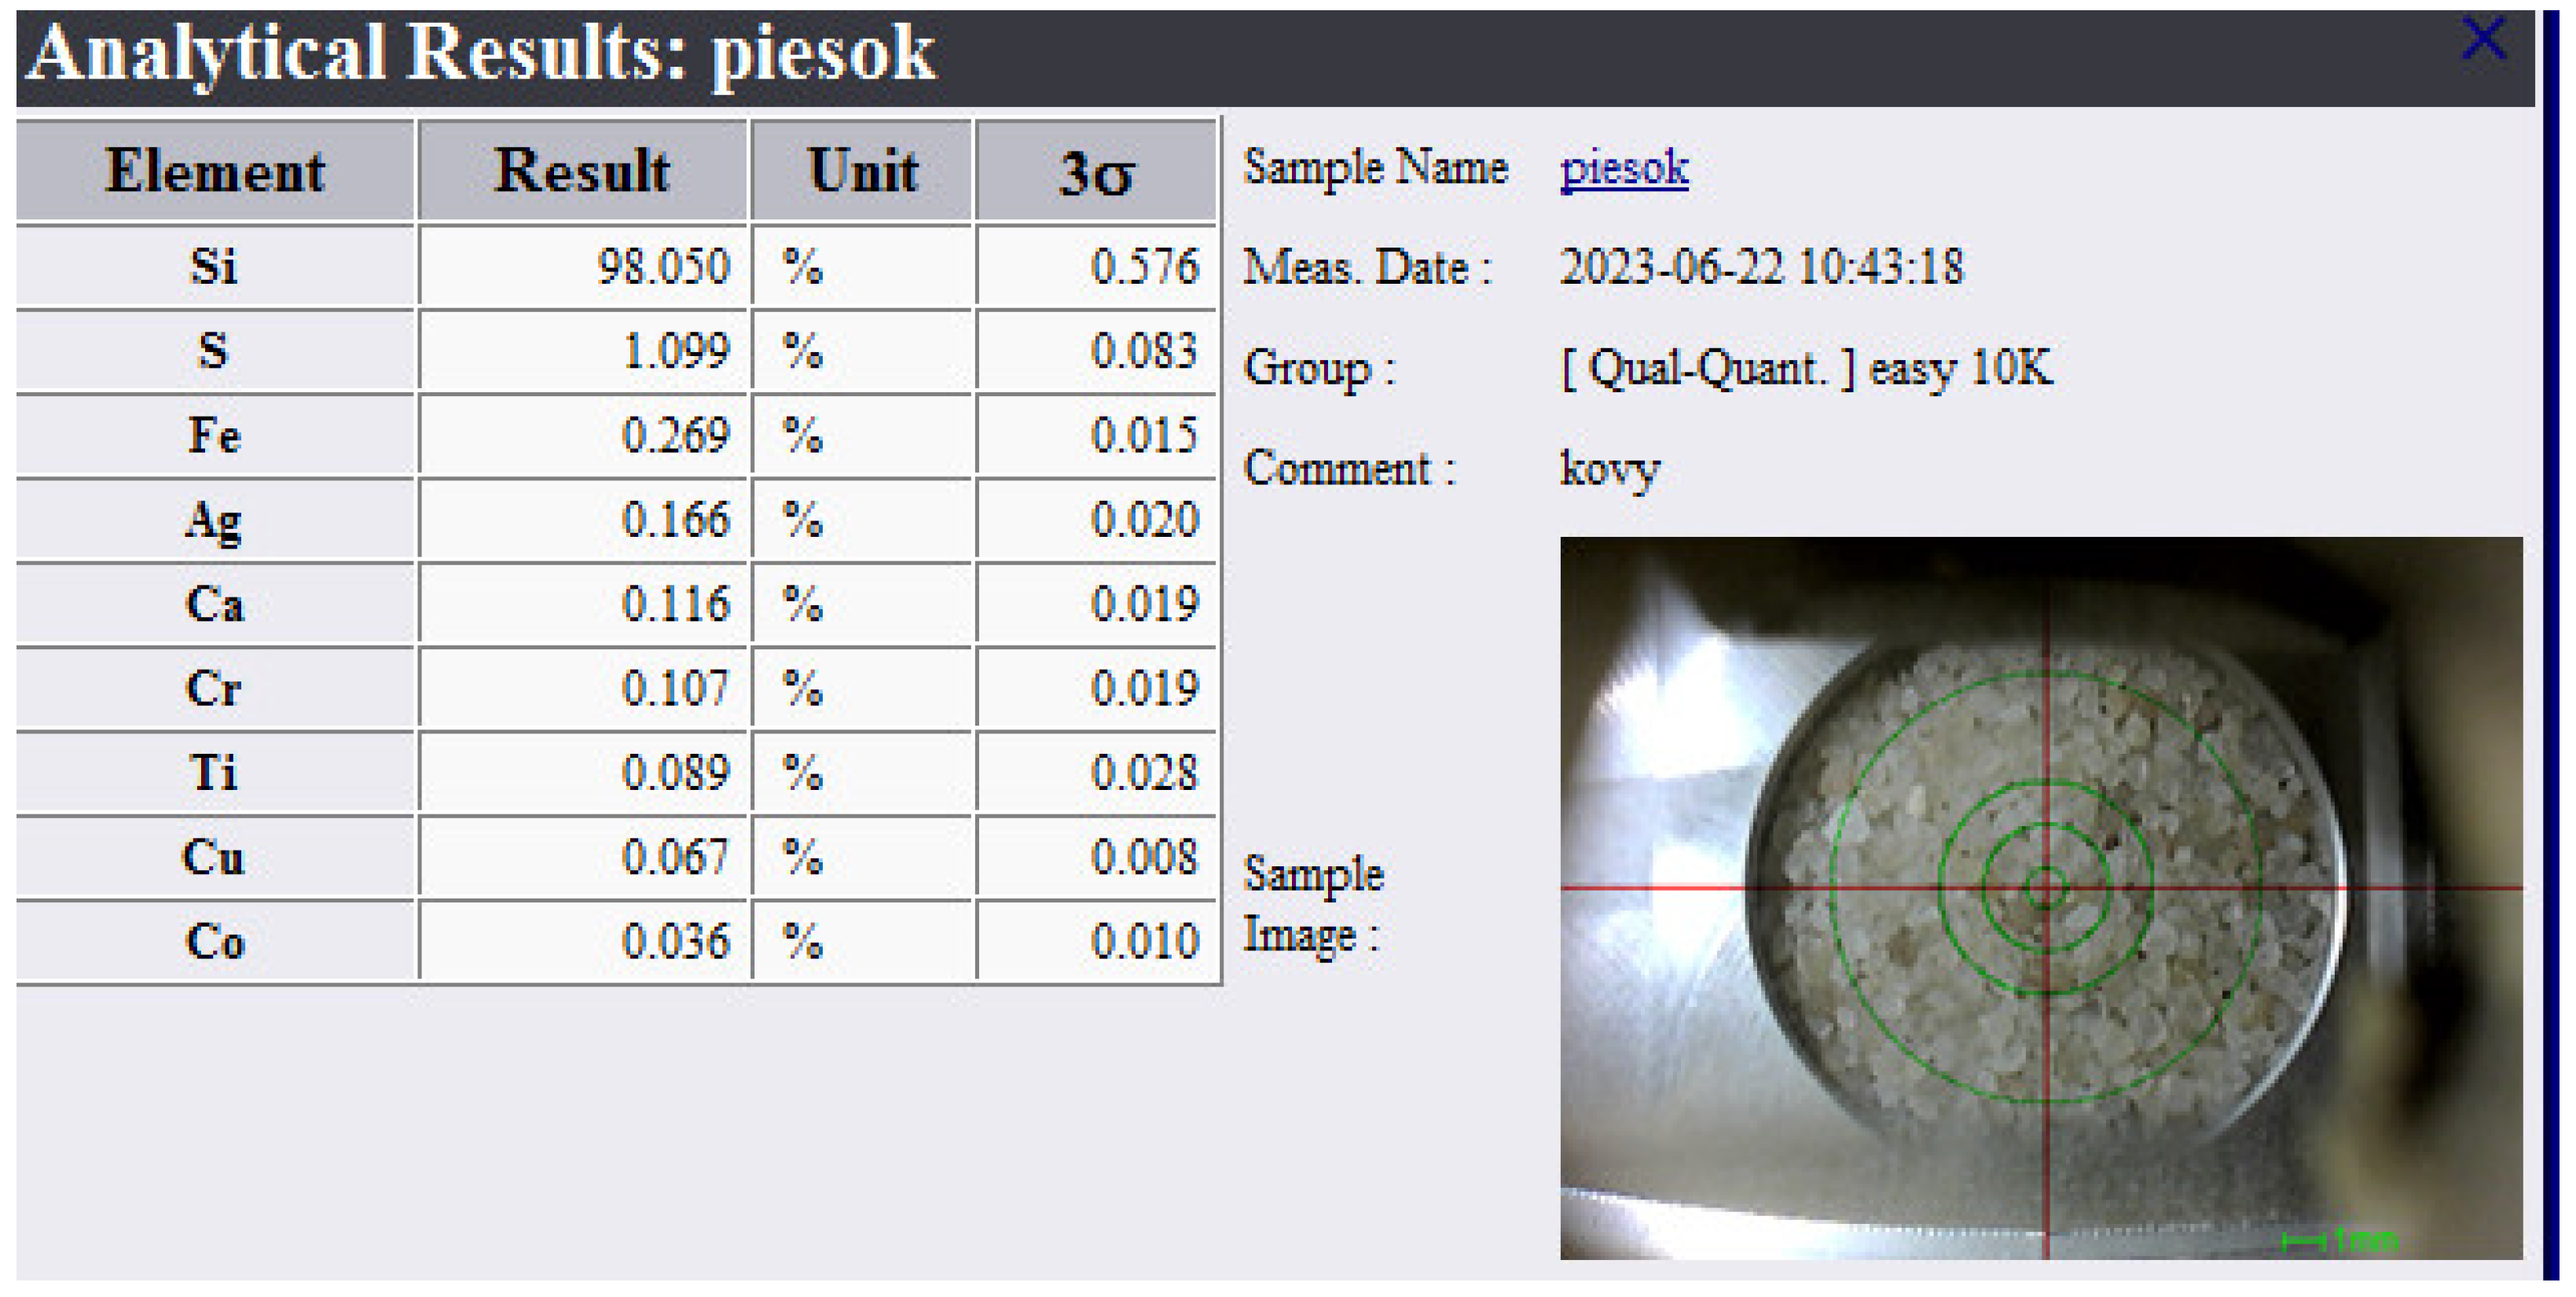
  • Interlayer—fine silica sand and bentonite in a ratio of 1:1 (Figure 1B);
  • Tin, with 99.98% purity, in the form of cut wire with a 5 mm diameter (Figure 1C);
  • Top layer—crushed coal (Figure 1D);
  • Sibral—temperature-resistant insulation material.
In this order, mentioned above, the individual parts of the batch were placed in a ceramic cup and then placed in the muffle furnace. The initial temperature was 120 °C during the insertion of the crucible filled with all layers. The crucible was heated at a speed interval of 10 °C/min. The casting temperature of the samples was different: 600 °C for the first melt, 700 °C for the second, 750 °C for the third, and 850 °C for the fourth melt. When the required temperature was reached, the crucible with the batch was held at this temperature for 20 min. The insulation material was removed, and the interlayer of fine sand and bentonite was broken with a graphite rod and then floated to the surface of the melt; subsequently, it was removed. After that, the crucible was covered with insulating material again and placed back into the furnace for 20 minutes, holding the required casting temperature to allow for a complete reaction between phosphorus and tin (Figure 2). The measured temperatures and melting time of individual samples are shown in Table 1, where temperature (TA) and time (tA) were recorded before the interlayer was taken, and temperature (TB) and time (tB) were recorded after the melt crucible had been reinserted into the furnace.
After the specified time, the contents of the crucible were poured into a mould, and the sample was removed after the alloy had been cooled. After that, all samples were visually inspected from the aspect of the impurities on their surface. The cooling of the sample was followed by its preparation for measuring the chemical composition with a digital optical emission spectrometer, Q4 TASMAN, with a CCD detector (Figure 3). This spectrometer is designed to analyse the chemical composition of metal solid samples. The spectrometer’s analytical tripod is based on combination of a pneumatic sample pressure that allows the sample to be firmly held at different heights, an analytical tripod with a top plate, and an analytical hole underneath which the electrode is placed. Argon gas passes through the analytical tripod. The sample on the spectrometer has to be representative of the material for analysis. In order to achieve the highest possible accuracy and reliability with the spectrometer to measure with, each sample has to be properly prepared before measurement. The underside of the sample has to be machined from both sides with a removal of material of at least 2 mm. Coolant or lubricating oils are not allowed to be used for machining to avoid contamination of the sample.
Before the measurement, the area of each sample to be analysed was sanded on a grinder with new, uncontaminated fine grain sandpaper. The requirements for each sample measured were as follows:
-
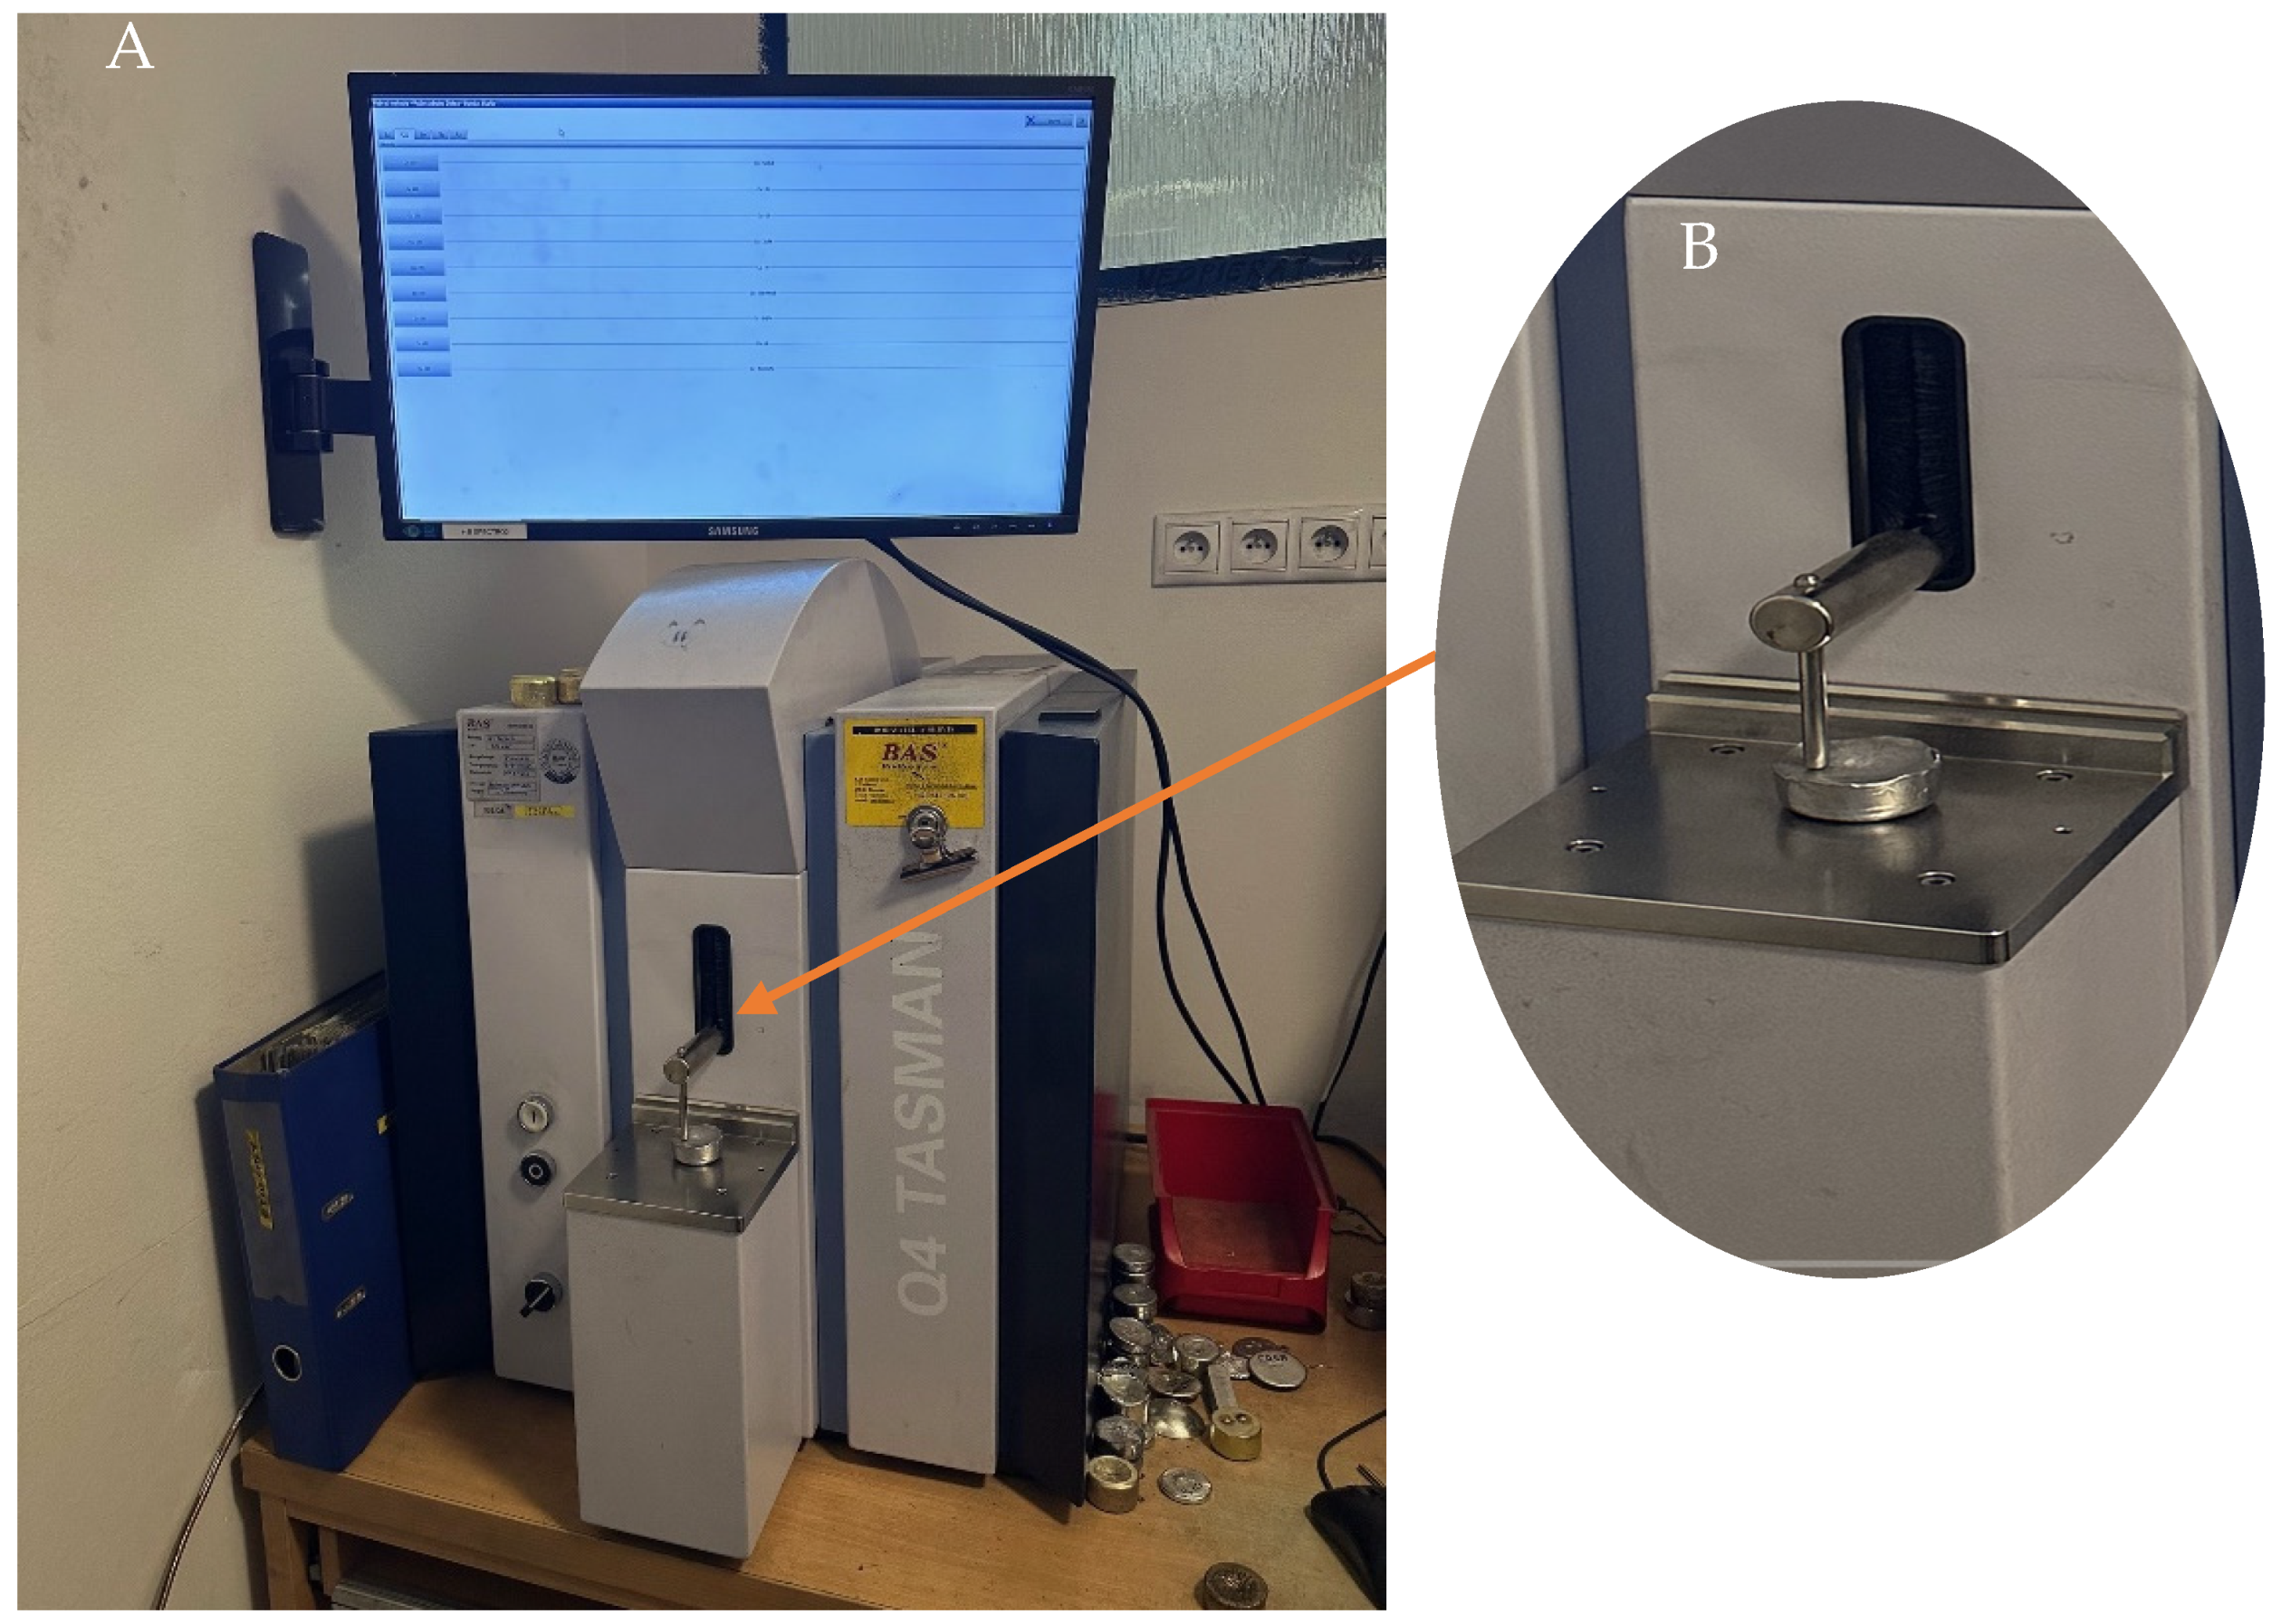
Electrical conductivity: The sample must be electrically conductive, without impurities on the surface.
-
Strength: The sample has to be solid and non-porous, free from bubbles, cracks, and dirt.
-
Homogeneity: The sample has to be homogeneous throughout its volume, and there is not any segregation of individual elements. The surface of the sample has to be flat, clean, dry, and unoxidized as well as larger than the hole above the electrode in order to cover and seal it completely.
-
Cleanliness: The sanded side of the sample surface is not allowed to be placed on the table to avoid contamination of the surface to be analysed.
Before each analysis, the electrode must be cleaned with a cleaning brush.
Then, the prepared sample can be placed on a plate of an analytical tripod, completely covering the gap above the electrode. The sample has to extend 1 mm beyond the edge of the electrode gap, or ideally as much as possible in the centre of the sample where it is expected to be the most homogeneous.

2.2. Analysis of Dross Amount Formed on the Solder Bath Surface

To verify the effects of the antioxidant SnP2 alloy on reducing the amount of the melt surface oxides in the production of tin solder, the production of solder, SAC305 type, was chosen, and the chemical composition is shown in Table 1. The content of the elements in the table is indicated with the maximum permissible content of the individual elements according to the standard for this type of alloy (J-STD-006C) [7]. This type of alloy is specifically mentioned as a substitute for Sn63Pb37 (Sn 63%, Pb 37%) lead alloy. The performance characteristics of this alloy are very desirable; e.g., this alloy shows the best-in-class yield, outperforms all SnCu-based materials, has low dross generation, excellent solderability due to fast wetting speed (in back-to-back tests 0.65 s compared to 1.00 s for SnCu-based materials), and delivers excellent performance across a wide range of flux technologies. SAC305 complies with all requirements of RoHS Directive (Article 4.1 of the European Directive 2011/65/EU). Alloy specification for maximum lead (Pb) content = 0.07%. As Chen, Y. et al. writes in their article, Micro-structure evolution and growth kinetics of intermetallic compound in SAC305/Ag and SAC305/Cu solder joints during solid-state aging [8], SAC305 is a lead-free alloy that has proven to be a suitable substitute for leaded solder, precisely because of its good mechanical properties and relatively low melting point (melting point is from 217 °C to 219 °C). The solder pot temperature for wave soldering applications is from 255 °C to 265 °C and, for selective soldering, the recommended solder pot temperature is from 280 °C to 320 °C. Due to these temperatures, this type of alloy is also commonly used to stabilize and reduce the copper content in a wave solder bath. The temperature difference in use is also confirmed by Diepstraten, Gerjan in his book Lead-free Soldering Process Development and Reliability, chapter Wave/Selective Soldering, where the solder temperatures for selective soldering are slightly higher than for wave soldering (260 °C). However, they are much lower than lead-free hand soldering temperatures for rework wire (400 °C). Typically, the solder temperature is between 280 and 300 °C. The smaller nozzles need more heat to obtain enough energy in the assembly and have complete hole fill. Some engineers do not want to have temperatures above 300 °C because of fillet/pad lifting or flux activation loss [9]. Also, the results of M. Yang’s study showed that a Cu6Sn5 scallop-type layer with round grains having a strong texture was formed at the interface of the SAC solders/Cu systems. The addition of Ag decreased the IMC/liquid SAC solder interfacial energy and improved the wettability of the solder on the Cu [10].
Two solder baths (A and B) with the same material content were prepared, and each 300 kg batch of SAC305 consisted of the following parts:
  • Tin (Sn), with 99.98% purity, in the form of bars—288.45 kg.
  • Silver (Ag), with 99.98% purity in the form of cut wire with 5 mm diameter—9.0 kg.
  • Copper (Cu), with 99.98% purity in the form of thin wire with 0.44 mm*—1.5 kg.
*This form of material was chosen for better melting of copper at a lower temperature.
Deoxidation alloy SnP2 (Sn 98%, P 2%) was used in one of the solder baths (B), in the form of solid waffle-shaped ingots (Figure 4). The amount that was added to the melting was 1.05 kg.
All of the above materials were put into an electric industrial furnace with a pot made of cast iron. The heat temperature was set at 300 °C. After an hour and a half, the temperature was reduced to 255 °C, and the tin–phosphorus deoxidation alloy was then added to the second melt (B) to bring the phosphorus level up to a range of 0.005–0.007%. Molten alloy was mixed. The first dross began to appear. Even at this stage, a difference was noticeable in the furnace with an alloy without added phosphorus and with added phosphorus. The phosphorus-free melt colour on the surface showed yellow tones and was dull, while the surface colour of the phosphorus containing melt was silver glossy. All the dross generated during this period was carefully skimmed from the surface of the melt and weighed every hour. The total melting time was 6 h under stable conditions at a temperature of 255 °C. After 6 h, samples were cast from the melt without the addition of phosphorus (A) and from the melt with the addition of phosphorus (B) into the brass mould for the preparation of samples, as can be seen in Figure 5.
It is also important to consider the negative aspects of adding a phosphorus–tin alloy to a tin bath in the manufacture of solder. K. Sweatman, in a study titled The effects of phosphorus in lead-free solders, discussed the effect of adding phosphorus into a solder bath on stainless steel, as a powerful antioxidant for solder phosphorus, it can also break down the oxide film that gives stainless steel its resistance to wetting by molten solder. Once the protective oxide film had been penetrated, the molten solder wets the underlying Fe-Cr-Ni alloy, which then begins to dissolve in the solder [11]. The consequence is erosion of the parts exposed to the molten solder and even perforation of the walls of the solder pot, resulting in the leakage of molten solder, which can cause serious health and safety issues as well as damaging the machine. One solution to the problem of the machine erosion caused by the phosphorus, added to control drossing, was to make the solder pot using cast iron, which is more resistant to dissolution, or to line the pot with titanium. Pumps and nozzles were made more resistant to wetting and erosion by applying a ceramic coatings or a treatment that created a surface layer of metal nitrides that are much more resistant to wetting and dissolution [12]. However, this increases the cost of soldering equipment significantly.

3. Results

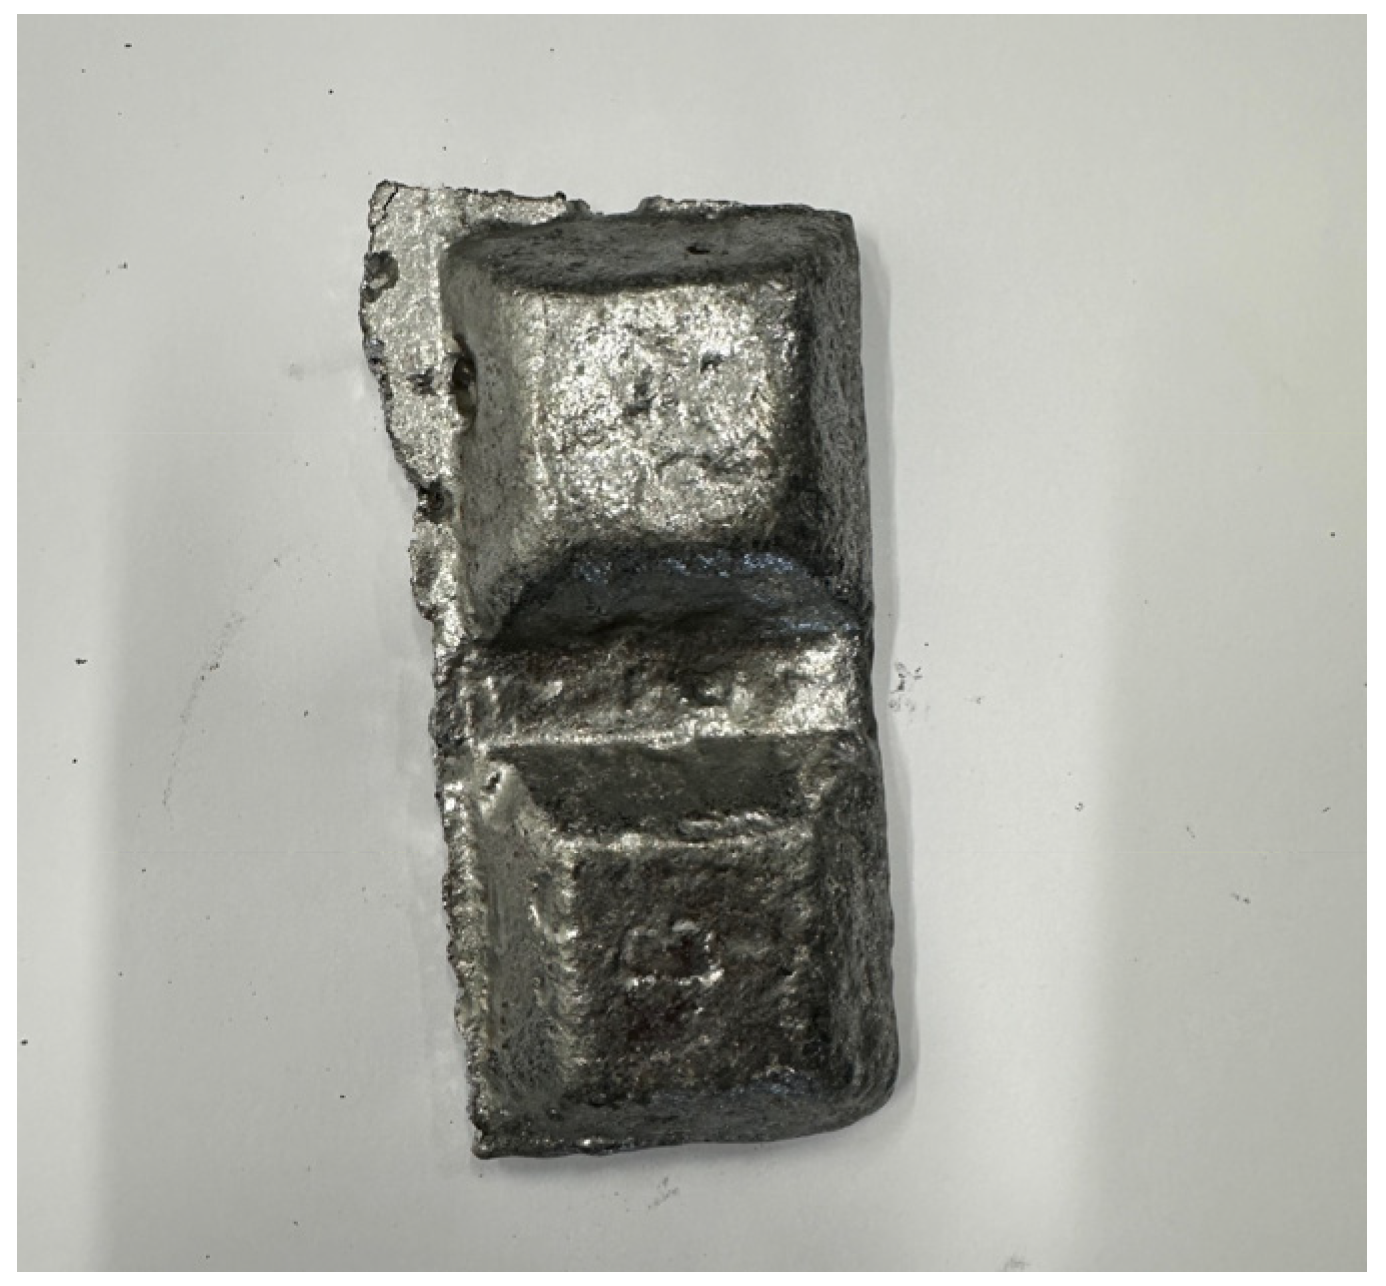
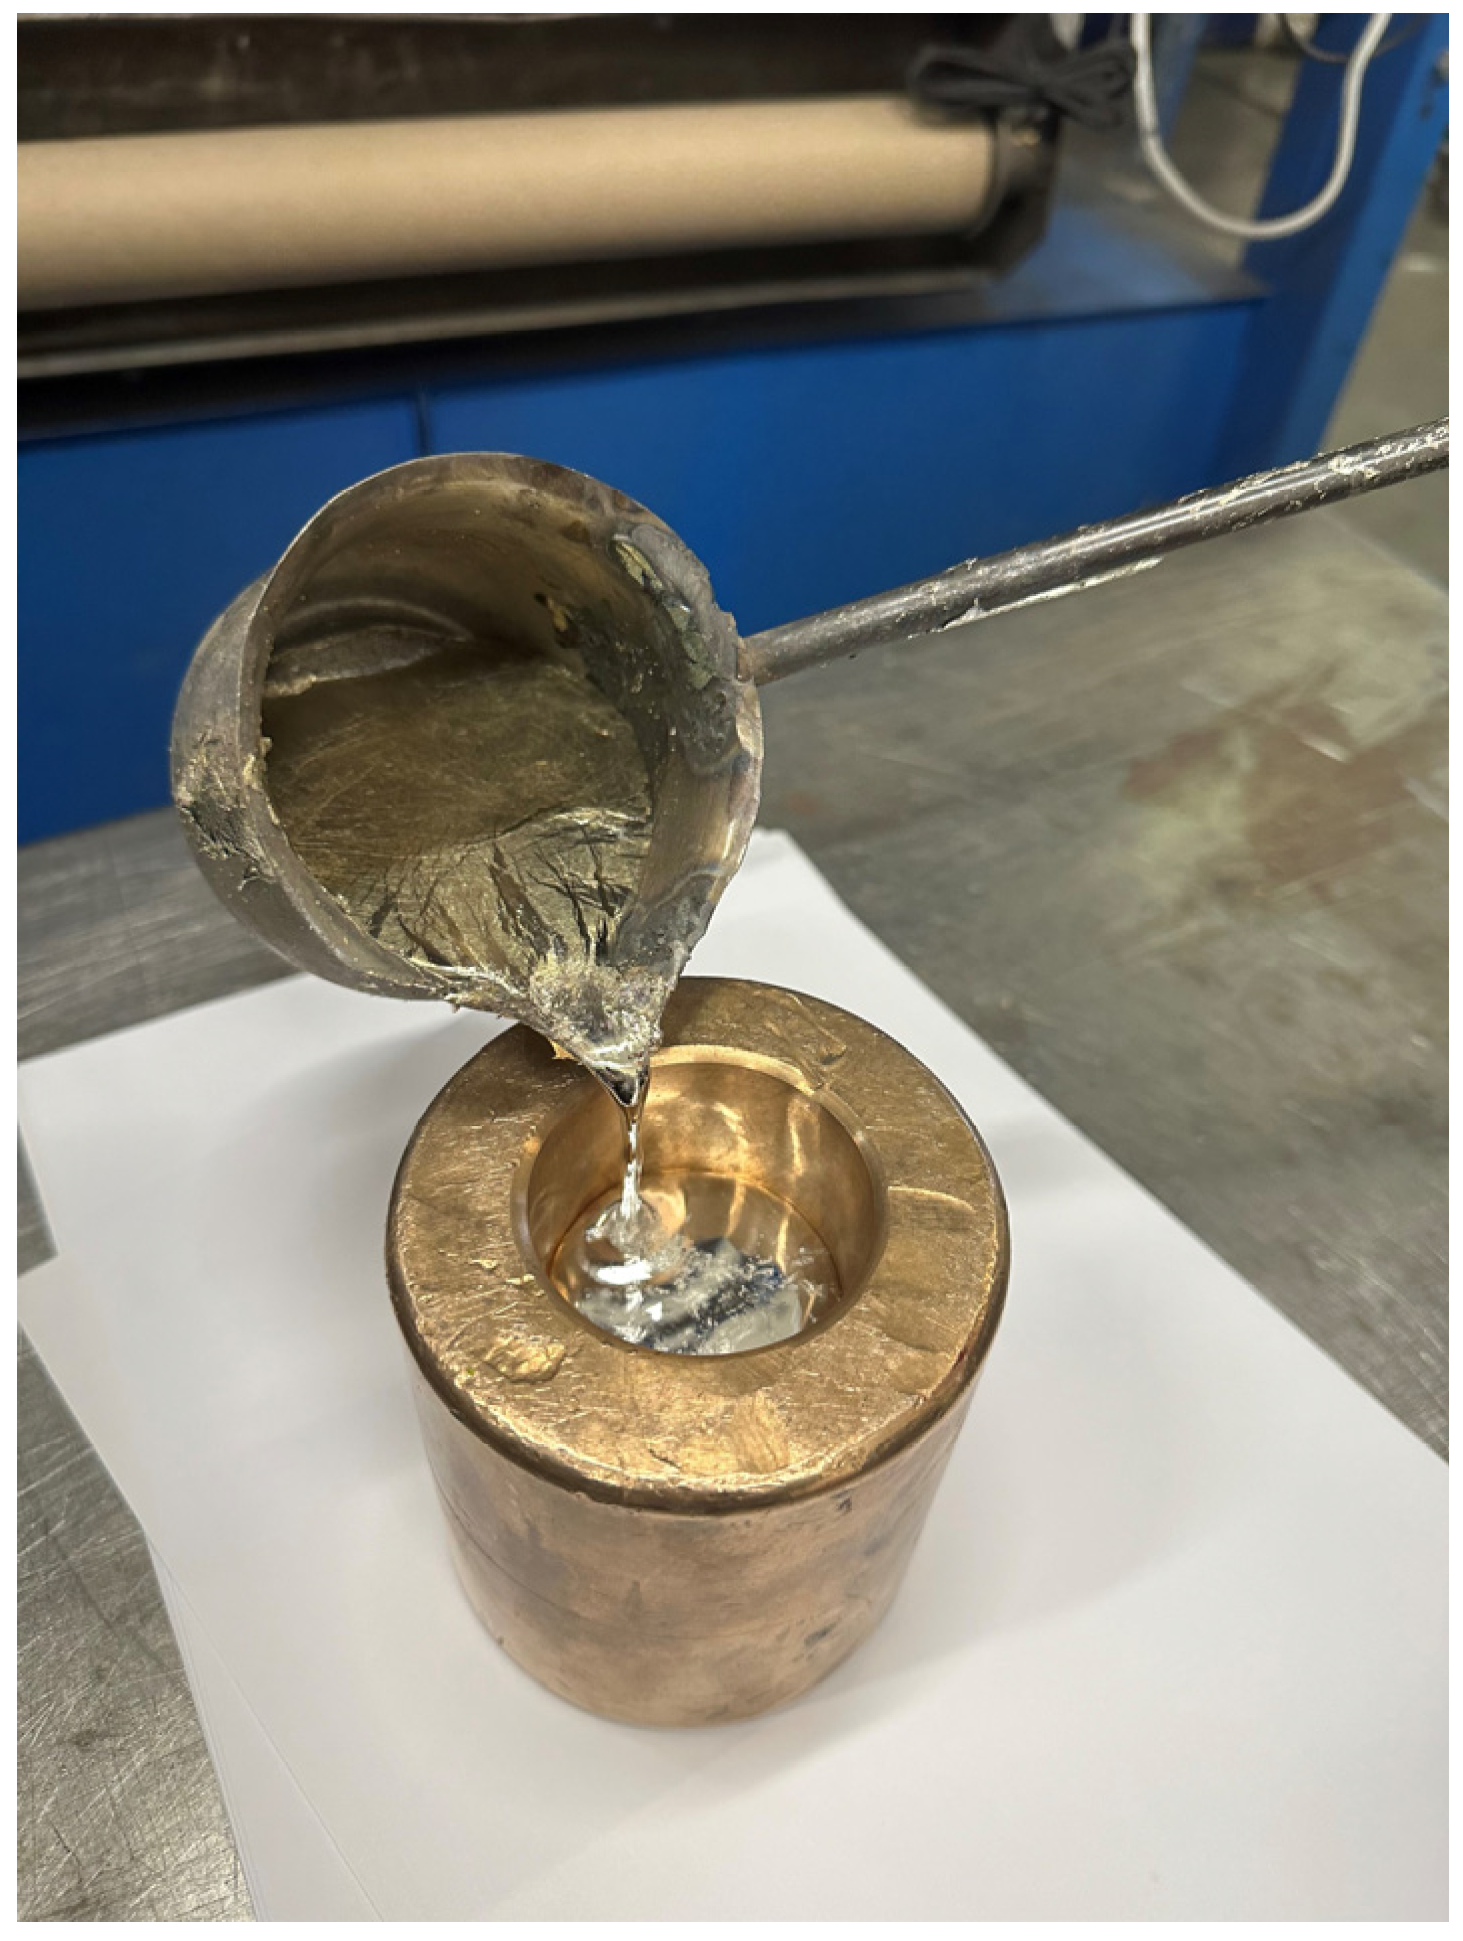
3.1. Preparation of SnP2 Alloy Samples under Laboratory Conditions

The chemical composition of four samples was measured, using the Q4 TASMAN digital optical emission spectrometer (Bruker, Billerica, MA, USA). The casting temperature of the samples was different (Table 2). The phosphorus and tin contents for individual samples are available in Table 3. The dependence of the casting temperature on the phosphorus content of the alloy is graphically shown in Figure 6.
From the experiments and the results obtained and presented in Table 2 and Table 3, it is clear that to form an Sn-P alloy with a phosphorus content of ≥2%, a temperature higher than 800 °C is required for the reaction to take place and complete the process. The observed surface of such a molten Sn-P alloy sample was rougher than that of the sample with a lower phosphorus content. A change in the colour and structure of sample surfaces could also be observed. This phenomenon in the casting of tin–phosphorus alloys is comparable to the specialized study, which was introduced by AI-Ping Xian and Guo-Liang Gong: Oxidation Behaviour of Molten Tin Doped with Phosphorus [13]. The given study shows how the phosphorus content of the Sn-P alloy affects the oxidation of the casting surface. In the cited paper, the authors introduce the fact that the oxidation resistance of a liquid alloy decreases with the amount of slag taken from its surface, which could be the result of unreacted phosphorus binding to slag-forming oxides due to a lower melting point of the alloy. The light silvery surface of the sample remained constant only at a higher melting point. According to the occurrence of other elements in the alloy captured on the basis of the chemical composition measurement method using a digital optical emission spectrometer (Ca, Cu, Fe), the sample with the highest phosphorus content (Sample No. 4) was exposed to semi-quantitative measurement from the sample surface by energy-dispersive X-ray fluorescence spectrometry using the EDX-7000 Shimadzu measuring instrument (Tokyo, Japan). The results of this measurement show a more accurate content of the mass percentages of individual elements and indicate the purity of the alloy. The sample was measured from both sides, and the measurement results are shown in Figure 7, Figure 8, Figure 9 and Figure 10.
The presence of calcium in the group of the elements found in the Sn-P alloy manifested itself in a higher percentage, and it led to the measurement as well as analysis of the chemical composition of sand. The given sand served as an intermediate layer between the individual elements during the melting of the alloy and was considered a source of calcium in the resulting sample [14,15]. The sand was also subjected to semi-quantitative analysis by energy-dispersive X-ray fluorescence spectrometry (Figure 11). The measurement result was not satisfactory because the presence of calcium in the sand was negligible and was probably not a contaminant of the sample (Sample No. 4).

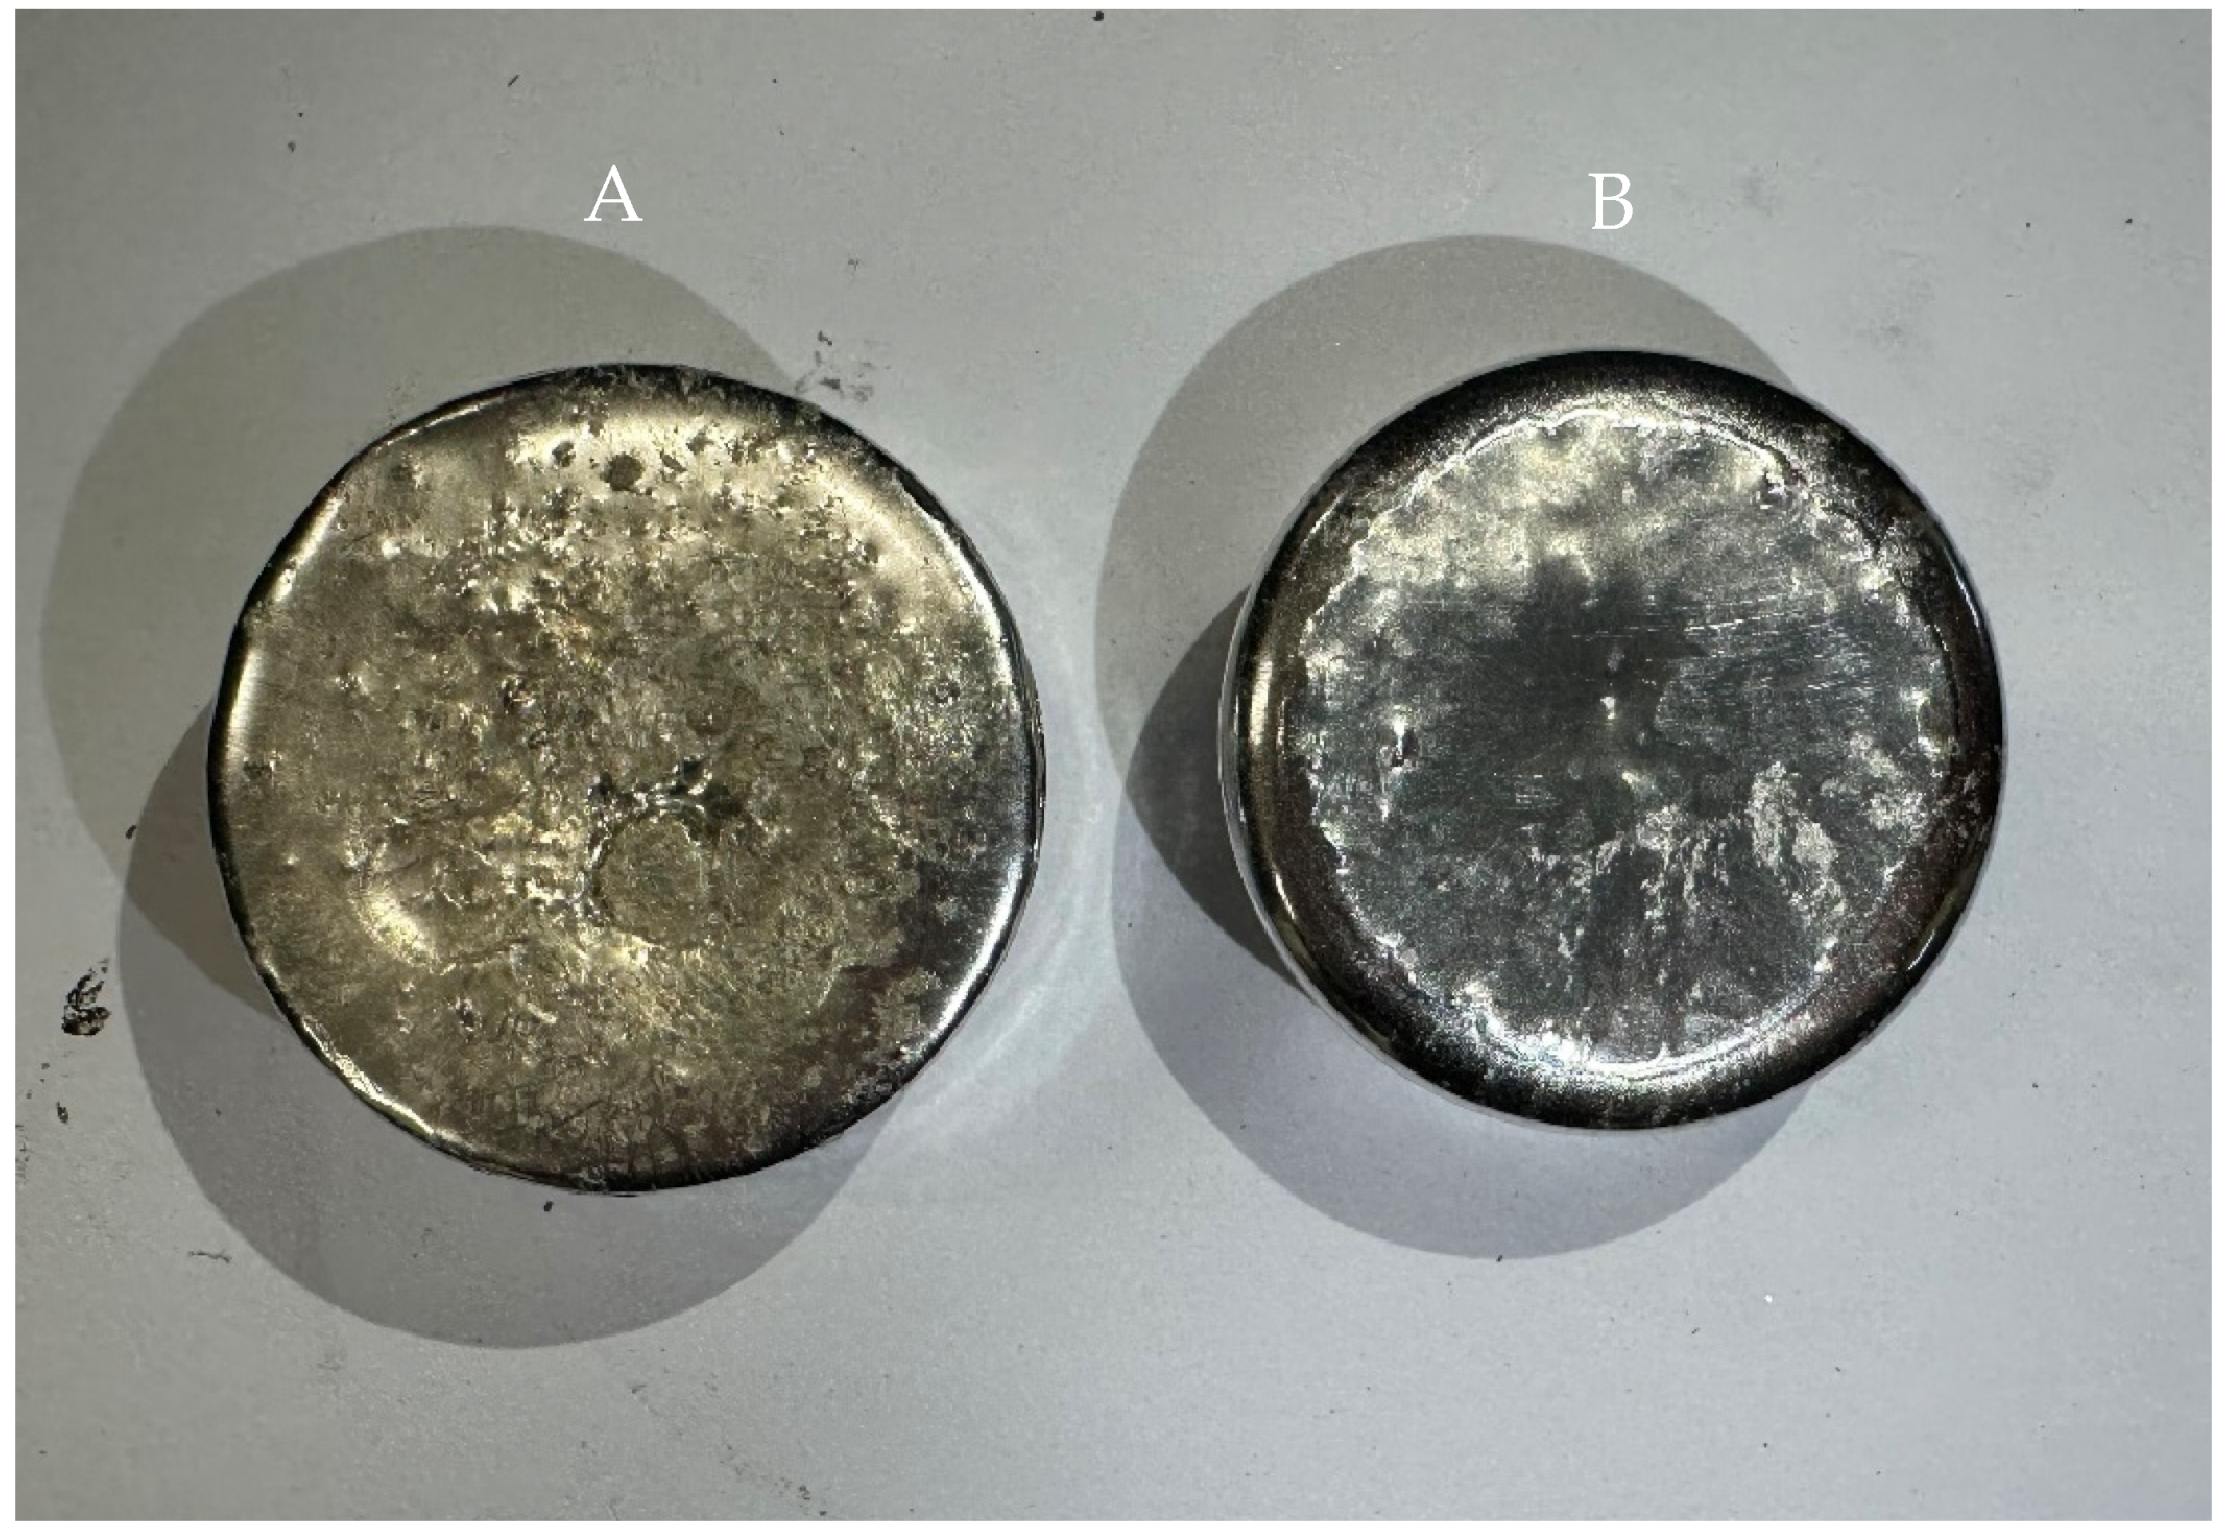
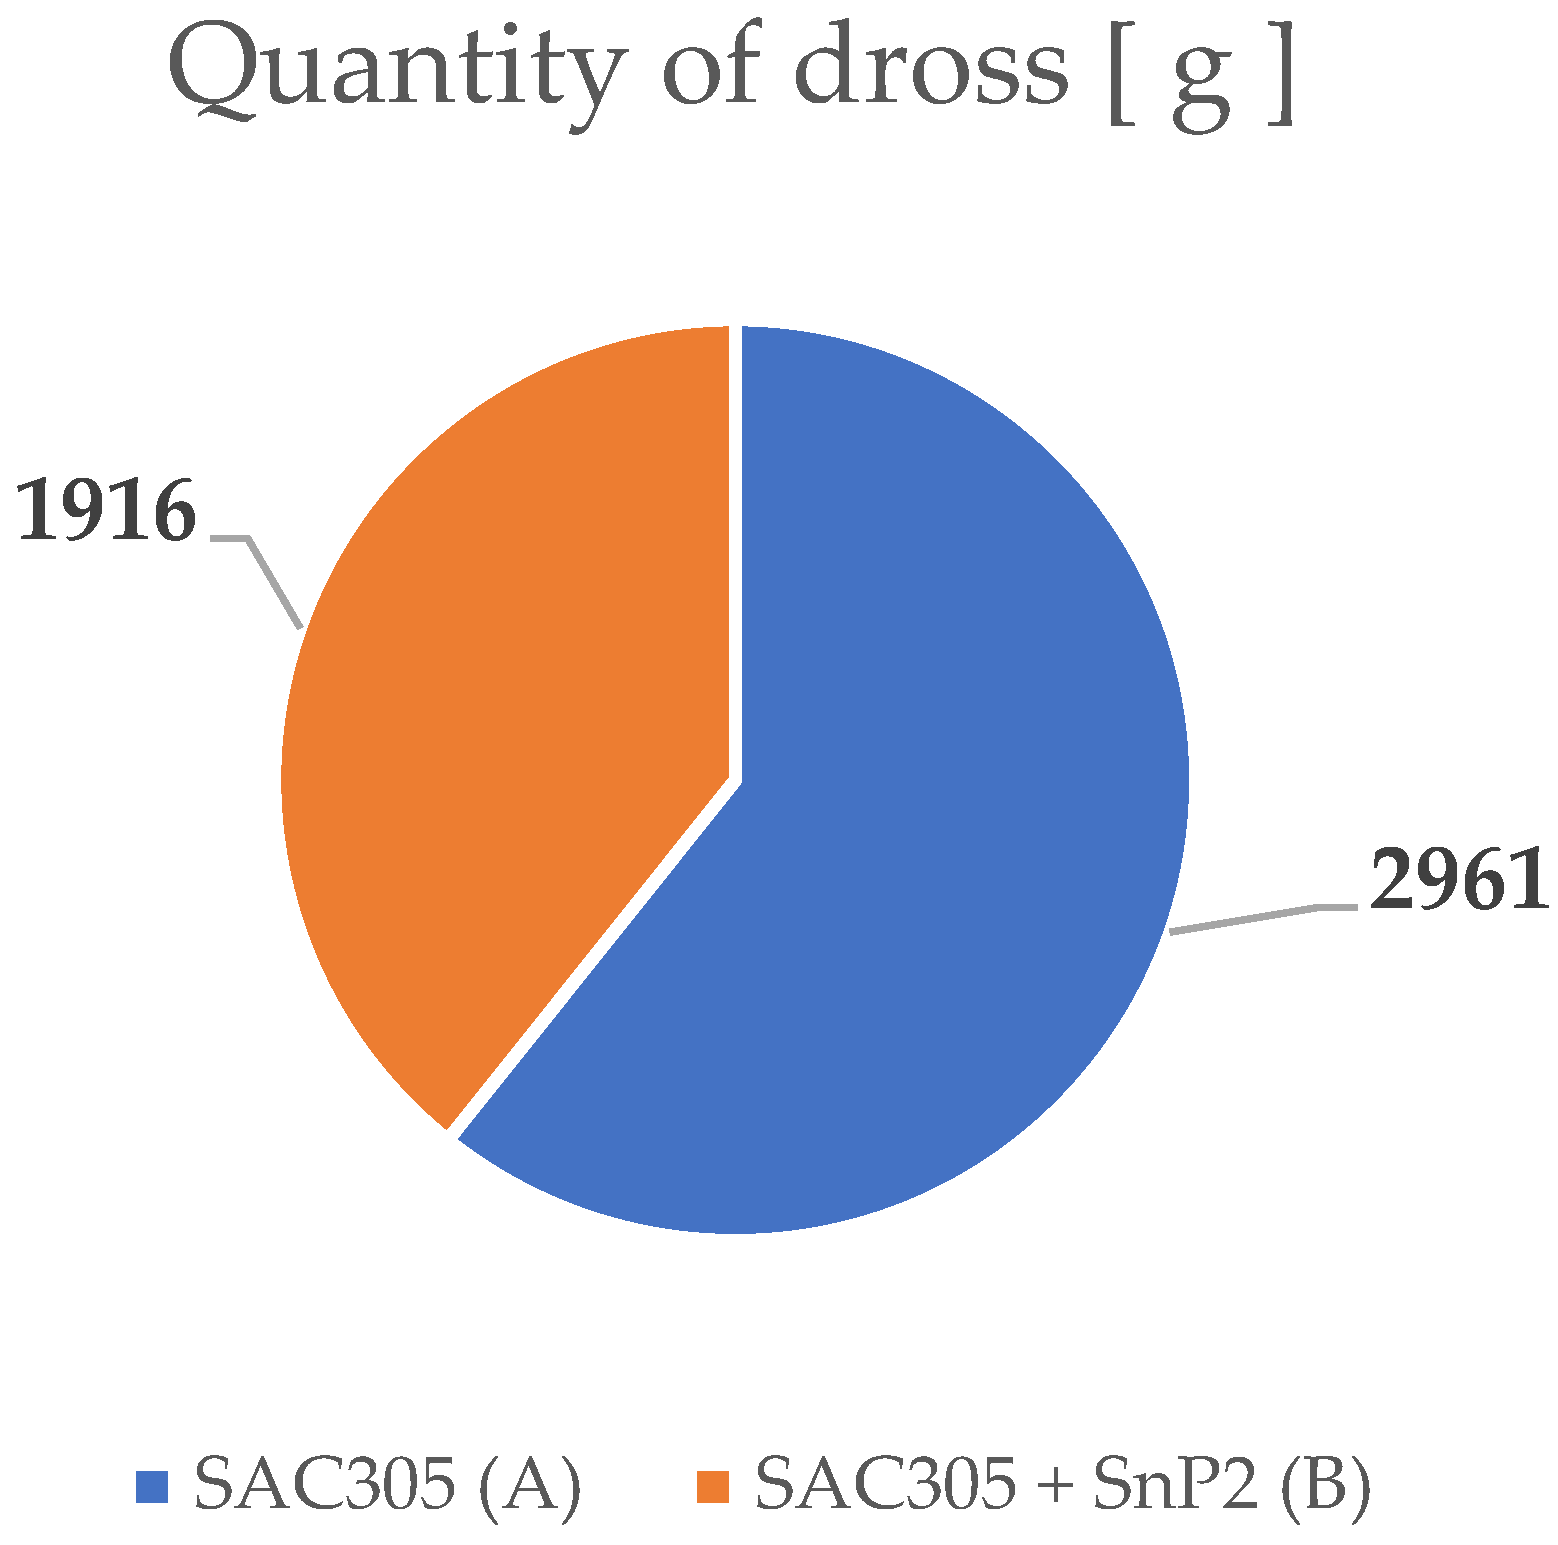
3.2. Chemical Analysis of Dross Amount Formed on the Solder Bath Surface

Two different samples were cast. During the cooling of the samples in the brass mould, there was a difference in the amount of oxides on their surface observed by the naked eye (Figure 12). The surface of the sample from the melt without the addition of phosphorus (Figure 12A) had a significantly higher amount of oxides in comparison with the surface of samples with the addition of phosphorus (Figure 12B). This significant difference is also visible in Figure 13. This visual difference refers to the ability of dross to be formed on the surface of both melts.
The cooling of the samples was followed by preparation for measuring the chemical composition using a digital optical emission spectrometer (Q4 TASMAN) with a CCD detector. Tolerances for the content range of individual elements were respected according to the J-STD-006C standard. The chemical composition of sample A can be seen in Table 4. In Table 5, where the measured chemical composition values for sample B are shown, the phosphorus content is 0.003%. At the beginning of melting, its content was higher (represented by 0.007% in the total batch volume). If we consider the properties of phosphorus at higher temperatures [16,17], it can be assumed that, under the influence of temperature and melting time, a certain amount was burned out.

4. Conclusions

In conclusion, based on the relevant obtained results, the melting process of Sn-P alloys must be performed in a clean and inert environment, due to the activity of constituent elements that can cause other undesirable chemical reactions and connections. The temperature and melting time have to be controlled and monitored continuously. During the melting, the temperature increased, and while the holding time of approx. 21 min at a constant temperature seemed sufficient to carry out a chemical reaction between tin and phosphorus, the difference in the percentage content of phosphorus in the cast sample was influenced by the temperature. However, the temperature of 850 °C was proved to be the most suitable for casting the SnP2 pre-alloy because, at this temperature, the highest percentage of red phosphorus was contained in tin. In the process of melting this pre-alloy, the temperature cannot be decreased below 850 °C before casting if the aim is to achieve the highest possible phosphorus content during melting.
The dross taken from each melt every hour was weighed and recorded. The weighing process and investigation led to results for dross from two solder baths: SAC305 (A) and SAC305 with the addition of phosphorus (B). They are shown in Figure 14. The quantity of dross, resulting from solder bath for B, is 35% lower than the resulting quantity of dross from solder bath A. The formation of oxidic phases is undesirable for the further use of these alloys in the form of solders. The addition of tin–phosphorus pre-alloy deoxidation is one option to reduce the formation of dross on the surface of the melt during the production of solder. It is important to mention that the advantage of phosphorus in solder is not only a reduction in the weight of the smelting by-product (dross) in the manufacture of solder. The Sn-P pre-alloy has a high use in wave soldering, where it is gradually added to the melt in small quantities, resulting in a significant reduction in the amount of oxides on the surface of the melt in the process of PCB board soldering.

Author Contributions

Conceptualization, J.K. and J.V.J.; methodology, J.K.; software, J.K.; validation, J.K., J.V.J. and J.V.; formal analysis, J.K.; investigation, J.K.; resources, J.K.; data curation, J.K.; writing—original draft preparation, J.K.; writing—review and editing, J.V.J. and J.V.; visualization, J.K.; supervision, J.V.; project administration, J.K.; funding acquisition, J.V.J. All authors have read and agreed to the published version of the manuscript.

Funding

This research received no external funding.

Institutional Review Board Statement

Not applicable.

Informed Consent Statement

Not applicable.

Data Availability Statement

The data presented in this study are available on request from the corresponding author. The data are not publicly available due to privacy.

Conflicts of Interest

The authors declare no conflicts of interest.

References

  1. Yan, J.; Xiao, W.; Wang, J.; Zhang, F.; Li, X.; He, H.; Wang, L. Effects of alloying elements on the interfacial segregation of bismuth in tin-based solders. Mater. Today Commun. 2023, 35, 105713. [Google Scholar] [CrossRef]
  2. Huang, W.S. Stannum; Metallurgical Industry Press: Beijing, China, 2000. [Google Scholar]
  3. Campbell, J. Complete Casting Handbook Metal Casting Processes, Metallurgy, Techniques and Design, 2nd ed.; Butterworth-Heinemann: Oxford, UK, 2015; ISBN 978-0-444-63509-9. [Google Scholar]
  4. Kurdyumov, A.V.; Belov, V.D.; Pikunov, M.V. Casting Production from Nonferrous Metal Alloys: Textbook; MISiS: Moscow, Russia, 2011. [Google Scholar]
  5. Smiryagin, A.P. Industrial Nonferrous Metals and Alloys; Ripol Klassik: Moscow Russia, 2013. [Google Scholar]
  6. He, S.; Nishikawa, H. Effect of substrate metallization on the impact strength of Sn-Ag-Cu solder bumps fabricated in a formic acid atmosphere. In Proceedings of the 2017 International Conference on Electronics Packaging (ICEP), Yamagata, Japan, 19–22 April 2017; pp. 381–385. [Google Scholar] [CrossRef]
  7. J-STD-006C; Requirements for Electronic Grade Solder Alloys and Fluxed and Non-Fluxed Solid Solders for Electronic Soldering Applications. Institute of Electrical and Electronics Engineers (IEEE): Piscataway, NJ, USA; Association Connecting Electronics Industries (IPC): Bannockburn, IL, USA, 2017.
  8. Chen, Y.; Huang, J.; Huang, Y.; Li, Q.; Zeng, H.; Tian, L.; Li, J.; Wang, S.; He, W.; Hong, Y. Microstructure evolution and growth kinetics of intermetallic compound in SAC305/Ag and SAC305/Cu solder joints during solid-state aging. J. Mater. Sci. Mater. Electron. 2024, 35, 297. [Google Scholar] [CrossRef]
  9. Diepstraten, G. Wave/Selective Soldering. In Lead-Free Soldering Process Development and Reliability; John Wiley & Sons, Inc.: Hoboken, NJ, USA, 2020. [Google Scholar] [CrossRef]
  10. Yang, M.; Ji, H.; Wang, S.; Ko, Y.-H.; Lee, C.-W.; Wu, J.; Li, M. Effects of Ag content on the interfacial reactions between liquid Sn–Ag–Cu solders and Cu substrates during soldering. J. Alloys Compd. 2016, 679, 18–25. [Google Scholar] [CrossRef]
  11. Sweatman, K.W.; Nishimura, T. The effects of phosphorus in lead-free solders. In Proceedings of the SMTA International, Rosemont, IL, USA, 27 September–1 October 2015. [Google Scholar]
  12. Vianco, P.T.; Hosking, F.M.; Rejent, J.A. Wettability Analysis of Tin-Based, Lead Free Solders; Sandia National Labs.: Albuquerque, NM, USA, 1992. [Google Scholar]
  13. Xian, A.P.; Gong, G.L. Oxidation Behavior of Molten Tin Doped with Phosphorus. J. Electron. Mater. 2007, 36, 1669–1678. [Google Scholar] [CrossRef]
  14. Wang, H.; Zhao, H.; Sekulic, D.P.; Qian, Y. A Comparative Study of Reactive Wetting of Lead and Lead-Free Solders on Cu and (Cu6Sn5/Cu3Sn)/Cu Substrates. J. Electron. Mater. 2008, 37, 1640–1647. [Google Scholar] [CrossRef]
  15. El-Daly, A.A.; Hammad, A.E. Enhancement of creep resistance and thermal behavior of eutectic Sn–Cu lead-free solder alloy by Ag and In-additions. Mater. Des. 2012, 40, 292–298. [Google Scholar] [CrossRef]
  16. Goh, Y.; Haseeb, A.S.M.A.; Faizul Mohd Sabri, M. Electrodeposition of lead-free solder alloys. Solder. Surf. Mt. Technol. 2013, 25, 76–90. [Google Scholar] [CrossRef]
  17. Abbott, A.P.; Alhaji, A.I.; Ryder, K.S.; Horne, M.; Rodopoulos, T. Electrodeposition of Copper-Tin Alloys Using Deep Eutectic Solvents. Trans. Inst. Met. Finish. 2016, 94, 104–113. [Google Scholar] [CrossRef]
Figure 1. Preparation of the Sn-P alloy batch ((A)red phosphorus, (B) red phosphorus with sand as interlayer and tin in the form of cut wire, (C) the rest of the tin, top layer in form of coal powder).
Applsci 14 08257 g001
Figure 2. Sn-P alloy after melting process.
Applsci 14 08257 g002
Figure 3. Digital optical emission spectrometer, Q4 TASMAN, with a CCD detector (A) and detail of the sample placed on the measuring table to be in contact with the spectrometer electrode (B).
Applsci 14 08257 g003
Figure 4. SnP2 alloy in waffle-shaped ingots.
Applsci 14 08257 g004
Figure 5. Brass mould for samples of melted solder alloy SAC305.
Applsci 14 08257 g005
Figure 6. The dependence of the casting temperature on the percentage of phosphorus content.
Applsci 14 08257 g006
Figure 7. Top of the sample designated as No. 4—chemical composition of the surface, measured by semi-quantitative method.
Applsci 14 08257 g007
Figure 8. Bottom of the sample designated as No. 4—chemical composition of the surface, measured by semi-quantitative method.
Applsci 14 08257 g008
Figure 9. Top of the sample designated as No. 4—chemical composition of the surface, measured by semi-quantitative method.
Applsci 14 08257 g009
Figure 10. Bottom of the sample designated as No. 4—chemical composition of the surface, measured by semi-quantitative method.
Applsci 14 08257 g010
Figure 11. Sand used as an interlayer in alloy melting—chemical composition of the surface, measured by semi-quantitative method.
Applsci 14 08257 g011
Figure 12. Visual differences between two samples: (A) without addition of phosphorus in the solder bath, (B) with addition of phosphorus in the solder bath.
Applsci 14 08257 g012
Figure 13. Visual differences between two samples: yellow tones of oxides on (A) sample surface, shine and glossy surface with significantly amount decrease of oxides on (B) sample surface.
Applsci 14 08257 g013
Figure 14. Quantity of dross from melts A (without the addition of Sn-P pre-alloy) and B (with the addition of Sn-P pre-alloy).
Applsci 14 08257 g014
Table 1. Chemical composition of SAC305 alloy according to standard J-STD-006C.
Chemical ElementContent in Alloy [%]Chemical ElementContent in Alloy [%]
SnbalanceAs0.03 max
Ag3.0 ± 0.2Ni0.01 max
Cu0.5 ± 0.1Bi0.10 max
Pb0.07 maxCd0.001 max
Sb0.10 maxAl0.001 max
Zn0.001 maxIn0.05 max
Fe0.02 max--
Table 2. Measured temperatures and time during melting of Sn-P alloy.
Sample No.Weight
of Tin [g]
Weight of P4 [g]TA
[°C]
tA
[min]
TB
[°C]
tB
[min]
1490.0310.095992160220
2490.129.987092271221
3490.0810.037462175021
4490.0210.018492185121
Table 3. Tin and phosphorus content of samples from 1 to 4 cast at different temperatures.
Sample No.Weight of Tin
[g]
Weight of P4 [g]Starting
Temperature
[°C]
Ø Casting Temperature
[°C]
Weight
Sn
[%]
Weight
P
[%]
1490.0310.09123600.599.930.07
2490.129.98121710.599.420.58
3490.0810.0312074899.100.90
4490.0210.0112085097.962.04
Table 4. Chemical composition of A sample—without addition of phosphorus in the solder bath.
Chemical ElementContent in Alloy [%]Chemical ElementContent in Alloy [%]
Sn96.39As0.01
Ag2.9Ni0.001
Cu0.6Bi0.02
Pb0.02Cd0.000
Sb0.05Al0.001
Zn0.001In0.02
Fe0.01P0.000
Table 5. Chemical composition of B sample—with addition of phosphorus in the solder bath.
Chemical ElementContent in Alloy [%]Chemical ElementContent in Alloy [%]
Sn96.42As0.002
Ag3.0Ni0.005
Cu0.4Bi0.004
Pb0.02Cd0.000
Sb0.1Al0.001
Zn0.001In0.02
Fe0.02P0.003
Disclaimer/Publisher’s Note: The statements, opinions and data contained in all publications are solely those of the individual author(s) and contributor(s) and not of MDPI and/or the editor(s). MDPI and/or the editor(s) disclaim responsibility for any injury to people or property resulting from any ideas, methods, instructions or products referred to in the content.

