Communication

Nano-CeO2 for the Photocatalytic Degradation of the Complexing Agent Citric Acid in Cu Chemical Mechanical Polishing

1
School of Electronic Information Engineering, Hebei University of Technology, Tianjin 300130, China
2
Innovation and Research Institute of Hebei University of Technology in Shijiazhuang, Shijiazhuang 050299, China
*
Author to whom correspondence should be addressed.
These authors contributed equally to this work.
Appl. Sci. 2024, 14(18), 8285; https://doi.org/10.3390/app14188285
Submission received: 7 August 2024 / Revised: 2 September 2024 / Accepted: 11 September 2024 / Published: 14 September 2024

Abstract

:
Cu interconnect chemical mechanical polishing (CMP) technology has been continuously evolving, leading to increasingly stringent post-CMP cleaning requirements. To address the environmental pollution caused by traditional post-CMP cleaning solutions, we have explored the use of photocatalytic processes to remove citric acid, which is a commonly used complexing agent for CMP. In this study, CeO2 abrasives, characterized by a hardness of 5.5, are extensively employed in CMP. Importantly, CeO2 also exhibits a suitable band structure with a band gap of 2.27 eV, enabling it to photocatalytically remove citric acid, a commonly used complexing agent in Cu CMP. Additionally, the integration of H2O2, an essential oxidant in Cu CMP, enhances the photocatalytic degradation efficiency. The research indicates that the removal rate of single-phase CeO2 was 1.78 mmol/g/h and the degradation efficiency increased by 40% with the addition of H2O2, attributed to the hydroxyl radicals generated from a Fenton-like reaction between H2O2 and CeO2. These findings highlight the potential of photocatalytic processes to improve organic contaminant removal in post-CMP cleaning, offering a more sustainable alternative to conventional practices.

1. Introduction

As the feature size of integrated circuits continues to shrink below 20 nm, copper (Cu) has long replaced aluminum (Al) as the new wiring material in interconnect technology. However, due to its challenges of being difficult to etch and prone to spreading, the Cu interconnection process cannot rely on traditional etching techniques [1]. To apply Cu as the interconnect material, IBM cleverly solved this problem by inventing the dual-damascene process [2]. Cu dual-damascene technology includes two main electrochemical steps. The first step is the electrochemical deposition (or electroplating) of Cu into trenches and vias, followed by chemical mechanical polishing or planarization (CMP) in the second step to remove the overburden Cu layer after deposition [3]. Therefore, CMP, as the only global planarization process required after each deposition, plays a critical role. CMP slurries include oxidizers, complexing agents, inhibitors, and abrasives. Amino acids such as glycine, and carboxylic acids such as citric acid (CA), are commonly used as complexing agents to achieve a high material removal rate (MRR) [4,5]. However, these organic complexing agents or corrosion inhibitors are difficult to remove from the wafer surface after CMP due to chemical adsorption and other interactions, making wafer cleaning particularly challenging. Incomplete removal of these residues can disrupt subsequent processes and negatively impact the final product’s performance [6]. The current popular post-CMP Cu cleaning process involves using highly alkaline cleaning agents with high pH to clean the polished Cu [7,8]. While these agents can remove polishing residues, the high pH of alkaline cleaning agents poses certain risks to the environment, equipment, and human health.
In the search for more environmentally friendly post-CMP cleaning methods with less impact on equipment and human health, photocatalytic processes have gained favor due to their eco-friendly, green, sustainable, energy-saving, easy-to-operate nature, broad spectrum of activity, and lack of secondary pollution [9]. In the field of the photocatalytic degradation of pollutants, Xueling, B. et al. investigated the formation of alkyl halides from the photodegradation of small-molecule carboxylic acids in the presence of chloride and Fe(III) [10]. Xiuling, Z. et al. used a dual-chamber microbial fuel cell to degrade citric acid [11]. Milica, P. et al. investigated the plasma-modified electrosynthesized cerium oxide catalyst for plasma and the photocatalytic degradation of RB 19 dye [12]. Natalia, Q. et al. achieved the photocatalytic degradation of relatively high concentrations of citric acid by adding H2O2, Fe(III), or both to TiO2 and observed a significant enhancement in the degradation rate [13]. Costa-Silva, M. et al. conducted a study investigating the photocatalytic performance of Ce–Ni co-doped ZnO nanodisk-like self-assembled structures synthesized via the sol-gel method for the degradation of methylene blue (MB) dye under UV irradiation [14]. The photocatalytic reaction process mainly consists of four steps: photoexcitation, carrier migration, carrier separation, and redox reactions. The core of the surface reaction is the redox reaction induced by photogenerated carriers [15].
To minimize the environmental, equipment, and human impact of post-CMP cleaning processes, this study explores the use of CeO2 abrasives with suitable band structure and tribological properties, combined with the commonly used oxidant H2O2 in CMP, as photocatalytic accelerators to degrade the citric acid complexing agents remaining on the Cu surface after CMP [16]. This approach leverages clean energy in the form of solar power to drive the post-CMP cleaning process. By testing the degradation efficiency of citric acid under illumination, the optimal concentration and degradation rate were identified, validating the feasibility of using photocatalysis for post-CMP cleaning. In terms of reaction mechanisms, the morphology and band structure of cerium oxide were characterized, revealing a large specific surface area and numerous active sites. Additionally, the optical properties of the CeO2 and the CeO2 with H2O2 added were characterized. Short-wavelength visible and ultraviolet light were found to be absorbed by cerium oxide and the hydroxyl radicals generated upon the addition of hydrogen peroxide enhanced the photocatalytic reaction, demonstrating the feasibility of photocatalytic degradation. The impedance, erosion current, erosion voltage of surface oxides, and concentration of Cu(II) in the solution during the degradation process were presented, further elucidating the photocatalytic degradation mechanism. This study confirms the feasibility of using photocatalytic processes to clean copper deposition layers and presents a cleaning design strategy that employs semiconductor materials as photocatalysts and hydrogen peroxide as a photocatalytic accelerator for the in situ degradation of complexing agents.

2. Materials and Methods

2.1. Chemical Reagents

Chemical agents utilized encompass: CeO2 (99.95% purity, supplied by Shanghai Aladdin Biochemical Technology Co., Ltd., Shanghai, China), citric acid (99.95% purity, supplied by Shanghai Aladdin Biochemical Technology Co., Ltd., Shanghai, China), H2O2 (supplied by Tianjin Fengchuan chemical reagent Technology Co., Ltd., Tianjin, China).

2.2. Characterization of CeO2

X-ray diffraction (XRD) patterns were recorded on an X-Pert diffractometer (Bruker AXS, Billerica, MA, USA, D8 Discover). The morphologies were characterized by field-emission scanning electron microscopy (SEM) (Zeiss, Jena, Germany, Sigma 500). Transmission electron microscopy (TEM) and high-resolution transmission electron microscope (HRTEM) images were acquired on an FEI Talos F200S microscope (Thermo Fisher Scientific, Waltham, MA, USA, Talos F200S). The diffuse reflection spectra were measured by ultraviolet–visible (UV–Vis) spectrophotometer (PerkinElmer, Waltham, MA, USA, Lambda 1050+) from 250 to 800 nm. The photoluminescence (PL) spectra properties of materials were investigated by PL spectra (Horiba Fluorolog-3) with an excitation light wavelength of 350 nm.

2.3. Characterization of CeO2 Photocatalytic Degradation

Under UV irradiation (BXU 034 photochemical reactor, Guangzhou Xingchuang Electronics, Guangzhou, China), the efficiency of the photocatalytic degradation of citric acid using cerium oxide in synergy with hydrogen peroxide was investigated. The sample with added H2O2 in the CeO2 dispersion is labeled as H-CeO2. Initially, the degradation rate of citric acid at different concentrations of cerium oxide was explored. A predetermined amount of cerium oxide was dispersed in a citric acid solution (2 g/L, 500 mL) and sonicated for 1 min using an ultrasonic cleaner (Beijing Oksultrasonic Group Co., Ltd, Beijing, China, F009SD) to ensure thorough dispersion. The solution was then magnetically stirred in the dark for a certain period before activating the UV lamp as a light source. At predetermined intervals, 3 mL of the solution was sampled and its absorbance at 430 nm was measured using a visible spectrophotometer (722N, Shanghai Precision & Scientific Instrument Co., Ltd., Shanghai, China) to determine the citric acid concentration. After identifying the citric acid concentration with the highest degradation efficiency, two control experiments were conducted to further investigate the degradation mechanism. In the dark control experiment, the citric acid concentration with the highest degradation efficiency was selected as the predetermined concentration. Citric acid was added and the prepared solution was magnetically stirred in a dark environment for one hour, followed by measuring the absorbance of citric acid. In the hydrogen peroxide control experiment, the solution was prepared according to the aforementioned steps, subjected to UV irradiation for one hour while being magnetically stirred, and the absorbance of citric acid was measured. Subsequently, the solution was prepared again following the same steps, and 1 mL of hydrogen peroxide was added to the solution. The subsequent irradiation and measurement procedures were conducted as described above.

2.4. Electrochemical Measurements

All electrochemical tests were performed using the CHI660E electrochemical workstation of Shanghai Chenhua Instrument Co., Ltd. (Shanghai, China). The corrosion properties of Cu in a specified solution were studied. Open potential (OCP), dynamic potential polarization (Tafel diagram), and electrochemical impedance spectroscopy (EIS) data were collected in a three-electrode system in which Cu was the working electrode, standard calomel electrode (SCE) was the reference electrode, and platinum was the reverse electrode. Before each test, the Cu electrode was sealed with electrical tape, exposing an active area of 1 square centimeter. Before each electrochemical measurement, we conducted rough polishing with 1500# silicon carbide sandpaper, then fine polishing with 2500# silicon carbide sandpaper, until the Cu surface was mirrorlike. The purpose was to remove the oxide on the electrode surface and expose the fresh Cu surface. We then rinsed with deionized water and dried with compressed air. OCP stabilized for approximately 600 s to ensure reliable and consistent potential readings. In the OCP ± 0.3 V voltage range the scanning rate was 5 mV/s, and the potentiodynamic polarization was measured. EIS was performed under OCP with a frequency range of 0.01 Hz to 1000 kHz and a 5 mV AC signal was applied. The EIS data was analyzed and modeled by Zview 3.1 software.

2.5. Copper Ion Concentration Testing

The concentration of Cu ions in the solution was measured using a Thermo Scientific ICP-MS (Saint Louis, MO, USA). An 800 mL solution containing 0.2 g/L cerium oxide (CeO2), 0.2 g/L citric acid, and 1 mL hydrogen peroxide (H2O2) was prepared. The solution was subjected to ultrasonic dispersion treatment and then exposed to UV light. At fixed intervals, the UV irradiation was stopped, and a beaker containing the solution was removed. A polished Cu sheet was immersed in the solution for a predetermined time. The solution was then sampled and the Cu sheet was removed, rinsed with deionized water, and repolished to expose a fresh Cu surface for subsequent immersions.

3. Results and Discussion

3.1. CeO2 Morphologies and Crystal Structures

XRD and the crystal model of CeO2 revealed the crystal structure of CeO2 used as a catalyst in both polishing slurry and photocatalysis. As shown in Figure 1a, the diffraction peaks of CeO2 are sharp and intense, indicating its high crystallinity. No impurity peaks were detected within the resolution range of the equipment, confirming the high purity. The main diffraction peaks at 28.60°, 33.04°, 47.55°, 56.26°, 59.12°, 69.41°, 76.78°, 79.16°, and 88.49° correspond well to the (1 1 1), (2 0 0), (2 2 0), (3 1 1), (2 2 2), (4 0 0), (3 3 1), (4 2 0), and (4 2 2) planes of the cubic fluorite structure of CeO2 (JCPDS Card 43–1002), respectively. The cubic fluorite structure of CeO2 belongs to the Fm-3m space group, as shown in Figure 1b [17]. After the addition of hydrogen peroxide, it can be observed from the figure that there was almost no change in the XRD pattern of H-CeO2 powder, indicating that the lattice structure and crystalline phase of the CeO2 material remain unchanged.
TEM and SEM characterized the internal lattice and external morphological structures of the nano-CeO2. As shown in Figure 1c, the SEM image displays the nano-CeO2 as predominantly spherical with a rough surface. The size distribution shown in Figure 1d indicates that the nano-material has a wide size distribution consisting of polydisperse nano-CeO2 particles. The catalytic performance of a catalyst is largely influenced by its surface area and the number of catalytically active sites available. The small size and the extensive surface area of nanoparticles facilitate rapid charge transfer between the catalyst and redox couples, leading to enhanced catalytic activity [18]. The approximately spherical nature of the nano-CeO2 material increases the number of reactive sites and facilitates charge transfer between the catalyst and redox molecules, achieving high catalytic activity [19].
The size characteristics of nano-CeO2 are also clearly demonstrated in TEM images (Figure 1e–g) showing the particle-like, nearly spherical distribution consistent with the SEM results. Additionally, the lattice fringe of CeO2 is 0.314 nm, which matches well with the (111) peak at around 28.60° in XRD.

3.2. The Optical Characteristics of the Photocatalysts

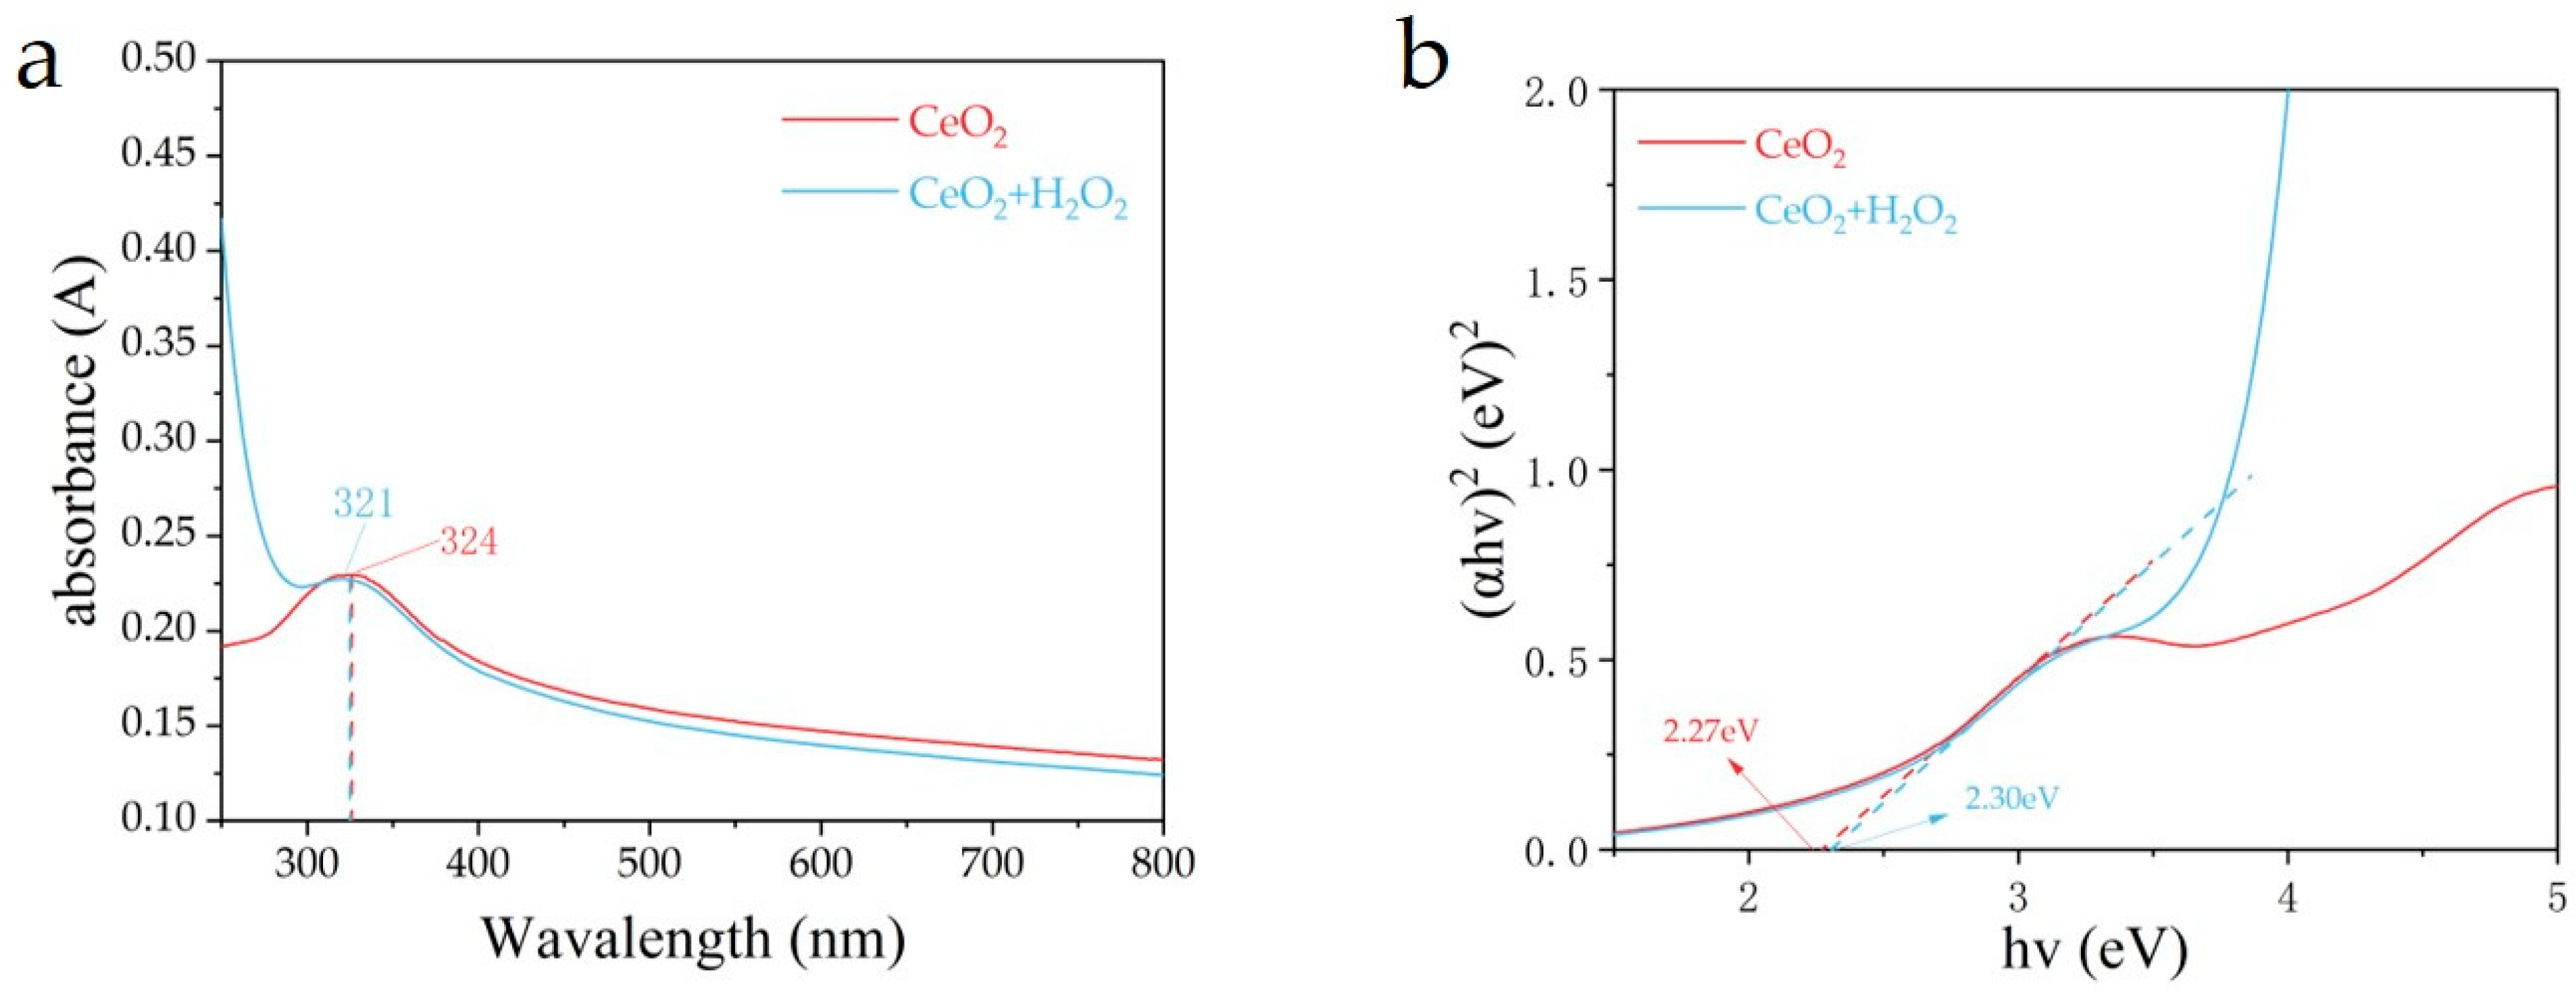
H2O2 plays an indispensable role in CMP, as it is essential for the formation of complexes through the reaction of Cu(II) with the complexing agent. Therefore, the optical absorption characteristics of CeO2 and H-CeO2 were characterized using UV–Vis absorption spectroscopy. As shown in Figure 2a, CeO2 exhibits an absorption edge at 547 nm. The charge-transfer transition peak observed at 324 nm is due to the charge transfer between the fully occupied 2p (O) orbital and the empty 4f (Ce) orbital [20,21]. After the addition of hydrogen peroxide, a blue shift in the absorption peak is observed. This is attributed to the Fenton-like reaction between CeO2 and H2O2:
C e 3 + + H 2 O 2 + H + C e 4 + + O H · + H 2 O
The oxidation of C e 3 + to C e 4 + results in a reduction in the concentration of C e 3 + , which is typically associated with a high number of oxygen vacancies in CeO2. As the amount of C e 3 + decreases, these oxygen vacancies also diminish, lattice defects are filled, and crystallinity increases [22,23]. UV spectra show that the absorption ranges of both CeO2 and H-CeO2 are primarily between 250 and 500 nm, covering most of the ultraviolet and visible regions including violet, blue, and part of the cyan regions. Additionally, the optical band gap energy was determined based on the Kubelka–Munk function using the Tauc plot equation (as shown in Equation (2)) [24]:
( a h v ) 1 / n = A ( h v E g )
where α is the absorption coefficient, h is Planck’s constant, υ is the photon frequency, A is a proportionality constant, n = 1/2 for the direct bandgap, and n = 2 for the indirect bandgap. The optical bandgaps of the two materials are shown in Figure 2b. The optical bandgap of pure CeO2 was 2.27 eV, while the optical bandgap increased to 2.30 eV with the addition of hydrogen peroxide. After the Fenton-like reaction, a significant amount of hydroxyl radicals is generated, which, in conjunction with CeO2, greatly enhances the material’s oxidative capability [25]. A 365 nm wavelength light source was chosen for photocatalytic reactions using both CeO2 and H-CeO2.
PL spectroscopy was employed to investigate the recombination efficiency of electron-hole pairs and the photocatalytic activity of the catalyst. Figure 3a shows the PL spectrum of CeO2 with an excitation wavelength of 350 nm. A peak is observed around 460 nm, which is attributed to the charge transition from the 4f band to the CeO2 valence band, causing the blue emission peak [26]. Upon adding H2O2, a significant reduction in the PL emission peak is observed. PL spectroscopy is also a method to measure the lifetime of photogenerated carriers in semiconductors; therefore, we used time-resolved fluorescence spectroscopy to calculate the fluorescence lifetime of CeO2, as shown in Figure 3b. The average fluorescence lifetime is obtained using Equation (3).
τ a v e r a g e   = A i × τ i 2 / A i × τ i
The average fluorescence lifetime of CeO2 is 0.0218 ns, and it increases to 0.043 ns after the addition of hydrogen peroxide. The decrease in PL peak intensity and the increase in fluorescence lifetime after adding H2O2 can be attributed to the filling of the material’s oxygen vacancies. The lattice defects are reduced, which reduces surface defects and enhances carrier mobility, thereby reducing the recombination rate of photogenerated carriers [27]. A lower PL emission intensity and longer average fluorescence lifetime indicate a slower recombination trend of photogenerated electron-hole pairs, suggesting that the recombination is suppressed and the photocatalytic activity is improved [24,28,29].

3.3. Performance of CeO2 in the Photocatalytic Degradation of Citric Acid

To verify the feasibility of CeO2 in degrading citric acid under ultraviolet light exposure, photocatalytic tests were conducted. The UV spectrum peak of citric acid is primarily concentrated around 430 nm [30]. Therefore, we used a visible spectrophotometer to measure the UV spectrum of citric acid at 430 nm and calculated the concentration of citric acid using the Beer–Lambert law (Equation (4)). The Beer–Lambert law has certain limitations, and the calculated error is relatively accurate only in dilute solutions [31]. Thus, a dilute solution of citric acid was used to simulate the residual citric acid after polishing.
l o g I 0 I A = ε c l
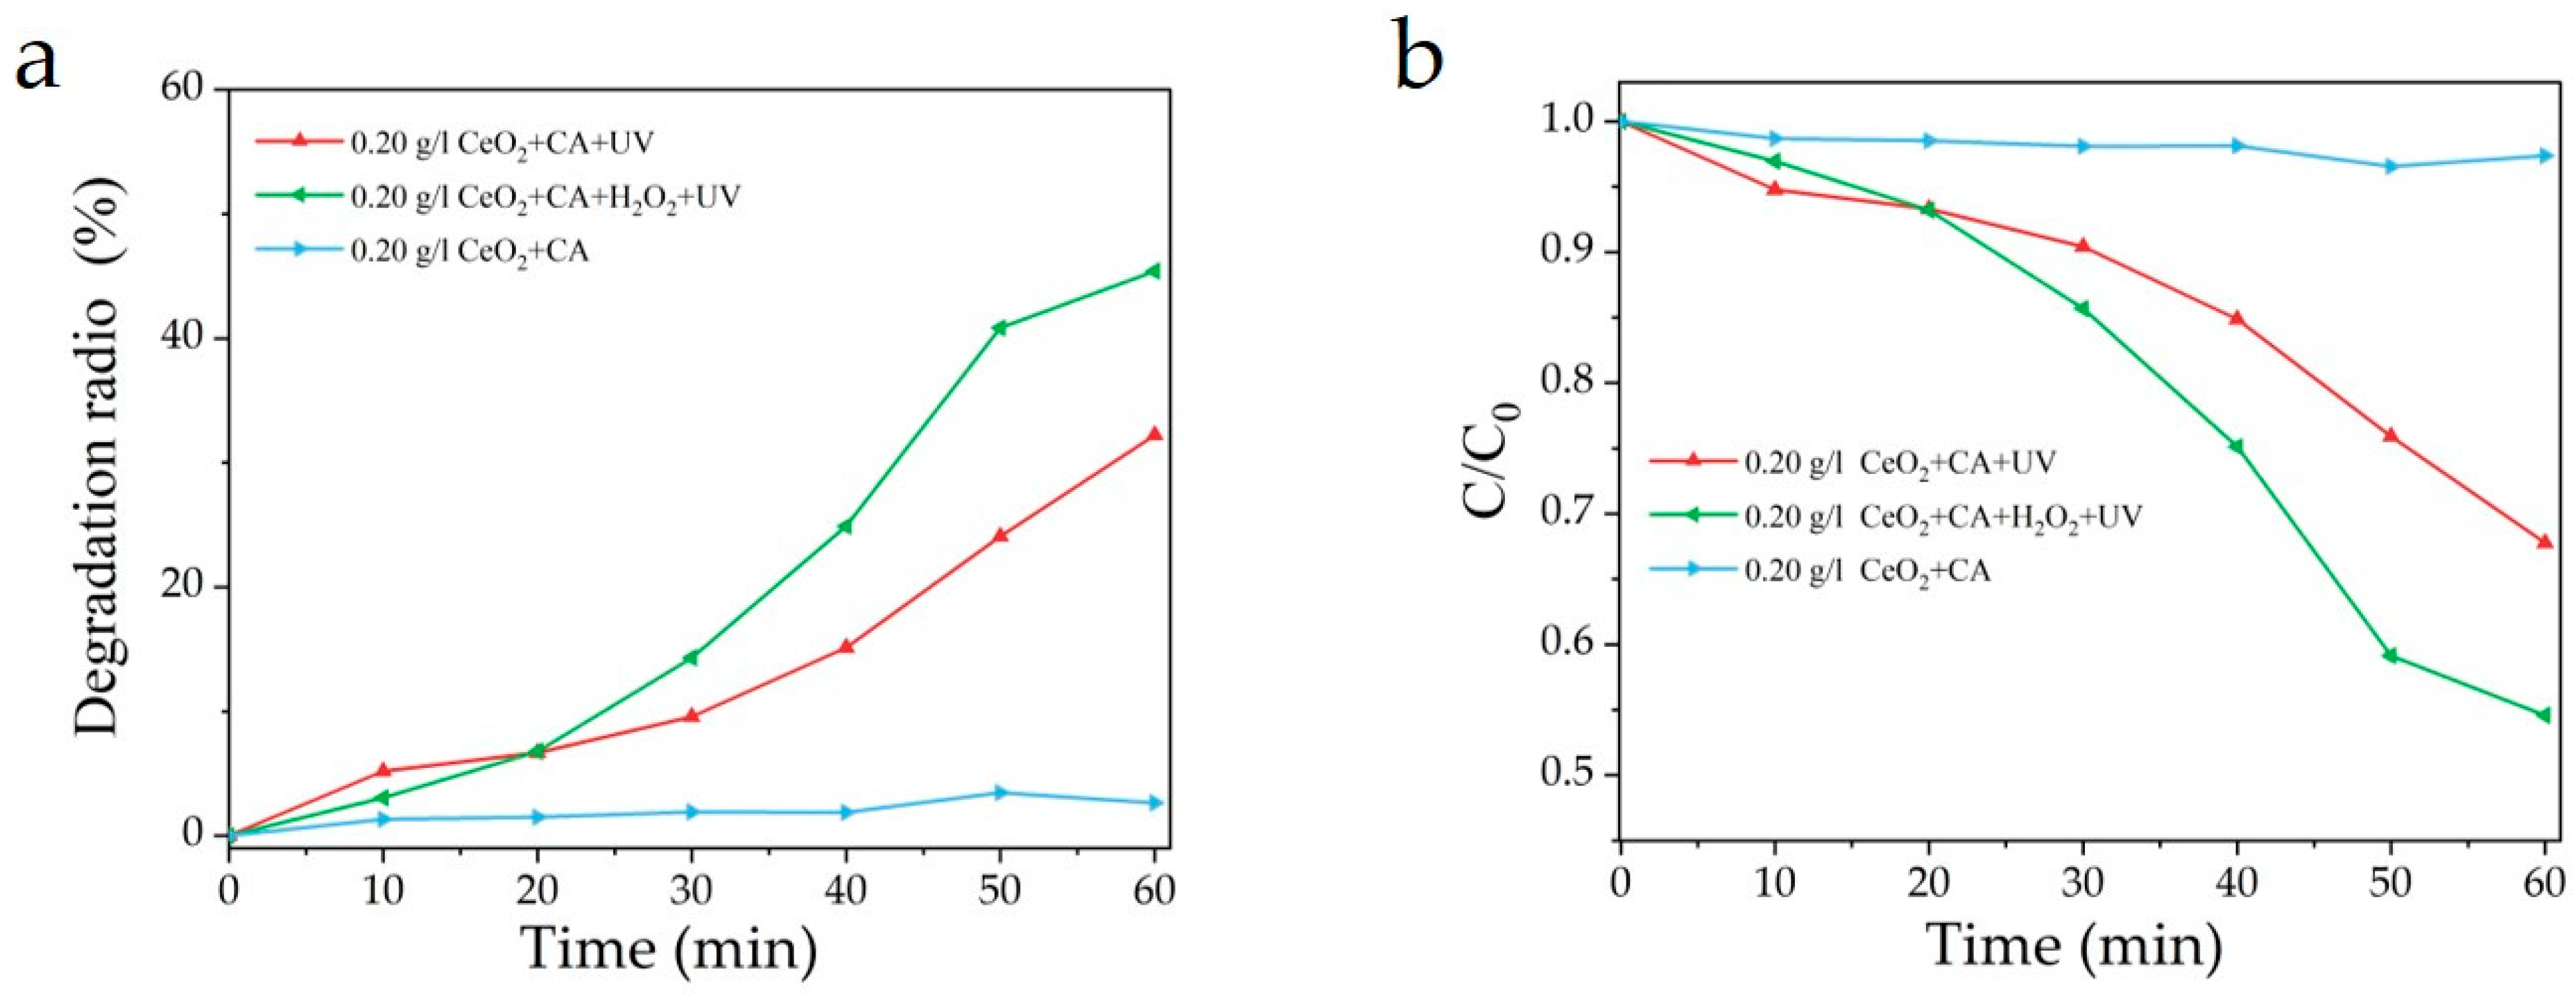
I 0 and I represent the intensities of the incident light and the transmitted light, respectively. l is the path length of the absorbing solution and c is the concentration. l o g 10 ( I 0 / I ) is the absorbance or optical density and ε is known as the molar extinction coefficient. As shown in Figure 4a,b, after 30 min in a dark environment, the concentration of citric acid decreased due to physical adsorption by the cerium oxide material; however, the reduction was minimal.
Various concentrations of CeO2 (0.1 g/L, 0.15 g/L, 0.2 g/L, 0.25 g/L, and 0.3 g/L) were added under UV irradiation to degrade a 0.2 g/L citric acid solution. The degradation efficiency of citric acid is shown in Figure 4a,b. The degradation rate D of citric acid was obtained using Equation (5), where c is the concentration of citric acid at the current time and c 30 represents the concentration of citric acid 30 min before the start of irradiation.
D = ( 1 c c 30 ) × 100 %
It can be observed that without the addition of H2O2, the removal rate of citric acid shows a parabolic distribution as the concentration of CeO2 increases. At a CeO2 concentration of 0.2 g/L, the degradation rate reaches its maximum of 33.58% after 60 min. The kinetic curves of citric acid are shown in Figure 4c, presenting a linear relationship between ln( c 0 / c ) and time ( t ), where c 0 represents the concentration of citric acid just before the start of irradiation. These curves indicate that the degradation of citric acid follows the Langmuir–Hinshelwood pseudo-first-order kinetics (as shown in Equation (6)).
l n ( c 0 / c ) = k t
k is the reaction rate constant obtained from the slope of the l n ( c 0 / c ) = k t curve. As shown in Figure 4d, the k value is highest at a CeO2 concentration of 0.2 g/L, reaching 0.00609, which is twice the k value at a CeO2 concentration of 0.1 g/L.
From the experimental results mentioned above, it can be seen that the adsorption of citric acid by cerium oxide is relatively weak. To rigorously verify the photocatalytic role of CeO2, we also conducted adsorption and degradation experiments of citric acid with CeO2 in the dark. The results, shown in Figure 5a,b, indicate that CeO2 does not degrade citric acid in the dark. The observed reduction in citric acid concentration is attributed to the adsorption of citric acid onto CeO2. However, since the adsorption is weak, it does not significantly affect the degradation process. Therefore, the adsorption of citric acid by CeO2 can be considered negligible.
Thus, in subsequent experiments, the impact of adsorption was no longer considered. After determining the optimal CeO2 concentration for the fastest citric acid degradation, we added H2O2 to the solution. This addition reflects the chemical environment of actual Cu CMP slurry, which requires an oxidant, complexing agent, inhibitor, and pH adjusters in its composition. In CMP, inhibitors typically comprise surfactants, which are relatively easy to remove, and pH adjusters are highly soluble in water. Thus, the solution included abrasives, oxidants, and complexing agents to simulate the real CMP slurry environment. After thorough stirring, UV irradiation was performed. As shown in Figure 5a,b, the addition of H2O2 significantly enhanced the degradation efficiency to 45.41%, which is a 40% improvement as compared to the degradation efficiency without H2O2.
The degradation rate D of citric acid is calculated using Equation (7), where c is the concentration of citric acid at the current time and c 0 is the concentration of citric acid before the start of irradiation.
D = ( 1 c c 0 ) × 100 %

3.4. Corrosion Behavior of Cu Wafer under Photocatalysis

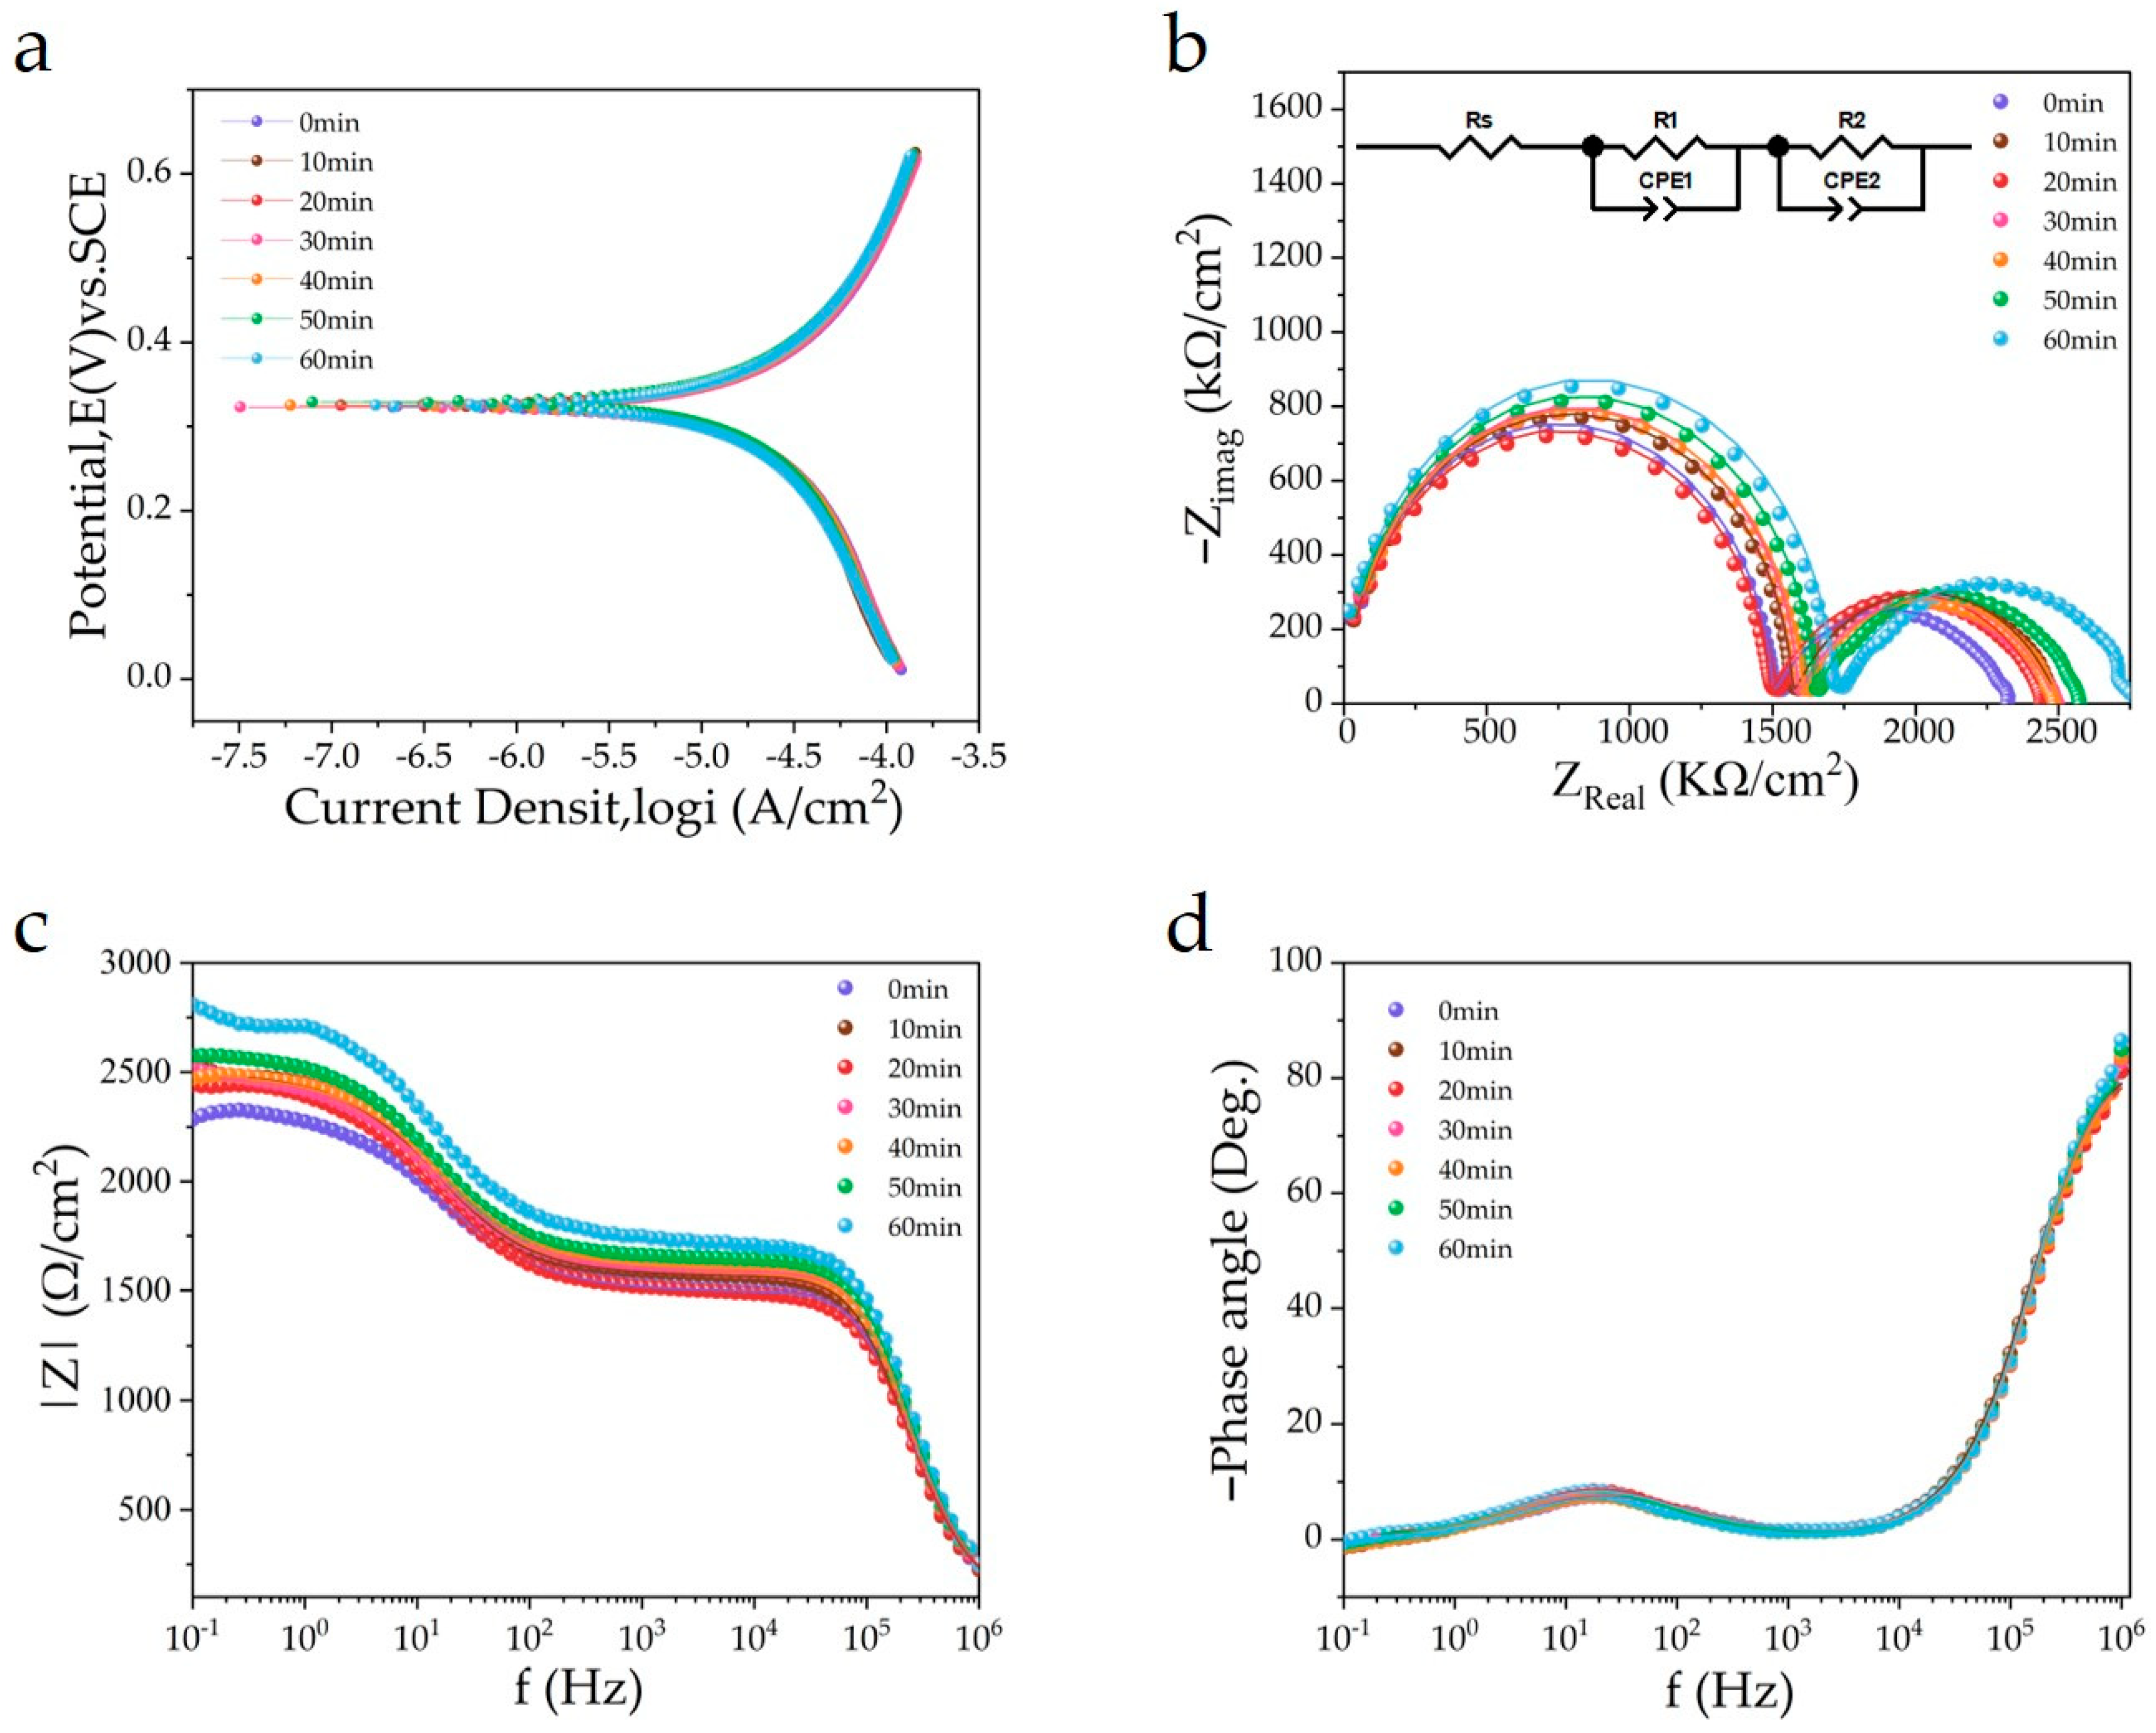
Figure 6a displays the Tafel plots of the solutions containing citric acid, CeO2, and H2O2, using a polished Cu electrode as the working electrode, after different light irradiation times. The corrosion potential (Ecorr) and corrosion current density (Icorr) data calculated from the Tafel plots are summarized in Table 1. The Ecorr value indicates the ease with which a material dissolves in the electrolyte, reflecting the difficulty of the chemical reaction between the sample and the electrolyte. The Icorr value represents the corrosion rate of the material in the electrolyte. Generally, a lower corrosion potential (Ecorr) signifies a stronger chemical reaction between the solution and the electrode, while a higher corrosion current (Icorr) indicates a faster rate of interfacial chemical reactions between the electrode and the electrolyte [32]. As observed from Figure 6a and Table 1, with increasing light irradiation time, the corrosion current gradually decreases, while the corrosion potential shows an increasing trend. This suggests that the citric acid in the solution is being progressively degraded, leading to a reduction in the corrosive capability of the solution. This finding is consistent with the results obtained from UV spectroscopy measurements.
The CMP process for Cu can be described as comprising two removal components: a mechanical component involving surface abrasion and a chemical component involving the generation of an oxidized layer and the formation of Cu(II) species, leading to the dissolution of the abraded material [33]. In practical polishing, complexing agents such as citric acid are used to achieve partial polishing by forming Cu(II) complexes that remove the oxidized layer from the Cu surface. The thickness of the oxidized layer on the Cu surface is characterized using EIS. The capacitors ( Q 1 and Q 2 ) are designed as constant phase elements (CPE). For actual electrochemical reactions, the impedance response of the electrode is rarely ideal, and therefore, it is commonly represented as a CPE element in the equivalent circuit [34]. All impedance data were fitted using the equivalent circuit shown in the upper left corner of Figure 6b R S ( R 1 C 1 ) ( R 2 C 2 ) . Figure 6b–d show the Nyquist and Bode plots of the Cu electrode in the solution after different irradiation times. The spherical symbols and solid lines represent the original experimental data and the ZVIEW fitting curves, respectively. The experimental results exhibit a double semicircle pattern with frequency increasing in the counterclockwise direction. The magnitude of the impedance values can be expressed as:
Z = a 2 + b 2 = a 2 + ( 1 2 π c f ) 2
where Z is the impedance, a is the real part of the impedance, b is the imaginary part of the impedance, c is the nominal capacitance, and f is the frequency. a and c can be roughly referred to as the resistance and capacitance of the metal surface oxidized layer, respectively [4]. From the formula, it can be observed that the impedance of the Cu surface oxidized layer is related to the resistance a and capacitance c, and the capacitance of the oxidized layer can be defined as [35]:
C = ε 0 ε r A d
where C denotes the capacitance, ε r is the dielectric constant of the oxidized layer, ε 0 is the dielectric constant of free space, A represents the surface area of the oxidized layer, and d is the thickness of the oxidized layer. According to this formula, the magnitude of the impedance |Z| increases with the thickening of the oxidized layer and decreases with its thinning.
Following illumination, the radius of the curves in the Nyquist plots notably increases, signifying that UV-irradiated electrolytes result in higher impedance within the electrochemical system. This implies that as the illumination time progresses, the erosion of the Cu electrode’s oxidized layer by the solution diminishes. From the impedance perspective, this indicates a reduction in ion generation from citric acid corrosion after each ten-minute interval of illumination. This observation suggests a decrease in citric acid concentration and confirms the synergistic effect of C e O 2 and H 2 O 2 in degrading citric acid.

3.5. Photocatalytic Cleaning Process

Based on the above results, we propose a potential mechanism for cleaning the Cu surface layer after CMP using photocatalysis, as illustrated in Figure 7. During Cu CMP, citric acid, commonly used as a complexing agent, reacts with the Cu surface oxide layer to form some residual complexes that remain on the Cu substrate. These residual citric acid complexes are difficult to remove due to chemical adsorption [36,37]. When the polished Cu substrate is placed into the polishing solution under UV illumination, cerium oxide, due to its suitable band gap, is driven by UV photons, resulting in the excitation of electrons to the conduction band (CB) while holes remain in the valence band (VB), as indicated in Equation (10). The h+ accumulated in the VB of CeO2 can oxidize citric acid contaminants [38]. Additionally, reactive oxygen species (ROS) generated through photo-induced CB electrons or VB holes (as shown in Equations (11)–(15)) also contribute to the degradation of the contaminants [39].
C e O 2 + h v C e O 2 ( e C B + h V B + )
C e O 2 h V B + + H 2 O C e O 2 + H + + O H ·
C e O 2 h V B + + O H C e O 2 + O H ·
C e O 2 e C B + O 2 C e O 2 + O 2 ·
O 2 · + H + H O 2 ·
2 H O 2 · 2 H 2 O 2 + O 2
Simultaneously, a Fenton-like reaction between cerium oxide and hydrogen peroxide generates a substantial amount of hydroxyl radicals, significantly enhancing the oxidizing ability of the photocatalyst. Under the synergistic catalysis of cerium oxide and hydroxyl radicals, citric acid is effectively degraded.
By adding the Cu substrate to the polishing solution and measuring the Cu(II) concentration in the solution under continuous UV illumination using ICP, it was observed that over time, the concentration of Cu(II) in the solution gradually increased due to citric acid corrosion. However, the rate of increase in Cu(II) every ten minutes decreased, which indirectly indicates that the degradation of a significant amount of citric acid by the photocatalyst led to a reduction in the corrosion reaction.

4. Conclusions

In summary, this study investigates the feasibility of using a photocatalytic process for post-CMP cleaning of Cu deposition layers by employing CeO2 in conjunction with H2O2 to photocatalytically degrade citric acid adhered to Cu surfaces. Various instruments were utilized to characterize the photocatalytic materials, examining their microscopic morphology and optical properties. XRD, TEM, and SEM analyses confirmed that CeO2 nanoparticles possess numerous oxygen vacancies that serve as capture sites, enhancing the separation efficiency of photogenerated charge carriers, reducing bandgap energy, and increasing visible light absorption capability. UV–Vis results indicated that the addition of hydrogen peroxide to CeO2 led to a blue shift in the absorption edge as compared to pure CeO2, resulting in an increased optical bandgap and enhanced redox capability. PL spectra revealed that the PL peak intensity of H-CeO2 was lower and its fluorescence lifetime was longer, indicating enhanced photocatalytic degradation capability of CeO2 due to hydrogen peroxide addition. The concentration of citric acid was calculated from UV spectra obtained via visible spectrometry, revealing that the fastest degradation rate with cerium oxide alone was 1.78 mmol/g/h, and the degradation efficiency increased by a significant 41% upon adding hydrogen peroxide. Lastly, ICP and electrochemical experiments illustrated the corrosion of Cu by citric acid in the solution and the gradual reduction of corrosion due to photocatalytic degradation, proving the feasibility of using a photocatalytic process for post-CMP cleaning of Cu deposition layers. This study offers a novel strategy for in situ degradation of complexing agents by employing semiconductor abrasives that also function as photocatalysts.

Author Contributions

Y.L., investigation, characterization, and writing—original draft; Z.L. (Zongmao Lu), investigation, visualization; J.W., investigation; J.L., methodology; Z.L. (Ziyang Li), methodology; C.Z., methodology; Y.Q., supervision and writing—review and editing. All authors have read and agreed to the published version of the manuscript.

Funding

This work was financially supported by the Science and Technology Cooperation Special Project of Shijiazhuang (SJZZXB23003) and the National Natural Science Foundation of Hebei province (F2020202067).

Institutional Review Board Statement

Not applicable.

Informed Consent Statement

Not applicable.

Data Availability Statement

The original contributions presented in the study are included in the article, and further inquiries can be directed to the corresponding author.

Conflicts of Interest

The authors declare no conflicts of interest.

References

  1. Chen, Y.; Xu, M.; Wen, J.; Wan, Y.; Zhao, Q.; Cao, X.; Ding, Y.; Wang, Z.; Li, H.; Bian, Z. Selective recovery of precious metals through photocatalysis. Nat. Sustain. 2021, 4, 618–626. [Google Scholar] [CrossRef]
  2. Yan, H.; Niu, X.; Qu, M.; Luo, F.; Zhan, N.; Liu, J.; Zou, Y. A review: Research progress of chemical-mechanical polishing slurry for copper interconnection of integrated circuits. Int. J. Adv. Manuf. Technol. 2023, 125, 47–71. [Google Scholar] [CrossRef]
  3. Ein-Eli, Y.; Starosvetsky, D. Review on copper chemical-mechanical polishing (CMP) and post-CMP cleaning in ultra large system integrated (ULSI)—An electrochemical perspective. Electrochim. Acta 2007, 52, 1825–1838. [Google Scholar] [CrossRef]
  4. Hu, L.; Pan, G.; Chen, Q.; Li, L.; Ma, Y.; Zhang, Y. Experimental and computational investigation of complexing agents on copper dissolution for chemical mechanical polishing process. Colloids Surf. A-Physicochem. Eng. Asp. 2023, 664, 131142. [Google Scholar] [CrossRef]
  5. Ma, B.; Jiang, Y.; Tan, B.; Yuan, J.; Li, W.; Zhang, S.; Ji, J. Complexing agents for potassium oleate removal after cobalt chemical-mechanical polishing: Prediction, verification and mechanism. J. Mol. Liq. 2023, 383, 122077. [Google Scholar] [CrossRef]
  6. Hazarika, J.; Gupta, A.; Rajaraman, P.V. Review—Post-Chemical Mechanical Planarization Cleaning Technology. ECS J. Solid State Sci. Technol. 2023, 12, 114002. [Google Scholar] [CrossRef]
  7. Du, H.; Wang, F.; Wang, X.; Tan, B.; Shi, Y.; Liu, R.; Han, X. Synergistic Effect of Composite Complex Agent on BTA Removal in Post-Cu-CMP: Experimental and Theoretical Analysis. ECS J. Solid State Sci. Technol. 2023, 12, 124003. [Google Scholar] [CrossRef]
  8. Li, W.; Tan, B.; Zhang, S.; Gao, B.; Ma, B.; Guo, L.; Du, H.; Wang, F.; Wang, X. Application of an optimized alkaline cleaning solution for inhibitor removal during the post-CMP process: Performance evaluation and mechanism analysis. J. Mol. Liq. 2023, 369, 120892. [Google Scholar] [CrossRef]
  9. Li, X.; Chen, Y.; Tao, Y.; Shen, L.; Xu, Z.; Bian, Z.; Li, H. Challenges of photocatalysis and their coping strategies. Chem Catal. 2022, 2, 1315–1345. [Google Scholar] [CrossRef]
  10. Xueling, B.; Qian, Y.; Yang, G.; Baoqiang, H.; Renyuan, Z.; Ran, D.; Jing, L. Alkyl halide formation from degradation of carboxylic acids in the presence of Fe(III) and halides under light irradiation. Water Res. 2023, 235, 119842. [Google Scholar] [CrossRef]
  11. Xiuling, Z.; Yuanfeng, L.; Linshan, Z.; Qichun, Z.; Congju, L. Simultaneous degradation of high concentration of citric acid coupled with electricity generation in dual-chamber microbial fuel cell. Biochem. Eng. J. 2021, 173, 108095. [Google Scholar] [CrossRef]
  12. Milica, P.; Tijana, J.; Saša, R.; Janez, K.; Nena, V.; Slobodan, N.; Miloš, K.; Aleksandar, B. Plasma modified electrosynthesized cerium oxide catalyst for plasma and photocatalytic degradation of RB 19 dye. J. Environ. Chem. Eng. 2022, 10, 107931. [Google Scholar] [CrossRef]
  13. Natalia, Q.; María, E.M.; Raquel, T.G.; Michèle, B.; Marta, I.L. Photocatalytic degradation of citric acid under different conditions: TiO2 heterogeneous photocatalysis against homogeneous photolytic processes promoted by Fe(III) and H2O2. Appl. Catal. B Environ. 2007, 71, 117–124. [Google Scholar] [CrossRef]
  14. Costa-Silva, M.; Francisca, P.A.; Guerra, Y.; Bartolomeu, C.V.; Edson, C.S.-F.; Josy, A.O.; Luciano, C.A.; Skovroinski, E.; Peña-Garcia, R. Photocatalytic, structural and optical properties of Ce–Ni co-doped ZnO nanodisks-like self-assembled structures. Mater. Chem. Phys. 2022, 292, 126814. [Google Scholar] [CrossRef]
  15. Zheng, Z.; Tian, S.; Feng, Y.; Zhao, S.; Li, X.; Wang, S.; He, Z. Recent advances of photocatalytic coupling technologies for wastewater treatment. Chin. J. Catal. 2023, 54, 88–136. [Google Scholar] [CrossRef]
  16. Hu, T.; Chiu, S.; Dai, B.; Tsai, M.; Tung, I.; Feng, M. Nitric acid-based slurry with citric acid as an inhibitor for copper chemical mechanical polishing. Mater. Chem. Phys. 1999, 61, 169–171. [Google Scholar] [CrossRef]
  17. Monika, S.; Akhilesh Kumar, S. Studies on structural, morphological, and electrical properties of Ga3+ and Cu2+ co-doped ceria ceramics as solid electrolyte for IT-SOFCs. Int. J. Hydrogen Energy 2020, 45, 24014–24025. [Google Scholar] [CrossRef]
  18. You, H.; Wu, Z.; Zhang, L.; Ying, Y.; Liu, Y.; Fei, L.; Chen, X.; Jia, Y.; Wang, Y.; Wang, F.; et al. Harvesting the Vibration Energy of BiFeO3 Nanosheets for Hydrogen Evolution. Angew. Chem. Int. Ed. 2019, 58, 11779–11784. [Google Scholar] [CrossRef]
  19. Liu, X.; Xiao, L.; Zhang, Y.; Sun, H. Significantly enhanced piezo-photocatalytic capability in BaTiO3 nanowires for degrading organic dye. J. Mater. 2020, 6, 256–262. [Google Scholar] [CrossRef]
  20. Goharshadi, E.K.; Samiee, S.; Nancarrow, P. Fabrication of cerium oxide nanoparticles: Characterization and optical properties. J. Colloid Interface Sci. 2011, 356, 473–480. [Google Scholar] [CrossRef]
  21. Truffault, L.; Ta, M.-T.; Devers, T.; Konstantinov, K.; Harel, V.; Simmonard, C.; Andreazza, C.; Nevirkovets, I.P.; Pineau, A.; Verona, O.; et al. Application of nanostructured Ca doped CeO2 for ultraviolet filtration. Mater. Res. Bull. 2010, 45, 527–535. [Google Scholar] [CrossRef]
  22. Li, F.; Yang, L.; Zou, L.; Wu, Y.; Hu, C.; He, J.; Yang, X. Decreasing Crystallinity is Beneficial to the Superoxide Dismutase-like Activity of Ceria Nanoparticles. Chemnanomat 2022, 8, e202100466. [Google Scholar] [CrossRef]
  23. Zhang, H.; Qiu, J.; Yan, B.; Liu, L.; Chen, D.; Liu, X. Regulation of Ce (III)/Ce (IV) ratio of cerium oxide for antibacterial application. Iscience 2021, 24, 102226. [Google Scholar] [CrossRef] [PubMed]
  24. Parida, V.K.; Srivastava, S.K.; Chowdhury, S.; Gupta, A.K. Facile synthesis of 2D/0D Bi2O3/MnO2 Z-scheme heterojunction for enhanced visible light-assisted photocatalytic degradation of acetaminophen. Chem. Eng. J. 2023, 472, 144969. [Google Scholar] [CrossRef]
  25. Xu, L.; Wang, J. Magnetic Nanoscaled Fe3O4/CeO2 Composite as an Efficient Fenton-Like Heterogeneous Catalyst for Degradation of 4-Chlorophenol. Environ. Sci. Technol. 2012, 46, 10145–10153. [Google Scholar] [CrossRef]
  26. Murugan, R.; Kashinath, L.; Subash, R.; Sakthivel, P.; Byrappa, K.; Rajendran, S.; Ravi, G. Pure and alkaline metal ion (Mg, Ca, Sr, Ba) doped cerium oxide nanostructures for photo degradation of methylene blue. Mater. Res. Bull. 2018, 97, 319–325. [Google Scholar] [CrossRef]
  27. Deng, H.; Jia, Y.; Wang, W.; Zhong, S.; Hao, R.; Fan, L.; Liu, X. Defect and Crystallinity-Mediated Charge Separation in Carbon Nitride for Synergistically Boosted Solar-Driven Hydrogen Evolution. Acs Sustain. Chem. Eng. 2023, 11, 13736–13746. [Google Scholar] [CrossRef]
  28. Li, L.; Hu, S.-z.; Huang, T.; Zhang, N.; Wang, Y. Fabricating the ternary CeO2@CNTs/CdSe composite with synchronously enhanced adsorption and photocatalytic activity toward water-soluble pollutants removal. Chem. Eng. J. 2023, 476, 146574. [Google Scholar] [CrossRef]
  29. Mansingh, S.; Padhi, D.K.; Parida, K.M. Enhanced visible light harnessing and oxygen vacancy promoted N, S co-doped CeO2 nanoparticle: A challenging photocatalyst for Cr(VI) reduction. Catal. Sci. Technol. 2017, 7, 2772–2781. [Google Scholar] [CrossRef]
  30. Ghassempour, A.; Najafi, N.M.; Amiri, A.A. Determination of citric acid in fermentation media by pyrolysis mass spectrometry. J. Anal. Appl. Pyrolysis 2003, 70, 251–261. [Google Scholar] [CrossRef]
  31. Tekin, N.; Cebe, M. Investigation of dissociation properties of oxalic acid–solvent systems by UV-spectrophotometry. J. Mol. Liq. 2005, 122, 65–68. [Google Scholar] [CrossRef]
  32. Wang, W.; Zhang, B.; Shi, Y.; Ma, T.; Zhou, J.; Wang, R.; Wang, H.; Zeng, N. Improvement in chemical mechanical polishing of 4H-SiC wafer by activating persulfate through the synergistic effect of UV and TiO2. J. Mater. Process. Technol. 2021, 295, 117150. [Google Scholar] [CrossRef]
  33. Steigerwald, J.M.; Murarka, S.P.; Gutmann, R.J.; Duquette, D.J. Chemical processes in the chemical mechanical polishing of copper. Mater. Chem. Phys. 1995, 41, 217–228. [Google Scholar] [CrossRef]
  34. Brug, G.J.; van den Eeden, A.L.G.; Sluyters-Rehbach, M.; Sluyters, J.H. The analysis of electrode impedances complicated by the presence of a constant phase element. J. Electroanal. Chem. Interfacial Electrochem. 1984, 176, 275–295. [Google Scholar] [CrossRef]
  35. Gao, F.; Liang, H. Material removal mechanisms in electrochemical-mechanical polishing of tantalum. Electrochim. Acta 2009, 54, 6808–6815. [Google Scholar] [CrossRef]
  36. Gorantla, V.R.K.; Assiongbon, K.A.; Babu, S.V.; Roy, D. Semiconductor Devices, Materials, and Processing—Citric Acid as a Complexing Agent in CMP of Copper—Investigation of Surface Reactions Using Impedance Spectroscopy. J. Electrochem. Soc. 2005, 152, G404. [Google Scholar] [CrossRef]
  37. Guo, X.; Yuan, S.; Gou, Y.; Wang, X.; Guo, J.; Jin, Z.; Kang, R. Study on chemical effects of H2O2 and glycine in the Copper CMP process using ReaxFF MD. Appl. Surf. Sci. 2020, 508, 145262. [Google Scholar] [CrossRef]
  38. Shijie, L.; Shiwei, H.; Wei, J.; Yu, L.; Yingtang, Z.; Jianshe, L.; Zhaohui, W. Facile synthesis of cerium oxide nanoparticles decorated flower-like bismuth molybdate for enhanced photocatalytic activity toward organic pollutant degradation. J. Colloid Interface Sci. 2018, 530, 171–178. [Google Scholar] [CrossRef]
  39. Herzog, A.E.; Michael, T.J.; Dunkelberger, A.D.; Johannes, M.D.; Rolison, D.R.; DeSario, P.A.; Novak, T.G. Nanostructured CeO2 photocatalysts: Optimizing surface chemistry, morphology, and visible-light absorption. Nanoscale 2024, 16, 9659–9679. [Google Scholar] [CrossRef]
Figure 1. (a) XRD diffraction pattern of CeO2 and H-CeO2 powders, (b) crystal model of CeO2, (c) SEM image of CeO2, (d) particle size distribution of CeO2, (eg) TEM images of CeO2.
Applsci 14 08285 g001
Figure 2. (a) UV-Vis diffuse reflectance spectra of CeO2 and H-CeO2, (b) Optical bandgap diagram of CeO2 and H-CeO2.
Applsci 14 08285 g002
Figure 3. (a) PL spectra of CeO2 and H-CeO2, (b) Fluorescence lifetimes of CeO2 and H-CeO2.
Applsci 14 08285 g003
Figure 4. (a) Degradation capability of citric acid solution at different CeO2 concentrations, (b) Photocatalytic degradation curve of citric acid, (c) Linear relationship between l n ( c 0 / c ) and time ( t ), (d) Rate constant k at different CeO2 concentrations.
Applsci 14 08285 g004
Figure 5. (a) Degradation rate of citric acid solution under different conditions, (b) Photocatalytic degradation curve of citric acid.
Applsci 14 08285 g005
Figure 6. (a) Tafel curves at different photocatalysis times. (b) Nyquist plots at different photocatalysis times, along with the R S ( R 1 C 1 ) ( R 2 C 2 ) equivalent circuit model. (c) Bode magnitude plots at different photocatalysis times. (d) Bode phase plots at different photocatalysis times.
Applsci 14 08285 g006
Figure 7. Scheme of Cleaning After CMP.
Applsci 14 08285 g007
Table 1. The values of E c o r r and I c o r r in the electrolyte at different irradiation times.
Electrolyte Illumination TimeEcorr vs. SCE (V)Icorr (A/cm2)
0 min−0.323 2.00 × 10 5
10 min−0.325 1.99 × 10 5
20 min−0.325 1.99 × 10 5
30 min−0.323 1.97 × 10 5
40 min−0.325 1.94 × 10 5
50 min−0.329 1.88 × 10 5
60 min−0.325 1.77 × 10 5
Disclaimer/Publisher’s Note: The statements, opinions and data contained in all publications are solely those of the individual author(s) and contributor(s) and not of MDPI and/or the editor(s). MDPI and/or the editor(s) disclaim responsibility for any injury to people or property resulting from any ideas, methods, instructions or products referred to in the content.