Abstract
This paper presents a comprehensive comparative analysis of the measurement tools in the Cognex D900 vision system, applied within an industrial manufacturing environment focused on quality control. Initially, issues related to vision systems, including their definition, history, and development path, are discussed. The benefits of using vision systems in such industrial scenarios are presented. The analysis examines the operation of selected functions offered by the vision system, comparing two methods of program preparation for inspection: user-configured functions performing the indicated measurements and image analysis using deep learning. The first method allows for the omission of non-critical defects, providing specific dimension values for further analysis by other systems, and features straightforward function configuration with low hardware requirements, with modification times ranging from 30 to 200 ms depending on image detail placement. Conversely, the ViDi tool offers comprehensive image analysis without the need to specify detail features, enabling the detection of any deviations from a reference pattern. Through a series of tests conducted in a high-precision manufacturing environment, this research highlights the strengths, limitations, and practical implications of using advanced vision systems in automated inspection and quality control processes.
1. Introduction
In industrial automation, vision systems play a key role in increasing the efficiency, precision, and quality of production processes [1]. They are used, among other things, for quality control, where they detect product defects, measure dimensions, and check assembly completeness [2]. Additionally, vision systems assist robots in manipulation tasks, enabling the precise positioning and assembly of components. They also enable the automation of inspection processes, significantly reducing production time and operational costs [3].
The integration of vision systems with other automation components, such as robots, PLC controllers, and SCADA systems, allows for the creation of advanced and intelligent production lines that can quickly respond to changing conditions and market demands. By applying vision technologies, the industry can achieve higher levels of efficiency, waste reduction, and overall product quality improvement [4].
In the era of rapid technological development and increasing demands for quality and production efficiency, including the elimination of human factors, vision systems are gaining importance as key tools supporting the automation of industrial processes. This work is dedicated to the analysis and discussion of vision systems and their applications in various industry sectors. It provides a detailed description of the tools of the Cognex In-Sight D900 vision system (Cognex Corporation, Natick, MA, USA), one of the leaders in the vision technology market.
Vision systems utilizing advanced image processing algorithms and machine learning enable the automatic analysis of the visual features of production elements for control, identification, measurement, and sorting. The wide range of applications covers various industries such as the automotive industry, pharmaceuticals, food production, and many others where the execution, precision and reliability of control are crucial factors.
This work will thoroughly discuss the measurement tools of the Cognex D900 vision system (Cognex Corporation, Natick, MA, USA), which, thanks to its advanced technology and ease of integration with industrial systems, provides a solution adaptable to the needs of modern industry.
The aim of this work is not only to present the theoretical foundations of the operation of vision systems but also to showcase their practical applications and benefits, as well as to compare their strengths and weaknesses.
The structure of the paper is as follows. Section 2 and Section 3 are devoted to an analysis of the literature in the field of industrial vision systems and image analysis. Section 2 discusses the development of vision systems over the years and describes the general method of image recognition. Section 3 discusses the practical applications of Cognex vision systems in industry. Next, in Section 4, a comparative analysis of the available tools for the selected vision system is presented. Section 5 is devoted to a discussion of the research results achieved. Finally, Section 6 concludes the paper, summarizing the main objectives.
2. Background and Literature Review
Section 2 presents the concept of a vision system and highlights key historical events considered pivotal in its development. It defines and compares machine vision with computer vision, outlining the differences between these two concepts. This chapter also explores the topic of the image recognition process, which is used to identifying objects or features in an image. An analysis of the benefits derived from the use of machine vision is also conducted, comparing strategic goals in relation to machine vision applications.
2.1. Vision Systems: Definition, History, and Evolution
A vision system, also known as computer vision, is a field of artificial intelligence in which programs aim to identify objects depicted in digital images provided by cameras. This enables computers to “see”. These systems can analyze large sets of visual data, detecting features and patterns that can then be applied to other images. This field relies on the use of deep learning and neural networks for processing visual information, which forms the basis for processes such as facial recognition and augmented reality [5].
In 1963, Larry Roberts, considered the father of computer vision, described the process of deriving 3D information from 2D photographs. In 1966, Marvin Minsky tasked a student with connecting a camera to a computer so it could describe what it saw. In 1969, Willard Boyle and George E. Smith demonstrated how charge could be moved across a semiconductor surface, leading to the invention of the Charge-Coupled Device (CCD) concept. In 1971, Michael Tompsett demonstrated how a CCD could be used as an imaging device. Three years later, Bryce Bayer, working for Kodak, showed how color images could be captured using a CCD. In 1972, scientists at General Electric developed an X-Y array of photosensitive elements known as a charge injection device (CID), eliminating some of the drawbacks associated with CCDs. However, the success of CMOS sensors did not come until the next thirty years, partly due to the variability in the CMOS manufacturing process. In 1980, Kunihiko Fukushima built the ‘neocognitron’, which became a precursor to modern convolutional neural networks. The first digital image scanner to convert images into grids of numbers was the device built by Ray Kurzweil in 1974, known as the Kurzweil Reading Machine (Figure 1). This was essentially a scanner that converted written text into speech using OCR (Optical Character Recognition) to assist the visually impaired in reading printed texts [6,7,8,9,10,11].
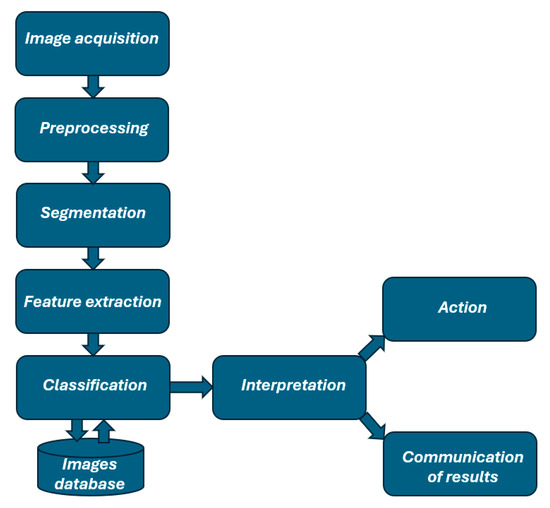
Figure 1.
The basic outline of the image recognition method.
In the 1990s, multiple video recording devices and video surveillance systems for ATMs emerged. In 2001, the first real-time face detection system (Viola–Jones) was developed at the MIT. In 2009, Google began testing robot cars [5,12].
The development of vision systems spanned various decades. In the 1970s, the focus was on edge extraction from images, line labeling, 3D modeling, and representing objects as connections of smaller structures, optical flow, and motion estimation. The 1980s brought advancements in scale-space theory, shape inference from different cues such as shadow, texture, and focus, as well as contour models known as “snakes”. The 1990s concentrated on camera calibration, 3D scene reconstruction from multiple images, the dense stereo correspondence problem, and multi-view stereo techniques, as well as image segmentation using graph cuts. Since the 2000s, computer vision has advanced in areas such as autonomous vehicles, face recognition, healthcare, and many other fields [12].
2.2. Machine Vision vs. Computer Vision
Machine vision and computer vision can perform tasks faster than human vision, but they serve different purposes and have distinct characteristics. Machine vision is a specialized application of computer vision, specifically designed for industrial and production environments. It involves image processing and operates based on a set of predefined rules and parameters to support tasks like quality assurance. In contrast, computer vision is a broader field that includes the automated analysis of images and can be applied across a wide range of theoretical and practical domains, including but not limited to industrial applications [13,14,15,16,17,18,19,20].
Table 1 presents the key differences between the two.

Table 1.
Key differences between machine vision and computer vision [13,14,15,16,17,18,19,20].
Machine vision systems are typically part of a larger mechanical system, capturing images using digital cameras and processing them to make decisions, such as accepting or rejecting items on a production line. These systems are designed for real-time, high-speed decision making in controlled environments. On the other hand, computer vision systems can operate independently, analyzing pre-recorded images or videos and deriving valuable information from them. Unlike machine vision, computer vision does not always require a real-time image capture and can work with stored or synthetic images.
While machine vision focuses on specific features of an object to make rapid decisions, computer vision aims to extract as much information as possible from an image. Despite these differences, machine vision is often considered a subset of computer vision because it uses the principles of computer vision to achieve specific industrial goals.
2.3. Image Recognition Process
Image recognition in vision systems is a complex process that involves several essential stages to analyze and understand visual data. These stages ensure that the system can accurately identify and classify objects within an image, ultimately leading to informed decisions and actions. The stages include the following [21,22,23,24]:
- Image acquisition: The process begins with capturing an image using a vision camera. Depending on the application requirements, the camera might be a 2D, 3D, or linear type. This captured image serves as the raw input data for the system. Once the image is captured, it is converted into a digital format that can be processed by the system for further analysis. The quality and type of the camera used, as well as the lighting conditions, play a crucial role in the accuracy of the subsequent steps.
- Preprocessing: After acquiring the image, the next step is preprocessing, which involves a series of operations designed to enhance the image quality and prepare it for further analysis. Preprocessing can include a range of techniques such as lighting correction to ensure consistent brightness, noise filtering to remove any unwanted artifacts, contrast enhancement to make important features stand out, and normalization to ensure uniformity across different images. The primary goal of preprocessing is to make feature detection easier and more reliable by refining the image to a more analyzable form.
- Segmentation: Segmentation is a critical stage where the image is divided into different segments to isolate objects of interest from the background. This step is crucial for focusing on specific parts of the image that are relevant for recognition. Techniques used in segmentation can vary, including thresholding, which separates objects based on intensity levels; edge detection, which identifies object boundaries; and pixel classification, which categorizes pixels based on their characteristics. Effective segmentation is vital for the accuracy of the following stages.
- Feature extraction: Once the image is segmented, the system proceeds to feature extraction, where it identifies and isolates key characteristics necessary for object recognition. These features can include shapes, textures, colors, sizes, or specific markers that are unique to the object being recognized. Feature extraction is a pivotal stage because the accuracy of object recognition heavily depends on how well the system can identify and analyze these features.
- Classification: After extracting the relevant features, the system moves on to classification. Here, classification algorithms, often powered by machine learning or artificial intelligence, analyze the extracted features and assign the object to one of the predefined categories. This categorization is based on training data that the system has learned from, allowing it to recognize and classify objects with a certain degree of accuracy. The effectiveness of this stage depends on the quality of the training data and the sophistication of the classification algorithms.
- Interpretation: The interpretation stage involves analyzing the classification results to make sense of the recognized objects within the context of the application. For instance, in a quality control scenario, the system may evaluate whether a product meets the specified standards based on its classification. This step is where the system’s decisions are contextualized, making the data meaningful and actionable for the intended application.
- Action: Based on the interpretation, the system is then capable of taking appropriate actions. These actions can vary depending on the application, such as rejecting a defective product from the production line, sorting objects into different categories, or triggering alerts that signal the need for human intervention. The action stage is where the system’s analysis directly influences real-world operations, ensuring that the appropriate response is taken based on the visual data.
- Communication of results: Finally, the vision system communicates the results of its analysis and actions to other systems within the enterprise. This can include production management systems, databases, or user interfaces, ensuring that the relevant information is available to those who need it. The effective communication of results is essential for integrating the vision system’s insights into broader workflows, allowing for seamless operation and coordination within the enterprise.
Each of these steps can be more or less complicated depending on the complexity of the task and the specific requirements of the application. Modern vision systems often use advanced machine learning and artificial intelligence algorithms to improve the accuracy and reliability of the image recognition process. The general scheme of the image recognition method is shown in Figure 1.
2.4. Benefits of Using Machine Vision
The deployment of vision systems in industrial environments offers numerous benefits, including increased efficiency, consistent quality control, and the ability to perform inspections that would be impossible or impractical for human operators. Key applications include dimensional measurement, surface inspection, part identification, and assembly verification. The Cognex D900, for instance, is widely used in sectors such as automotive, electronics, and pharmaceuticals, where precision and reliability are paramount.
By eliminating physical contact between the test system and the parts being tested, machine vision prevents part damage and eliminates maintenance time and costs associated with the wear and tear of mechanical components. For example, a study [25] by Konstantinidis et al. found that computer vision systems empowered with self-adjustment capacities should be integrated with existing execution systems to rectify defects in real time, thus promoting the intelligent system design towards enabling zero-defect manufacturing at the human and system level. Machine vision also brings additional safety and operational benefits by reducing human involvement in the production process. Moreover, it prevents the human contamination of cleanrooms and protects workers from hazardous environments. As shown in Table 2, there is a clear relationship between strategic goals, such as cost reduction and quality improvement, and machine vision applications.
Table 2.
Relationship between strategic goals and machine vision applications [11,25,26,27,28].
Despite their advantages, vision systems face challenges such as high initial costs, the need for specialized knowledge to configure and maintain the systems, and limitations in processing speed when handling complex tasks. Moreover, the choice between traditional rule-based approaches and AI-driven methods presents a significant consideration for practitioners. The selection of an appropriate approach depends on factors such as the complexity of the task, the required accuracy, and the available computational resources.
3. Applications of Cognex Vision Systems
Typically, the first step in any machine vision application, whether it is a simple assembly verification or a complex robotic bin picking, is using pattern matching technology to locate the object or feature of interest within the camera’s field of view. The success or failure often hinges on the ability to accurately locate the object of interest. If pattern matching software tools cannot precisely locate parts in the image, then they cannot guide, identify, inspect, count, or measure the parts. Although finding parts seems straightforward, variations in their appearance under real production conditions can make this step extremely challenging. While vision systems are trained to recognize parts based on patterns, even the most controlled processes allow for some variability in the appearance of parts.
To achieve accurate, reliable, and repeatable results, part location tools in vision systems must include sufficient intelligence to quickly and accurately compare training patterns to actual objects (pattern matching) moving along the production line. Part location is a critical first step in the four main categories of machine vision applications. These categories include the following:
- Guidance;
- Identification;
- Gauging;
- Inspection.
In the literature, these categories are described by the acronym GIGI [29].
3.1. Guidance—Object Indication
Guidance can be implemented for various reasons. Firstly, machine vision systems can locate the position and orientation of parts, compare them against specified tolerances, and ensure they are at the correct angle to verify proper assembly. Then, guidance can be used to report the location and orientation of parts in 2D or 3D space to a robot or machine controller, allowing the robot to locate the part or the machine to align it. Vision guidance achieves significantly higher speed and accuracy than manual positioning in tasks such as palletizing or depalletizing parts, packing parts from a conveyor, finding and aligning parts for assembly with other components, placing parts on a workstation, or removing parts from bins [29].
Guidance can also be used to align with other machine vision tools. This is a crucial function of machine vision because parts may be presented to the camera in unknown orientations during production. By locating the part and then aligning other vision tools to it, machine vision allows for automatic tool setup. This involves locating key features on the part to enable the precise positioning of vision tools such as calipers, blobs, edge detectors, and other vision software tools to interact correctly with the part. This approach enables manufacturers to produce multiple products on the same production line and reduces the need for expensive specialized mechanisms to maintain consistent part positions during inspection [29].
Sometimes, guidance requires matching geometric patterns. Pattern matching tools must tolerate significant variations in contrast and lighting, as well as changes in scale, rotation, and other factors, while reliably finding parts each time. This is because the location information obtained through pattern matching allows for the alignment of other machine vision tools. This section may be divided by subheadings. It should provide a concise and precise description of the experimental results, their interpretation, as well as the experimental conclusions that can be drawn [29].
3.2. Identification
Machine vision technologies enable the reading of codes and alphanumeric characters. A machine vision system for part identification and recognition can read barcodes (1D), matrix codes (2D), direct part markings (DPMs), and printed characters on parts, labels, and packaging. An Optical Character Recognition (OCR) system reads alphanumeric characters without prior knowledge, whereas an Optical Character Verification (OCV) system confirms the presence of a character string. Additionally, machine vision systems can identify parts by locating a unique pattern or by recognizing objects based on color, shape, or size [29].
DPM applications involve marking a code or string of characters directly on a part. Manufacturers across various industries commonly use this technique for error proofing, enabling effective packaging strategies, process control monitoring, and quality control metrics. DPM also helps to identify problematic areas, known as bottlenecks, within a facility. Tracking through direct part marking improves asset monitoring and part authenticity verification. It also provides unit-level data to enhance technical support and warranty service by documenting the genealogy of parts within the subassemblies of the final product [29].
Conventional barcodes have gained wide acceptance in retail checkouts and inventory control. However, tracking information requires more data than a standard barcode can hold. To increase data capacity, companies have developed 2D codes, such as Data Matrix, which can store more information, including manufacturer details, product identification, batch numbers, and even unique serial numbers for virtually every finished product [29].
3.3. Measurement and Calibration—Gauge
A machine vision system for calibration calculates the distances between two or more points or geometric locations on an object and determines whether these measurements conform to specified tolerances. If they do not, the vision system sends a failure signal to the machine controller, triggering a rejection mechanism that removes the object from the production line [28].
In practice, a fixed camera captures images of parts as they move through the camera’s field of view, and the system uses software to calculate the distances between various points on the image. Because many machine vision systems can measure object features with an accuracy of up to 0.0254 mm, they are used in numerous applications that were traditionally managed by contact-based measuring devices [29].
3.4. Inspection—Defect Identification
Machine vision systems are critical for detecting defects, contaminants, functional faults, and other irregularities in manufactured products. These systems can inspect pharmaceutical tablets for defects, verify icons or the presence of pixels on displays, and measure backlight contrast levels on touchscreens.
Machine vision systems also ensure product completeness. For instance, in the food and pharmaceutical industries, they verify that a product matches its packaging and check safety seals, caps, and rings on bottles [29].
Designed for inspection, machine vision systems monitor the visual appearance of the material under observation. By using statistical analysis, the system automatically identifies potential surface defects and classifies them into groups based on similarities in contrast, texture, and/or geometry [29].
3.5. Application of Cognex Vision Systems in Industry
Machine vision helps solve complex industrial tasks in a reliable and consistent manner. According to the Automated Imaging Association (AIA), machine vision encompasses all industrial and non-industrial applications in which a combination of hardware and software provides operational guidance to devices to perform their functions based on image capture and processing. Although industrial computer vision uses many of the same algorithms and approaches as academic/educational and government/military applications of computer vision, the constraints are different [30,31,32].
Industrial vision systems require greater reliability, durability, and stability compared to academic/educational vision systems and typically cost significantly less than those used in government/military applications. Therefore, industrial machine vision signifies low cost, acceptable accuracy, high durability, reliability, and high mechanical and thermal stability [33,34,35,36].
In order to present specific applications of machine vision, a small summary has been prepared, showing what is checked using vision methods and implemented GIGI categories (Table 3).
Table 3.
A list of typical vision applications in various industries with the most frequently implemented GIGI category [37].
Machine vision systems rely on digital sensors housed in industrial cameras with specialized optics for acquiring images so that computer hardware and software can process, analyze, and measure various characteristics for decision making. Machine vision is used in various industry sectors, each leveraging its unique capabilities to solve specific problems.
4. Comparative Analysis of Cognex D900 Measurement Tools
The research setup was equipped with a Cognex In-Sight D900 camera mounted on a MANFROTTO mounting system, allowing for flexible positioning of the camera relative to the object under examination. This arrangement enabled positioning the camera at an optimal distance from the object, ensuring the correct size of the object in the image and achieving the best possible lighting and image sharpness.
The setup also included a computer connected to the D900 series camera via an Ethernet protocol. The computer system was equipped with the In-Sight Vision Suite 23.3.0 PR1 (1431) software for programming the vision system (Figure 2).
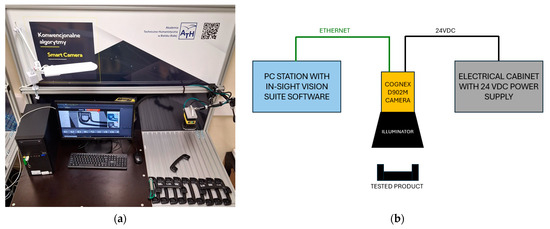
Figure 2.
The laboratory station: (a) illustrative view; (b) block diagram.
Camera specifications:
- Model: D902M (Cognex Corporation, Natick, MA, USA);
- Sensor Type: Monochrome CMOS;
- Resolution: 2.3 MP (1920 × 1200 pixels);
- Maximum Data Acquisition Speed: 51 frames per second;
- Memory: 16 GB FLASH and 3GB SDRAM.
This setup allows for the precise control and configuration of the camera system to ensure accurate and reliable imaging for various applications in machine vision.
The task of the presented vision system was to perform an inspection on a semi-finished product, specifically a passenger handle mounted in passenger cars for a certain automotive company.
Task assumptions:
- The component is inspected in any orientation within the working field of the vision system.
- Vision inspections are adjusted according to the orientation of the component.
- The correctness of the construction of the element is checked against a reference pattern.
- The color of the component is checked.
- The mold cavity number, where the component was produced, is checked.
To ensure the optimal preparation of the application for performing inspections, a set of photos of details recognized as compliant (OK) and non-compliant (NG) with the production requirements was prepared.
Image acquisition parameters were set according to the values shown in Figure 3.
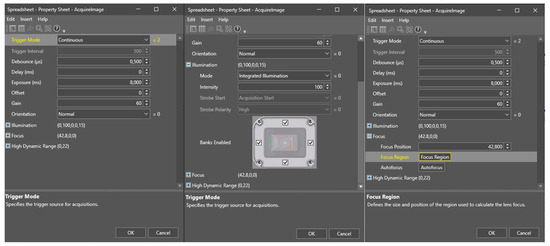
Figure 3.
Acquire image configuration.
Their values were selected so that detail features such as edges, texture and text were best highlighted in the context of contrast against the background. Figure 4 shows the image after setting the parameters.
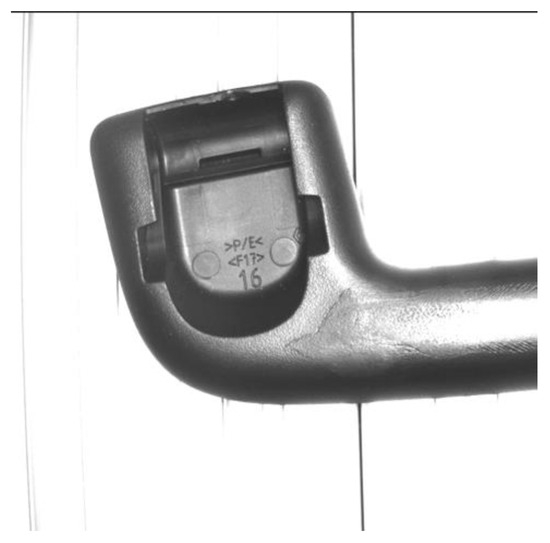
Figure 4.
Image after setting parameters.
4.1. Manual Inspection Execution
The process of programming the application began with training the vision system on the characteristics of the inspected component. These characteristics are crucial for determining the orientation of the component in subsequent images. The TrainPatMaxRedLine function was used. The Image parameter indicates cell $A$0 as a cell with an absolute location containing the current photo. The Fixture parameter was set to the value (0,0,0)—the shift in the X axis, Y axis and rotation angle relative to the base photo coordinate system. The Pattern Region parameter was configured. The pattern search area is shown in Figure 5.
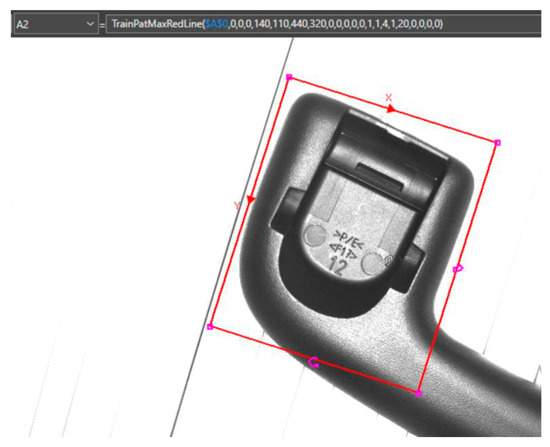
Figure 5.
Set the Pattern Region for the reference photo.
By confirming the selection of the region, the pre-selected photo features marked in green were obtained (Figure 6). The function also took into account a part of the slot number—in order to eliminate the influence of the slot number on pattern matching, parameter values were modified based on the effect of feature extraction. The best result was obtained for the configuration:
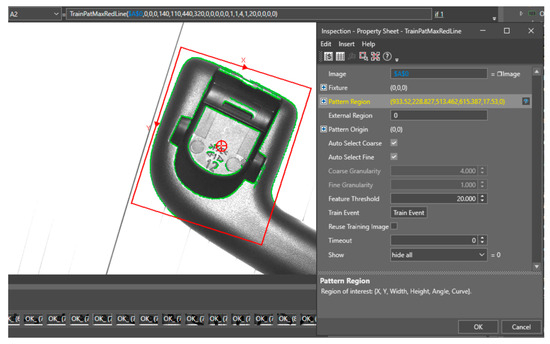
Figure 6.
Pattern features after initial configuration.
- Coarse Granularity = 12.000;
- Fine Granularity = 6.000;
- Feature Threshold = 26.000.
The Reuse Training Image option was selected—thanks to this, after changing the Fixture or Pattern Region parameters, the features of the reference image were updated (Figure 7).
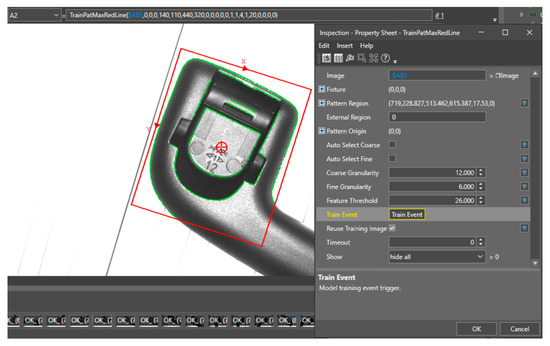
Figure 7.
Features of the standard after calibration of the granulation value.
In order to search for a detail in the working area of the vision system and assign it an orientation, a function using the pattern learned by the TrainPatMaxRedLine function was used.
The FindPatMaxRedLine function is inserted into Spreadsheet. In the configuration window, in the Image field, cell $A$0 containing the current photo is indicated. The Fixture parameter is set to (0,0,0). Find Region was set to cover as much of the system’s field of view as possible—it was assumed that the detail could be freely moved and rotated within the system’s field of view. The Pattern parameter is cell $A$2, where the TrainPatMaxRedLine function was previously placed. It was assumed that only one detail could be included in the ROI, so Number to Find was set to 1. High pattern matching accuracy was selected to best match subsequent inspections in the current photo. The values in the Find Tolerances field are set so that the pattern is found for a full rotation of the detail. In order to eliminate the influence of small changes in the distance of the detail from the vision sensor, a tolerance of ±10% of the scale was set. Following the guidelines, the value of the XY Overlap parameter was set to 100% due to the possibility of moving the detail in the ROI.
After the initial configuration, the function was verified with the given parameters. The matching results were checked for 73 photos. The distribution of the fit score is shown in Figure 8.
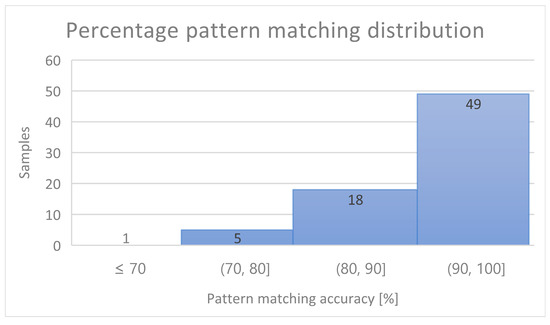
Figure 8.
Pattern matching score distribution.
Analyzing the graph presented in Figure 8, it can be concluded that more than half of the examined details were within the pattern matching score above 90%, and only one photo had a matching level below 70%.
The next stage of preparing the application was configuring the function that checks the color of the detail. For this purpose, the ExtractHistogram function was used, which was placed in cell A6. Cell $A$0 is indicated in the Image field of the configuration window. The Fixture parameter fields indicate the coordinate system shifts returned by the FindPatMaxRedLine function, respectively: X axis $C$4, Y axis $D$4, and rotation angle $E$4. The region is set as in Figure 9.
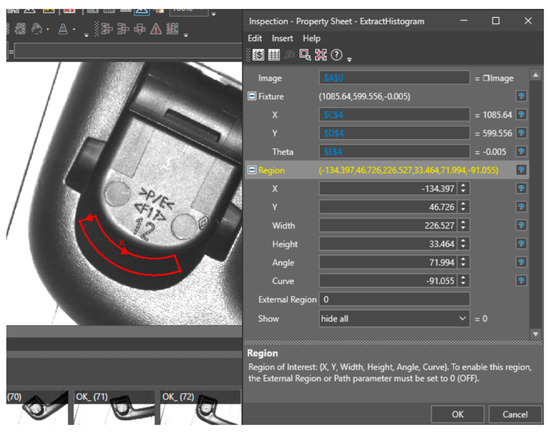
Figure 9.
ExtractHistogram function parameters.
Next, the FindLine function was used to detect the edge of a hole that serves as a positioning function for a detail installed at a later stage of the production process. The mentioned function is placed in cell A8. The Image parameter points to cell $A$0, Fixture to cells $C$4, $D$4 and $E$4. The region is marked as in Figure 10. The edge polarization is white to black—the hole is illuminated in such a way that the checked edge is at the transition from white to black. The function points to the first found edge, which it locates as a transition from white to light over a length of 8 pixels. The result was normalized according to the maximum contrast in the ROI of the FindLine function—changes in contrast were noticed depending on the position of the detail in the field of view of the vision system.
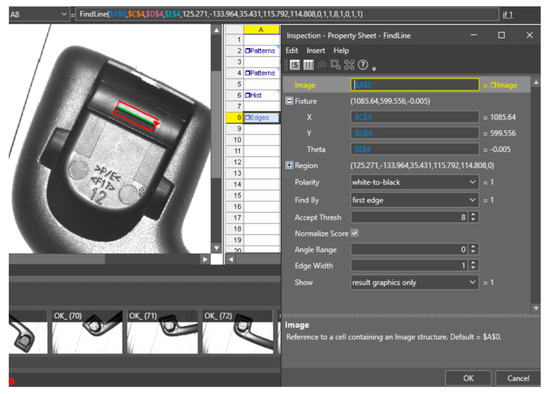
Figure 10.
Configuration of the FindLine function.
As a follow-up inspection, the Caliper function was added to cell A10. This function was used to measure the distance of the edges marked in Figure 11. Too small a distance between these edges may make the further assembly of components difficult or impossible.
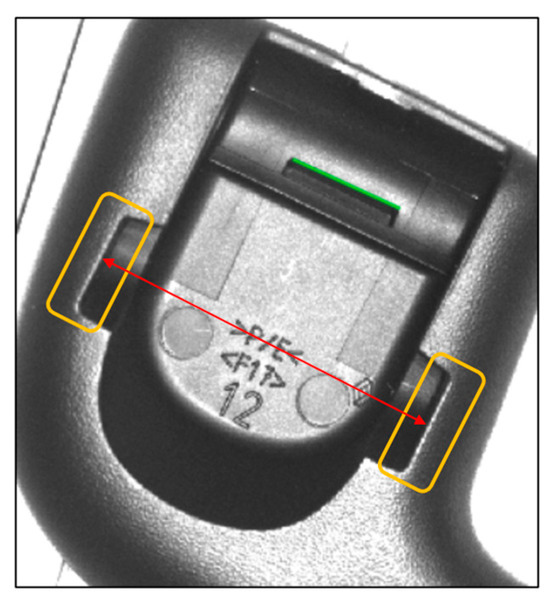
Figure 11.
Measured distance.
The function parameters were chosen as shown in Figure 12. The structure in cell $A$0 was indicated as Image. The Fixture values are specified in cells $C$4, $D$4 and $E$4. The region is set to encompass both edges. The scanning direction of this area was chosen to be perpendicular to the edge. Edge Mode is set to Edge Pair to detect one pair of edges (Number to Find = 1). The lowest value of the contrast difference at the transition was set to 20 with an error of 4. The edge width was chosen to be 4 pixels. The polarization was set so that the edge at the transition from light to dark pixels was detected first, and the second edge was detected from dark to light pixels. It was expected that the edges should be found at a distance of 356 pixels; hence, this value was assigned to the Edge Distance parameter. The contrast method of assigning a score to the found edges has been selected. The lower limit for high contrast edge searching was set to 11.
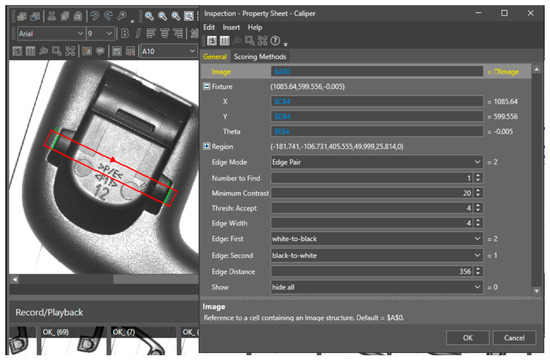
Figure 12.
Caliper function parameters.
The Caliper function with such parameters set in the reference photo returned a distance between the edges of 360 pixels. The inspection operation was checked on 70 photos of good details. Distance values ranged from 348 to 369 pixels. This was influenced by the change in edge illumination depending on the position of the details in relation to the illuminator.
In order to minimize the influence of the detail position on the fluctuations of the Distance value, the Filter function was introduced in cell A9, returning an Image structure with modified pixel values in a specific area. The region is set to include the edges mentioned above (Figure 13). Stretch was chosen as the filtering method, which enhanced the pixel values in the best way to extract the desired edges.
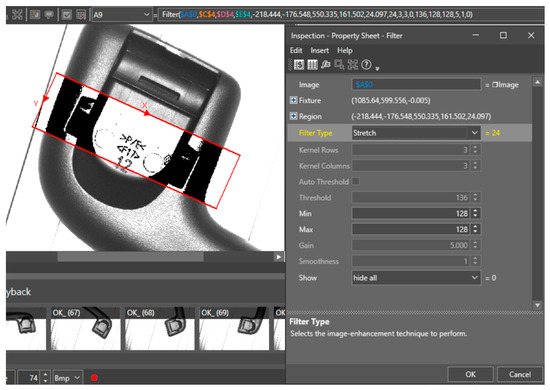
Figure 13.
Configuration of the Filter function.
In order to improve the detection of the second desired edge, another method of assigning a score to the edges was added—the Position method set as in Figure 14. This allowed the result discrepancies to be narrowed to the range from 355 to 368 while stabilizing the measurement.
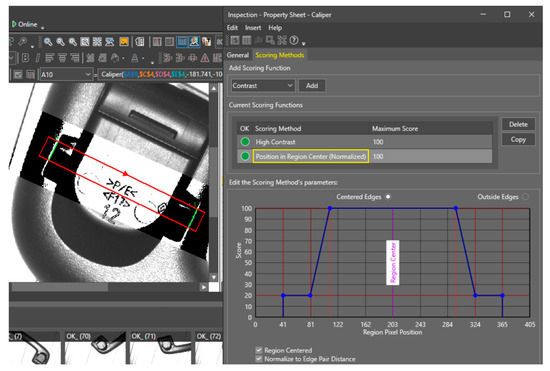
Figure 14.
Parameterization of the Caliper function.
The last function was OCRMax, which is responsible for reading characters in a designated area. Reading the characters allows you to generate product quality statistics, thus allowing you to associate the deterioration of the quality of the detail with a specific injection mold cavity. A more detailed analysis of the data generated in this way also makes it possible to determine the frequency of inspections and preventive services.
The OCRMax function is located in cell A13. Image was assigned to cell $A$0, and Fixture was associated with cells $C$4, $D$4 and $E$4. The ROI area in the Region field is marked as in Figure 15.
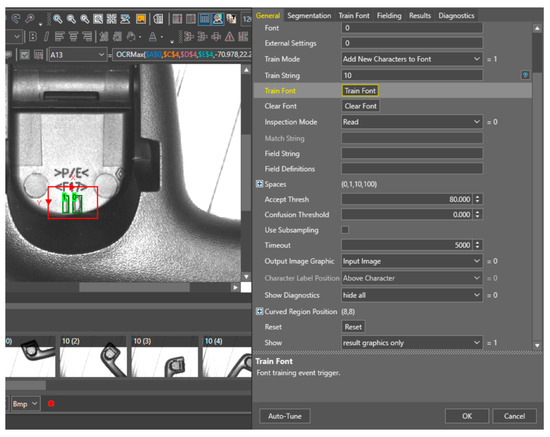
Figure 15.
Region of interest for OCRMax function.
Using the presented learning method, the characters 9, 10, 11, 12, 13, 14, and 15 were entered into the database using photos of details from different injection mold cavities, for different positions of the detail in the camera viewing area. The learned characters can be found in the Train Font tab of the OCRMax function.
4.2. Machine Learning-Based Inspection
ViDiDetect and ViDiRead tools based on deep learning were used to recognize correct and incorrect details and the mold cavity number.
The initial part of the program remained unchanged compared to the solution presented using the method presented in the previous section, so was included the AcquireImage, TrainPatMaxRedLine and FindPatMaxRedLine functions. The last two functions were used to tell the ViDi tools to move the ROI coordinate system—the system was trained on image fragments that contained detail.
The Image field indicates cell $A$0, which contains the data structure of the current image. In the External Fixture field, cell $A$4 is indicated, containing the displacements of the object in the current photo relative to the template. The Region has been selected to include the part of the detail being inspected.
By entering the Open ViDi Editor tab, the vision system training window was opened. Before starting training, it was necessary to prepare a set of photos of details and mark them as good or bad (Figure 16 and Figure 17). In the Bad detail photos, a gray circle indicates the area that the user believed was a defect. The training set contained 24 photos. For the solution search process, it was recommended that the system use 50% of the set of photos so that the operation of the solution could be checked on the remaining photos.
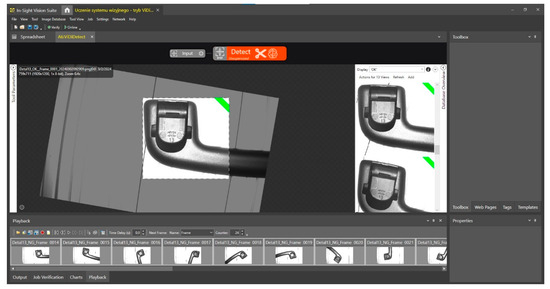
Figure 16.
Learning images marked as good—green ribbon.
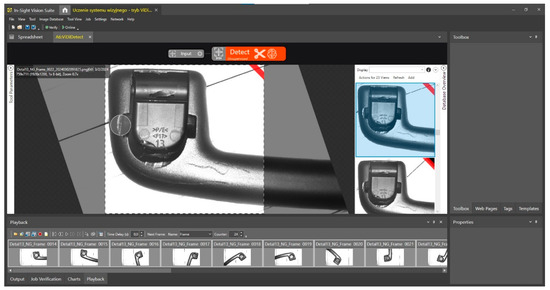
Figure 17.
Learning images marked as bad—red ribbon.
The time taken to calculate the solution took approximately one hour. The result is shown in Figure 18.
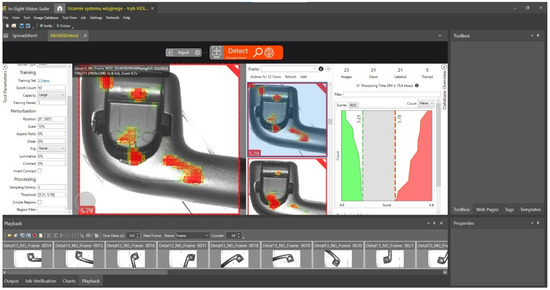
Figure 18.
ViDiDetect tool result.
Areas recognized by the system as defective, i.e., deviating from the pattern common to photos marked as good, are marked with red spots.
The graph on the right side of Figure 19 shows how the solution distinguishes between good and bad photos. As noted, the difference between the result classifying the detail as good and bad was 0.56 mm2 in the range of 4.8–6.4 mm2, which is a result sufficient to correctly detect detail defects.
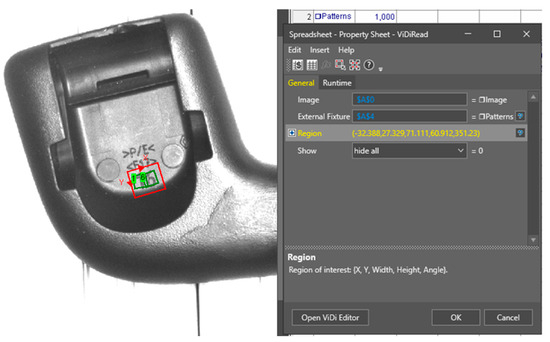
Figure 19.
Configuring the ViDiRead tool.
In the next step, the ViDiRead function used to read the socket number is placed in cell A8. As in the case of the previous function, the Image field shows cell $A$0 and the External Fixture field shows cell $A$4. The region was designated to include the nest number—Figure 19.
After the initial configuration of the ViDiRead tool, the learning screen was opened by pressing the Open ViDi Editor button. A set of training images containing different numbers of sockets in different positions was implemented. In each photo, the area where the sign was placed was indicated and its value was assigned to it.
Moreover, 50% of the prepared photos were used for the learning process. The system took about one hour to prepare the solution. The final effect is shown in Figure 20.
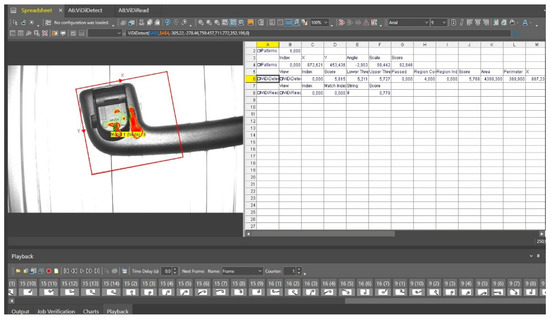
Figure 20.
The result of running the ViDiDetect and ViDiRead tools.
It is important to note that the ViDiDetect function mentioned in the provided text is not something you need to write yourself; it is a pre-existing tool within the Cognex In-Sight Vision Suite software. Cognex, a leading manufacturer of machine vision systems and software, offers a variety of tools and functions as part of their software suite for machine vision applications.
ViDiDetect is a specialized tool provided by Cognex for defect detection using deep learning techniques. It is designed to recognize and analyze defects or anomalies in images or visual data. This tool leverages machine learning and artificial intelligence algorithms to identify deviations from a trained model and provides a Pass/Fail result based on its analysis.
Users of Cognex’s machine vision systems can configure and utilize built-in tools like ViDiDetect to develop and fine-tune machine vision applications for various quality control, inspection, and defect detection tasks. To use ViDiDetect or similar functions, users typically set up training data, teach the system to differentiate between good and bad parts, and then apply the trained model to analyze new images or video streams for defects or irregularities. These tools are invaluable for automating quality control processes and ensuring consistent and accurate inspections in manufacturing and industrial environments.
In the next step of the research, attention was paid to check the stability of the system in terms of changing working conditions. The inspections performed included checking the parts that were shifted and rotated relative to the origin of the ROI coordinate system of the TrainPatMaxRedLine function pattern. The test was performed on 73 photos. Along with changes in the shifts and rotation of the part, the values returned by the inspection functions also changed. The following figures (Figure 21, Figure 22 and Figure 23) presents the dependencies of the values returned for selected inspections in relation to changes in the position and rotation angle of the part of the current photo relative to the reference one. The following two parameters were taken into account:
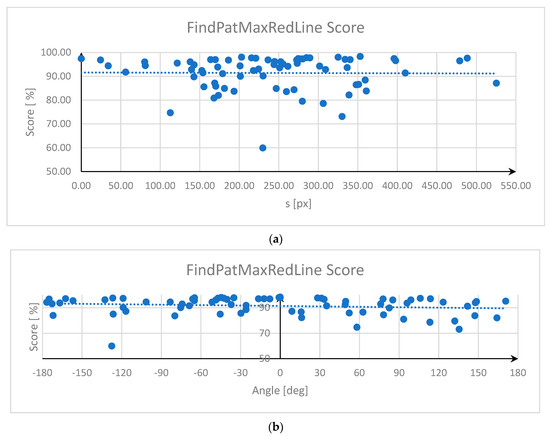
Figure 21.
Dependence of the FindPatMaxRedLine function results on (a) distance s, (b) rotation angle.
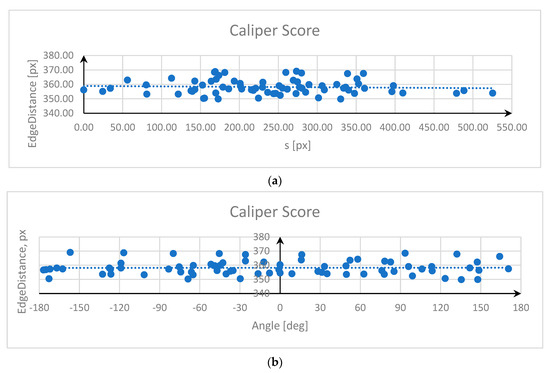
Figure 22.
Dependence of the Caliper-measured edge distance on (a) distance s, (b) rotation angle.
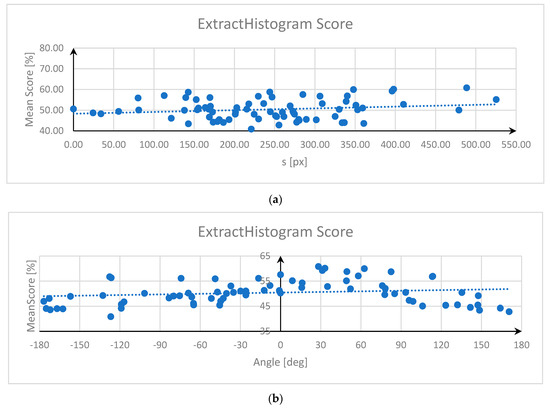
Figure 23.
Dependence of the ExtractHistogram function score on (a) distance s, (b) rotation angle.
- The distance FindPatMaxRedLine origin of the current photo from the TrainPatMaxRedLine origin of the reference photo, calculated in pixels according to the following formula:
s—distance [px];
xor, yor—origin coordinates in the reference image [px];
xoc, yoc—origin coordinates in the current image [px].
- The rotation angle of the part’s origin system in the current image relative to the part’s origin system in the reference image.
In the above figures, a trend line was added to show the trend in value changes depending on distance and rotation angle. As can be seen, the changes are not clearly related. When correcting inspections in real-world application, it was necessary to use limit values that included the highest and lowest acceptable values of the parameters.
5. Discussion
This study offers valuable insights into the integration of traditional and AI-based approaches in industrial vision systems, particularly in the context of optimizing inspection processes in automated environments. By comparing manual learning and AI-driven methods, we were able to highlight the strengths and limitations of each approach, shedding light on how they can be effectively combined for enhanced performance.
The use of manual learning in solving design tasks presents several advantages, particularly in the analysis of measured parameter values. For instance, the ability to convert pixel distances into SI units using special calibration tables is a significant benefit. Moreover, this method allows for the intentional omission of defects in areas deemed unimportant from a quality perspective. This targeted approach not only enhances efficiency but also ensures that critical areas are given priority. The simplicity of configuring functions in this mode, coupled with the low hardware requirements, further supports its practicality. Notably, the time required for image processing—from capture to analysis—was relatively short, ranging from 30 to 200 ms, depending on the detail’s position relative to the reference image. This efficiency, combined with the fact that standard In-Sight system tools are freely available and highly customizable, makes manual learning a viable option in certain contexts.
However, the study also revealed that the manual approach has limitations, particularly its restricted ability to control only specific, pre-defined values. This means that defects in unexpected areas may go undetected, potentially leading to false positives where defective details are mistakenly classified as good.
In contrast, the AI-based approach, utilizing the ViDi tool, offers a more universal solution for comprehensive image analysis. This method does not require the teaching of specific features but instead relies on a set of reference images, from which the system autonomously identifies patterns associated with a good detail. Such an approach is highly effective in capturing any deviations from the established standard. This universality marks a significant advancement in inspection technology, offering the potential to detect a broader range of defects.
However, our findings also indicate some drawbacks of the AI-based method. Access to the ViDi tool requires a key, adding an extra step to the process. Additionally, the need for high computational power can be a barrier, as lower-powered systems may experience significantly longer processing times. Moreover, the AI-based approach provides a general similarity score rather than identifying specific defects, which could limit its utility in certain scenarios. The image processing time for this method was longer, ranging from 227 ms to 262 ms, which could impact overall efficiency in time-sensitive environments.
In conclusion, our study suggests that a hybrid approach, integrating both manual and AI-based methods, could offer the best of both worlds. By leveraging the precision and customization of manual learning alongside the broad, pattern-recognition capabilities of AI, future developments in industrial vision systems could see significant improvements in both accuracy and efficiency. This integrated approach holds promise for optimizing inspection processes, ensuring that automated environments are both more reliable and adaptable to diverse inspection needs.
6. Conclusions
Vision systems using advanced image processing algorithms and machine learning enable the automatic analysis of production elements in order to control their quality, identify and measure key dimensions or sort them. The wide range of applicability of vision systems proves how important a well-selected vision system is as a machine component in today’s industry.
This work presents how to configure the Cognex D900 vision system in the application prepared by the programmer in two ways: by configuring permanent controls, standard for each application of this manufacturer, and by using the ViDi tool for inspection, using machine learning.
In the case of both methods, their strengths and weaknesses are presented. To configure the first method, there is no need to prepare a set of many training photos because the inspection limits can be corrected on an ongoing basis. In the case of the second method, many photos of the detail are needed, but even in this case, the appearance of a new defect cannot be ruled out, which may be acceptable but will be rejected by the vision system.
In order to make the most of the capabilities of the D900 vision system, the best method seems to be to combine standard tools for measuring key dimensions of production elements with ViDi tool, thanks to which the system is able to detect previously unforeseen defects, as well as surface defects of the structure. Thanks to this connection, the system can be more universal but at the expense of image processing time—due to the advancement of ViDi tool, the system needs more of it. A key factor in deciding how to configure vision system tools is to compare the need for image analysis accuracy with the need for vision system performance.
The findings show that while the manual configuration of the Cognex D900 vision system is effective in specific, well-defined tasks, the ViDi tools offer a more general solution capable of adapting to diverse inspection requirements. This makes the Cognex D900 vision system not only a powerful tool for specialized applications but also a versatile solution for a wide range of quality control tasks in different industrial settings.
Author Contributions
Conceptualization, J.R. and D.J.; methodology, J.W.; software, J.R., D.J. and J.W.; validation, J.R.; formal analysis, J.W.; investigation, J.R., D.J. and J.W.; writing—original draft preparation, J.W., J.R. and D.J.; writing—review and editing, J.W., D.J. and J.R. All authors have read and agreed to the published version of the manuscript.
Funding
This research received no external funding.
Institutional Review Board Statement
Not applicable.
Informed Consent Statement
Not applicable.
Data Availability Statement
The raw data supporting the conclusions of this article will be made available by the authors on request.
Conflicts of Interest
Author Jakub Worek was employed by the company Lys Fusion Poland Sp. z o.o. The remaining authors declare that the research was conducted in the absence of any commercial or financial relationships that could be construed as a potential conflict of interest.
References
- Cinal, M.; Sioma, A.; Lenty, B. The Quality Control System of Planks Using Machine Vision. Appl. Sci. 2023, 13, 9187. [Google Scholar] [CrossRef]
- Szeliski, R. Computer Vision: Algorithms and Applications; Springer: Berlin, Germany, 2022; pp. 85–151. [Google Scholar]
- Shahria, M.T.; Ghommam, J.; Fareh, R.; Rahman, M.H. Vision-Based Object Manipulation for Activities of Daily Living Assistance Using Assistive Robot. Automation 2024, 5, 68–89. [Google Scholar] [CrossRef]
- Golnabi, H.; Asadpour, A. Design and application of industrial machine vision systems. Robot. Comput.-Integr. Manuf. 2007, 23, 630–637. [Google Scholar] [CrossRef]
- Britannica, E. Available online: https://www.britannica.com/technology/computer-vision (accessed on 17 July 2024).
- Benbarrad, T.; Salhaoui, M.; Kenitar, S.B.; Arioua, M. Intelligent Machine Vision Model for Defective Product Inspection Based on Machine Learning. J. Sens. Actuator Netw. 2021, 10, 7. [Google Scholar] [CrossRef]
- Wesley, E.S.; Hairong, Q. Machine Vision; Cambridge University Press: Cambridge, UK, 2004; pp. 46–65. [Google Scholar]
- Jain, J.; Kasturi, R.; Schunck, B.G. Machine Vision; McGraw-Hill Science/Engineering/Math: New York, NY, USA, 1995; pp. 1–24. [Google Scholar]
- Davies, E.R. Computer and Machine Vision: Theory, Algorithms, Practicalities, 4th ed.; Elsevier: Amsterdam, The Netherlands, 2012; pp. 1–15. [Google Scholar]
- Beyerer, J.; León, F.P.; Frese, C. Machine Vision Automated Visual Inspection: Theory, Practice and Applications; Springer: Berlin, Germany, 2016; pp. 223–365. [Google Scholar]
- Smith, M.L.; Smith, L.N.; Hansen, M.F. The quiet revolution in machine vision—a state-of-the-art survey paper, including historical review, perspectives, and future directions. Comput. Ind. 2021, 130, 103472. [Google Scholar] [CrossRef]
- Ren, Z.; Fang, F.; Yan, N.; Wu, Y. State of the Art in Defect Detection Based on Machine Vision. Int. J. Precis. Eng. Manuf. Green Technol. 2022, 9, 661–691. [Google Scholar] [CrossRef]
- Wang, J.; Fu, P.; Gao, R.X. Machine vision intelligence for product defect inspection based on deep learning and Hough transform. J. Manuf. Syst. 2019, 51, 52–60. [Google Scholar] [CrossRef]
- Ouhami, M.; Hafiane, A.; Es-Saady, Y.; El Hajji, M.; Canals, R. Computer Vision, IoT and Data Fusion for Crop Disease Detection Using Machine Learning: A Survey and Ongoing Research. Remote Sens. 2021, 13, 2486. [Google Scholar] [CrossRef]
- Dziubek, M.; Rysiński, J.; Jancarczyk, D. Exploring the ViDiDetect Tool for Automated Defect Detection in Manufacturing with Machine Vision. Appl. Sci. 2023, 13, 11098. [Google Scholar] [CrossRef]
- Wolszczak, P.; Kotnarowski, G.; Małek, A.; Litak, G. Training of a Neural Network System in the Task of Detecting Blue Stains in a Sawmill Wood Inspection System. Appl. Sci. 2024, 14, 3885. [Google Scholar] [CrossRef]
- Chen, L.; Yang, Z.; Huang, F.; Dai, Y.; Liu, R.; Li, J. Transmission Tower Re-Identification Algorithm Based on Machine Vision. Appl. Sci. 2024, 14, 539. [Google Scholar] [CrossRef]
- Tzampazaki, M.; Zografos, C.; Vrochidou, E.; Papakostas, G.A. Machine Vision—Moving from Industry 4.0 to Industry 5.0. Appl. Sci. 2024, 14, 1471. [Google Scholar] [CrossRef]
- Torres, P.M.B. Text Recognition for Objects Identification in the Industry. In Proceedings of the International Conference of Mechatronics and Cyber-MixMechatronics—2017, ICOMECYME 2017, Lecture Notes in Networks and Systems, Bucharest, Romania, 7–8 September 2017; Springer: Cham, Switzerland, 2017; Volume 20, pp. 126–131. [Google Scholar]
- Zhang, M.; Zhang, Y.; Zhang, Q. Attention-Mechanism-Based Models for Unconstrained Face Recognition with Mask Occlusion. Electronics 2023, 12, 3916. [Google Scholar] [CrossRef]
- Calì, M.; Ambu, R. Advanced 3D Photogrammetric Surface Reconstruction of Extensive Objects by UAV Camera Image Acquisition. Sensors 2018, 18, 2815. [Google Scholar] [CrossRef] [PubMed]
- Dhiman, P.; Kaur, A.; Balasaraswathi, V.R.; Gulzar, Y.; Alwan, A.A.; Hamid, Y. Image Acquisition, Preprocessing and Classification of Citrus Fruit Diseases: A Systematic Literature Review. Sustainability 2023, 15, 9643. [Google Scholar] [CrossRef]
- Yu, Y.; Wang, C.; Fu, Q.; Kou, R.; Huang, F.; Yang, B.; Yang, T.; Gao, M. Techniques and Challenges of Image Segmentation: A Review. Electronics 2023, 12, 1199. [Google Scholar] [CrossRef]
- Singh, J.; Thakur, D.; Ali, F.; Gera, T.; Kwak, K.S. Deep Feature Extraction and Classification of Android Malware Images. Sensors 2020, 20, 7013. [Google Scholar] [CrossRef]
- Konstantinidis, F.K.; Mouroutsos, S.G.; Gasteratos, A. The Role of Machine Vision in Industry 4.0: An automotive manufacturing perspective. In Proceedings of the 2021 IEEE International Conference on Imaging Systems and Techniques (IST), Kaohsiung, Taiwan, 24–26 August 2021. [Google Scholar]
- Pérez, L.; Rodríguez, Í.; Rodríguez, N.; Usamentiaga, R.; García, D.F. Robot Guidance Using Machine Vision Techniques in Industrial Environments: A Comparative Review. Sensors 2016, 16, 335. [Google Scholar] [CrossRef]
- Li, L.; Ota, K.; Dong, M. Deep Learning for Smart Industry: Efficient Manufacture Inspection System With Fog Computing. IEEE Trans. Ind. Inform. 2018, 14, 4665–4673. [Google Scholar] [CrossRef]
- Javaid, M.; Haleem, A.; Singh, R.P.; Rab, S.; Suman, R. Exploring impact and features of machine vision for progressive industry 4.0 culture. Sens. Int. 2022, 3, 100132. [Google Scholar] [CrossRef]
- Cognex. Available online: https://www.cognex.com/en-pl/what-is/machine-vision/applications (accessed on 29 July 2024).
- Keyence. Available online: https://www.keyence.eu/ss/products/vision/application-selecting/contents.jsp?category_id=c01 (accessed on 25 July 2024).
- Cognex. Available online: https://www.cognex.com/industries/consumer-products/packaging/automated-glass-vial-counting (accessed on 25 July 2024).
- Cognex. Available online: https://www.cognex.com/industries/consumer-products/material-handling/quality-inspection (accessed on 25 July 2024).
- Cognex. Available online: https://www.cognex.com/industries/consumer-products/packaging/personal-hygiene-product-packaging-inspection (accessed on 25 July 2024).
- Omron. Available online: https://www.ia.omron.com/products/family/3149/ (accessed on 25 July 2024).
- Sick. Available online: https://www.sick.com/il/en/catalog/products/machine-vision-and-identification/fixed-mount-barcode-scanners/clv62x/c/g79824 (accessed on 25 July 2024).
- Kuka. Available online: https://www.kuka.com/en-us/products/robotics-systems/software/application-software/kuka_visiontech (accessed on 25 July 2024).
- Malamas, E.N.; Petrakis, E.; Zervakis, M.; Petit, L.; Legat, J.-D. A survey on industrial vision systems. Appl. Tools. Image Vis. Comput. 2003, 21, 171–188. [Google Scholar] [CrossRef]
Disclaimer/Publisher’s Note: The statements, opinions and data contained in all publications are solely those of the individual author(s) and contributor(s) and not of MDPI and/or the editor(s). MDPI and/or the editor(s) disclaim responsibility for any injury to people or property resulting from any ideas, methods, instructions or products referred to in the content. |
© 2024 by the authors. Licensee MDPI, Basel, Switzerland. This article is an open access article distributed under the terms and conditions of the Creative Commons Attribution (CC BY) license (https://creativecommons.org/licenses/by/4.0/).