Article

Performance Analysis of Pile Group Installation in Saturated Clay

1
Key Laboratory of High-Performance Ship Technology, Ministry of Education, Wuhan University of Technology, Wuhan 430070, China
2
Department of Naval Architecture, Ocean, and Structural Engineering, School of Naval Architecture, Ocean and Energy Power Engineering, Wuhan University of Technology, Wuhan 430063, China
3
School of Road and Track, Hubei Communications Technical College, Wuhan 430079, China
4
Guangdong Yudean Zhuhai Offshore Wind Power Co., Ltd., Zhuhai 519040, China
*
Author to whom correspondence should be addressed.
These authors contributed equally to this work.
Appl. Sci. 2024, 14(18), 8321; https://doi.org/10.3390/app14188321
Submission received: 8 August 2024 / Revised: 10 September 2024 / Accepted: 11 September 2024 / Published: 15 September 2024
(This article belongs to the Section Marine Science and Engineering)

Abstract

:
In offshore pile engineering, the installation of jacked piles generates compaction effects within soil, thus further affecting previously installed adjacent piles. This study proposes a three-dimensional numerical model for pile group installation, soil consolidation, and loading analysis. Subsequently, the effect of pile spacing and pile length-to-diameter ratio on the deformation, internal forces, and vertical bearing capacity of adjacent piles are investigated. The results indicate that with an increase in pile center distance, the peak lateral displacement of the adjacent piles decreases, whereas the peak vertical displacement increases. As the pile length-to-diameter ratio increases, the peak vertical and lateral displacements of the adjacent piles are enhanced. In addition, the peak axial force of the adjacent piles initially decreases and then increases with the penetration depth of the subsequent pile, whereas the peak bending moment initially increases and then decreases. The vertical bearing capacity of the subsequent pile is significantly superior to that of the adjacent piles. Therefore, the effects of pile installation on adjacent piles should be included in pile engineering. The impact of the subsequent pile installation on the bearing capacity of adjacent piles can be significantly reduced by increasing the pile center distance and pile length-to-diameter ratio. The findings provide useful guidance for pile group engineering.

1. Introduction

Pile foundation systems are widely used in infrastructure construction to transfer loads to deeper, more stable soil layers to support superstructures. Among various pile installation methods, jacked piles are commonly used due to their low noise and low vibration [1,2]. In the process of pile installation, saturated clay, characterized by high compressibility and low permeability, experiences significant displacement and excess pore pressure (EPP) due to compaction effects [3,4,5], which cannot be avoided [6,7] and affect the safety and bearing capacity of previously installed adjacent piles (referred to as adjacent piles). Therefore, investigating the impact of subsequent pile installation on adjacent piles can provide guidance for the design and construction of pile group engineering.
Although the response of adjacent piles can be accurately analyzed through model tests [8] and field tests [9,10], these methods require substantial investment in experimental equipment and time. In contrast, theoretical methods and numerical studies have been widely adopted to analyze the impact of subsequent pile installation on adjacent piles. Theoretical research was firstly adopted by Bishop et al. [11], who proposed the cavity expansion method to solve the problems of metal indentation. The method has been further developed and extended by various scholars [12,13,14,15] and has been widely used in the mechanical analysis of soil behavior after pile installation. It should be noted that the cavity expansion method typically simplifies three-dimensional problems into two-dimensional ones, ignoring the friction contact between the pile and soil during installation, which may result in inaccurate calculations of soil stress and EPP [16]. Some researchers have conducted theoretical studies on the response of existing adjacent piles induced by pile installation using the two-stage method [17,18,19], namely, (a) soil displacement induced by pile installation and (b) the impact of soil displacement on existing piles. It is important to note that theoretical studies often ignore changes in pore pressure within the soil during pile installation. Moreover, theoretical studies only consider the effect of pile installation on adjacent existing piles and are not applicable for newly installed piles. Unlike existing piles, newly installed piles have not undergone the consolidation process of the surrounding soil. Therefore, the impact of subsequent pile installation on newly installed piles may be more significant.
Given the simplifications inherent in theoretical solutions, researchers have adopted numerical methods to simulate the entire process of ground soil response due to pile installation. Pile installation is a large deformation problem for foundation soils, and methods such as the Arbitrary Lagrangian–Eulerian (ALE) method and the Discrete Element Method (DEM) can effectively handle large soil deformations. Consequently, these methods have been widely used in the pile installation simulations [20,21,22,23]. However, most current research has focused on the effects of single pile installation on soil, without considering the installation process of pile groups.
Some scholars have proposed the multi-stage Eulerian–Lagrangian (MSEL) technique to analyze the installation of pile groups [24,25]. The MSEL technique treats piles as Lagrangian elements with infinite rigidity, thereby neglecting pile deformation and soil–pile interaction and focusing only on the soil response. Tho et al., Jayasinghe et al., and Zhou et al. [26,27,28] studied the response of existing adjacent piles to the installation of subsequent piles using numerical models. It is important to note that existing piles are usually pre-embedded in the soil, without considering the installation process of pile groups and its effects on the bearing capacity of the group. Su et al. [21] demonstrated that installation effects significantly impact pile bearing capacity, with jacked piles showing higher capacity compared to wished-in-place piles. Therefore, the installation of pile groups not only induces deformation and internal forces in adjacent piles but also affects their bearing performance.
This study utilized the FLAC3D (version, 7.0) finite difference program to simulate the entire process of jacked pile installation. Subsequently, the radial displacement and EPP induced by single pile installation, as well as soil consolidation after pile installation, were analyzed and validated. Based on these analyses, a separated auxiliary tube method was proposed to simulate the installation of pile groups. Additionally, the effects of pile center distance (S) and length-to-diameter ratio (L/De) on the displacement, internal forces, and vertical bearing capacity of adjacent piles were investigated.

2. Numerical Modeling and Validation

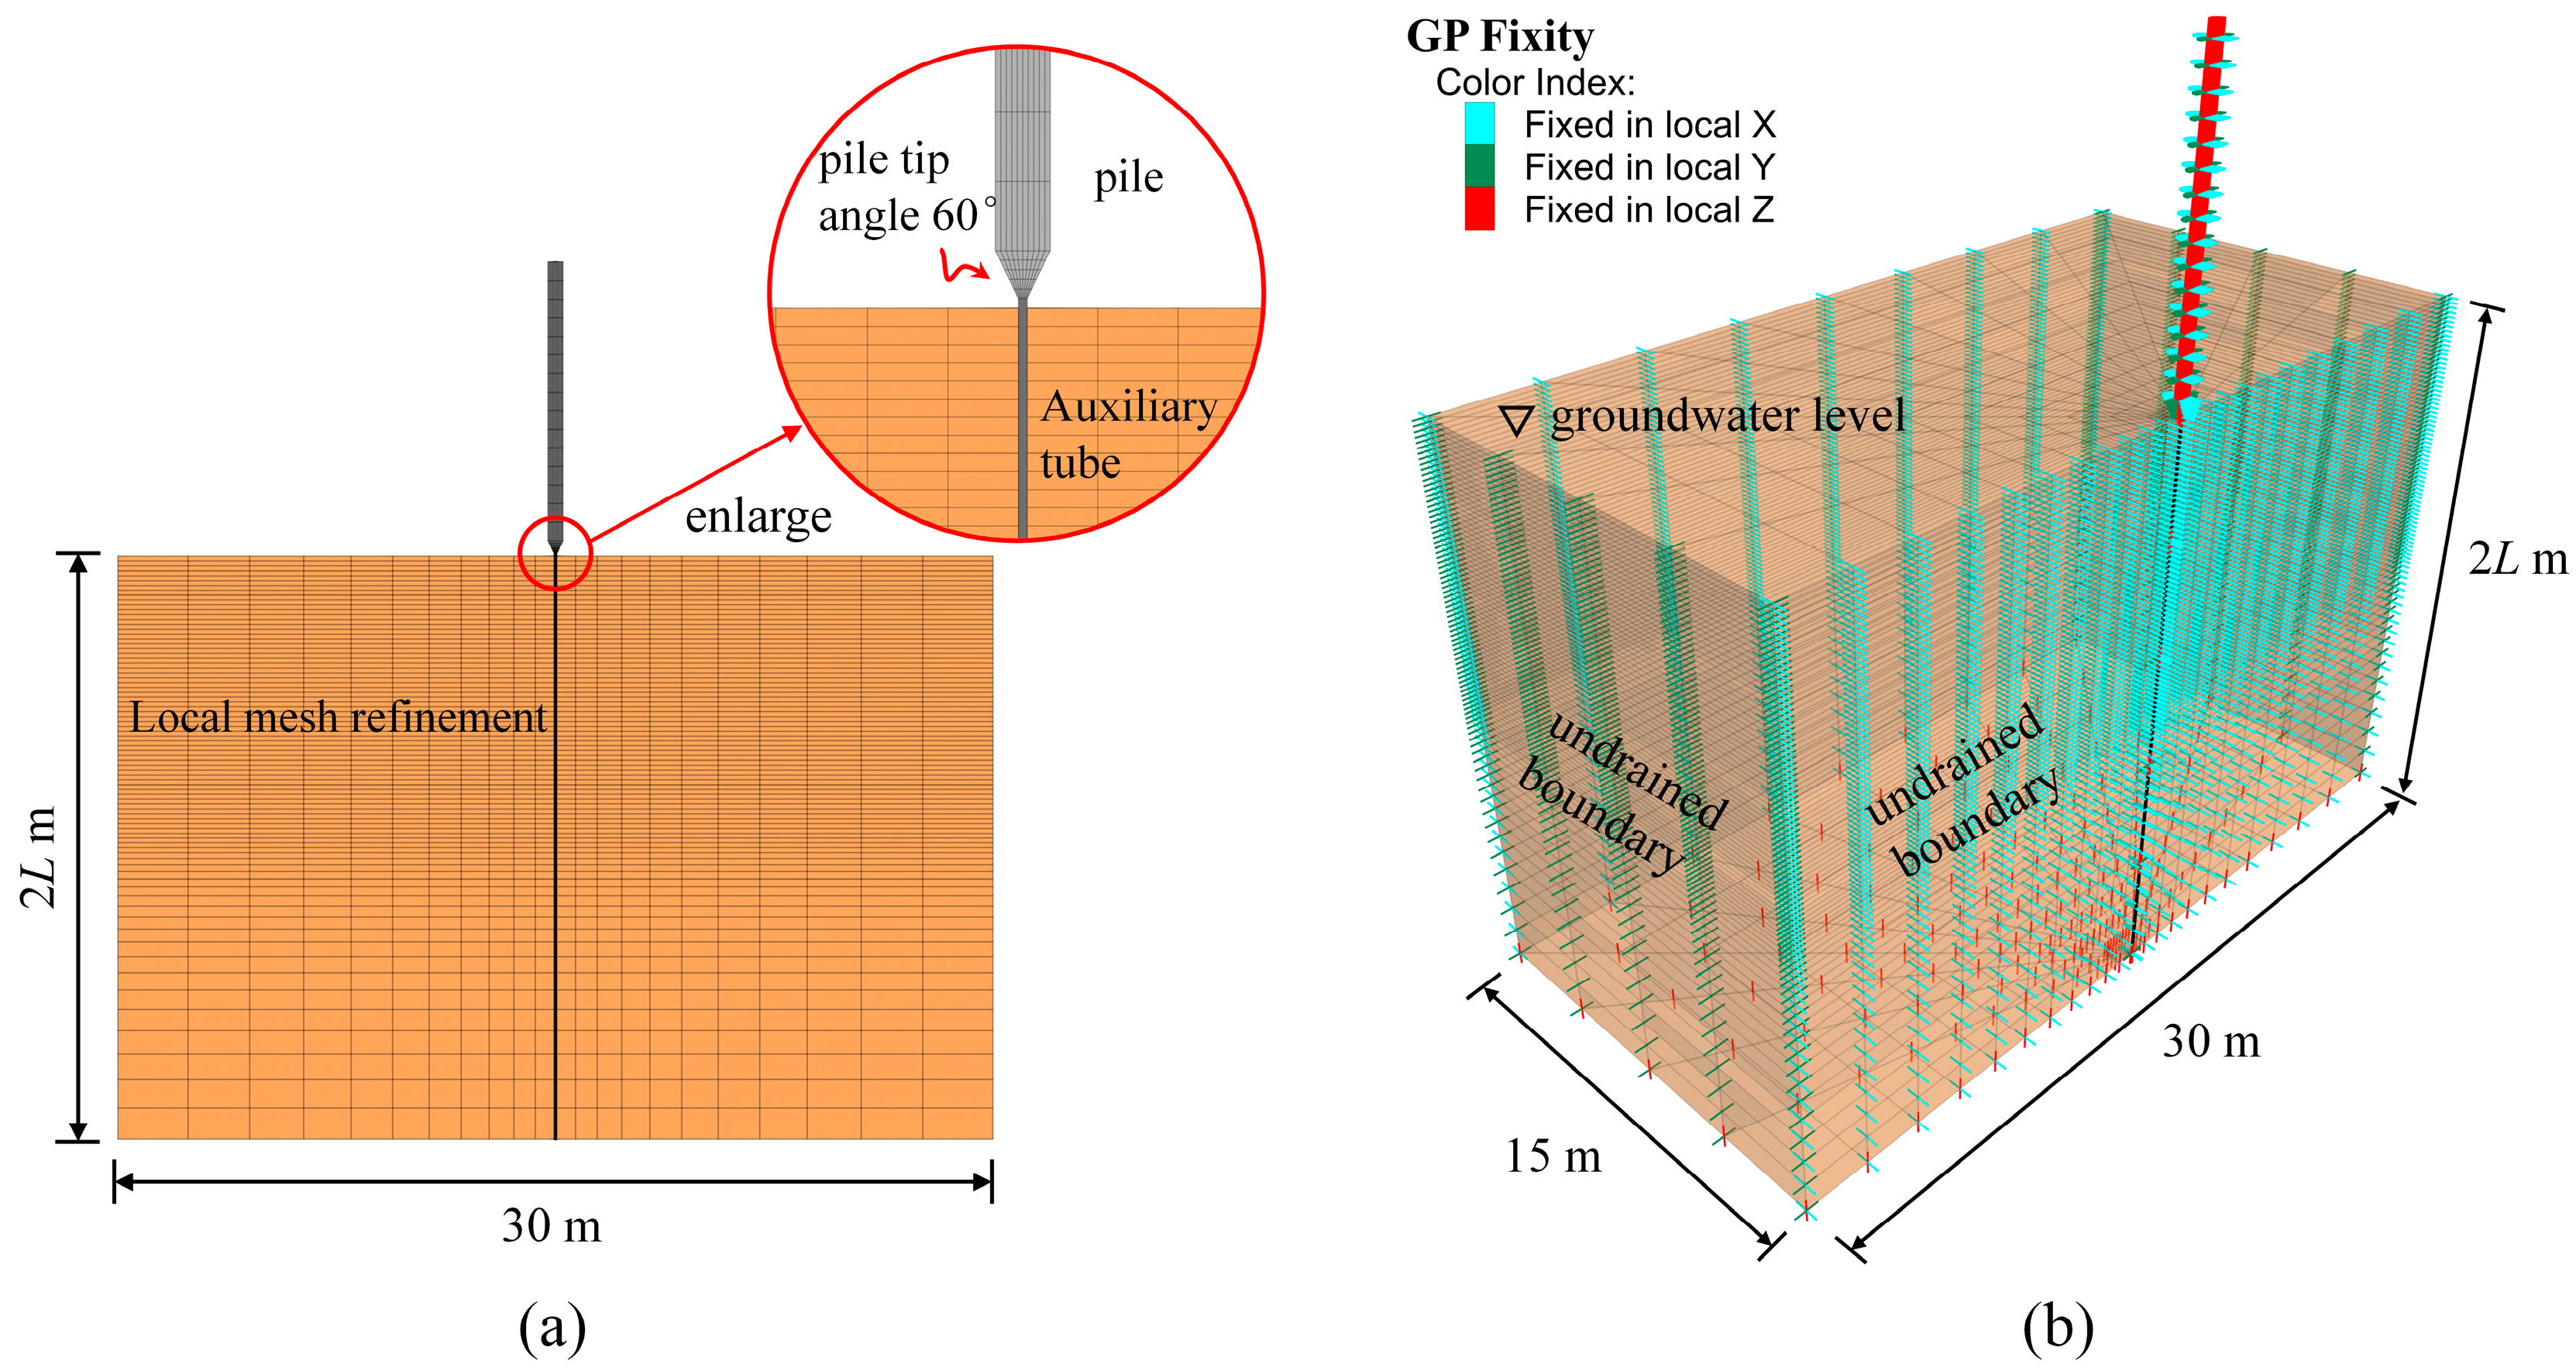
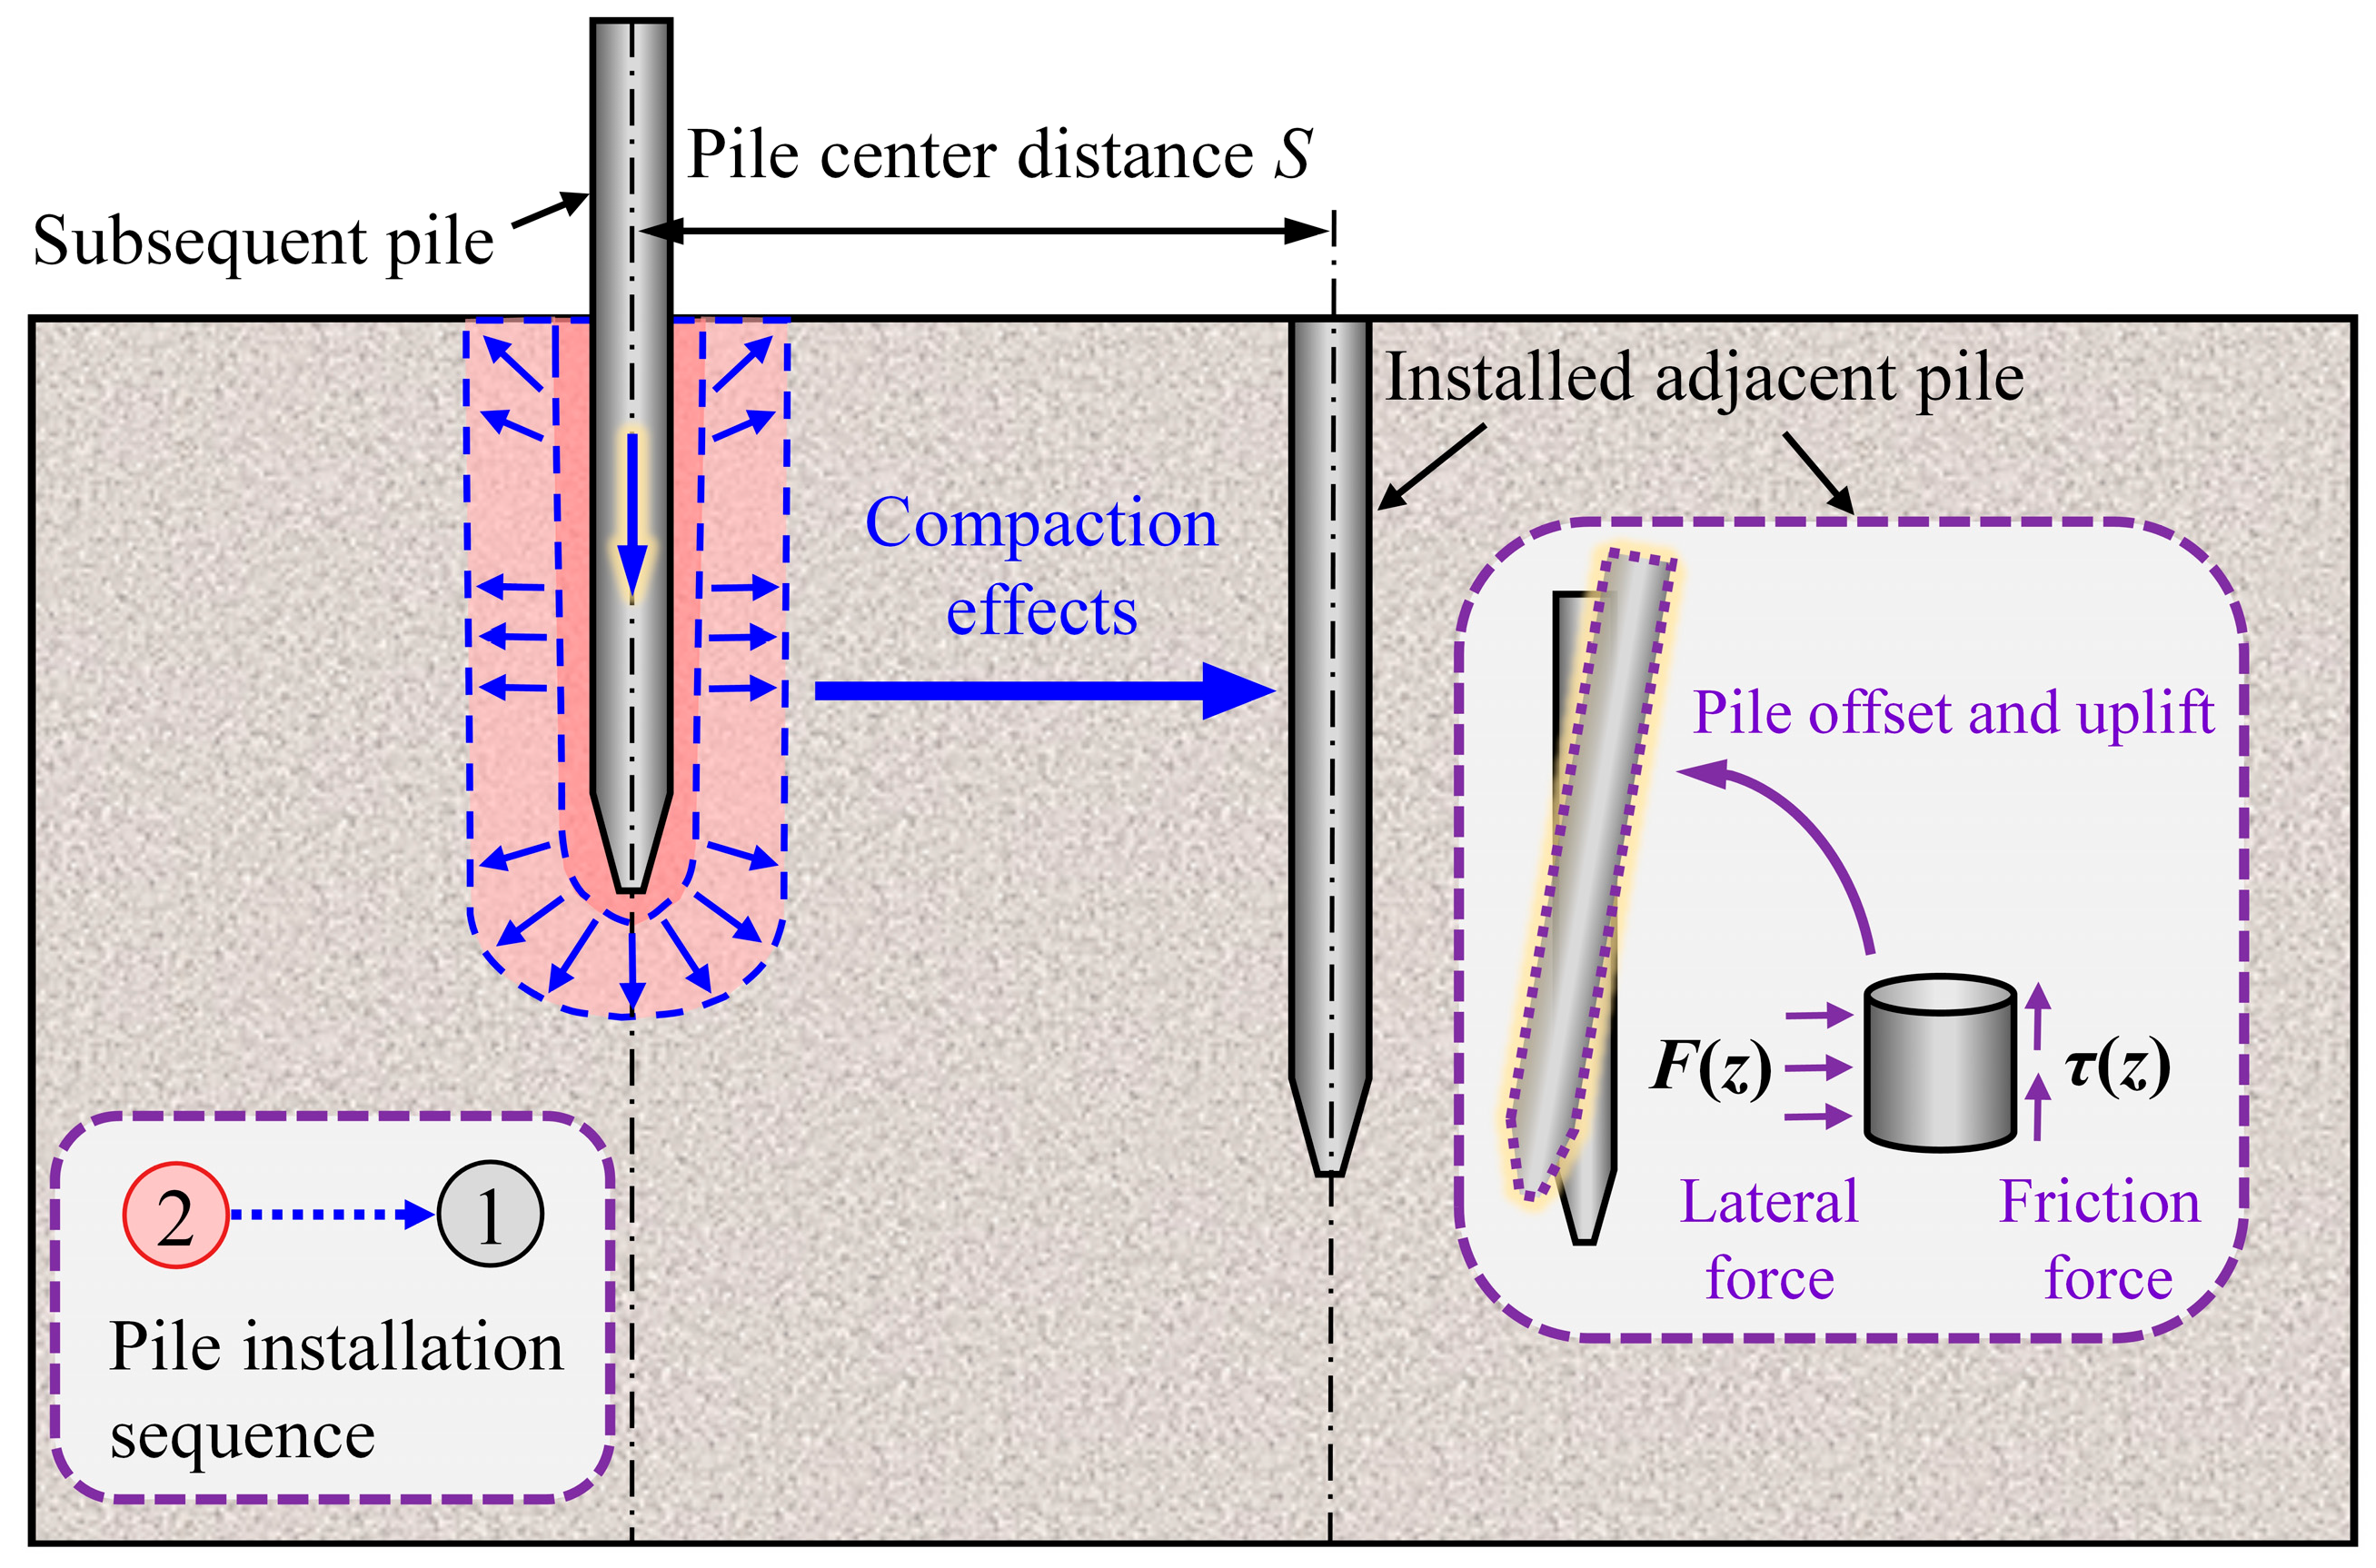
2.1. Single Pile Installation Model

In this study, the two-pile group installation and soil consolidation process are simulated using a numerical modeling technique. Firstly, the proposed method is applied to the numerical simulation of single pile installation in this section, and the reliability of the numerical model is verified by comparison with the single pile test results. The simulation process involves four stages: (1) stress equilibrium: initialization of soil stress and pore pressure; (2) pile installation: using undrained analysis, a downward velocity is applied to the pile to drive it to the specified depth; (3) consolidation analysis: performing coupled fluid–solid drainage analysis with decoupling through the master–slave process method; and (4) static load test: undrained analysis is used to obtain the pile’s load–displacement curve through the displacement method.
To eliminate the boundary effects, Dong et al. [29] proposed that the boundary distance from the pile center should be greater than 15 times the pile diameter in the numerical model. In this study, the model dimension is set to be 30 m × 15 m × 2L (length × width × height, where L is the pile length). Considering the computational convergence and accuracy, the horizontal mesh size should not be less than 0.5 to 1 times the pile diameter, whereas the vertical mesh size can be locally refined according to the pile length. The geometry mesh is illustrated in Figure 1a. By virtue of symmetry, only half of the pile–soil system was modeled. The boundary conditions of the model are shown in Figure 1b. For the mechanical boundaries, the vertical displacement of the bottom boundary and the horizontal displacement of the right-hand boundary are restrained. For the seepage boundaries, the ground surface is permeable, the lateral boundaries are 60 times the pile diameter away from the pile center, and the pore pressure at the edges of the numerical model can be assumed to be constant; thus, the “no permeability” boundary conditions are applied at the lateral boundaries of the numerical model.
A study by Carter et al. [30] indicates that the expansion of the foundation soil from a small cavity and from zero are essentially identical in terms of computational accuracy. Therefore, an auxiliary tube penetrates the soil downwards and the pile slides after the tube with constant speed. The friction contact between the installation pile and soil can be established during pile installation. Similar approaches have been reported in studies by Henke and Grabe, Konkol and Bałachowski, and Cui et al. [16,31,32]. Thus, the equivalent pile diameter can be determined as follows:
D e 2 = d e = d 2 d 0 2
where De represents the equivalent diameter of the pile, de denotes the equivalent radius of the pile, and d and d0 represent the radius of the pile and the radius of the auxiliary tube, respectively.
In this section, the modeling of a single pile encompasses three stages: initial geostatic stress, installation, and consolidation. During the first stage, soil gravity is represented by a body force, and initial stress and pore pressure are established using a geostatic step. Subsequently, a vertical velocity of 5 × 10⁻⁵ m/step is applied to the pile to simulate the installation process. The pile and auxiliary tube have radii of 0.25 m and 0.04 m, respectively, with a pile tip angle of 60°. In this study, the pile exhibits linear elastic behavior, while the saturated soil adheres to the Mohr–Coulomb criterion. The material parameters for the pile and soil are provided in Table 1. The soil–pile interface is modeled using frictional contact elements; when the shear stress on the contact surface exceeds the maximum allowable shear stress, separation and slippage between the pile and soil occur. The contact surface parameters have a significant effect on the pile bearing capacity. In this paper, the contact surface parameters were calibrated using the centrifuge test of Li et al. [33]; the specific parameters are shown in Table 2. The pore water in the soil is treated as an isotropic fluid, with the relevant fluid calculation parameters listed in Table 3. The consolidation stage involves a coupled analysis of pore water and soil, utilizing the master–slave method to decouple the fluid–solid interaction. In this approach, the fluid calculation is the master process, while the mechanical calculation serves as the slave process.

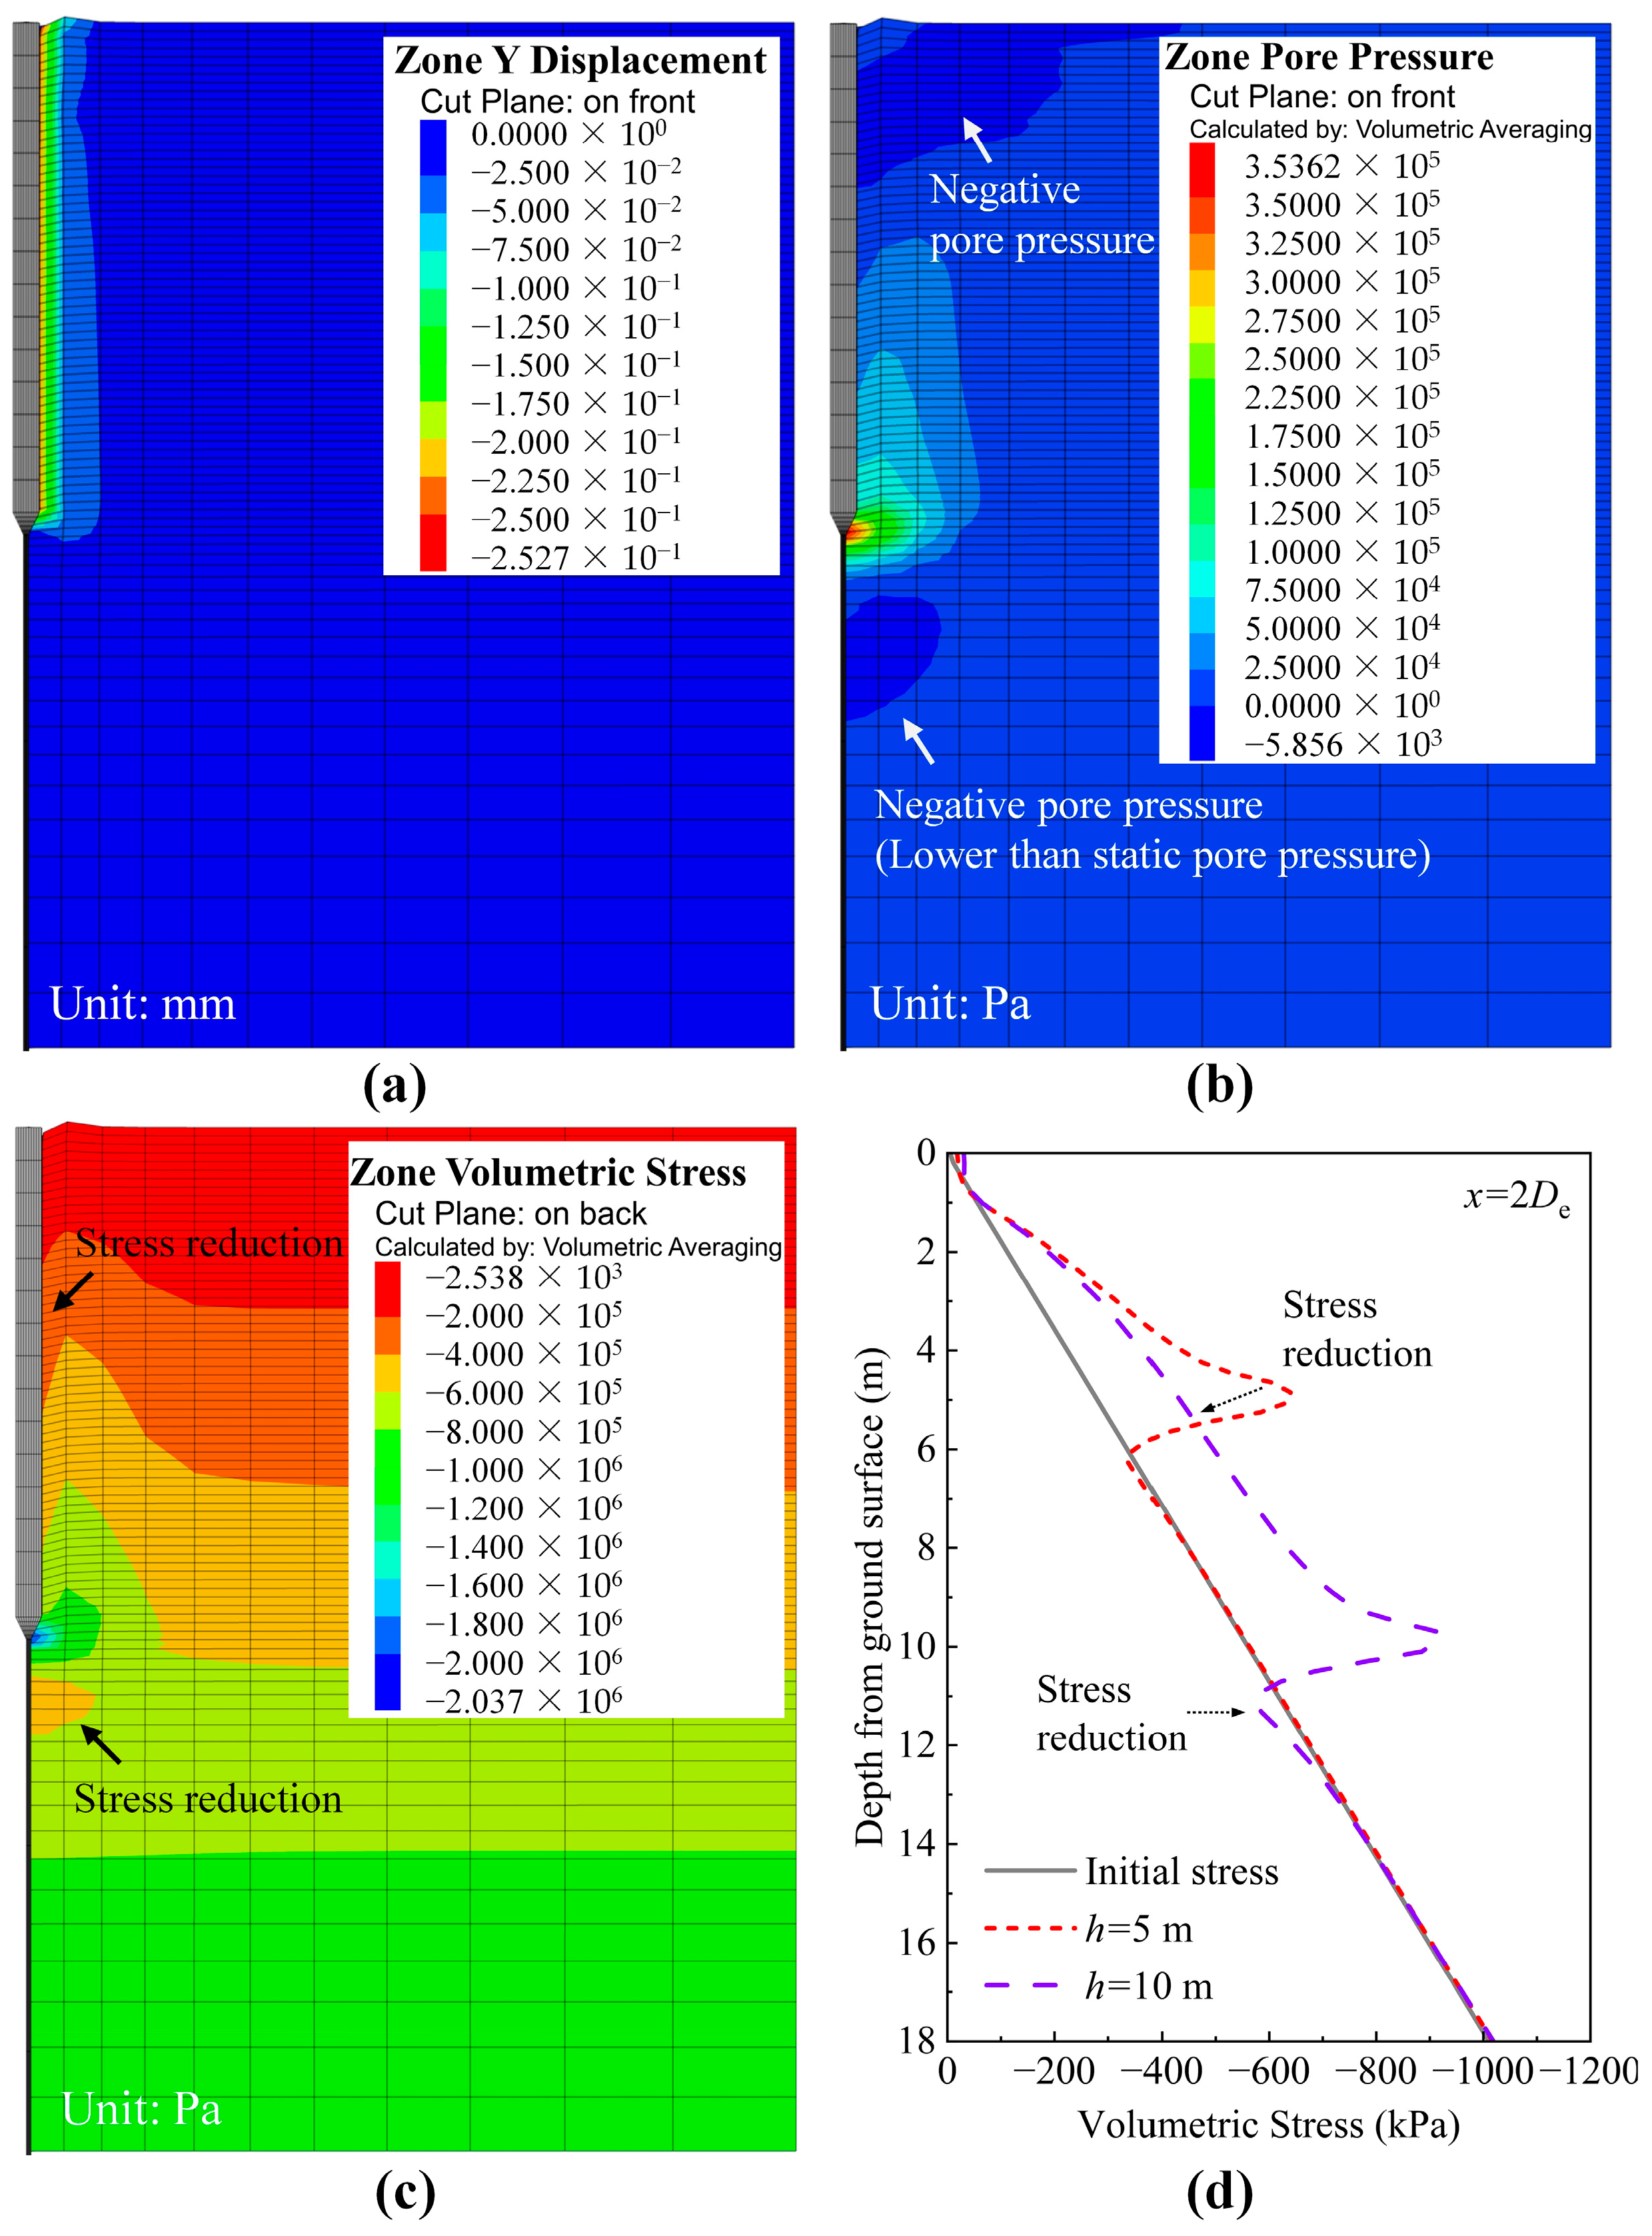
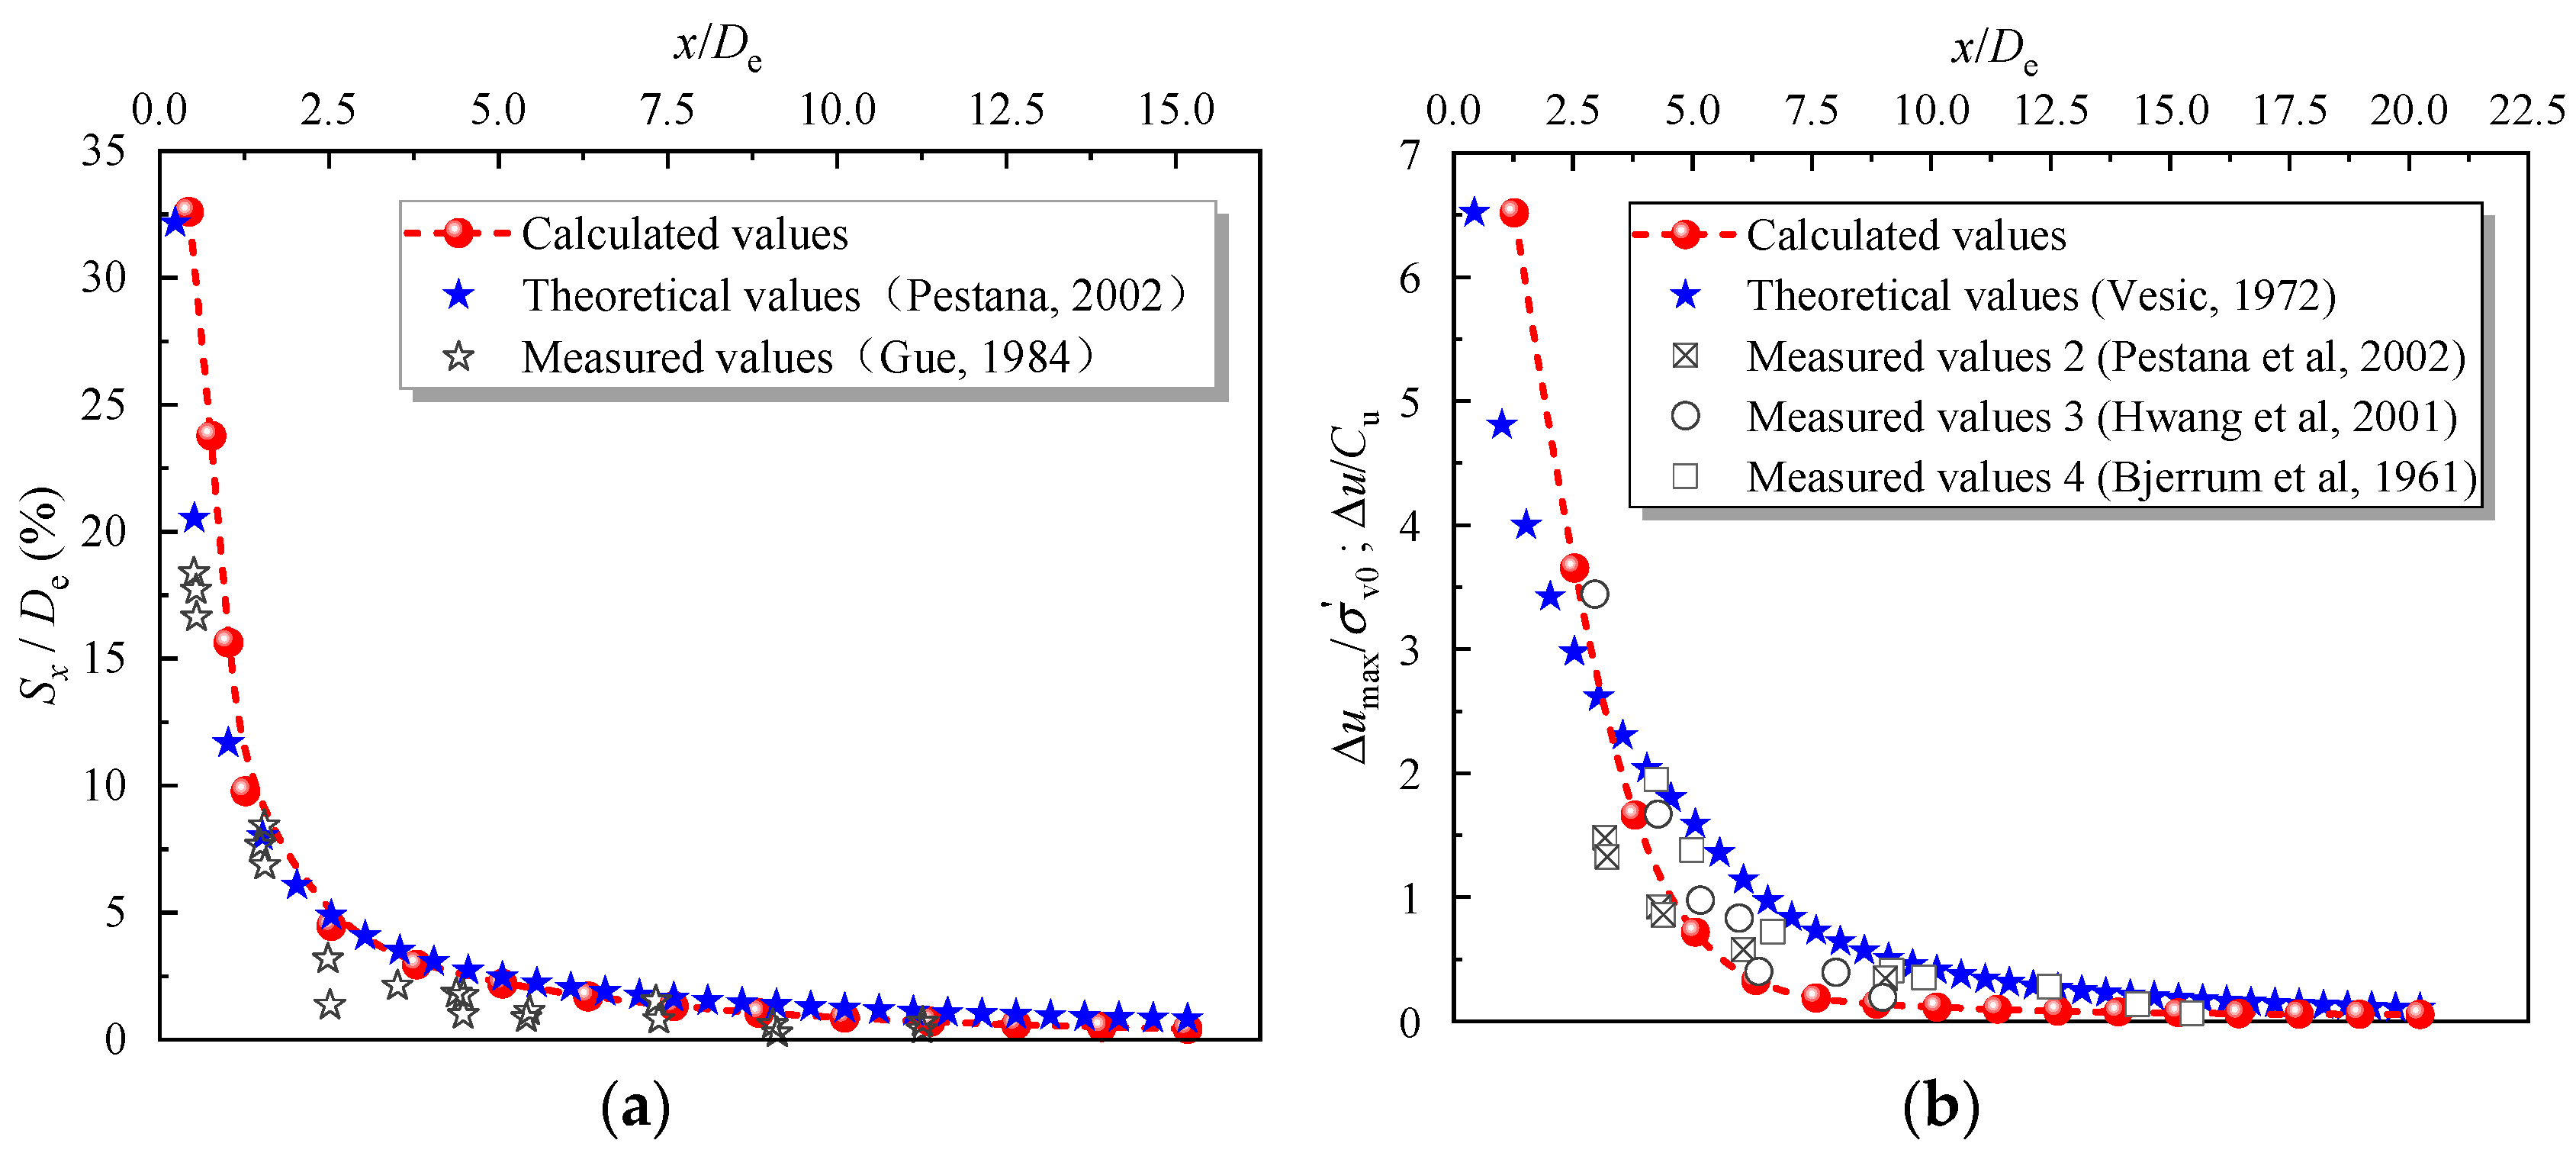
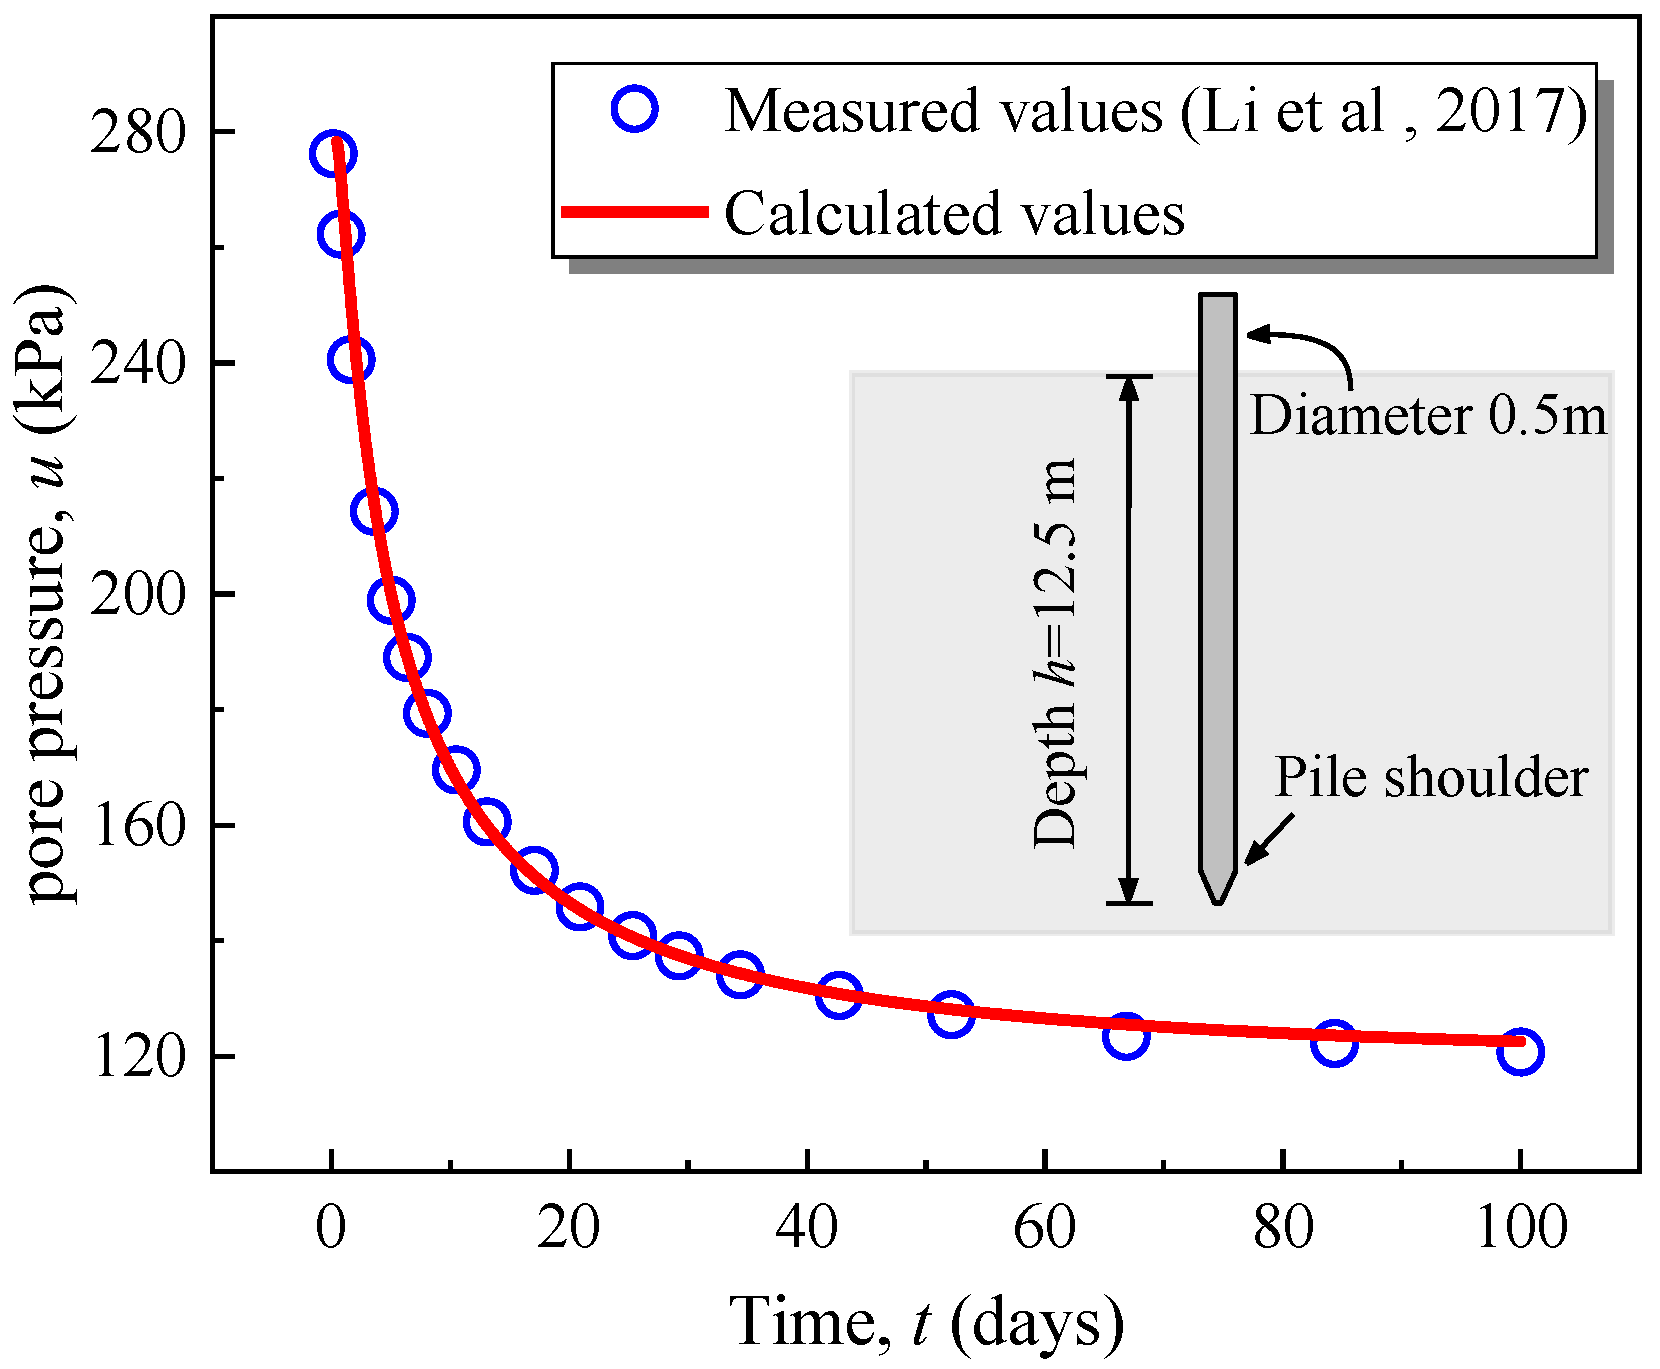
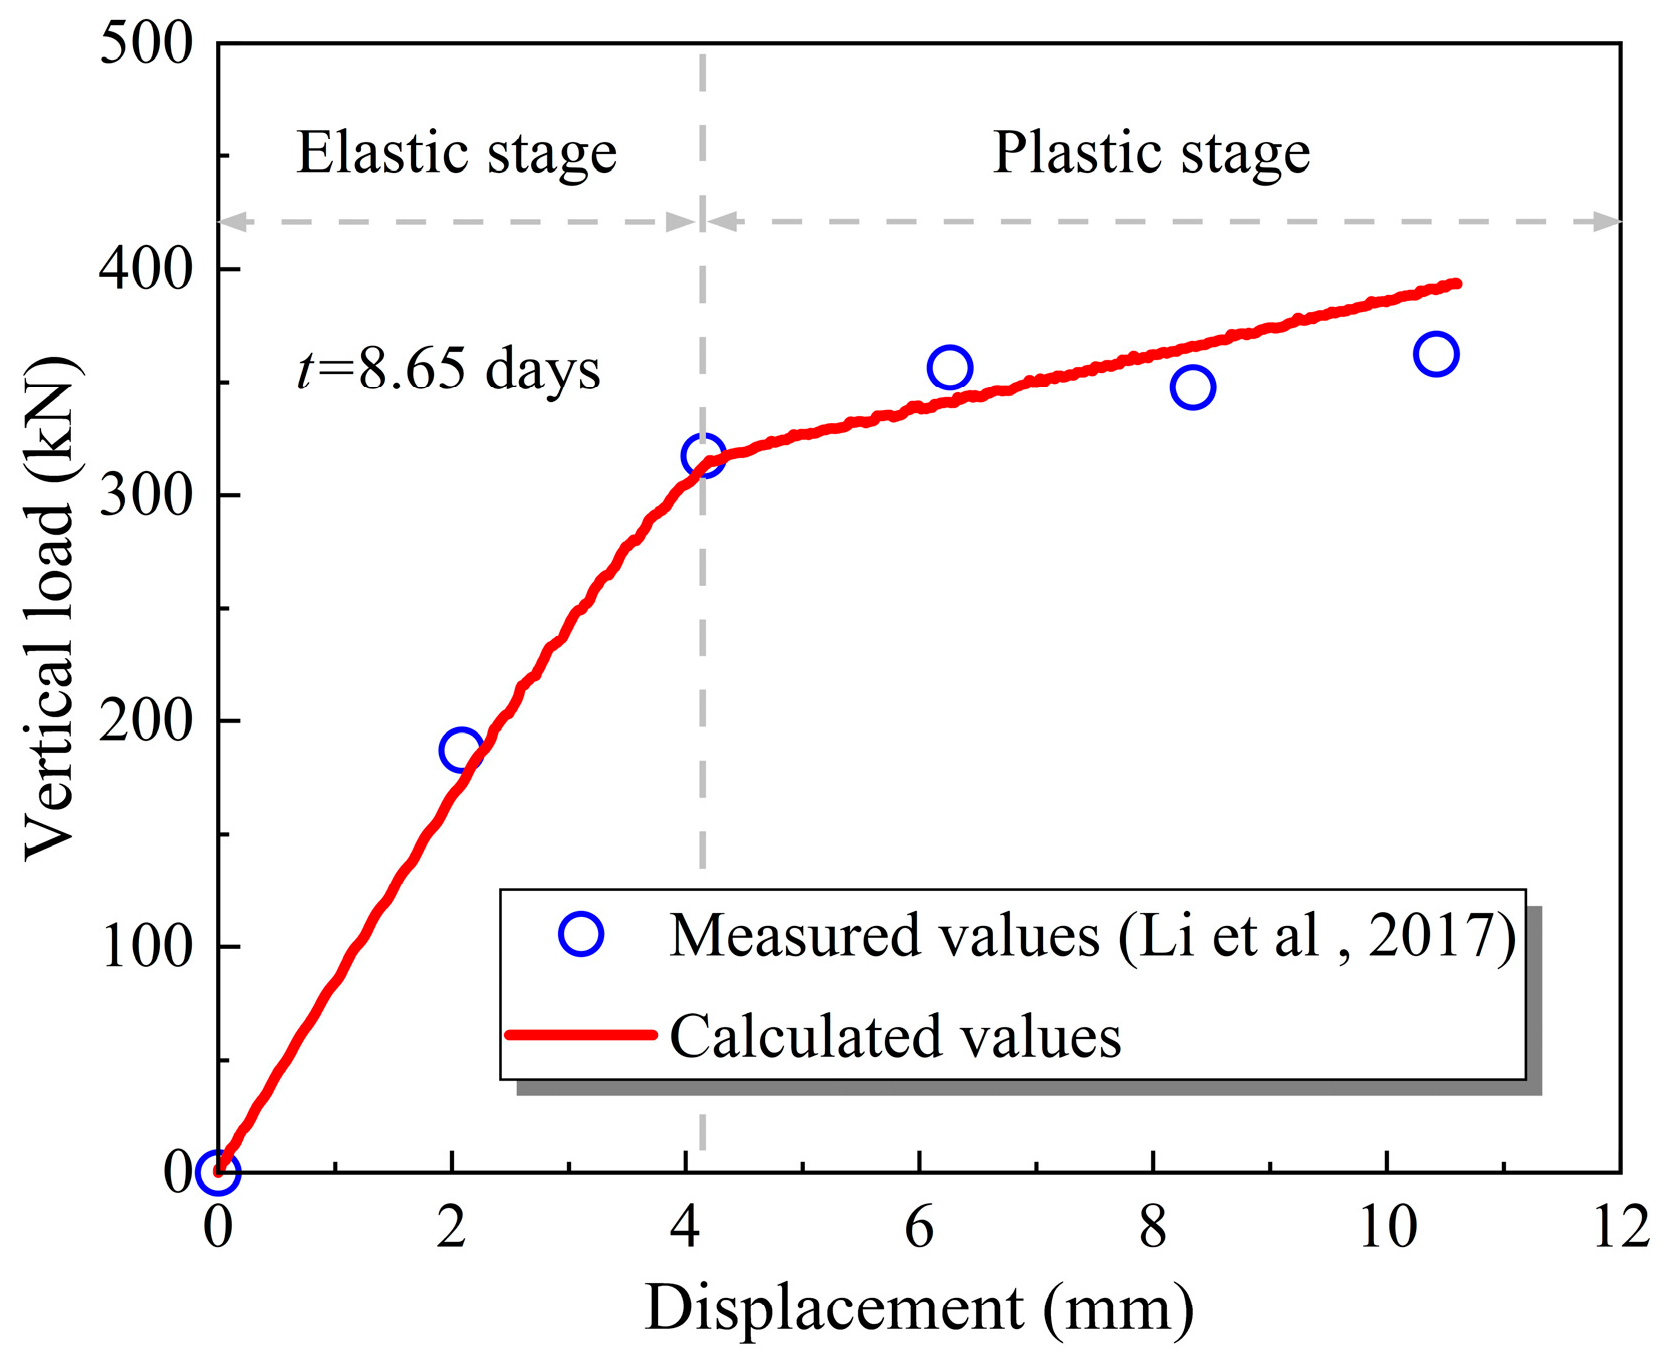
2.2. Model Validation

During the installation of the pile, the compression and shearing of the pile induce significant soil deformation and generate notable EPP. Figure 2a,b show the distribution of radial displacement and EPP in the soil when a single pile penetrates to a depth of 10 m. The results indicate that radial displacement is concentrated near the pile and decreases rapidly with increasing radial distance. The EPP is mainly concentrated around the pile tip, while the pore pressure at the top and bottom of the pile is lower than the static pore pressure, resulting in the observation of negative pore pressure. A similar pore pressure distribution pattern was also reported by Sabetamal et al. [34]. Correspondingly, stress reduction areas are also observed at the top and bottom of the pile, as illustrated in Figure 2c,d. As demonstrated by Yang et al. [35], tensile-induced dilation of the soil leads to a reduction in volumetric stress (or strain), with tensile stress being positive in FLAC3D. Hence, it can be inferred that the occurrence of stress reduction and negative pore pressure around the pile top and bottom are caused by tensile-induced dilation of the soil under undrained conditions. Additionally, Figure 2d illustrates the variation in soil volumetric stress at pile penetration depths of 5 m and 10 m. The results show that the volumetric stress at the pile bottom is lower than the initial stress, while the volumetric stress around the pile top decreases as the penetration depth increases.
From the perspective of cavity expansion theory, the expansion of a cylindrical cavity is typically simplified to a plane problem, where soil displacement varies only with radial distance. Although theoretical solutions ignore the influence of depth, they provide a good approximation for estimating the radial displacement of soil caused by pile installation. According to Pestana et al. [3], the radial displacement of soil at a distance x from the center of the cylindrical cavity is given by
S x = d e 1 + x / d e 2 x / d e
where Sx is the radial displacement of soil at a distance x from the cylindrical cavity center point, and de is the equivalent pile radius.
The variation in EPP within the soil caused by single pile installation can be calculated using the formula derived by Vesić [12] based on cylindrical cavity expansion theory:
u C u = 2 ln R p x + 1.733 A 0.578 ,   x R p ( 1.733 A 0.578 ) R p x 2 ,   x > R p
R p d e = E 2 ( 1 + ν ) C u
in which Rp is the radius of the soil plastic zone, de is the equivalent radius of the pile, E is the elastic modulus of the soil, ν is the Poisson’s ratio of the soil, and A is the pore pressure coefficient, with A ranging from 0.7 to 1.3 for normally consolidated soil and from 1.5 to 2.5 for sensitive soil. In this study, the soil is normally consolidated, so A is taken as 1.2, and Cu is the undrained shear strength of the soil. Since the undrained shear strength of saturated clay shows an approximately linear or piecewise linear relationship with depth, Cu is taken as Cu = 22.5 + 2.5 z in this study.
In Figure 3a, the y-axis stands for the normalized radial soil displacement by the pile diameter. It can be observed that the computed curve agrees well with the theoretical and measured curves: the radial soil displacement decreases rapidly with increasing radial distance, and the influence region for the radial soil displacement is 0~10 De. As shown in Figure 3b, the EPP normalized by the effective vertical stress ( σ v 0 ) decreases rapidly with increasing radial distance. The EPP obtained from the analytical method is generally higher than the measured data. These results may be due to the theoretical solution not including the pile–soil friction effect. The influence region is 0~10 De. However, the computed EPP obtained from the proposed numerical method aligns well with the measured values, thus further validating that the established numerical model is feasible for simulating the pile installation process.
As soil consolidation progresses, the EPP dissipates gradually over time. This study calibrates the actual seepage time using the fluid bulk modulus, with the modified fluid bulk modulus denoted as K f a . Li et al. [33] measured the dissipation of EPP around the pile shaft after installation and obtained the pile’s load–displacement (L-D) curve through centrifuge testing. The material parameters for the calculated model are consistent with centrifuge tests, as listed in Table 4. As shown in Figure 4, the EPP decreases over time, and the calculated results are in good agreement with the measured data. Figure 5 presents the L-D curve of the pile after 8.65 days of consolidation, showing distinct elastic and plastic stages consistent with the measured trend. Therefore, this method is suitable for analyzing the installation, consolidation, and bearing capacity of jacked piles.

3. Two-Pile Group Analyses

In geotechnical engineering, jacked piles are generally installed in a continuous sequence, where the installation of a subsequent pile (the second pile) exerts lateral pressure and upward frictional force on the adjacent pile (the first pile), causing the adjacent pile to experience offset and uplift, as illustrated in Figure 6. Additionally, during the installation of the subsequent pile, the auxiliary tube can increase the resistance of the adjacent pile. Therefore, in subsequent analyses, the influence of the auxiliary tube on the adjacent pile should be excluded.
In this study, the effects of subsequent pile installation on adjacent piles are explored. The separate auxiliary tube method is proposed for investigating the effect of adjacent piles on the installation of subsequent piles. In addition, the influence of L/De and pile length on the responses of adjacent piles are further discussed.
The simulation of two-pile group installation and consolidation was typically carried out in three stages: (1) In the installation of the adjacent pile, both the pile and the auxiliary tube are set as rigid and moving downwards with a constant speed. (2) The auxiliary tube is separated from the pile, and the rigid body constraints on the pile are removed after the installation process of Pile 1, as illustrated in Figure 7. (3) The installation of the subsequent pile occurs. It should be noted that the installation of the two-pile group is continuous, so the intervening consolidation between Pile 1 and Pile 2 is excluded in this study.

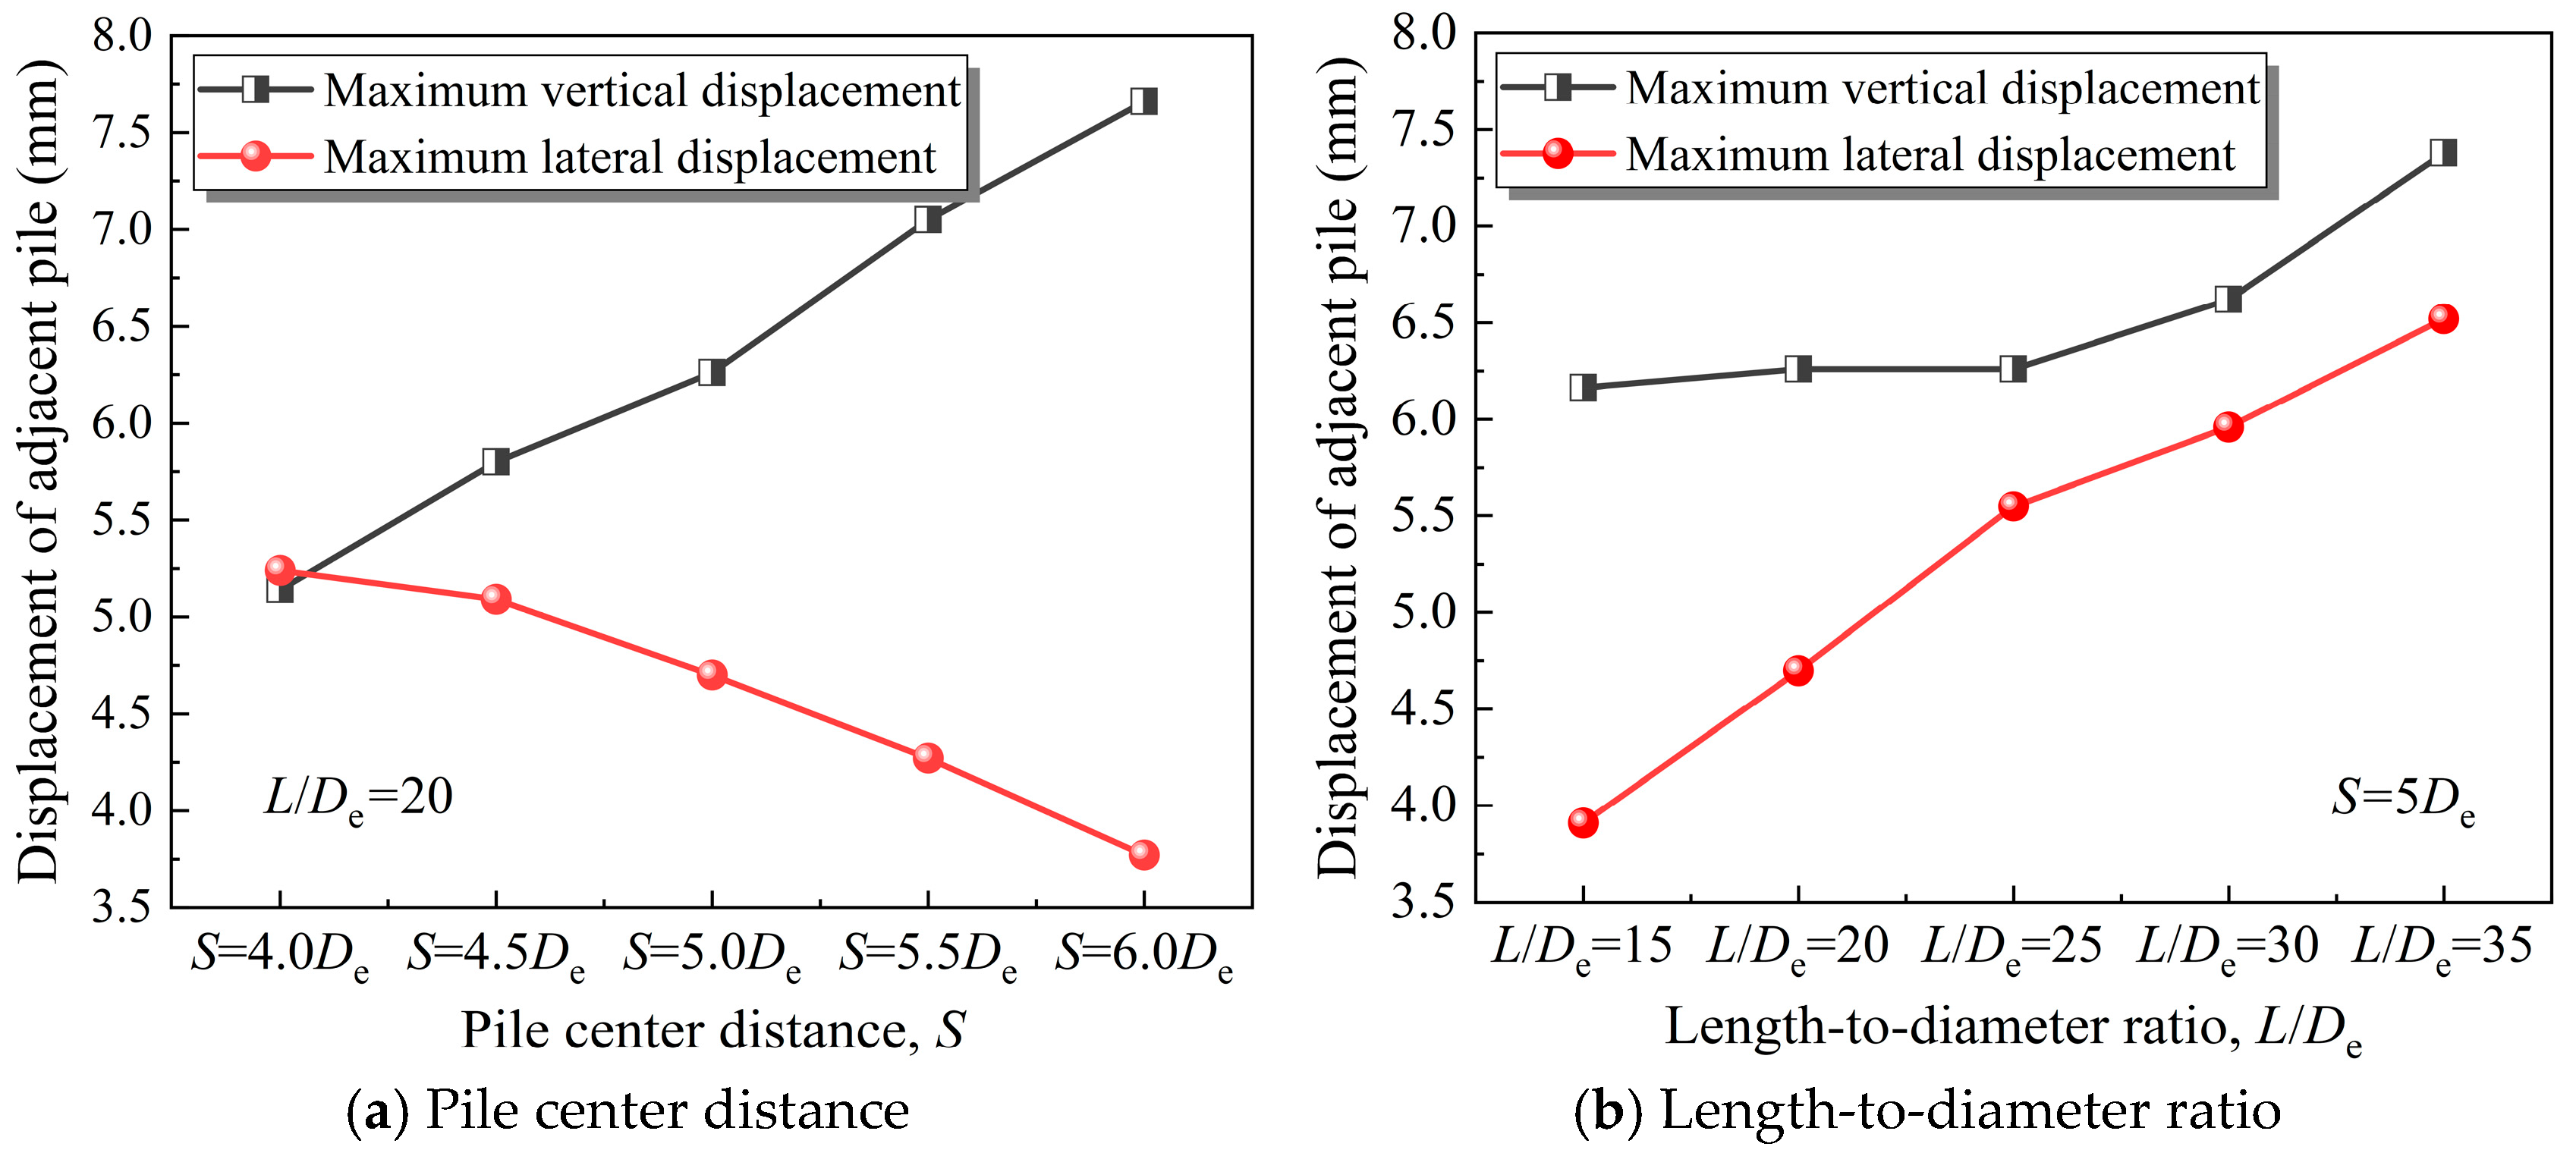
3.1. Displacement of Adjacent Pile

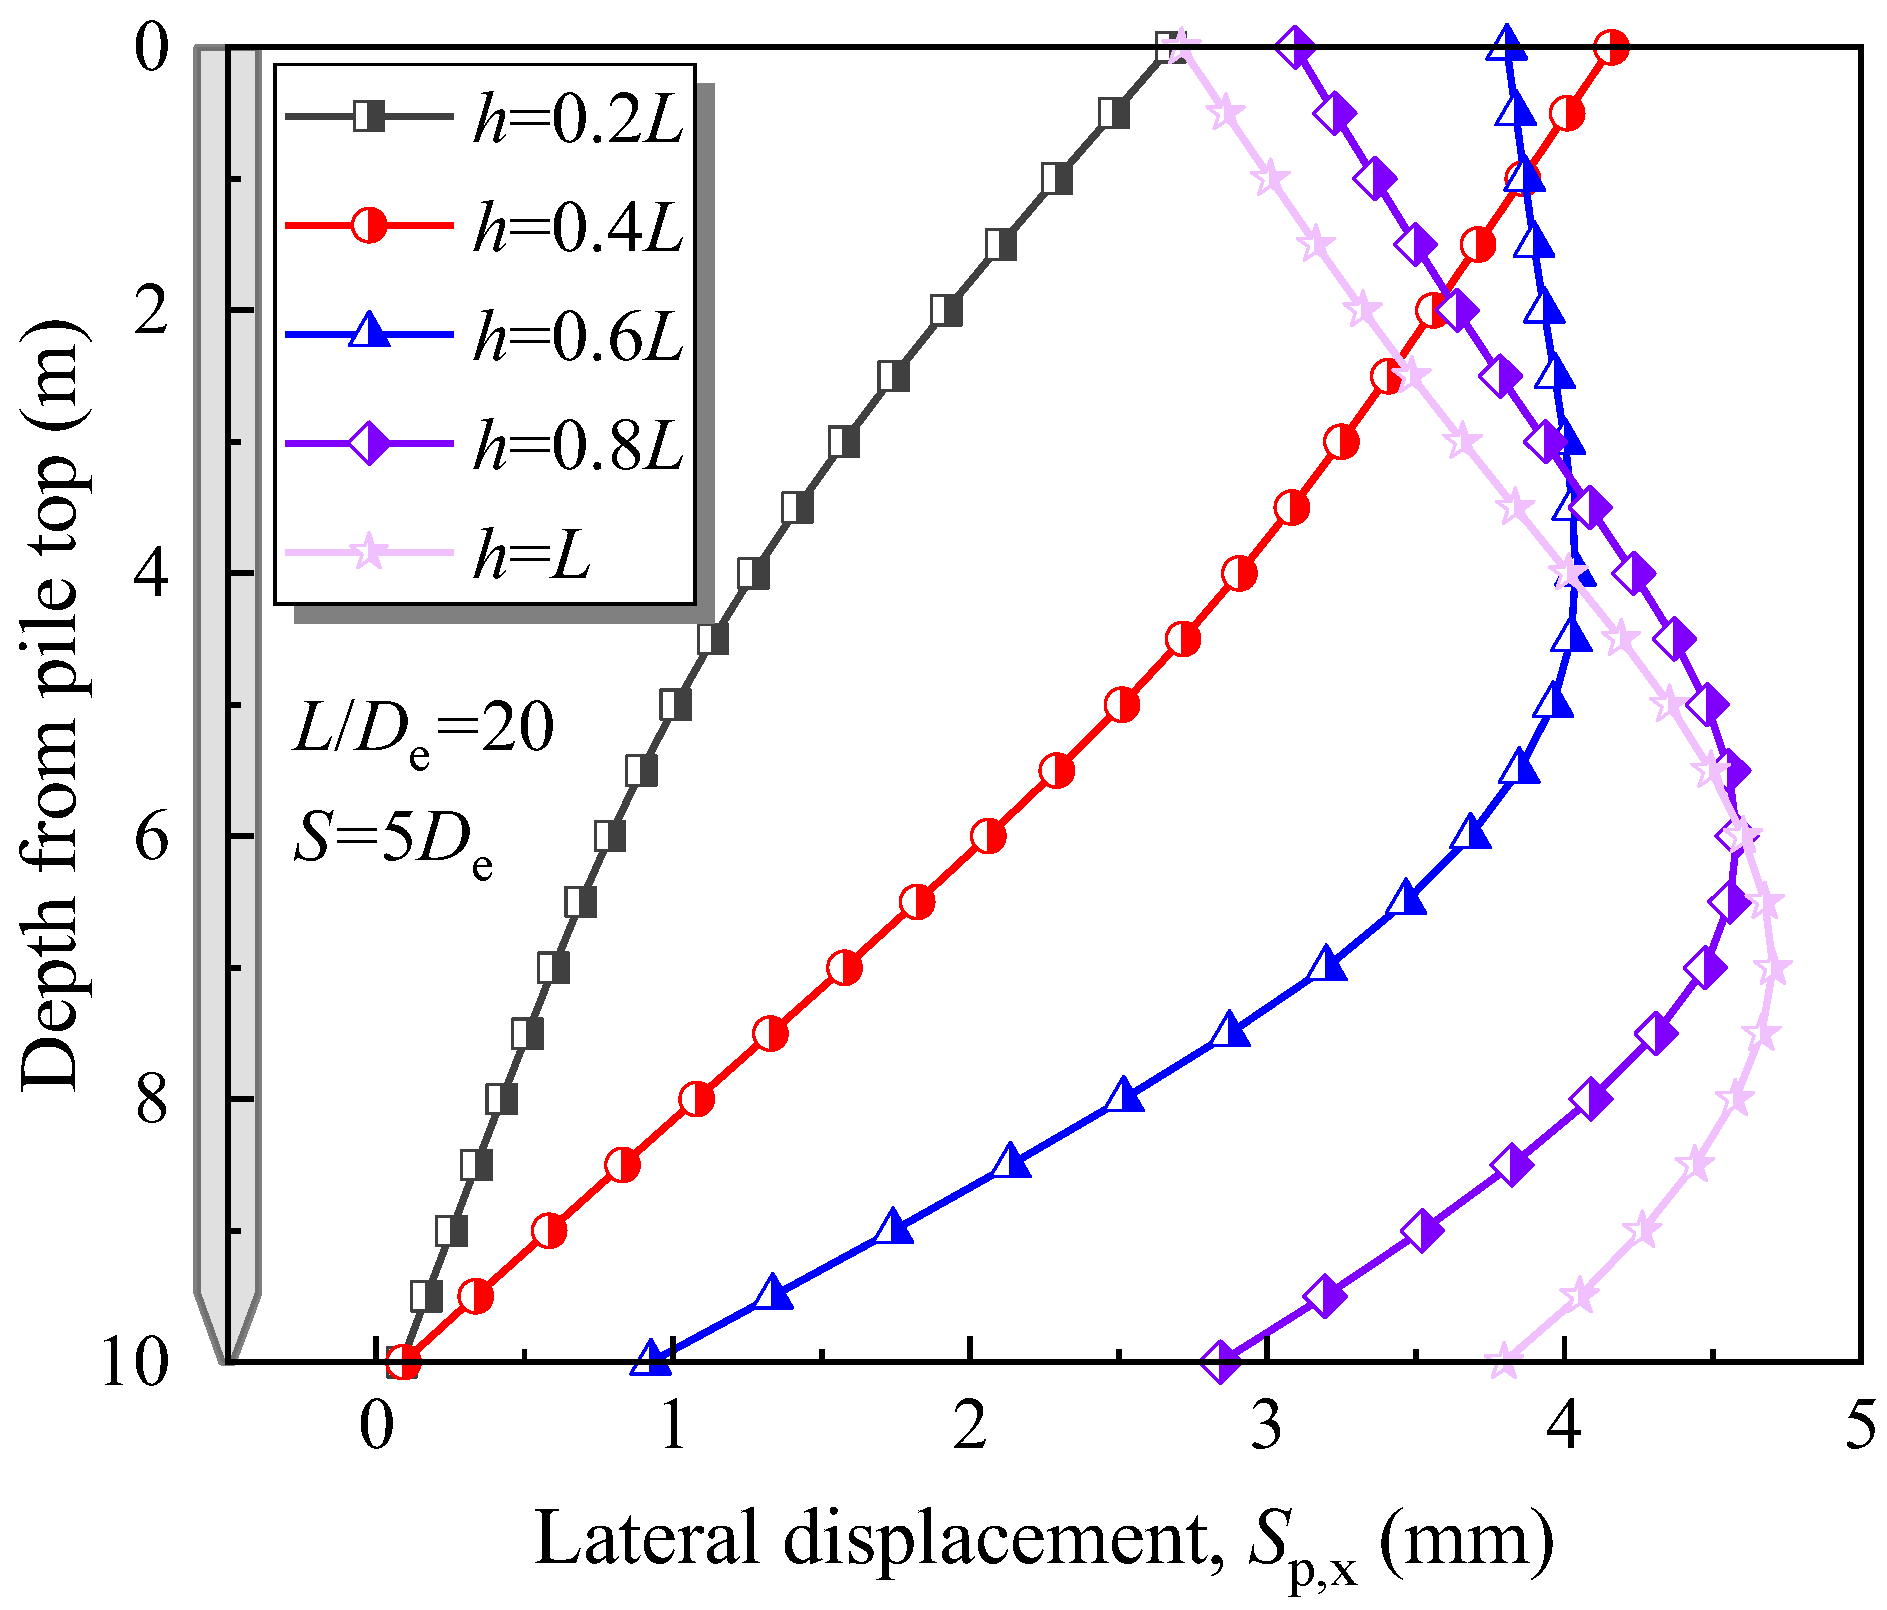
3.1.1. Lateral Displacement

In the process of subsequent pile installation, the lateral displacement of the adjacent pile varies. Figure 8 illustrates the lateral displacement distribution of the adjacent pile along the pile shaft with different penetration depths (h) of the subsequent pile. During the initial stage of subsequent pile penetration, i.e., h < 0.4 L, the lateral displacement of the adjacent pile decreases with pile depth. As the penetration depth of the subsequent pile increases, the location of the peak lateral displacement moves downwards. Once the penetration of the subsequent pile is complete (i.e., h = L), the peak lateral displacement occurs at the pile tip.
In practice, the pile center distance (S) is usually set as 4~6 times the pile diameter. Figure 9a compares the lateral displacement distribution of the adjacent pile with different spaces, i.e., S = 4 De, 4.5 De, 5 De, 5.5 De, 6 De. The results indicate that lateral displacement initially increases and then decreases with increasing depth from the pile top, with the peak lateral displacement occurring in the lower-middle part of the pile, approximately 0.7 L from the pile top. The peak lateral displacement of the adjacent pile is negatively correlated with S. As the center distance increases, the peak lateral displacement of the adjacent pile decreases. Figure 9b shows that with small L/De, the lateral displacement decreases with depth, whereas the peak lateral displacement occurs at the pile top. For large length-to-diameter ratios (L/De > 15), the peak lateral displacement occurs approximately 0.7 L from the pile top. In addition, the peak lateral displacement of the adjacent pile increases with higher L/De, which is mainly due to the fact that the lateral bending stiffness of the pile reduces with the increase in L/De.

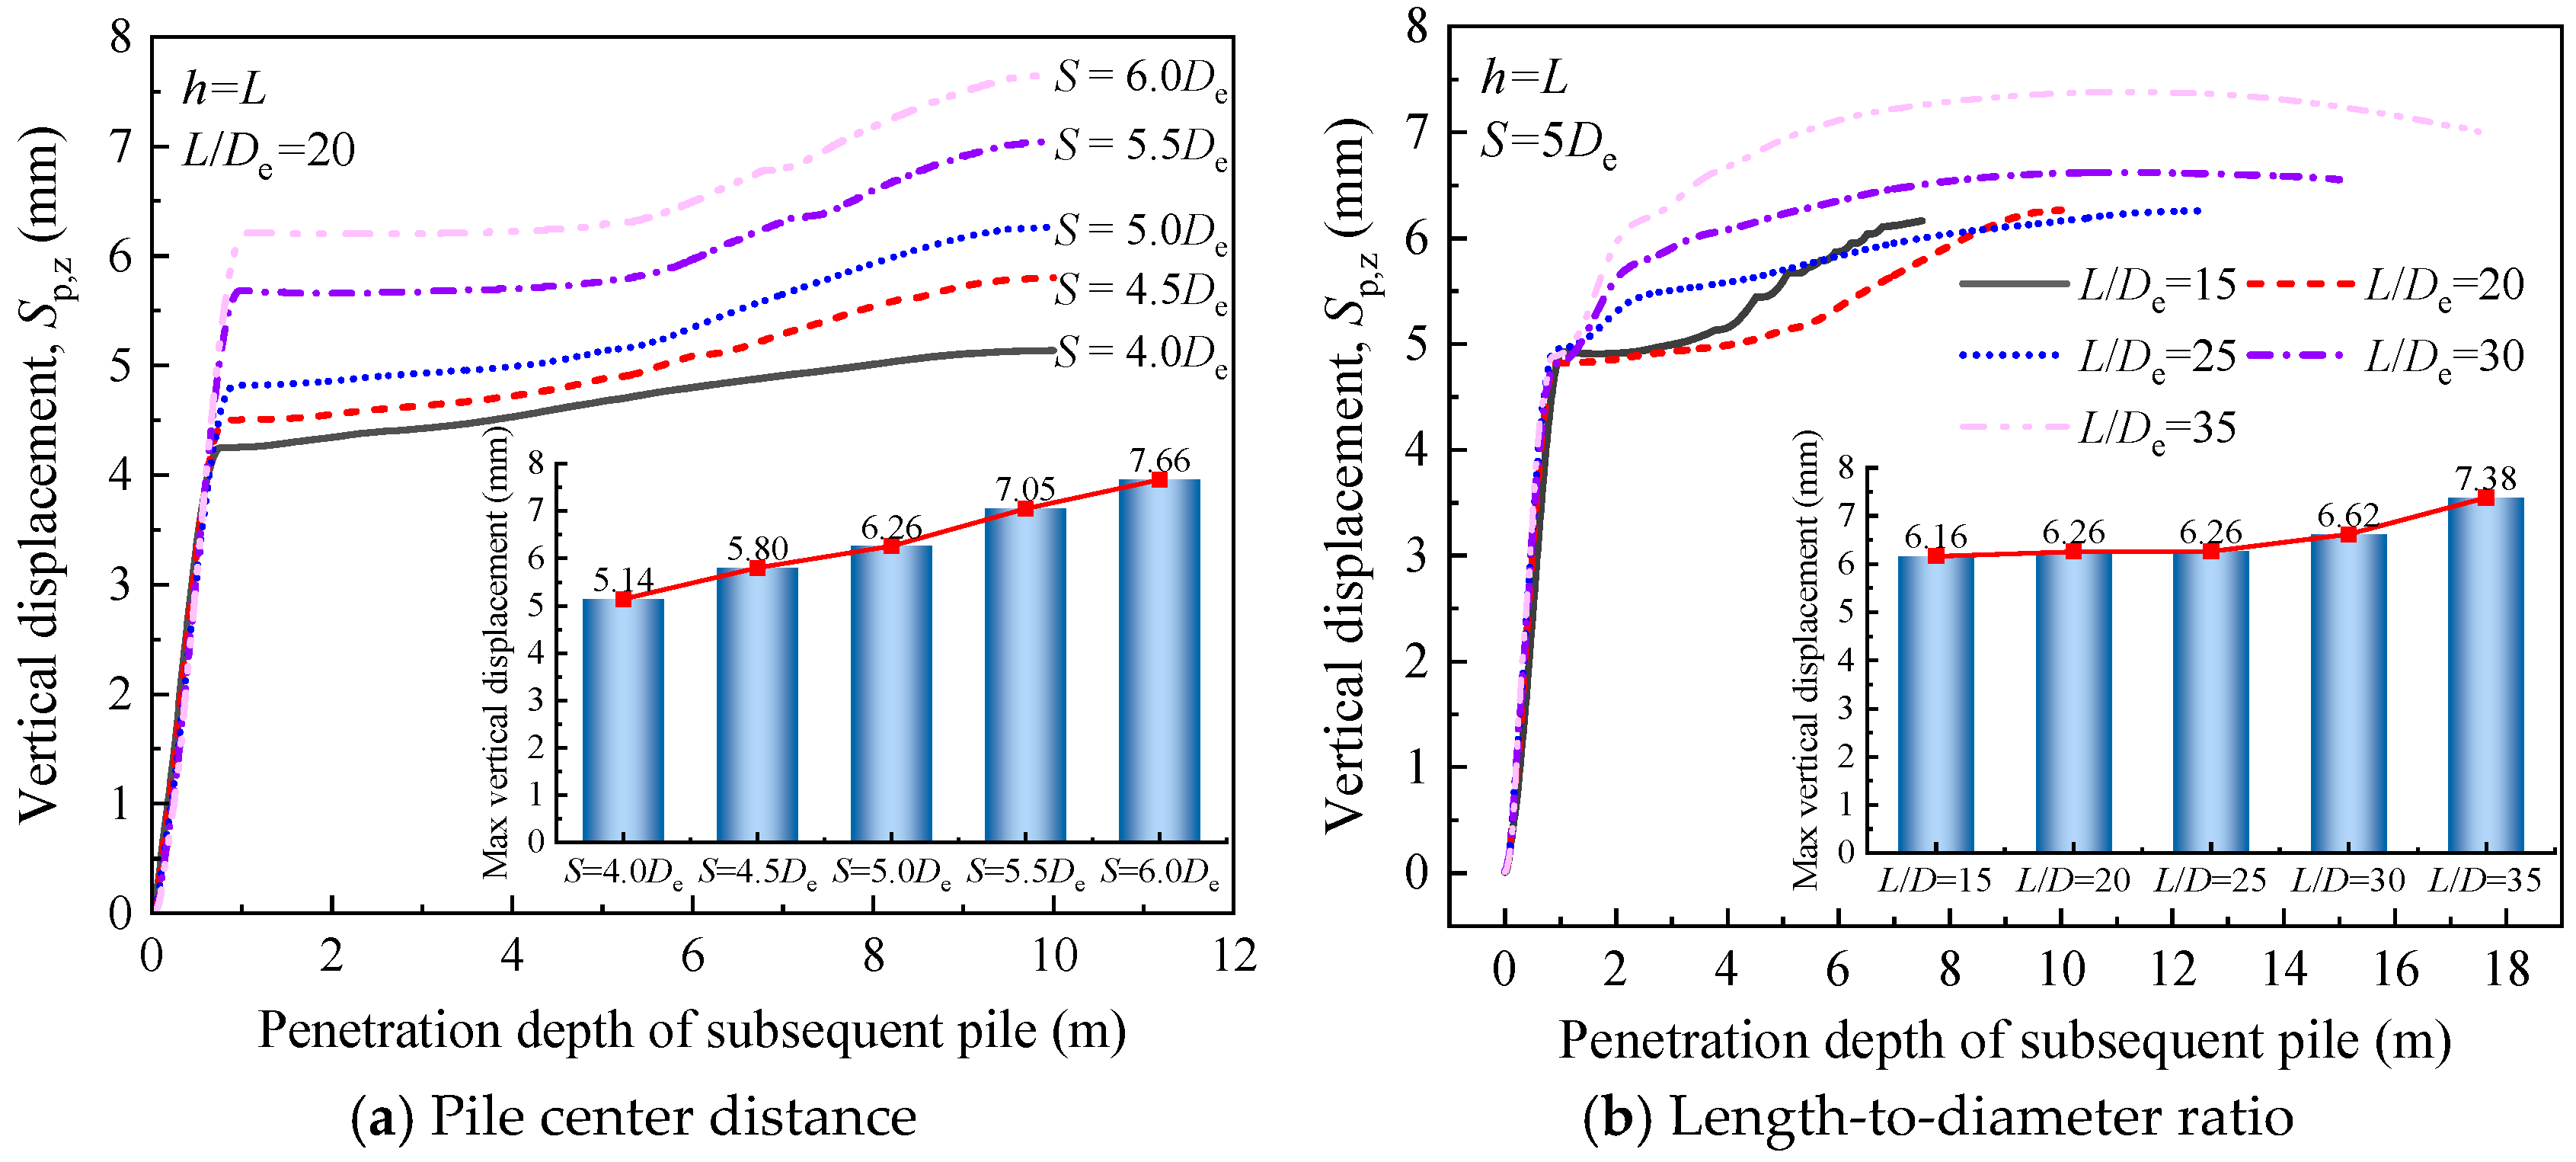
3.1.2. Vertical Displacement

Figure 10a demonstrates the effect of S on the vertical displacement of the adjacent pile. The results indicate that with an increase in h, the vertical displacement first rises rapidly and then increases gradually. It is worth noting that S has little effect on the initial increase rate of the vertical displacement, whereas the final vertical displacement is largely dependent on S. The peak vertical displacement is positively correlated with S. As S increases, the peak vertical displacement also increases.
Figure 10b reports that for small L/De, the vertical displacement first rises rapidly and then increases gradually, reaching its peak value once the subsequent pile installation is completed. For large length-to-diameter ratios (L/De > 25), the vertical displacement of the adjacent pile can be divided into three stages: a steep increase stage, a gradual increase stage, and a decrease stage. After reaching the peak value, the vertical displacement slowly decreases with further increases in h. Additionally, an increase in L/De results in a larger peak vertical displacement of the adjacent pile.
Figure 11 illustrates the influence of S and L/De on the peak displacement of the adjacent pile. The results indicate that the peak vertical displacement is generally higher than the peak lateral displacement. During the installation of the subsequent pile, the adjacent pile is subjected to horizontal lateral pressure and upward friction. In the process of pile installation, horizontal ground movements and vertical displacements can be observed [39]. However, the soil movements are mainly in the horizontal direction, and their inclination increases towards the vertical direction with increasing distance from the adjacent pile’s center [40]. Therefore, with the increase in pile center distance, the lateral displacement of the soil around the adjacent pile significantly decreases, while the inclination in the vertical direction increases, leading to an increase in the peak vertical displacement of the pile. In addition, both the peak vertical and lateral displacements of the adjacent pile rise with larger L/De.

3.2. Internal Forces of Adjacent Pile

In FLAC3D, while using solid elements to model pile foundations accurately reflects the actual cross-sectional shape and dimensions of the piles, it does not allow for the direct computation of internal forces such as axial force and bending moment. Therefore, this study introduces a structural element pile model to calculate the internal forces of adjacent piles. Specifically, the adjacent pile (the first pile) is modeled using solid elements to analyze compaction effects during its installation. Once the adjacent pile installation is complete, the structural element is established along the central axis of the pile. Subsequently, the installation of the subsequent pile (the second pile) is carried out, and the changes in axial force and bending moment in the adjacent pile during the process are recorded.
Figure 12a shows the variation in axial force of the adjacent pile with h. The results indicate that the peak axial force is primarily located at the bottom of the pile, approximately 0.8~0.9 L from the top of the pile. Additionally, the peak axial force decreases with increasing h. This is mainly because the axial force of the adjacent pile is largely related to the soil stress. After the adjacent pile is installed, there is significant geostress and additional stress at the bottom of the pile, resulting in a higher axial force at the bottom. As h increases, the geostress concentrates in the soil around the subsequent pile, leading to a decrease in the peak axial force of the adjacent pile. Since the bending moment of the adjacent pile is mainly related to the lateral pressure exerted by the subsequent pile, as h increases, the lateral pressure’s effect on the adjacent pile is transmitted downward. Therefore, as shown in Figure 12b, the peak bending moment of the adjacent pile moves downwards along the pile with increasing h.
For subsequent analysis, normalization was performed using h/L (subsequent pile penetration depth/pile length). Figure 13 shows the variation in peak axial force and peak bending moment of the adjacent pile with S. The results indicate that the peak axial force increases with the increase in S, while the peak bending moment generally decreases with the increase in S. Additionally, the peak axial force first decreases and then increases with the increase in h, with the maximum peak axial force occurring around h/L = 0.1. The peak bending moment first increases and then decreases with the increase in h, with the maximum peak bending moment occurring around h/L = 0.7. Figure 14 shows that the peak axial force and peak bending moment of the adjacent pile generally increase with the increase in L/De. The maximum peak axial force occurs around h/L = 0.1, while the maximum peak bending moment occurs around h/L = 0.7 or h/L = 0.8.

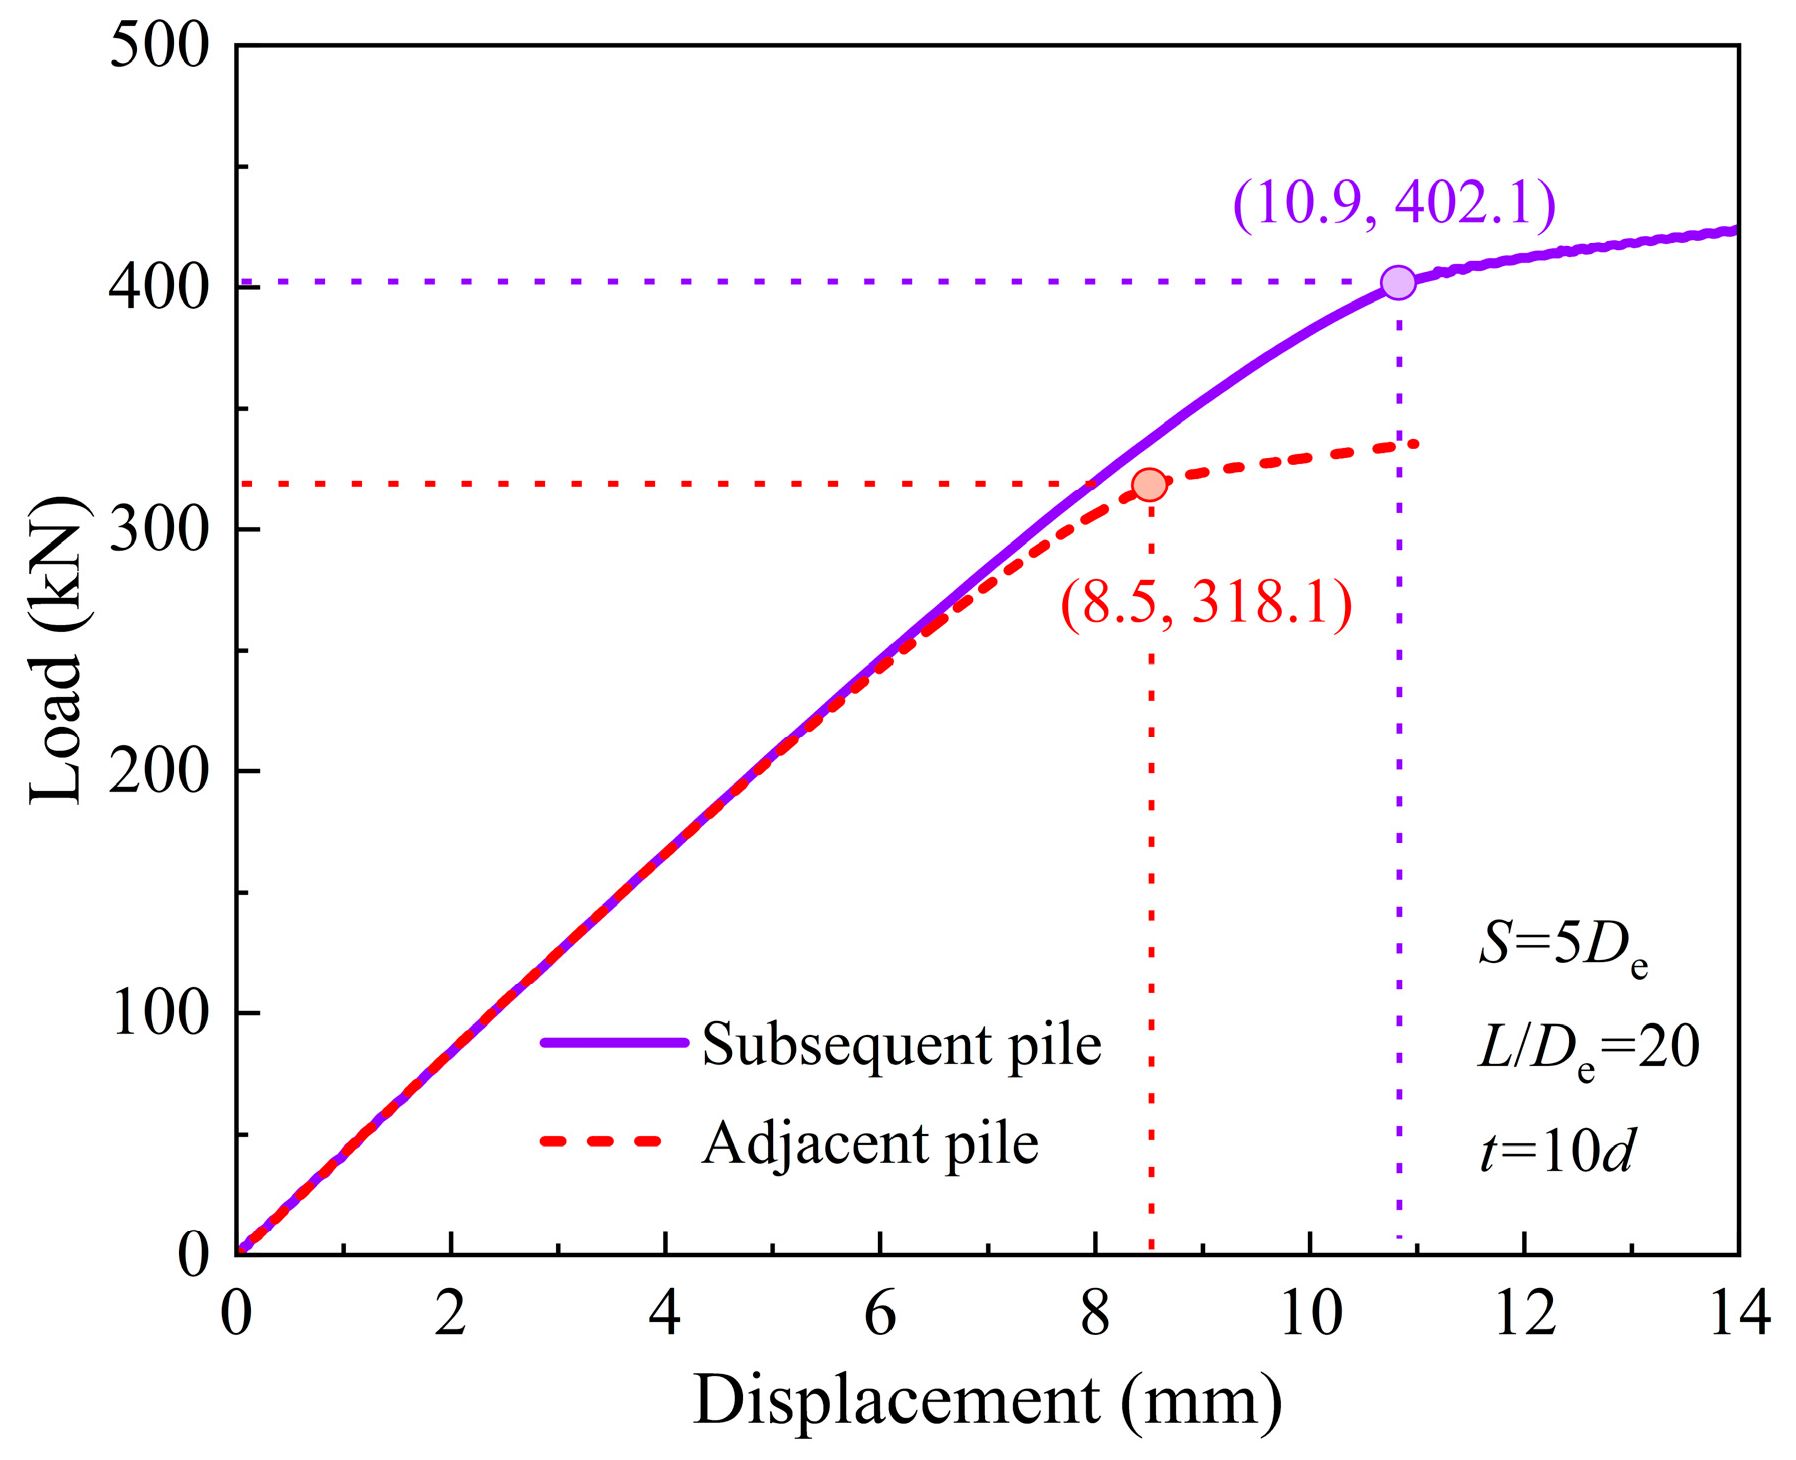
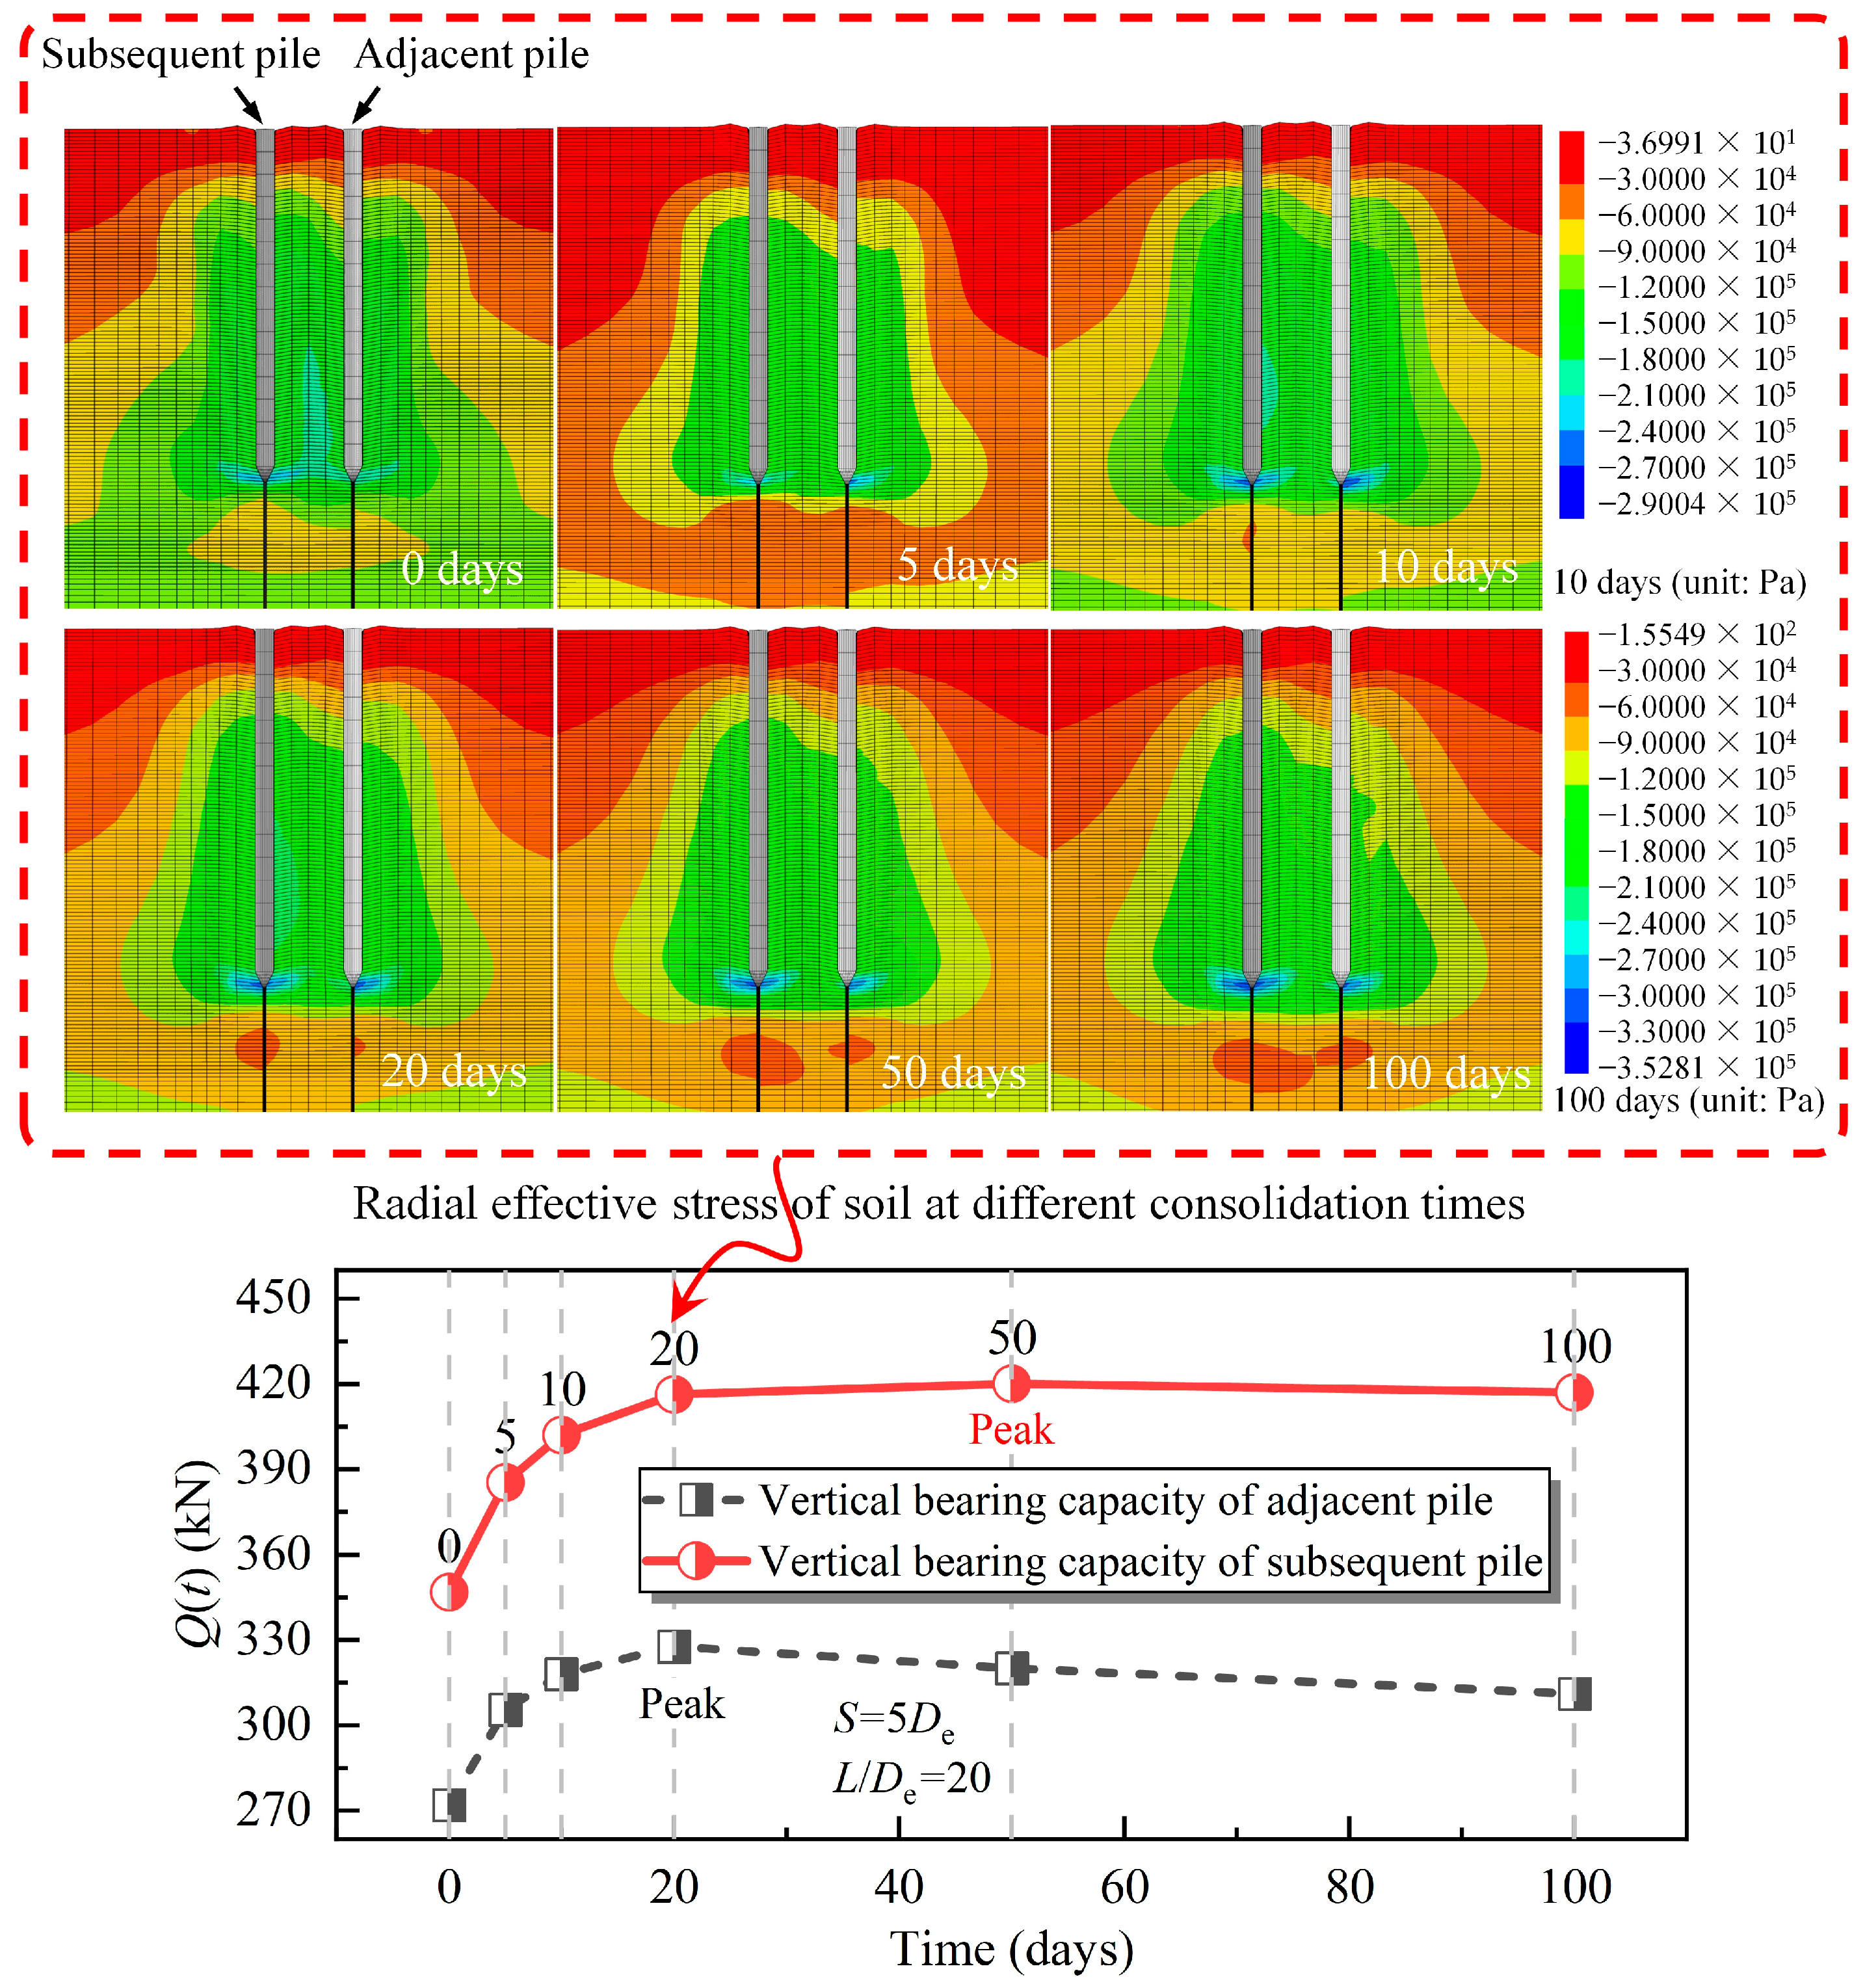
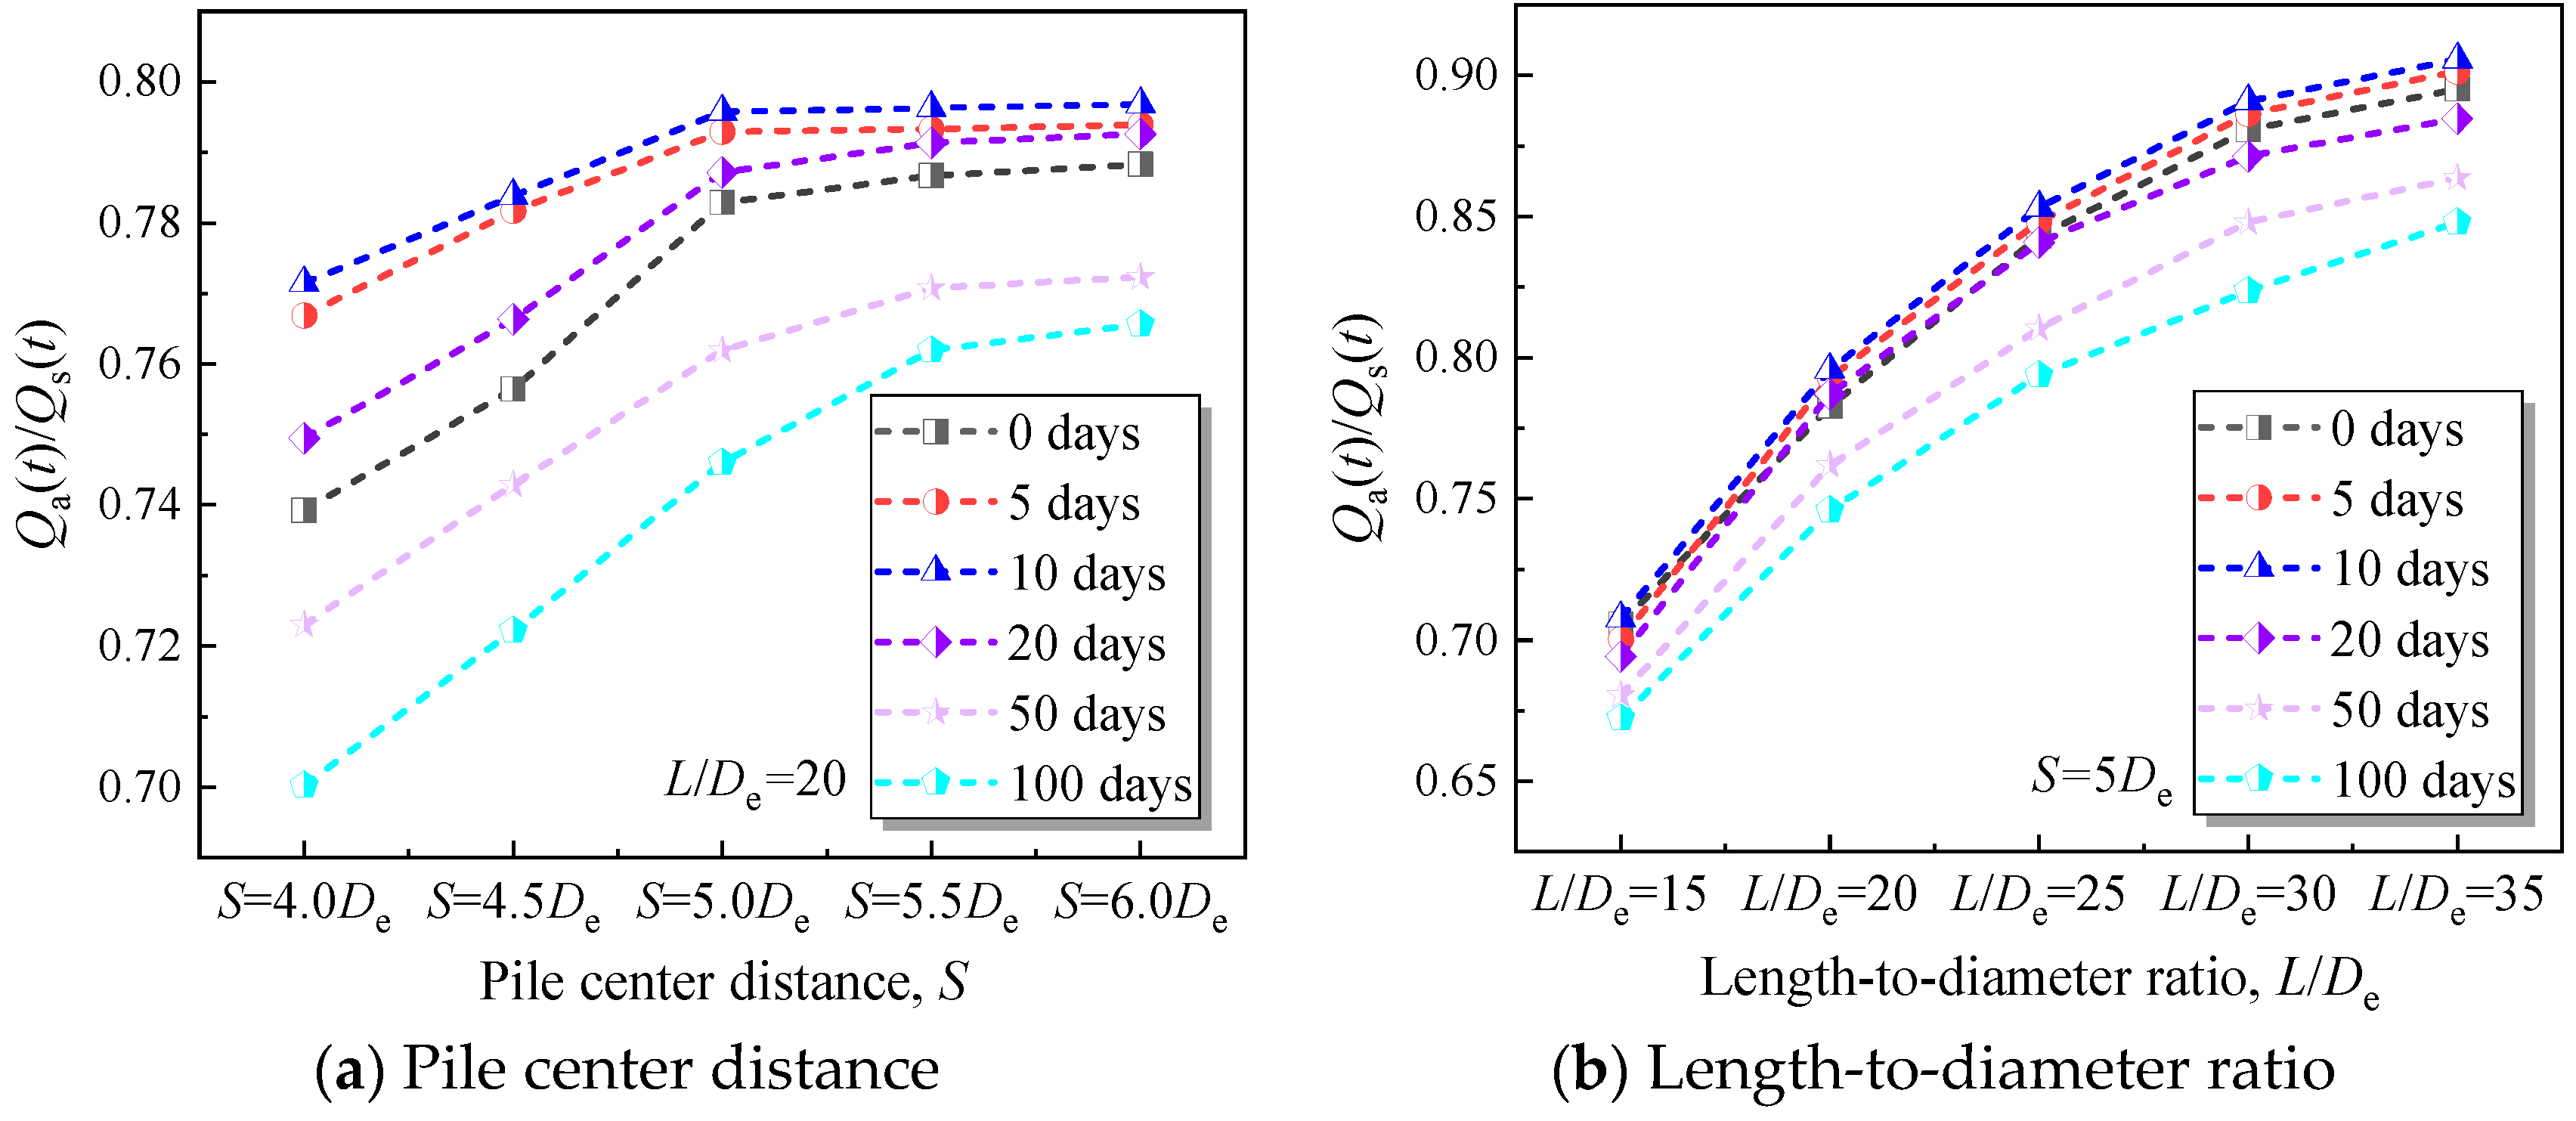
3.3. Vertical Bearing Capacity of Adjacent Pile

After pile installation, excess pore pressure is generated within soil. Positive EPP is mainly concentrated near the pile tip, while negative EPP is mainly distributed around the upper part and lower part of the pile, as shown in Figure 15a. Notably, the EPP at the tip of the subsequent pile is significantly higher than that of the adjacent pile. As the soil undergoes drainage consolidation, the EPP gradually dissipates. According to the principle of effective stress in saturated soils, the effective stress in the soil changes with the pore pressure. Figure 16 shows the variation in radial effective stress at different depths. The results indicate that, after 100 days of soil consolidation, the radial effective stress at the middle of the pile (z = 0.5 L) is significantly lower than immediately after pile installation, primarily due to the recovery of negative pore pressure. Additionally, due to the dissipation of EPP, the radial effective stress at the pile tip (z = L) is significantly higher than immediately after pile installation. It is noteworthy that, after 100 days of consolidation, the radial effective stress around the subsequent pile is higher than that around the adjacent pile.
In this study, the vertical bearing capacity of the pile is defined as the endpoint of the elastic stage in the load–displacement curve. The load–displacement curve is obtained using the displacement control method, where vertical displacement is first applied to the pile, and the corresponding reaction force at the pile head is then extracted. As shown in Figure 17, after 10 days of soil consolidation, the vertical bearing capacity of the subsequent pile is significantly higher than that of the adjacent pile. Figure 18 compares the variation in vertical bearing capacity (Q(t)) between the adjacent pile and the subsequent pile over time. The results show that the vertical bearing capacity initially increases and then decreases, with the peak capacity for the adjacent pile occurring around day 20 and the peak capacity for the subsequent pile around day 50. This is primarily due to the linear distribution of pore pressure in the direction of gravity after soil consolidation is completed. In the later stages of soil consolidation, pore water continuously flows into the soil at the top of the pile, gradually reducing the effective stress in this region and consequently decreasing the vertical bearing capacity of the pile.
Additionally, at various time intervals, the vertical bearing capacity of the subsequent pile is consistently higher than that of the adjacent pile. This phenomenon can be attributed to two main factors: first, the additional stress generated within the soil during the installation of the subsequent pile accumulates on top of the stress caused by the adjacent pile, resulting in a greater additional stress around the subsequent pile; second, the excess pore pressure generated after the installation of the subsequent pile is significantly higher than that of the adjacent pile, and as the soil consolidates, the increase in effective stress around the subsequent pile is more pronounced.
To facilitate the discussion on the impact of S and L/De on the vertical bearing capacity of the adjacent pile, normalization was performed using Qa(t)/Qs(t) (adjacent pile vertical bearing capacity/subsequent pile vertical bearing capacity). As shown in Figure 19, increasing both S and L/De reduces the impact of the subsequent pile installation on the bearing capacity of the adjacent pile. Notably, increasing L/De is more effective in enhancing the adjacent pile’s bearing capacity compared to increasing S. Additionally, the vertical bearing capacity of the adjacent pile initially increases and then decreases over time. When soil consolidation reaches approximately 10 days, the difference in bearing capacity between the adjacent pile and the subsequent pile in saturated clay is minimized.

4. Conclusions

Through the project of continuous group pile installation in saturated clay, this paper explores the impact of subsequent pile installation on the adjacent pile based on a three-dimensional numerical model. The main conclusions are as follows:
This paper investigates the impact of subsequent pile installation on adjacent pile in a continuous pile group installation project within saturated clay, based on a three-dimensional numerical model. The main conclusions are as follows:
The peak vertical displacement of the adjacent pile is significantly higher than the peak lateral displacement. As S increases, the peak vertical displacement of the adjacent pile increases, while the peak lateral displacement decreases. With an increase in L/De, both the peak vertical and lateral displacements of the adjacent pile increase.
As the penetration depth of the subsequent pile increases, the peak axial force of the adjacent pile initially decreases and then increases, while the peak bending moment initially increases and then decreases. The maximum peak axial force of the adjacent pile is approximately at h/L = 0.1, and the maximum peak bending moment is approximately at h/L = 0.7~0.8.
The peak axial force of the adjacent pile increases with the increase in S, while the peak bending moment decreases with the increase in S. Both the peak axial force and peak bending moment increase with the increase in L/De.
The vertical bearing capacity of the pile initially increases and then decreases over time, and the vertical bearing capacity of the subsequent pile is significantly higher than that of the adjacent pile. Increasing S and L/De can reduce the impact of subsequent pile installation on the bearing capacity of the adjacent pile. Compared to increasing S, increasing L/De is more effective in improving the bearing capacity of the adjacent pile.

Author Contributions

Methodology, Z.L. and D.H.; Resources, F.L.; Software, W.X. and Z.L.; Supervision, D.H. and F.L.; Validation, W.X.; Visualization, Z.L.; Writing—original draft, W.X. and Z.L.; Writing—review and editing, D.H. All authors have read and agreed to the published version of the manuscript.

Funding

This research received no external funding.

Institutional Review Board Statement

Not applicable.

Informed Consent Statement

Not applicable.

Data Availability Statement

The original contributions presented in this study are included in the article and further inquiries can be directed to the corresponding author.

Conflicts of Interest

Author Zihang Li was employed by the company Guangdong Yudean Zhuhai Offshore Wind Power Co., Ltd. The remaining authors declare that the research was conducted in the absence of any commercial or financial relationships that could be construed as a potential conflict of interest.

References

  1. Yang, J.; Tham, L.G.; Lee, P.K.K.; Chan, S.T.; Yu, F. Behaviour of jacked and driven piles in sandy soil. Géotechnique 2006, 56, 245–259. [Google Scholar] [CrossRef]
  2. Gong, W.; Li, J.; Li, L.; Zhang, S. Evolution of mechanical properties of soils subsequent to a pile jacked in natural saturated clays. Ocean. Eng. 2017, 136, 209–217. [Google Scholar] [CrossRef]
  3. Pestana, J.M.; Hunt, C.E.; Bray, J.D. Soil deformation and excess pore pressure field around a closed-ended pile. J. Geotech. Geoenviron. Eng. 2002, 128, 1–12. [Google Scholar] [CrossRef]
  4. Li, X.; Cai, G.; Liu, S.; Puppala, A.J.; Zheng, J.; Jiang, T. Undrained shear strength and pore pressure changes due to prestress concrete pile installation in soft clay. Int. J. Civ. Eng. 2019, 17, 193–203. [Google Scholar] [CrossRef]
  5. Hoang, L.T.; Dao, K.X.; Xiong, X.; Matsumoto, T. Performance analysis of a jacked-in single pile and pile group in saturated clay ground. Soils Found. 2022, 62, 101094. [Google Scholar] [CrossRef]
  6. Li, Y.N.; Li, J.P.; Zhang, S.T. Model Test Research on the Compaction Effect of Jacked Pile in Layered Soil. In Deep Foundations and Geotechnical In Situ Testing, Proceedings of GeoShanghai 2010; ASCE Press: Reston, VA, USA, 2010; pp. 238–245. [Google Scholar]
  7. Luo, Z.; Tao, Y.; Gong, X.; Zou, B. Soil compacting displacements for two jacked piles considering shielding effects. Acta Geotech. 2020, 15, 2367–2377. [Google Scholar] [CrossRef]
  8. Le Kouby, A.; Dupla, J.C.; Canou, J.; Francis, R. The effects of installation order on the response of a pile group in silica sand. Soils Found. 2016, 56, 174–188. [Google Scholar] [CrossRef]
  9. Cooke, R.W.; Price, G.; Tarr, K. Jacked piles in London Clay: A study of load transfer and settlement under working conditions. Geotechnique 1979, 29, 113–147. [Google Scholar] [CrossRef]
  10. Foglia, A.; Abdel-Rahman, K.; Wisotzki, E.; Quiroz, T.; Achmus, M. Large-scale model tests of a single pile and two-pile groups for an offshore platform in sand. Can. Geotech. J. 2021, 99, 1825–1838. [Google Scholar] [CrossRef]
  11. Bishop, R.F.; Hill, R.; Mott, N.F. The theory of indentation and hardness tests. Proc. Phys. Soc. 1945, 57, 147–159. [Google Scholar] [CrossRef]
  12. Vesić, A.S. Expansion of cavities in infinite soil mass. J. Soil Mech. Found. Div. 1972, 98, 265–290. [Google Scholar] [CrossRef]
  13. Carter, J.P.; Booker, J.R.; Yeung, S.K. Cavity expansion in cohesive frictional soils. Geotechnique 1986, 36, 349–358. [Google Scholar] [CrossRef]
  14. Chen, S.L.; Abousleiman, Y.N. Exact undrained elasto-plastic solution for cylindrical cavity expansion in modified Cam Clay soil. Géotechnique 2012, 62, 447–456. [Google Scholar] [CrossRef]
  15. Castro, J.; Sivasithamparam, N. Theoretical solution for drained cylindrical cavity expansion in clays with fabric anisotropy and structure. Acta Geotech. 2022, 17, 1917–1933. [Google Scholar] [CrossRef]
  16. Cui, J.; Rao, P.; Li, J.; Chen, Q.; Nimbalkar, S. Time-dependent evolution of bearing capacity of driven piles in clays. Proc. Inst. Civ. Eng. Geotech. Eng. 2022, 176, 402–418. [Google Scholar] [CrossRef]
  17. Poulos, H.G. Effect of pile driving on adjacent piles in clay. Can. Geotech. J. 1994, 31, 856–867. [Google Scholar] [CrossRef]
  18. Zhou, P.; Zhou, H.; Liu, H.; Li, X.; Ding, X.; Wang, Z. Analysis of lateral response of existing single pile caused by penetration of adjacent pile in undrained clay. Comput. Geotech. 2020, 126, 103736. [Google Scholar] [CrossRef]
  19. Zhou, P.; Li, J.; Li, L.; Xie, F. Analysis of the existing pile response induced by adjacent pile driving in undrained clay. Comput. Geotech. 2021, 138, 104319. [Google Scholar] [CrossRef]
  20. Sharif, Y.U.; Brown, M.J.; Ciantia, M.O.; Cerfontaine, B.; Davidson, C.; Knappett, J.; Meijer, G.J.; Ball, J. Using discrete element method (DEM) to create a cone penetration test (CPT)-based method to estimate the installation requirements of rotary-installed piles in sand. Can. Geotech. J. 2021, 58, 919–935. [Google Scholar] [CrossRef]
  21. Su, D.; Wu, Z.; Lei, G.; Zhu, M. Numerical study on the installation effect of a jacked pile in sands on the pile vertical bearing capacities. Comput. Geotech. 2022, 145, 104690. [Google Scholar] [CrossRef]
  22. Cerfontaine, B.; Ciantia, M.O.; Brown, M.J.; White, D.J.; Sharif, Y.U. DEM study of particle scale effect on plain and rotary jacked pile behaviour in granular materials. Comput. Geotech. 2023, 161, 105559. [Google Scholar] [CrossRef]
  23. Cheng, X.; Vanapalli, S.K. Prediction of the end-bearing capacity of axially loaded piles in saturated and unsaturated soils based on the stress characteristics method. Int. J. Geomech. 2023, 23, 04023104. [Google Scholar] [CrossRef]
  24. Kang, C.; Yi, J. Large Deformation Numerical Simulation of the Set up Effect Induced by Sand Compaction Pile Group Installation. In MATEC Web of Conferences; EDP Sciences: Les Ulis, France, 2020; Volume 319, p. 06003. [Google Scholar]
  25. Yi, J.T.; Liu, F.; Zhang, T.B.; Yao, K.; Zhen, G. A large deformation finite element investigation of pile group installations with consideration of intervening consolidation. Appl. Ocean. Res. 2021, 112, 102698. [Google Scholar] [CrossRef]
  26. Tho, K.K.; Chen, Z.; Leung, C.F.; Chow, Y.K. Enhanced analysis of pile flexural behavior due to installation of adjacent pile. Can. Geotech. J. 2014, 51, 705–711. [Google Scholar] [CrossRef]
  27. Jayasinghe, L.B.; Waldmann, D.; Shang, J. Impact of pile punching on adjacent piles: Insights from a 3D coupled SPH-FEM analysis. Appl. Mech. 2020, 1, 47–58. [Google Scholar] [CrossRef]
  28. Zhou, P.; Liu, H.; Zhou, H.; Cao, G.; Ding, X. A simplified analysis approach for the effect of the installation of adjacent XCC pile on the existing single XCC pile in undrained clay. Acta Geotech. 2022, 17, 5499–5519. [Google Scholar] [CrossRef]
  29. Dong, J.; Chen, F.; Zhou, M.; Zhou, X. Numerical analysis of the boundary effect in model tests for single pile under lateral load. Bull. Eng. Geol. Environ. 2018, 77, 1057–1068. [Google Scholar] [CrossRef]
  30. Carter, J.P.; Randolph, M.F.; Wroth, C.P. Stress and pore pressure changes in clay during and after the expansion of a cylindrical cavity. Int. J. Numer. Anal. Methods Geomech. 1979, 3, 305–322. [Google Scholar] [CrossRef]
  31. Henke, S.; Grabe, J. Simulation of pile driving by 3-dimensional Finite-Element analysis. In Proceedings of the 17th European Young Geotechnical Engineers’ Conference, Zagreb, Crotia, 19–23 July 2006; pp. 215–233. [Google Scholar]
  32. Konkol, J.; Bałachowski, L. Large deformation finite element analysis of undrained pile installation. Stud. Geotech. Mech. 2016, 38, 45–54. [Google Scholar] [CrossRef]
  33. Li, L.; Li, J.; Sun, D.A.; Gong, W. Analysis of time-dependent bearing capacity of a driven pile in clayey soils by total stress method. Int. J. Geomech. 2017, 17, 04016156. [Google Scholar] [CrossRef]
  34. Sabetamal, H.; Nazem, M.; Carter, J.P.; Sloan, S.W. Large deformation dynamic analysis of saturated porous media with applications to penetration problems. Comput. Geotech. 2014, 55, 117–131. [Google Scholar] [CrossRef]
  35. Yang, Z.X.; Gao, Y.Y.; Jardine, R.J.; Guo, W.B.; Wang, D. Large deformation finite-element simulation of displacement-pile installation experiments in sand. J. Geotech. Geoenviron. Eng. 2020, 146, 04020044. [Google Scholar] [CrossRef]
  36. Gue, S.; Gue, S.S. Ground Heave Around Driven Piles in Clay. Ph.D. Thesis, University of Oxford, Oxford, UK, 1984. [Google Scholar]
  37. Hwang, J.H.; Liang, N.; Chen, C.H. Ground response during pile driving. J. Geotech. Geoenviron. Eng. 2001, 127, 939–949. [Google Scholar] [CrossRef]
  38. Bjerrum, L.; Johannessen, I.J. Pore Pressures Resulting from Driving Piles in Soft Clay; Norwegian Geotechnical Institute: London, UK, 1961; pp. 108–111. [Google Scholar]
  39. Konkol, J.; Bałachowski, L. Influence of installation effects on pile bearing capacity in cohesive soils–large deformation analysis via Finite Element Method. Stud. Geotech. Mech. 2017, 39, 27–38. [Google Scholar] [CrossRef]
  40. Wersäll, C.; Massarsch, K.R. Soil heave due to pile driving in clay. In Sound Geotechnical Research to Practice: Honoring Robert D. Holtz II, Proceedings of Geo-Congress 2013; ASCE Press: Reston, VA, USA, 2013; pp. 480–498. [Google Scholar]
Figure 1. (a) Geometry mesh and (b) model boundary conditions.
Applsci 14 08321 g001
Figure 2. Soil response caused by single pile installation: (a) radial displacement, (b) excess pore pressure, (c) volumetric stress, and (d) variation in volumetric stress with depth.
Applsci 14 08321 g002
Figure 3. Comparison of calculated (a) radial soil displacement [3,36] and (b) excess pore pressure with test results along the radial distance [3,12,37,38].
Applsci 14 08321 g003
Figure 4. Dissipation of excess pore pressure in the soil consolidation stage [33].
Applsci 14 08321 g004
Figure 5. Load–displacement curve of the pile after 8.65 days of consolidation [33].
Applsci 14 08321 g005
Figure 6. Schematic diagram of the two-pile group installation.
Applsci 14 08321 g006
Figure 7. Schematic diagram of the separate auxiliary tube method.
Applsci 14 08321 g007
Figure 8. Lateral displacement of adjacent pile with subsequent pile penetration depth.
Applsci 14 08321 g008
Figure 9. The effect of S and L/De on the lateral displacement of the adjacent pile.
Applsci 14 08321 g009
Figure 10. The influence of S and L/De on the vertical displacement of the adjacent pile.
Applsci 14 08321 g010
Figure 11. Influence of S and L/De on the peak displacement of the adjacent pile.
Applsci 14 08321 g011
Figure 12. Internal forces of adjacent pile with different penetration depths of subsequent pile.
Applsci 14 08321 g012
Figure 13. Variation in peak axial force and peak bending moment with S.
Applsci 14 08321 g013
Figure 14. Variation in peak axial force and peak bending moment with L/De.
Applsci 14 08321 g014
Figure 15. Pore pressure distribution of soil at different times: (a) after pile installation, (b) after 5 days, (c) after 10 days, (d) after 20 days, (e) after 50 days, and (f) after 100 days.
Applsci 14 08321 g015aApplsci 14 08321 g015b
Figure 16. Variation in radial effective stress in soil at different depths.
Applsci 14 08321 g016
Figure 17. Load–displacement curves of piles.
Applsci 14 08321 g017
Figure 18. Changes in vertical bearing capacity of the adjacent and subsequent pile with time.
Applsci 14 08321 g018
Figure 19. Effects of S and L/De on vertical bearing capacity of adjacent pile.
Applsci 14 08321 g019
Table 1. Material parameters of pile and clay.
MaterialSaturated ClayPile
Constitutive modelMohr–CoulombLinear elasticity
Elastic modulus [E/(GPa)]0.0130
Poisson’s ratio [v]0.450.27
Density [ρ (kg/m3)]18002500
Internal friction angle [φ/(°)]20
Cohesion [c/(kPa)]15
Earth pressure coefficient at rest [K0]0.5
Table 2. Soil–pile surface parameters.
Contact TypeFrictional Contact
Normal stiffness [kn (Pa/m)]1 × 109
Shear stiffness [kS (Pa/m)]1 × 109
Contact surface cohesion [ c /(kPa)]4
Contact surface friction angle [ φ /(°)]8
Table 3. Fluid parameters.
Fluid TypeIsotropic
Fluid bulk modulus [Kf/(Pa)]2 × 109
Modified fluid bulk modulus [ K f a /(Pa)]1.5 × 106
Permeability coefficient [k (cm/s)]1 × 10−7
Fluid density [ρf (kg/m3)]1 × 103
Fluid tensile strength [σf,t/(kPa)]10
Porosity [P]0.5
Main process calculation step [m]10
Slave process calculation step [n]100
Table 4. Clay parameters in centrifuge tests.
Calculation ParametersValues
Effective unit weight [γ′/(kN/m3)]8.75
Effective internal friction angle [φ′/(°)]30
Overconsolidation ratio [OCR]1.0
Void ratio [e0]0.98
Elastic modulus [E/(MPa)]24
Poisson’s ratio [v]0.45
Cohesion [c/(kPa)]15
Earth pressure coefficient at rest [K0]0.55
Coefficient of permeability [k/(cm/s)]2.65 × 10−7
Disclaimer/Publisher’s Note: The statements, opinions and data contained in all publications are solely those of the individual author(s) and contributor(s) and not of MDPI and/or the editor(s). MDPI and/or the editor(s) disclaim responsibility for any injury to people or property resulting from any ideas, methods, instructions or products referred to in the content.

