Article

Radar-Based Target Tracking Using Deep Learning Approaches with Unscented Kalman Filter

1
Department of Electronics and Communication Engineering, Koneru Lakshmaiah Education Foundation, Guntur 522302, India
2
Department of Computer Science and Engineering, Vignan’s Institute of Information Technology, Visakhapatnam 530049, India
3
Department of Artificial Intelligence and Information Systems, Samarkand State University, University Boulevard 15, Samarkand City 140104, Samarqand Region, Uzbekistan
4
Department of Information and Communication Engineering, Yeungnam University, Gyeongsan 38541, Republic of Korea
*
Authors to whom correspondence should be addressed.
Appl. Sci. 2024, 14(18), 8332; https://doi.org/10.3390/app14188332
Submission received: 21 July 2024 / Revised: 19 August 2024 / Accepted: 9 September 2024 / Published: 16 September 2024
(This article belongs to the Special Issue Evolutionary Computation in Biomedical Signal Processing)

Abstract

:
Machine learning, a rapidly growing field, has attracted numerous researchers for its ability to automatically learn from and make predictions based on data. This manuscript presents an innovative approach to estimating the covariance matrix of noise in radar measurements for target tracking, resulting from collaborative efforts. Traditionally, researchers have assumed that the covariance matrix of noise in sonar measurements is present in the vast majority of literature related to target tracking. On the other hand, this research aims to estimate it by employing deep learning algorithms with noisy measurements in range, bearing, and elevation from radar sensors. This collaborative approach, involving multiple disciplines, provides a more precise and accurate covariance matrix estimate. Additionally, the unscented Kalman filter was combined with the gated recurrent unit, multilayer perceptron, convolutional neural network, and long short-term memory to accomplish the task of 3D target tracking in an airborne environment. The quantification of the results was achieved through the use of Monte Carlo simulations, which demonstrated that the convolutional neural network performed better than any other approach. The system was simulated using a Python program, and the proposed method offers higher accuracy and faster convergence time than conventional target tracking methods. This is a demonstration of the potential that collaboration can have in research.

1. Introduction

A radar is a system that emits and receives electromagnetic waves (EMW), usually a pulse, and determines the object’s distance, location, and size in an aerial environment by using [1]. Systems use techniques such as pulse-echo measurement, phase-difference measurement, and frequency-modulated continuous-wave (FMCW) to obtain those target signatures. The distance to the target usually uses the pulse-echo technique, which measures the time it takes EMW to reflect on the transmitter. By measuring the phase difference, the system can determine the direction of the reflecting object. FMCW is used to determine the range and speed of the target by measuring the frequency shift of the received echo [2]. Radar target tracking uses sensor data to actively acquire target measurements where target motion parameters are performed to estimate the underlying motion rule and predict the target’s future trajectory and unknown states.
Target tracking is a complex task requiring high precision and accuracy due to the dynamic nature of targets, environmental factors, the tracking system’s complexity, and the various types of data from many/different sensors that must be processed at a time. Currently, target tracking research focuses on two key areas: enhancing filtering algorithms and accurately characterizing the target motion state. The filtering algorithm plays a vital role in improving the quality of the target state estimation. In contrast, accurately describing the target’s motion state is critical for reliable trajectory prediction. Several types of filters are commonly used in nonlinear estimation methods when numerical measurements are available, mainly including the extended Kalman filter (EKF) [2,3,4,5], the unscented Kalman filter (UKF) [5,6,7,8,9,10], Particle Filters (PFs) [8,11,12,13,14,15], and the cubature Kalman filter (CKF) [4,16,17,18]. Recent research in radar systems has focused on using more advanced signal processing techniques, such as beamforming, to improve the detection and localization of targets.

1.1. Tracking Target in Aerial Environment

Radar tracking in an aerial environment is a complex task due to various factors related to the air’s physical properties and the airborne object’s characteristics, such as size, speed, materials used in manufacturing, altitude, latitude, and shape. Stealth aircraft are more complex to track compared to non-stealth aircraft, while small and fast-moving objects at high altitudes may be more challenging to track than a more significant and slower object moving at a lower altitude [19]. These factors make radar tracking in an aerial environment challenging and highly nonlinear. In Figure 1, the radar system is mounted on a moving vehicle and used to track a single aerial target, and both the target and observer are moving in the direction shown.
In a scenario shown in Figure 1, a radar sensor is mounted on a moving vehicle traveling at speed vo and tracking an aircraft target moving at a constant speed v t . The sensor will measure the target’s range, bearing, and elevation. The combination of the vehicle and target’s relative motion and the measurement of these three parameters will allow the radar to accurately track the position and movement of the aircraft target. The parameters mentioned in the above figure are as follows: β : Bearing. t c r s : Target course, o b c r s : Observer course, r: Range. TBA: Target Bearing Angle, tpi: Target Pitch, obpi: Observer pitch, ε : Elevation. To simulate a real-life scenario, the specified parameters for the target and observer were initialized and fed into the Python-based simulator. These parameters include observer course, initial range, initial bearing, target velocity, observer velocity, target course, standard deviation in range, standard deviation in bearing, elevation, standard deviation in elevation, observer pitch, and target pitch. The study by Nalini Santhosh et al. [20] comprehensively describes the mathematical model used for 3D simulator design.

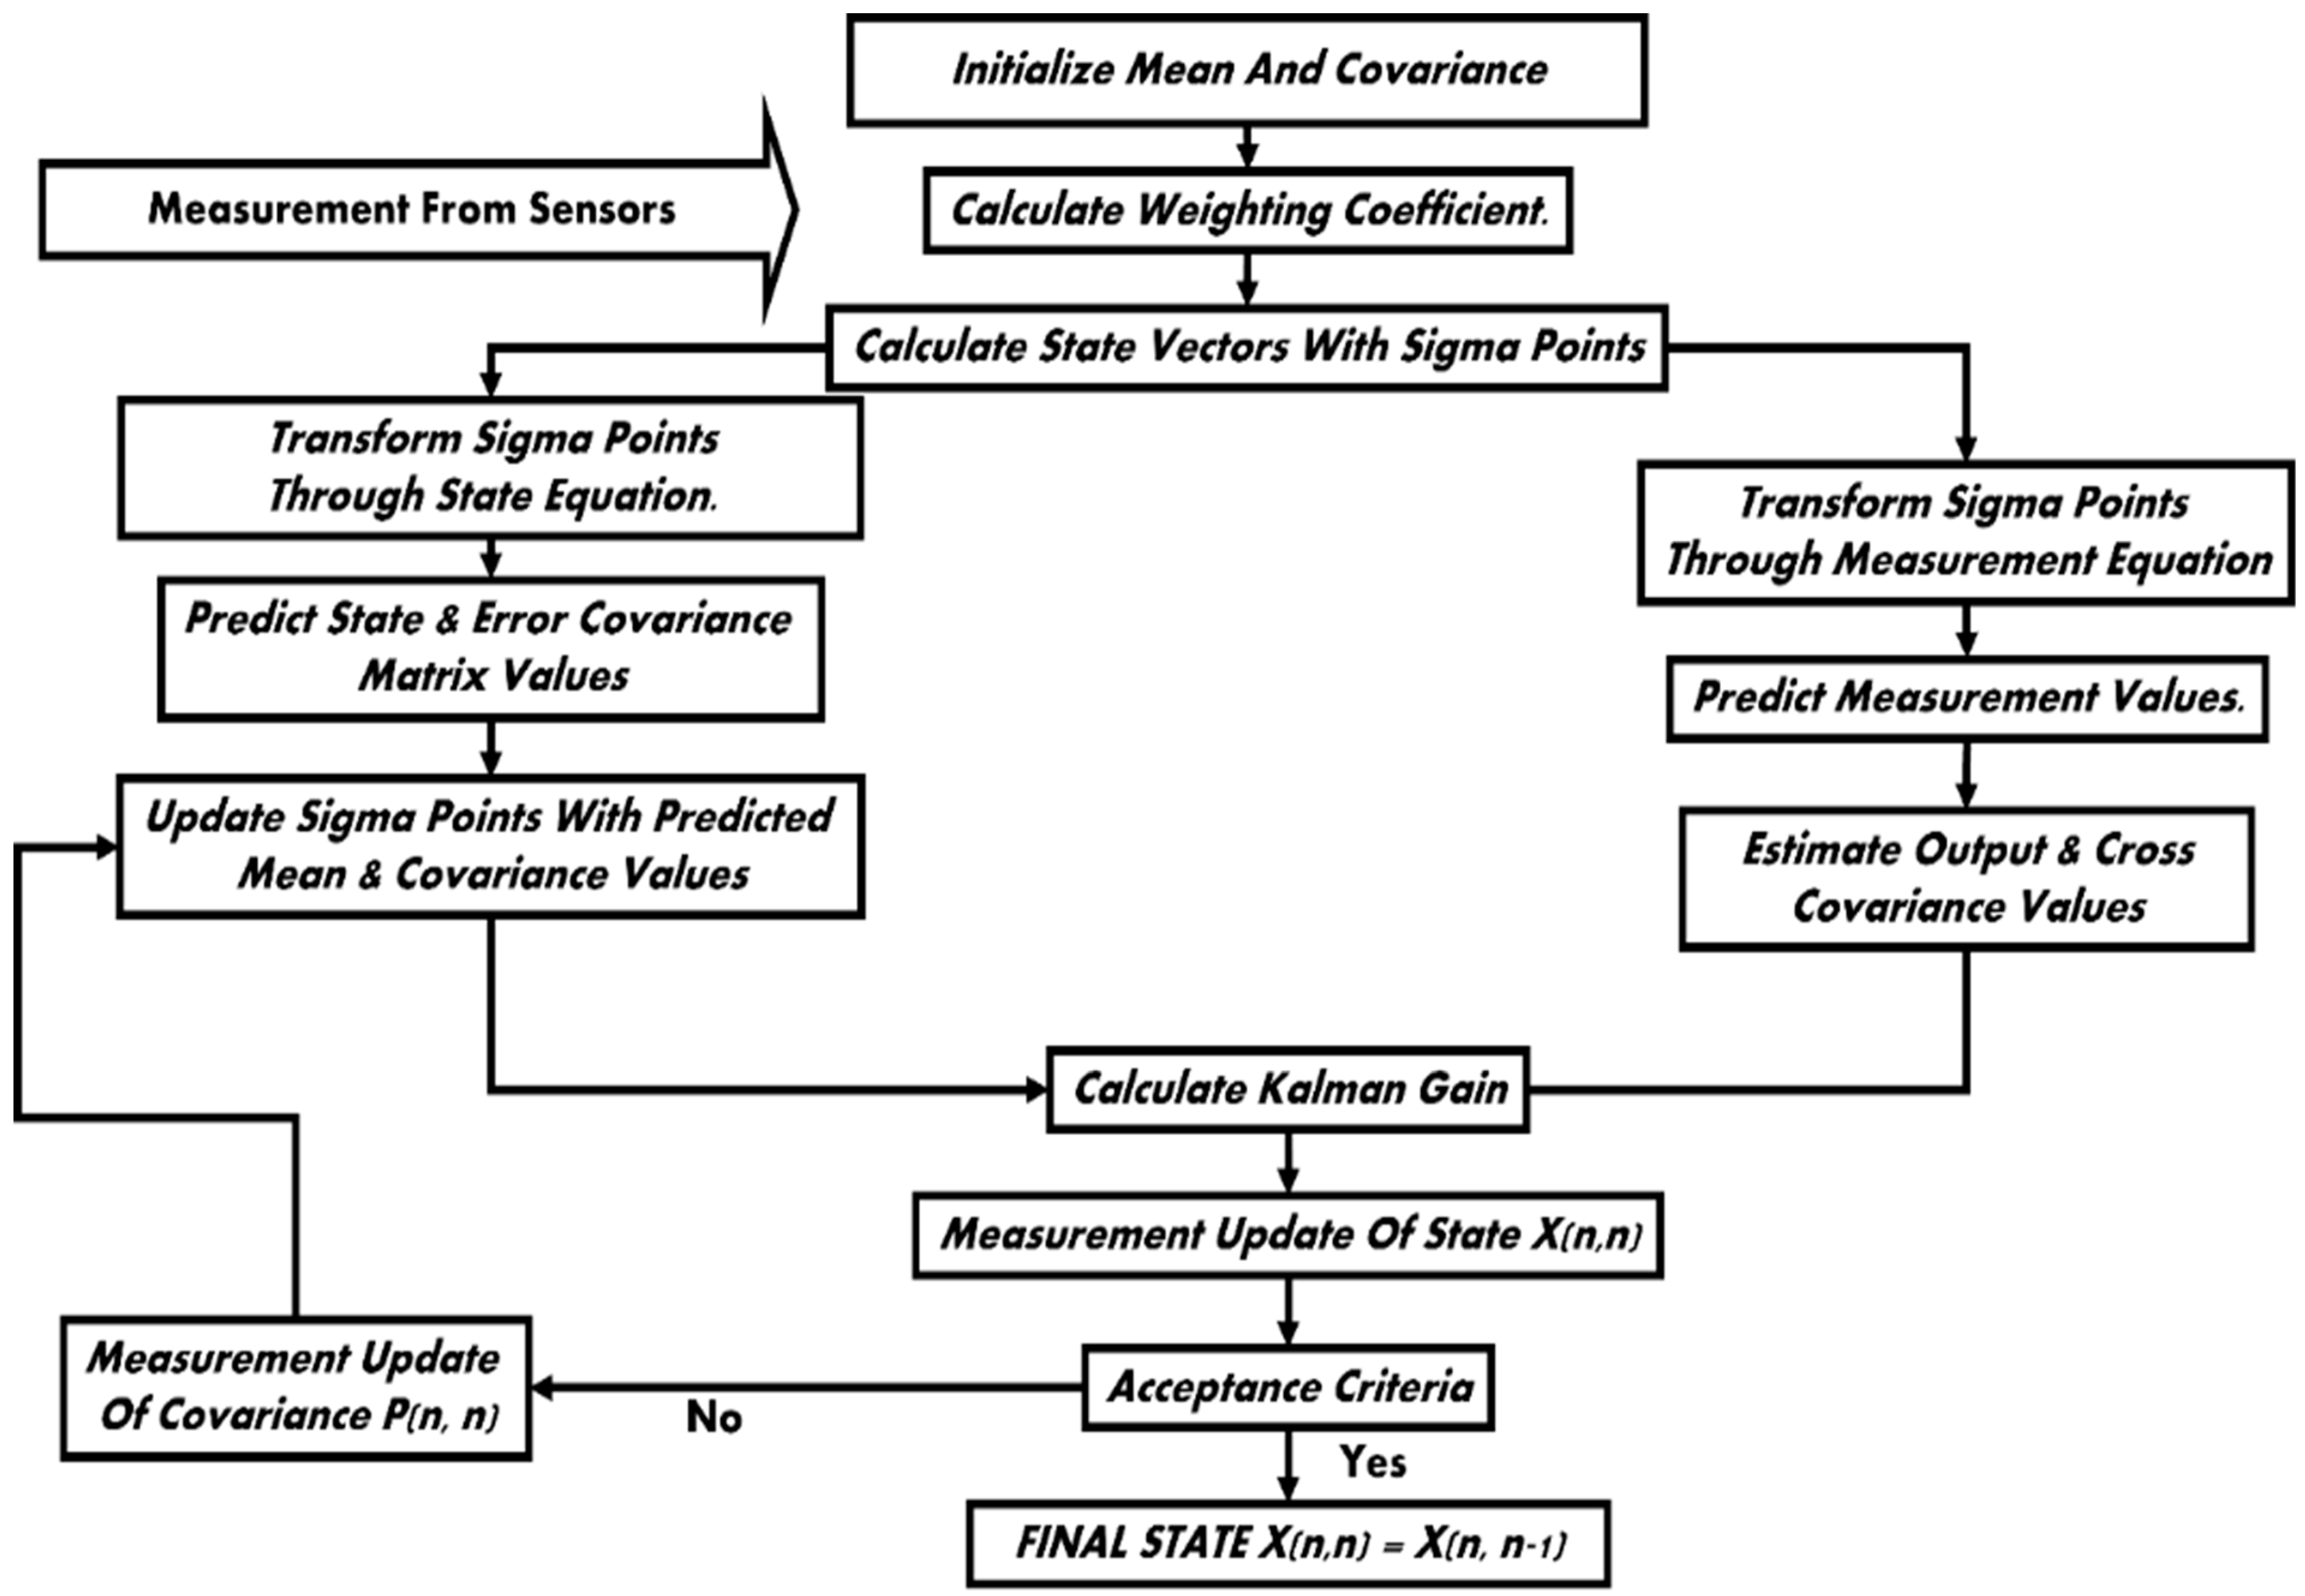
1.2. Significance of Unscented Kalman Filter

The basic algorithm for solving tracking problems in nonlinear systems is the EKF, which effectively provides good results for first-order nonlinearity but is not robust [9]. The stability of the estimation process for low-order nonlinearity is enhanced by the modified [21] and extended Kalman gain filter [21]. However, it performs poorly for more complex, higher-order nonlinearity [13]. The UKF algorithm uses a set of sigma points to approximate the nonlinear relationship between the state of the system, control input, and noise by updating the state estimate and covariance at each time step based on a measurement of the system, and the weights used in the algorithm are calculated based on the mean and covariance of the predicted state distribution [21,22]. By doing so, the UKF can accurately capture any nonlinear function’s posterior mean and variance up to the second order. This feature makes the UKF particularly well-suited for solving higher-order nonlinear problems where traditional linear approaches may fail.
The standard deviation depends on the material used in sensors and other factors such as the design of the sensor, the operating conditions, and the measurement method. Therefore, it affects variability or uncertainty within measurements [23]. The accuracy of the standard deviation is crucial in UKF to ensure reliable and robust performance target tracking tasks to update the system’s state in real-time, mainly when dealing with complex nonlinear systems. Otherwise, the target states can never be accurately estimated [7].

1.3. Significance of Machine Learning

Advancements in computing power and access to large amounts of data have made the development of new machine learning algorithms a rapidly growing field. For example, Transformer-based models, such as GPT-3 [24,25,26], use attention mechanisms to process input sequences and various natural language processing tasks. Graph Neural Networks (GNNs) [27] are designed to handle graph-structured data and have shown promising outcomes in fields such as drug discovery and recommendation systems. Few-shot learning [28,29], a relatively new area of study that has emerged in recent years, focuses on developing models that can learn from limited examples, making it well-suited for tasks where data are scarce. Gated Recurrent Units [30], first introduced in 2014, are a Recurrent Neural Network that handles long data sequences and has been applied to time series analysis, effectively capturing both short-term and long-term dependencies in the data. Wulff et al. [31] utilized the Simultaneous Perturbation Stochastic Approximation (SPSA) algorithm to identify the deformation state and controller coefficient of a quadrotor and subsequently employed a deep neural network to estimate the change in moment of inertia under deformation. Similarly, in Ref. [32], a deep neural network was employed to estimate the moment of inertia and proportional integral derivative (PID) coefficient to obtain several deformation states of a hex-rotor [33,34].
A Multilayer Perceptron (MLP) is a type of Artificial Neural Network (ANN) that is commonly used in deep learning consisting of one or more layers of Artificial Neurons (ANs), where each neuron is a simple mathematical function that takes in one or more inputs, performs a weighted sum of those inputs, adds a bias term, and then applies an activation function to the result [35,36,37]. On the other hand, CNN is a type of ANN specifically designed to process data with a grid-like topology, such as images or time-series data. The key feature of CNN is the use of convolutional layers, which apply a set of learnable filters to the input data [37,38,39,40,41]. Each filter is convolved across the input data to produce a set of feature maps, which capture different aspects of the input data. The feature maps are then passed through activation functions and pooling layers to reduce the spatial dimensionality of the data and increase their invariance to small spatial translations [42,43,44,45]. The application of CNN in time series prediction is demonstrated by Wibaw et al. [46].

1.4. Challenges with Assuming Standard Deviation: Exploring Alternative Approaches

In Ref. [23], one challenge described with assuming standard deviation is that it can lead to underestimation or overestimation of the uncertainty in the system state. If the true standard deviation exceeds the assumed value, the filter may underestimate the uncertainty and produce overconfident estimates. On the other hand, if the true standard deviation is smaller than the assumed value, the filter may overestimate the uncertainty and produce overly conservative estimates. Overall, the wrong assumption of standard deviation limits the filter’s ability to effectively capture the system’s nonlinear behavior [8]. Suppose researchers without expertise or materials attempt to assume the standard deviation within data. In that case, they risk making inaccurate or unreliable estimates, leading to severe consequences in applications where accuracy and reliability are critical. To solve this problem, the author proposed a deep learning method to estimate these standard deviations, which provides many benefits, such as accurate, robust, and unbiased predictions. It can process large amounts of data, be updated, and be reused across multiple scenarios, while human intuition can be hard to replicate.
The main problem of effectively predicting dynamic systems is the focus of this research. It is concentrated on enhancing the target state prediction in particular. The authors acknowledge that the covariance matrix, an essential part of many prediction models, may be difficult to reliably estimate using conventional approaches. The interesting aspect of the paper is how different deep learning models are combined with the UKF to anticipate dynamic systems. Incorporating deep learning models facilitates a data-driven methodology for estimating the covariance matrix, an undertaking frequently arduous in conventional techniques. The authors are able to anticipate target states with a high degree of accuracy and dependability by fusing deep learning with UKF. For this particular application, the research presents a comparative examination of CNN, GRU, LSTM, and MLP models, showing that CNN and GRU perform better in terms of accuracy and dependability. Section 2 gives a detailed explanation of materials and methods. The detailed simulation analysis and results are given in Section 3, followed by a conclusion in Section 4.

2. Materials and Methods

This section presents the methods utilized for radar-based target tracking using UKF and DL techniques. A detailed block diagram in Figure 2 outlines the various stages of UKF processing. Additionally, it serves as a visual representation of the procedures carried out during this process. The UKF algorithm, a nonlinear estimate method used in target tracking, is depicted in the diagram. Its goal is to determine a system’s state from noisy observations. Figure 2 shows that initial estimates are set for the system’s state mean (x) and covariance matrix (P). These figures may be predicated on default assumptions or past knowledge. Radar is the source of the present measurement data (z). There is uncertainty and noise in this data. Weights for the sigma points are calculated (Wm and Wc). These weights evaluate the significance of every sigma point in the estimating process. Sigma points are produced around estimating the present state (x). These points represent the system’s possible states.
To anticipate the system’s future states, the sigma points are transmitted through the nonlinear state equation (f). The predicted state mean (x’) and error covariance matrix (P’) are computed using the converted sigma points as a base. This step estimates the system’s status at the following time step. The predicted sigma points are translated using the measurement equation (h) to produce expected measurements. The anticipated measurement (z’) is computed using the altered sigma points as a base. The predicted mean and covariance values are used to update the sigma points. The cross-covariance matrix (Pxy) and output estimate (y) are computed. The output covariance (Pyy) and the expected error covariance (P’) are used to calculate the Kalman gain (K). The Kalman gain determines the impact of the measurement update on state estimation. The difference between the expected measurement (z’) and the actual measurement (z) is used to update the state estimate (x) along with the Kalman gain. The output covariance (Pxy) and the Kalman gain are used to update the error covariance matrix (P). Acceptance criteria are compared with the modified state and covariance values. The procedure ends if they satisfy the requirements. If not, step 2 of the algorithm is repeated.
Figure 3 provides descriptive insight into steps undertaken to train and test the DL models, where the proposed system, a simulator, was developed to produce a dataset for training and testing. Range ( r ), bearing ( β ), and elevation ( ε ) measurements were used as input to the neural network, which forecasted the standard deviations of those measurements. At each epoch, the predicted output of the neural network was compared to the actual output using a mean squared error as a loss function. The error was calculated and backpropagated in the network to adjust weights. Over time, once the error was reduced to a minimum, models were exported to be integrated into UKF. In this study, 300 possible scenarios are carefully designed. Each of these scenarios is used to simulate the target-observer movement dataset according to Figure 3.
In Table 1, s c n r , δ r n g , δ b r g , δ e l e v , r n g , b r g , V t , V o , e l e v , t c r , t p , o c r s , o p stands for scenario number, the standard deviation in range, is standard deviation in bearing, standard deviation in elevation, initial range, initial bearing, target speed, observer speed, target course, target pitch, observer initial course, and observer pitch, respectively. This provides a comprehensive description of the mathematical model used for 3D target tracking and implements a clear explanation of the UKF algorithm. In this study, the observer and target are again assumed to move with constant velocities and course, as specified in Table 1.

2.1. Deep Neural Network Design

MLP and CNN are DNNs (Deep Neural Networks) typically used for supervised learning tasks such as classification and regression. DNNs can be explained using the following diagram. The following Figure 4 illustrates DNN.
In a DNN, the network consists of multiple neuron layers, including input, hidden, and output. Each neuron in the network applies an activation function to its inputs and passes the result to the next layer of neurons. The equations for a feedforward DNN can be written as:
z l = W l a l 1 + b l
a l = g z l
where W l is the weight matrix between layer l and layer l 1 , b l is the bias vector for layer l , a l is the output of layer l after applying the activation function g to its inputs z l . The forward pass through the network can be computed recursively as:
a 0 = x
a l = g z l = g W l a l 1 + b l   for   l = 1 , 2 , , L
where x is the input to the network and L is the number of layers in the network. During training, the network is trained to minimize a loss function that measures the difference between the predicted output of the network and the target output.
f x = 1 1 + e x
f x = e x e x e x + e x
f x = max 0 , x
where e is again Euler’s number, and x is the input to the function; in this study, as it is a regression problem, ReLU was preferred because it addresses the vanishing problem, converges faster, and can help to produce sparse representations, where many of the neurons in the network have zero activations.

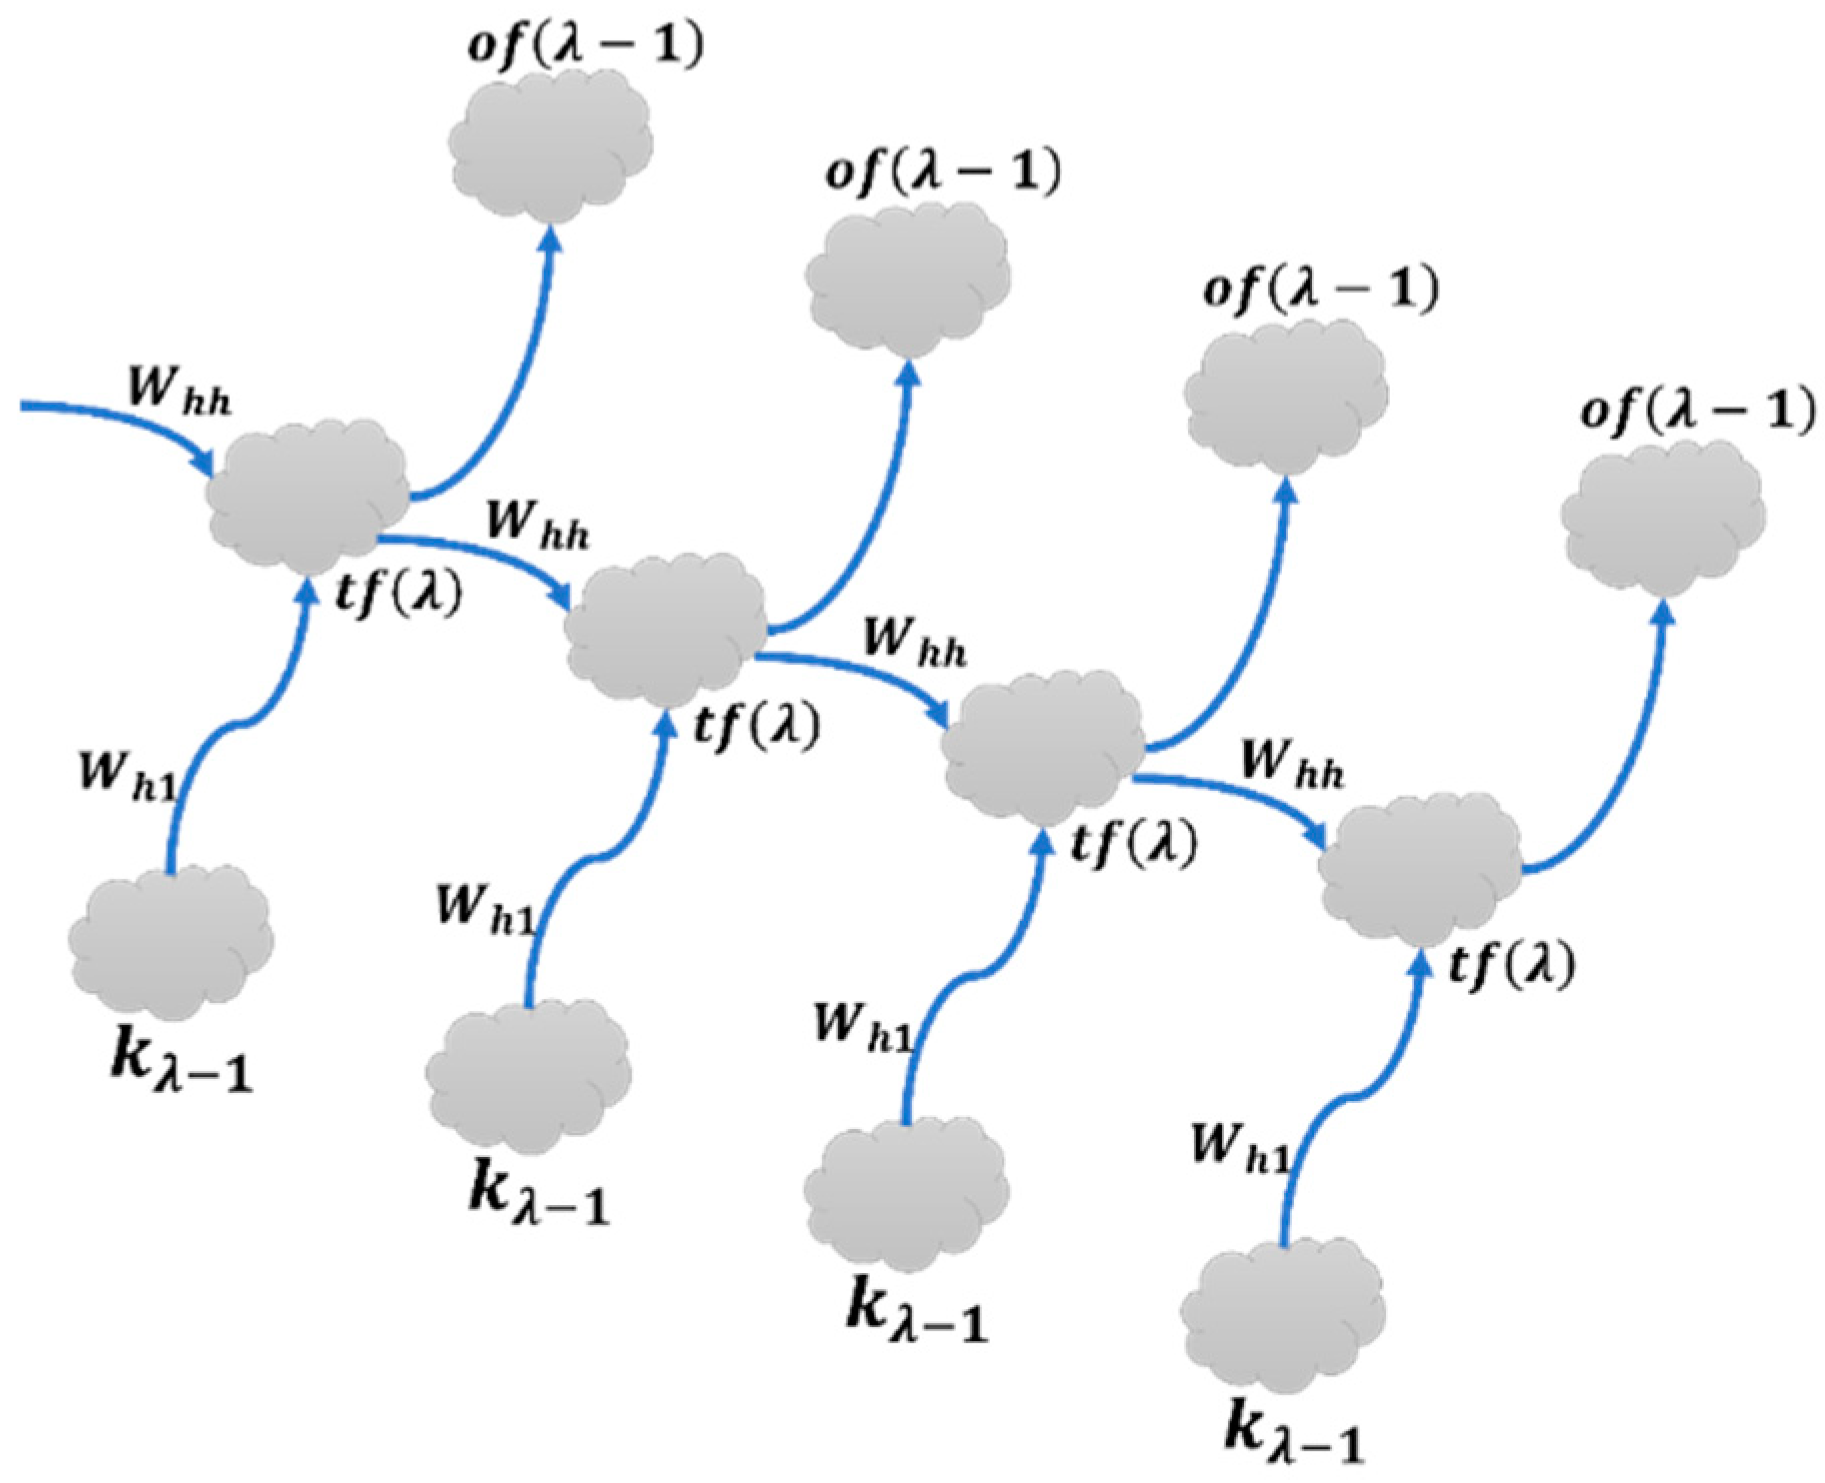
2.2. Recurrent Neural Network (RNN) Design

LSTM and GRU are both types of RNNs designed to handle sequential data. An RNN is a type of neural network designed to work with sequential data where the order of the data matters. It is a neural network with a form of memory, allowing it to capture temporal dependencies in the data. RNNs can receive inputs at each time step and use their internal state (hidden layer) to process the current input and remember previous inputs [34]. They are explained using Figure 5.
t f λ = σ W h h t f λ 1 + W h x x λ + b h
o f λ = σ W y h t f λ + b y
The key feature of an RNN is that the activation at each time step depends on the previous activations. This allows the RNN to capture temporal dependencies in sequential data. In particular, the previous activation tf(λ − 1) serves as a form of memory passed from one time step to the next. Equation (1) computes the activation tf(λ), which is a function of the previous activation tf(λ − 1), the current input x(λ), and biases b h . The equation uses the σ activation function to squash the weighted sum of the previous activation and current input. Equation (2) computes the output of (λ), a function of the current activation and biases b y . The equation uses the σ activation function to squash the weighted sum of the current activation. The key feature of an RNN is that the activation at each time step depends on the previous activations, allowing the RNN to capture temporal dependencies in sequential data. In particular, the previous activation tf(λ − 1) serves as a form of memory that is passed from one time step to the next.

2.3. System Architectural Design

The 3D space target tracking simulator is designed to track a target initially located at a distance “ r ” from an observer located at the origin. The observer and target then move with velocities according to the initial data in Table 1. Range, bearing, and elevation measurements are taken at regular intervals, and noise is added. The simulation ran for a specified time interval of 10 s, the same time step used during training. For the first 10 s, the measurements, such as bearing, range, and elevation, were stored in a buffer, and the UKF did not operate. Afterward, the buffered measurements are combined with respective saved models and scalers to make predictions depending on the model used to make a prediction. The buffered data were first transformed into 3D data to meet the requirements of the GRU, LSTM, and CNN models, but not MLP, as it required 2D data. Predictions were made using each model separately, which were then used in the UKF to estimate the state of the unknown target. The block diagram in Figure 6 provides a visual summary of these steps. In this way, a data-driven approach of all mentioned algorithms (i.e., MLP, CNN, GRU, LSTM) was successfully implemented to predict the standard deviation effectively without relying on human experience or assumptions, which is crucial for the algorithm’s better performance. The framework systematically produces scenarios, conducts simulations, and then compares the measured values with the actual values. An error metric is computed, and depending on a set of acceptance criteria, the procedure either halts or proceeds. While the text mentions deep learning models’ involvement in standard deviation computation, the integration of these models with UKF remains unclear. Deep learning models have the ability to analyze raw data, such as time series, in order to provide early estimations of the state of a system. These estimations can be used as the initial conditions for the UKF.
Overall, the proposed system significantly contributes to the field of target tracking by replacing the need for the assumption of a covariance matrix based on human intuition with the power of machine learning. The results from the above-mentioned algorithms may show that using deep learning algorithms outperformed the traditional method, demonstrating a promising approach to improve the accuracy and reliability of target tracking by eliminating the reliance on subjective assumptions. This method provides a more robust and efficient way to handle the complexity of target-tracking tasks.

3. Simulation Analysis and Results

To provide a clear and objective standard for evaluating the quality and relevance of the research conducted, referring to [35], the following acceptance criteria were considered, as displayed in Table 2.

3.1. Model Training

This study used 300 carefully designed scenarios in which a target was tracked in 3D to create a dataset for training a machine learning model (MLP, CNN, LSTM, and GRU). The dataset contained columns for measured range, measured bearing, and measured elevation as input features and standard deviation in range, standard deviation in bearing, and standard deviation in elevation as output features. The simulation was performed using a simulator designed in Python to create the dataset.

3.1.1. Multilayer Perceptron (MLP)

This paper presents a multilayer perceptron with four dense layers for solving a multi-output regression problem using TensorFlow. The first layer has 128 neurons with ReLU activation, 3 input features, and L1 regularization with a coefficient of 0.001 to prevent overfitting. The second and third layers have 64 and 32 neurons, respectively, with the same activation and regularization. The output layer has three neurons for the three output features with linear activation (Figure 7a). The image depicts a feedforward neural network architecture in deep learning. It consists of an input layer, dense layers, three thick layers, a ReLU activation function, L1 regularization, and an output layer. The input layer accepts data, dense layers connect neurons, and the output layer aggregates information from the previous layers for the final output.

3.1.2. Convolutional Neural Network (CNN)

This paper proposes a Convolutional Neural Network (CNN) for a multi-output regression problem. The model consists of several components: a Conv1D layer, a MaxPooling1D layer, a Flatten layer, two Dense layers, and an output layer. The input shape is (10, 3), where 10 is the number of time steps and 3 is the number of features. The Conv1D layer applies 1D convolution to the input and uses a ReLU activation function, while the MaxPooling1D layer performs max pooling to reduce spatial dimensions. The Flatten layer converts the multi-dimensional feature maps into a 1D vector, as the Dense layers require a 1D input. The first Dense layer has 100 neurons, and the second has 64 neurons, with ReLU activation and L1 regularization of 0.001. The output layer has three neurons representing the final predictions (Figure 7b). The image depicts a 1D CNN architecture that processes sequential data. It is made up of an input layer, convolution 1D layer, ReLU activation, max-pooling 1D layer, flatten layer, dense layers 1 (100 neurons), dense layers 2 (64 neurons), and an output layer (3 neurons). The first layer has 100 neurons, whereas the second layer has 64 neurons with L1 regularization to avoid overfitting. The output layer represents the output classes from a classification task.

3.1.3. Long Short-Term Memory (LSTM)

This paper presents a deep learning model for time series prediction using LSTM networks. The model has four layers, including three LSTM layers and one dense layer. The first LSTM layer has 200 units, the second has 100 units, and the third has 64. All three LSTM layers use the ReLU activation function. This model can also learn hierarchical representations of input data with multiple time steps and features (Figure 8a). The image depicts a recurrent neural network (RNN) architecture for processing 3D input data that employs Gated Recurrent Units (GRUs). The architecture is made up of five layers: input, GRU, dropout, batch normalization, and dense. The GRU layers handle sequential data well, extracting higher-level features while reducing overfitting and enhancing training stability. The final layer is a fully linked layer with three units representing output classes from a classification operation.

3.1.4. Gated Recurrent Unit (GRU)

This paper proposed a deep learning model with 5 GRU layers, and techniques to avoid overfitting and underfitting were implemented. The data were structured into 3D for use with the GRU layers, and the model had a Dense output layer with three units as several output features (Figure 8b). The network architecture has an input layer capable of processing sequential data and accommodating numerous features at each time step. The LSTM layers, specifically designed to efficiently process sequential data, extract more complex features by utilizing three layers with progressively decreasing numbers of units. The network employs LSTM layers, Rectified Linear Unit (ReLU) activation functions, and a concise output layer to produce complex patterns. Deep learning frameworks such as TensorFlow/Keras and PyTorch are employed to build comparable network structures. Factors such as the number of LSTM layers, the number of units in each layer, the choice of activation functions, and the configuration of the output layer are of utmost importance.

3.2. Results of DL

When training DL models, the true value (label) refers to the actual value of the output variable for input in the dataset. On the other hand, the predicted value refers to the output value predicted by the deep learning model for the same input. The true values were typically known during training because they were included in the labeled dataset used to train the model. The predicted values are obtained by feeding the input data into the model and observing its output.
Figure 9, Figure 10, Figure 11 and Figure 12 show the performance of MLP, CNN, LSTM, and GRU models during training by comparing the true unseen data to predicted data. Only 100 data points were plotted to have a clear view. (a) Shows True against predicted standard deviation in bearing, (b) True against predicted standard deviation in elevation, and (c) True against predicted standard deviation in range. After training, each model was tested and evaluated using mean squared error as evaluation metrics according to Equation (10).
MSE = 1 n i = 1 n y i     ŷ i 2
where n is the total number of samples, y i and ŷ i be the true and predicted value of the i t h sample, respectively.
A comparative analysis of the actual and predicted values of standard deviations for specific parameters in a system is presented in Figure 9a–c. These parameters appear to be associated with bearing, elevation, and range values, potentially in the context of object tracking or localization. The model’s ability to predict bearing values’ variability (standard deviation) is contrasted with the actual variability observed in the data in Figure 9a. The model’s capacity for predicting the variability of elevation values is illustrated in Figure 9b. The model’s ability to predict the variability of range values is evaluated in Figure 9c.
The parameters of bearing, elevation, and range are the primary focus of each subplot in Figure 10a–c. It represents the sequence of data points, denoted by the sample number, as well as the standard deviation’s magnitude for the specific parameter along with the anticipated standard deviation for the given range, elevation, or bearing with the genuine or true standard deviation for range, elevation, or bearing, respectively.
The model’s ability to predict each parameter’s variability (standard deviation) compared to the actual variability observed in the data is illustrated in Figure 11 and Figure 12. The plots demonstrate that the actual standard deviations (orange lines) do not precisely align with the predicted standard deviations (blue lines) for any of the parameters. This implies that the model may not effectively represent the actual variability in the data. The sample range is characterized by fluctuations in the standard deviations, both predicted and actual. This implies that the data’s variability is not constant. The model used to generate the predictions may have limitations in accurately estimating the standard deviations for these parameters, as evidenced by the discrepancies between the predicted and actual values.
Table 3 below provides an overview of the models’ performance. After testing, the new dataset shows each model’s overall mean squared error.

Hybrid (DL-UKF)

The average distance to a traceable target is about 65,000 m, and the average velocity of moving aircraft is 130 m/s. These measurements are used to compute the initial target’s state vector, and they are assumed to follow Gaussian distribution with zero mean; therefore, the following expression is derived.
X s 0 = 130 130 130 65,000 sin β sin ε 65,000 sin β sin ε 65,000 sin ε T
Moreover, from Equation (11), the initial covariance matrix P   0 0 = d i a g o n a l   4   X s ( k ) 2 12   . For evaluating the performance of the system, which incorporates DL models with UKF, five different scenarios were designed. Table 4 shows the values for those scenarios.
The fifth scenario from Table 4 is chosen to display the simulation result. The Monte Carlo method was used to model the nonlinearities in the target motion and measurement models, which allows for more accurate predictions of the target’s state. The following graphs present the results of this study.
Figure 13a displays the true path of both the target and observer, as well as the estimated path of the target achieved through the utilization of the UKF algorithm. The standard deviations implemented in the UKF algorithm are determined based solely on human intuition and experience, with an assumption of being within the range of 0 to 3 degrees. The UKF algorithm alone has demonstrated efficaciousness in estimating the unknown states of the target as expected. Where xo, yo, and zo are the observers’ x, y, and z coordinates. xt, yt, and zt are the target’s x, y, and z coordinates. prxt, pryt, and przt are the estimated x, y, and z coordinates.
Figure 13b–e depict the true path of both the target and observer, as well as the estimated target path achieved through the integration of GRU, LSTM, MLP, and CNN, respectively, into UKF. For comparative purposes, the accompanying graphs depict a combination of the mean square error for range, bearing, elevation, course, and speed of all model predictions.
Figure 14 showcases a comparative model performance analysis integrated into the UKF algorithm. The predictions made by the UKF algorithm were used as the benchmark to establish a reference for analysis. The efficacy of the alternative algorithms was evaluated based on their ability to predict values that closely agreed with the UKF’s predictions. Results indicated that both LSTM and GRU models showed high effectiveness in their predictive performance, which can be further explained in Table 5. Based on the available data and information, it can be concluded that using a UKF with the predicted standard deviations from various machine learning models led to accurate prediction of target states. Among the models, CNN showed faster convergence in its predictions, followed by GRU, LSTM, and MLP.
Integrating deep learning algorithms with UKF has shown tremendous success in target-tracking applications. In this context, multiple presents the performance of this approach in 5 scenarios. It reports the convergence time for range (R), course (C), speed (S), elevation (E), and pitch (P) for each scenario based on the acceptance criteria specified for all algorithms.
Scenario 2 was used as an example, where the UKF’s Total Convergence (TC) was considered ideal since it was simulated using the standard deviation provided in Table 4. By incorporating DL models into the UKF and simulating without assuming the standard deviation, the authors aimed to obtain the same standard deviation, implying that the convergence time should be identical to that obtained when using UKF alone. The results in Table 4 indicate that the LSTM model’s predictions were almost similar to the UKF’s predictions, with only a one-second difference, followed by the GRU, CNN, and MLP models, respectively. This pattern was consistent across most of the cases examined. Table 3 corroborates these results by showing that the LSTM model had the lowest MSE, followed by the GRU, CNN, and MLP models.

4. Conclusions

Combining an unscented Kalman filter with various deep learning models represents a viable approach for accurately predicting dynamic systems in multiple applications. This approach is beneficial when a data-driven approach is required to estimate the covariance matrix. It was possible to achieve forecasts of target states that were extremely accurate and reliable by integrating the strengths of UKF and deep learning models. When it comes to nonlinear state estimation, UKF offers a framework that is both robust and adaptable. At the same time, deep learning models can learn from enormous datasets and produce accurate predictions. Among deep learning models, CNN and GRU models have been observed to outperform LSTM and MLP models in terms of accuracy and reliability. Specifically, CNN and GRU models estimated a one-meter-per-second speed less than LSTM and MLP models at the 100th second. It is possible to impart the improved performance of CNN and GRU models to their capacity to process sequential input and maintain long-term dependencies. Additionally, these models are well-suited for this task because of their ability to handle sequential data. In contrast to MLP models, often utilized for more generic classification tasks, CNN models are built specifically for image processing.

Author Contributions

Conceptualization, U.P., S.K.R., B.O.L.J., H.M.R., S.A. and W.P.; writing—original draft preparation, U.P., S.K.R., B.O.L.J., H.M.R., S.A. and W.P.; writing—review and editing, U.P., S.K.R., B.O.L.J., H.M.R., S.A. and W.P. All authors have read and agreed to the published version of the manuscript.

Funding

This research received no external funding.

Institutional Review Board Statement

Not applicable.

Informed Consent Statement

Not applicable.

Data Availability Statement

The datasets generated during and analyzed during the current study are available from the corresponding author upon reasonable request.

Conflicts of Interest

The authors declare no conflicts of interest.

References

  1. James, R.J. A History of Radar. IEE Rev. 1989, 35, 343. [Google Scholar] [CrossRef]
  2. Cho, Y.S.; Cho, S.H. A Design of the Frequency Modulated Continuous Wave (FMCW) Radar System. In Proceedings of the 18th IEEE International Symposium on Consumer Electronics (ISCE 2014), Jeju, Republic of Korea, 22–25 June 2014; IEEE: Piscataway, NJ, USA, 2014; pp. 1–2. [Google Scholar]
  3. Julier, S.J.; Uhlmann, J.K. New Extension of the Kalman Filter to Nonlinear Systems; Kadar, I., Ed.; SPIE: Berlin, Germany, 1997; p. 182. [Google Scholar]
  4. Koteswara Rao, S.; Kavitha Lakshmi, M.; Jahan, K.; Naga Divya, G.; Omkar Lakshmi Jagan, B. Acceptance Criteria of Bearings-Only Passive Target Tracking Solution. IETE J. Res. 2023, 69, 2874–2885. [Google Scholar] [CrossRef]
  5. Kumar, D.V.A.N.R.; Rao, S.K.; Raju, K.P. Integrated Unscented Kalman Filter for Underwater Passive Target Tracking with Towed Array Measurements. Optik 2016, 127, 2840–2847. [Google Scholar] [CrossRef]
  6. Divya, G.N.; Koteswara Rao, S. Implementation of Ensemble Kalman Filter Algorithm for Underwater Target Tracking. J. Control Decis. 2022, 1–10. [Google Scholar] [CrossRef]
  7. Divya, G.N.; Rao, S.K. Application and Comparison of Bayesian Framework Algorithms for Underwater State Estimation. In Proceedings of the 2019 International Symposium on Ocean Technology (SYMPOL), Ernakulam, India, 11–13 December 2019; IEEE: Piscataway, NJ, USA, 2019; pp. 10–20. [Google Scholar]
  8. Ling, J. Target Tracking Using Kalman Filter Based Algorithms. J. Phys. Conf. Ser. 2021, 2078, 012020. [Google Scholar] [CrossRef]
  9. Divya, K.S.; Ramesh, K.S.; Rao, S.K.; Naga Divya, G. Underwater Object Tracking Using Unscented Kalman Filter. In Proceedings of the 2021 3rd International Conference on Advances in Computing, Communication Control and Networking (ICAC3N), Greater Noida, India, 17 December 2021; IEEE: Piscataway, NJ, USA, 2021; pp. 1729–1733. [Google Scholar]
  10. Rao, S.K.; Babu, V.S. Unscented Kalman Filter With Application To Bearings-Only Passive Manoeuvring Target Tracking. In Proceedings of the 2008 International Conference on Signal Processing, Communications and Networking, Chennai, India, 4–6 January 2008; IEEE: Piscataway, NJ, USA, 2008; pp. 219–224. [Google Scholar]
  11. Xu, L.; Liu, C.; Yi, W.; Li, G.; Kong, L. A Particle Filter Based Track-before-Detect Procedure for Towed Passive Array Sonar System. In Proceedings of the 2017 IEEE Radar Conference (RadarConf), Seattle, WA, USA, 8–12 May 2017; IEEE: Piscataway, NJ, USA, 2017; pp. 1460–1465. [Google Scholar]
  12. Sun, W.; Sun, M.; Zhang, X.; Li, M.; Wanchun, D. Moving Vehicle Detection and Tracking Based on Optical Flow Method and Immune Particle Filter under Complex Transportation Environments. Complexity 2020, 2020, 3805320. [Google Scholar] [CrossRef]
  13. Divya, G.N.; Rao, S.K. Application of Sigma Point Particle Filter Method for Passive State Estimation in Underwater. Def. Sci. J. 2021, 71, 507–514. [Google Scholar] [CrossRef]
  14. Wu, Q.; Chen, L.; Li, Y.; Wang, Z.; Yao, S.; Li, H. Reweighted Robust Particle Filtering Approach for Target Tracking in Automotive Radar Application. Remote Sens. 2022, 14, 5477. [Google Scholar] [CrossRef]
  15. Abdoul-Moaty, E.-S.; Abdoul-Shahid, T.R.; El-Din Sayed Hafez, A.; Abd-El-Latif, M. A Particle Filter for Mutistatic Radar Tracking. In Proceedings of the 2014 IEEE Aerospace Conference, Big Sky, MT, USA, 1–8 March 2014; IEEE: Piscataway, NJ, USA, 2014; pp. 1–5. [Google Scholar]
  16. Ishtiaq, S.; Wang, X.; Hassan, S. Multi-Target Tracking Algorithm Based on 2-D Velocity Measurements Using Dual-Frequency Interferometric Radar. Electronics 2021, 10, 1969. [Google Scholar] [CrossRef]
  17. Fang, X.; Huang, D. Robust Adaptive Cubature Kalman Filter for Tracking Manoeuvring Target by Wireless Sensor Network under Noisy Environment. IET Radar Sonar Navig. 2023, 17, 179–190. [Google Scholar] [CrossRef]
  18. Xu, J.; Xu, M.; Zhou, X. The Bearing Only Target Tracking of UUV Based on Cubature Kalman Filter with Noise Estimator. In Proceedings of the 2017 36th Chinese Control Conference (CCC), Dalian, China, 26–28 July 2017; IEEE: Piscataway, NJ, USA, 2017; pp. 5288–5293. [Google Scholar]
  19. Wang, X.; Zhang, X.; Gong, H.; Jiang, J.; Rai, H.M. A Flight Control Method for Unmanned Aerial Vehicles Based on Vibration Suppression. IET Collab. Intell. Manuf. 2021, 3, 252–261. [Google Scholar] [CrossRef]
  20. Nalini Santhosh, M.; Koteswara Rao, S.; Das, R.P.; Lova Raju, K. Underwater Target Tracking Using Unscented Kalman Filter. Indian. J. Sci. Technol. 2015, 8, 1–5. [Google Scholar] [CrossRef]
  21. You, D.; Liu, P.; Shang, W.; Zhang, Y.; Kang, Y.; Xiong, J. An Improved Unscented Kalman Filter Algorithm for Radar Azimuth Mutation. Int. J. Aerosp. Eng. 2020, 2020, 1–10. [Google Scholar] [CrossRef]
  22. Salcedo-Bosch, A.; Rocadenbosch, F.; Sospedra, J. A Robust Adaptive Unscented Kalman Filter for Floating Doppler Wind-LiDAR Motion Correction. Remote Sens. 2021, 13, 4167. [Google Scholar] [CrossRef]
  23. Ibe, O.C. Introduction to Descriptive Statistics. In Fundamentals of Applied Probability and Random Processes; Elsevier: Amsterdam, The Netherlands, 2014; pp. 253–274. [Google Scholar]
  24. Vaswani, A.; Shazeer, N.; Parmar, N.; Uszkoreit, J.; Jones, L.; Gomez, A.N.; Kaiser, Ł.; Polosukhin, I. Attention Is All You Need. In Proceedings of the Advances in Neural Information Processing Systems, Long Beach, CA, USA, 4–9 December 2017; Guyon, I., Luxburg, U., Von Bengio, S., Eds.; Curran Associates, Inc.: New York, NY, USA, 2017; Volume 30. [Google Scholar]
  25. Yenduri, G.; Ramalingam, M.; Selvi, G.C.; Supriya, Y.; Srivastava, G.; Maddikunta, P.K.R.; Raj, G.D.; Jhaveri, R.H.; Prabadevi, B.; Wang, W.; et al. GPT (Generative Pre-Trained Transformer)—A Comprehensive Review on Enabling Technologies, Potential Applications, Emerging Challenges, and Future Directions. IEEE Access 2024, 12, 54608–54649. [Google Scholar] [CrossRef]
  26. Sufi, F. Generative Pre-Trained Transformer (GPT) in Research: A Systematic Review on Data Augmentation. Information 2024, 15, 99. [Google Scholar] [CrossRef]
  27. Zhang, J.; Chen, B.; Zhang, L.; Ke, X.; Ding, H. Neural, Symbolic and Neural-Symbolic Reasoning on Knowledge Graphs. AI Open 2021, 2, 14–35. [Google Scholar] [CrossRef]
  28. Finn, C.; Abbeel, P.; Levine, S. Model-Agnostic Meta-Learning for Fast Adaptation of Deep Networks; PMLR: Birmingham, UK, 2017. [Google Scholar]
  29. Duan, R.; Li, D.; Tong, Q.; Yang, T.; Liu, X.; Liu, X. A Survey of Few-Shot Learning: An Effective Method for Intrusion Detection. Secur. Commun. Netw. 2021, 2021, 1–10. [Google Scholar] [CrossRef]
  30. Cho, K.; van Merrienboer, B.; Bahdanau, D.; Bengio, Y. On the Properties of Neural Machine Translation: Encoder–Decoder Approaches. In Proceedings of the SSST-8, Eighth Workshop on Syntax, Semantics and Structure in Statistical Translation, Doha, Qatar, 25 October 2014; Association for Computational Linguistics: Stroudsburg, PA, USA, 2014; pp. 103–111. [Google Scholar]
  31. Wulff, B.; Schuecker, J.; Bauckhage, C. SPSA for Layer-Wise Training of Deep Networks; Springer: Berlin/Heidelberg, Germany, 2018; pp. 564–573. [Google Scholar]
  32. Oktay, T.; Kose, O. Quadrotor Flight System Design Using Collective and Differential Morphing with SPSA and ANN. Int. J. Intell. Syst. Appl. Eng. 2021, 9, 159–164. [Google Scholar] [CrossRef]
  33. Oktay, T.; Kose, O. Hexarotor Longitudinal Flight Control with Deep Neural Network, PID Algorithm and Morphing. Eur. J. Sci. Technol. 2021, 27, 115–124. [Google Scholar] [CrossRef]
  34. Gao, C.; Liu, H.; Zhou, S.; Su, H.; Chen, B.; Yan, J.; Yin, K. Maneuvering Target Tracking with Recurrent Neural Networks for Radar Application. In Proceedings of the 2018 International Conference on Radar (RADAR), Brisbane, QLD, Australia, 27–31 August 2018; IEEE: Piscataway, NJ, USA, 2018; pp. 1–5. [Google Scholar]
  35. Ramchoun, H.; Amine, M.; Idrissi, J.; Ghanou, Y.; Ettaouil, M. Multilayer Perceptron: Architecture Optimization and Training. Int. J. Interact. Multimed. Artif. Intell. 2016, 4, 26. [Google Scholar] [CrossRef]
  36. Rai, H.M.; Chatterjee, K. A Novel Adaptive Feature Extraction for Detection of Cardiac Arrhythmias Using Hybrid Technique MRDWT & MPNN Classifier from ECG Big Data. Big Data Res. 2018, 12, 13–22. [Google Scholar] [CrossRef]
  37. Rai, H.M.; Trivedi, A.; Shukla, S. ECG Signal Processing for Abnormalities Detection Using Multi-Resolution Wavelet Transform and Artificial Neural Network Classifier. Measurement 2013, 46, 3238–3246. [Google Scholar] [CrossRef]
  38. Goyal, Y.R.; Rai, H.M.; Aggarwal, M.; Saxena, K.; Amanzholova, S. Revolutionizing Skin Cancer Detection: A Comprehensive Review of Deep Learning Methods. In Proceedings of the Proceedings of the 5th International Conference on Information Management & Machine Intelligence, Jaipur, India, 23 November 2023; ACM: New York, NY, USA, 2023; pp. 1–6. [Google Scholar]
  39. Rai, H.M.; Chatterjee, K.; Gupta, A.; Dubey, A. A Novel Deep CNN Model for Classification of Brain Tumor from MR Images. In Proceedings of the 2020 IEEE International Conference for Convergence in Engineering, ICCE 2020-Proceedings, Kolkata, India, 5 September 2020; Institute of Electrical and Electronics Engineers Inc.: Piscataway, NJ, USA, 2020; pp. 134–138. [Google Scholar]
  40. Rai, H.M.; Chatterjee, K.; Dubey, A.; Srivastava, P. Myocardial Infarction Detection Using Deep Learning and Ensemble Technique from ECG Signals. In Proceedings of the Second International Conference on Computing, Communications, and Cyber-Security. Lecture Notes in Networks and Systems, Ghaziabad, India, 3–4 October 2020; Springer: Singapore, 2020; Volume 203, pp. 717–730. [Google Scholar]
  41. Rai, H.M.; Chatterjee, K.; Mukherjee, C. Hybrid CNN-LSTM Model for Automatic Prediction of Cardiac Arrhythmias from ECG Big Data. In Proceedings of the 2020 IEEE 7th Uttar Pradesh Section International Conference on Electrical, Electronics and Computer Engineering (UPCON), Prayagraj, India, 27 November 2020; IEEE: Piscataway, NJ, USA, 2020; pp. 1–6. [Google Scholar]
  42. Albawi, S.; Mohammed, T.A.; Al-Zawi, S. Understanding of a Convolutional Neural Network. In Proceedings of the 2017 International Conference on Engineering and Technology (ICET), Antalya, Turkey, 21–24 August 2017; IEEE: Piscataway, NJ, USA, 2017; pp. 1–6. [Google Scholar]
  43. Rai, H.M.; Chatterjee, K.; Dashkevich, S. Automatic and Accurate Abnormality Detection from Brain MR Images Using a Novel Hybrid UnetResNext-50 Deep CNN Model. Biomed. Signal Process Control 2021, 66, 102477. [Google Scholar] [CrossRef]
  44. Rai, H.M.; Chatterjee, K.; Dashkevych, S. The Prediction of Cardiac Abnormality and Enhancement in Minority Class Accuracy from Imbalanced ECG Signals Using Modified Deep Neural Network Models. Comput. Biol. Med. 2022, 150. [Google Scholar] [CrossRef]
  45. Rai, H.M.; Chatterjee, K. Detection of Brain Abnormality by a Novel Lu-Net Deep Neural CNN Model from MR Images. Mach. Learn. Appl. 2020, 2, 100004. [Google Scholar] [CrossRef]
  46. Wibawa, A.P.; Utama, A.B.P.; Elmunsyah, H.; Pujianto, U.; Dwiyanto, F.A.; Hernandez, L. Time-Series Analysis with Smoothed Convolutional Neural Network. J. Big Data 2022, 9, 44. [Google Scholar] [CrossRef]
Figure 1. Observer–target movement in an aerial environment. β : Bearing. t c r s : Target course, o b c r s : Observer course, r: Range. TBA: Target Bearing Angle, tpi: Target Pitch, obpi: Observer pitch, ε : Elevation.
Applsci 14 08332 g001
Figure 2. UKF block diagram for target tracking.
Applsci 14 08332 g002
Figure 3. Schematic diagram of proposed DL approaches, training, and testing.
Applsci 14 08332 g003
Figure 4. DNN Architecture.
Applsci 14 08332 g004
Figure 5. Basic Recurrent neural network block diagram.
Applsci 14 08332 g005
Figure 6. System block diagram.
Applsci 14 08332 g006
Figure 7. Block diagram of used (a) Multilayered Perceptron (MLP) and (b) Convolutional Neural Network (CNN) classifiers.
Applsci 14 08332 g007
Figure 8. Block diagram of LSTM and GRU.
Applsci 14 08332 g008
Figure 9. ML models evaluation metrics—MLP.
Applsci 14 08332 g009
Figure 10. ML models evaluation metrics—CNN.
Applsci 14 08332 g010
Figure 11. ML model’s evaluation metrics—LSTM.
Applsci 14 08332 g011
Figure 12. ML models evaluation metrics—GRU.
Applsci 14 08332 g012
Figure 13. Observer, target’s true and estimated paths using (a) UKF only, (b) UKF-GRU, (c) UKF-LSTM, (d) UKF-MLP, and (e) UKF-MLP.
Applsci 14 08332 g013aApplsci 14 08332 g013b
Figure 14. Error in estimated (a) speed, (b) course, and (c) pitch.
Applsci 14 08332 g014
Table 1. Scenario parameters and initial conditions.
s c n r δ r n g (m) δ b r g (deg) δ e l e v (deg) r n g (m) b r g (deg) V t (m/s) V o (m/s) e l e v (deg) t c r (deg) t p (deg) o c r s (deg) o p (deg)
113.9490.031740.48258,3642714973476.694270.065300.054.5
214.7540.047150.47748,7731542752657.62189.9953119.9116.4
29911.8330.03750.61756,903664003568.73490.005360.0064.5
30014.7180.03990.079448,641334053751.06389.99120119.9124.5
Table 2. Acceptance Criteria.
CriteriaSingle Monte Carlo Run100 Monte Carlo Runs
Range Error 10 % of true range 3.3 % of true range
Course Error 5 ° 1.67 °
Speed Error 1 m/s 0.33 m/s
Pitch Error 5 ° 1.67 °
Table 3. Performance comparison of LSTM, GRU, CNN, and MLP Models during training.
ParametersMSE
MLPCNNLSTMGRU
δ r n g (in m) 1.81981 1.451240.543280.3335
δ b r g (in deg) 1.59   ×   10 08 1.32   ×   10 08 4.84807   ×   10 09 3.2981 × 10 09
δ e l e v (in deg) 1.61   ×   10 08 1.37   ×   10 08 5.46733   ×   10 09 4.0326 × 10 09
Table 4. Scenario parameters and initial conditions for DL-UKF.
s c n r δ r n g (m) δ b r g (deg) δ e l e v (deg) r n g (m) b r g
(deg)
V t
(m/s)
V o
(m/s)
e l e v
(deg)
t c r (deg) t p (deg) o c r s
(deg)
o p
(deg)
111.41830.05760.07349,07644319416889.90120119116.4
213.24660.04240.04145,9722685073354269.9100239115.5
312.41020.06170.07156,9023302133876270.06030055.5
49.81080.04480.08547,861137651314390.00536056.4
511.62550.08210.07657,3383512873758270.06530063.6
Table 5. Convergence times.
SNUKFMLPCNNLSTMGRU
CSPTCCSPTCDifCSPTCDifCSPTCDifCSPTCDif
110923085230991774617753113197571973311318549185451061925719238
23016759167281707217032918783187203016668166 1 30173691736
340196401961221862018610123184201841213619939199 3 128190201906
411618468184130209402092512920753207239518652186 2 1151964919612
5145253632531272245122429127224512242915226264262914525262252 1
Disclaimer/Publisher’s Note: The statements, opinions and data contained in all publications are solely those of the individual author(s) and contributor(s) and not of MDPI and/or the editor(s). MDPI and/or the editor(s) disclaim responsibility for any injury to people or property resulting from any ideas, methods, instructions or products referred to in the content.

