Abstract
Human health is significantly impacted by the quality of the air in living areas. Numerous factors, such as the kind of particle, clean air delivery rate, room geometry, surface features, and thermal plume produced by people or other equipment, all have an impact on indoor particle movement. This work uses computational fluid dynamics to quantitatively examine the performance of a portable air purifier that is routinely used to improve the indoor air quality of a room. The volumetric flow rate, particle diameter, and placement of the air cleaner device were considered in the assessment of the particle transport characteristics. The temperature, velocity, and age of the air distribution in the room were computed in three-dimensional simulations, and the effectiveness of the air cleaning device (ACD) in eliminating contaminants was then investigated. Clean air delivery rate (CADR), collection efficiency, and particle concentration rate values were also computed for every case that was taken into consideration. It is found that CADR and collection efficiency values for larger particles are about 2–7% better than those for smaller particles. The collection efficiency of ACD with different operating conditions is in the range of 71% to 87%. Better collection performance parameters are observed with higher flow rates.
1. Introduction
Indoor air quality is very important for occupant health and comfort. Since people spend almost 90% of their daily time in indoor spaces, indoor air quality directly affects human health [1,2]. Luo et al. [3] reported a connection among air pollution, meteorological conditions, and respiratory illnesses like pertussis. Aglan et al. [4] stated that intensifying respiratory symptoms have been linked to increased community-level exposure to air pollution. Experimental data indicates that the health effects of contaminants are lessened in a room with an airflow. Regardless, it is important to keep in mind that certain high-use, high-frequency, high-duration practices, the presence of vulnerable populations, as well as indoor characteristics and layout (volume, air exchange rate, etc.) can result in chronic exposures that are higher than the WHO guidelines or reference values, indicating the need to restrict this kind of exposure [5]. Therefore, it is crucial to provide adequate fresh air and control the concentration of pollutants in enclosed spaces. There are various types of pollutants, such as particulate matter, gaseous pollutants, and biological molecules. There are also several methods to improve indoor air quality. Elimination of the contaminant source, increase in the ventilation rate [6], and placement of an air cleaning device [7] into the indoor environment are some of these methods.
Since the spreading out of the coronavirus disease (COVID-19), the importance of air cleaning devices has increased. During the pandemic, most people spent long hours indoors due to the lockdowns and the restrictions on outdoor activities [8]. The spread of the COVID-19 virus occurs with droplets and particles. In an indoor environment, a person carrying the virus can transmit the virus by coughing and speaking. The WHO states that breathing in respiratory droplets larger than 5 μm during coughing or sneezing can spread the coronavirus infections [9]. Studies have also been conducted to determine whether the transmission via smaller particles is feasible [10,11,12]. Therefore, it is crucial to clean indoor air with appropriate air cleaning devices [5]. Recently, air cleaning devices have been widely used in indoor spaces such as hospitals, schools, workplaces, as well as houses [13]. However, some of the data provided by the manufacturers are not reliable because of the lack of experimental data. Also, there are only a few appropriate laboratory facilities in which to conduct reliable experiments to make evaluations [14]. Therefore, it is very important to evaluate the effectiveness of portable air cleaners both experimentally and numerically. Through the years, breakthroughs in computer science have produced solution techniques based on computational fluid dynamics (CFD) to handle fluid dynamics problems [15]. Very complicated fluid flows can be simulated in a variety of settings and geometry thanks to the CFD solution of nonlinear Navier–Stokes equations [16,17].
There are different parameters to evaluate the performance of the air cleaners. One of them is the clean air delivery rate (CADR) [18]. CADR is the distribution rate of fresh air delivered to the room by the air cleaner. To measure the effectiveness of air cleaners, CADR is often used as an international metric. The AHAM (Association of Home Appliance Manufacturers) standard defines the CADR measurement method and processes [19]. CADR is determined by the rate of change in the concentration of particles and pollutants in the room over time using the cleaning device. The higher the CADR value, the higher the amount of clean air supplied to the environment, and, therefore, the higher the filtering rate of the pollutants in the air.
Another parameter for air cleaners is the age of the air [19]. The age of the air is the mean time that a particle takes to travel from an inlet point to reach a certain point in the space. If air age is high, it means that fresh air reaches the desired area later. Therefore, it is not desirable to have a high air age [20].
A limited number of studies in the literature show that the position and the location of the air cleaner affects the air flow patterns and changes air cleaning efficiencies [21]. It has been shown that air cleaning device (ACD) placement is an important parameter with respect to pollutant removal performance, especially at low flow rates [22]. In addition, the direction of the air flow also affects the efficiency of the device [23]. The most important parameter affecting ACD performance is volumetric flow rate [20]. The pollutant removal is not only dependent on the ACD, but also on the room in which the device is located and the furniture used in this room [23]. One of the methods used to improve the performance of ACDs is to change the control strategy. Park et al. [24] showed that the performance of such devices could be improved with the zone control approach. ACDs have various performance characteristics on different types of pollutants. Tobisch et al. [14] used experimental and computational fluid dynamics (CFD) methods to investigate the risk of infection resulting from particle exposure in a model lecture hall and determine the best location for an air purifier. According to their findings, changes in position and orientation would result in a 13% deviation in the particle concentration at head height. They came to the additional conclusion that air purification is a useful strategy for lowering aerosol particle concentrations. Noh et al. [25] stated that the CADR value decreases with increasing particle size. The filter technologies used in these devices also significantly affect device performance [26]. The cleaning performance and electricity consumption of ACDs are often compared with those of air conditioners (AC). In these comparisons, it has been concluded that ACDs are better than ACs in terms of both energy consumption and cleaning performance [27,28]. Although ACDs reduce the pollutant concentration in the environment, some disadvantages are also included in the literature. With regard to the disadvantages, filter lifetime has been reported as one, as, in air cleaners, it is between 1 and 3 months, depending on the pollutant concentrations [29]. In addition, secondary products emitted from these devices are important in terms of indoor air quality [30]. Sabanskis et al. [31] reported that the position of the aerosol source and the airflow pattern produced by the air cleaner and heating device in the room have a significant impact on the efficiency of the air purification process.
According to the aforementioned research in the current literature, there is limited work considering the performance of portable air cleaner devices by using CFD tools. However, there is no reported assessment study employing both the CADR and the mean age of air methods.
The aim of this study is to investigate the performance of the air cleaner under different operating conditions by using both the CADR and the mean age of air methods. In the performance evaluation of an ACD, the obtained information from both methods are compared and discussed in detail. Air velocity and age of air distributions in a room were calculated using three-dimensional CFD. In the numerical tical study, two different locations of the air cleaner device and three different blowing speeds were considered. In addition to that, the particle cleaning performance of the device was also investigated by randomly injecting different size particles into the indoor air, the results of which were compared and interpreted.
2. Materials and Methods
2.1. Numerical Model
The Lagrangian and Eulerian particle models are the two primary types of CFD particle transport models. The former is typified by the discrete phase model (DPM), which sees the particles as discrete entities with individual Lagrangian equations of motion. DPM resolves inertial effects and forces including drag, buoyancy, and gravity, as well as the motion of individual particles with varying weights and sizes. Instead, Eulerian models follow a finite volume element along the fluid flow path, treating the particles as a single phase. These approaches, in contrast to Lagrangian models, simulate the average behavior of the particles as opposed to that of individual particles. The concentration of massless particles is taken into account by Eulerian methods as a function of both space and time. This type of model is called a passive scalar model when there are no interactions between the fluid and particle phases [32].
Although Lagrangian approaches are more descriptive, they also require a lot more computing power, since good predictions necessitate simulating a large number of discrete particles [32]. Selecting the appropriate airflow model is equally crucial. More comprehensive discussions and comparisons of the various models for indoor particle simulations can be found in the references [31,32,33].
In this study, a combination of these two methods was used, as the Euler–Lagrange approach was employed. Since the diameters of the droplets considered in the present study were 1 µm and 10 µm, for which the Stokes number is very small, and the volume fraction of the particles was very small (<<10%), their influence on the mainstream air flow could be negligible. Therefore, the air velocity and temperature distributions in a room with an air cleaner were calculated with the Eulerian approach without considering the existence of the particles. The age of the air was also calculated at the same time. Then, by using these calculated velocity and temperature data in the room, the Lagrangian particle tracking method was employed to determine the trajectories of the particles in order to derive the transport characteristic of indoor particles. Then, the performance parameters of the ACD were calculated.
The ANSYS Fluent (Release R19.0) software was used to solve the three-dimensional steady-state Reynolds averaged Navier–Stokes (RANS) and energy equations [34]. Under the Eulerian framework, the governing equations explaining the airflow in the solution domain can be written as given in Equations (1)–(3), obtained from the conservation of mass, momentum, and energy, respectively.
Conservation of mass:
Conservation of momentum:
Conservation of energy:
where xi (m) is the coordinate component, ui (m/s) is the fluid velocity component, T (K) is the temperature, ρ (kg/m3) is the fluid density, cp (kJ/kgK) is the specific heat at the constant pressure, μ (kg/ms) is the dynamic viscosity, μt (kg/ms) is the turbulent viscosity, p (Pa) is the pressure, λ (W/mK) is the heat transfer coefficient of the fluid, and S is the volumetric source term.
The SIMPLE scheme was chosen for velocity–pressure coupling, and the standard method was used for pressure discretization while the second order discretization was applied to other quantities [34]. Turbulence properties were calculated using the RNG k-ε model, which was used in several research works dealing with air movement in enclosed spaces [22,35,36,37]. Detailed information about the RNG k-ε turbulence model can be found in the source [38].
2.2. Solution Domain Model and Validation
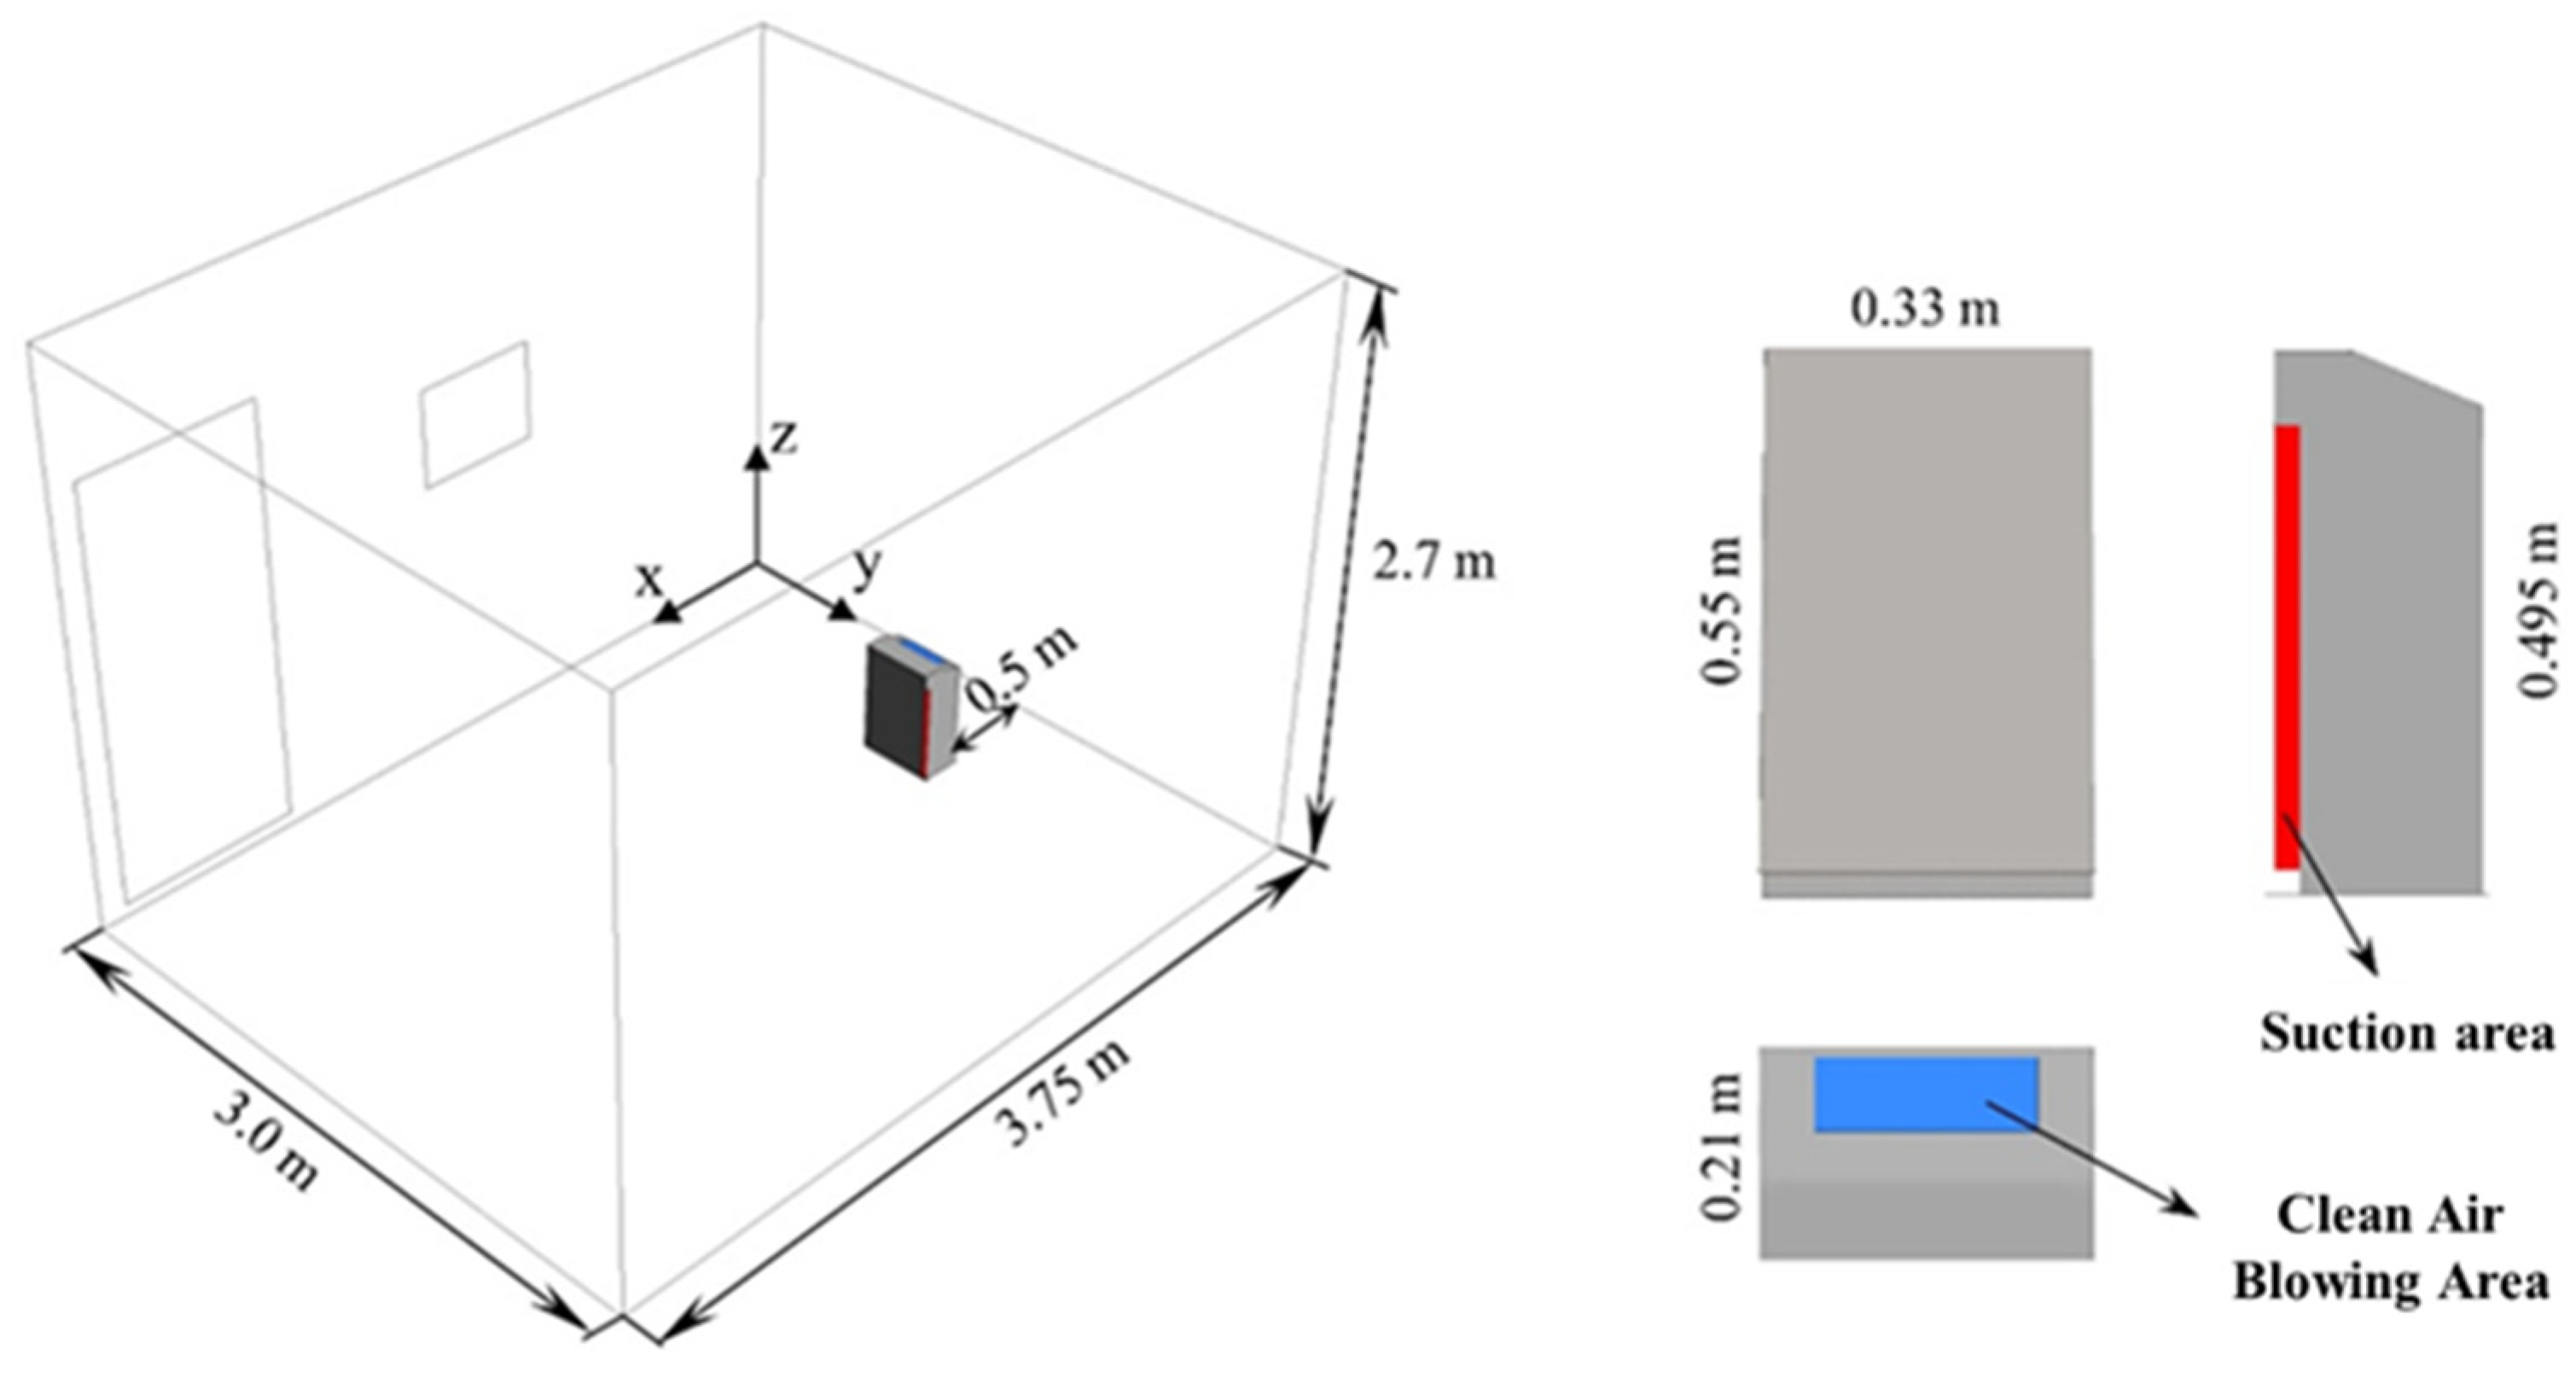
A commercially available air cleaner was selected for numerical modelling. Then, it was modelled inside a room which was appropriate with the AHAM standard [18]. The dimensions and the location of the selected air cleaner and the room are given in Figure 1.

Figure 1.
Schematics of the modelled room and air cleaning device.
Two different positions of the air cleaner in the room were examined: the device positioned 0.5 m away from the wall (position 1), as shown in Figure 1, and the device positioned in the middle of the room (position 2).
The purified air inlet velocity, the turbulent intensity, and the turbulent viscosity ratio were specified at the blowing area. The zero-pressure condition was applied to the suction outlet area of the ACD. To all walls, including door, window, room boundaries, and the device walls, the no-slip condition was applied. Constant temperature, 295 K, was defined at the room boundaries. Since the ACD device components, such as the electric motor, produce some heat, the temperature at the ACD surfaces was set to 300 K.
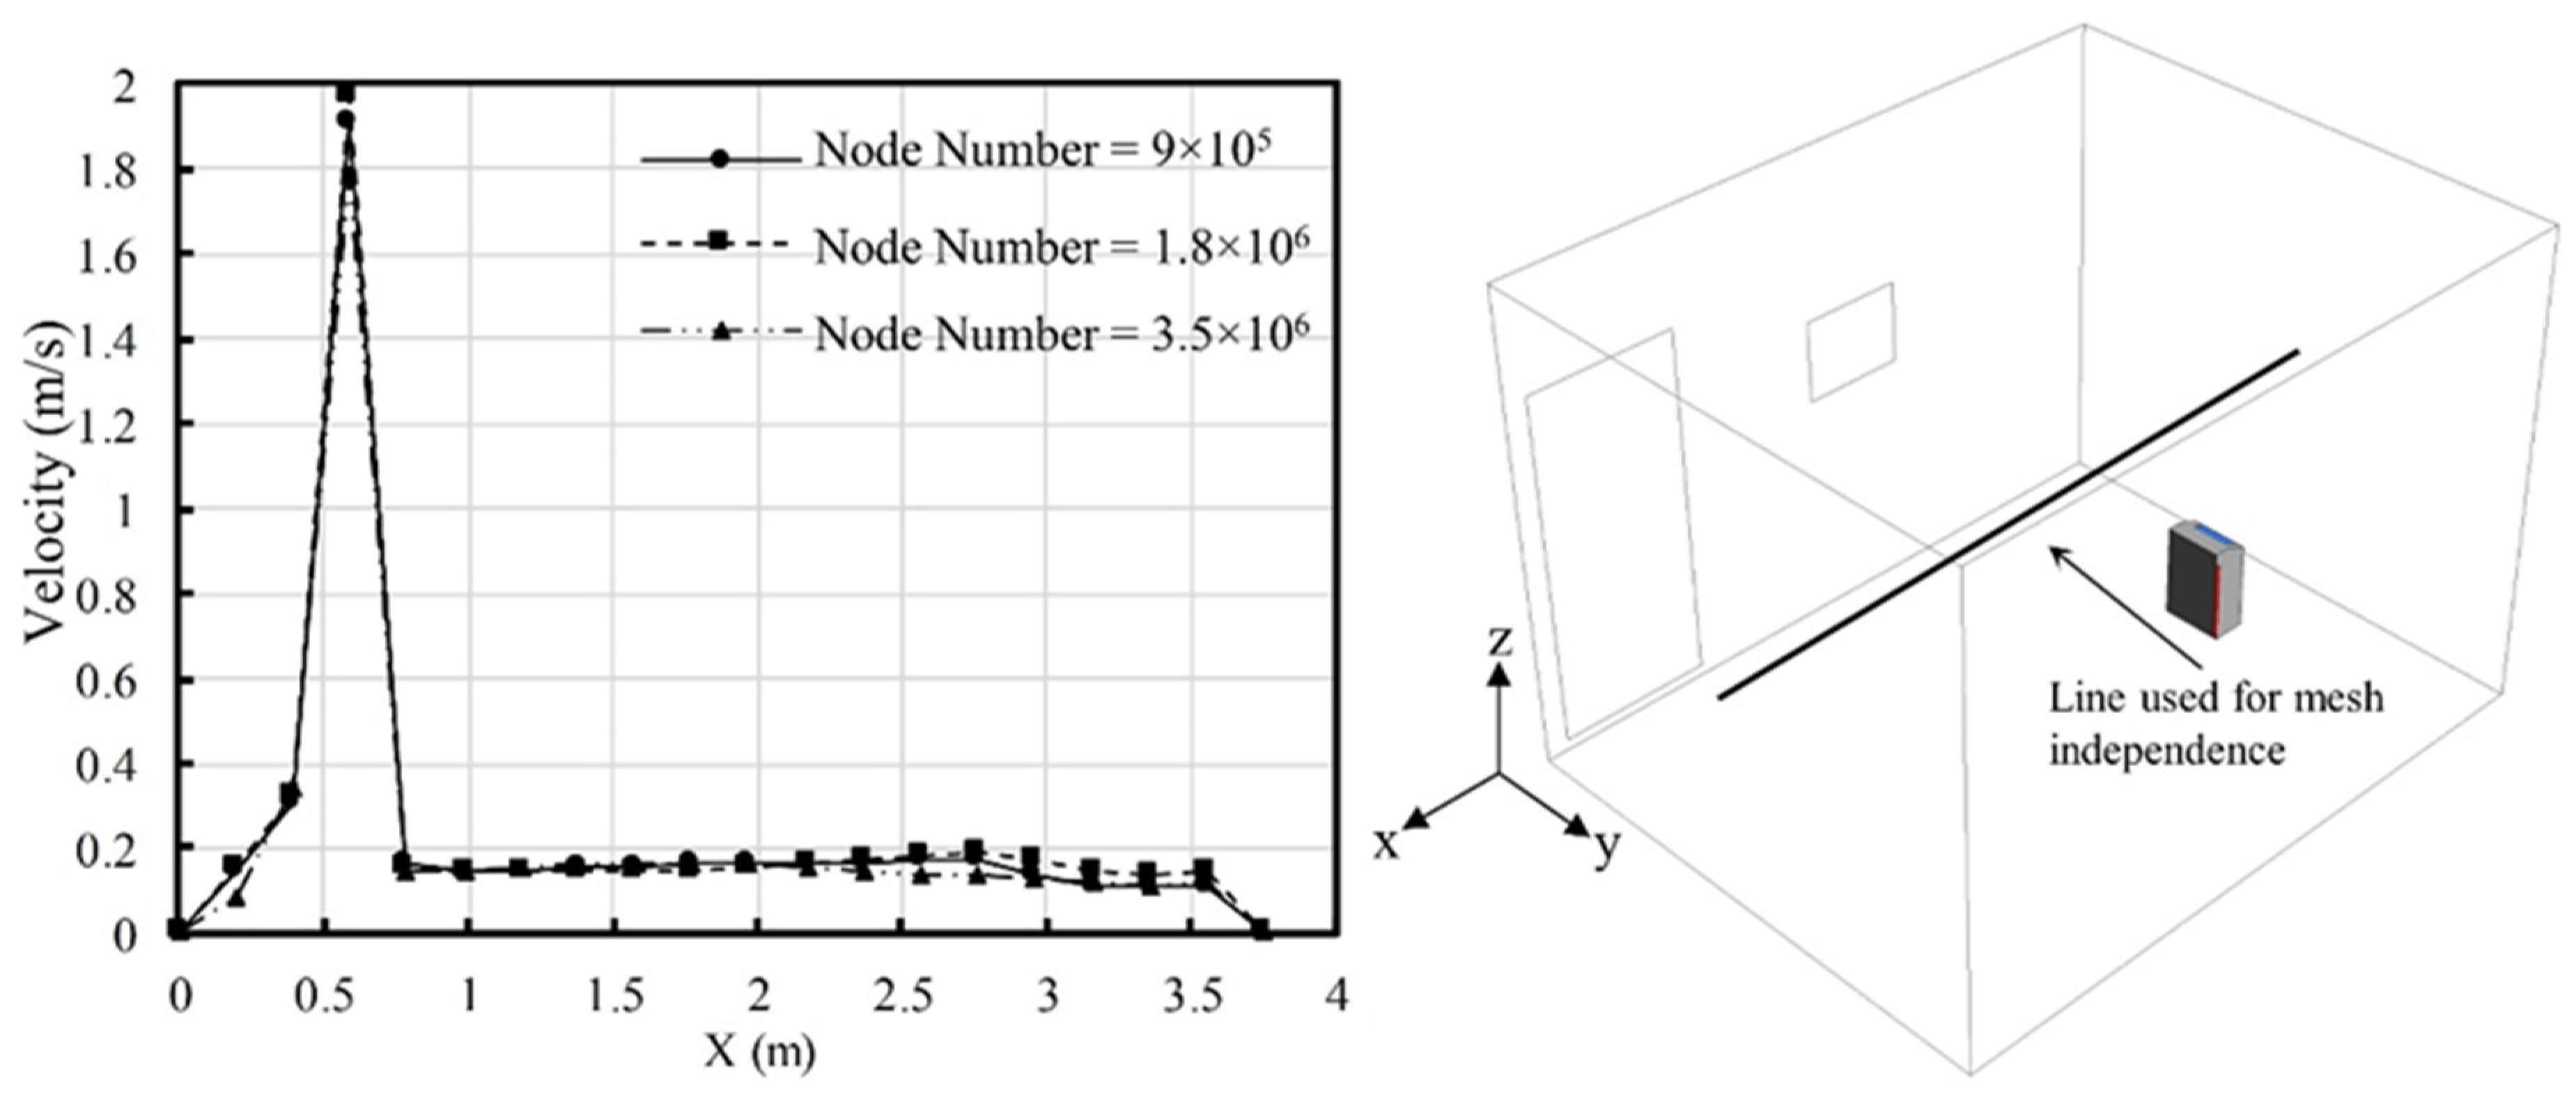
For mesh independence analysis, the mean air age and velocity values of three distinct meshes with differing node counts were compared. Figure 2 displays the air velocity values in the center of the room obtained using various meshes. After the calculations were conducted using this mesh structure and the 1.8 × 10⁶ node number, it was seen that the findings remained unchanged. Therefore, this mesh number was used for all further calculations.
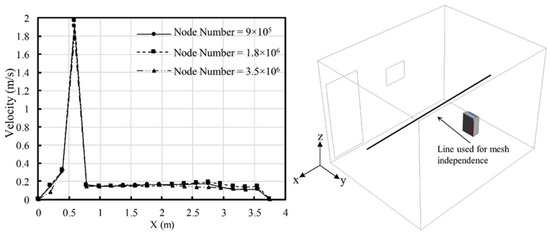
Figure 2.
Variation of the velocity magnitude at the line placed in the center of the room.
Numerical results were validated by measuring the air velocity in a room with the exact dimensions given in Figure 1. A TSI Q-Trak measuring device with a TSI 966 velocity probe was used for these measurements. The probe resolution and accuracy were 0.01 m/s and ±0.05 m/s, respectively. The air velocity was measured at 12 different points to compare the numerical results with measurements; the coordinates of these points, as well as the measured and computed velocity values, are given in Table 1. The locations of these points are given based on the origin of the coordinate system shown in Figure 1.

Table 1.
Air velocity comparison of experimental and numerical results.
A comparison of the measurement results and the numerical prediction results for the velocity values is given in Table 1. The relative difference between the calculated and the measured velocity values was less than 5% at all points except for the location of P6. Considering the very low velocities in the room and the accuracy of the probe used for measurement, it was concluded that the numerical results were in good agreement with the experimental results.
2.3. Mean Age of Air
Air age is the time it takes for the cleaned air coming out of an air purifier to reach a predefined area [34]. The mean age of the air is calculated to estimate the cleaning levels of indoor air under different operating conditions of the air purifier. Air age, α, needs to be solved in volume as a scalar quantity. For this purpose, in addition to the conservation equations and turbulence equations in Equations (1)–(3), an additional equation in which the air age is a variable was solved simultaneously with other variables. An additional code was written in the FLUENT software with the help of user-defined functions (UDF) to solve the air age equation and calculate the air age. The equation used in the calculation of air age is given in Equation (4) [27,39].
In this equation, Γα represents the diffusion coefficient. The boundary conditions given in Equation (5) were used in the calculation of mean air age.
2.4. Particle Tracking
The discrete phase model (DPM) in the FLUENT software was used to calculate the particle concentration variation by tracking particles [40,41,42]. After solving the velocity, temperature, and air age distributions in the room under steady state conditions, using this solution, the concentration variation and particle movements were calculated under a transient regime [43]. Randomly distributed, injected particles in the room were tracked through the air separately using the Lagrangian approach.
The diameter of exhaled particles varies between 0.01 μm and 1000 μm, contingent upon the origin and mode of formation [44]. It should be noted that the temperature and humidity of the surrounding air, in addition to the makeup of the particles, affect the size of water droplets. For small droplets, equilibration happens quickly (less than a second), but it can be complicated if a surfactant layer covers the droplet’s surface, delaying condensation or evaporation [44,45]. However, Johnson et al. [46] reported that even droplets as large as 30 µm can remain suspended in the air for extended periods. Exhaled air is an aerosol made up of droplets that are produced internally. Despite being liquid droplets, these contain nonvolatile substances and water; therefore, the physical term for them is “particles”. Since the present study considers the performance of an ACD, the respiratory particles, alongside other pollutants present in the indoor air, were simulated virtually by using water properties. Considering the fact that the inhaled particulate matter responsible for the airborne transmission of viruses consists of water droplets, all the particles were treated as liquid water spheres, and the heat and mass transfer between particles and fluid were ignored so that there would be no evaporation from the droplets. The thermodynamic properties of the particles were as follows: the density of a particle was 998.2 kg/m3, the thermal conductivity of a particle was 0.6 W/mK, and the specific heat of a particle was 4182 J/kgK.
Measured numbers of human expired particles during different respiratory activities vary between subjects, with the numbers roughly varying between 1000 and 10,000 for vocalizing, coughing, and breathing, although the numbers could rise up to 350,000 for sneezing [45]. Morawska et al. [47] reported that the size distribution that was measured was substantially greater than that of aerosol in the respiratory system. It is plausible that homogeneous nucleation took place, leading to a significant rise in the quantity of droplets. The reported amounts were significantly higher than those seen in previous research [47]. Bake et al. [44] stated that low aerosol concentration in experimental works may necessitate measurements of extended duration and many repeats. This is also true for numerical simulation studies. Therefore, a large number of particles results in a better evaluation of particle concentration change in the room. Once the concentration change function is obtained, this can be used with any number of particles present in the room. In light of these, in the present simulation study, about 30,000 particles, either with a diameter of 1 μm or 10 μm, were instantly (0.002 s time interval) injected from 1500 randomly distributed points at average room air temperature. After that, the movement of randomly distributed particles in the room was tracked with 0.1 s time intervals by solving the force balance on the particles.
A particle may be affected by a number of forces when it travels in an environment with fluids. The balance equation considering the forces acting on the particles is given in Equation (6) [42].
In Equation (6), the particle velocity is represented by up (m/s), the particle mass is represented by mp (kg), and the force to which the particle is subject is represented by F (N). These forces can be obtained by using the equations named as drag force, Fd, Equation (7), bouncy force, Fg, Equation (9), Saffman lift force, Fs, Equation (10), Brownian force, Fb, Equation (11), thermophoretic force, Fth, Equation (13), pressure-gradient force, Fpg, Equation (13), and virtual mass force, Fvm, Equation (14). Comprehensive information on these factors is given in the reference [43].
where dp (m) represents the diameter of the particle and ρp (kg/m3) indicates the density of the particle. The slip correction factor, Cc, is calculated by using Equation (8) [48]:
where γ is taken as 0.066 µm [43].
where dij represents the deformation tensor. Equation (11) provides the Brownian force:
where kB (1.38 × 10⁻²³ J/K) is the Boltzmann constant and ζi represents zero-mean, unit-variance-independent Gaussian random numbers.
Kn (2γ/dp) is known as the Knudsen number. kr (=k/kp) is the ratio of fluid heat conduction coefficient to particle heat conduction coefficient. Cs, Ct, and Cm constants were given as 1.17, 2.18, and 1.14, respectively.
2.5. Clean Air Delivery Rate (CADR) Calculations
The term “clean air delivery rate” (CADR) refers to the amount of particulate-free air that a domestic electric room air cleaner with a cord connection can deliver. In technical terms, CADR is the product of the test chamber’s volume expressed in cubic meters using Equation (15) and the rate of particulate contaminant reduction in the test chamber during operation minus the rate of natural decay during nonoperation. Every unit’s performance as a whole system for every kind of particulate pollution, including dust, aerosols, tobacco smoke, and others, is measured by CADR. There is no linear correlation between CADR and air movement or any specific particle removal methodology’s features [18].
After the randomly distributed particles were injected into the room, particle movement tracking calculations using DPM were performed with 0.1 s time intervals until all the particles were removed from the indoor air. Calculated data were used to obtain the CADR value for each case considered in the study. The clean air delivery rate of an air cleaner was calculated through Equation (15).
CADR = V(ke − kn)
In this equation, V represents the room volume, kn the natural decay rate, and ke the total decay rate including tracking by walls and the air cleaner outlet. The value of ke was calculated using Equation (16), using the concentration change in the room:
Küpper et al. [49] performed 15 different measurements for the kn value in a room with a volume of 70 m3. Within the results of these measurements, the mean value of kn was 0.00531 min−1. The kn value for PM2.5 was estimated at 0.0057 1/min−1 by Shiue et al. [50], while Gunschera et al. [51] took kn as 0.00667 min−1 in their VOC measurements. In the present study, kn was assumed to be 0.00531 min−1, that is, the average value of Küpper et al. [49].
Finally, the collection efficiency of the air cleaning device was calculated by using Equation (17).
η = CADR/Q
In this equation, η and Q (m3/h) represent the collection efficiency and the rated volumetric flow rate of the air cleaner device, respectively.
By using Equation (16), the time interval required to reduce the particle concentration to any desired rate can be calculated as in Equation (18):
where C* is the particle concentration ratio at time t. For example, to find the time required to clean 90% of the particles, (Δt10%), in the room, the value of C* should be taken as 0.1.
Δt = −ln(C*)/ke
3. Results and Discussions
First of all, the cases were studied with the air cleaner placed 0.5 m away from the wall, that is, position 1. The volumetric flow rates were taken as 126.7 m3/h, 190.1 m3/h, and 253.4 m3/h, corresponding to velocity values of 2 m/s, 3 m/s, and 4 m/s, respectively. Then, the cases were considered with the air cleaner placed into the middle of the room, namely position 2.
3.1. Velocity and Temperature Distributions
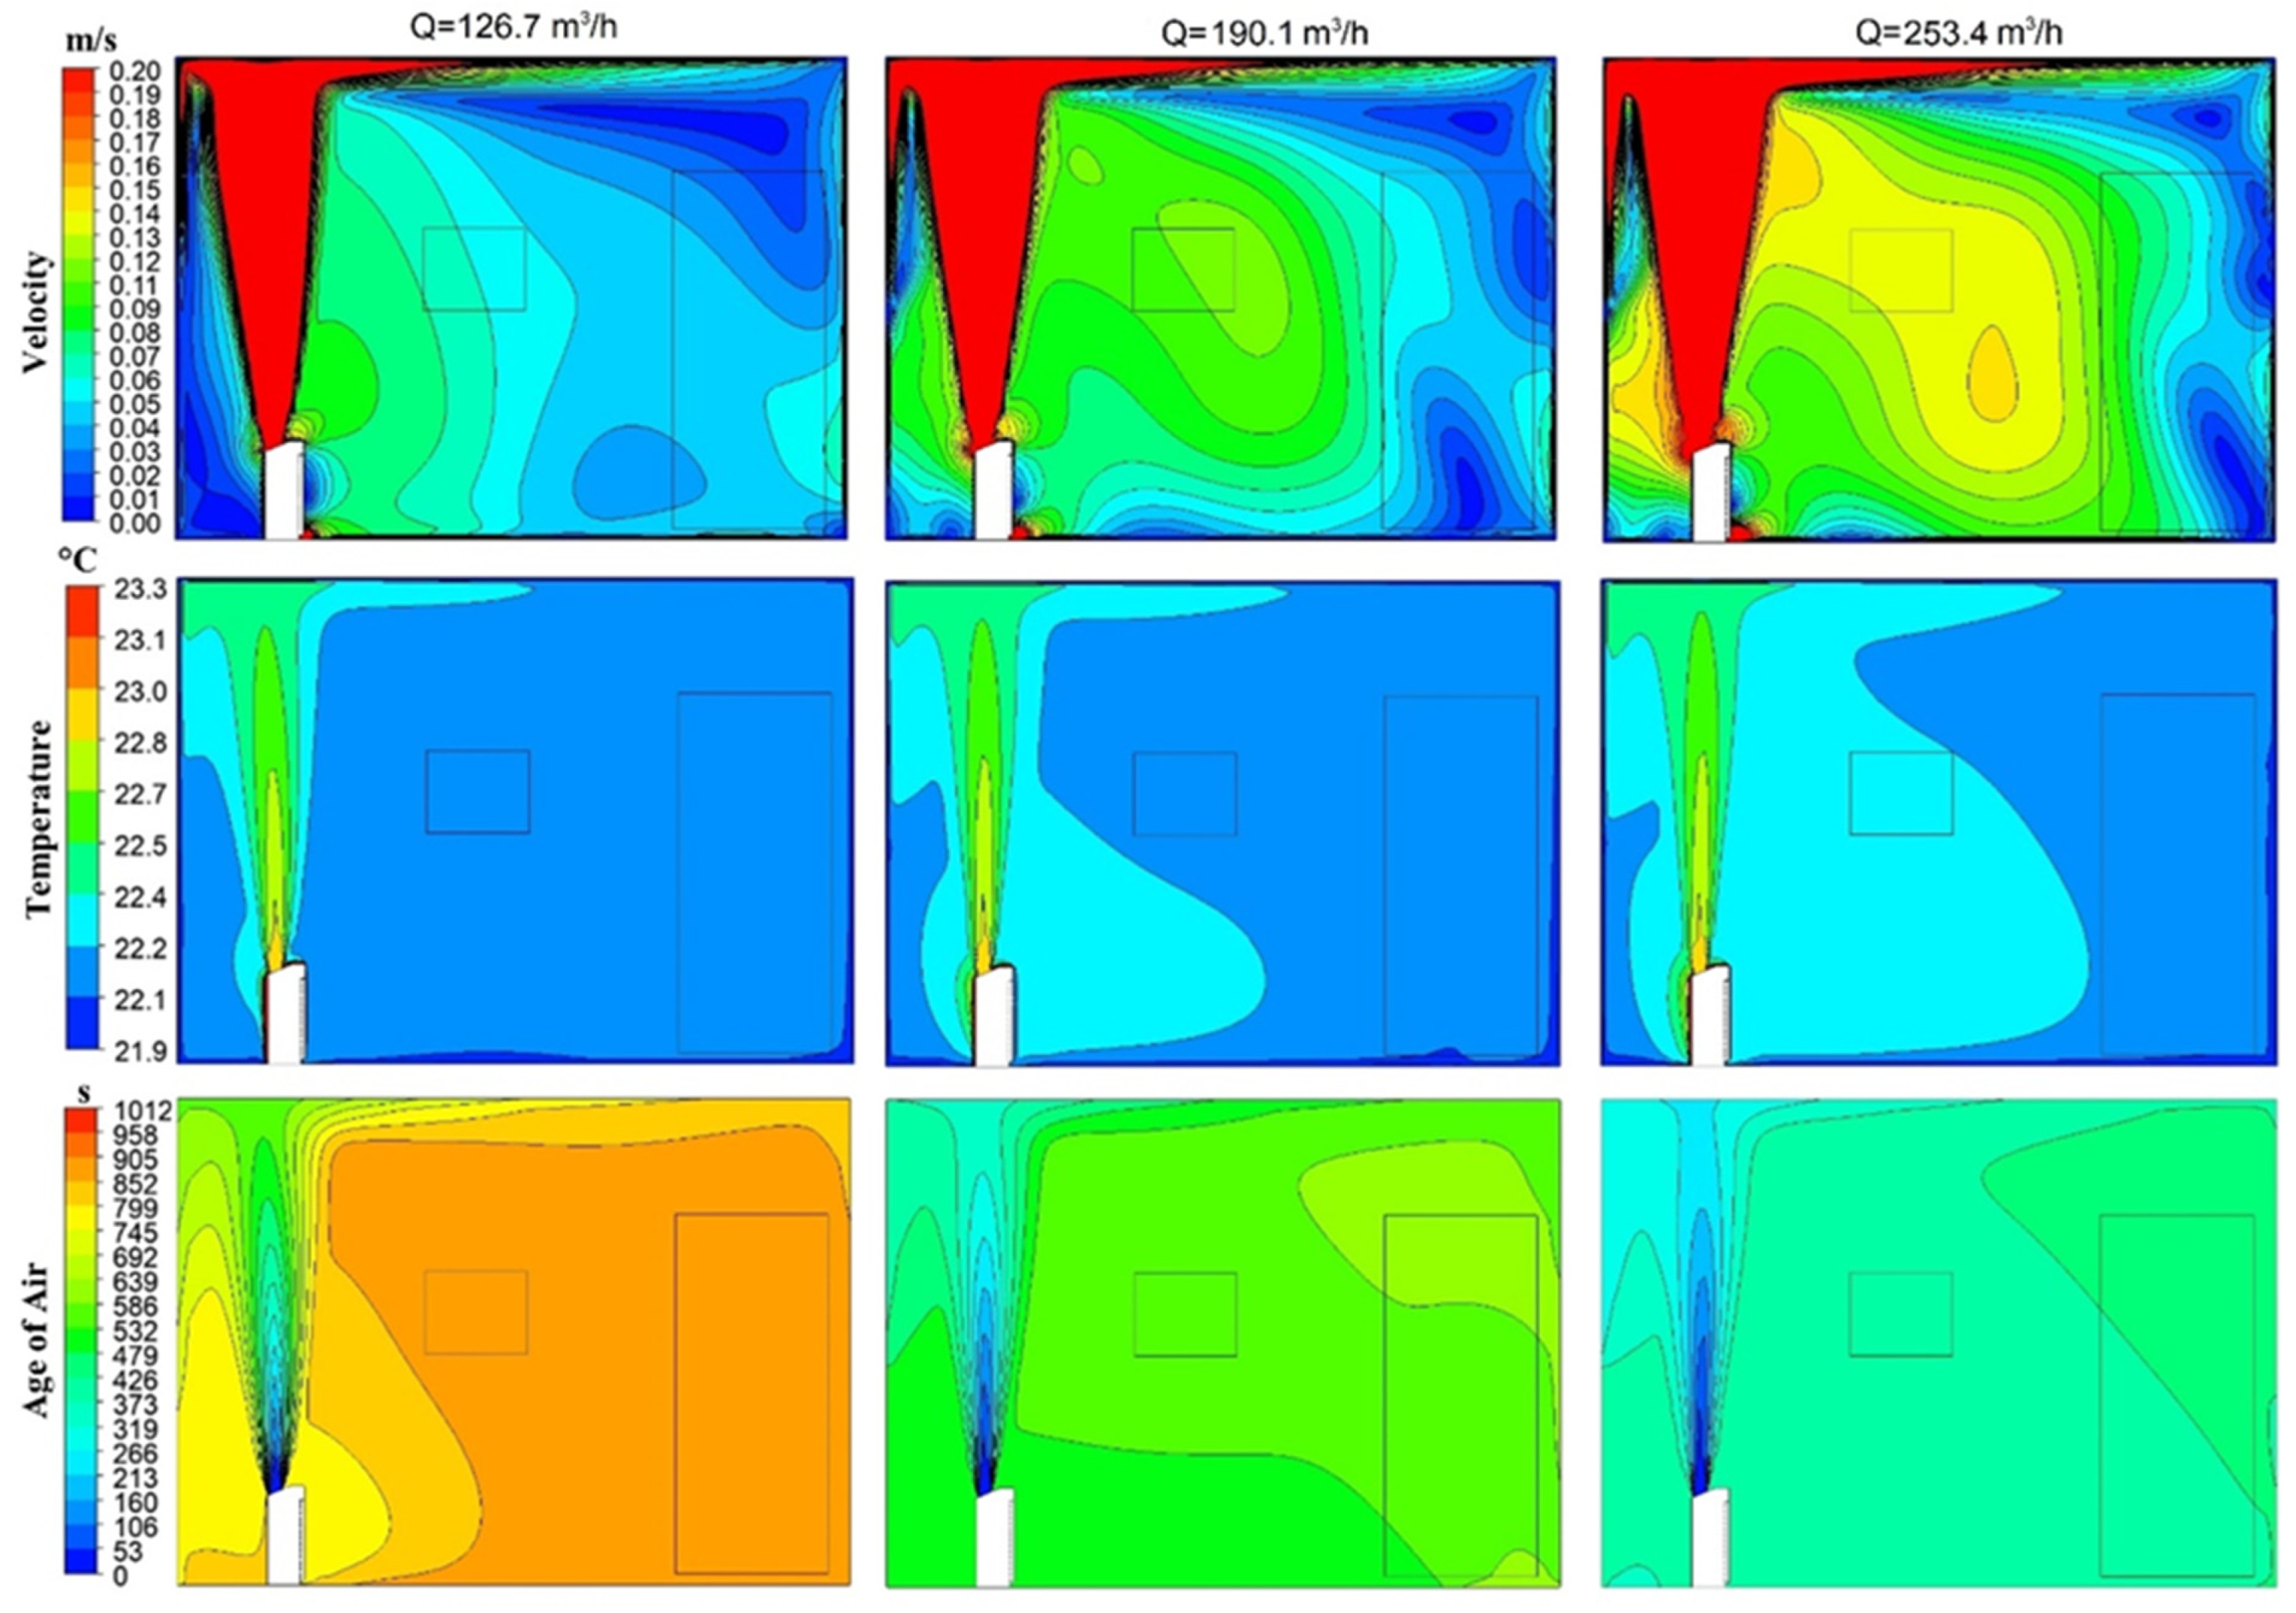
The calculated counter lines of velocity distributions on the selected planes can be seen in Figure 3. Depending on the velocity magnitude at the inlet of the air cleaners, the air flow was moved toward the ceiling of the room as the velocity decreased with the expansion of the plume. After that, an air circulation characterized by very small velocities, especially in the core region, occurred inside the room. Meanwhile, the contaminated indoor air was circulating by means of relatively low pressure at the outlet region of the air cleaner. By comparing the three flow rate cases, it can be seen that increasing the flow rate resulted in higher velocity values in the room. This caused stronger recirculation and mixing of the indoor air. This can also be observed from the calculated age of air distributions, as shown in Figure 3. When the mass flow rate increased, the age of the air decreased proportionally. In both cases, the higher values of the air age mainly occurred in the right upper core section of the room due to the establishment of a recirculation zone.
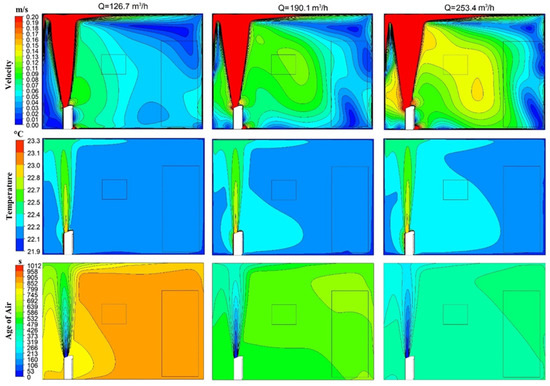
Figure 3.
Contour plots of velocity, temperature, and air age in the middle of the room while the ACD was in position 1.
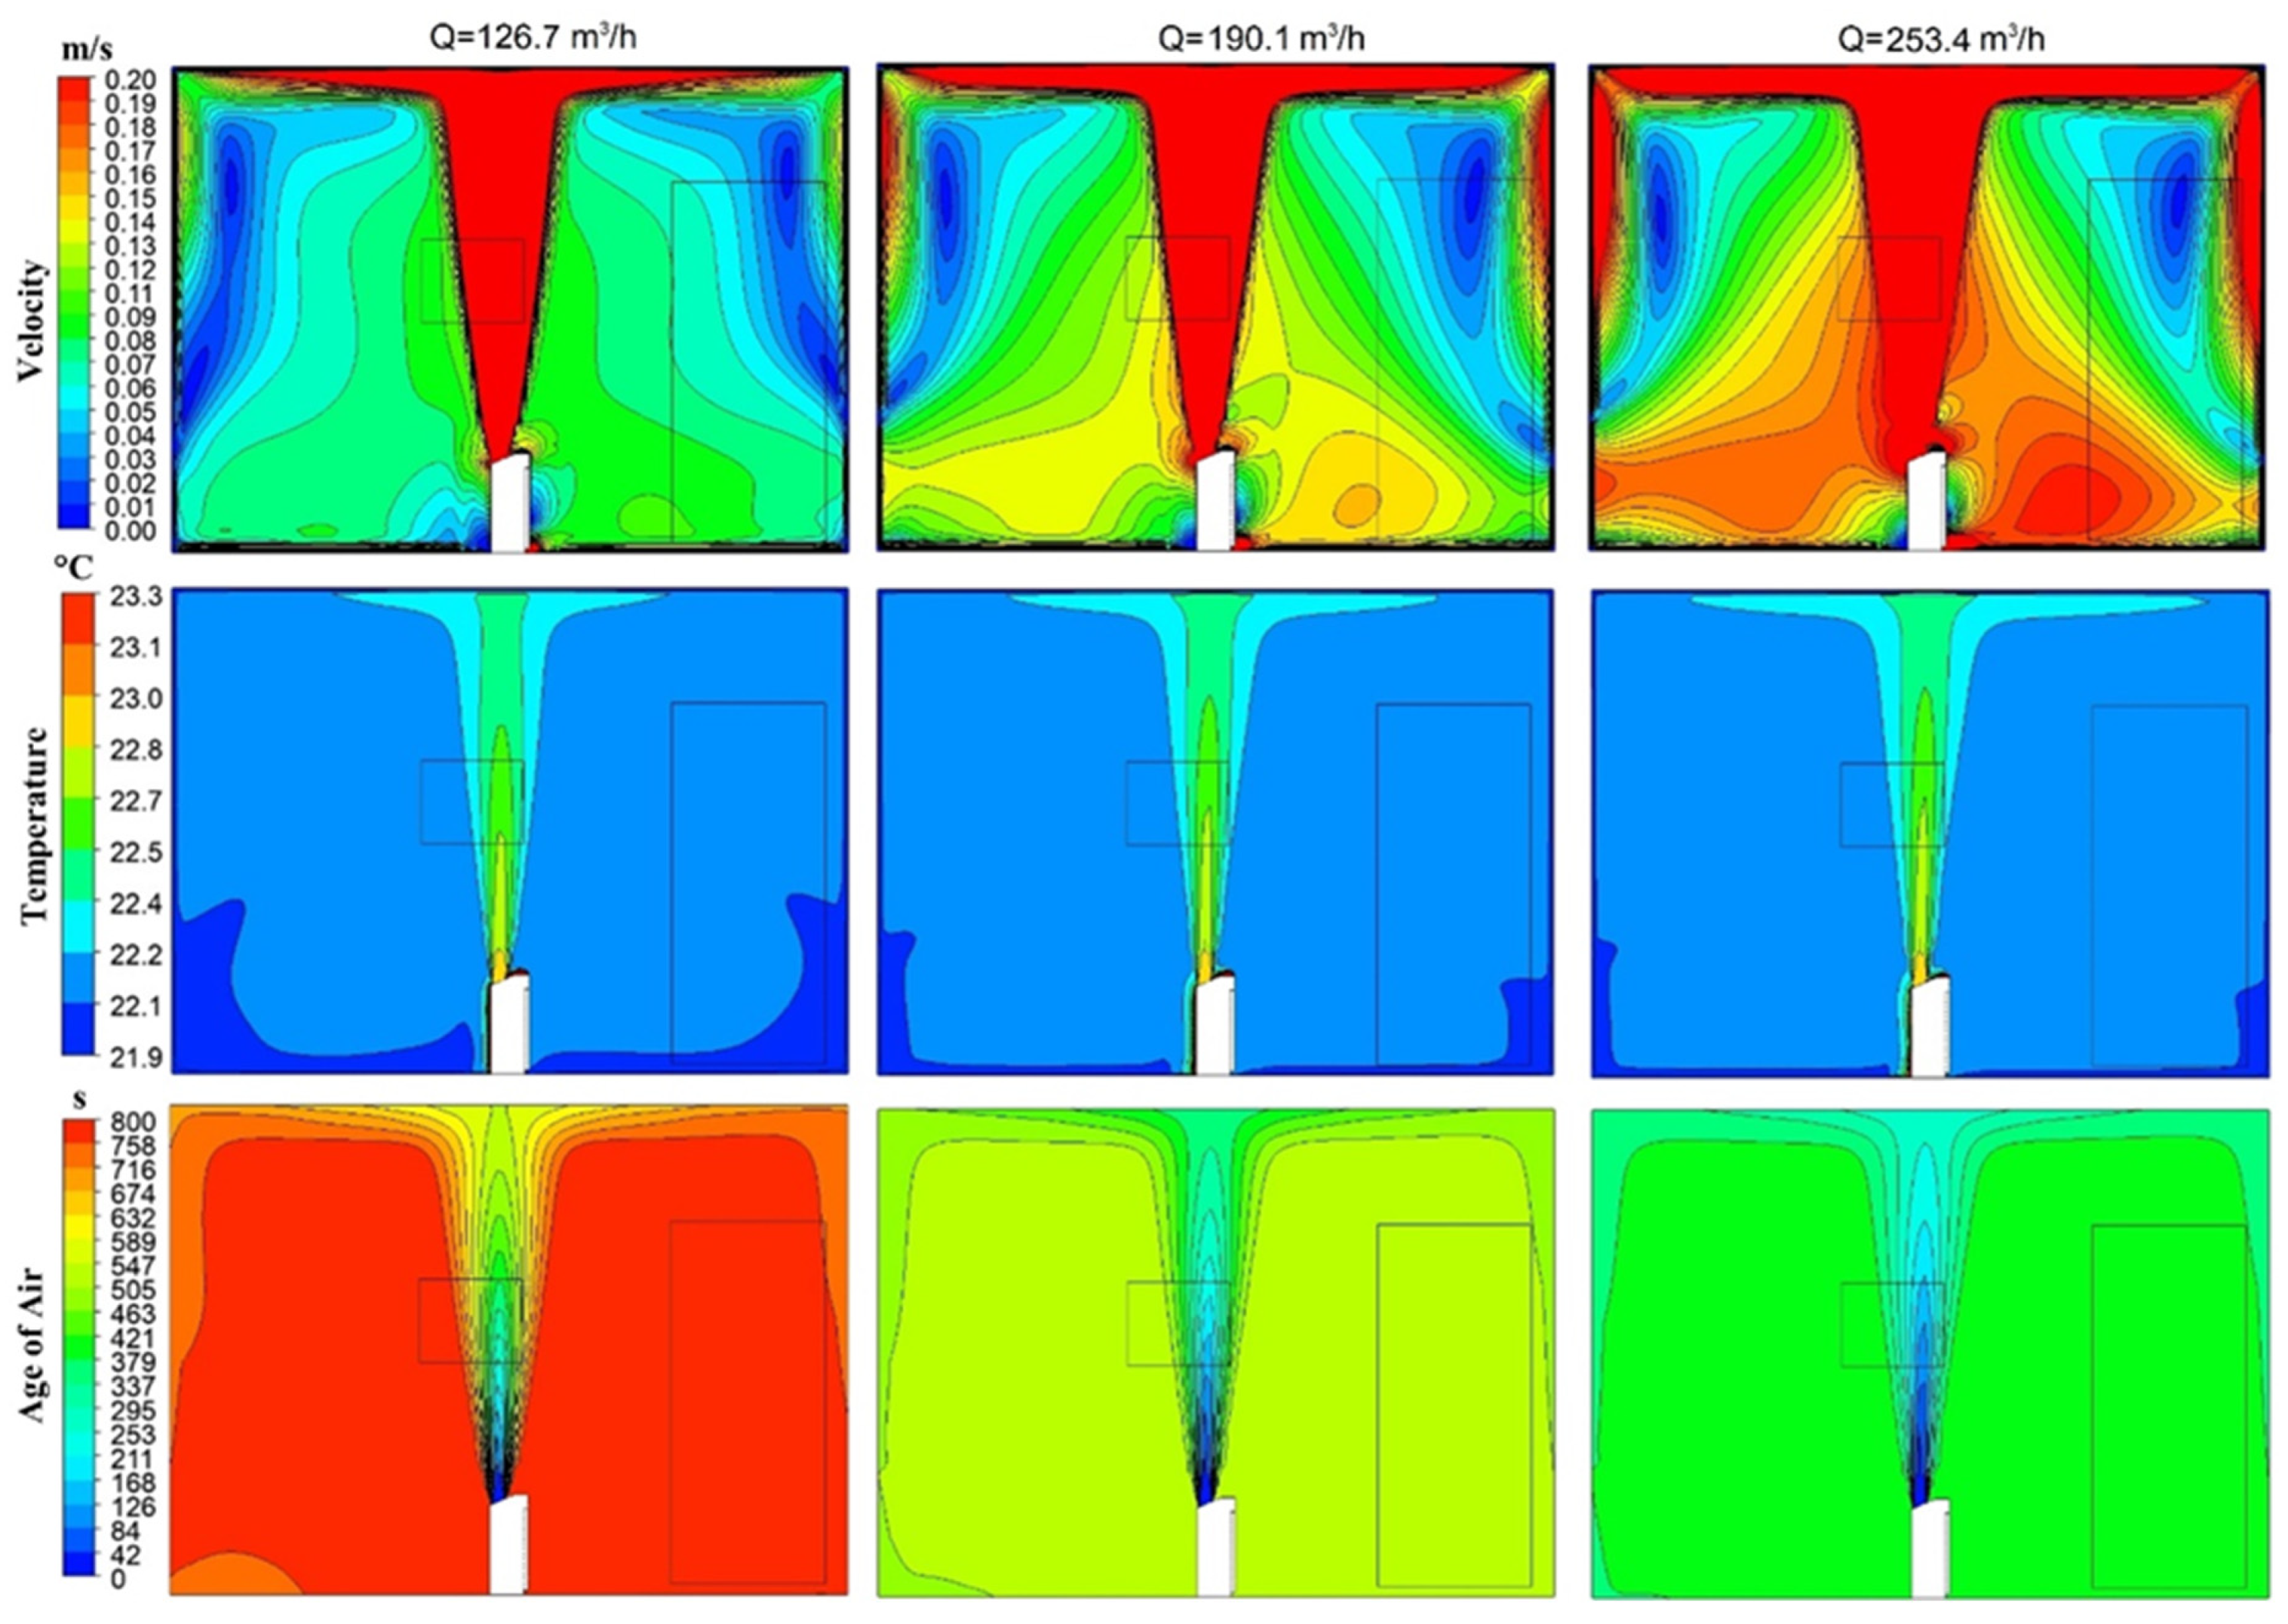
The calculated counter lines of velocity distributions on the selected planes for the center location of the air cleaner can be seen in Figure 4. Similarly to the previous location cases, the air flow was moved toward the ceiling of the room as the velocity decreased with the expansion of the plume. However, the air stream divided itself among all regions once it had reached the ceiling, resulting in a more homogeneous distribution of clean air. After that, air circulation regions, characterized by relatively small velocities, especially in the core regions, occurred inside the room around the air cleaner. Meanwhile, the contaminated indoor air was circulating by means of relatively low pressure at the outlet region of the air cleaner. By comparing these two flow rate cases, it can be seen that increasing the flow rate resulted in higher velocity values in the room, similarly to the previous location cases. This caused stronger recirculation and mixing of indoor air. This can also be observed from the calculated age of air distributions, as shown in Figure 3 and Figure 4. When the mass flow rate increased, the air age decreased proportionally. In both cases, the higher values of the air age mainly occurred in the upper core sections of the room due to the establishment of a recirculation zone.
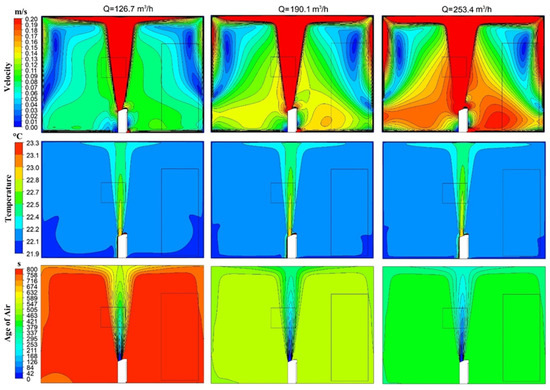
Figure 4.
Contour plots of velocity, temperature, and air age in the middle of the room while ACD was in position 2.
The temperature distribution (Figure 3 and Figure 4) shows that there was a relatively homogeneous distribution in the room. The change in air temperature remained below 1.5 °C. The air temperature at the locations close to the device was slightly warmer than in other parts of the room (+0.2 °C) when the air cleaner was in position 2, with this region expanding with increasing blowing speed. On the other hand, when the device was in position 1, this small irregularity in temperature was not observed (Figure 4). The most important reason for this is that, if the device was located in the middle of the room, it could distribute the fresh air better throughout the room. The same phenomenon was also observed in the velocity and air age distribution as mentioned above.
3.2. Age of Air Distributions
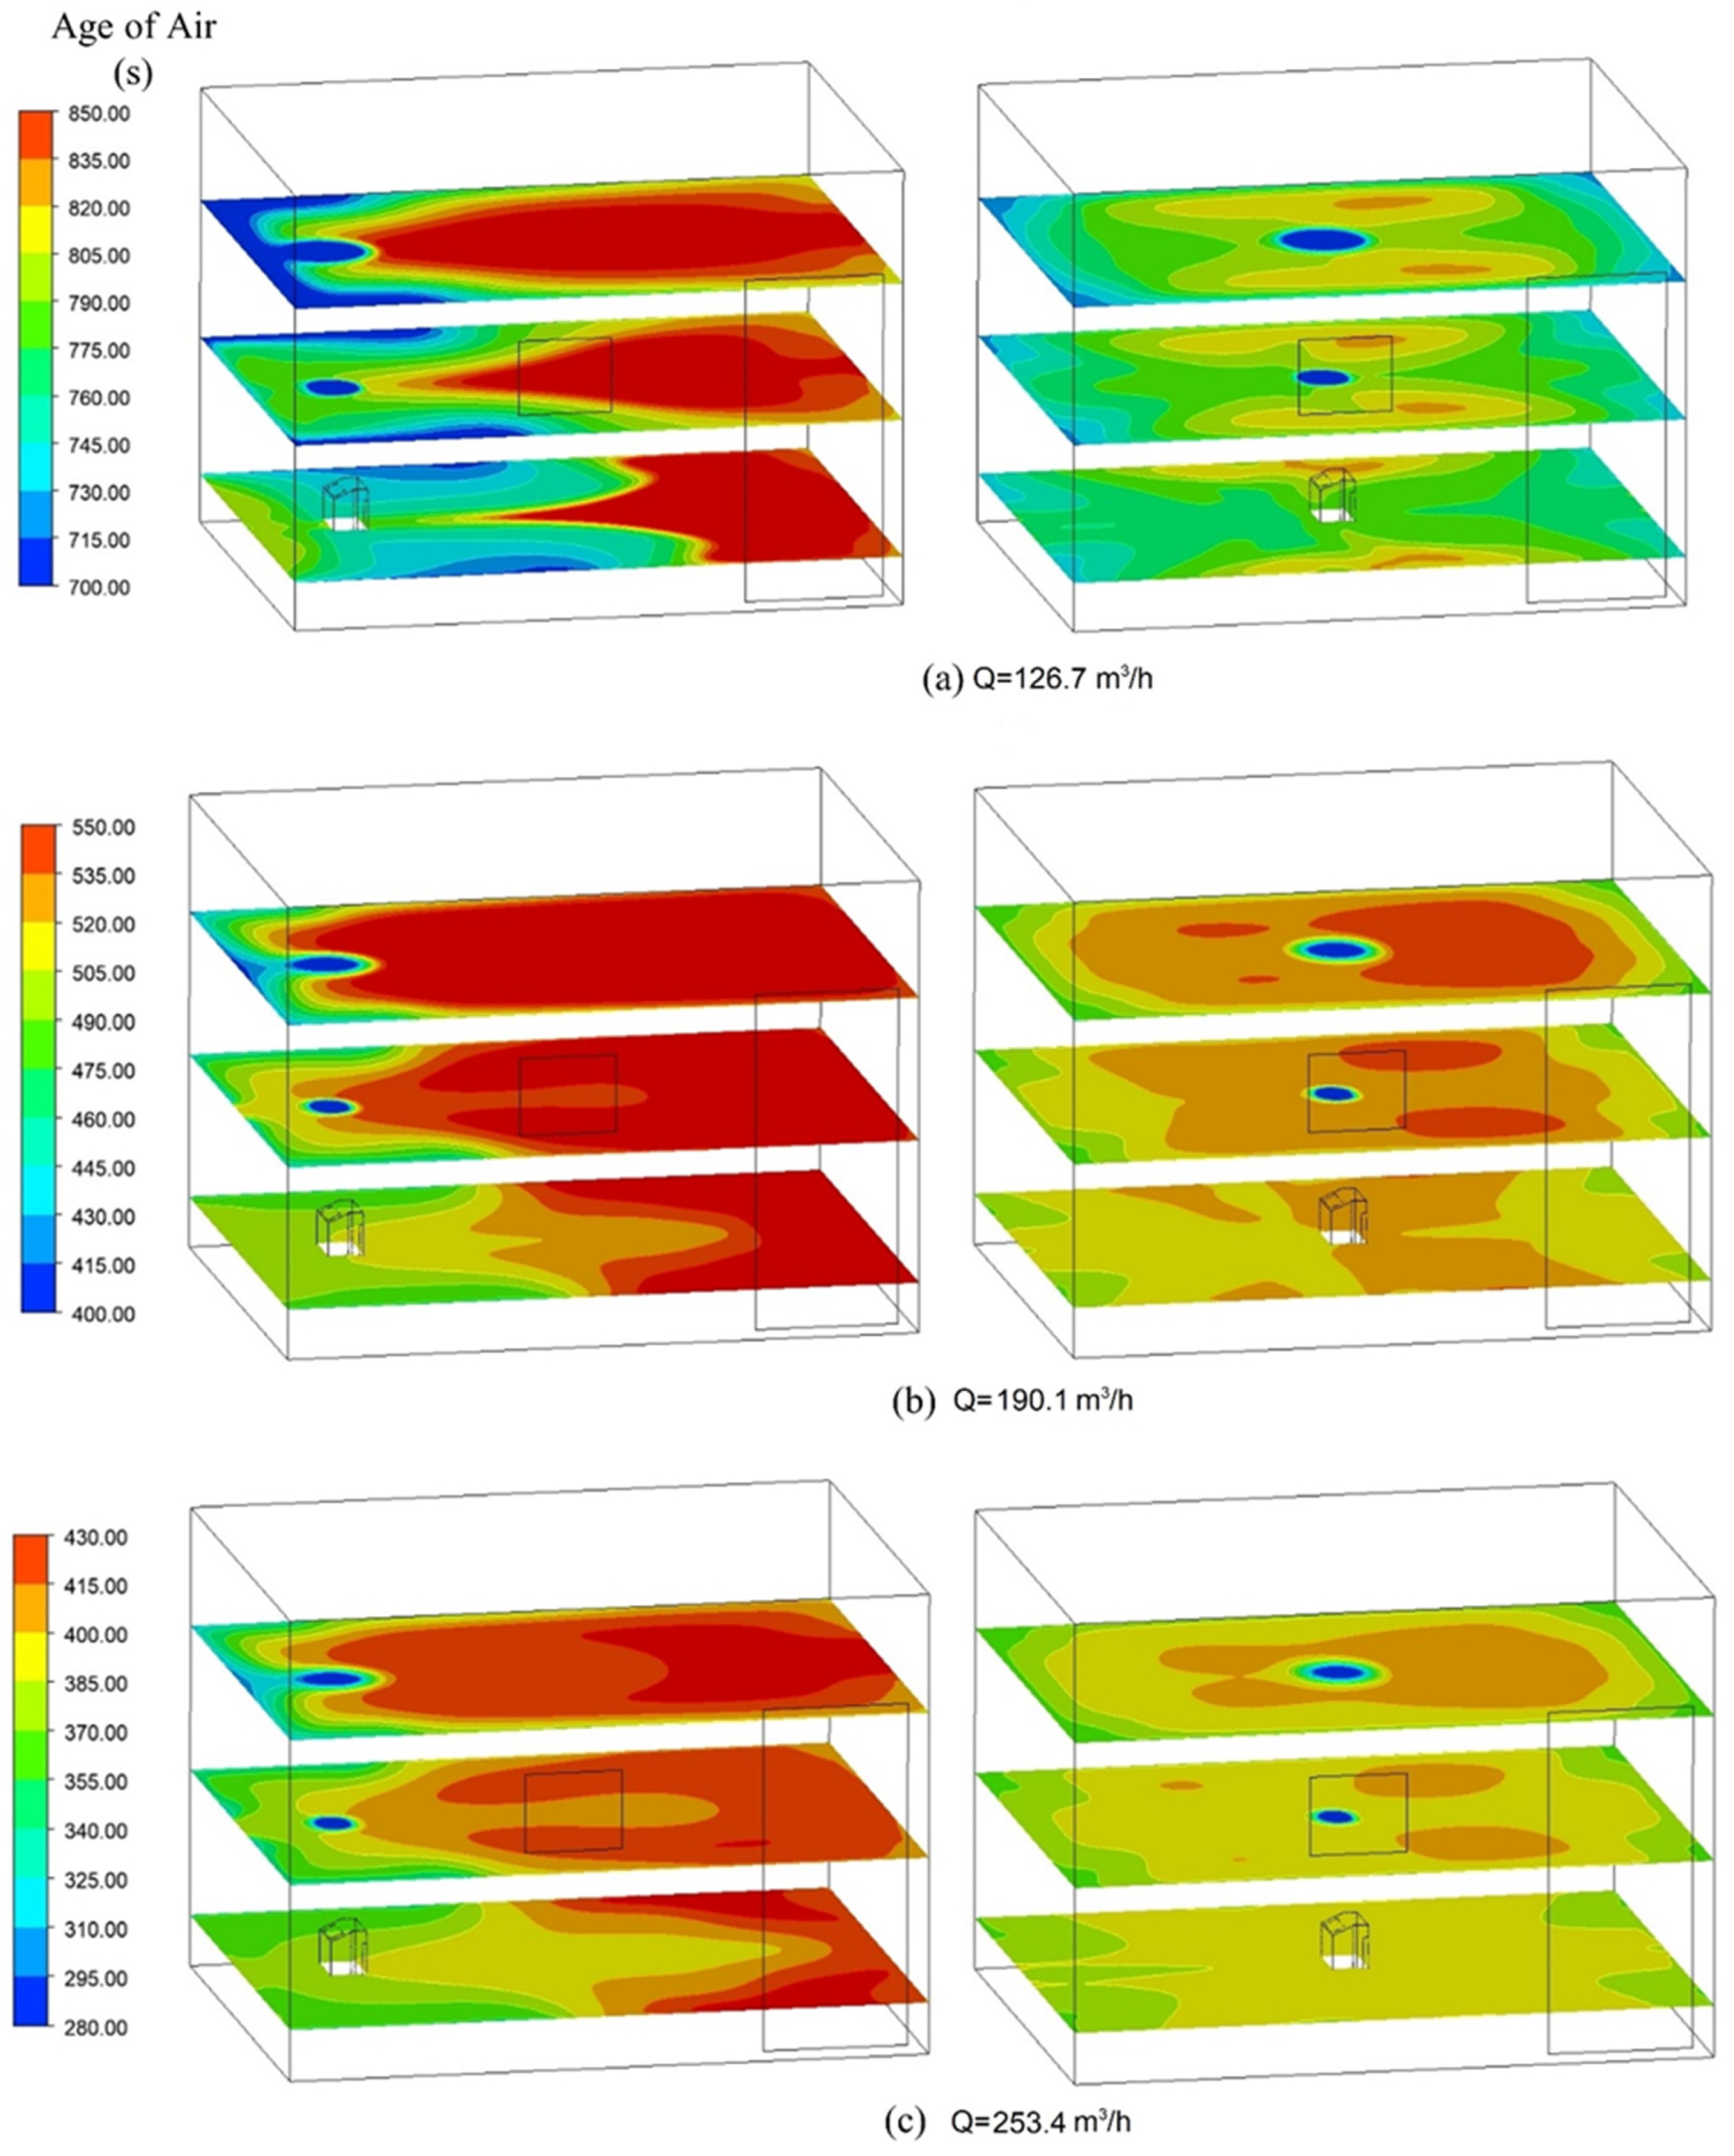
The variation in air age along the z-axis (0.3 m, 1.15 m, and 2 m height from the floor surface) is given in Figure 5. For both device locations, the air age around the air cleaner device was lower than that in other regions. It is expected that the air rate of change near the air cleaner will be faster due to bypass. When the ACD was in the first position, the air age around the wall away from the device was up to 25% higher than the air age around the wall where the device was located. This shows that, even if the flow rate increases, the air will reach, eventually, the wall region away from the device. In the case of the ACD located in the second position, it can be said that the distribution of the air in the room was more homogeneous than in the first case. Therefore, positioning the ACD in the middle of the room will allow the fresh air to reach other parts of the room more quickly.

Figure 5.
Air age distribution on three different XY planes.
It can be said that the locations of the high air age regions did not vary, although the increase in flow rate caused a decrease in the mean air age. With respect to position 1 of the ACD, the air ages at a height of 2 m above the floor were higher than in other regions. It can also be seen that increasing the flow rate did not change the region where the fresh air would reach last, even though the value of the air age decreased. The same is true for the second position of the device. Therefore, in addition to increasing the blowing speed, a change in device position should also be considered in order to improve the air age value of a certain area in the room.
Table 2 presents the calculated mean and maximum values of air age for all considered cases. It can be seen that increasing mass flow rates resulted in a decrease in the age of air values. Although the air stream divided itself between the two sides of the room and the air velocities slowed down, the center placement of the air cleaner apparently shortened the travel distance of the air. Therefore, the center placement cases show smaller air age values than those observed in the wall-side placement cases.
Table 2.
Maximum and mean air age (s) values for different flow rates.
3.3. CADR Values
Table 3 presents the clean air delivery rate (CADR) values for all considered cases. It can be seen that increasing mass flow rates resulted in an increase in CADR values. It should be mentioned that higher CADR values represent a better performance. Surprisingly, the center placement of the air cleaner showed a better performance compared to the wall side cases. This may be caused by longer air stream distributions resulting in slower air velocities at the faraway locations in the room, so that particles may stay longer in the air. These results could also be explained by using the mean air age values given in Table 2. Smaller mean age values resulted in higher CADR values. In this respect, it can be said that both performance metrics support each other’s findings. These observed results show that the air distribution performance of a ventilation system or cleaning device used in a closed environment can be analyzed by using these two different methods.
Table 3.
Predicted performance parameters of the air cleaner device by using the CADR method.
Table 3 also shows that CADR and collection efficiency values for larger particles were about 2–7% better than those for smaller particles. It means that smaller particles spent a longer time being suspended in the room air. Table 3 also shows the efficiency of the air cleaner device. Parallel to the CADR values, better collection efficiency values were observed with increasing flow rates. The maximum efficiency value of 86% for the ACD was obtained in relation to the center location and the highest flow rate. The efficiency of the ACD was in the range of 71% to 87%.
For each case, the calculated total decay rate, ke, values are also given in Table 3. Statistical works with the particle tracking data were performed by using an Excel spreadsheet. In the calculation of ke, R2 values were greater than 0.98 for all cases considered. Higher ke values resulted in a faster decrease in particle concentration in the room air. This can be clearly seen from the time intervals required to decrease particle concentrations to 10% and 1%. Higher flow rates exhibited larger total decay rates, that is, a faster decrease in the particle concentration rates. These results are in line with the experimental work of Küpper et al. [49] and Kähler et al. [12]. It is also interesting that the required time for a 99% decrease in the concentration, Δt1%, was twice that required for a 90% decrease, Δt10%. Similarly to the collection efficiency values, a longer time was required with a decreasing particle diameter. Among the cases considered in this study, the smallest Δt10% was observed for the case of the 10 μm particle, the highest flow rate, and the center placement of the ACD.
3.4. Particle Concentrations
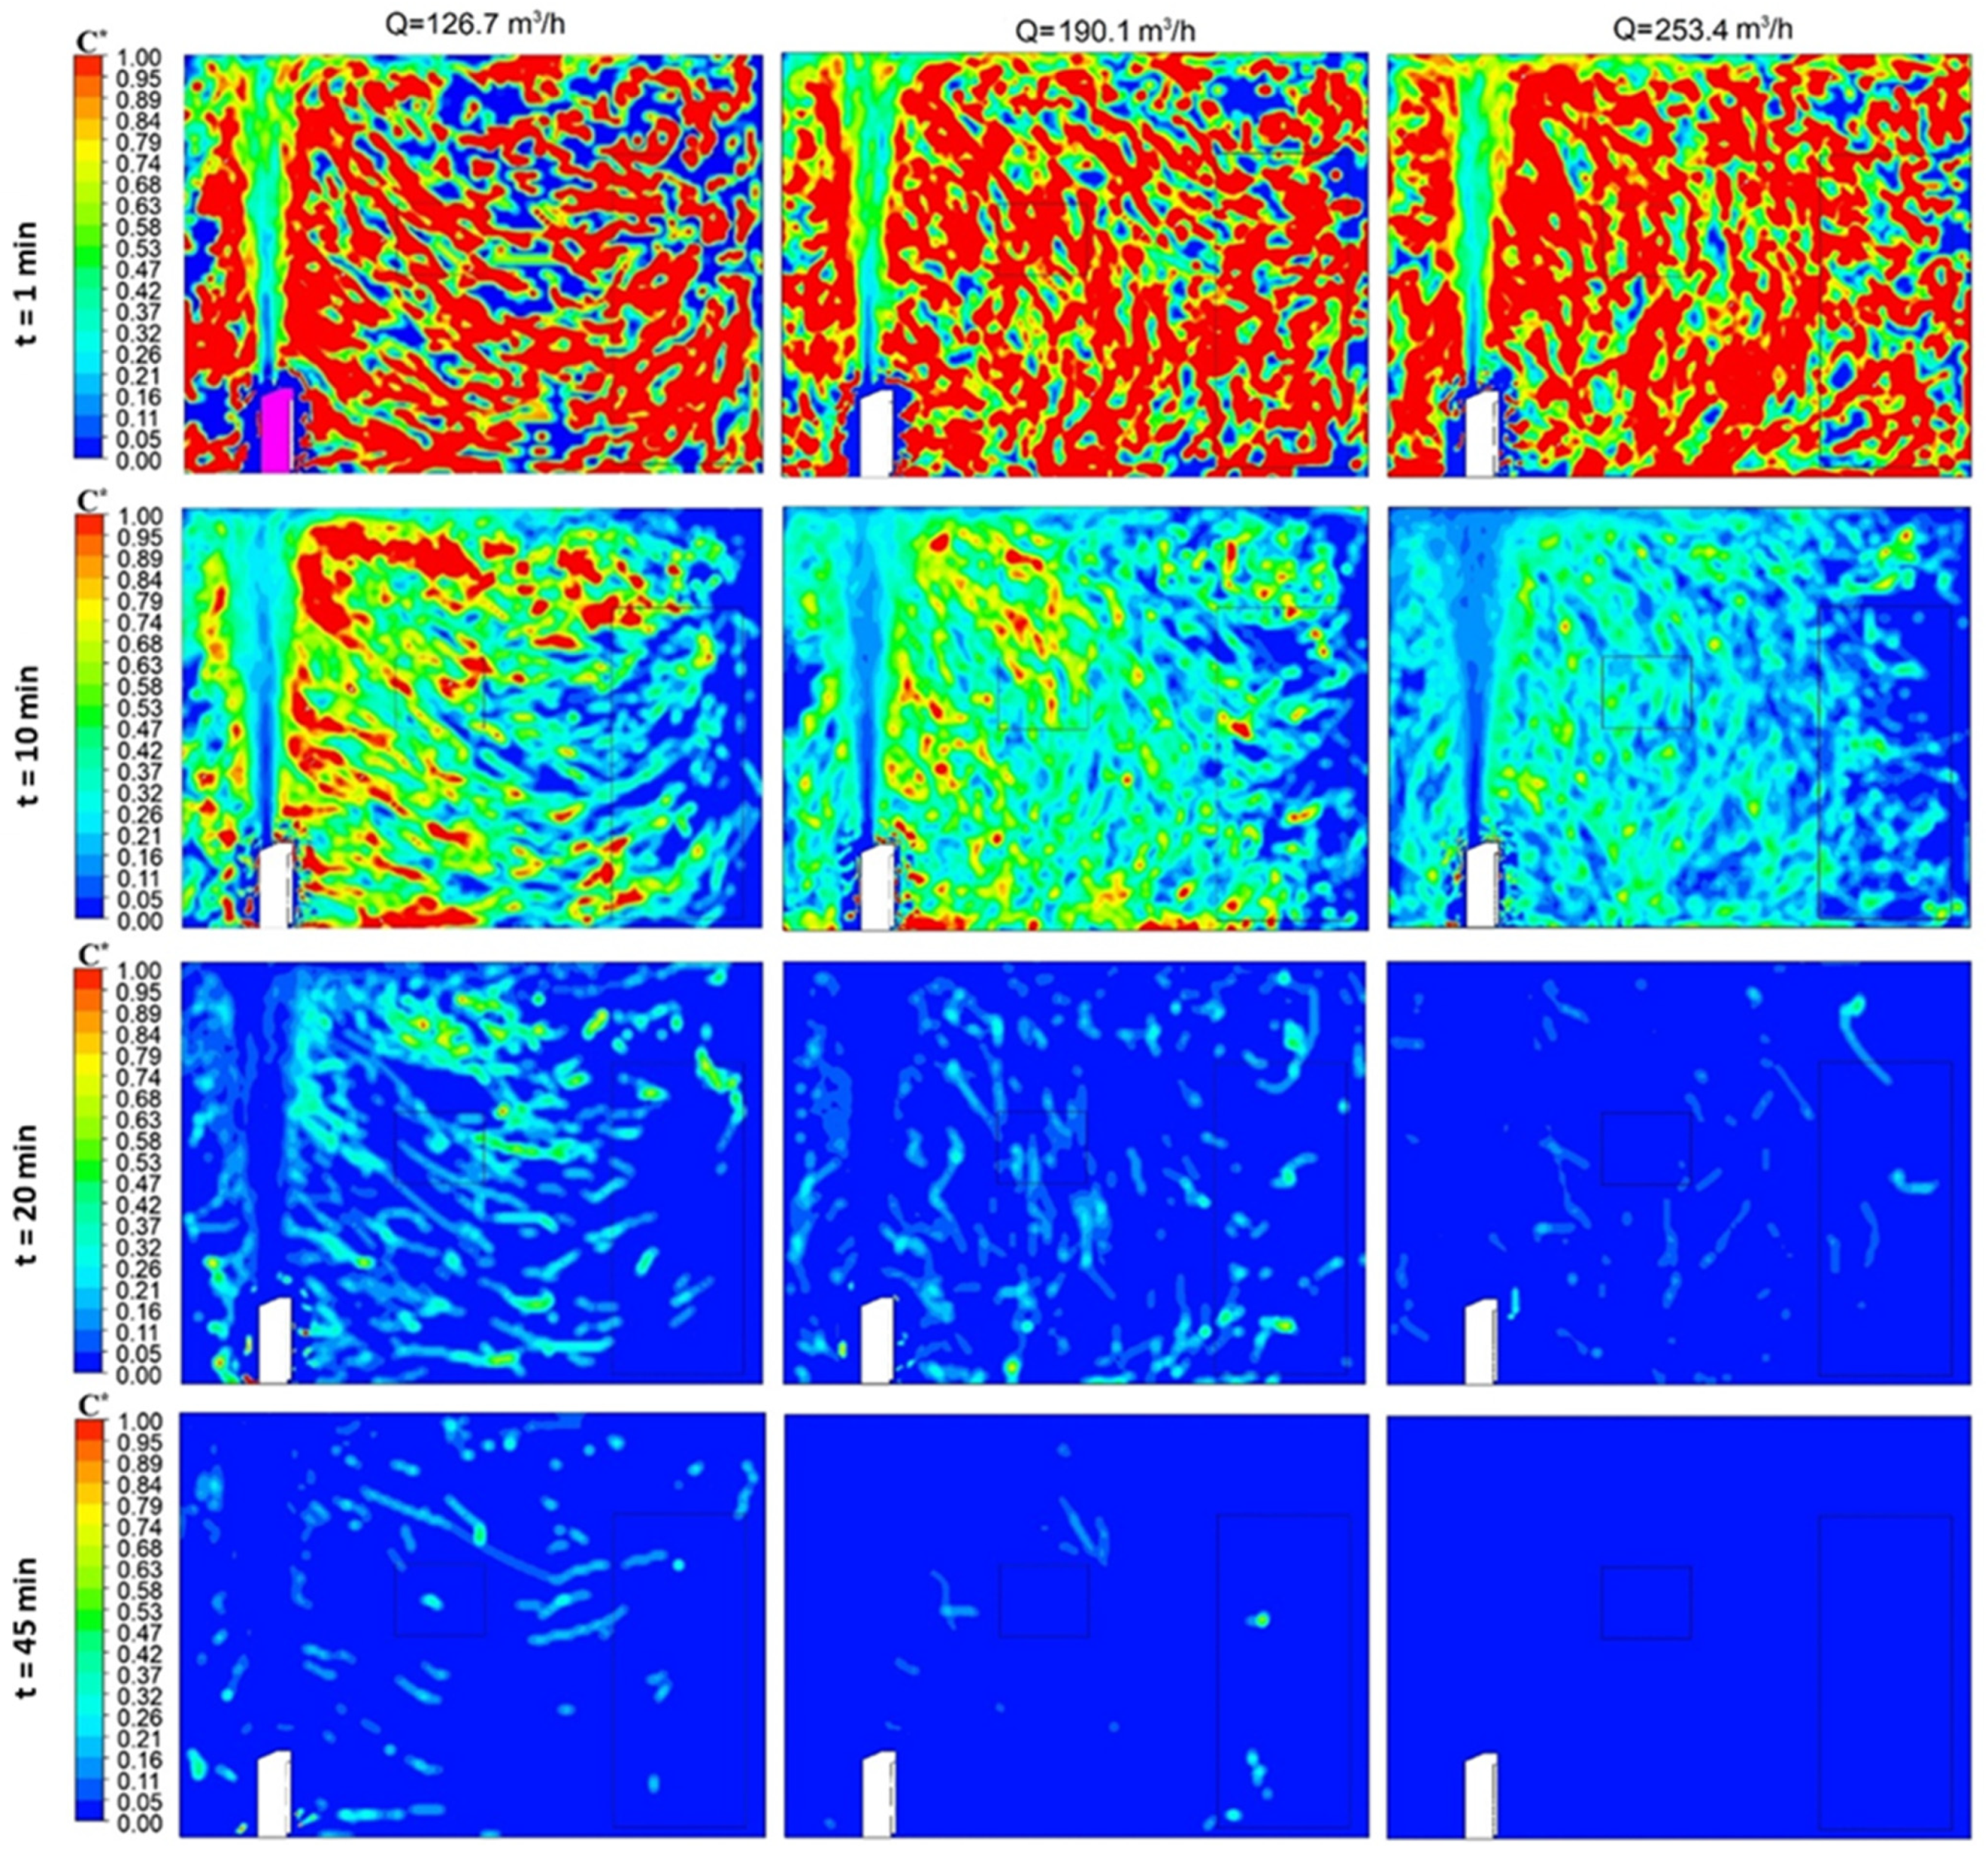
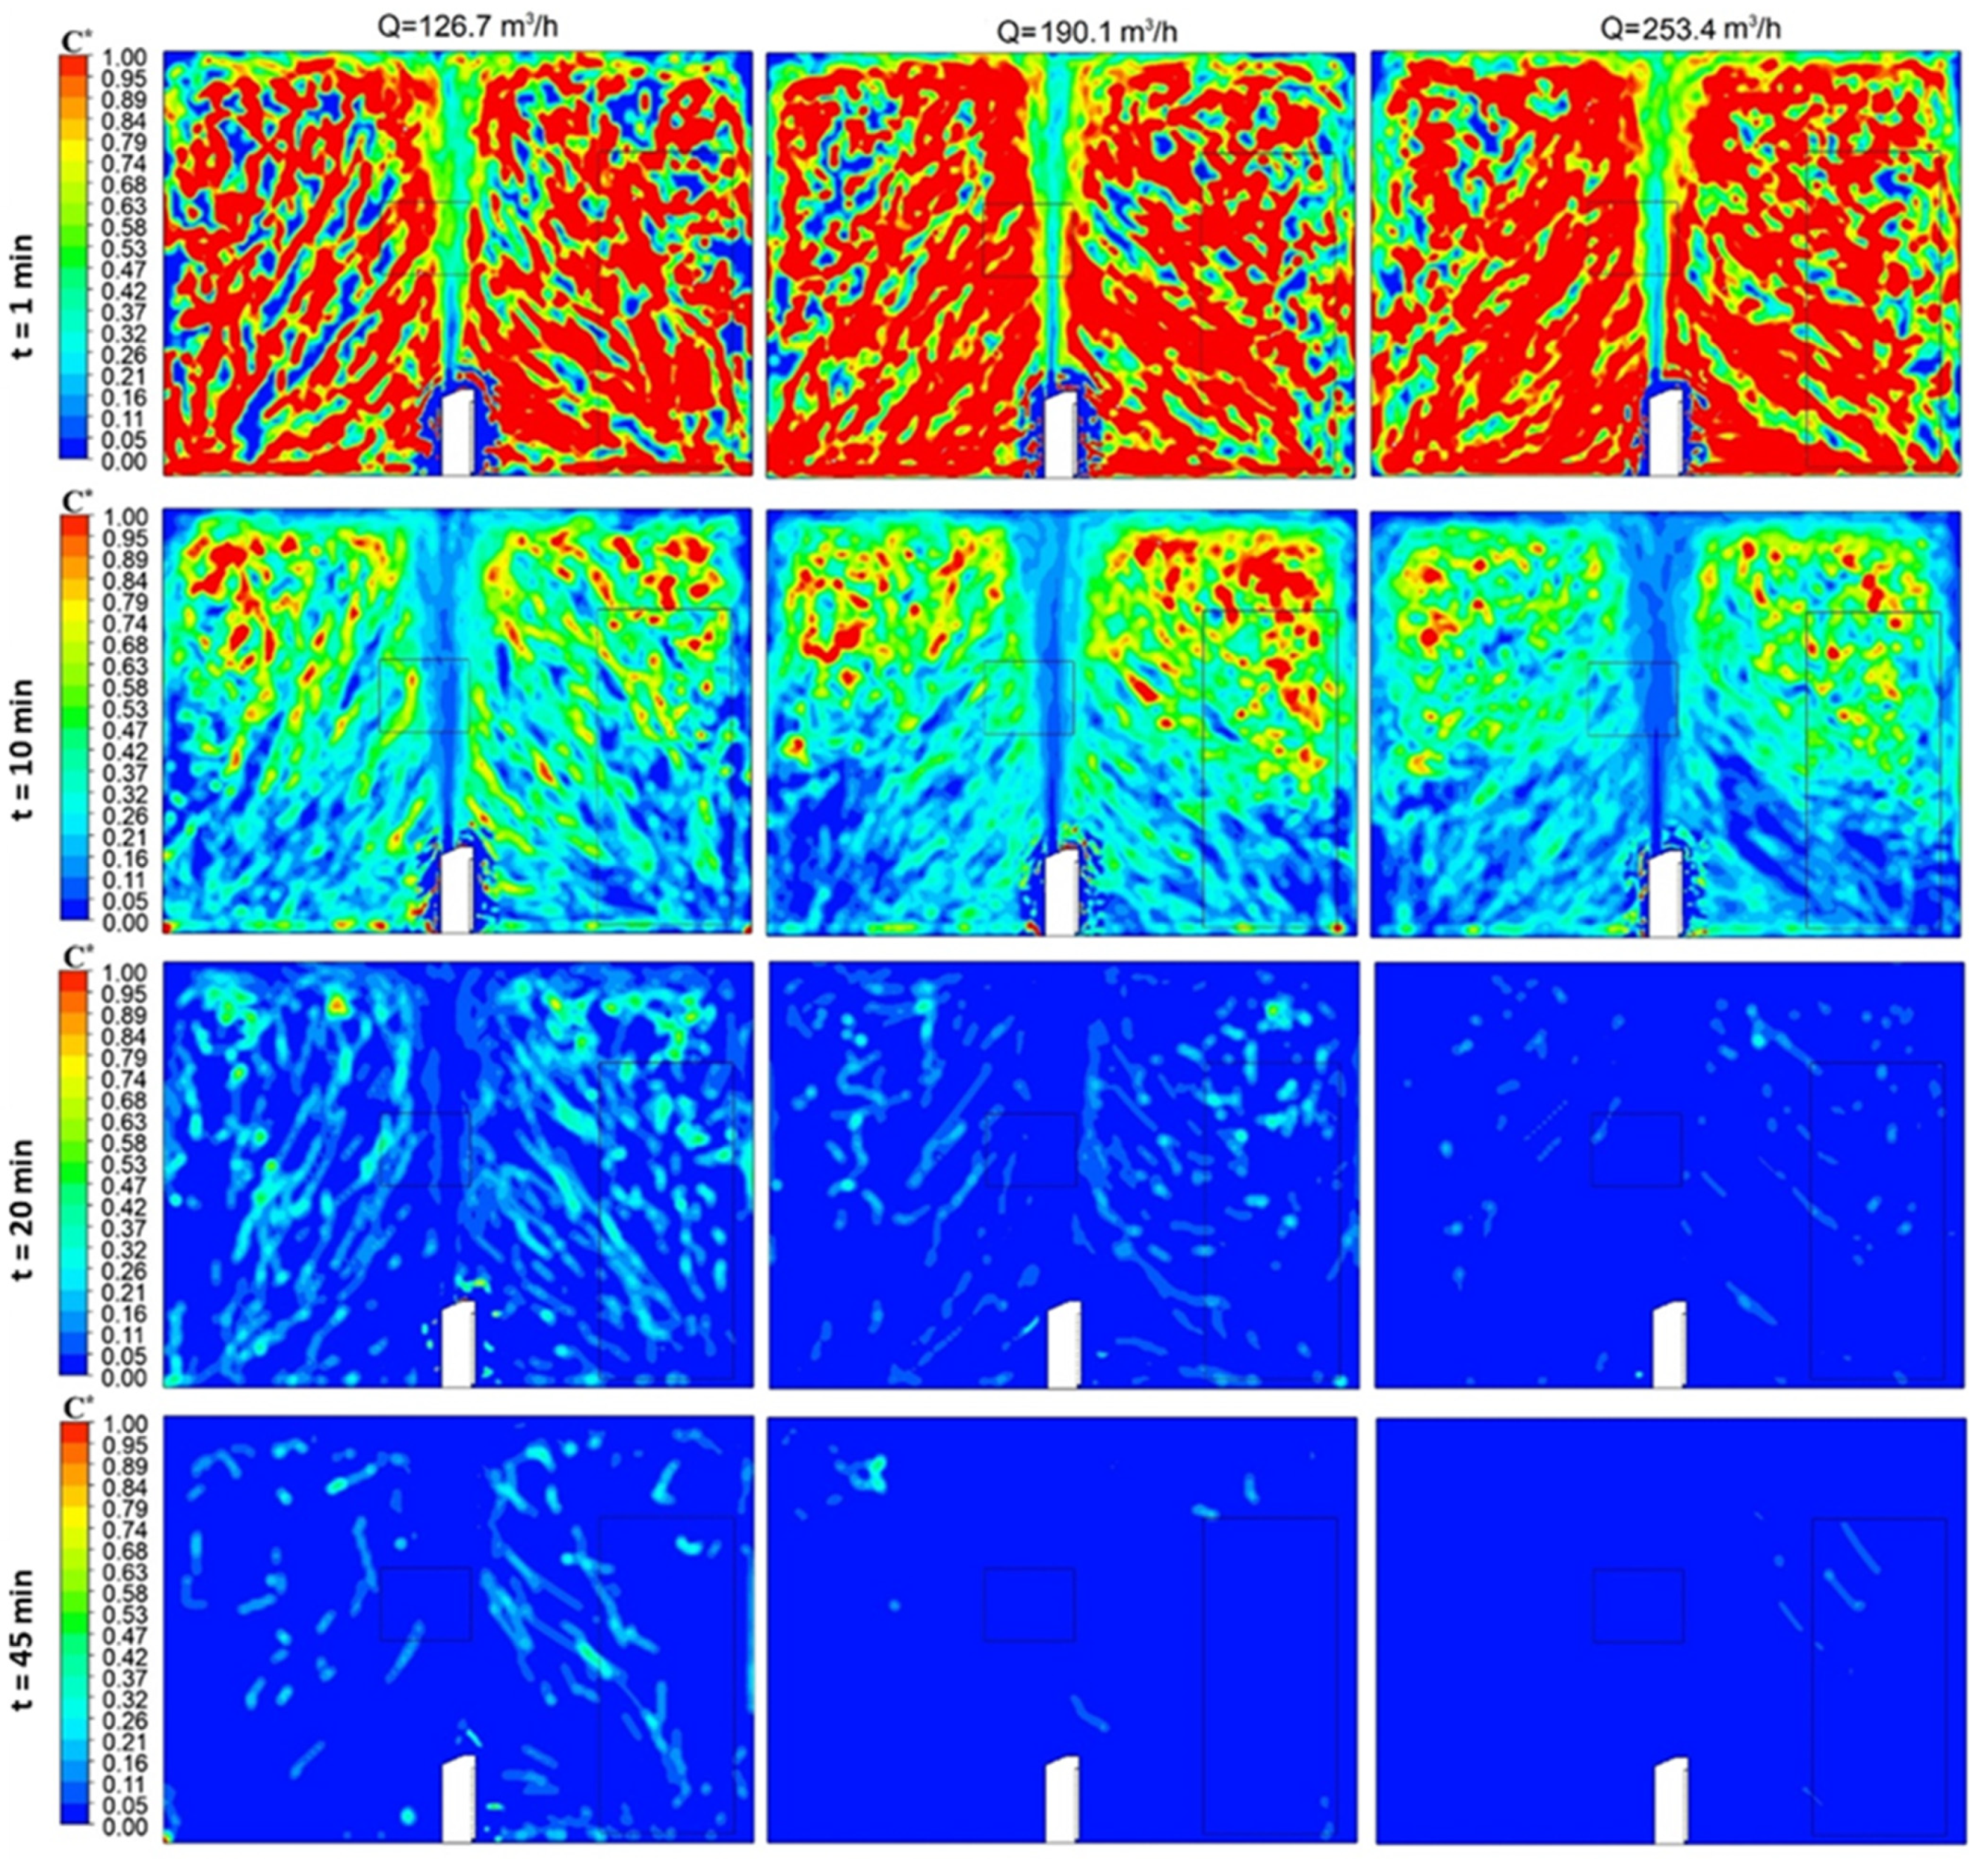
The air cleaner caused different air velocities depending on its position, with different air movement patterns occurring in the room, as shown in Figure 4 and Figure 5. The effect of device location on air movement also directly affected the particle concentration in the environment. Figure 6 and Figure 7 show the variation in particle concentrations formed in the plane in the middle of the room over time. By increasing the blowing speed for both positions of the ACD, the particle concentration decreased faster in the environment. At the end of a 45 min period, for a blowing flow rate of 253.4 m3/h, the concentration of particles in the room became almost zero. On the other hand, at a low flow rate (126.7 m3/h), there were regions where the particle concentration was about 10% of the initial concentration in the room after 45 min.

Figure 6.
Particle concentration change over time while the ACD was located near the wall.
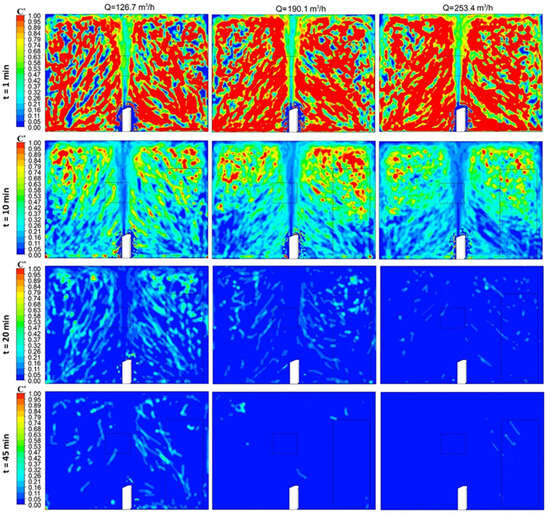
Figure 7.
Particle concentration change over time while the ACD was located in the center of the room.
While the ACD was in position 1, the most critical regions in terms of particle concentrations were found to be 1.8 m above the floor of the room. When the ACD was in position 2, the most critical area was 1.5 m in front of the device. Particulate concentrations were found to be effective in this region from the floor to the ceiling of the room. Therefore, when these two different ACD locations need to be evaluated in terms of health, the inhabitants are exposed to these pollutants. From this point of view, position 2 should be preferred over position 1, which would expose occupants to high concentrations from floor to ceiling. This is because the high concentrations formed in position 2 would occur at a higher position than the respiratory organs, even for a standing person.
3.5. Limitations of the Present Study
The majority of air purifiers available on the market today can be easily identified by their unique design, dimensions, capacity, and operating conditions. This makes this study a very specific instance from which it is impossible to generalize the observed behavior to all air purifier kinds. Therefore, the procedure used in this study should be followed for performance determination of different ACDs. Users may inhale considerable amounts of contaminants as a result of indoor pollution exposure [1,5,13]. The mixing and transport dynamics of aerosols in the room can be strongly impacted by the proximity of an ACD to the sources of emission and to physical barriers [49]. Since the current study used a test room that complied with the AHAM standard, no furniture or other obstructions and no internal or external pollutant sources that could have an impact on air flow or on the ACD’s performance were taken into account.
Further, it was assumed that the thermal comfort conditions were met in the test room. It means there was no external or internal heating, cooling, air exchange, or air conditioning systems in the room. Although seasonal factors (temperature and humidity variations) and their effect on the air flow and the pollutants in the room could be important, as reported in references [3,4], these effects were not considered in the present work. This will be considered in further studies.
Another limitation is the filtering efficiency of the ACD. It was assumed that all particles were captured by the ACD, i.e., 100% filtering efficiency, and that the purified clean air was supplied to the room. This study does not concern the filtering technologies used in the ACD. In general, the CADR values of air cleaners with old/used filters were substantially lower than those with fresh filters [49]. There is a large number of pollutants with different dimensions and characteristics, as seen in the references [1,13,49,50]. This study only considered the spherical liquid water droplets with diameters of 1 μm and 10 μm. They were considered as the inhaled particulate matter responsible for airborne transmission of viruses.
4. Conclusions
In this study, the performance of a commercially available air cleaner was investigated numerically by using CADR and age of air parameters. Twelve different cases were considered to investigate the influence of air cleaner location (center location and wall-side location), particle diameters (1 μm and 10 µm), and blowing speed (2 m/s, 3 m/s, and 4 m/s) on the system performance. The velocity, temperature, and age of air distributions associated with the ACD in a room are shown. The main conclusions from the analyses presented in this study could be summarized as follows:
- An increase in the air flow rate of the ACD causes more substantial recirculation inside the room. The age of air values decrease when the flow rates increase at both locations. Also, the center placement of the ACD shortens the air age due to a smaller recirculation zone and a more homogeneous air distribution.
- An increase in the air flow rate results in an increase in the CADR values of the ACD, meaning a better cleaning performance. As a result, an increase in the air flow rate has positive effects on both CADR and age of air parameters. The center placement of the ACD has higher CADR values compared to the wall-side placement.
- To improve the air quality at a certain location, both an increase in blowing speed and a change of device position should be considered. Another important point is that the increase in blowing speed increases the difference in air age values between the two positions. In other words, the air age values in the room become more dependent on the device position as the distance of the location from the device and the blowing speeds increase.
- By comparing the two performance methods, it is observed that the mean age of air method shows a recirculation structure of the air in the room. Therefore, the best position, which gives the smallest mean air age in the room, can be determined. Meanwhile, the CADR method gives the best collection efficiency considering the particle diameters and the flow rate. In addition to that, the decay rate of the particles and the required cleaning time interval for an air cleaning device can be determined using the CADR method. Hence, both methods are useful to determine the performance of an air cleaner device.
Author Contributions
Conceptualization, M.K. and M.G.; methodology, M.K. and M.G.; software, M.K. and M.G.; validation, M.K. and M.G.; formal analysis, M.K. and M.G.; investigation, M.K. and M.G.; resources, M.K. and M.G.; data curation, M.K. and M.G.; writing—original draft preparation, M.K. and M.G.; writing—review and editing, M.K. and M.G.; visualization, M.K. and M.G.; supervision, M.K.; project administration, M.K. All authors have read and agreed to the published version of the manuscript.
Funding
This research received no external funding.
Institutional Review Board Statement
Not applicable.
Informed Consent Statement
Not applicable.
Data Availability Statement
The data used to support the findings of this study are included within the article.
Conflicts of Interest
The authors declare no conflicts of interest.
References
- Di Fiore, C.; Pandolfi, P.; Carriera, F.; Iannone, A.; Settimo, G.; Mattei, V.; Avino, P. The Presence of Aromatic Substances in Incense: Determining Indoor Air Quality and Its Impact on Human Health. Appl. Sci. 2023, 13, 7344. [Google Scholar] [CrossRef]
- Chirico, F.; Settimo, G.; Magnavita, N. Indoor Air Quality and Indoor Environmental Quality: The role of occupational health surveillance and the cooperation between public and occupational health stakeholders. J. Health Soc. Sci. 2023, 8, 262–269. [Google Scholar] [CrossRef]
- Luo, Y.; Zhang, L.; Zhang, S.; Ai, L.; Lv, H.; Zhu, C.; Wu, J.H.; Tan, W. Effects and interaction of air pollution and meteorological factors on pertussis incidence in PR China. Hyg. Environ. Health Adv. 2022, 4, 100036. [Google Scholar] [CrossRef]
- Aglan, A.; Synn, A.J.; Nurhussien, L.; Chen, K.; Scheerens, C.; Koutrakis, P.; Coull, B.; Rice, M.B. Personal and community-level exposure to air pollution and daily changes in respiratory symptoms and oxygen saturation among adults with COPD. Hyg. Environ. Health Adv. 2023, 6, 100052. [Google Scholar] [CrossRef] [PubMed]
- Gola, M.; Caggiano, G.; De Giglio, O.; Napoli, C.; Diella, G.; Carlucci, M.; Carpagnano, L.F.; D’Alessandro, D.; Joppolo, C.M.; Capolongo, S.; et al. SARS-CoV-2 indoor contamination: Considerations on anti-COVID-19 management of ventilation systems, and finishing materials in healthcare facilities. Ann. Ig. 2021, 33, 381–392. [Google Scholar] [CrossRef]
- Faulkner, W.B.; Mermarzadeh, F.; Riskowski, G.; Kalbasi, A.; Chang, A.C. Effects of Air Exchange Rate, Particle Size and Injection Place on Particle Concentrations within a Reduced-Scale Room. Build. Environ. 2015, 92, 246–255. [Google Scholar]
- Chen, L.; Jin, X.; Yang, L.; Du, X.; Yang, Y. Particle transport characteristics in indoor environment with an air cleaner: The effect of nonuniform particle distributions. Build. Simul. 2017, 10, 123–133. [Google Scholar] [CrossRef]
- Zheng, W.; Hu, J.; Wang, Z.; Li, J.; Fu, Z.; Li, H.; Jurasz, J.; Chou, S.K.; Yan, J. COVID-19 Impact on Operation and Energy Consumption of Heating, Ventilation and Air-Conditioning (HVAC) Systems. Adv. Appl. Energy 2021, 3, 100040. [Google Scholar]
- Asadi, S.; Bouvier, N.; Wexler, A.S.; Ristenpart, W.D. The coronavirus pandemic and aerosols: Does COVID-19 transmit via expiratory particles? Aerosol Sci. Technol. 2020, 54, 635–638. [Google Scholar]
- Gralton, J.; Tovey, E.; McLaws, M.L.; Rawlinson, W.D. The role of particle size in aerosolised pathogen transmission: A review. J. Infect. 2011, 62, 1–13. [Google Scholar]
- Peng, S.; Chen, Q.; Liu, E. The role of computational fluid dynamics tools on investigation of pathogen transmission: Prevention and control. Sci. Total Environ. 2020, 746, 142090. [Google Scholar] [PubMed]
- Kähler, C.J.; Hain, R.; Fuchs, T. Assessment of Mobile Air Cleaners to Reduce the Concentration of Infectious Aerosol Particles Indoors. Atmosphere 2023, 14, 698. [Google Scholar] [CrossRef]
- Settimo, G.; Yu, Y.; Gola, M.; Buffoli, M.; Capolongo, S. Challenges in IAQ for Indoor Spaces: A Comparison of the Reference Guideline Values of Indoor Air Pollutants from the Governments and International Institutions. Atmosphere 2023, 14, 633. [Google Scholar] [CrossRef]
- Tobisch, A.; Springsklee, L.; Schäfer, L.F.; Sussmann, N.; Lehmann, M.J.; Weis, F.; Zöllner, R.; Niessner, J. Reducing indoor particle exposure using mobile air purifiers—Experimental and numerical analysis. AIP Adv. 2021, 11, 125114. [Google Scholar] [CrossRef]
- Mohamadi, F.; Fazeli, A. A Review on Applications of CFD Modeling in COVID-19 Pandemic. Arch. Comput. Methods Eng. 2022, 29, 3567–3586. [Google Scholar] [CrossRef]
- Kilic, M.; Sevilgen, G. Modelling airflow, heat transfer and moisture transport around a standing human body by computational fluid dynamics. Int. Commun. Heat Mass Transf. 2008, 35, 1159–1164. [Google Scholar]
- Sevilgen, G.; Kılıç, M. Transient Numerical Analysis of Airflow and Heat Transfer in a Vehicle Cabin during Heating Period. Int. J. Veh. Des. 2010, 52, 144–159. [Google Scholar]
- AHAM. Method for Measuring the Performance of Portable Household Electric Room Air Cleaners; AHAM: Quezon City, Philippines, 2013; pp. 1–4. [Google Scholar]
- Buratti, C.; Palladino, D. Mean Age of Air in Natural Ventilated Buildings: Experimental Evaluation and CO2 Prediction by Artificial Neural Networks. Appl. Sci. 2020, 10, 1730. [Google Scholar] [CrossRef]
- Kılıç, M.; Mutlu, İ.H.; Saldamlı, I. Numerical investigation of an air cleaning device performance. J. Fac. Eng. Arch. Gazi Univ. 2022, 37, 2077–2089. [Google Scholar]
- Zhang, T.; Wang, S.; Sun, G.; Xu, L.; Takaoka, D. Flow Impact of an Air Conditioner to Portable Air Cleaning. Build. Environ. 2010, 45, 2047–2056. [Google Scholar]
- Jin, X.; Yang, L.; Du, X.; Yang, Y. Particle Transport Characteristics in Indoor Environment with an Air Cleaner. Indoor Built Environ. 2016, 25, 987–996. [Google Scholar]
- Moradi Kashkooli, F.; Sefidgar, M.; Soltani, M.; Anbari, S.; Shahandashti, S.-A.; Zargar, B. Numerical Assessment of an Air Cleaner Device under Different Working Conditions in an Indoor Environment. Sustainability 2021, 13, 369. [Google Scholar] [CrossRef]
- Park, H.; Park, S.; Seo, J. Evaluation on Air Purifier’s Performance in Reducing the Concentration of Fine Particulate Matter for Occupants According to Its Operation Methods. Int. J. Environ. Res. Public Health 2020, 17, 5561. [Google Scholar] [CrossRef] [PubMed]
- Noh, K.C.; Oh, M. Variation of Clean Air Delivery Rate and Effective Air Cleaning Ratio of Room Air Cleaning Devices. Build. Environ. 2015, 84, 44–49. [Google Scholar]
- Ma, H.; Shen, H.; Shui, T.; Li, Q.; Zhou, L. Experimental Study on Ultrafine Particle Removal Performance of Portable Air Cleaners with Different Filters in an Office Room. Int. J. Environ. Res. Public Health 2016, 13, 102. [Google Scholar] [CrossRef]
- Noh, K.C.; Yook, S.J. Evaluation of Clean Air Delivery Rates and Operating Cost Effectiveness for Room Air Cleaner and Ventilation System in a Small Lecture Room. Energy Build. 2016, 119, 111–118. [Google Scholar]
- Tran, P.T.M.; Adam, M.G.; Balasubramanian, R. Mitigation of Indoor Human Exposure to Airborne Particles of Outdoor Origin in an Urban Environment during Haze and Non-Haze Periods. J. Hazard. Mater. 2021, 403, 123555. [Google Scholar]
- Pei, J.; Dai, W.; Li, H.; Liu, J. Laboratory and Field Investigation of Portable Air Cleaners’ Long-Term Performance for Particle Removal to Be Published in: Building and Environment. Build. Environ. 2020, 181, 107100. [Google Scholar]
- Siegel, J.A. Primary and Secondary Consequences of Indoor Air Cleaners. Indoor Air 2016, 26, 88–96. [Google Scholar]
- Sabanskis, A.; Vidulejs, D.D.; Teličko, J.; Virbulis, J.; Jakovičs, A. Numerical Evaluation of the Efficiency of an Indoor Air Cleaner under Different Heating Conditions. Atmosphere 2023, 14, 1706. [Google Scholar] [CrossRef]
- Saidi, M.S.; Rismanian, M.; Monjezi, M.; Zendehbad, M.; Fatehiboroujeni, S. Comparison between Lagrangian and Eulerian approaches in predicting motion of micron-sized particles in laminar flows. Atmos. Environ. 2014, 89, 199–206. [Google Scholar]
- Wang, M.; Lin, C.H.; Chen, Q. Advanced turbulence models for predicting particle transport in enclosed environments. Build. Environ. 2012, 47, 40–49. [Google Scholar]
- ANSYS. AnsysFluent 19.0 Theory Guide; Release 19.0; ANSYS Inc.: Canonsburg, PA, USA, 2021. [Google Scholar]
- Sevilgen, G.; Kılıç, M. Three Dimensional Numerical Analysis of Temperature Distribution in an Automobile Cabin. Therm. Sci. 2012, 16, 321–326. [Google Scholar]
- Sevilgen, G.; Kılıç, M. Investigation of Transient Cooling of an Automobile Cabin with a Virtual Manikin under Solar Radiation. Therm. Sci. 2013, 17, 397–406. [Google Scholar]
- Sevilgen, G.; Kılıç, M. Numerical analysis of air flow, heat transfer, moisture transport and thermal comfort in a room heated by two-panel radiators. Energy Build. 2011, 43, 137–146. [Google Scholar] [CrossRef]
- Choudhury, D. Introduction to the Renormalization Group Method and Turbulence Modelling; Fluent Inc.: New York, NY, USA, 1993; Volume 107. [Google Scholar]
- Hinds, W.C. Aerosol Technology, 2nd ed.; John Wiley & Sons: New York, NY, USA, 1999. [Google Scholar]
- Mutlu, M. Numerical Investigation of Indoor Air Quality in a Floor Heated Room with Different Air Change Rates. Build. Simul. 2020, 13, 1063–1075. [Google Scholar] [CrossRef]
- Mutlu, M. Particle Concentration Comparison of Radiator and Floor Heating Systems under Zero Air Change Rate Condition. Aerosol Air Qual. Res. 2021, 21, 210148. [Google Scholar] [CrossRef]
- Joppolo, C.M.; Bertolina, D.; Palazzo, M.; Marocco, L. Preserving Leonardo’s Last Supper: A CFD case study. J. Cult. Herit. 2021, 51, 194–200. [Google Scholar] [CrossRef]
- Kılıç, M.; Mutlu, M.; Altun, A.F. Numerical Simulation and Analytical Evaluation of the Collection Efficiency of the Particles in a Gas by the Wire-Plate Electrostatic Precipitators. Appl. Sci. 2022, 12, 6401. [Google Scholar] [CrossRef]
- Bake, B.; Larsson, P.; Ljungkvist, G.; Ljungström, E.; Olin, A.C. Exhaled particles and small airways. Respir. Res. 2019, 20, 8. [Google Scholar] [CrossRef]
- Nicas, M.; Nazaroff, W.W.; Hubbard, A. Toward understanding the risk of secondary airborne infection: Emission of respirable pathogens. J. Occup. Environ. Hyg. 2005, 2, 143–154. [Google Scholar] [CrossRef] [PubMed]
- Johnson, G.R.; Morawska, L.; Ristovski, Z.D.; Hargreaves, M.; Mengersen, K.; Chao, C.Y.H.; Wan, M.P.; Li, Y.; Xie, X.; Katoshevski, D.; et al. Modality of human expired aerosol size distributions. J. Aerosol Sci. 2011, 42, 839–851. [Google Scholar] [CrossRef]
- Morawska, L.; Johnson, G.R.; Ristovski, Z.D.; Hargreaves, M.; Mengersen, K.; Corbett, S.; Chao, C.Y.H.; Li, Y.; Katoshevski, D. Size distribution and sites of origin of droplets expelled from the human respiratory tract during expiratory activities. J. Aerosol Sci. 2009, 40, 256–269. [Google Scholar] [CrossRef]
- Allen, M.D.; Raabe, O.G. Re-evaluation of millikan’s oil drop data for the motion of small particles in air. J. Aerosol Sci. 1982, 13, 537–547. [Google Scholar]
- Küpper, M.; Asbach, C.; Schneiderwind, U.; Finger, H.; Spiegelhoff, D.; Schumacher, S. Testing of an Indoor Air Cleaner for Particulate Pollutants under Realistic Conditions in an Office Room. Aerosol Air Qual. Res. 2019, 19, 1655–1665. [Google Scholar] [CrossRef]
- Shiue, A.; Hu, S.C.; Tseng, C.H.; Kuo, E.H.; Liu, C.Y.; Hou, C.T.; Yu, T. Verification of Air Cleaner On-Site Modeling for PM2.5 and TVOC Purification in a Full-Scale Indoor Air Quality Laboratory. Atmos. Pollut. Res. 2019, 10, 209–218. [Google Scholar] [CrossRef]
- Gunschera, J.; Markewitz, D.; Bansen, B.; Salthammer, T.; Ding, H. Portable Photocatalytic Air Cleaners: Efficiencies and by-Product Generation. Environ. Sci. Pollut. Res. 2016, 23, 7482–7493. [Google Scholar] [CrossRef]
Disclaimer/Publisher’s Note: The statements, opinions and data contained in all publications are solely those of the individual author(s) and contributor(s) and not of MDPI and/or the editor(s). MDPI and/or the editor(s) disclaim responsibility for any injury to people or property resulting from any ideas, methods, instructions or products referred to in the content. |
© 2024 by the authors. Licensee MDPI, Basel, Switzerland. This article is an open access article distributed under the terms and conditions of the Creative Commons Attribution (CC BY) license (https://creativecommons.org/licenses/by/4.0/).