Article

Characterization of Seismic Dynamic Response of Uranium Tailings Dams Based on Discrete Element Method

1
Deep Mining Laboratory of Shandong Gold Group Co., Ltd., Yantai 261400, China
2
School of Resource Environment and Safety Engineering, University of South China, Hengyang 421000, China
*
Author to whom correspondence should be addressed.
Appl. Sci. 2024, 14(18), 8389; https://doi.org/10.3390/app14188389
Submission received: 8 August 2024 / Revised: 9 September 2024 / Accepted: 11 September 2024 / Published: 18 September 2024
(This article belongs to the Special Issue Recent Advances in Rock Mass Engineering)

Abstract

:
Tailings dams play a critical role in ensuring the safety of mining operations. However, earthquakes can cause breaches in these dams, resulting in significant casualties and property damage. This study investigates the dynamic response characteristics of uranium tailings dams subjected to seismic loading, employing the discrete element method. It specifically analyzes how seismic wave amplitude, frequency, and the friction angle of tailings sand affect the dams’ dynamic response. The results reveal that the peak ground acceleration ratio (PGAR) exhibits an increasing–decreasing–increasing pattern with elevation. When the friction angle of the tailings sand exceeds 35°, the overall stability of the dam improves. Conversely, a friction angle below 25° significantly increases the risk of dam failure. Additionally, the dam shows a reduced dynamic response to seismic waves with frequencies exceeding 15 Hz. At lower frequencies, deformation and damage are primarily concentrated on the slope face, while at higher frequencies, damage is predominantly located at the bottom of the model. These findings provide a theoretical foundation and reference for the safe operation of tailings dams, highlighting their practical significance.

1. Introduction

Tailings dam facilities are used to store tailings and other industrial waste discharged from a mine after ore separation [1,2]. Uranium tailings ponds are an important component of uranium mine safety production due to their large capacity, high potential energy, and long storage time [3]. Currently, approximately 1 billion cubic meters of uranium tailings are produced worldwide [4,5]. A breach in a uranium tailings impoundment could result in severe environmental pollution and significant harm to downstream residents. Seismic activity is the primary cause of tailings pond failures [6,7]. Earthquakes can cause the liquefaction of tailings sands, weakening the strength of tailings materials and leading to static deformation of the dam. This can result in residual deformation in the dam structure, causing damage and reducing its overall stability [8,9]. Therefore, studying the dynamic response characteristics under seismic loading is of great practical significance.
Zhou, Jin, and Li [10,11,12] conducted shaking table tests to analyze the acceleration, pore pressure, and displacement of the dam body under seismic waves of varying peak ground accelerations. Their findings revealed that the acceleration peaks of the dam body exhibited distinct spatial effects. Moreover, they observed that the PGA amplification coefficients measured on the slope surface consistently surpassed those in the slope. Notably, they discovered that the dynamic amplification effect on the high side slopes correlated significantly with the slope’s intrinsic frequency. However, laboratory experiments are typically on a small scale, and although shake table tests have their advantages, they also have clear limitations.
Model material parameters play a crucial role in numerical simulations, significantly impacting the authenticity, accuracy, and reliability of results [13,14]. Traditional trial-and-error methods for calibrating rock mechanical parameters are both complex and time-consuming. In contrast, using finite element analysis and machine learning offers an efficient way to accurately predict these parameters [15]. The Weibull distribution can describe the heterogeneity of rock hydraulics, providing a method for parameter distribution in heterogeneous rocks [16].
The dynamic response of the dam under earthquake was simulated using finite element software, and the seismic dynamic response of the dam was analyzed in terms of acceleration, stress, displacement, liquefied area, and stability [17,18]. The vertical dynamic response of a slope is less influenced by elevation, while the horizontal dynamic response has an obvious elevation amplification effect and topographic effect. The ground vibration amplification effect is related to the mechanical strength of the structural surface, as well as the waveform and spectral characteristics of the seismic waves [19]. Jin et al. [20] conducted model testing and numerical calculations using the finite element method to observe the gradual increase in the horizontal and vertical displacements of the monitoring points on the dam body with an increase in input peak acceleration. However, the acceleration amplification coefficient showed a decreasing trend. The collapse of the tailings dam did not exhibit clear evidence of a sliding surface as the input peak acceleration increased. Instead, the collapse mode presented as uniform sliding across the entire structure. Using the OpenSees software v.3.5.0, Vijayasri, T. [21] conducted an analysis on five distinct seismic motions. The study compared different boundary conditions in terms of displacement flow vectors, pore pressures, and stress–strain curves during the shaking period. The findings revealed that the viscous boundary conditions provided a more accurate representation of the actual field conditions in comparison to the fixed boundary conditions. Ferdosi Behnam et al. [22] conducted simulations and analyses to examine the effects of different waste rock reinforcement methods on the seismic performance of tailings dams. The study focused on the impact of seismic wave frequencies and found that low-frequency waves have a greater influence on tailings dams compared to high-frequency waves. The application of non-uniform seismic loads leads to a 10-30% decrease in the dynamic response of concrete panel rockfill dams compared to that of uniform loads. Furthermore, the edges of the concrete panels experience higher dynamic tensile stresses [23,24]. Prodromos N. Psarropoulos and Yiannis Tsompanakis employed an equivalent viscoelasticity model to simulate the dynamic response of different types of tailings dams to seismic forces. They considered the nonlinear properties of the foundation soil and the deposited tailings in order to identify the potential instability modes and seismic failure characteristics of these dams [25]. Most current studies on the dynamic characteristics of tailings dams rely on numerical simulation techniques like the limit equilibrium method and finite element method, which typically provide satisfactory results. Among the various types of numerical simulation methods, the discrete unit method can make up for some of the shortcomings of the finite element method when handling uranium tailings sand due to its discrete nature [26].
This paper examines the dynamic response characteristics of a uranium tailings dam under seismic load using the discrete element method. This study investigates the acceleration, displacement, and velocity change patterns of the uranium tailings dam. Furthermore, it quantitatively analyzes the factors influencing the dynamic response characteristics of the uranium tailings dam, such as the friction angle of the tailings sand and seismic wave amplitude. By controlling the variables, the study calculates the impact of these factors on the dynamic response of the tailings dam. The research findings can be utilized in the development of tailings ponds, providing a theoretical basis and reference for the safe operation of dams. This is of significant importance in safeguarding the safety of downstream residents and protecting the ecological environment.

2. Overview of Uranium Tailings Dams

A typical basin landform in southern China is formed by nine water-retaining dams and surrounding hills. This study focuses on a 300-meter-long section of one such uranium tailings dam. The initial dam of a tailings impoundment is a crushed, homogeneous earth dam with a height of 20 m, a downstream slope ratio of about 1:2.8, and a stacked dam with a slope ratio of about 1:3.4. The inner side of the top of the initial dam and the dam of the stacked dam platform are on bedrock. Table 1 provides an overview of the primary geotechnical parameters for this tailings impoundment.

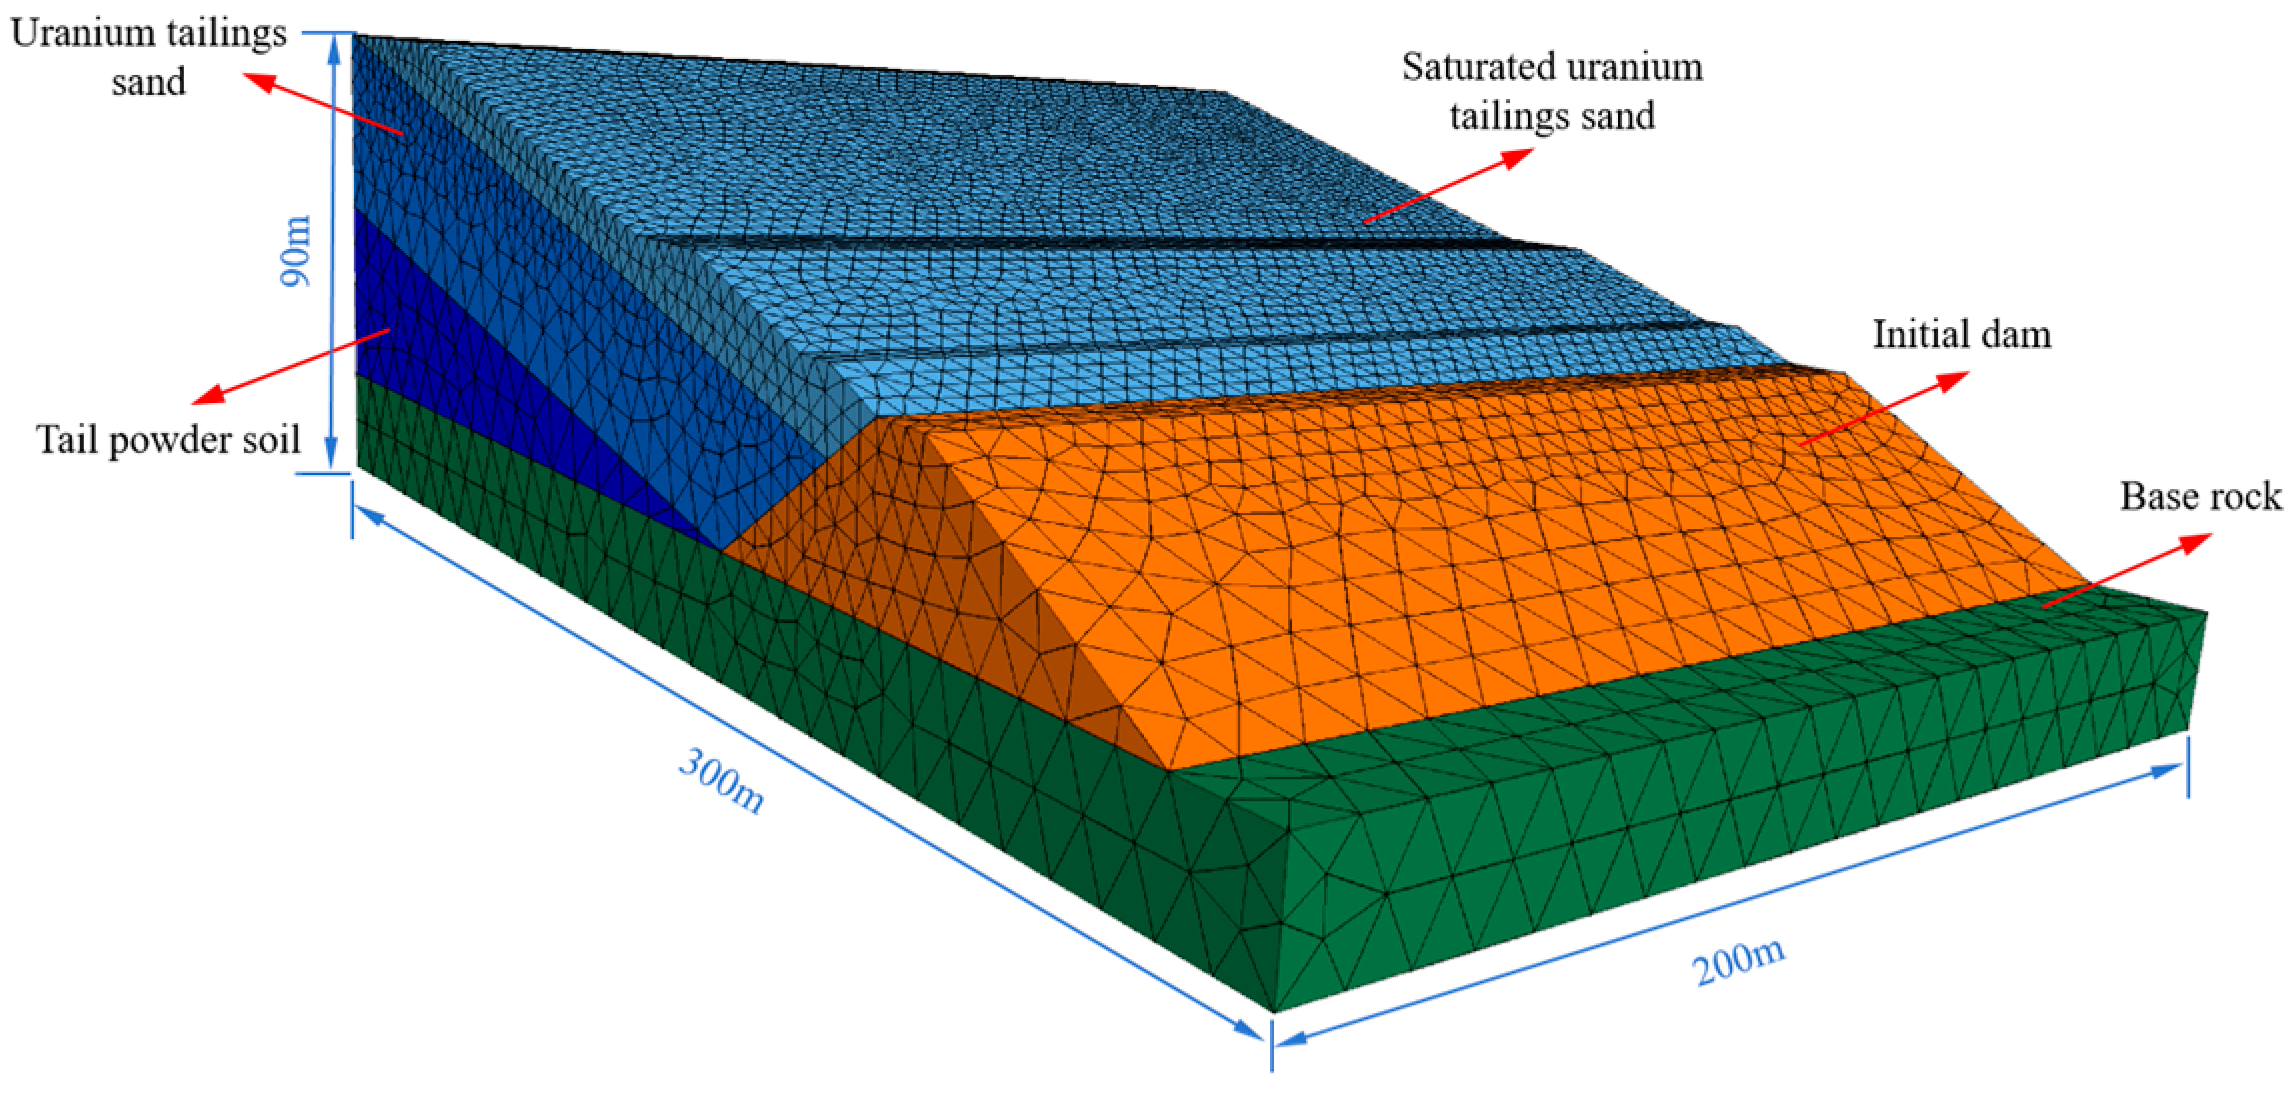
3. Modeling of Dam Dynamics

Considering the geological complexity of the tailings dam, the dam body was simplified according to relevant data and field investigation, and the 3D dynamic analysis model shown in Figure 1 was established. In order to accurately represent the propagation of seismic waves, the size must be smaller than 1/8~1/10 of the minimum wavelength of the input wave, and the size of the model unit was optimized without affecting the calculation accuracy, and a total of 42,574 blocks were determined after trial calculations. Monitoring points are set up in the model to record the change in the velocity, displacement and the acceleration of key points under seismic load.

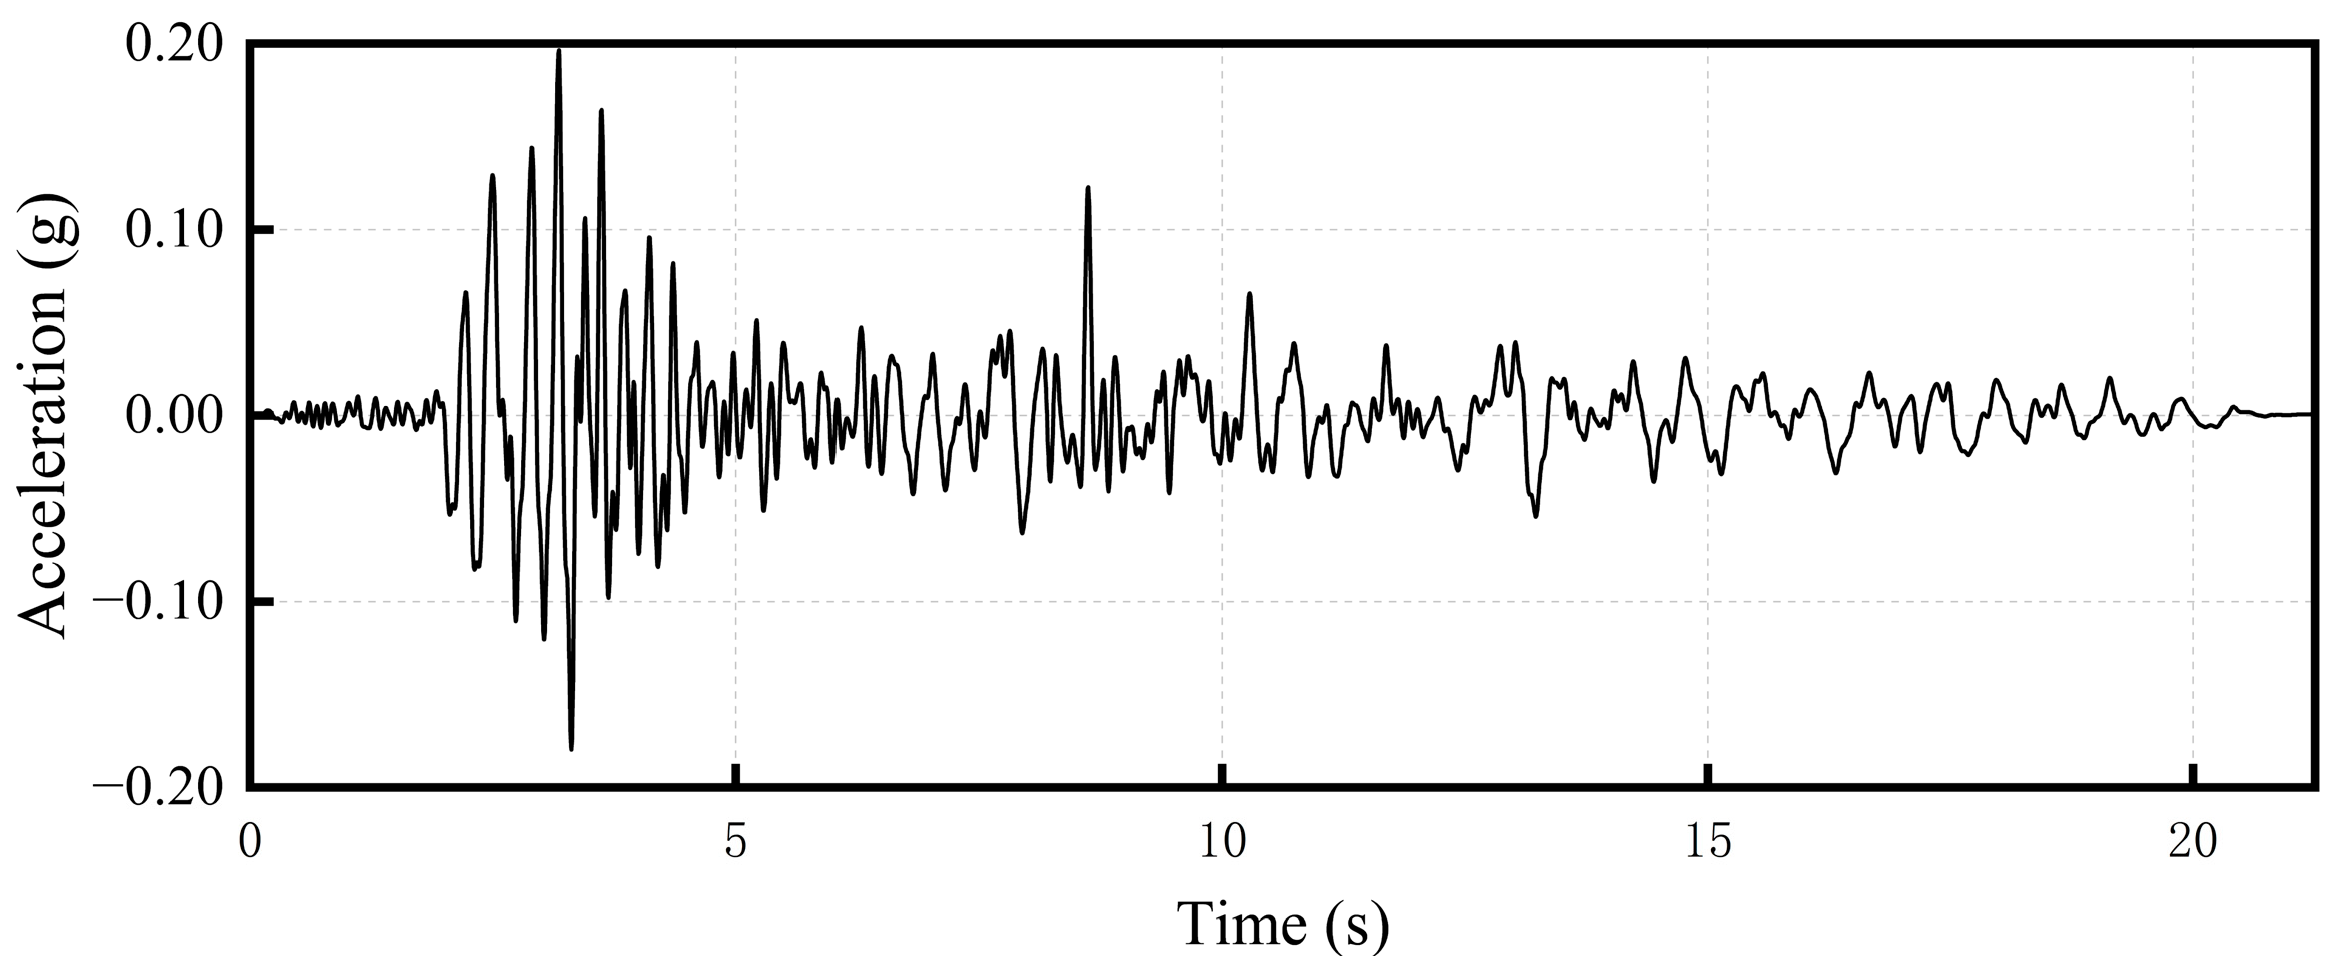
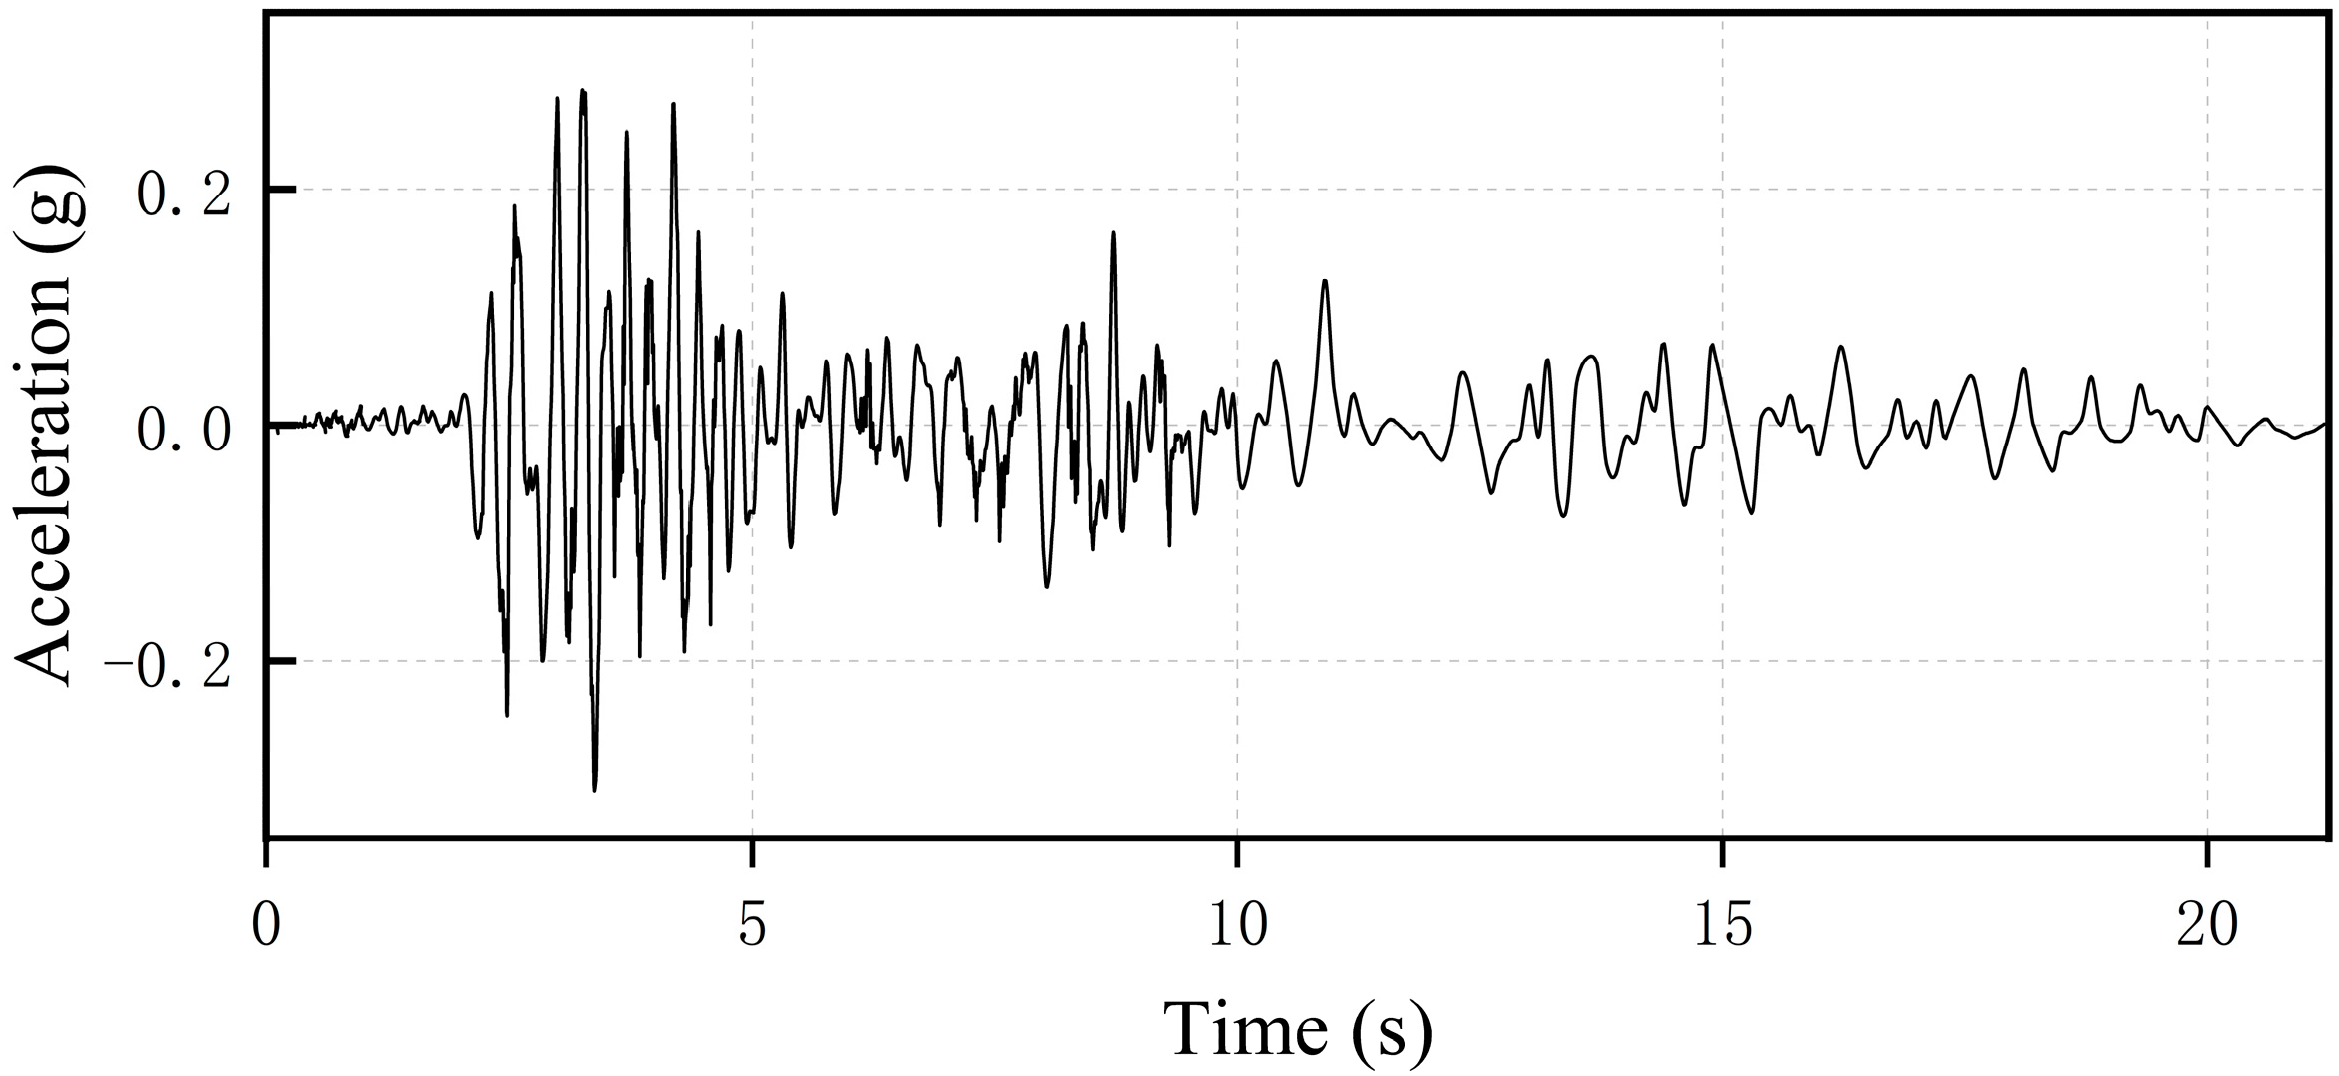
3.1. Loading Seismic Loads

There are two main types of seismic waves: artificial seismic waves and real seismic waves. In this paper, the simulation input seismic wave comes from the PEER ground motion database; the sampling interval is 0.005 s, its peak acceleration is 0.20 g, and the duration of the earthquake is 21.25 s. The time course curves of the acceleration, velocity, and displacement of the seismic wave are shown in Figure 2 and Figure 3.

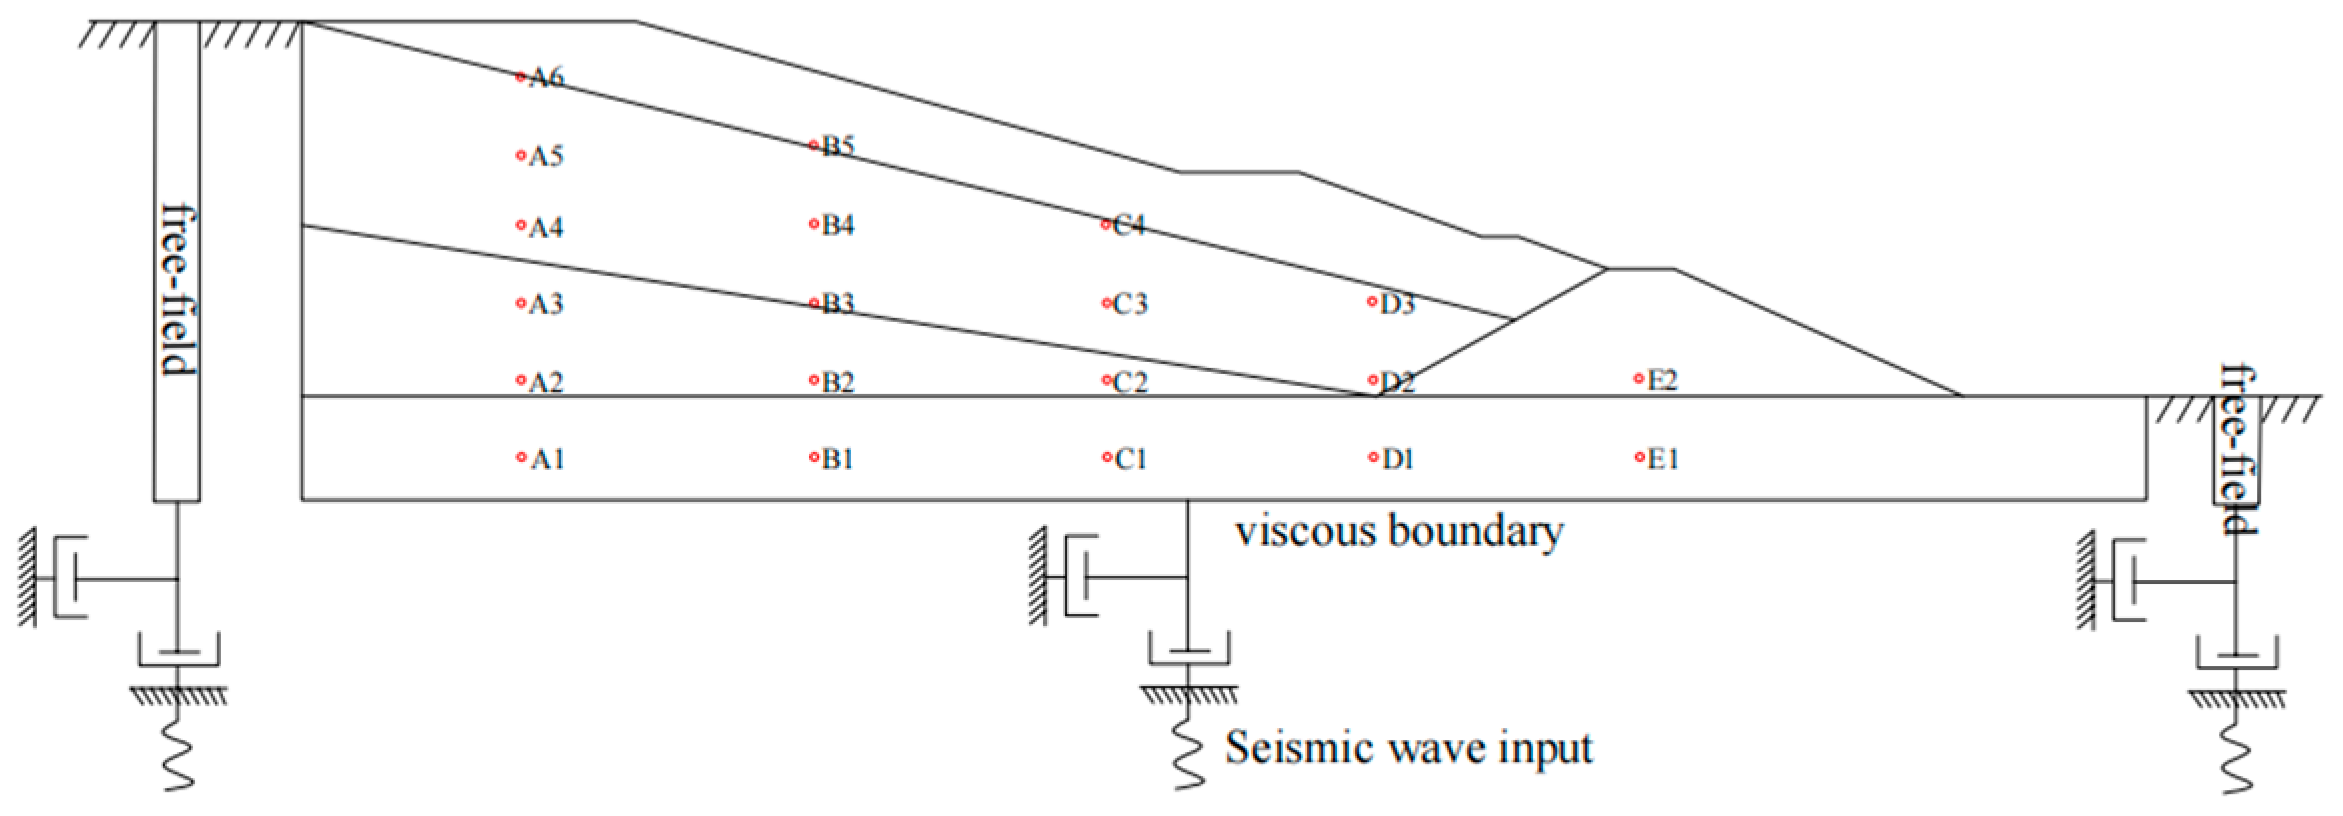
3.2. Setting of Boundary Conditions and Damping

In the static analysis, horizontal displacement constraints are applied to the model, while three-way displacement constraints are set on the bottom surface. The slope surface is left unconstrained, serving as a free surface. When conducting a dynamic analysis, the use of fixed or elastic boundaries can cause outward waves to reflect back into the model, resulting in distorted dynamic calculations. To address this issue, boundary conditions in 3DEC are primarily set as free-field boundaries and viscous boundaries [27,28]. The viscous boundary is positioned at the bottom of the model, surrounded by a free-field boundary (refer to Figure 4). Additionally, the seismic wave must be converted into a stress–time scale and applied to the bottom of the model using the transformation formula [16]:
σ n = 2 ρ c p v n
τ n = 2 ρ c s v s
where: σ n , σ n are the normal and tangential stresses applied to the viscous boundary, respectively; ρ is the density; c p , c s are the longitudinal and transverse wave speeds, respectively; v n , v s are the normal and tangential velocity components on the model boundary.
In the dynamic computational analysis of 3DEC, three common forms of damping are Rayleigh damping, local damping, and Maxwell damping. However, local damping is not suitable for simulating dynamic calculations under seismic loading as it cannot effectively attenuate the high-frequency components of complex waveforms. Both Rayleigh damping and Maxwell damping effectively prevent self-oscillation in systems and manage complex waveforms. Maxwell damping schemes with three components that produce relatively constant damping over the frequency range are relevant to most seismic deformation analyses. The numerical computation time required for Maxwell damping is much less than that required for Rayleigh damping [29,30].

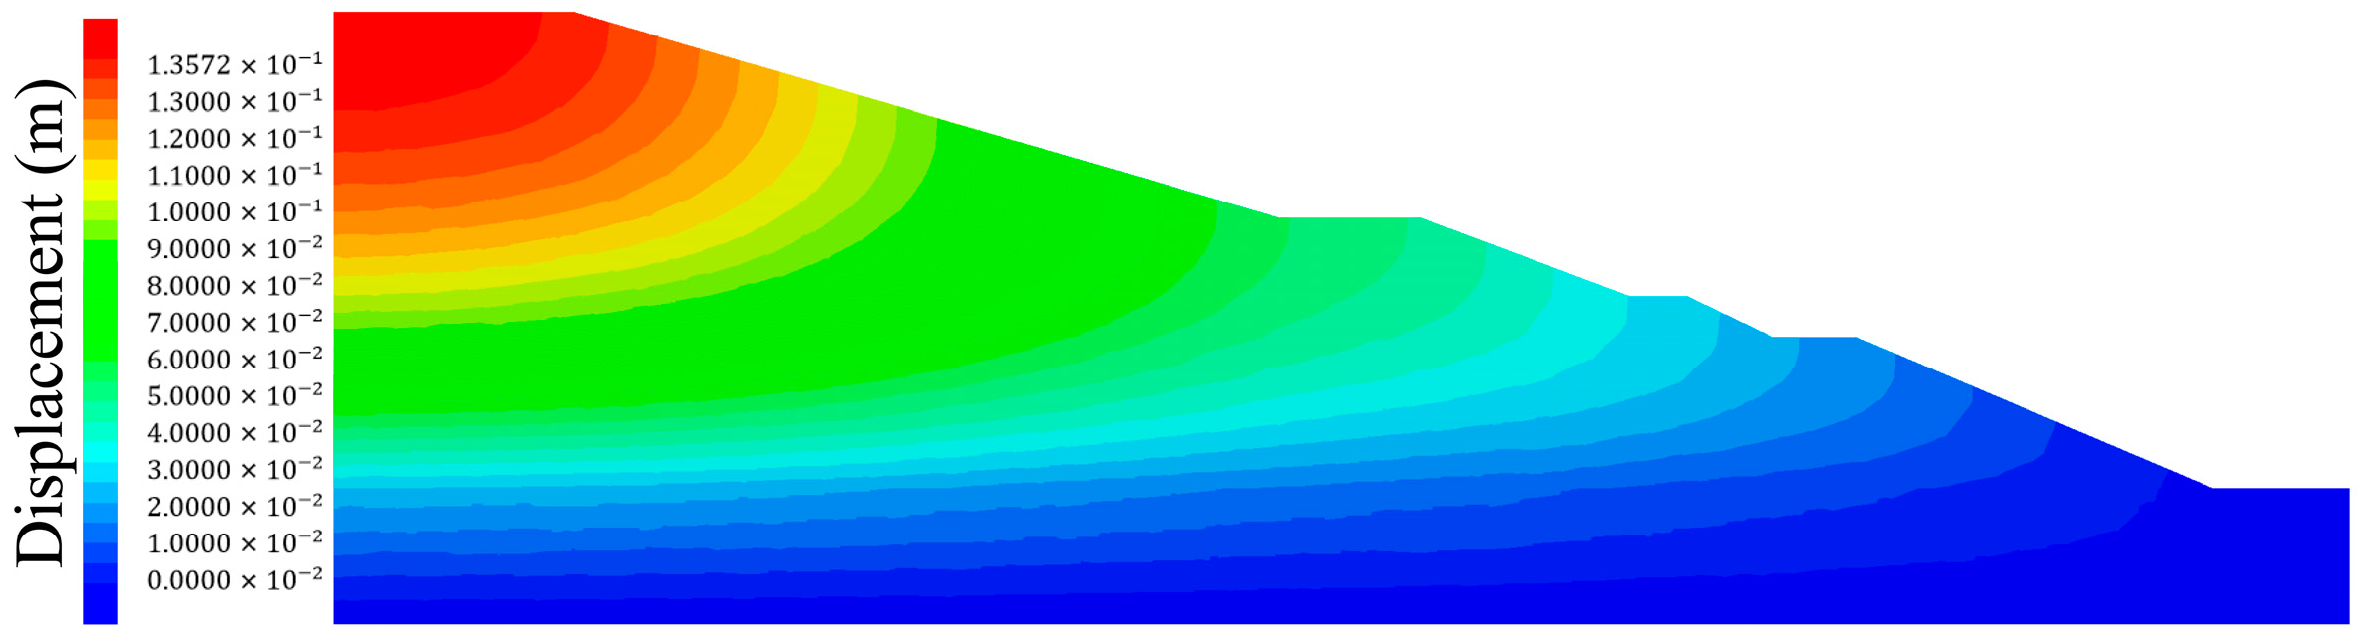
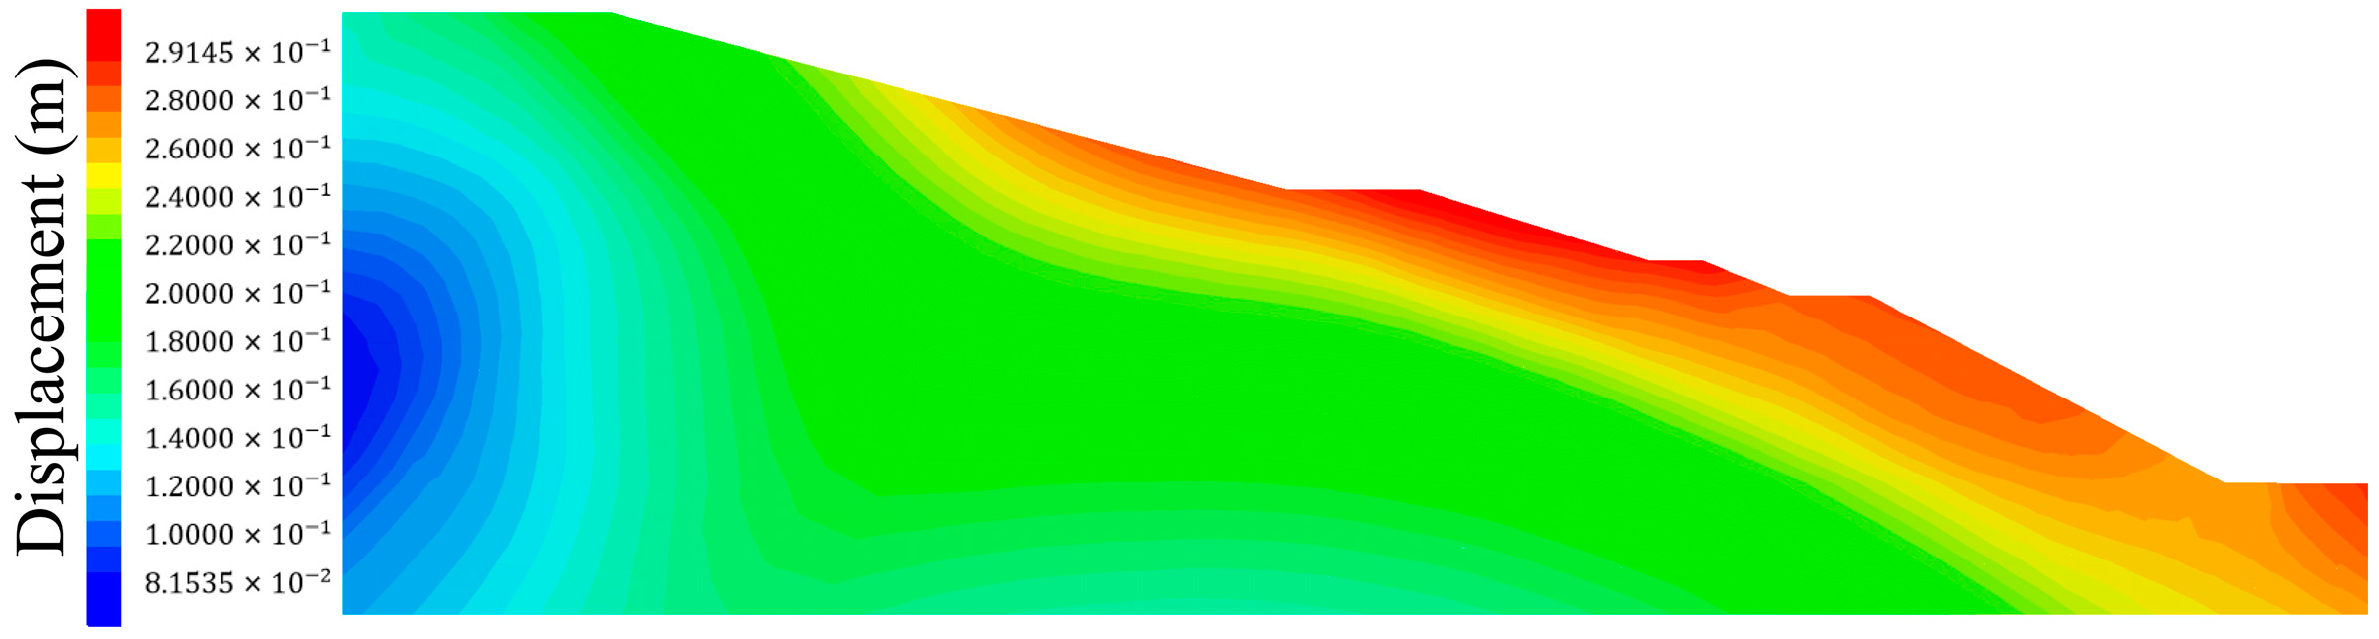
4. Analysis of Numerical Simulation Results

The computational analysis of discrete elements involves two steps. First, computation is performed under self-weight conditions to establish the initial stress field required for dynamic analysis (Figure 5). Then, the seismic wave is applied after resetting the initial velocity and displacement to conduct the dynamic computational analysis. Following the cessation of seismic vibrations, tailings dams may continue to deform. To obtain more reliable results, calculations should persist until the model reaches a state of rest after the seismic loading is completed. The permanent displacement map of the dam body in the x-direction (Figure 6) indicates that, under seismic loading, horizontal displacement is primarily concentrated at the slope face. This displacement is distributed in a stratified manner along a specific curved surface, with a maximum value of 0.26 meters. An analysis of Figure 7 reveals that the maximum permanent displacement in the z-direction is concentrated at the foot of the slope and the bottom of the dam body; however, the displacement at the bottom of the dam body is in the opposite direction to that at the foot of the slope. The cloud diagram of the maximum permanent displacement (Figure 8) illustrates a maximum value of 0.29 m. This instability is predominantly concentrated at the slope face and the foot of the slope, similar to the displacement observed in the x-direction. This suggests that horizontal seismic waves have a more significant impact on the stability of the dam body. Consequently, the instability of the dam body arises from the potential curved sliding surface along the slope, influenced by the superposition of seismic waves in both the horizontal and vertical directions.
The time range curves of monitoring point A1 reveal a high degree of agreement between the slope velocity time range curves and the input displacement time range of the horizontal seismic wave (refer to Figure 9). This indicates that the boundary conditions of the dynamic model and the seismic loading are correct. The numerical calculations also recorded the peak values of the kinematic parameters and their amplification coefficients for each monitoring point simultaneously (Table 2).

5. Analysis of Response-Influencing Factors

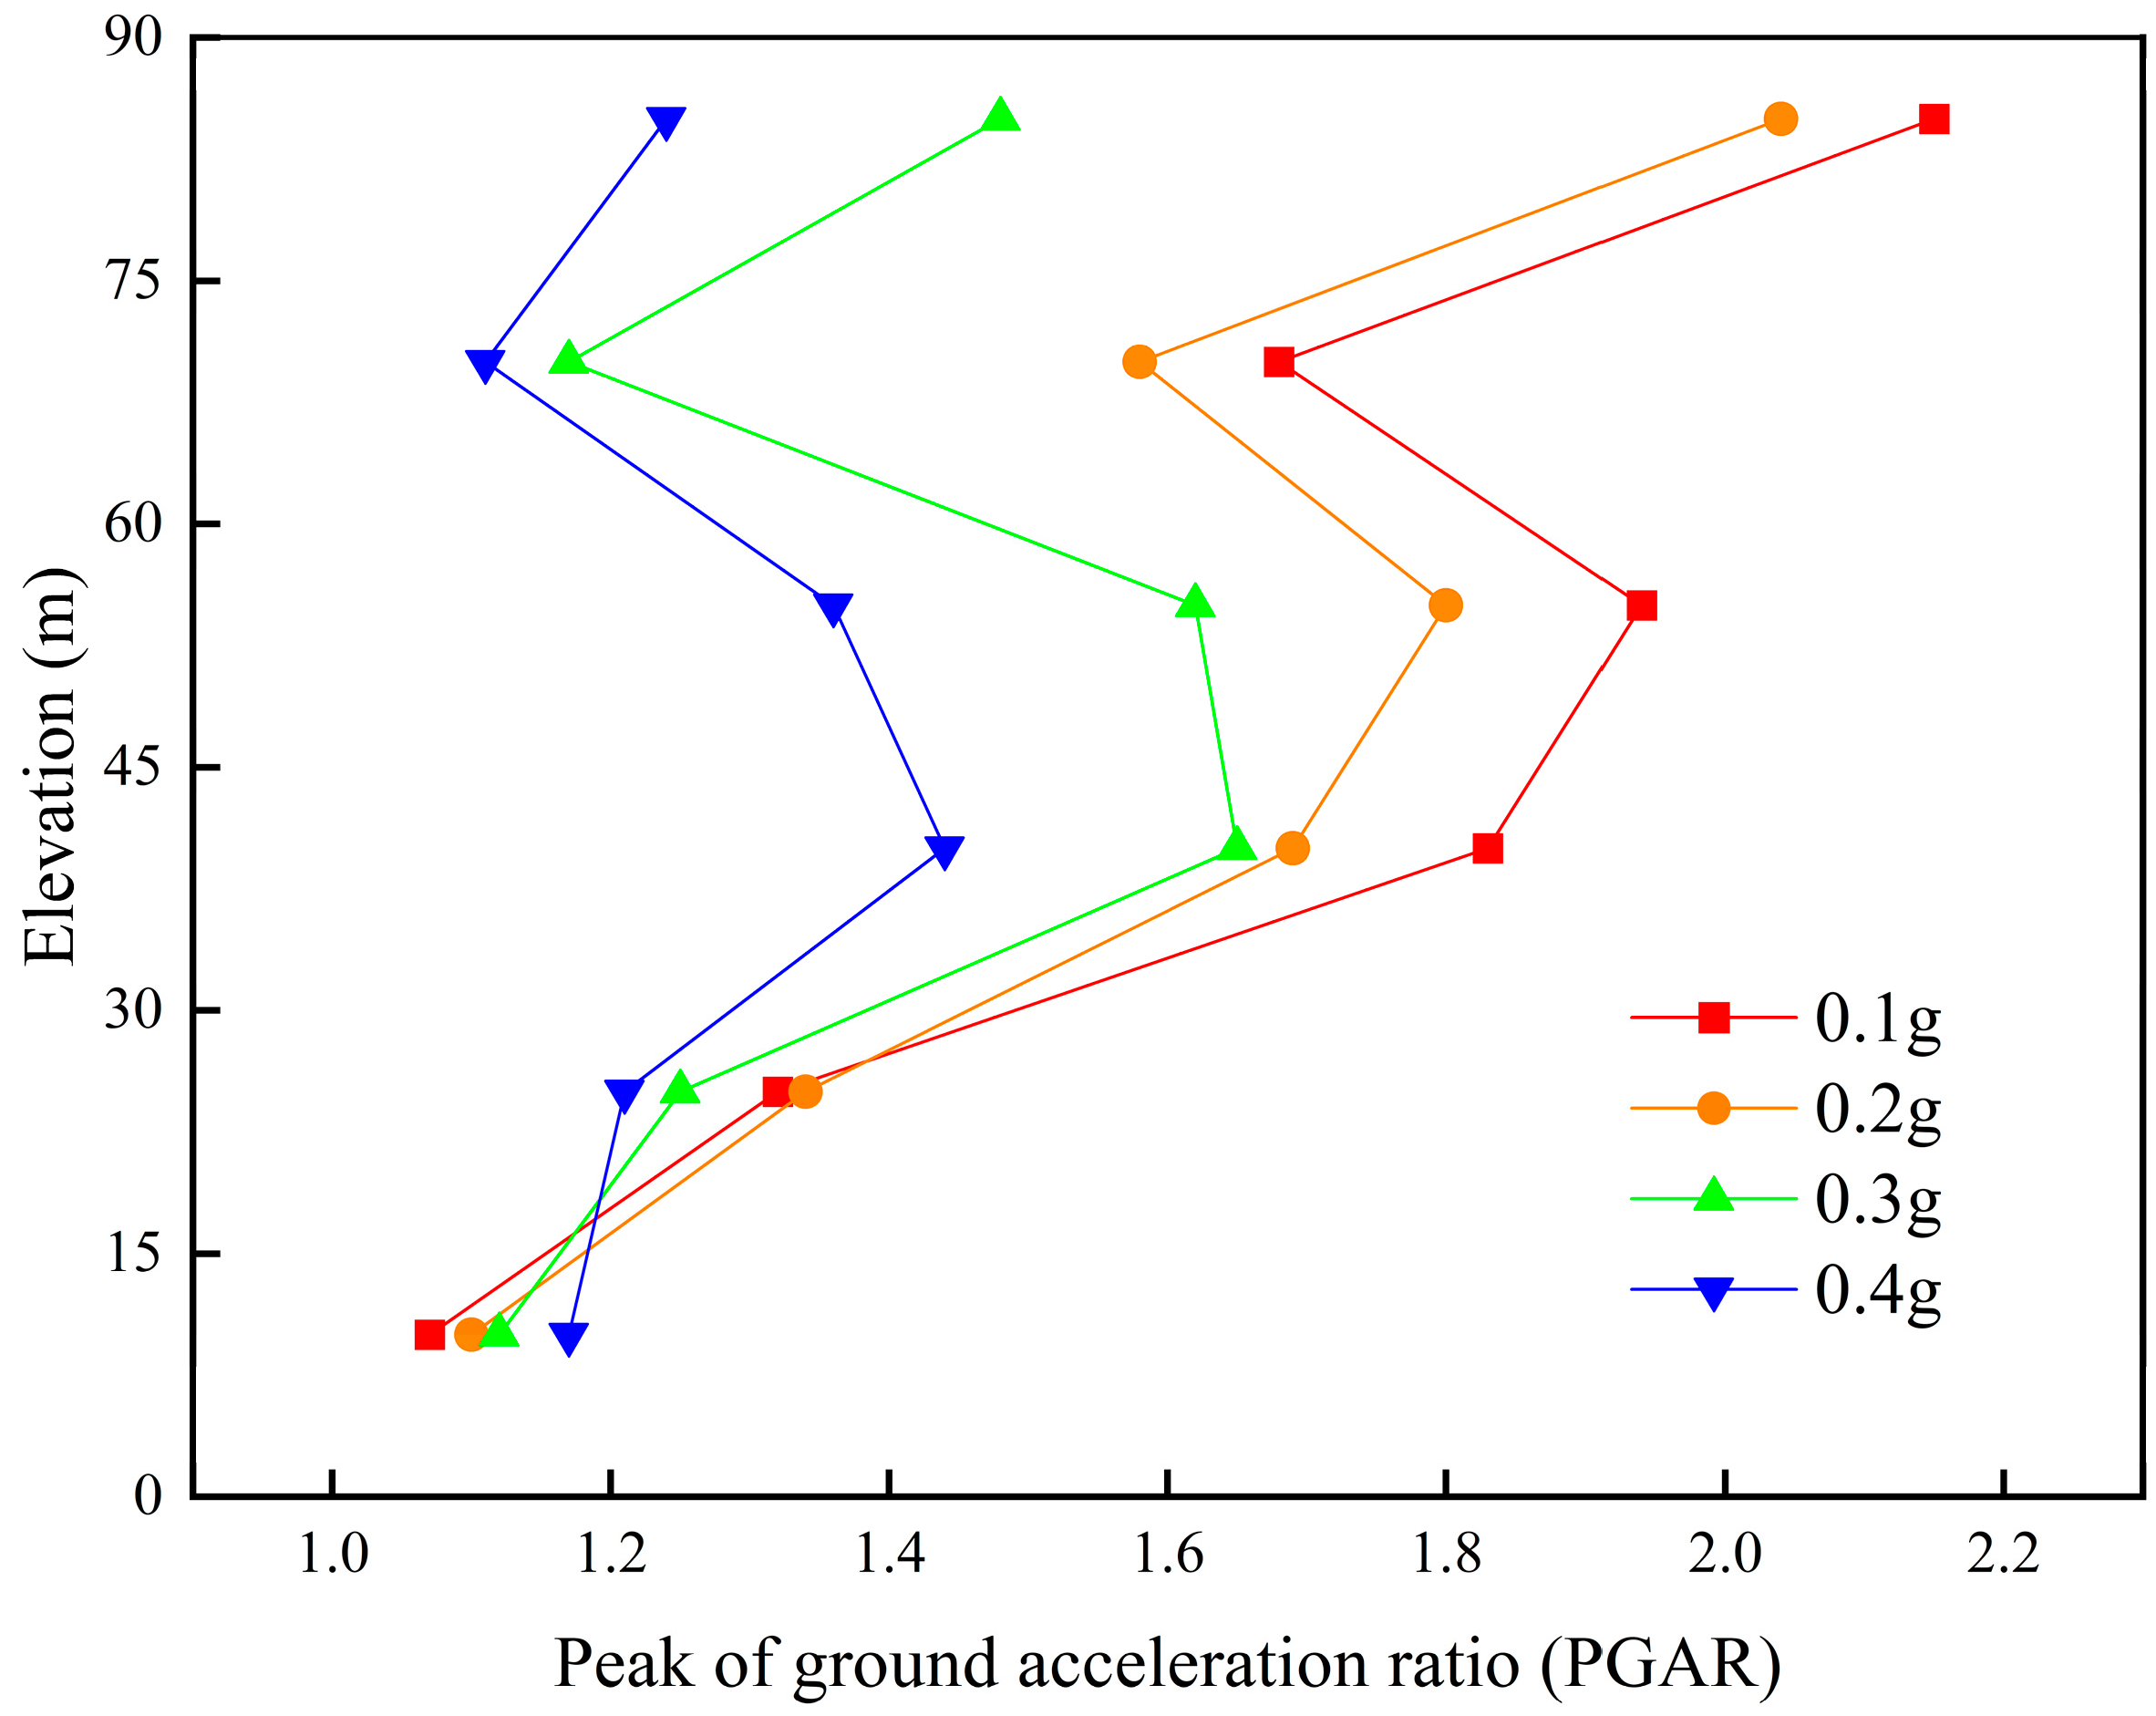
5.1. Effect of Seismic Wave Amplitude on Dam Stability

The kinematic parameters of monitoring point C4 were observed at various amplitudes. Figure 10 illustrates that the displacement value at this monitoring point increases with amplitude, demonstrating a nearly linear relationship. Figure 11 reveals that the peak ground acceleration ratio (PGAR) does not increase linearly with elevation; instead, it exhibits a pattern of increasing, followed by decreasing, and then increasing again. This nonlinear behavior is attributed to the accumulation of shear strain in the tailings sand under seismic action, which reduces the stiffness and increases damping, thereby enhancing the filtering effects. Additionally, it was observed that the PGAR decreases as the seismic wave amplitude increases. This is because the filtering effect of the tailings sand becomes more pronounced at higher seismic wave amplitudes, leading to a reduction in the PGAR.

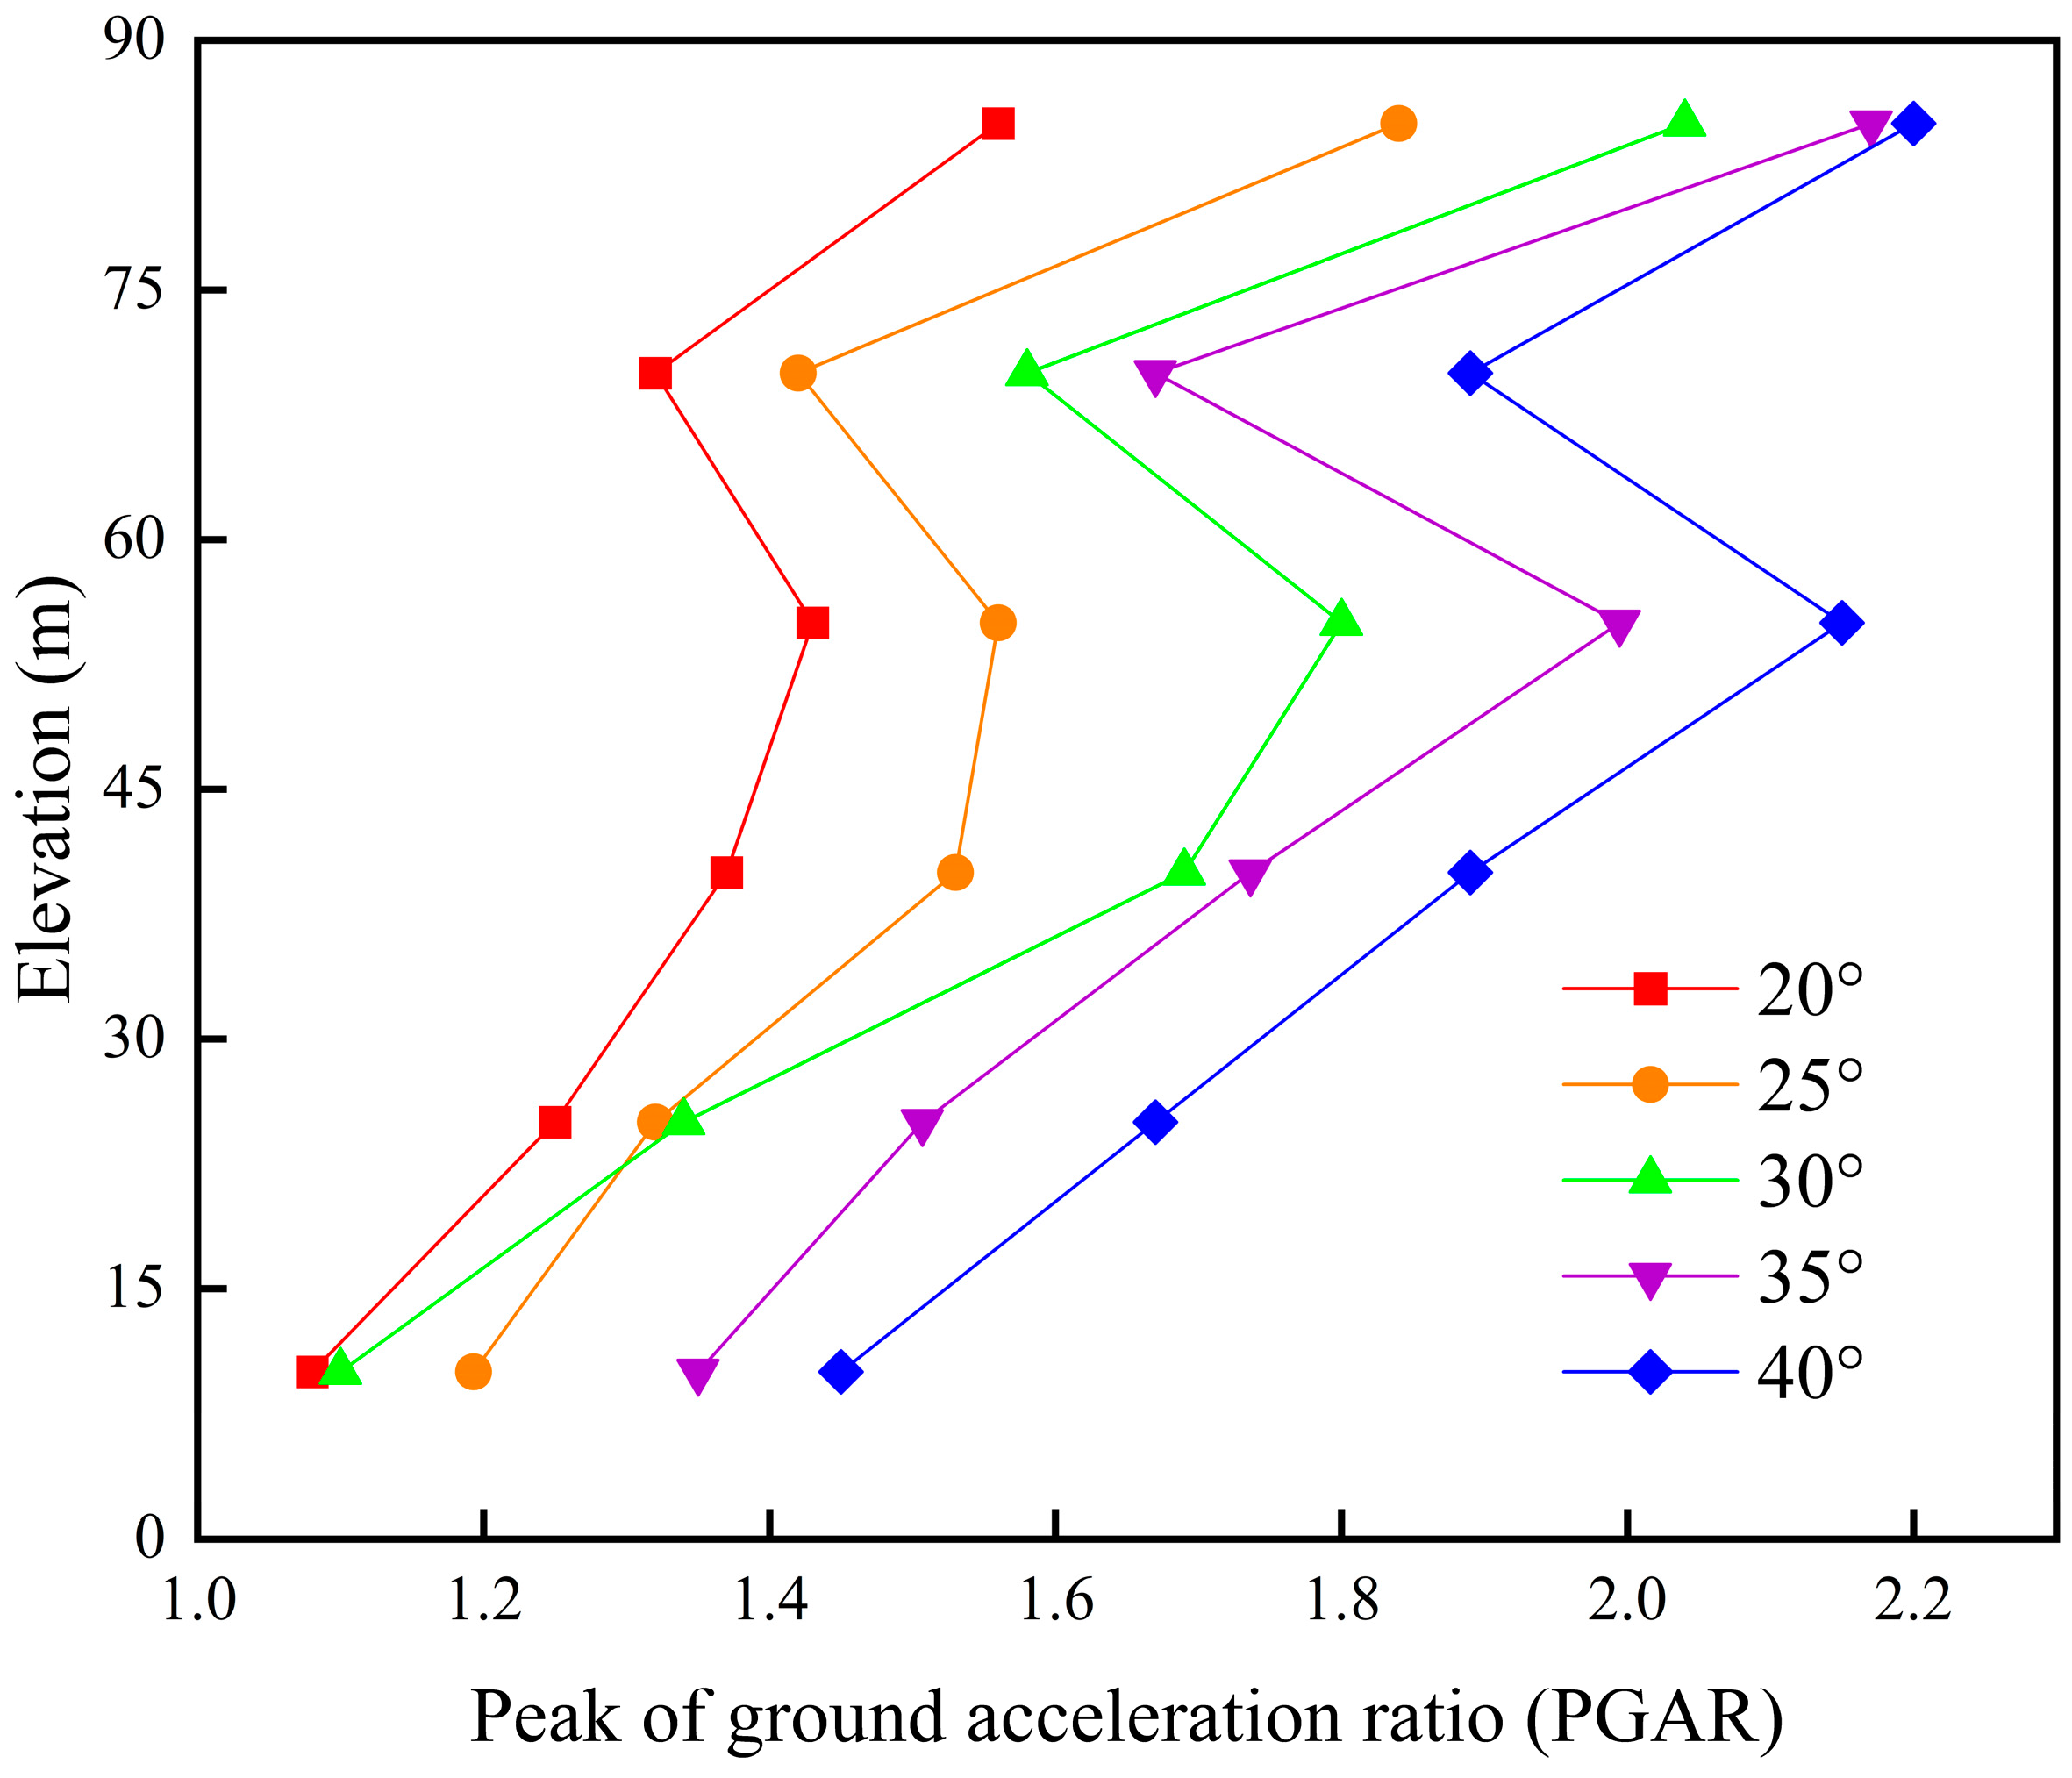
5.2. Effect of Tailings Sand Friction Angle on Dam Stability

During the calibration of the simulation parameters, it was discovered that the equivalent internal friction angle significantly impacts the simulation results [31,32]. Figure 12 shows the time course of the horizontal displacement at monitoring point C4 on the slope under different friction angles, and it can be seen that the permanent displacement value decreases significantly with the increasing friction angle, and the extreme value of displacement also decreases significantly, which indicates that its stability increases with the increase in the friction angle of the tailings sands. At friction angles of 35° and 40°, the differences in the horizontal displacement curves at the same point are relatively minor, and there is minimal accumulation of horizontal displacement. This observation suggests that the stability of the uranium tailings impoundment improves when the friction angle of the tailings exceeds 35°. The horizontal displacement curves at monitoring point C4 exhibit minimal variation for friction angles of 35° and 40°. Upon the application of a seismic load, the permanent horizontal displacement is markedly smaller compared to that observed at a friction angle of 30°, with the displacement values decreasing, which indicates that the tailings dam remains stable. This finding suggests that when the friction angle exceeds 35°, the stability of the tailings dam is effectively maintained. Furthermore, increasing the friction angle beyond 35° has a diminishing impact on the dam stability. However, it is important to note that during earthquakes, heavy rainfall tends to reduce the friction angle of the tailings sand. At a friction angle of 20°, both the peak and permanent displacement values increase significantly. Following the application of a seismic load, the horizontal displacement at the monitoring point reaches 0.47 m and continues to rise, signaling instability in the tailings dam.
Figure 13 shows the change rule of the acceleration response along the vertical direction under different friction angles of the model: with the increase in the tailings sand friction angle, the acceleration amplification coefficient continues to increase. As the friction angle of the tailings increases, the acceleration amplification factor also rises, thereby enhancing the dynamic response of the tailings dam. The friction angle of the material is a crucial factor affecting the acceleration amplification factor, which tends to increase proportionally with the friction angle. This suggests that, within a certain range, increasing the friction angle of uranium tailings improves the overall stability of the dam.

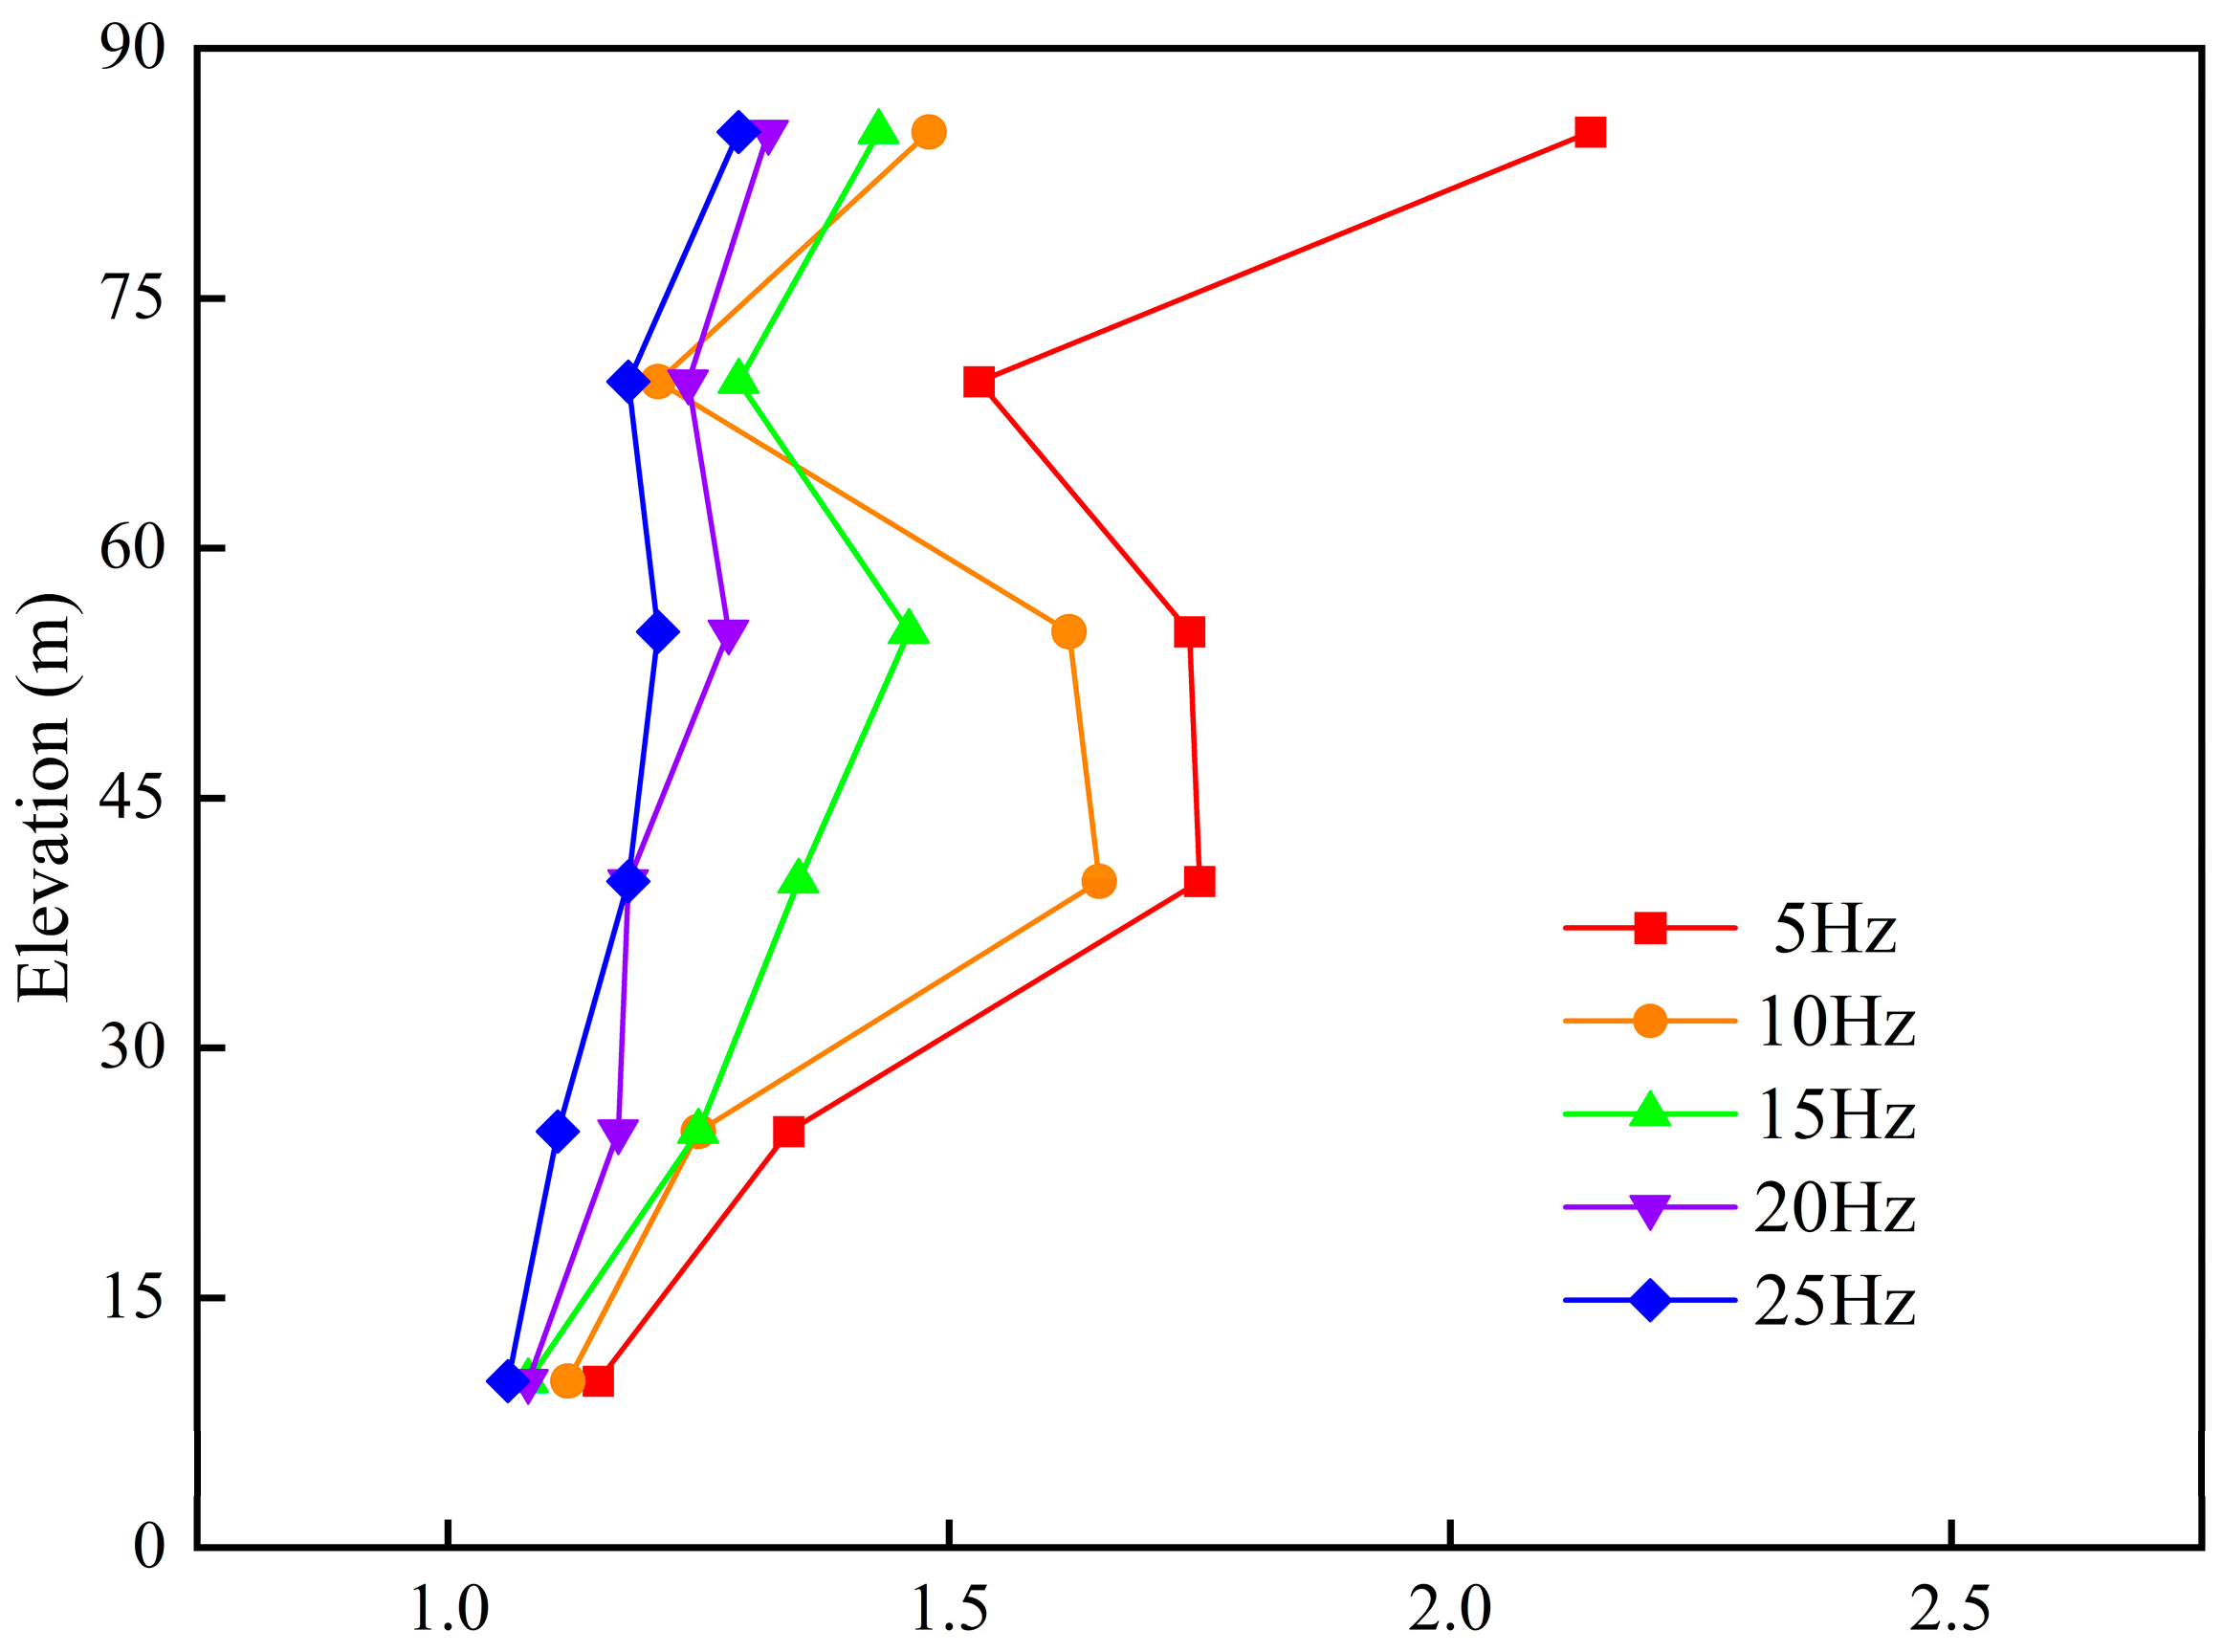
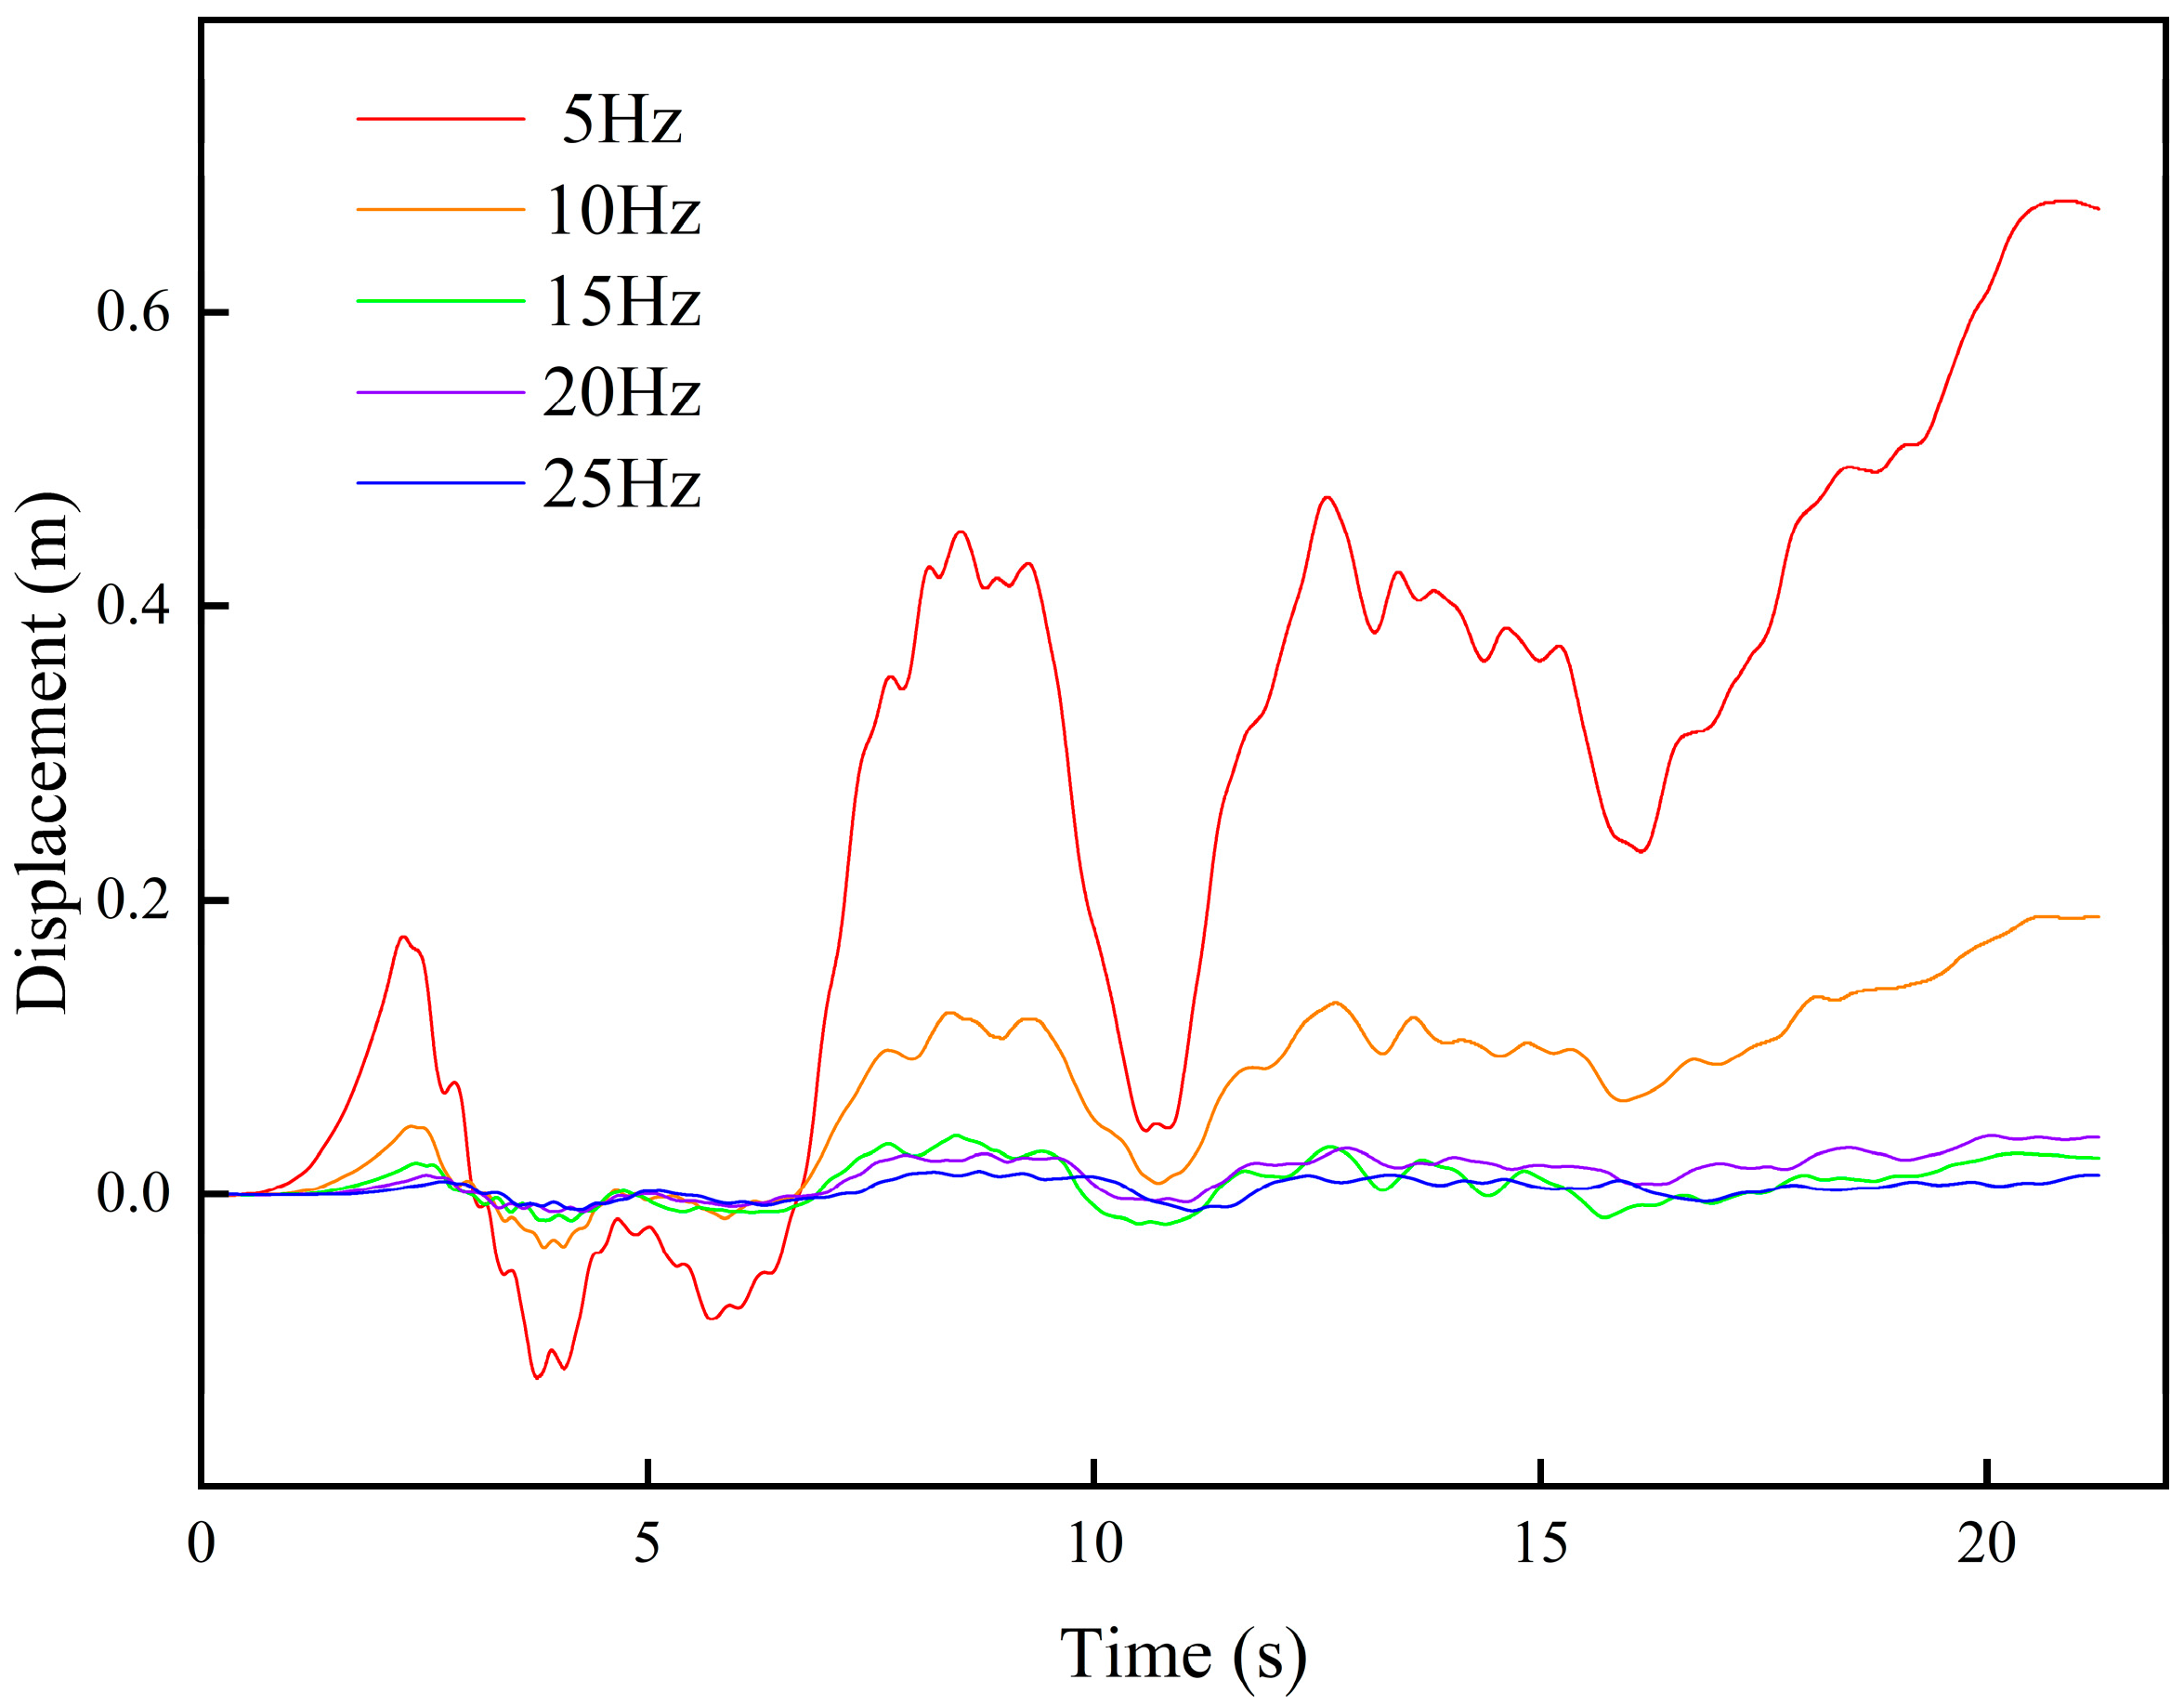
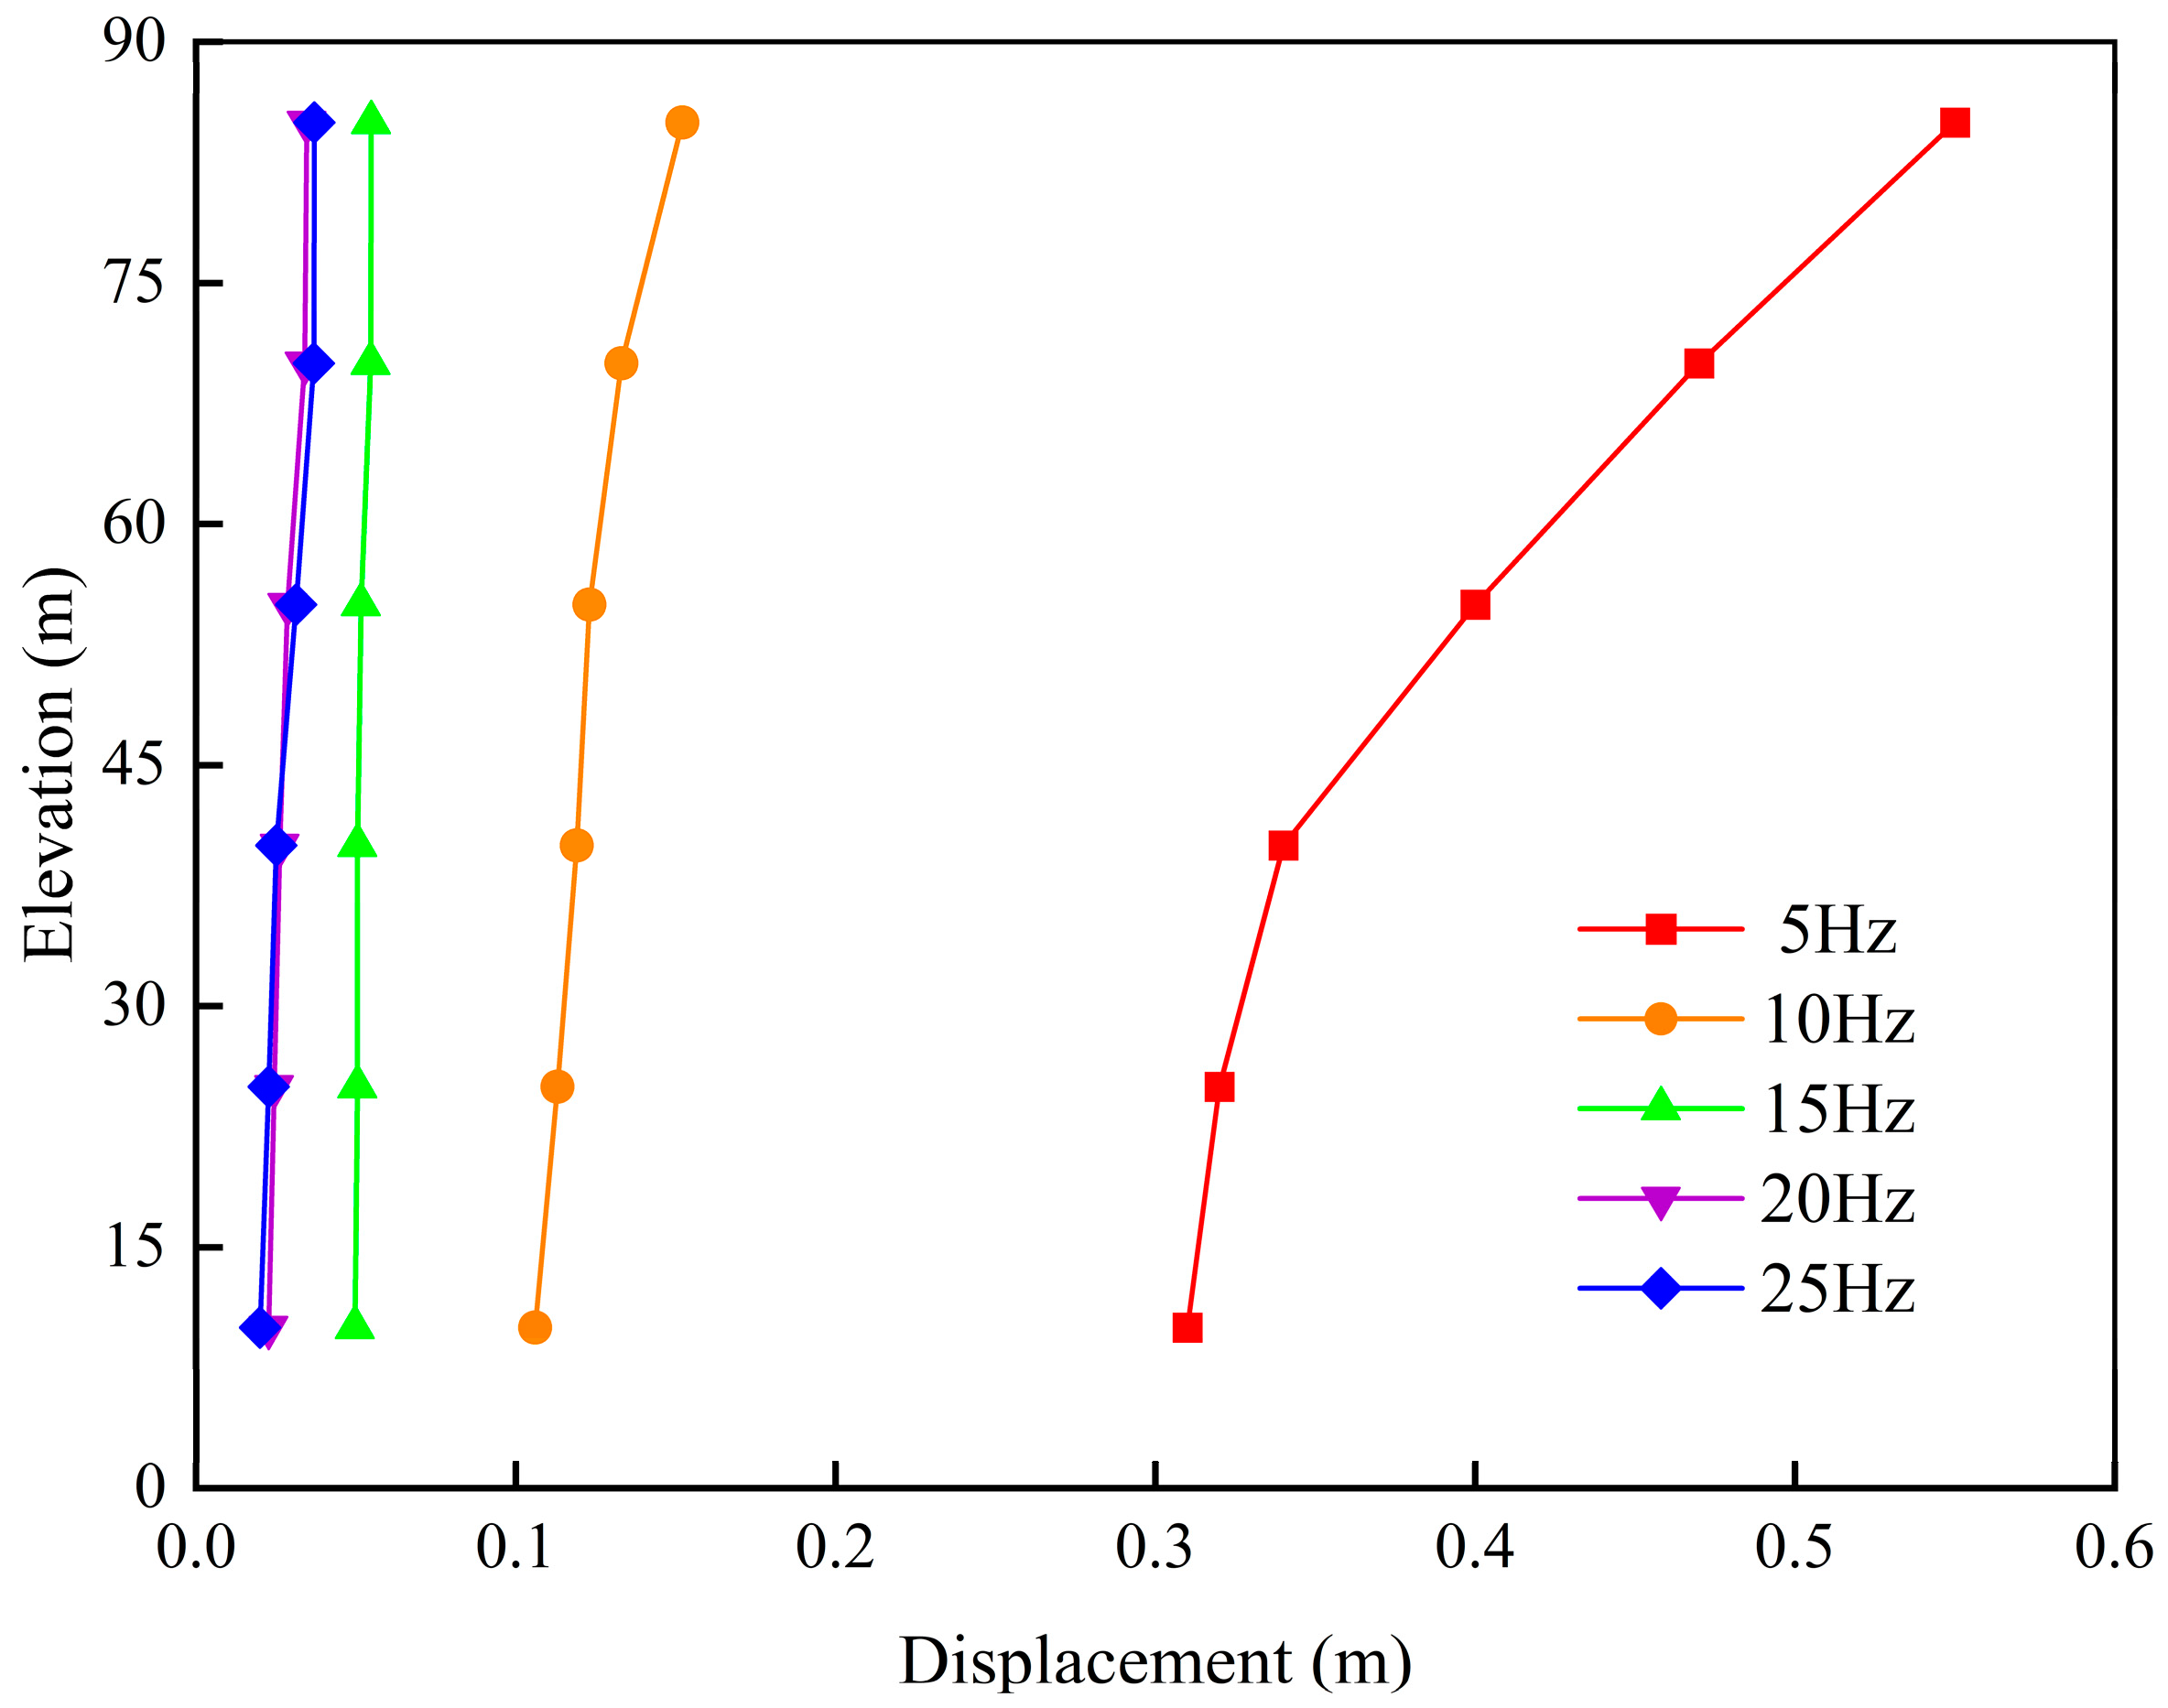
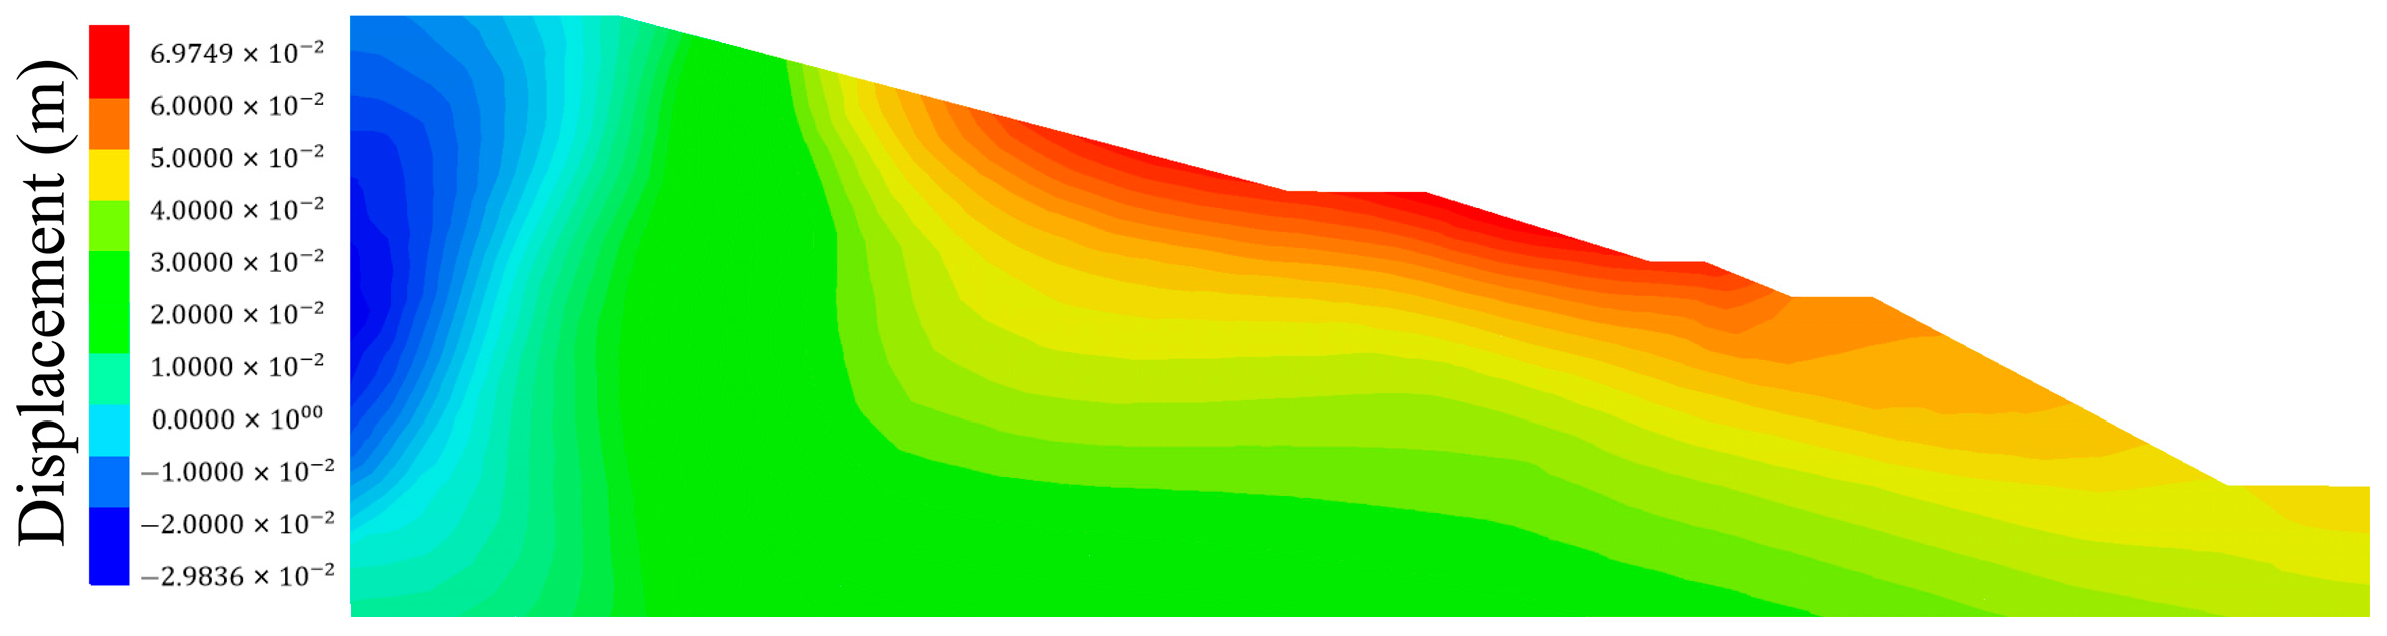
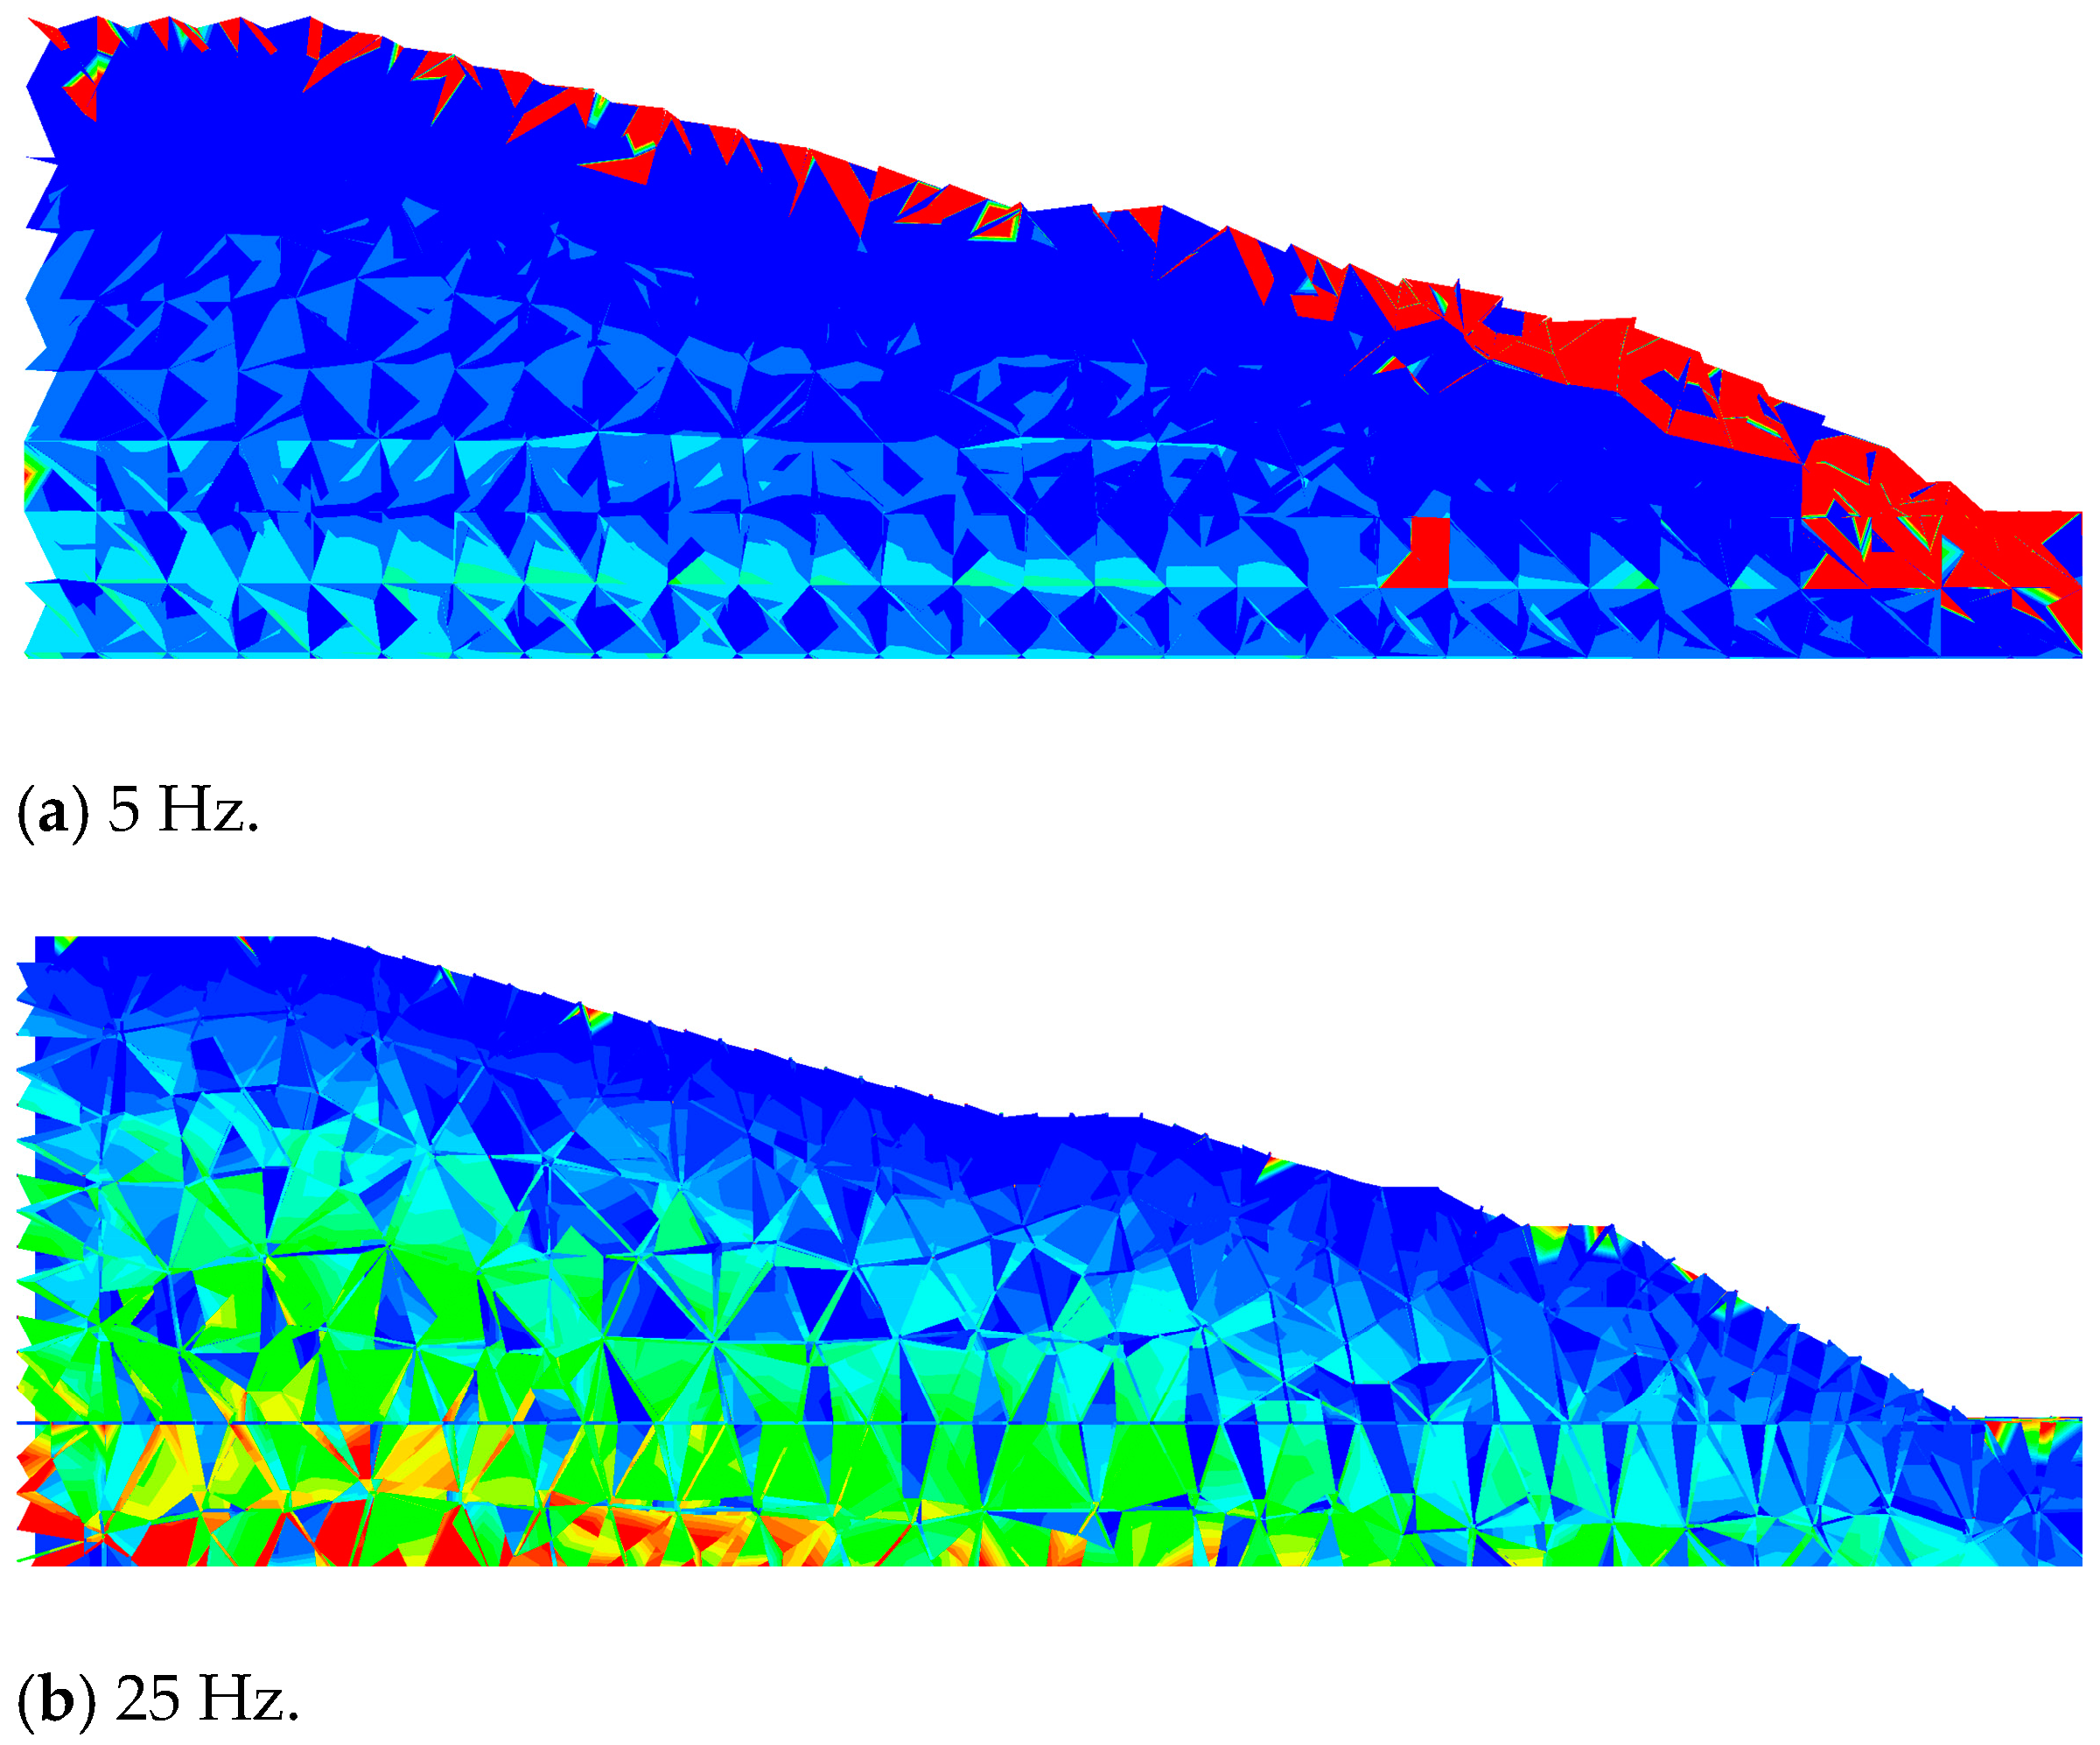
5.3. Effect of Seismic Loading Frequency on Dam Stability

The frequency of natural seismic waves typically ranges from 5 to 15 Hz. This study analyzed the dynamic response characteristics of the dam model using seismic wave frequencies of 5, 10, 15, 20, and 25 Hz. The acceleration response increases with elevation, exhibiting a significant amplification effect that peaks at the top of the slope. As the frequency of the input seismic wave increases, the amplification effect of acceleration with elevation tends to decrease (refer to Figure 14). At an input frequency of 5 Hz, the peak ground acceleration ratio (PGAR) amplification coefficient is at its highest as the dominant frequency is lowest at this point, resulting in a pronounced amplification effect on the slope body. Conversely, higher input frequencies contain more high-frequency energy, which enhances the filtering effect of the geotechnical body, thereby reducing the PGAR amplification coefficient response. Figure 15 illustrates the time course curves of displacement in the x-direction at monitoring point C4 for different frequencies. The maximum displacement value decreases as the frequency increases due to the reduced acceleration response of the higher-frequency seismic waves. When the seismic load frequency exceeds 15 Hz, the displacement value of the model due to the seismic load remains nearly unchanged, indicating that high-frequency waves have a lesser impact on the dam body.
The dynamic response of the model is characterized by its macroscopic deformation. According to the theory of elastic wave scattering, seismic stress waves split the wave field upon encountering a heterogeneous interface to maintain equilibrium. This phenomenon is primarily manifested through reflections from the free surface and both reflection and refraction at the slope discontinuity interface. Consequently, the seismic wave field near the interface becomes a complex combination of various wave types. As illustrated in Figure 16, the maximum permanent displacement in the horizontal direction of the tailings pond decreases with the increasing frequency of the input seismic wave. When the frequency exceeds 15 Hz, the displacement amplification ceases, likely due to the tailings’ filtering effect and the dam’s inherent inhibition.
Figure 17, Figure 18, Figure 19 and Figure 20 illustrate the maximum displacement cloud of the dam body at various frequencies. At lower frequencies, the maximum displacement of the dam body model is concentrated at the foot of the slope, with the maximum permanent displacement values distributed stratified along a specific radial pattern. As the frequency increases, the maximum displacement of the dam body model gradually shifts towards the top of the slope. Notably, at 25 Hz, the distribution of the maximum permanent displacement differs significantly from that observed at other frequencies. Figure 21 depicts the deformation damage at frequencies of 5 Hz and 25 Hz, respectively. At lower frequencies, the deformation damage to the dam model is concentrated in the shallow surface area and at the foot of the slope, resulting in localized cracking. In contrast, at 25 Hz, deformation damage primarily occurs at the bottom of the dam body, characterized by the predominance of lateral crack development, while the slope surface exhibits minimal damage.

6. Conclusions

This paper investigates the dynamic response characteristics of a uranium tailings pond under seismic loads using the discrete element simulation software 3DEC v.5.2. It examines how the tailings sand friction angle, seismic wave amplitude, and frequency affect these characteristics. The main conclusions are as follows:
(1) The maximum permanent displacement was observed at the slope face and distributed in layers along a certain radian. The peak ground acceleration ratio (PGAR) does not increase linearly with altitude; rather, it follows an increase–decrease–increase pattern.
(2) As the amplitude of the seismic wave increases, slope displacement and velocity show an upward trend, while the PGAR exhibits a distinct decreasing trend.
(3) The internal friction angle of the dam body increases as the sand particles become coarser. This results in the stronger dynamic stability of the dam body. The displacement trend remains similar to that of the original distribution, but there is a significant reduction in the extreme value and permanent displacement. When the friction angle exceeds 35°, the overall stability of the dam is relatively good, and further increases in the friction angle have minimal impact on enhancing the stability of the tailings dam. Conversely, when the friction angle falls below 25°, the risk of dam failure increases significantly.
(4) Tailings sand serves as an effective filter for high-frequency seismic waves, significantly diminishing the dam’s dynamic response to waves with frequencies exceeding 15 Hz. In contrast, low-frequency seismic waves are the predominant cause of damage to tailings ponds. When the frequency is low, the deformation damage to the model slope is concentrated on the slope face; conversely, when the frequency is high, the deformation damage is predominantly located at the bottom of the model.

Author Contributions

M.L.: Writing—original draft, Funding acquisition, Project administration, Supervision. H.H.: Data curation, Software, Validation. Y.H.: Writing—review & editing, Funding acquisition, Methodology, Resources. All authors have read and agreed to the published version of the manuscript.

Funding

This research was funded by National Natural Science Foundation of China (Grant Nos. 12005099 and 12205144), and Natural Science Foundation of Hunan Province (Grant Nos. 2024JJ6372 and 2023JJ40546).

Institutional Review Board Statement

Not applicable.

Informed Consent Statement

Not applicable.

Data Availability Statement

The datasets used and/or analyzed during the current study are available from the corresponding author on reasonable request.

Acknowledgments

The valuable support and assistance provided by Yang Liu during the course of this research are gratefully acknowledged.

Conflicts of Interest

Author Ming Lan was employed by the company of Dep Mining Laboratory of Shandong Gold Group Co. Ltd. The remaining authors declare that the research was conducted in the absence of any commercial or financial relationships that could be construed as a potential conflict of interest.

References

  1. Rana, N.M.; Ghahramani, N.; Evans, S.G.; McDougall, S.; Small, A.; Take, W.A. Catastrophic mass flows resulting from tailings impoundment failures. Eng. Geol. 2021, 292, 106262. [Google Scholar] [CrossRef]
  2. Agurto-Detzel, H.; Bianchi, M.; Assumpção, M.; Schimmel, M.; Collaço, B.; Ciardelli, C.; Barbosa, J.R.; Calhau, J. The tailings dam failure of 5 November 2015 in SE Brazil and its preceding seismic sequence. Geophys. Res. Lett. 2016, 43, 4929–4936. [Google Scholar] [CrossRef]
  3. Dai, X.; Wu, X.; Hong, Y.; Xie, J.; Lin, D.; Chen, Y.; Liu, Y. Safety and stability evaluation of the uranium tailings impoundment dam: Based on the improved AHP-cloud model. J. Radiat. Res. Appl. Sci. 2022, 15, 21–31. [Google Scholar] [CrossRef]
  4. Owen, J.R.; Kemp, D.; Lèbre, É.; Svobodova, K.; Pérez Murillo, G. Catastrophic tailings dam failures and disaster risk disclosure. Int. J. Disaster Risk Reduct. 2020, 42. [Google Scholar] [CrossRef]
  5. Jiang, F.; Wu, H.; Liu, Y.; Chen, G.; Guo, J.; Wang, Z. Comprehensive evaluation system for stability of multiple dams in a uranium tailings reservoir: Based on the TOPSIS model and bow tie model. R. Soc. Open Sci. 2020, 7, 191566. [Google Scholar] [CrossRef]
  6. Islam, K.; Murakami, S. Global-scale impact analysis of mine tailings dam failures: 1915–2020. Glob. Environ. Change 2021, 70. [Google Scholar] [CrossRef]
  7. Lamour, R.J.A.; Wasserman, M.A.V.; Rochedo, E.R.R.; Lugon Junior, J. Assessment of the environmental radiological impact in the emergency exposure phase through the simulation of a uranium mining tailings dam breach. Braz. J. Radiat. Sci. 2023, 11, 1–20. [Google Scholar] [CrossRef]
  8. Villavicencio, G.; Espinace, R.; Palma, J.; Fourie, A.; Valenzuela, P. Failures of sand tailings dams in a highly seismic country. Can. Geotech. J. 2013, 51, 449–464. [Google Scholar] [CrossRef]
  9. Lyu, Z.; Chai, J.; Xu, Z.; Qin, Y.; Cao, J. A Comprehensive Review on Reasons for Tailings Dam Failures Based on Case History. Adv. Civ. Eng. 2019, 2019, 4159306. [Google Scholar] [CrossRef]
  10. Jin, J.; Ding, Q.; Cui, H.; Zhang, P.; Xiao, X.; Lv, X. Dynamic response characteristics of a tailing dam determined by shaking-table tests. Arab. J. Geosci. 2020, 13, 897. [Google Scholar] [CrossRef]
  11. Zhou, Z.; Ren, C.; Xu, G.; Zhan, H.; Liu, T. Dynamic Failure Mode and Dynamic Response of High Slope Using Shaking Table Test. Shock. Vibration. 2019, 2019, 4802740. [Google Scholar] [CrossRef]
  12. Li, Q.; Ma, G.; Li, P.; Su, Z. Dynamic characteristics of tailings dam with geotextile tubes under seismic load. Rev. Adv. Mater. Sci. 2021, 60, 599–614. [Google Scholar] [CrossRef]
  13. Lin, Q.; Zhang, S.; Liu, H.; Shao, Z. Water saturation effects on the fracturing mechanism of sandstone excavating by TBM disc cutters. Arch. Civ. Mech. Eng. 2024, 24, 154. [Google Scholar] [CrossRef]
  14. Cao, R.-h.; Yao, R.; Meng, J.; Qibin, L.; Lin, H.; Su, L. Failure mechanism of non-persistent jointed rock-like specimens under uniaxial loading: Laboratory testing. Int. J. Rock Mech. Min. Sci. 2020, 132, 104341. [Google Scholar] [CrossRef]
  15. Zhu, D.; Yu, B.; Wang, D.; Zhang, Y. Fusion of finite element and machine learning methods to predict rock shear strength parameters. J. Geophys. Eng. 2024, 21, 1183–1193. [Google Scholar] [CrossRef]
  16. Itasca Consulting Group. 3DEC User Manual; Itasca Consulting Group: Minneapolis, MN, USA, 2019; Available online: https://docs.itascacg.com/3dec700/3dec/docproject/source/3dechome.html (accessed on 7 August 2024).
  17. Ren, Z.; Wang, K.; Zhang, Q.S.; Xu, Z.M.; Tang, Z.G.; Chen, J.P.; Yang, J.Q.; Xu, Z.H. Earthquake dynamic response behavior of Xiangchong valley type tailings impoundment in Yunnan, China. J. Mt. Sci. 2018, 15, 82–99. [Google Scholar] [CrossRef]
  18. Chundi, S.; Baolin, X.; Wei, W. Analysis on seismic dynamic response and liquefaction area of tailings dam. Int. J. Comput. Appl. Technol. 2018, 57, 183–191. [Google Scholar] [CrossRef]
  19. Xu, M.; Yu, X.; Pan, Y.; Liu, X.; Zhao, Y.; Hu, J. Analysis of the seismic dynamic response and failure mode of the Layue landslide. Landslides 2023, 20, 1135–1148. [Google Scholar] [CrossRef]
  20. Jin, J.; Song, C.; Liang, B.; Chen, Y.; Su, M. Dynamic characteristics of tailings reservoir under seismic load. Environ. Earth Sci. 2018, 77, 654. [Google Scholar] [CrossRef]
  21. Vijayasri, T. Dynamic characterization of tailing dam using fully coupled dynamic analysis with different boundary conditions—A case study. Earthq. Eng. Eng. Vib. 2023, 22, 995–1013. [Google Scholar] [CrossRef]
  22. Ferdosi, B.; James, M.; Aubertin, M. Investigation of the Effect of Waste Rock Inclusions Configuration on the Seismic Performance of a Tailings Impoundment. Geotech. Geol. Eng. 2015, 33, 1519–1537. [Google Scholar] [CrossRef]
  23. Xu, B.; Zhou, Y.; Zhou, C.G.; Kong, X.J.; Zou, D.G. Dynamic responses of concrete-faced rockfill dam due to different seismic motion input methods. Int. J. Distrib. Sens. Netw. 2018, 14, 1550147718804687. [Google Scholar] [CrossRef]
  24. Yao, Y.; Wang, R.; Liu, T.Y.; Zhang, J.M. Seismic response of high concrete face rockfill dams subjected to non-uniform input motion. Acta Geotech. 2019, 14, 83–100. [Google Scholar] [CrossRef]
  25. Psarropoulos, P.N.; Tsompanakis, Y. Stability of tailings dams under static and seismic loading. Can. Geotech. J. 2008, 45, 663–675. [Google Scholar] [CrossRef]
  26. Bićanić, N. Discrete Element Methods. Encycl. Comput. Mech. 2004. [Google Scholar]
  27. Wu, J.; Wang, Y.; Dong, S.; Chen, Y.; Wang, L. Genetic mechanism and failure process of the Mogangling seismic landslide. J. Geol. Soc. India 2013, 82, 277–282. [Google Scholar] [CrossRef]
  28. Wang, Y.; Wu, L.Z.; Gu, J. Process analysis of the Moxi earthquake-induced Lantianwan landslide in the Dadu River, China. Bull. Eng. Geol. Environ. 2019, 78, 4731–4742. [Google Scholar] [CrossRef]
  29. Lemos, J.V.; Dawson, E.M.; Cheng, Z. Application of Maxwell damping in the dynamic analysis of masonry structures with discrete elements. Int. J. Mason. Res. Innov. 2022, 7, 663–686. [Google Scholar] [CrossRef]
  30. Maxwell Damping: An Alternative to Rayleigh Damping. In Geo-Extreme 2021; American Society of Civil Engineers: Reston, VA, USA, 2021; pp. 34–45. [CrossRef]
  31. Liu, B.; He, K.; Han, M.; Hu, X.; Wu, T.; Wu, M.; Ma, G. Dynamic process simulation of the Xiaogangjian rockslide occurred in shattered mountain based on 3DEC and DFN. Comput. Geotech. 2021, 134, 104122. [Google Scholar] [CrossRef]
  32. Fan, X.; Xu, Q.; Scaringi, G.; Dai, L.; Li, W.; Dong, X.; Zhu, X.; Pei, X.; Dai, K.; Havenith, H.-B. Failure mechanism and kinematics of the deadly June 24th 2017 Xinmo landslide, Maoxian, Sichuan, China. Landslides 2017, 14, 2129–2146. [Google Scholar] [CrossRef]
Figure 1. Three-dimensional uranium tailings dam model.
Applsci 14 08389 g001
Figure 2. Accelerogram of input seismic wave in x-direction.
Applsci 14 08389 g002
Figure 3. Accelerogram of input seismic wave in z-direction.
Applsci 14 08389 g003
Figure 4. Uranium tailings dam profile and distribution of monitoring points.
Applsci 14 08389 g004
Figure 5. Cloud view of the displacement of the dam body under gravity.
Applsci 14 08389 g005
Figure 6. Cloud map of maximum permanent displacement in x-direction.
Applsci 14 08389 g006
Figure 7. Cloud map of maximum permanent displacement in z-direction.
Applsci 14 08389 g007
Figure 8. Maximum permanent displacement cloud map.
Applsci 14 08389 g008
Figure 9. Time course curves of acceleration at monitoring point A1.
Applsci 14 08389 g009
Figure 10. Time course of C4 displacement for different seismic wave amplitudes.
Applsci 14 08389 g010
Figure 11. PGAR with elevation for different seismic wave amplitudes.
Applsci 14 08389 g011
Figure 12. X-displacement time course of monitoring point C4 under different friction angles.
Applsci 14 08389 g012
Figure 13. PGAR at different friction angles.
Applsci 14 08389 g013
Figure 14. PGAR of C4 at various frequencies.
Applsci 14 08389 g014
Figure 15. X-displacement time course of monitoring point C4 under different frequencies.
Applsci 14 08389 g015
Figure 16. Change rule of maximum permanent displacement in x-direction with elevation at different frequencies.
Applsci 14 08389 g016
Figure 17. The maximum permanent displacement at a frequency of 5 Hz.
Applsci 14 08389 g017
Figure 18. The maximum permanent displacement at a frequency of 15 Hz.
Applsci 14 08389 g018
Figure 19. The maximum permanent displacement at a frequency of 20 Hz.
Applsci 14 08389 g019
Figure 20. The maximum permanent displacement at a frequency of 25 Hz.
Applsci 14 08389 g020
Figure 21. Fracture development at frequencies of 5 Hz and 25 Hz.
Applsci 14 08389 g021
Table 1. Geotechnical physical and mechanical parameters of tailings dams.
MaterialsDensity
/(kg·m−3)
PorosityInternal Friction Angle/(°)Cohesion/(kPa)Young’s Modulus
/(GPa)
Poisson’s Ratio
Uranium tailings sand18500.53060.360.3
Saturated uranium tailings sand20500.52880.360.27
Tail powder soil20500.3918100.610.28
Initial dam18600.3919610.280.32
Base rock20400.4320601.050.28
Table 2. Peak values and amplification factors of motion parameters at each monitoring point.
Monitoring PointElevation
/m
Peak X-Velocity
/(m·s−1)
Horizontal Velocity Amplification FactorPeak X-Displacement/(cm)X-Displacement Amplification Factor
A1100.1430.9910.60.91
A2250.1561.0811.30.97
A3400.1671.1611.91.02
A4550.1881.3112.31.05
A5700.1691.1713.31.14
A6850.1541.0715.21.30
B1100.1581.1115.01.28
B2250.1481.0316.41.40
B3400.1701.1817.61.50
B4550.1771.2318.91.62
B5700.1781.2420.81.78
C1100.1471.0215.41.32
C2250.1310.9117.11.46
C3400.1451.0119.21.64
C4550.1591.1022.61.93
D1100.1300.9015.81.35
D2250.1260.8817.61.50
D3400.1701.1821.21.81
E1100.1310.9117.51.50
E2250.1461.0120.71.77
Disclaimer/Publisher’s Note: The statements, opinions and data contained in all publications are solely those of the individual author(s) and contributor(s) and not of MDPI and/or the editor(s). MDPI and/or the editor(s) disclaim responsibility for any injury to people or property resulting from any ideas, methods, instructions or products referred to in the content.

