Abstract
The aim of this study is to provide a solution for the plastic limit pressure and stress intensity factor of the elbows containing a part-through axial semi-elliptical crack by considering various crack sizes. The supporting system and loading conditions of the pipeline are described. The critical part of the observed pipeline was isolated for analysis and subjected to various sizes of semi-elliptical cracks. By performing numerical analysis, results were obtained for crack dimension ratios of c/a, and depth/thickness ratios of a/t. The obtained results include plastic limit pressure and stress intensity factor. The results were analyzed with a symbolic regression algorithm, and closed-form solutions for the limit pressure and stress intensity factor were proposed. To validate pipeline integrity, the Structural Integrity Assessment Procedure (SINTAP) was applied, and the FAD (Failure Assessment Diagram) was generated for cracks below the FAD function. The failure pressure was calculated by determining the points where the loading paths intersect the FAD function.
1. Introduction
To ensure the safety and reliability of conventional and nuclear power plants, it is essential to adopt a proactive approach to preventing component failures. The failure of a single component can result in the shutdown of the entire plant. Securing the structural integrity of a piping system leans on two key elements: ensuring a sufficient pipe wall thickness and installing appropriate supports. A pipe elbow is one of the most common pipeline fittings. It contains higher flexibility compared to a straight pipe and can be used to reduce reaction forces and moments within the piping system. Pipe elbows are subjected to various damage mechanisms, manifested on internal or external surfaces, intrados, crowns, or extrados, and exposed to fluids and the external environment. In a long-term operation, piping as pressure equipment may contain crack-like defects [1,2,3,4,5,6,7].
Applying fracture mechanics principles is crucial when determining a structural integrity assessment of flawed pipelines. In this context, the limit load (limit pressure) and the stress intensity factor are essential parameters while evaluating structural integrity. To prevent pipe failure, the internal pressure (P) must remain below the plastic limit pressure (PL), indicated as (P < PL). In scenarios involving flawed pipes, the plastic limit load corresponds to the local limit load, representing a loading level at which gross plasticity occurs in the un-cracked ligament. This may have implications for ligament failure. Numerous studies have investigated the plastic limit pressure on straight pipes featuring circumferential, axial, and part-through or through-wall cracks that appear on thin- and thick-walled geometries [8,9,10,11,12,13,14,15,16,17,18]. Various solutions rely on experimental data, while others are examined using finite element analysis. However, these solutions cannot be implemented on pipe elbows due to the impact of the elbow curvature, leading to an increase in hoop stress [19].
In the late 1970s, Griffiths [20] published experimental data on pipe elbows under in-plane bending, which were relatively limited. Miller and Zahoor’s publications from the late 1980s rely on Griffith’s experimental data [21,22]. Yahiaoui et al. [23] verified that in-plane opening bending, contributing to crack circumferential opening, poses a higher risk to the elbow than closing bending. In later studies, numerous publications focused research on pipe elbows with cracks, subjecting them to in-plane opening or closing bending loads [24,25,26]. Some publications simultaneously combine bending moments with internal pressure to estimate the limit load of cracked elbows [27,28,29,30]. Additionally, several publications investigated exclusively circumferential part-through or through-wall cracks on elbows [30,31,32,33,34]. The latest research has concentrated on developing plastic limit pressure solutions for elbows with through-wall cracks, considering idealized and non-idealized crack shapes [35,36]. Yield load solutions play a significant role in failure assessment procedures in the widely used European Structural Integrity Procedure SINTAP and the R6 procedure [37,38,39].
This paper aims to provide a solution for the plastic limit pressure and stress intensity factor of the elbows containing a part-through axial semi-elliptical crack by considering various crack sizes. Contrary to the mentioned studies, this study will not consider the elbow as an isolated case but will consider the influence of the entire pipeline along with pipe supports. In 2011, Lei proposed the ‘Equivalent straight pipe method’ that relies on the similarity in geometry and loading between an elbow and its corresponding straight pipe [40,41]. While numerous studies have focused on isolated cases of pipe elbows, our investigation takes a different perspective by considering not just the behavior of cracked elbows but the interactions of various components within the pipeline system. This approach ensures a more complete analysis of structural integrity under realistic operating conditions offering a safer and more reliable way for evaluating pipeline integrity.
2. Problem Description
The observed analyzed geometry is part of the feed-water system in the combined cycle power plants. A calculated feed-water pipeline is used for water transportation in combined cyclic gas turbines (CCGT). Such power plants work so that the exhaust gases of the gas turbine transfer their heat to the boiler and thus convert water into steam. The steam further circulates in a circular process and operates as the usual power plant. Combined power plants usually run on natural gas, fuel oil, and synthesis gases. Coal or biofuels can also be used as an additional energy source [42]. The feed water system prepares the water for re-introduction into the boiler, this includes venting, collecting water into the tank, and pumping it to the boiler. The feed water is sucked in through the suction side of the feed water pump and redistributed through the discharge side. The observed pipeline is connected to a feed water pump suction nozzle, which allows the distribution of water to the pump [43,44]. The geometry was analyzed, and at the critical section, where the highest principal stress is concentrated, an axial semi-elliptical part-through crack is present (on the intrados of the elbow). The pipeline is subjected to internal pressure of 3.5 MPa. The study aims to investigate the influence of hypothetically persistent cracks at the critical location on the observed pipeline. Since hoop stress dominates the critical area, crack initiation will occur at the critical location, perpendicular to the highest principal stress. According to [37], to simplify calculations, the actual crack geometry will be replaced with a semi-elliptical one. Pipeline dimensions are shown in Figure 1.
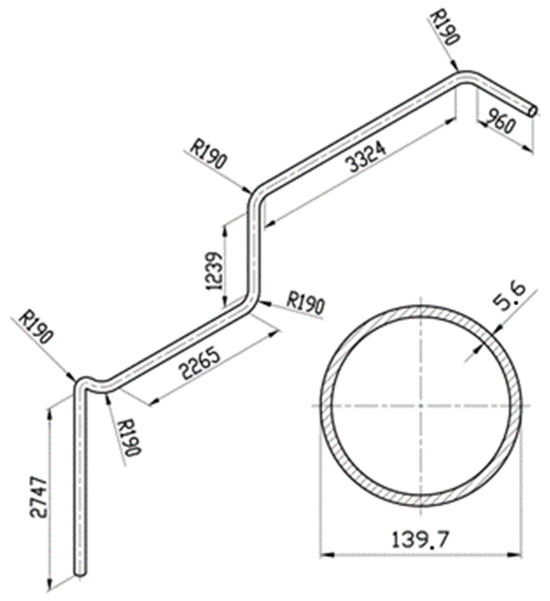
Figure 1.
Pipeline dimensions (all dimensions are in millimeters) [43].
3. Methodology
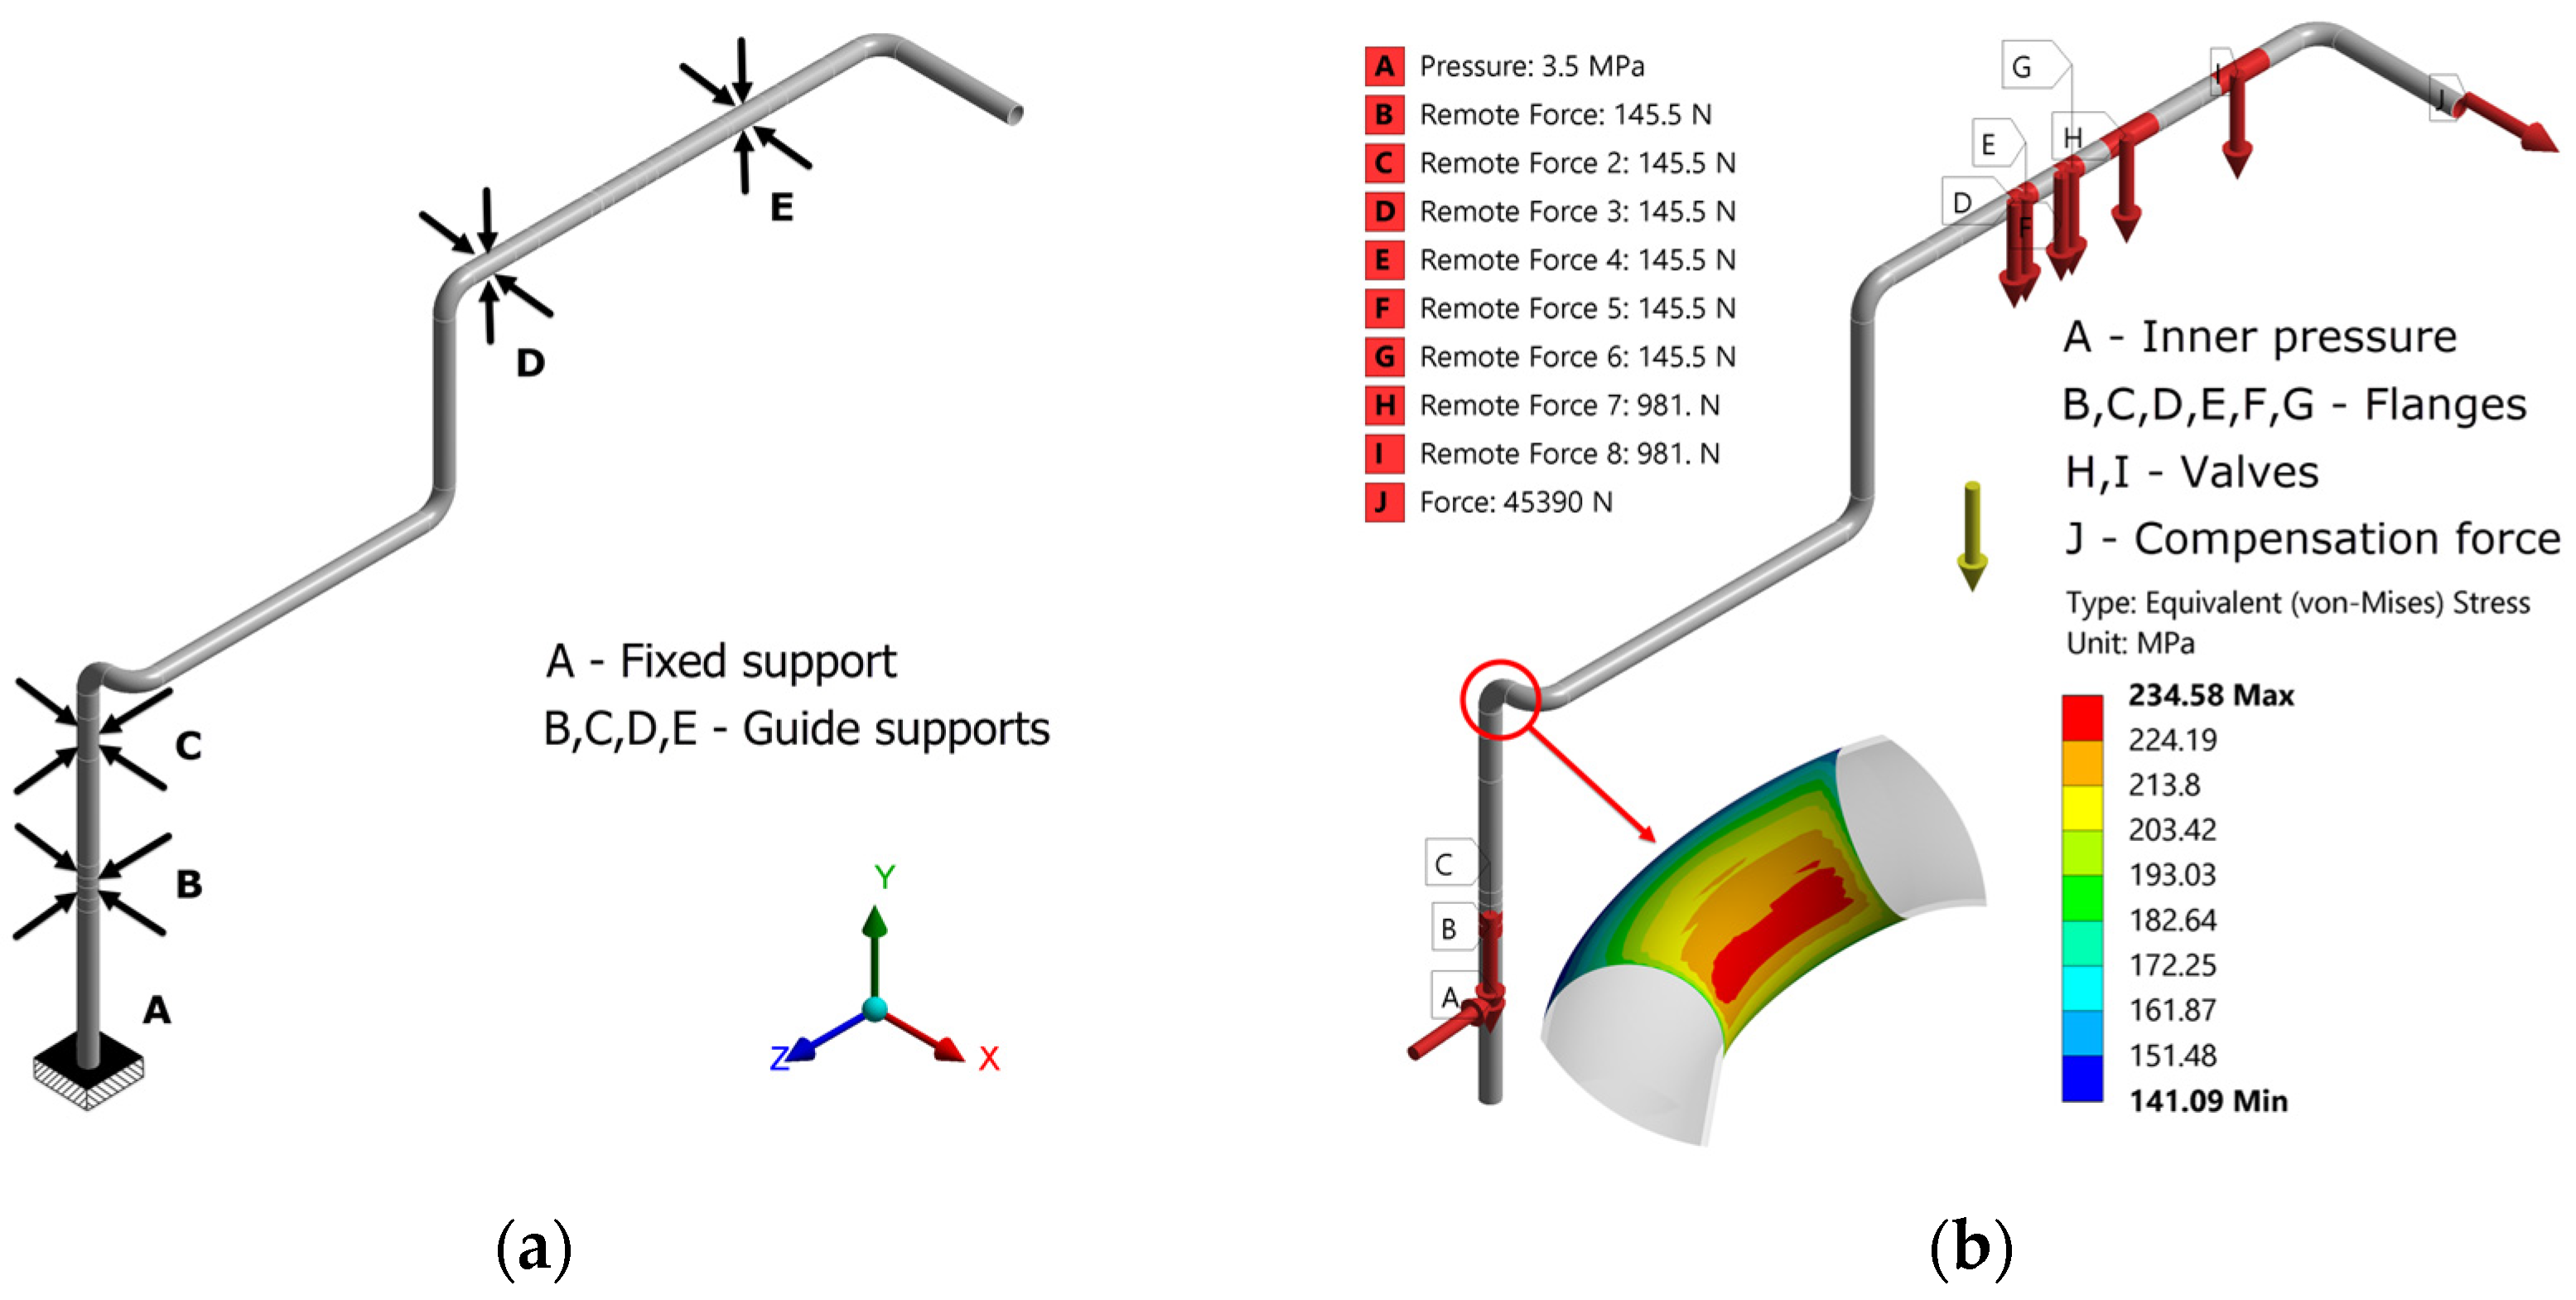
To determine the plastic limit pressure, the finite element method was applied. The nominal diameter of the pipeline is DN125 (outer diameter 139.7 mm) with a wall thickness of 5.6 mm. The elbow radius is equal to 190 mm. Figure 2 displays the boundary conditions of the pipeline along with the equivalent stress of the calculated critical elbow.
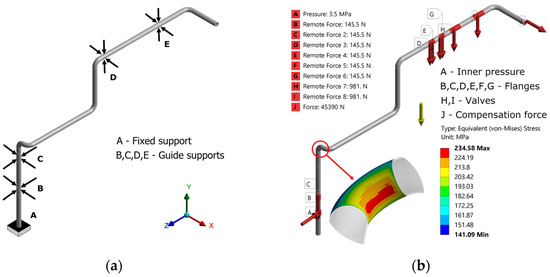
Figure 2.
Boundary conditions: (a) Supports; (b) Loads and von Misses stress distribution on critical location.
Boundary conditions and geometry are characteristic of pipelines in power plants, and besides internal pressure, the masses of valves and flanges are considered.
In addition to finite element analysis, the structural integrity of the pipeline was assessed using the SINTAP procedure. This procedure integrates the yield load solution within the failure assessment diagram (FAD) to assess the structural integrity and ensure the safe operation of the evaluated structure. Observed results can be used for the structural integrity assessment procedure (FAD philosophy). The FAD function is given as Kr = f(Lr), where option 1A is used as the material is expected to display a yield plateau (σY = Rp0.2). Kr represents the ratio between the stress intensity factor and fracture toughness of the material, while the ligament-yielding parameter Lr is defined as the ratio between internal pressure and plastic limit pressure [37].
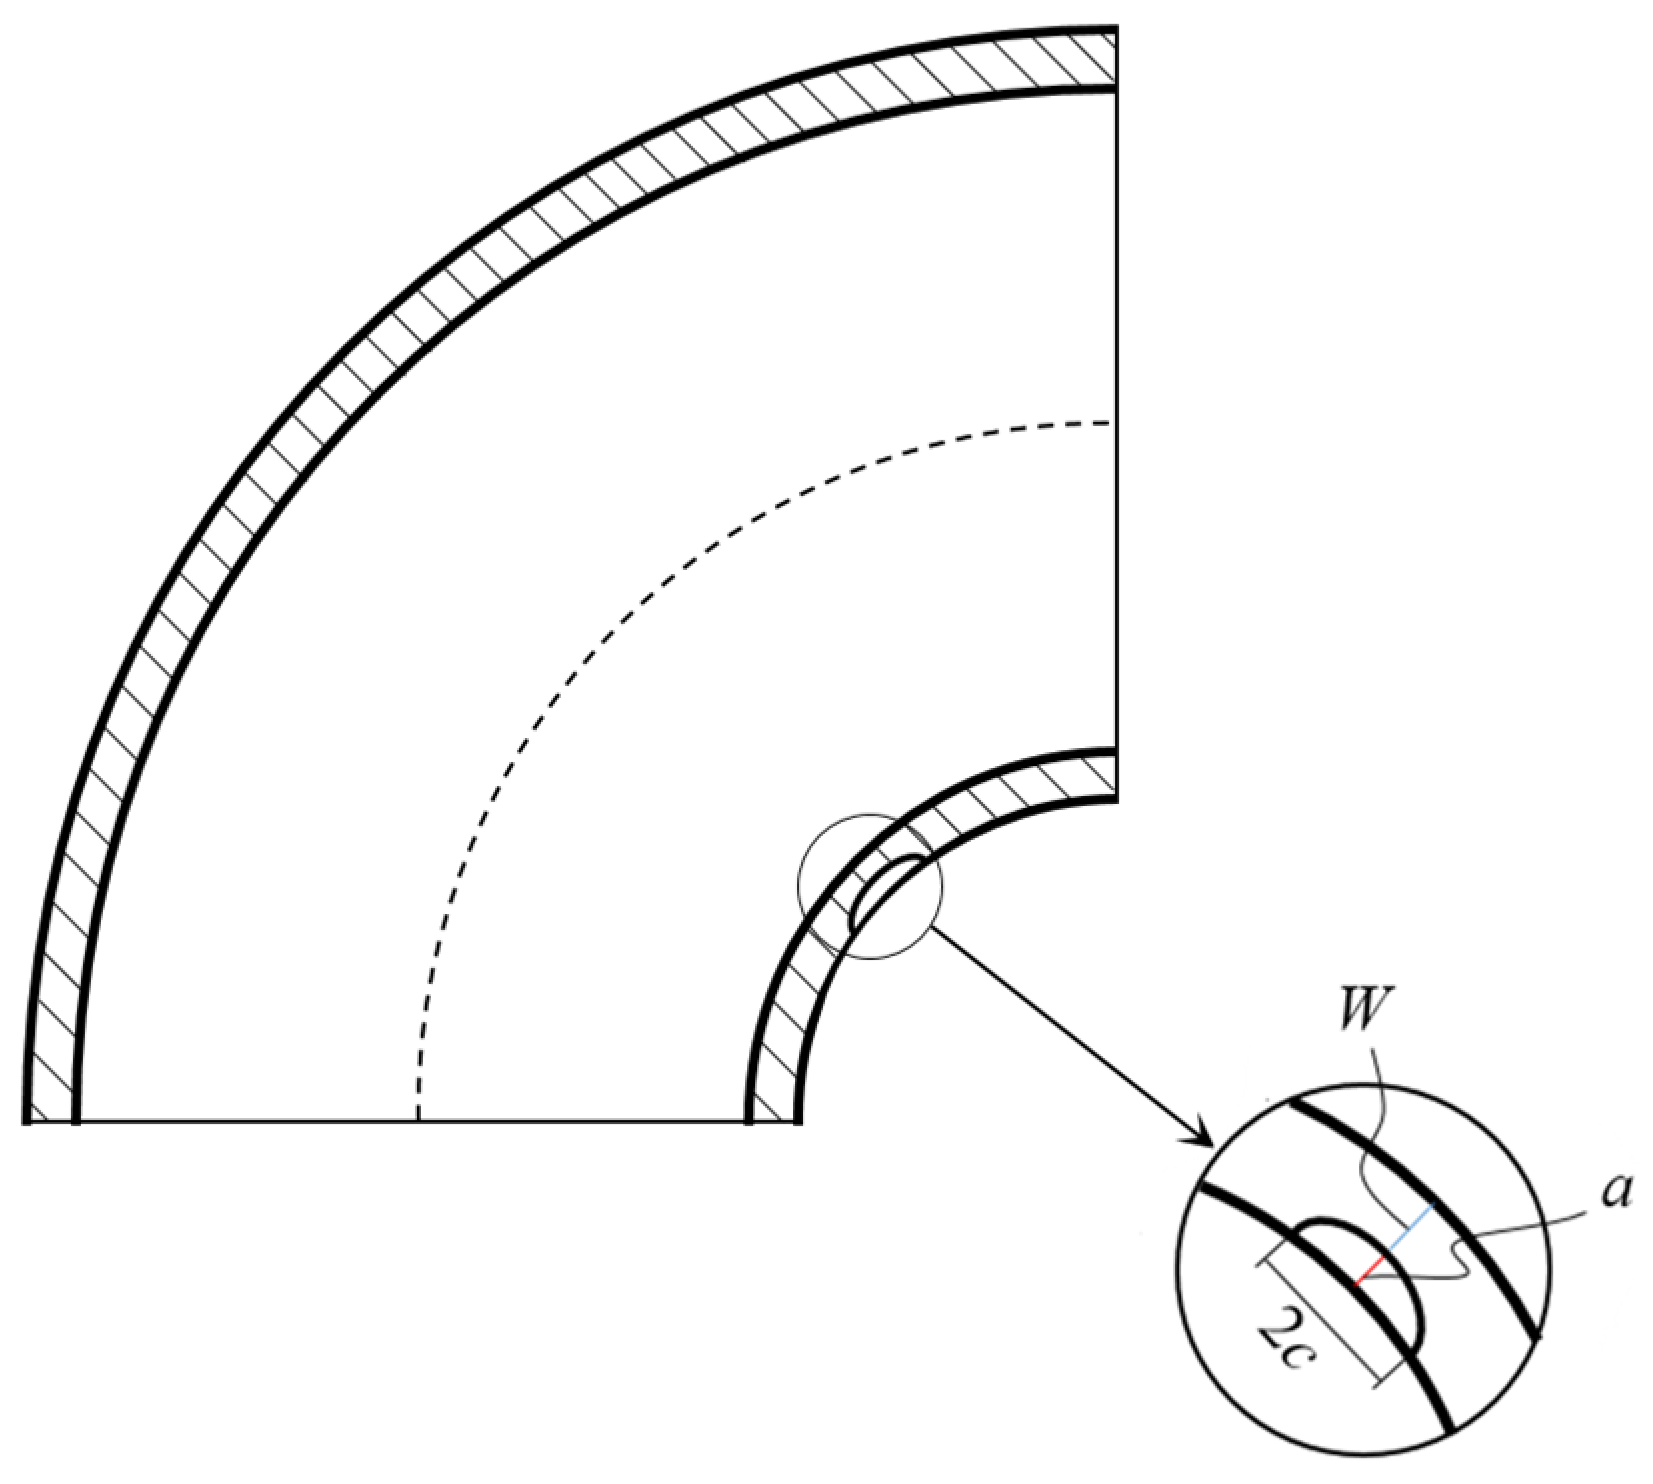
Figure 3 illustrates the dimensions of defects, where a represents the crack depth, c is half the crack length, and W indicates the remaining ligament.
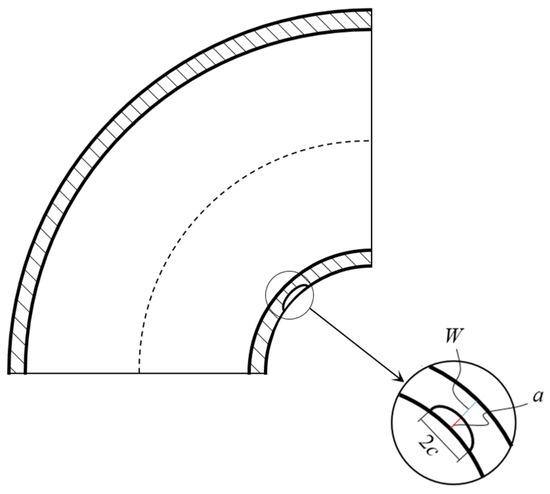
Figure 3.
Pipe elbow with crack.
The analyzed defects are described by using dimension ratios of c/a = 0.5, 1, 1.5, 2, 2.5, 3, 4, and 5, and depth/thickness ratios of a/t = 0.15, 0.3, 0.45, 0.6, and 0.75. Different c/a ratios are observed to explore behaviors that may occur with various semi-elliptical crack shapes. Additionally, different a/t ratios are examined to investigate both deeper and shallower cracks. Furthermore, such prepared input data and results can be statistically processed.
As mentioned earlier, similarly loaded cracked pipes will exhibit local plastic collapse of the ligament as a failure mechanism. There are several approaches that can be used to determine limit load. In this study, the limit pressure as load will be obtained. To calculate the limit pressure using the finite element method, nonlinear material properties must be considered. A bilinear elastic-plastic material model with a low level of isotropic hardening was used to achieve faster convergence of the results. Material design properties for P235 are given in Table 1.

Table 1.
Properties of P235 steel [45].
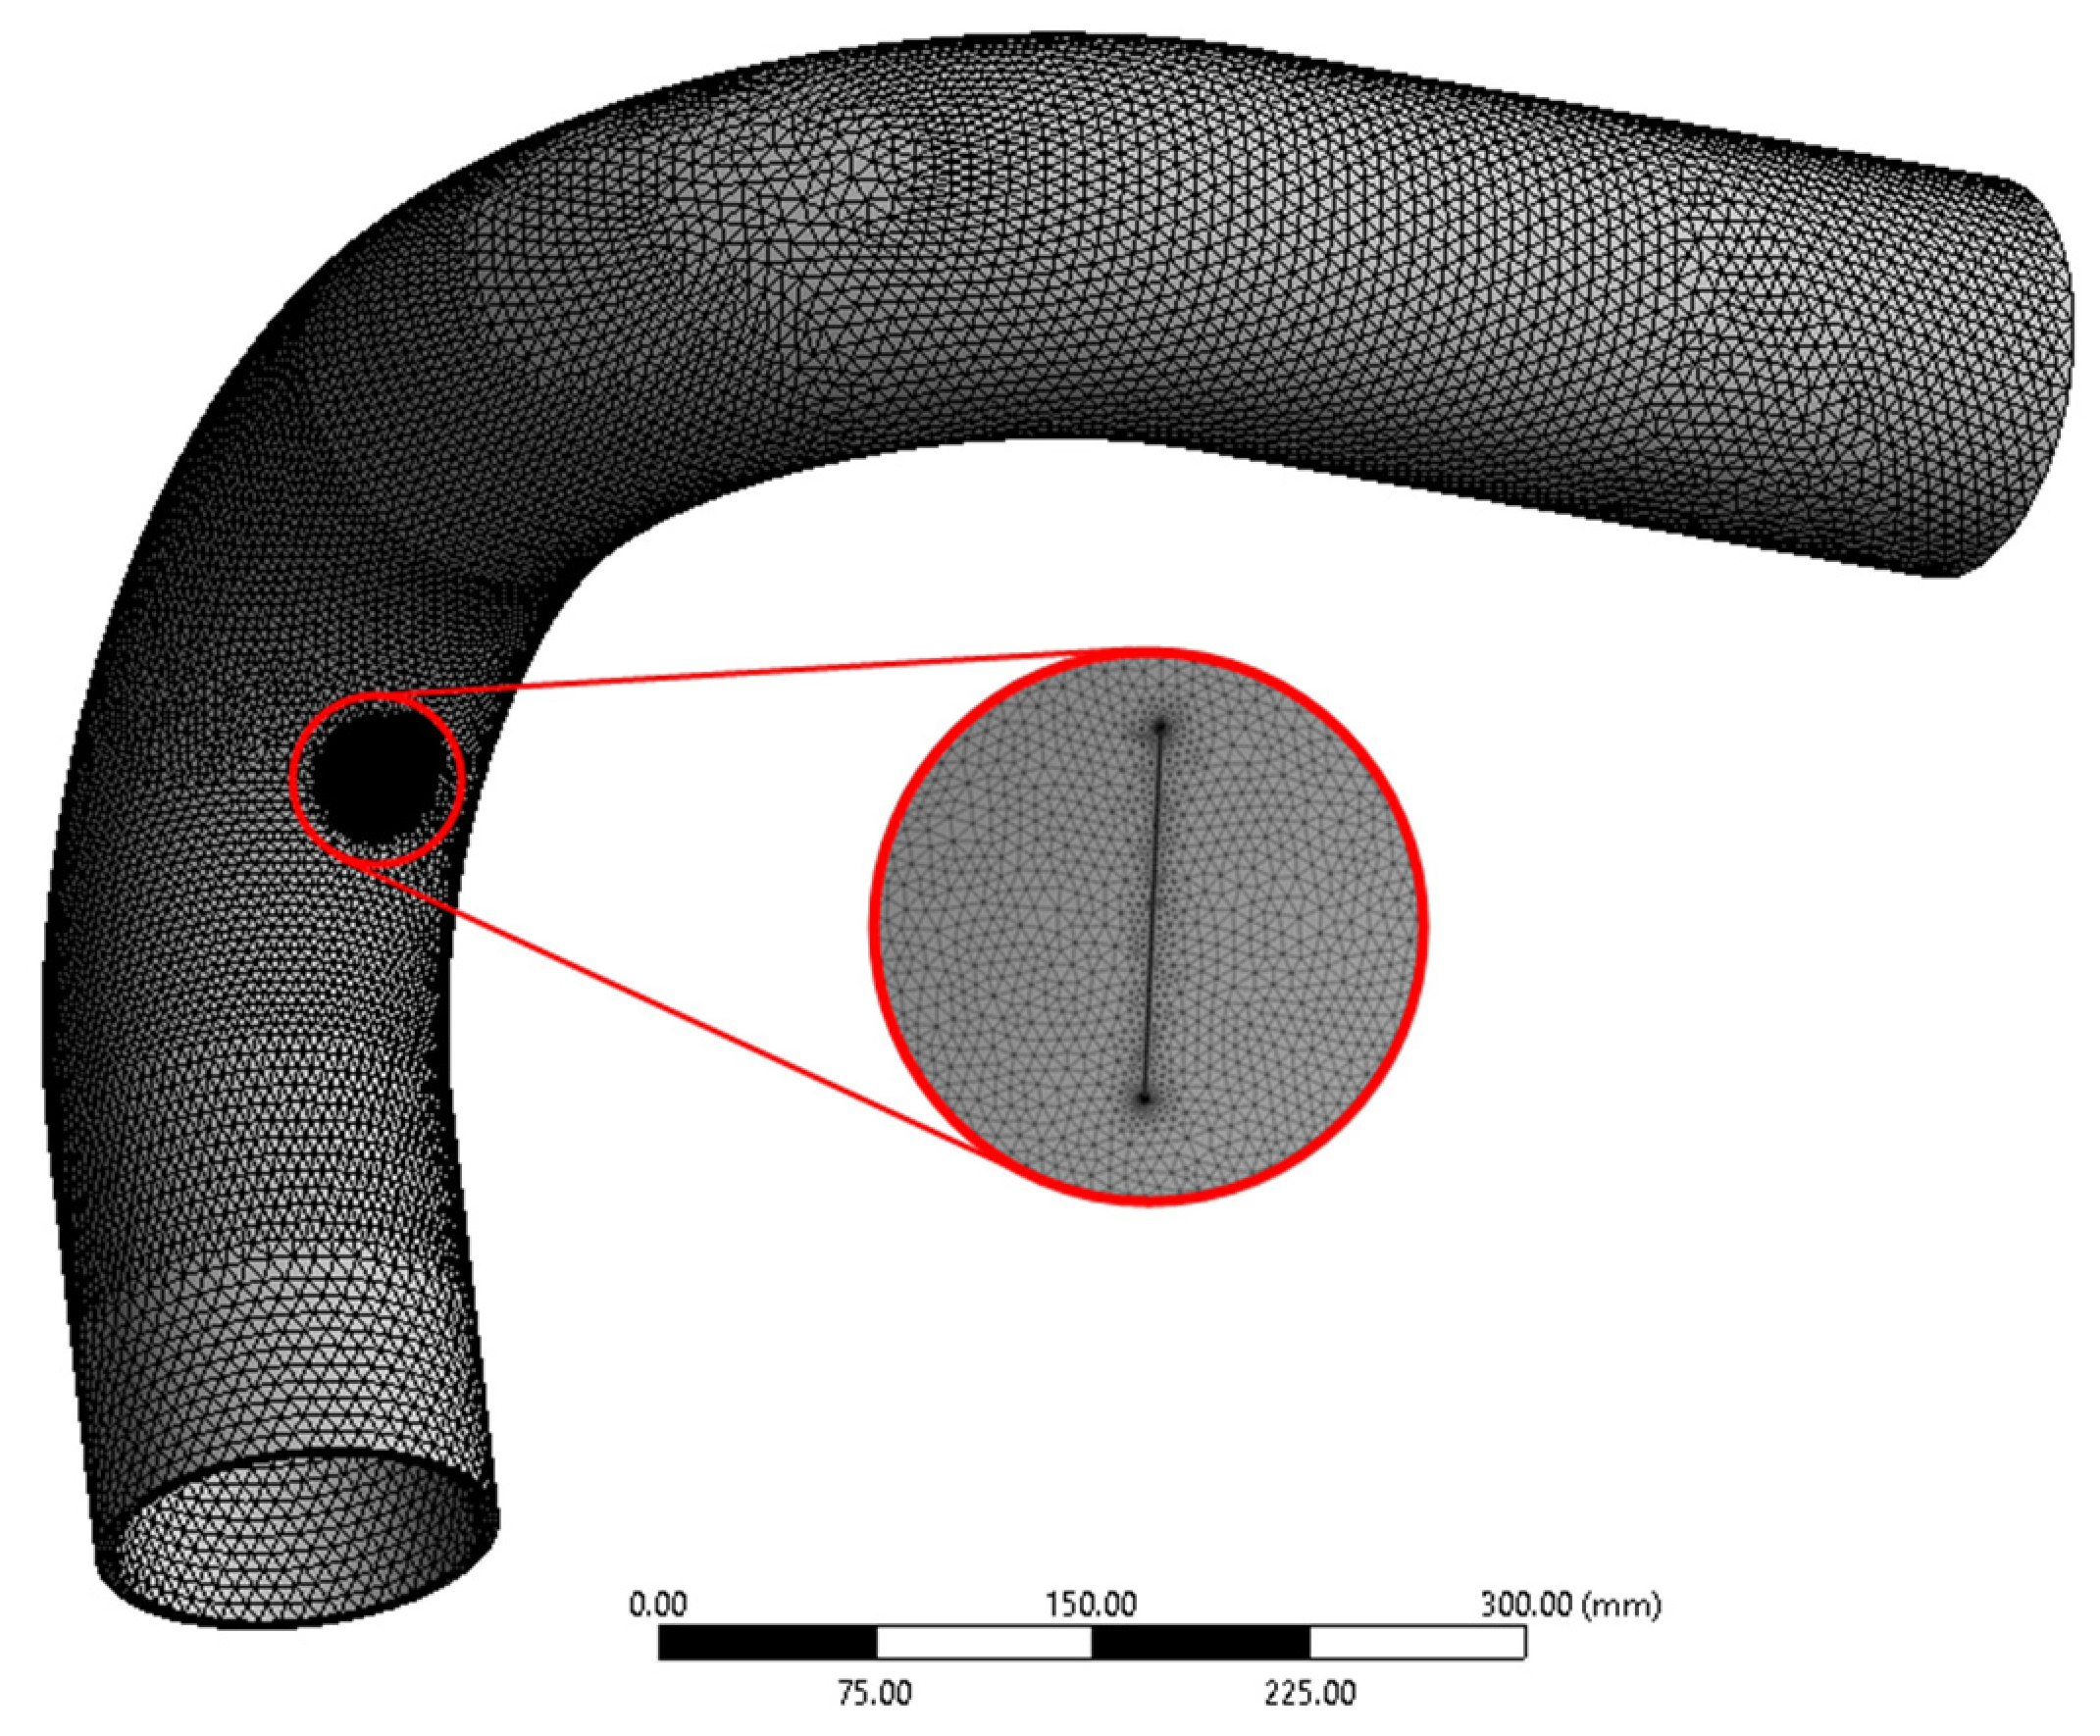
A simplified model was created to calculate the limit pressure using the submodeling technique. This approach enables the application of a finer mesh around the crack area. Calculations were performed in Ansys Workbench 2022 [46]. The submodel meshing was performed using nearly 700.000 tetrahedral finite elements, while the crack was meshed with dominantly hexahedral elements. The mesh density increases from the edges of the model towards the crack, with the element size of 10 mm at the edges and 0.5 mm around the crack tip location. Additionally, the mesh was structured to cover at least three elements spanning the thickness of the pipe. Mesh is similar for all considered crack dimensions. Figure 4 shows the meshed submodeled region of interest containing a semi-elliptical crack.
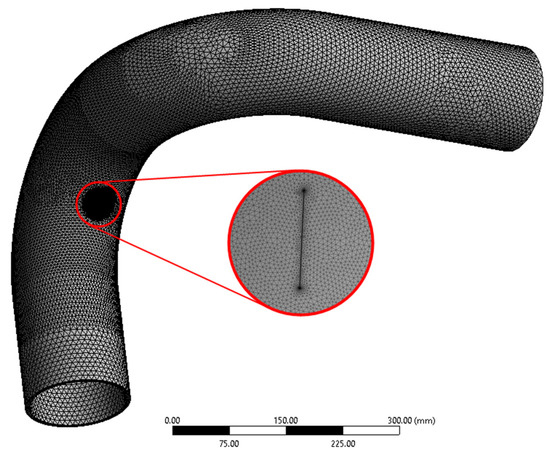
Figure 4.
Submodeled elbow with semi-elliptical crack.
4. Results
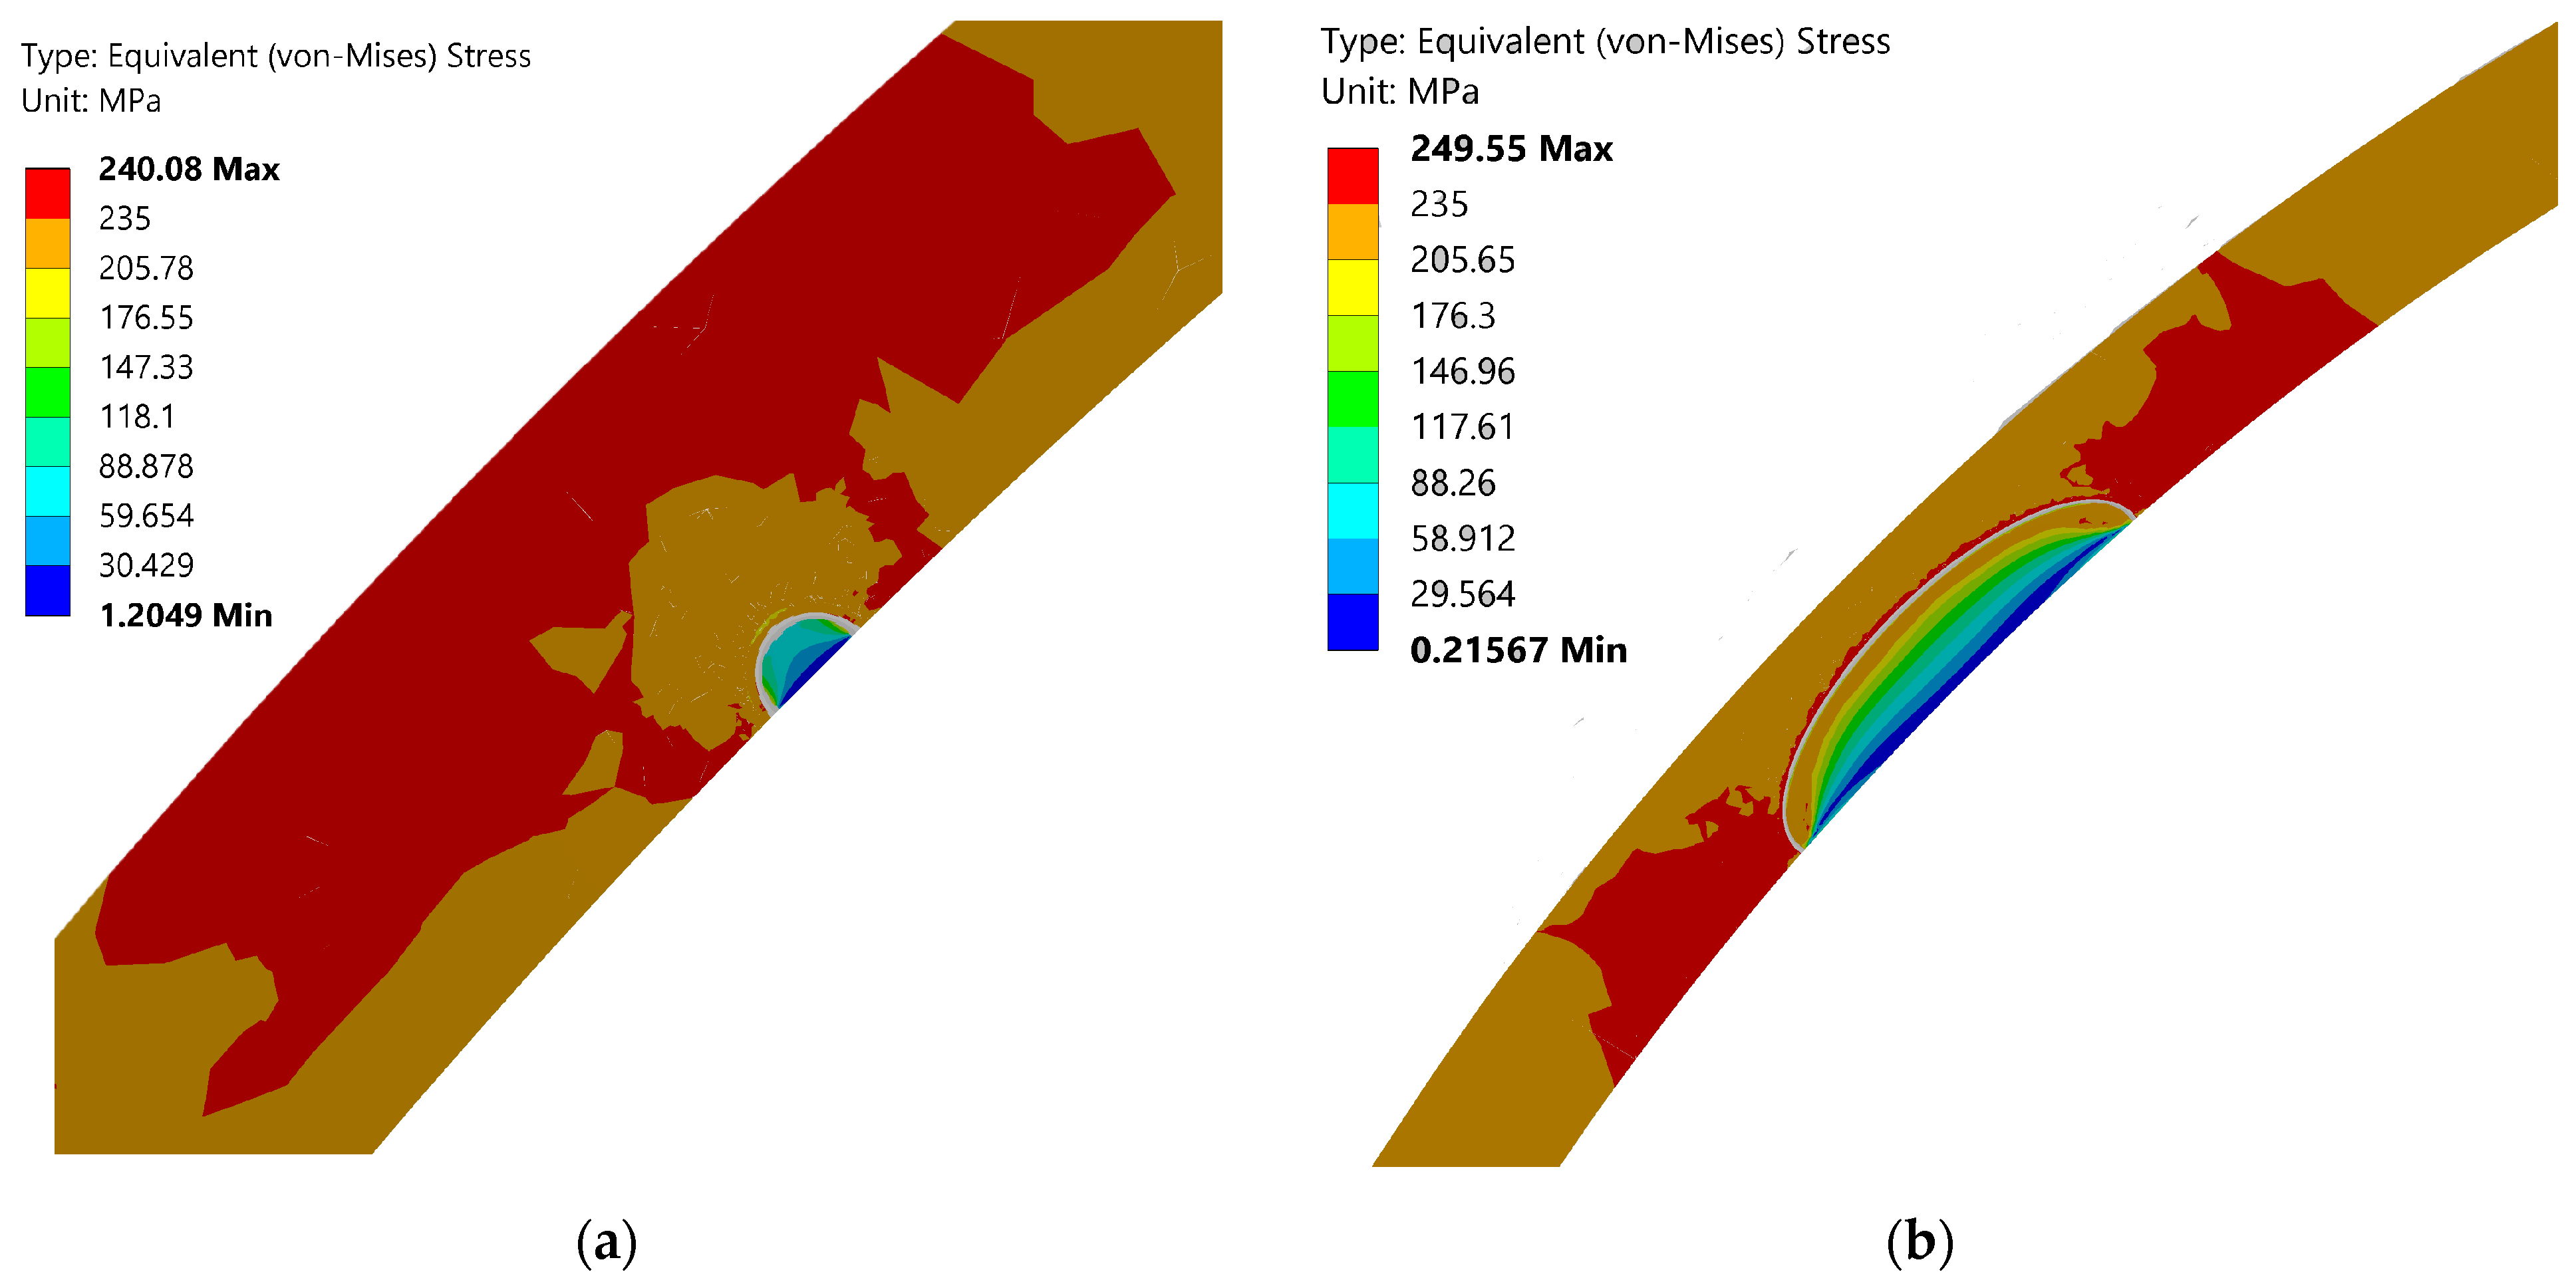
After running the analysis for all crack shapes, the results showed that the typical failure pattern for all crack dimensions involves localized material yielding on both sides of the crack surface points, in a plane parallel to the crack. Localized material yielding near the crack surface is a well-known phenomenon in fracture mechanics, primarily because of the stress concentrations developed at the crack tip. This phenomenon is illustrated in Figure 5, which shows the stress distribution for two specific crack size ratios: c/a = 1 (a/t = 0.15) and c/a = 2.5 (a/t = 0.6). The red zone indicates stress levels exceeding the yield strength, leading to plastic collapse.
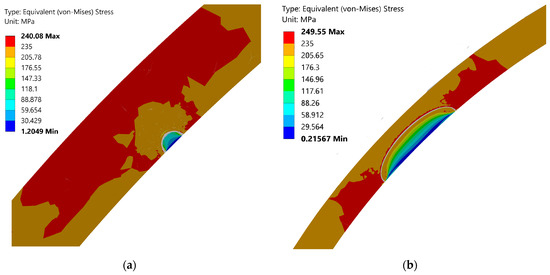
Figure 5.
Plastic collapse in crack zone: (a) c/a = 1; (b) c/a = 2.5.
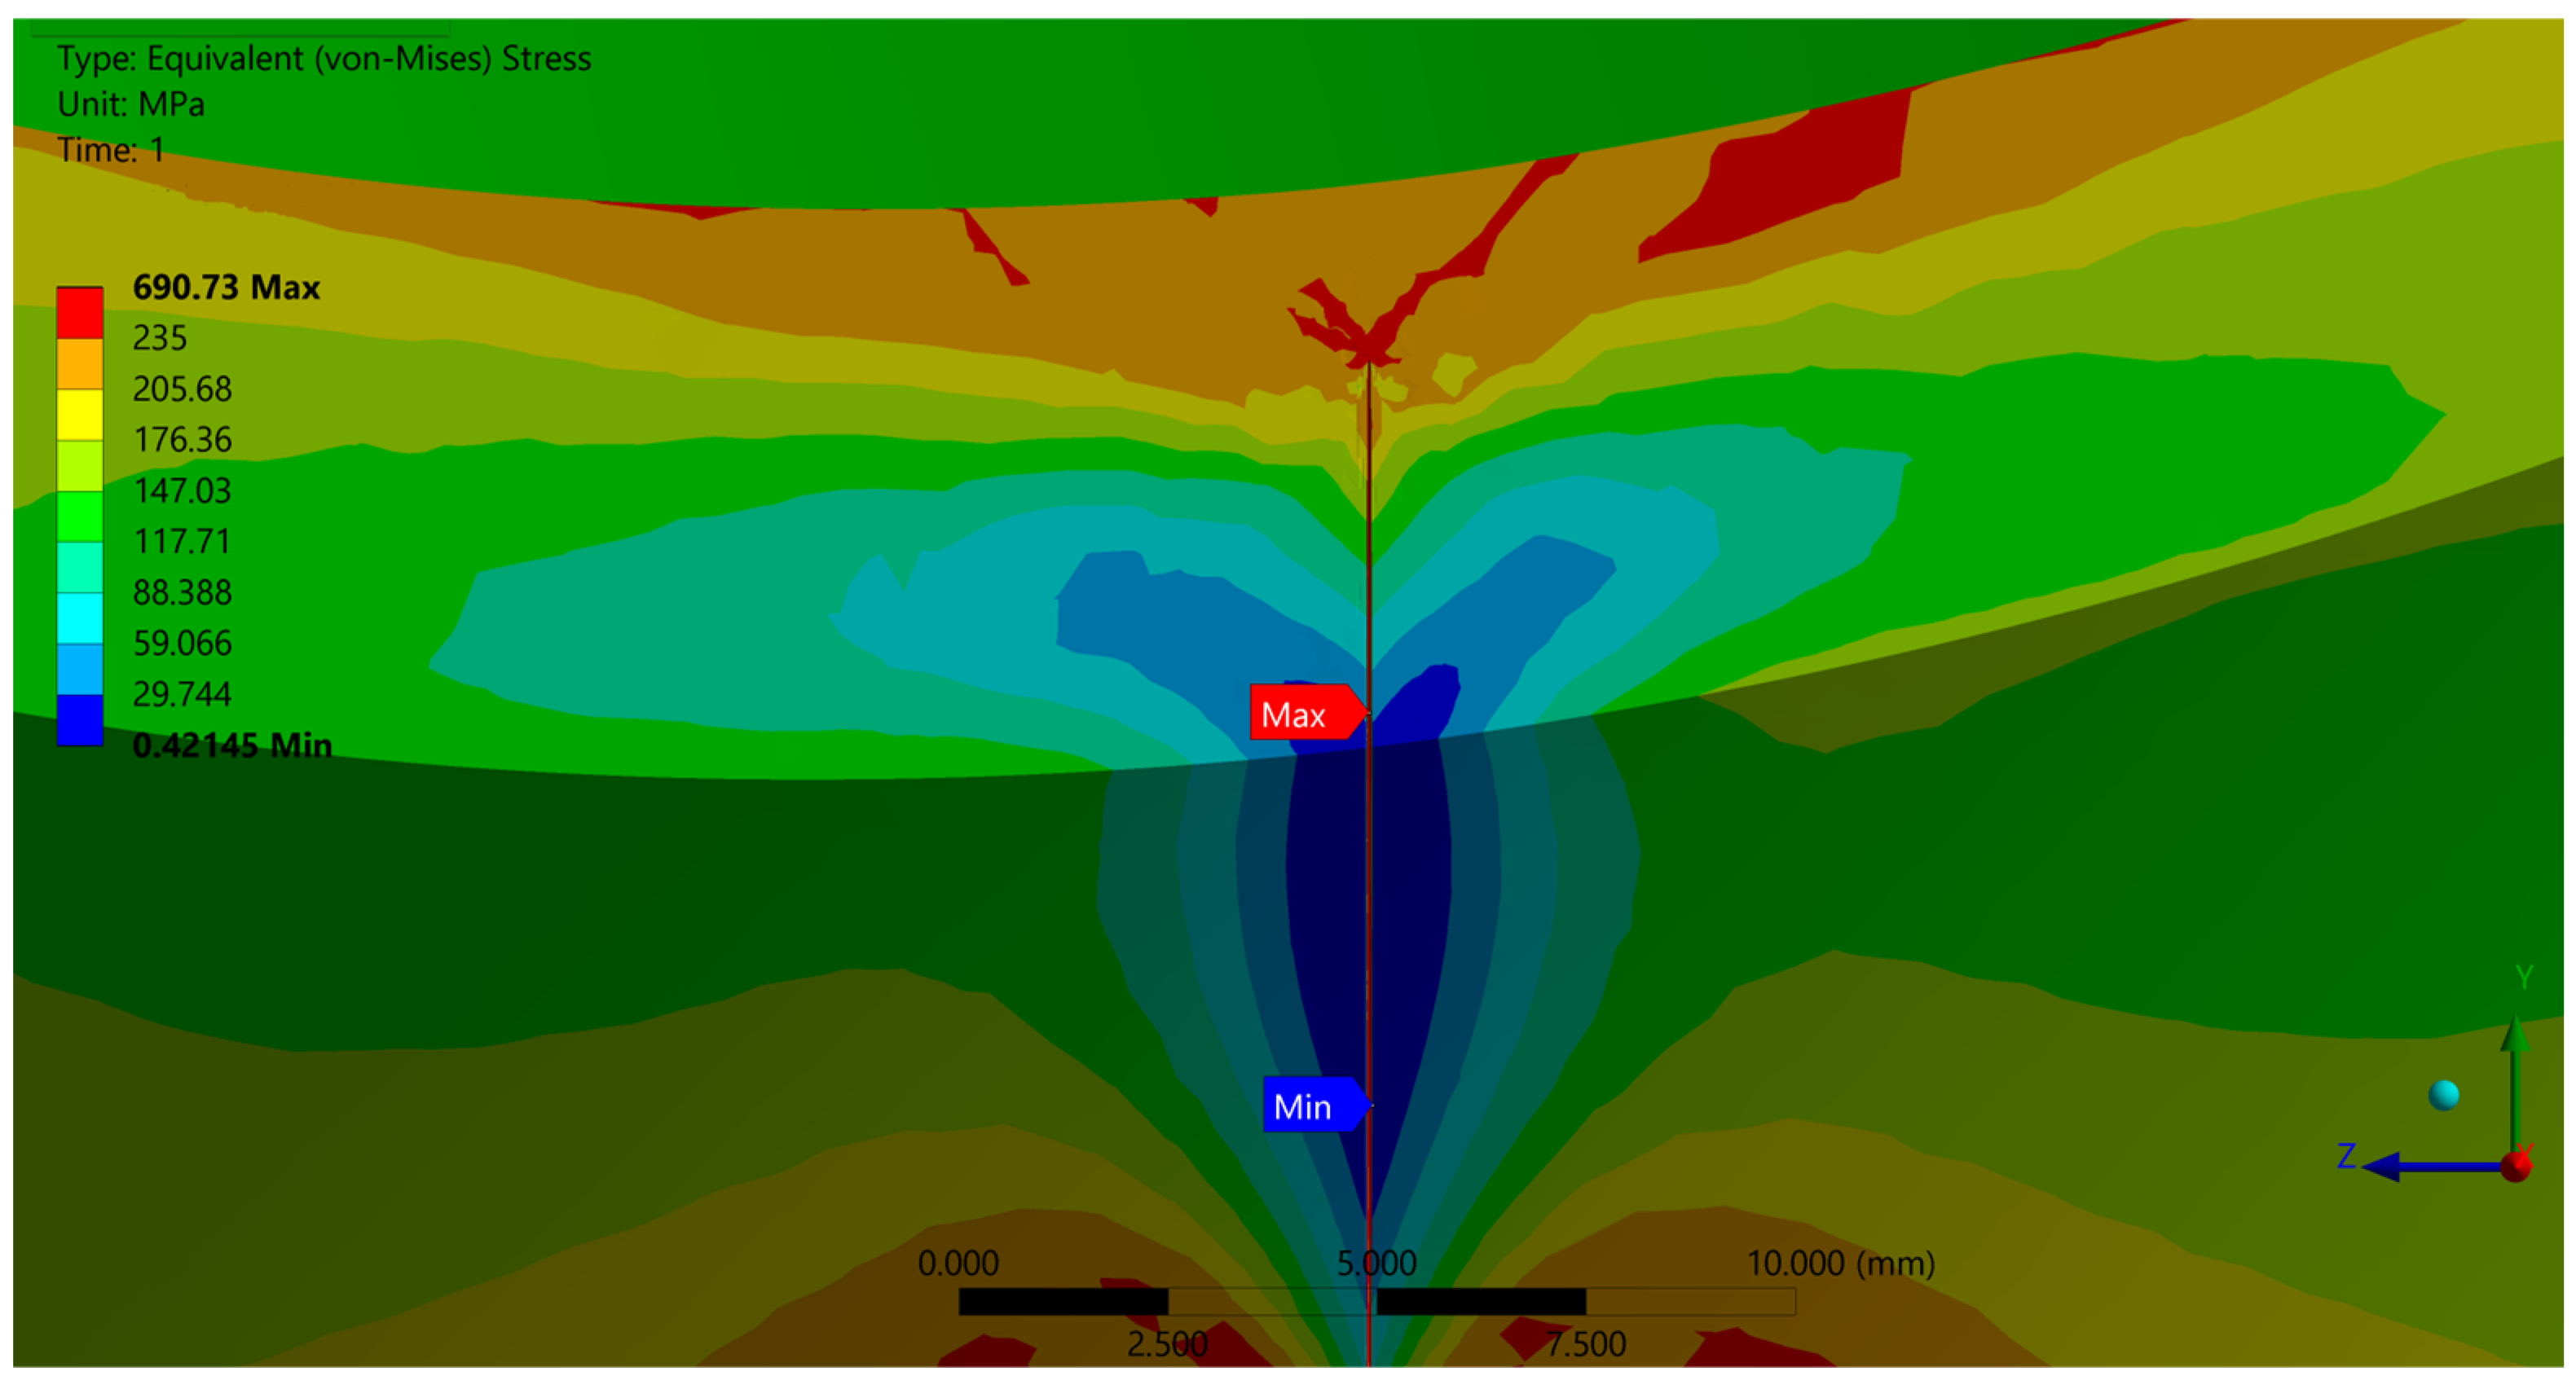
There is also present a yielding of the crack tip, particularly noticeable in Figure 6, where the crack size ratio is c/a = 2.5 (a/t = 0.75). As the crack size increases (higher c/a and a/t ratios), the stress concentration intensifies, which explains why the yielding becomes more evident in these regions, particularly for deeper cracks.
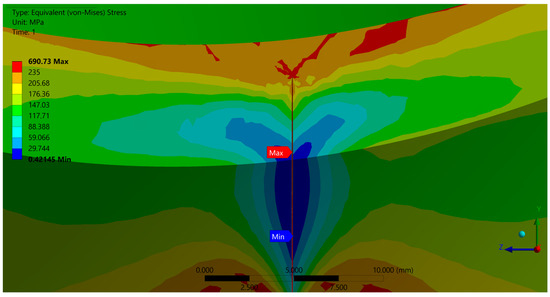
Figure 6.
Equivalent von Mises stress distribution for time step when limit (yield) load is reached (c/a = 2.5 and a/t = 0.75).
The stress intensity factor (KI) was calculated using a straightforward approach based on fracture mechanics principles. The crack geometry is defined, and the working pressure applied is set as a load in the finite element model. After running the simulations for each crack configuration, the results at the crack tip, considered the critical location, were obtained. The stress intensity factor was determined based on the crack tip stress distribution, which finite element analysis (FEA) calculates by evaluating the local stress fields around the crack front. The stress intensity factor values at the crack tip were obtained directly from the FEA post-processing correlating with the boundary conditions, applied pressure, and crack geometry.
Unlike the stress intensity factor, the plastic limit pressure (PL) was obtained by using an iterative process. In the FEA simulation, the internal pressure was set as a load, and load increases in each iterative calculation until the material around the crack tip yields through the entire thickness of the pipe. The pressure at which full yielding of the crack ligament section occurs is considered the plastic limit pressure, as it represents the point where failure due to plastic collapse is reached.
To validate FEA solutions for the cracked elbow, an analytical solution for the plastic limit pressure of straight pipe PLS with the same diameter and thickness was calculated, based on the methodology demonstrated in Kiefner et al. [8]. This analytical solution for the straight pipe serves as a benchmark for comparison to evaluate the accuracy of the FEA results for the more complex geometry of the cracked elbow.
The comparison shows that trends in both sets of results are consistent (Table 2). As the crack depth or geometry changes, both the FEA results for the elbow and the analytical solutions for the straight pipe exhibit similar trends in pressure reduction. Elbow complex geometry creates some variation in the exact values. The primary reason for these variations is the curvature of the elbow. Elbows experience a non-uniform distribution of stress due to bending and torsional effects. When an elbow is loaded with internal pressure, the curvature of the elbow creates regions of increased stress, particularly on the intrados where the stress concentrations tend to be higher. The geometry of an elbow introduces additional complexities that affect both the plastic limit pressure and the stress intensity factor in comparison to a straight pipe. The FEA approach effectively captures the mechanical behavior under similar loading conditions.
Table 2.
Solutions for stress intensity factor (KI) and plastic limit pressure (PL).
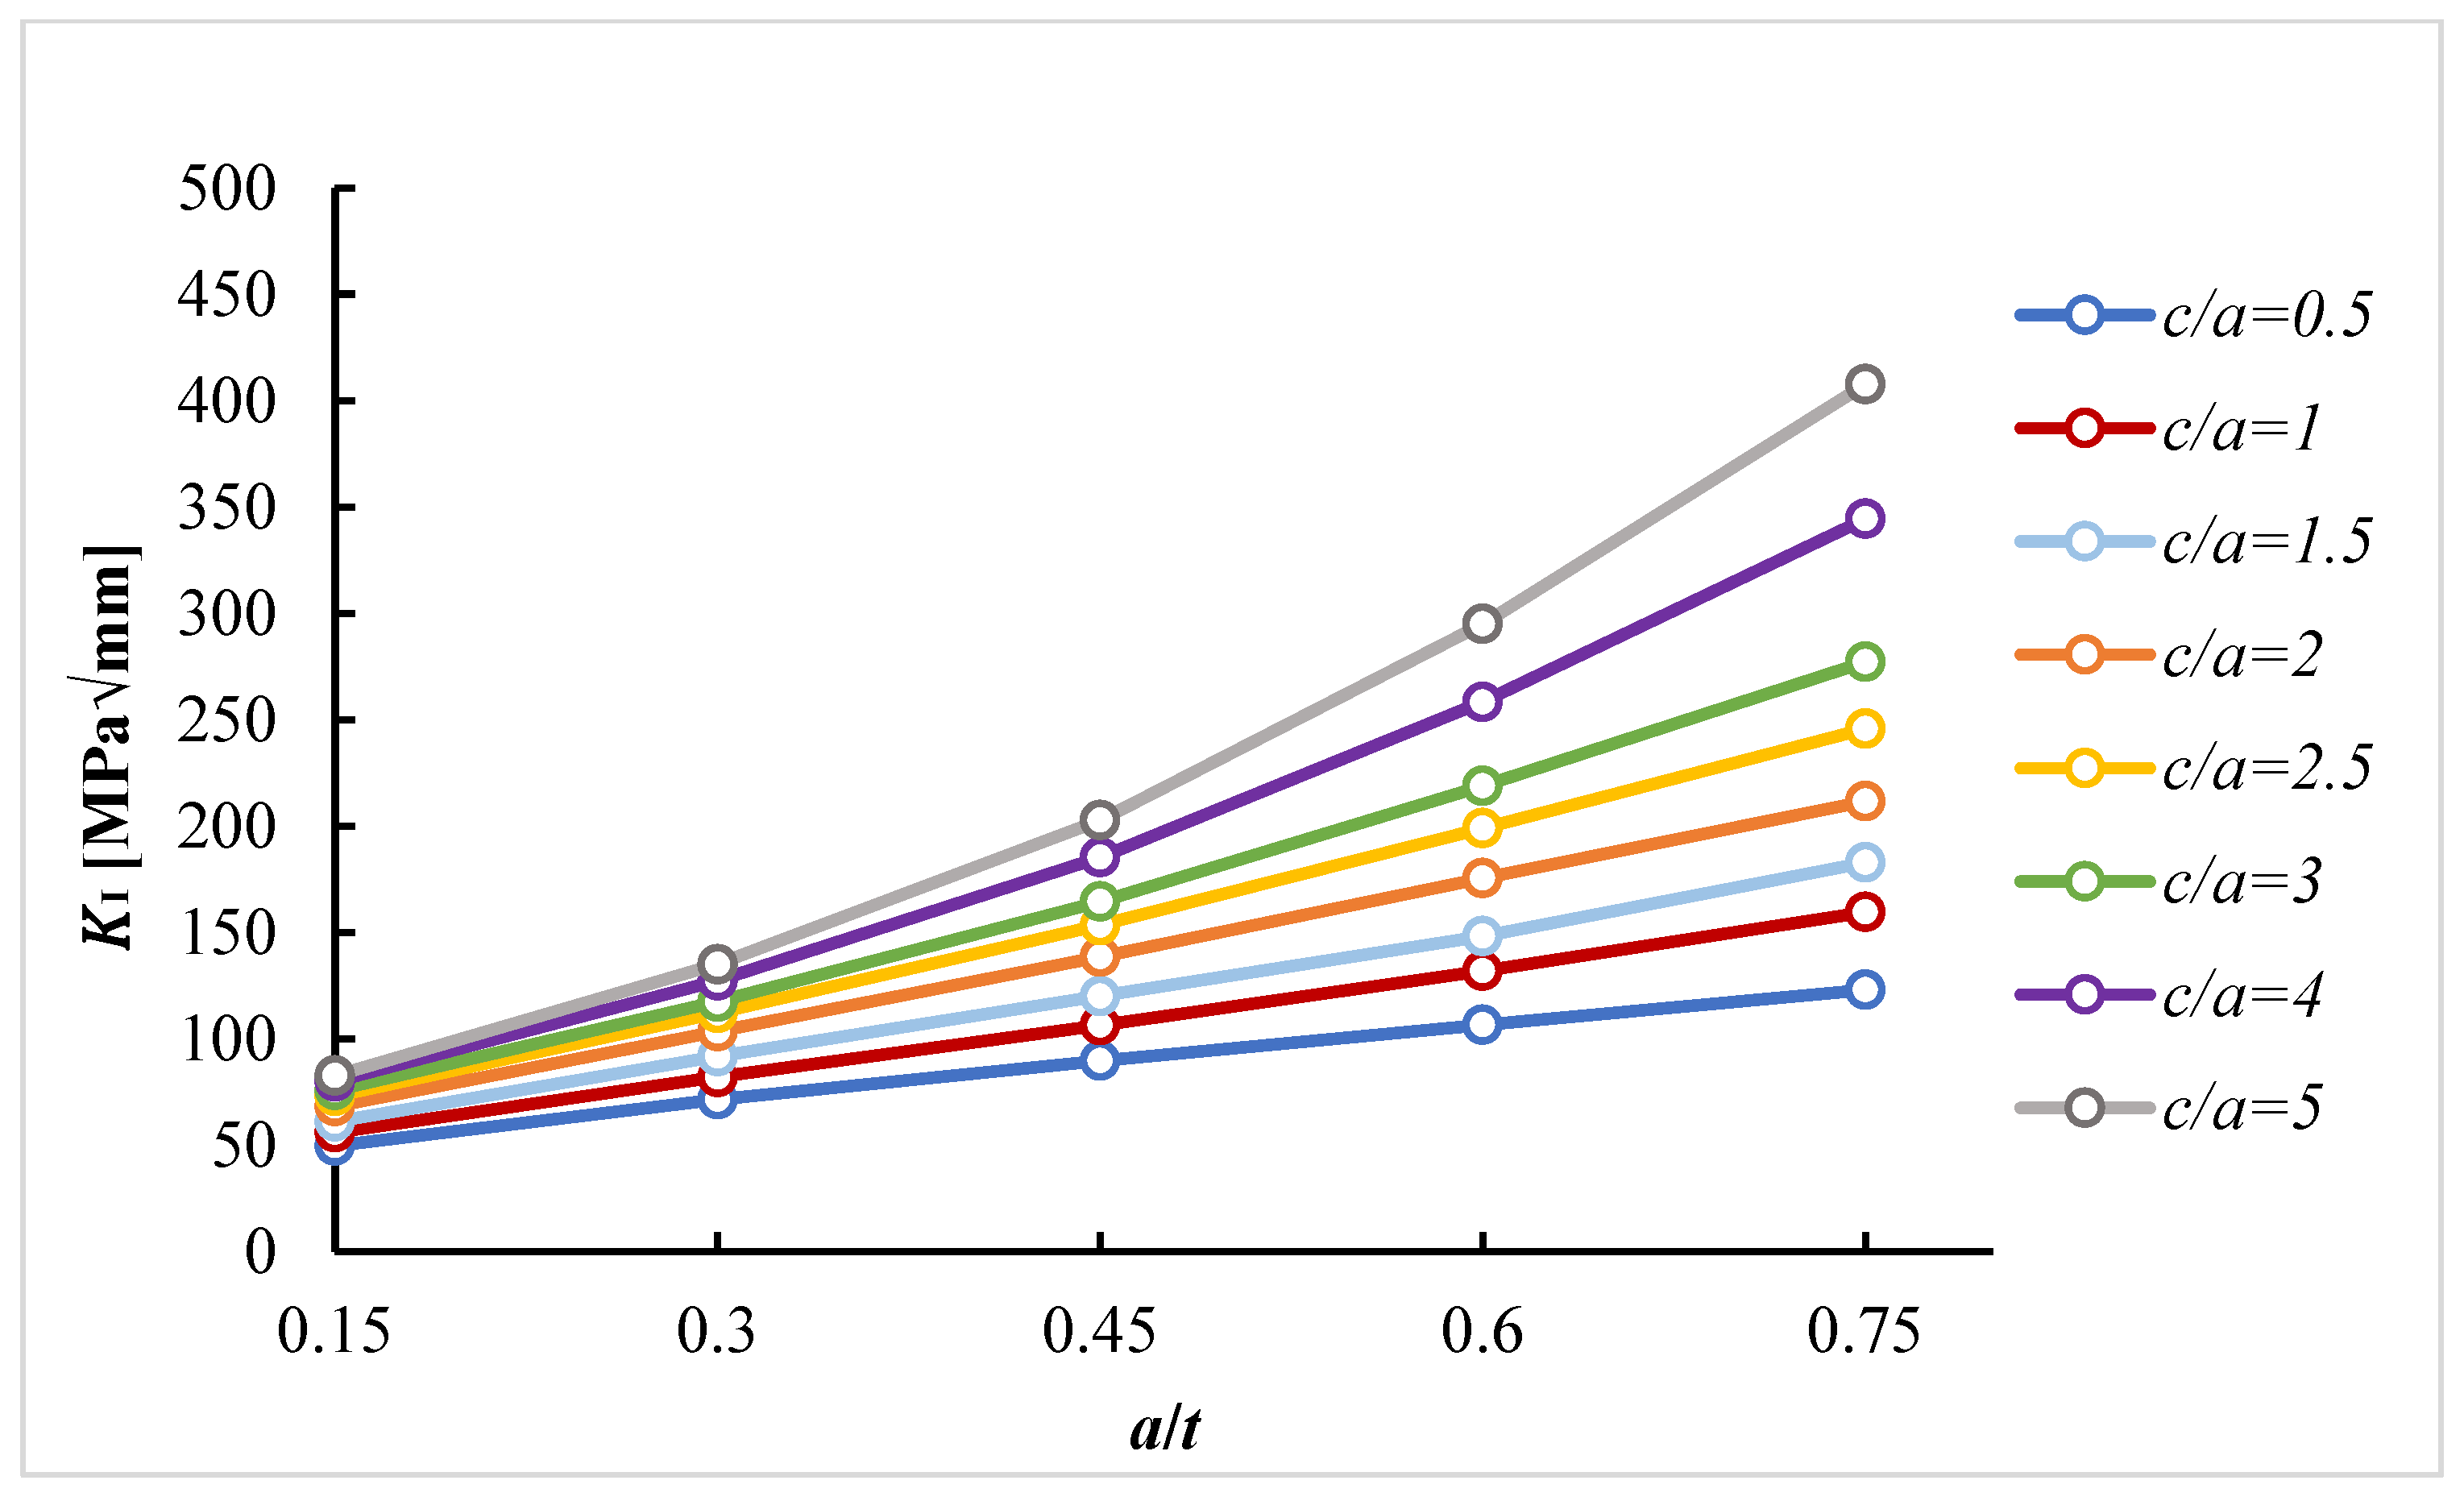
The results presented in Table 2 are used to plot the variation in stress intensity factor and plastic limit pressure against crack length and pipe thickness ratio (a/t), with respect to the crack dimension ratio (c/a). These plots are illustrated in Figure 7 and Figure 8.
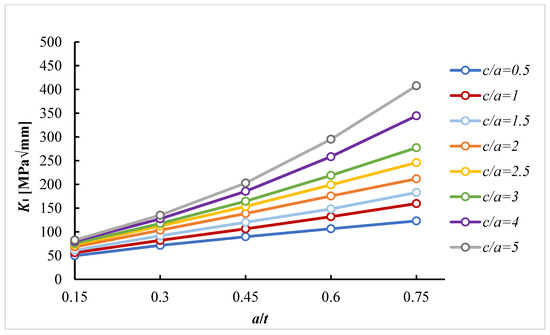
Figure 7.
Stress intensity factor plot regarding a/t and c/a ratio.
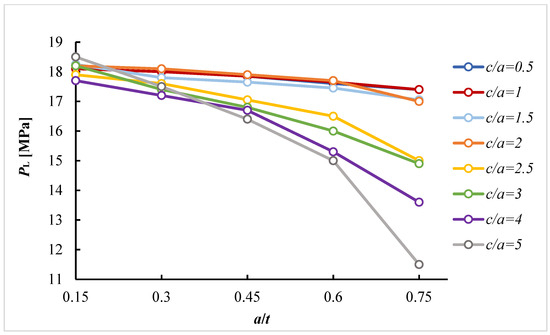
Figure 8.
Plastic limit pressure plot regarding a/t and c/a ratio.
As expected, the observed plots demonstrate two trends: as the a/t ratio increases, the stress intensity factor increases, while the plastic limit pressure decreases. There is also a trend of an increased slope for the stress intensity factor with a higher c/a ratio, while for plastic limit pressure, the slope decreases with a higher c/a ratio.
To obtain closed-form expressions from finite element analysis (FEA) results, a statistical symbolic regression analysis was performed by using TuringBot software v2.19 [47]. TuringBot is an advanced tool designed for symbolic regression. Unlike traditional linear regression, symbolic regression attempts to find the best-fitting equation by testing different mathematical expressions, which can be nonlinear or involve multiple interactions among the variables This makes it well suited for complex engineering applications where the relationships between variables, such as crack dimensions and stress responses, are not purely linear. Crack propagation and plastic limit pressure in materials often involve nonlinearity, especially in cases of complex geometries like semi-elliptical cracks. This approach enabled the generation of closed-form expressions for calculating the stress intensity factor KI ( and plastic limit pressure PL (MPa), where a and c are measured in millimeters (mm):
KI = (7.8071 + 1.49956 × a) × (6.94365 − (3.49515/(a × (c + 1.76901))) + c)
PL = 17.4989 − (0.00745158 × (a × a + (c − ((−2.24832)/(−2.21352 + (c/a))))) × c)
The quality of the regression models was evaluated using two key parameters, the R-squared (R2) and the root mean square (RMS) error. For stress intensity factor KI the R2 is 0.998518, showing that the regression model explains 99.85% of the variance in the FEA results. The RMS error for KI is 1.90855, indicating that there is an average deviation of the predicted values from the observed FEA results. For the limit pressure PL, the regression model observed an R-squared value of 0.981582, meaning that the model explains 98.16% of the variance in the FEA results. The RMS error for PL is 0.1885232, showing a high level of accuracy in the predictions. Lower RMS error values generally indicate a better model fit, with errors between 0.2 and 0.5 being considered highly accurate in many statistical engineering applications. The high R2 value confirms that the models capture the key trends in the data, while the low RMS error indicates that the models make highly accurate predictions within the specified range of crack dimensions.
Figure 9 and Figure 10 illustrate the regression models for the stress intensity factor and plastic limit pressure comparing finite element analysis (FEA) results with statistically obtained expressions (1 and 2). The scatter plots represent the observed FEA values, while the regression lines demonstrate the relationship modeled by the statistical analysis. The high degree of alignment between the FEA data and the regression models suggests a strong correlation between them. This indicates that the proposed expressions accurately represent the relationship between the crack dimensions within the tested range. The tight grouping of data points around the regression lines confirms the validity of the statistical models for predicting stress intensity factor and plastic limit pressure. This demonstrates that generated expressions are reliable for practical engineering calculations.
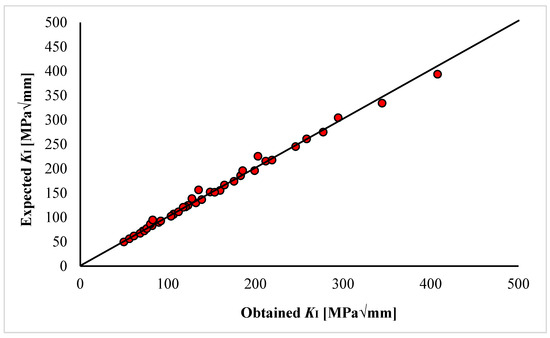
Figure 9.
Stress intensity factor scatter plot.

Figure 10.
Plastic limit pressure scatter plot.
Although the regression models have shown a strong fit within the tested range, future work could explore the models’ behavior beyond the tested crack sizes and include parameters such as pipe thickness and radius, which may further increase their accuracy and applicability. It is also essential to validate these models against experimental data or other analytical solutions to ensure their robustness in different scenarios.
5. FAD Procedure
The failure assessment diagram (FAD) provides a graphical method of assessing the structural integrity of the pipeline by plotting the relationship between crack dimensions and safe operating conditions. Figure 11 illustrates the FAD diagram through which an evaluation of the dimensions of the cracks located in the safe domain is shown. The estimated assessment points are determined with coordinates Kr and Lr by using the FEA results. The points illustrated lie below the FAD function (dotted line), indicating that they fall within the safe domain of the chart. When a point on a FAD diagram falls within the safe domain, it suggests that the pipeline can continue to operate safely under the current loading conditions. The pipeline is not likely to fail due to crack propagation or yielding until loads remain within the material capacity. The key point to note here is that the relationship between Kr and Lr appears approximately linear for these crack configurations within the safe domain (below the dashed line). This linear behavior is common in fracture mechanics when dealing with small-to-moderate crack sizes and load levels. The linearity indicates that, as the load on the pipeline increases (represented by increasing Lr), the stress intensity factor also increases proportionally (leading to a rise in Kr). This proportionality holds true until the material begins to yield, or the load approaches the limit load. Once the plastic limit pressure is reached, the material goes through plastic collapse, and the relationship between Kr and Lr becomes nonlinear [48]. Additionally, the plastic limit pressure is almost five times higher than the working pressure of the pipe. The point near the FAD function (a = 1.68 mm, c = 3.36 mm) still falls within the safe domain but is close to the FAD threshold where the structure may fail. For engineers, this proximity to the boundary raises concerns about the reliability of the system under additional loads or unexpected conditions, such as pressure oscillations or further crack growth. In cases like this, there is the option to consider preventative actions, such as reducing the operating pressure, arranging immediate repairs, or even taking the component out of service for a more detailed inspection.
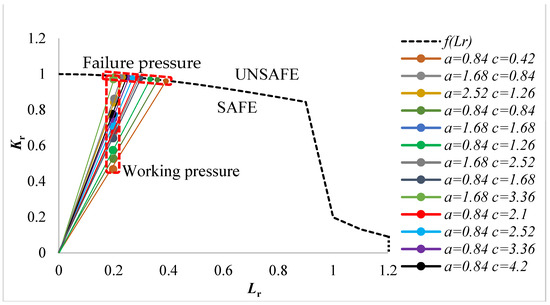
Figure 11.
Failure assessment diagram.
Table 3 presents the failure pressure values, which were calculated by determining the points where the loading paths intersect the FAD function. These values are critical for assessing the integrity of the pipeline and predicting the conditions under which failure might occur.
Table 3.
Failure pressure values determined from FAD intersections.
Safety depends on the difference between the working and failure pressures. For example, if the working pressure is significantly lower than the failure pressure, it means that the pipeline can operate safely under normal working conditions. However, if the working pressure approaches or exceeds the failure pressure, the risk of failure increases significantly, requiring immediate maintenance measures.
6. Discussion
This study provides a solution in the shape of closed-form expressions for calculating plastic limit pressure (PL) and stress intensity factor (KI) for elbows with part-through axial semi-elliptical part-through cracks. Generated expression, validated by symbolic regression shows high accuracy (R-squared values of 0.9985 for KI and 0.1885 for PL). These expressions offer a practical alternative to a time-consuming finite element analysis (FEA). Previous research, such as Lei’s ‘Equivalent straight pipe method’ [40,41], primarily focused on comparing elbows to straight pipes in isolation. Our study extends this by including the interactions within the entire pipeline system, pipe supports, and piping components. While we validated our FEA results using Kiefner et al.’s analytical solution for straight pipes [8], showing consistent trends despite variations in exact values, our approach offers a wider perspective on pipeline integrity.
The closed-form solutions enable quick and reliable failure assessment procedures, reducing the need for extensive FEA. Our approach considers the entire pipeline system, provides a more realistic evaluation of structural integrity, and ensures a safety threshold. While the current FAD diagram was constructed using FEA data, the proposed closed-form expressions are expected to provide similar results, giving a more efficient integrity assessment process and providing a practical tool for evaluating safe operational conditions and quick solutions.
The applicability of our expressions to other pipeline geometries and conditions remains to be tested. Future work should study different pipe dimensions and loading conditions, as well as experimental validation to improve the practical use of the models. Including additional parameters and factors can further improve integrity assessments. Our study contributes to a more complete understanding of pipeline integrity by considering the interactions between cracked elbows and other pipeline components, providing a strong foundation for practical failure assessments.
7. Conclusions
As a result of this study, closed-form solutions for plastic limit pressure (PL) and stress intensity factor (KI) for elbows containing a part-through axial semi-elliptical crack were obtained. It can be concluded that as the c/a ratio increases, its impact on the plastic limit pressure and stress intensity factor becomes more significant. By analyzing the numerical results through a symbolic regression algorithm, closed-form solutions for the limit pressure and stress intensity factor were proposed (Equations (1) and (2)). These expressions enable fast calculation of stress intensity factor and limit pressure, which can be used for failure assessment procedures, eliminating the need for time-consuming finite element analysis (FEA) determination.
The FAD diagram (Figure 11) was constructed by using SINTAP Standard option 1A, a material expected to display a yield plateau. The ligament yielding parameter, Lr, representing the ratio of internal working pressure to plastic limit pressure held the value close to 0.2 across different crack dimensions. This is because the points in the safe domain of the FAD diagram have a similar limit pressure value, while the working pressure remains constant. Additionally, failure pressure was determined by identifying the points where the loading paths intersect the FAD function.
Our approach goes beyond considering the elbow as an isolated case. Instead, it accounts for the interaction between elbows, pipe supports, and other pipeline components, ensuring a more realistic assessment of pipeline integrity. This comprehensive view provides greater safety margins and better reflects the complexities of real operating conditions.
While the current FAD diagram was constructed using FEA results, the closed-form expressions developed here are expected to give comparable results, thus providing a reliable and efficient tool for assessing safe operational conditions. Although the regression models have shown a strong fit within the tested range, future work should explore the application of these methods to various pipeline configurations, including different dimensions, loading conditions, and materials. Further study could explore the models’ behavior beyond the tested crack sizes and include parameters such as pipe thickness and radius, which may further increase their accuracy and applicability. It is also essential to validate these models against experimental data or other analytical solutions to ensure their robustness in different scenarios. The inclusion of other factors, such as temperature fluctuations, corrosion effects, and dynamic loading, can further improve the models’ accuracy and extend their application to a wider range of realistic scenarios. Preparing experiments for pipe elbows with cracks is complex and poses significant challenges. Validating the FEA results through experiments on pipe elbows without cracks is a practical approach. Future work should focus on this direction, aiming to bridge the gap between theoretical predictions and practical validation. These findings are crucial for an accurate and efficient integrity assessment of the piping system, providing a reliable basis for safety evaluations and maintenance planning.
Author Contributions
Conceptualization, B.D. and P.K.; Investigation, B.D.; Methodology, P.K. and M.K.; Software, P.K.; Supervision, P.K. and M.K.; Validation, M.K.; Writing—original draft, B.D. All authors have read and agreed to the published version of the manuscript.
Funding
This research received no external funding.
Institutional Review Board Statement
Not applicable.
Informed Consent Statement
Not applicable.
Data Availability Statement
Data are available upon request to the corresponding author. The data are not publicly available due to privacy.
Conflicts of Interest
The authors declare no conflicts of interest.
Nomenclature
| P | Design pressure |
| PL | Plastic limit pressure |
| a | Crack depth |
| c | Half semi-elliptical crack |
| W | Remaining ligament |
| E | Young’s modulus |
| ρ | Material density |
| Rp0.2 | Yield strength |
| Rm | Ultimate strength |
| ν | Poisson’s ratio in elastic range |
| t | Wall thickness |
| KI | Stress intensity factor |
| PLS | Plastic limit pressure of a straight pipe |
| σY | Yield stress |
| Kr | Ratio between stress intensity factor and fracture toughness of the material |
| Lr | Ratio between internal pressure and plastic limit pressure |
| PF | Failure pressure |
References
- Diem, H.; Müller, K.U. Deformation and failure behavior of elbows. In Proceedings of the Eighth Conference on Structural Mechanics in Reactor Technology, F1 7/9, Brussels, Belgium, 19–23 August 1985; pp. 269–274. [Google Scholar]
- Diem, H.; Blind, D.; Katzenmeier, G.; Hunger, H.A. Crack initiation and crack propagation of an elbow under in-plane bending in high temperature water of elevated oxygen content. In United States: American Association for Structural Mechanics in Reactor Technology; NC State University Libraries: Raleigh, NC, USA, 1989. [Google Scholar]
- Liu, H.; Zhou, Z.; Liu, M. A probability model of predicting the sand erosion profile in elbows for gas flow. Wear 2015, 342–343, 377–390. [Google Scholar] [CrossRef]
- Katinić, M.; Kozak, D.; Božić, Ž.; Gelo, I. Plastic limit pressures for cracked tube containing twin collinear axial through-wall cracks. Arch. Appl. Mech. 2019, 89, 805–811. [Google Scholar] [CrossRef]
- Muthanna, B.G.N.; Bouledroua, O.; Meriem-Benziane, M.; Setvati, M.R.; Djukic, M.B. Assessment of corroded API 5L X52 pipe elbow using a modified failure assessment diagram. Int. J. Press. Vessel. Pip. 2021, 190, 104291. [Google Scholar] [CrossRef]
- Peng, L.C.; Peng, T.L. Pipe Stress Engineering; ASME Press: New York, NY, USA, 2009; Volume 2. [Google Scholar] [CrossRef]
- Jang, H.W.; Hahm, D.; Jung, J.W.; Hong, J.W. Effective numerical approach to assess low-cycle fatigue behavior of pipe elbows. Nucl. Eng. Technol. 2018, 50, 758–766. [Google Scholar] [CrossRef]
- Kiefner, J.F.; Maxey, W.A.; Eiber, R.J.; Duffy, A.R. Failure Stress Levels of Flaws in Pressurized Cylinders; ASTM Special Technical Publications: West Conshohocken, PA, USA, 1973; pp. 461–481. [Google Scholar] [CrossRef]
- Chell, G.G. Elastic-plastic fracture mechanics. Dev. Fract. Mech. 1979, 1, 67–105. [Google Scholar]
- TPRD/L/2566/N83; Ewing, D.J.F. On the Plastic Collapse of a Thin-Walled Pressurised Pipe with an Axial Crack. CEGB Memorandum: London, UK, 1983.
- SID/REP/0191; Carter, A.J. A Library of Limit Loads for FRACTURE-TWO. Nuclear Electric Report TD: Toronto, ON, Canada, 1992.
- Jun, H.K.; Choi, J.B.; Kim, Y.J.; Park, Y.W. The Plastic Collapse Solutions Based on Finite Element Analyses for Axial Surface Cracks in Pipelines under Internal Pressure; ASME-PUBLICATIONS-PVP: New York, NY, USA, 1998; Volume 373, pp. 523–528. [Google Scholar]
- Kim, Y.J.; Shim, D.J.; Huh, N.S.; Kim, Y.J. Plastic limit pressures for cracked pipes using finite element limit analyses. Int. J. Press. Vessel. Pip. 2002, 79, 321–330. [Google Scholar] [CrossRef]
- Kim, Y.J.; Shim, D.J.; Nikbin, K.; Kim, Y.J.; Hwang, S.S.; Kim, J.S. Finite element based plastic limit loads for cylinders with part-through surface cracks under combined loading. Int. J. Press. Vessel. Pip. 2003, 80, 527–540. [Google Scholar] [CrossRef]
- Staat, M. Local and global collapse pressure of longitudinally flawed pipes and cylindrical vessels. Int. J. Press. Vessel. Pip. 2005, 82, 217–225. [Google Scholar] [CrossRef]
- Kim, Y.J.; Oh, C.S.; Song, T.K. Net-section limit pressure and engineering J estimates for axial part-through surface cracked pipes. In Proceedings of the ASME 2007 Pressure Vessels and Piping Conference, San Antonio, TX, USA, 22–26 July 2008; Volume 6, pp. 25–32. [Google Scholar] [CrossRef]
- Lei, Y. A review of limit load solutions for cylinders with axial cracks and development of new solutions. Int. J. Press. Vessel. Pip. 2008, 85, 825–850. [Google Scholar] [CrossRef]
- Tonković, Z.; Skozrit, I.; Alfirević, I. Influence of flow stress choice on the plastic collapse estimation of axially cracked steam generator tubes. Nucl. Eng. Des. 2008, 238, 1762–1770. [Google Scholar] [CrossRef]
- Wang, Q.; Zhou, W. A new burst pressure model for thin-walled pipe elbows containing metal-loss corrosion defects. Eng. Struct. 2019, 200, 109720. [Google Scholar] [CrossRef]
- Griffiths, J.E. The Effect of Cracks on the Limit Load of Pipe Bends Under In-Plane Bending: Experimental Study. Int. J. Mech. Sci. 1979, 21, 119–130. [Google Scholar] [CrossRef]
- Miller, A.G. Review of Limit Loads of Structures Containing Defects. Int. J. Press. Ves. Pip. 1988, 32, 197–327. [Google Scholar] [CrossRef]
- Zahoor, A. Ductile Fracture Handbook; Novetech Corporation: Rockville, MD, USA; Electric Power Research Institute: Palo Alto, CA, USA, 1989. [Google Scholar]
- Yahiaoui, K.; Moffat, D.G.; Moreton, D.N. Damage assessment of piping elbows loaded by steady internal pressure and dynamic in-plane or out-of-plane bending. In Proceedings of the Eighth International Conference on Pressure Vessel Technology, Montreal, QC, Canada, 21–26 July 1996; Volume 1, pp. 361–375. [Google Scholar]
- Miura, N.; Nakayana, Y. Ductile fracture experiments for through wall cracked elbows at high temperature subjected to in-place bending. ASME PVP 1997, 350, 97–105. [Google Scholar]
- Prabhakaran, K.M.; Bhate, S.R.; Bhasin, V.; Ghosh, A.K. Elastic-Plastic Analysis of an Elbow with Axial Part-through Internal Crack at Crown under In-Plane Bending; PVP 2008-61452; ASME: New York, NY, USA, 2008; Available online: http://www.asme.org/about-asme/terms-of-use (accessed on 9 January 2024).
- Wang, C.; Wang, Y.P.; Li, P.N.; Chen, J.; Sun, X.M. Limit Loads for Cracked Elbows Under In-Plane Bending Moment. In Proceedings of the International Conference on Advanced Technology of Design and Manufacture (ATDM 2010), Beijing, China, 23–25 November 2010. [Google Scholar]
- Chattopadhyay, J.; Nathani, D.K.; Dutta, B.K.; Kushwaha, H.S. Closed-Form Collapse Moment Equations of Elbows under Combined Internal Pressure and In-Plane Bending Moment; ASME: New York, NY, USA, 2000. [Google Scholar]
- Wang, C.; Xuan, F.; Li, P. Collapse loads for cracked piping elbows under internal pressure and in-plane moment. In Proceedings of the 18th International Conference on Structural Mechanics in Reactor Technology (SMiRT 18), Beijing, China, 7–12 August 2005. [Google Scholar]
- Manoj Simha, C.H. Limit load solutions for cracked elbows subjected to internal pressure and in-plane bending. J. Press. Vessel Technol. Trans. ASME 2012, 134, 041201. [Google Scholar] [CrossRef]
- Saravanan, M.; Gandhi, P.; Vishnuvardhan, S.; Raghava, G.; Sahu, M.K.; Gupta, S.K.; Chattopadhyay, J. Fracture Studies on Through-Wall Cracked Straight Pipes and Elbows under Internal Pressure and Bending. Exp. Tech. 2023, 47, 941–957. [Google Scholar] [CrossRef]
- Song, T.K.; Kim, Y.J.; Oh, C.K.; Jin, T.E.; Kim, J.S. Net-section limit moments and approximate J estimates for circumferential cracks at the interface between elbows and pipes. Int. J. Press. Vessel. Pip. 2009, 86, 495–507. [Google Scholar] [CrossRef]
- Hong, S.P.; Kim, J.H.; Kim, Y.J. Limit pressures of 90° elbows with circumferential surface cracks. Eng. Fract. Mech. 2009, 76, 2202–2216. [Google Scholar] [CrossRef]
- Hong, S.P. Effect of Internal Pressure on Plastic Loads of 90° Elbows with Circumferential Cracks under Combined Bending. Ph.D. Dissertation, Korea University, Seoul, Republic of Korea, 2011. [Google Scholar]
- Kang, S.J.; Choi, J.H.; Lee, H.; Cho, D.H.; Choi, J.B.; Kim, M.K. Limit load solutions for elbows with circumferential through-wall crack under the pressure-induced bending restraint effect. Int. J. Press. Vessel. Pip. 2019, 177, 103983. [Google Scholar] [CrossRef]
- Kim, M.; Kim, J.; Kim, M.K.; Choi, J.-B.; Huh, N.-S.; Kim, K. Plastic Limit Pressure Solutions for Elbows With Slant Through-Wall Cracks. J. Press. Vessel Technol. 2020, 142, 051502. [Google Scholar] [CrossRef]
- Kim, J.H.; Kim, M.K.; Choi, Y.R.; Cho, D.H.; Kim, M.K.; Choi, J.B. A study on the effect of non-idealized crack on a 90° elbow by using finite element analysis. In Proceedings of the ASME 2018 Pressure Vessels and Piping Conference, Prague, Czech Republic, 15–20 July 2018; American Society of Mechanical Engineers: New York, NY, USA, 2018; Volume 51685, p. V06BT06A007. [Google Scholar]
- EU Project BE 95-1462; SINTAP, Structural Integrity Assessment Procedure, Final Revision. Brite Euram Programme: Brussels, Belgium, 1999.
- EDF Energy. R6: Assessment of the integrity of structures containing defects. In Revision 4, with Amendments to Amendment 11; EDF Energy: Gloucester, UK, 2015. [Google Scholar]
- Konjatić, P.; Kozak, D.; Gubeljak, N. The influence of the weld width on fracture behavior of the heterogeneous welded joint. Key Eng. Mater. 2012, 488, 367–370. [Google Scholar] [CrossRef]
- Lei, Y. Review of limit load solutions for defective pipe bends. In EDF Energy Report E/REP/BBGB/0060/GEN/09, Revision 0; EDF Energy Nuclear Generation Ltd.: Gloucestershire, UK, 2011. [Google Scholar]
- Lei, Y.; Budden, P.J. Predictions for Defective Pipe Elbows Via the Reference Stress Method. J. Press. Vessel Technol. Trans. ASME 2022, 144, 031303. [Google Scholar] [CrossRef]
- Penner, S.S. Combined Power Plants, Including Combined Cycle Gas Turbine (CCGT) Plants; Horlock, J.H., Ed.; Pergamon Press: Oxford, UK, 1993; 288p. [Google Scholar]
- Damjanović, B.; Turk, D.; Konjatić, P.; Katinić, M. Calculation of critical pipeline geometry in thermal power plants. In Proceedings of the 12th International Natural Gas, Heat and Water Conference, Online Conference, 7–9 June 2021; Raos, P., Ed.; IAEE: Dallas, TX, USA, 2021. [Google Scholar]
- Li, Y.; Wang, Y.; Cai, J.; Ren, C.; Zhang, B.; Zhang, B. Structural Design of Pressure Pipeline Wedge-Shaped Concrete Piers. Teh. Vjesn. 2023, 30, 1373–1378. [Google Scholar]
- EN 10216-2:2020; Seamless Steel Tubes for Pressure Purposes—Technical Delivery Conditions—Part 2: Non-Alloy and Alloy Steel Tubes with Specified Elevated Temperature Properties. European Committee for Standardization: Brussels, Belgium, 2020.
- Ansys Workbench. Available online: https://www.ansys.com/products/ansys-workbench (accessed on 10 January 2024).
- TuringBot Software. Sao Paulo, Brazil. 2023. Available online: https://turingbotsoftware.com/ (accessed on 16 April 2024).
- Konjatić, P.; Katinić, M.; Kozak, D.; Gubeljak, N. Yield Load Solutions for SE (B) Fracture Toughness Specimen with I-Shaped Heterogeneous Weld. Materials 2021, 15, 214. [Google Scholar] [CrossRef]

Disclaimer/Publisher’s Note: The statements, opinions and data contained in all publications are solely those of the individual author(s) and contributor(s) and not of MDPI and/or the editor(s). MDPI and/or the editor(s) disclaim responsibility for any injury to people or property resulting from any ideas, methods, instructions or products referred to in the content. |
© 2024 by the authors. Licensee MDPI, Basel, Switzerland. This article is an open access article distributed under the terms and conditions of the Creative Commons Attribution (CC BY) license (https://creativecommons.org/licenses/by/4.0/).