Featured Application
A guide to construct and operate an experimental cardiac ablation simulator for interventional electrophysiology training.
Abstract
Cardiac ablation (CA) is an interventional electrophysiological procedure used to disrupt arrhythmic substrates in the myocardium by inducing localized scarring. Current CA training relies on the master–apprentice model. In different fields of medicine including CA, virtual and physical simulators have proven to enhance, and even outperform, conventional training modalities while providing a risk-free learning environment. Despite the benefits, high costs and operational difficulties limit the widespread use of interventional simulators. Our previous research introduced a low-cost CA simulator using a 3D-printed biatrial cardiac model, successfully recording ten ablation lesions on the phantom myocardium. In this work, we present and evaluate an enhanced version: compared to the previous version, the cardiac phantom’s electrical behavior and ablation settings were optimized to produce consistent lesions, while 3D-printed components improved the haptic and radiographic properties of the simulator. Seven cardiologists compared the experimental simulator’s performance to the leading commercial system from Heartroid in a 24-question survey on a 5-point Likert scale. The four following areas of fidelity were considered: catheter entry, anatomical correctness, radiographic appearance, and mapping and ablation. The experimental simulator significantly outperformed the commercial system (p < 0.01), particularly in radiographic appearance (p < 0.01). The results show the potential for the experimental simulator in routine CA training.
1. Introduction
Cardiac arrhythmias encompass a group of pathological conditions in which the patient’s heart rhythm and rate are abnormal. They can cause the heart to beat with abnormal frequency and lead to cardiac dysfunction, causing dizziness, fatigue, palpitations, embolic strokes, heart failure, and even cardiac arrest. Arrhythmias are some of the most common cardiovascular pathologies, affecting over 2 million people in the UK alone [1]. Atrial arrhythmias are the most common type worldwide, with atrial fibrillation (AF) being the most prevalent. In 2017, over 37.5 million cases of AF were recorded worldwide, accounting for over 280,000 deaths [2]. In 2014, F. Rahman et al. [3] predicted that the number of AF cases in western countries would more than double by the year 2050. These pathologies stem from arrhythmic substrate forming within the pulmonary veins, atria, coronary sinus and superior vena cava. When pharmacotherapy fails to prevent or control these arrhythmias, patients are referred for cardiac ablation (CA), a ‘keyhole’ percutaneous interventional procedure in which catheters are used to deliver thermal or non-thermal energy to the myocardial tissue of the cardiac wall, thereby disrupting the arrhythmic substrate and preventing interruption to the tissue conduction and atrial rhythm [4,5]. This is commonly achieved by delivering localized heat via a radiofrequency ablation catheter. This is carried out in the cardiac catheterization electrophysiology (EP) laboratory and guided by a combination of X-ray fluoroscopy imaging and electroanatomical mapping (EAM) [6]. AF ablation is the most common procedure to be performed in the cardiac EP lab. The right atrium is entered through the femoral venous system. Sheaths are inserted into the femoral vein, usually on the right, due to its proximity to the operator. Catheters are guided into the sheaths and then through the vein up to the inferior vena cava to reach the right atrium and, via a sheath already across the atrial septum, cross into the left atrium [6]. With a growing number of cases, healthcare systems are under pressure to train more operators. Conventional CA training is based on the master–apprentice model during procedures performed on patients [7].
Simulators have been proven to augment electrophysiology training, with direct benefits to patients, especially in early-stage training. R. De Ponti et al. [7] used the electrophysiology simulator Procedicus VIST G7 (Mentice AB, Gothenburg, Sweden) to assess the placement of electrophysiological catheters before and after simulator training. The use of simulators in training not only reduced procedural time, but also reduced the trainees’ need for prolonged visual feedback, ultimately reducing X-ray exposure time during the procedures. Using the same simulator, another study compared conventional training to simulator-based training in transeptal puncture (TSP) [8]. Two groups of students were trained separately and later assessed on their performance. Simulation practice proved more efficient, reducing training time from 30 days to 4 days.
The ANGIO Mentor (Surgical Science, Gothenborg, Sweden) systems are arguably the most versatile cardiovascular interventional simulators on the market today [9]. They are hybrid systems, meaning they have a physical component and a virtual reality component. They consist of blocks, with an insertable replica catheter that can be manipulated by the operator similarly to real ones. The blocks connect to computers, allowing the users to visualize simulated fluoroscopic images, as well as physiological values [10,11]. The simulator allows for full control of virtual C-arm fluoroscopy, virtual ultrasound, and a virtual computerized tomography (CT). This system can recreate numerous cardiovascular interventional procedures, including EAM and TSP. The price of the ANGIO Mentor ranges between GBP 60,000 and GBP 138,000, and individual procedure modules (such as the ones for EAM and TPS) cost between GBP 5000 and GBP 15,000 [10,11]. To our knowledge at the time of this study, the Heartroid EP Model (Heartroid, Kyoto, Japan) (Figure 1A,B) is the best commercial off-the-shelf physical simulator for radiofrequency CA (RCA), thanks to its many unique features and its compatibility with any EAM system. The system consists of a hemodynamic pump, a full transparent conductive heart phantom, a 6-L tank of saline, and a foam block with a valve recreating the leg. The heart phantom’s atria are interconnected via a set of three holes placed on the atrial septum; the four chambers interconnect with coronary vessels and valves. Tools are entered through an adjustable valve that simulates catheter entry through the leg foam block. Compatible with EAM, including the CARTO mapping system (Biosenese Webster, Irvine, CA, USA), one of the leading EAM systems, this simulator is able to recreate mapping, tracking, and ablation in all four chambers of the heart. CARTO patches and cables can be connected from the outside of the simulator tank via a series of stainless steel bolts and washers (Figure 1A,B). Unlike virtual simulators, physical simulators make use of real catheters in a real catheterization laboratory, exposing the trainee to a more realistic experience without endangering patients. This physical system costs approximately GBP 10,000–15,000 [12].
Due to the high costs associated with commercial simulators for electrophysiology, multiple institutions have made use of 3D printing technology to develop their own electrophysiology simulators compatible with EAMs [13,14,15,16]. L. Rossi et al. [15] present an experimental simulator consisting of a selective laser sintering (SLS) 3D-printed full heart model, made with thermochromic polyurethane and placed in a saline tank (Figure 1E). This system achieved realistic tactile feel during catheter manipulation and realistic body-like temperatures by pumping the system with thermostat-regulated 37 °C saline [15]. Similarly to Heartroid, the patches were in contact with the catheter tip via saline; however, the tank in this model was shaped as a torso to enhance realism. The system was paired with the CARTO mapping system and an electrocardiogram signal generator to recreate the electrophysiological conditions of the body. The total cost of construction was approximately GBP 6000 and 150 h of labor [15]. Similarly, our previous research [13] presented methods to build a low-cost, easy-to-replicate experimental simulator for CA, making use of fused deposition modelling (FDM) 3D printing. The simulator (Figure 1C,D) was composed of a saline tank containing a thermochromic biatrial phantom, a base to hold the phantom, and six probing tubes that hold the CARTO patches in the saline. The heart phantom presented in the article only contained two atria, focusing on atrial ablation training. To connect the chambers, a transeptal hole was placed in the fossa ovalis to enable access into the left atrium. The phantom was FDM 3D printed in Layfomm40 (CC-Products, Köln, Germany): a mixture of thermoplastic polyurethane and polyvinyl alcohol. The printed phantom was coated in paint to render its surface radiopaque and thermochromic. The phantom was soaked in 0.9% saline, and then placed in the simulator for ablation. Ten thermochromic ablation lesions were successfully performed on the posterior wall of the right atrium, providing an effective proof of concept for this manufacturing methodology. Though not as intricate as the experimental system proposed by L. Rossi et al. [15], this system is arguably more accessible to a wider academic audience by proposing low-cost materials and common 3D printing solutions.
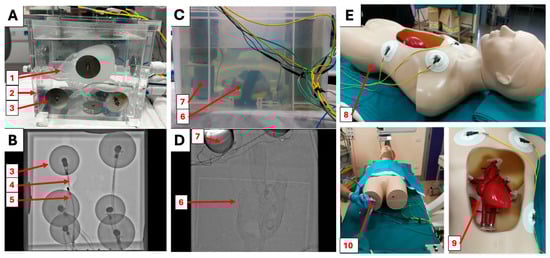
Figure 1.
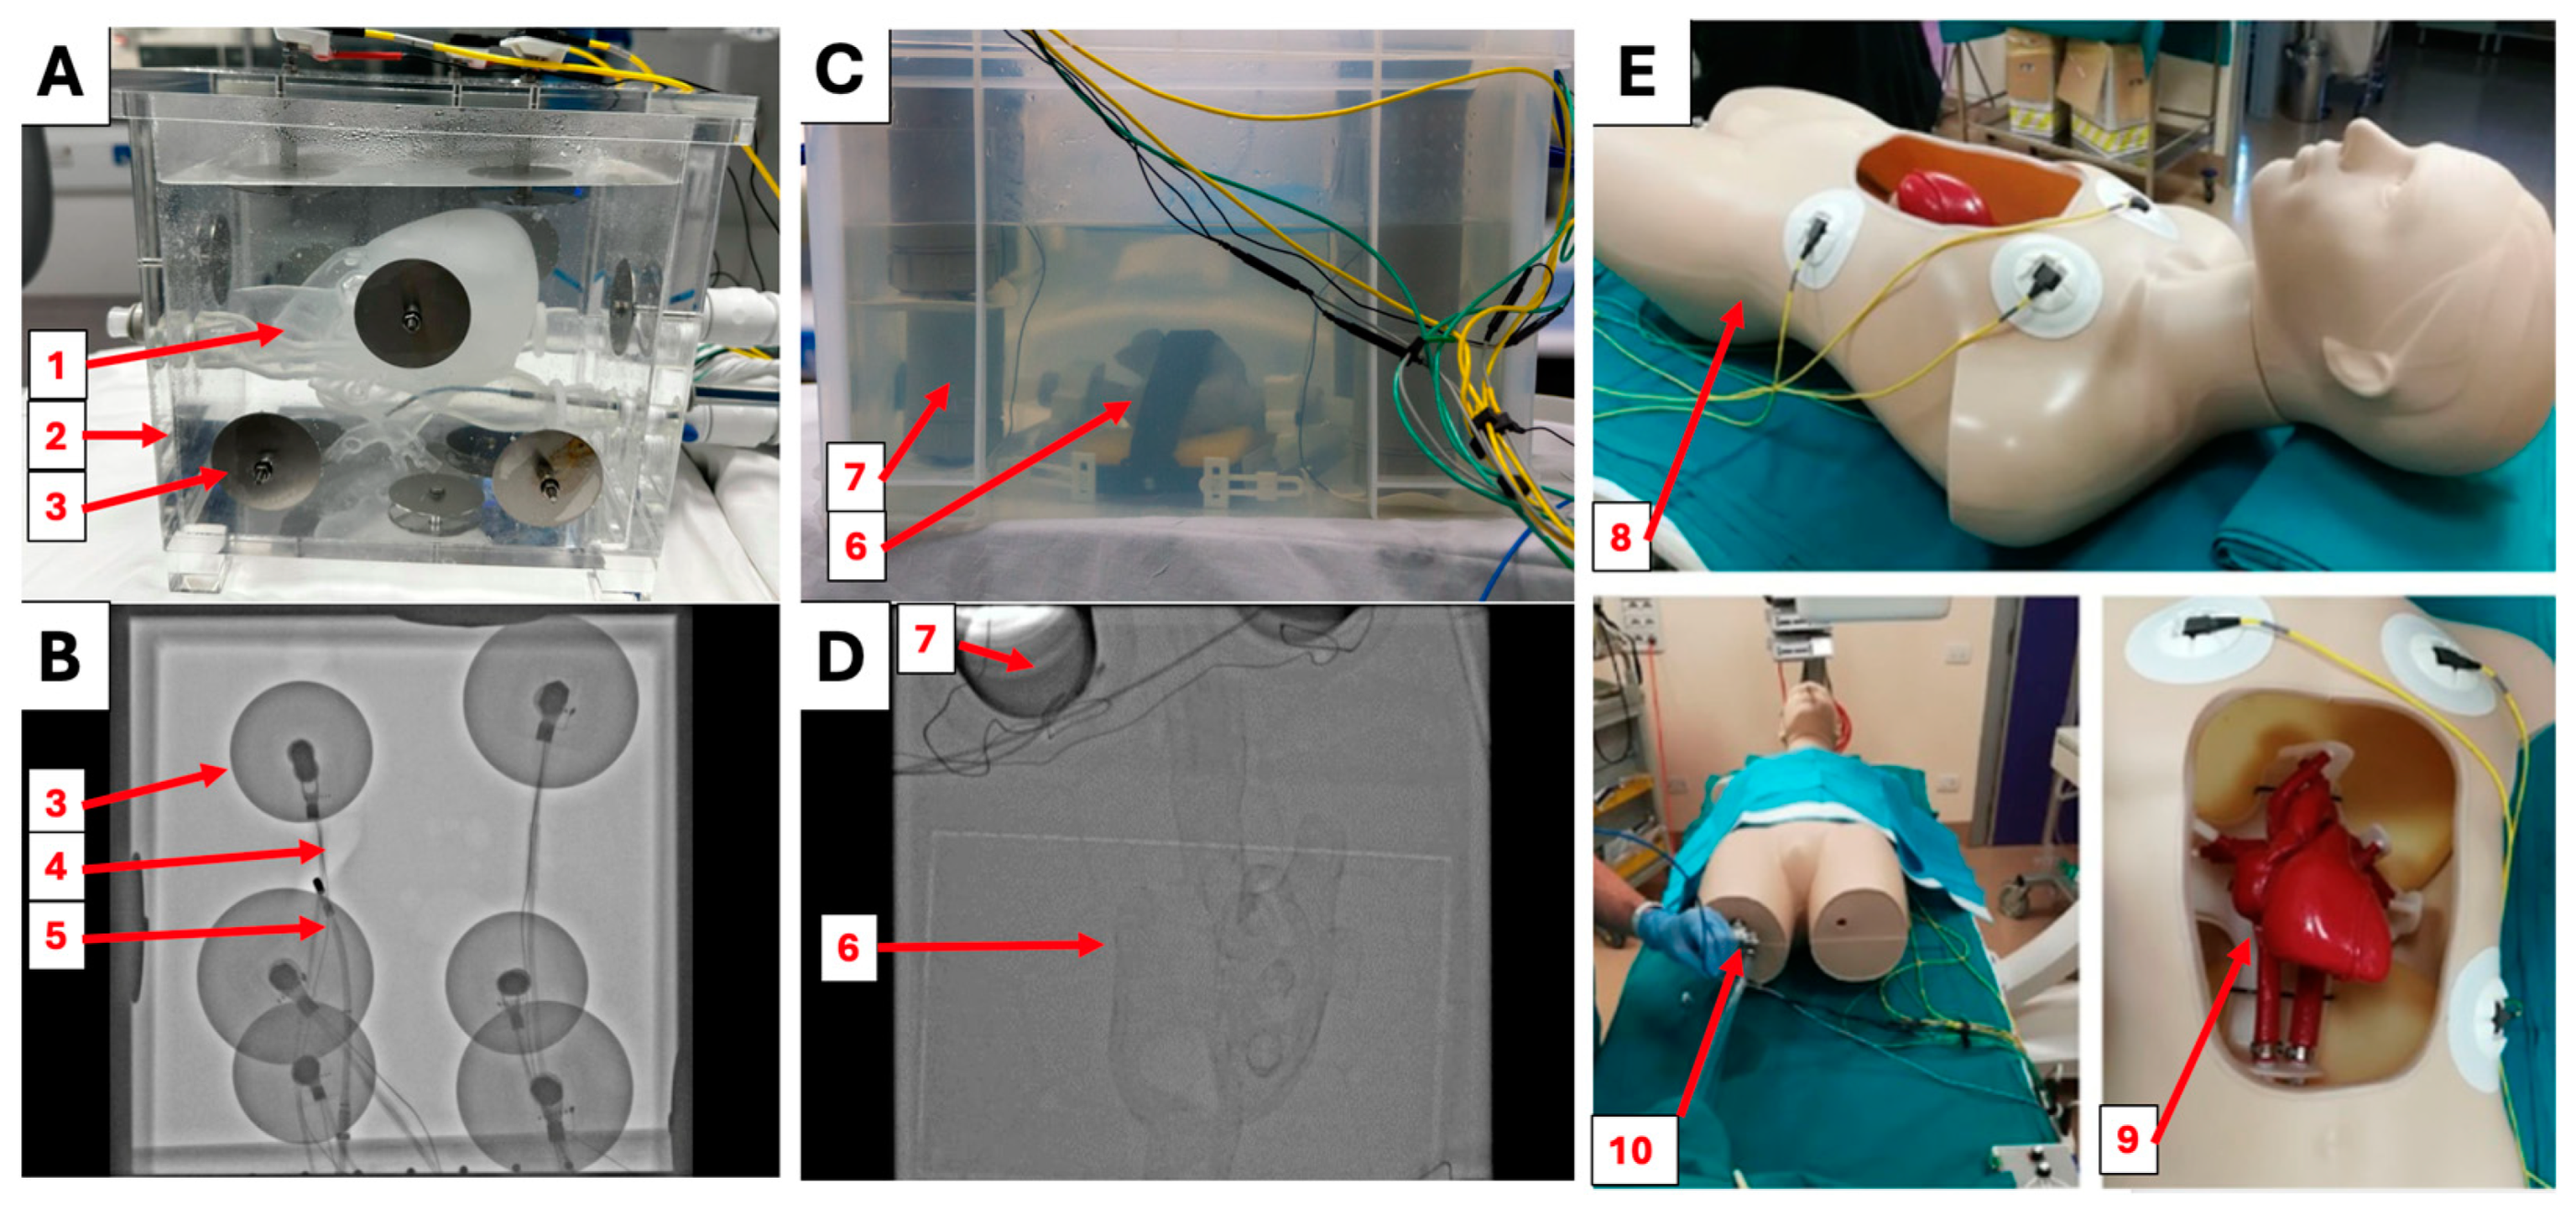
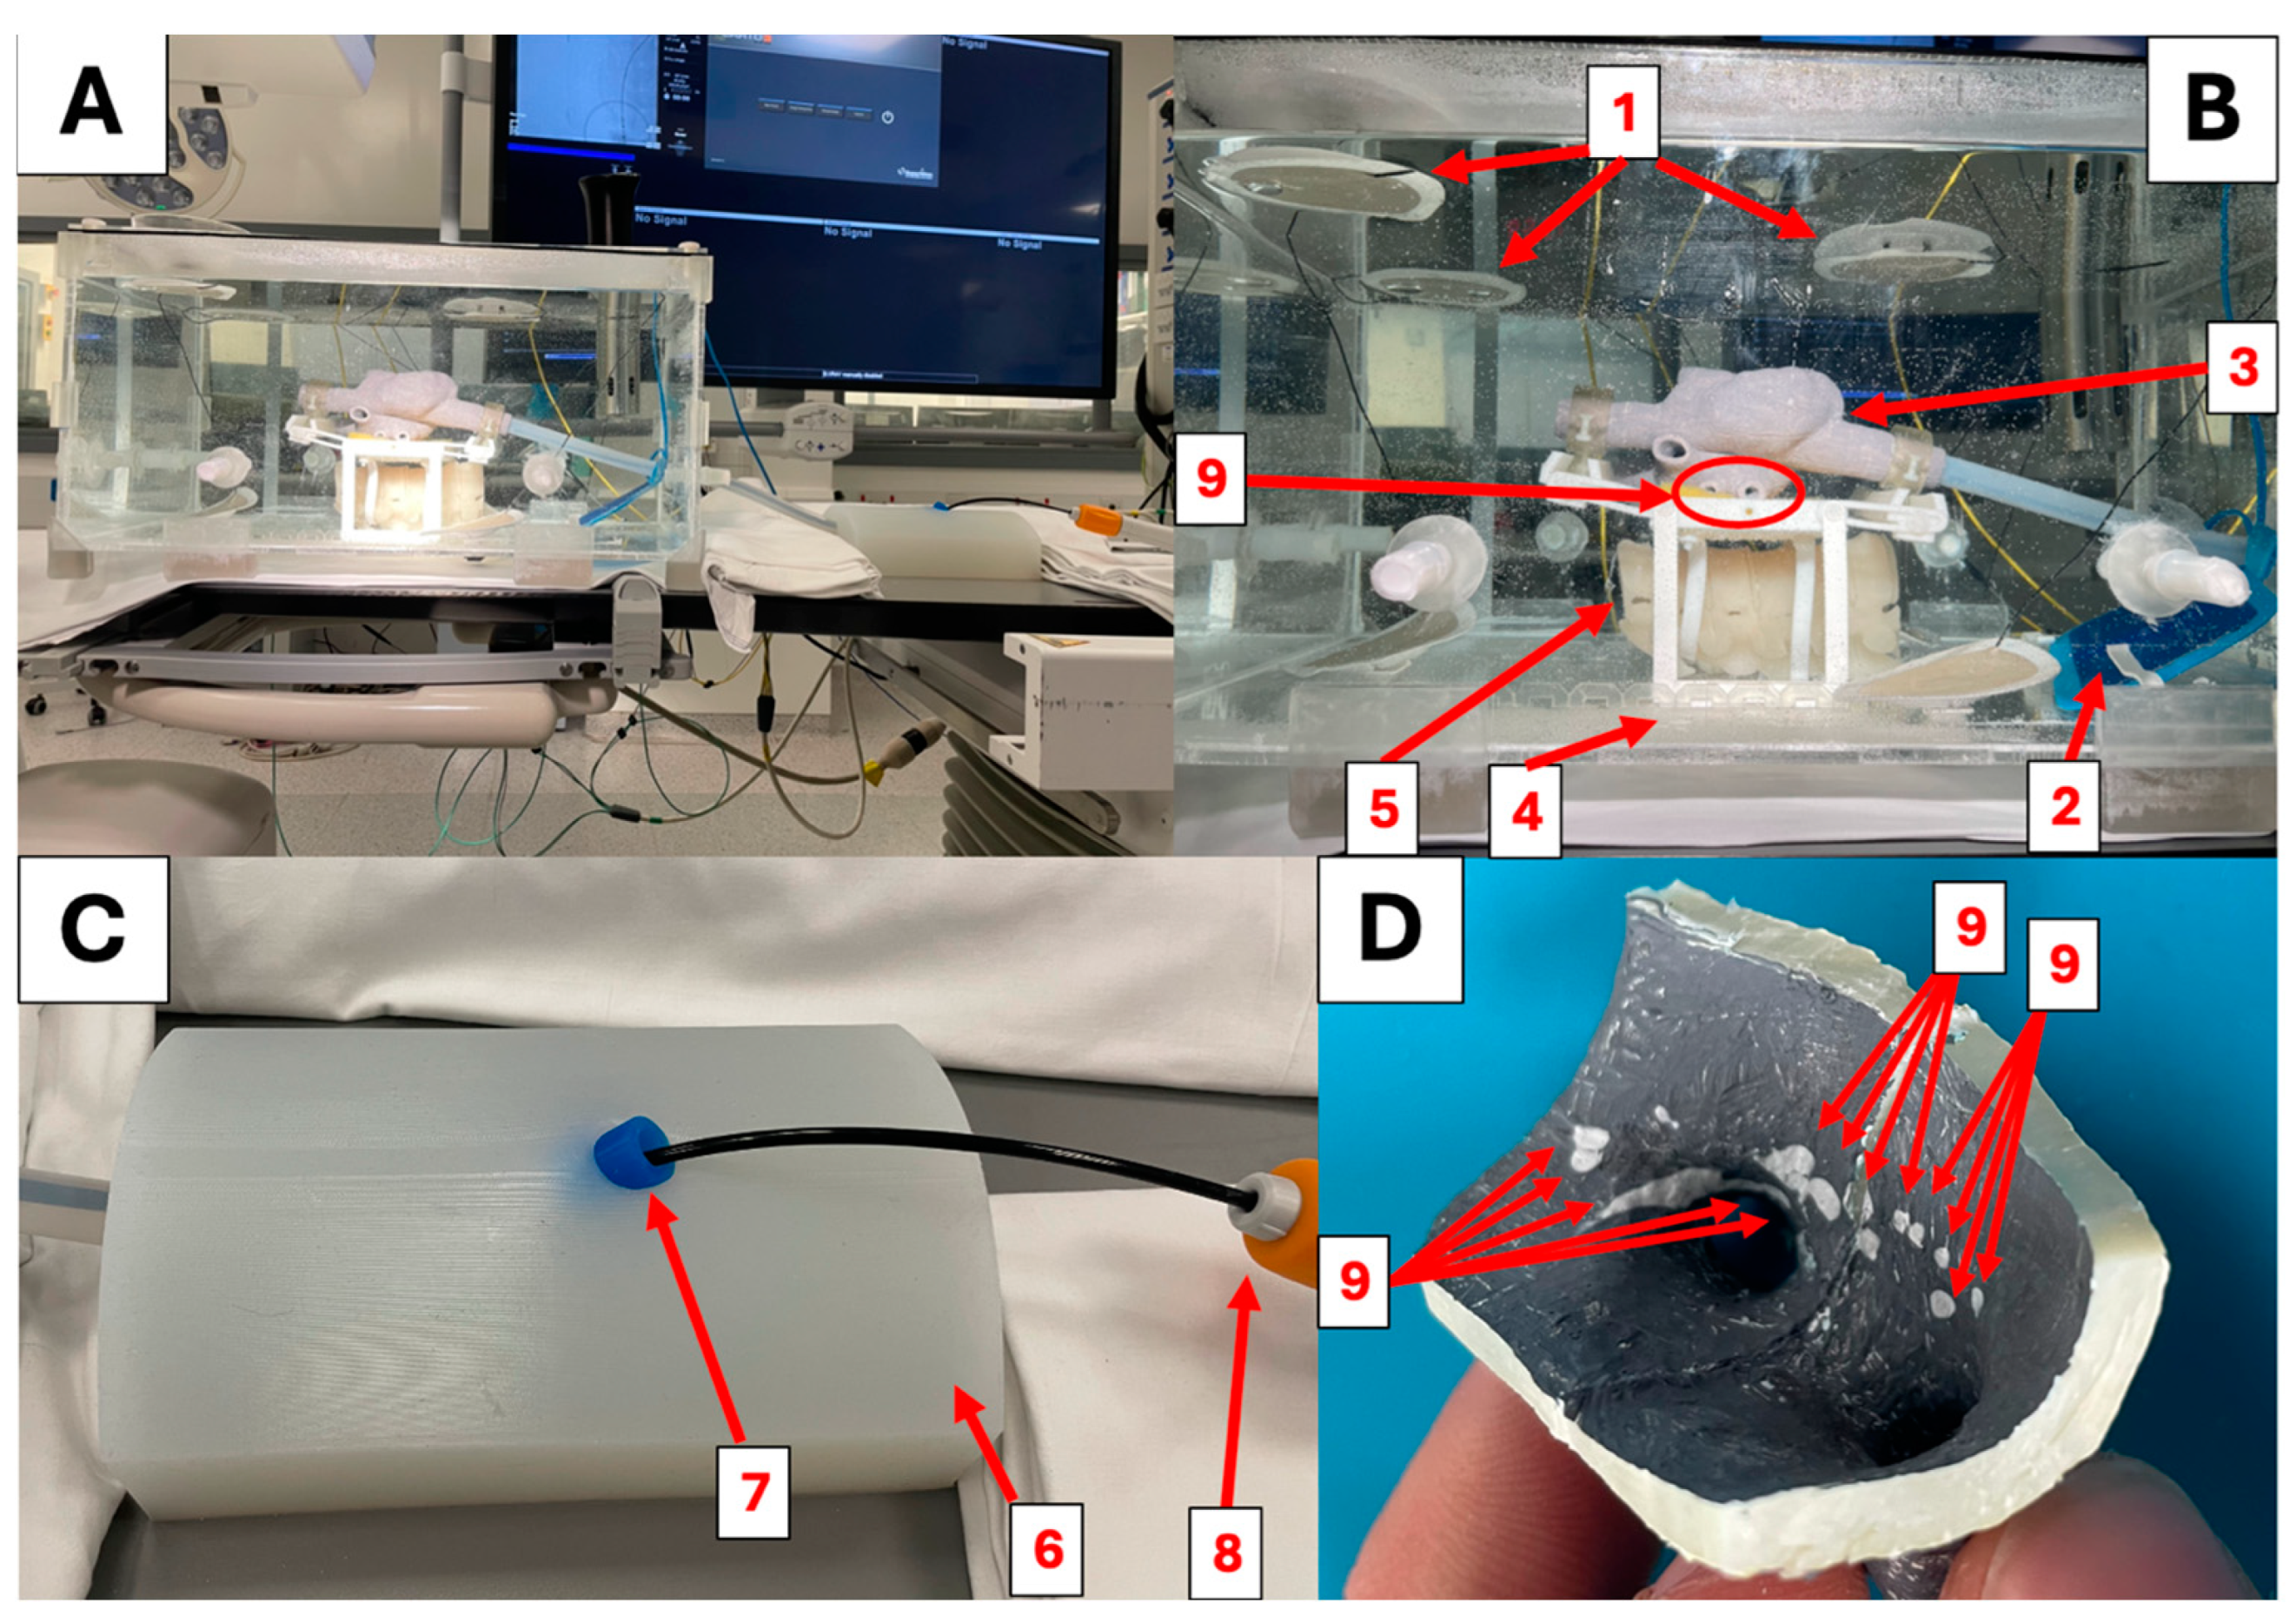
(A) The Heartroid EP Model training system. The translucent conductive heart phantom (1) is placed inside of a 6l saline tank (2) and connected to a pulsatile pump. Circular steel electrodes (3) allow for connection to electroanatomical mapping systems. (B) Fluoroscopic image of the Heartroid EP model. The electrodes (3), air bubbles (4), and catheter (5) are visible; however, the heart is not. (C) The experimental simulator proposed by S. Wang et al. [13] contains a 3D-printed thermochromic heart phantom (6) and probing tubes (7) to place the external reference patches in the anatomical position. (D) Fluoroscopic image of the experimental simulator proposed by S. Wang et al. [13]. The outline of the heart (6) is visible, as well as the patch holders (7). (E) The experimental simulator presented by L. Rossi et al. [15] is composed of a mannequin (8) hosting a 3D printed heart phantom (9). Similarly to the other systems, catheters are entered via valves in the leg area (10).
Figure 1.
(A) The Heartroid EP Model training system. The translucent conductive heart phantom (1) is placed inside of a 6l saline tank (2) and connected to a pulsatile pump. Circular steel electrodes (3) allow for connection to electroanatomical mapping systems. (B) Fluoroscopic image of the Heartroid EP model. The electrodes (3), air bubbles (4), and catheter (5) are visible; however, the heart is not. (C) The experimental simulator proposed by S. Wang et al. [13] contains a 3D-printed thermochromic heart phantom (6) and probing tubes (7) to place the external reference patches in the anatomical position. (D) Fluoroscopic image of the experimental simulator proposed by S. Wang et al. [13]. The outline of the heart (6) is visible, as well as the patch holders (7). (E) The experimental simulator presented by L. Rossi et al. [15] is composed of a mannequin (8) hosting a 3D printed heart phantom (9). Similarly to the other systems, catheters are entered via valves in the leg area (10).
The experimental simulators presented by S. Wang et al. [13] and L. Rossi et al. [15] were proven to be effective in simulating the procedure; however, comparisons against the commercial state-of-the-art system have never been made. It remains unclear whether training centers can consider these experimental devices as valid alternatives to commercial systems. This study’s objectives were to significantly enhance our previous simulator [13] based on our previous findings and to evaluate the newly enhanced experimental simulator using structured feedback from cardiologists, drawing direct comparisons to the leading commercial Heartroid CA simulator.
2. Materials and Methods
2.1. Simulator Construction
Based on the design presented by S. Wang et al. [13], a new system was fully designed on Autodesk Fusion360 (Autodesk, San Francisco, CA, USA). To create a more spacious, clear, and visible environment in the simulator tank, the plastic container was replaced with a 55 × 38 × 27 cm acrylic tank. This larger tank was laser cut from 5 mm acrylic panels and assembled using acrylic cement and silicone sealant. Ten 8 mm tubing inlets and outlets were vat photopolymerization (VP) 3D printed using Anycubic Basic Clear Resin (HongKong Anycubic Technology Co., Hong Kong, China). The resin pieces were fitted to the acrylic side panels using silicone sealant and acrylic cement to allow access into the tank. FDM-printed clips on the inferior side of the tank hold the grounding patch to simulate its placement on the lower back of the patient. The CARTO External Reference Patches were directly clipped to the walls of the tank with polylactic acid (PLA) 3D-printed hooks, ensuring reliable contact with the saline; meanwhile, their electromagnetic probes were locked on the other side of the acrylic panel to keep them out of the saline. The lid hosts a thermostat system (VPCOK Direct, Shenzhen, China), which heats the water to 37 °C, similar to the work by L. Rossi et al. [15].
To simulate catheter entry at the leg, the new simulator uses a 12 × 20 × 7 cm rounded silicone block. The leg block was cast in OO30 EcoFlex silicone (SmoothOn, Macungie, PA, USA) using an FDM 3D-printed PLA mold. The block connects to the tank via tubing and hosts a 17 mm hemostatic silicone valve to allow for the entry of tools without leaks.
A biatrial phantom with a 3 mm wall was FDM 3D printed in Layfomm40 using the same designs and methodologies described by S. Wang et al. [13]. The phantom was secured in the anatomical position using an elevated perforated PLA base. The base was fixed on the craniocaudal axis by a locking mechanism on the bottom of the tank.
2.2. X-ray Visibility
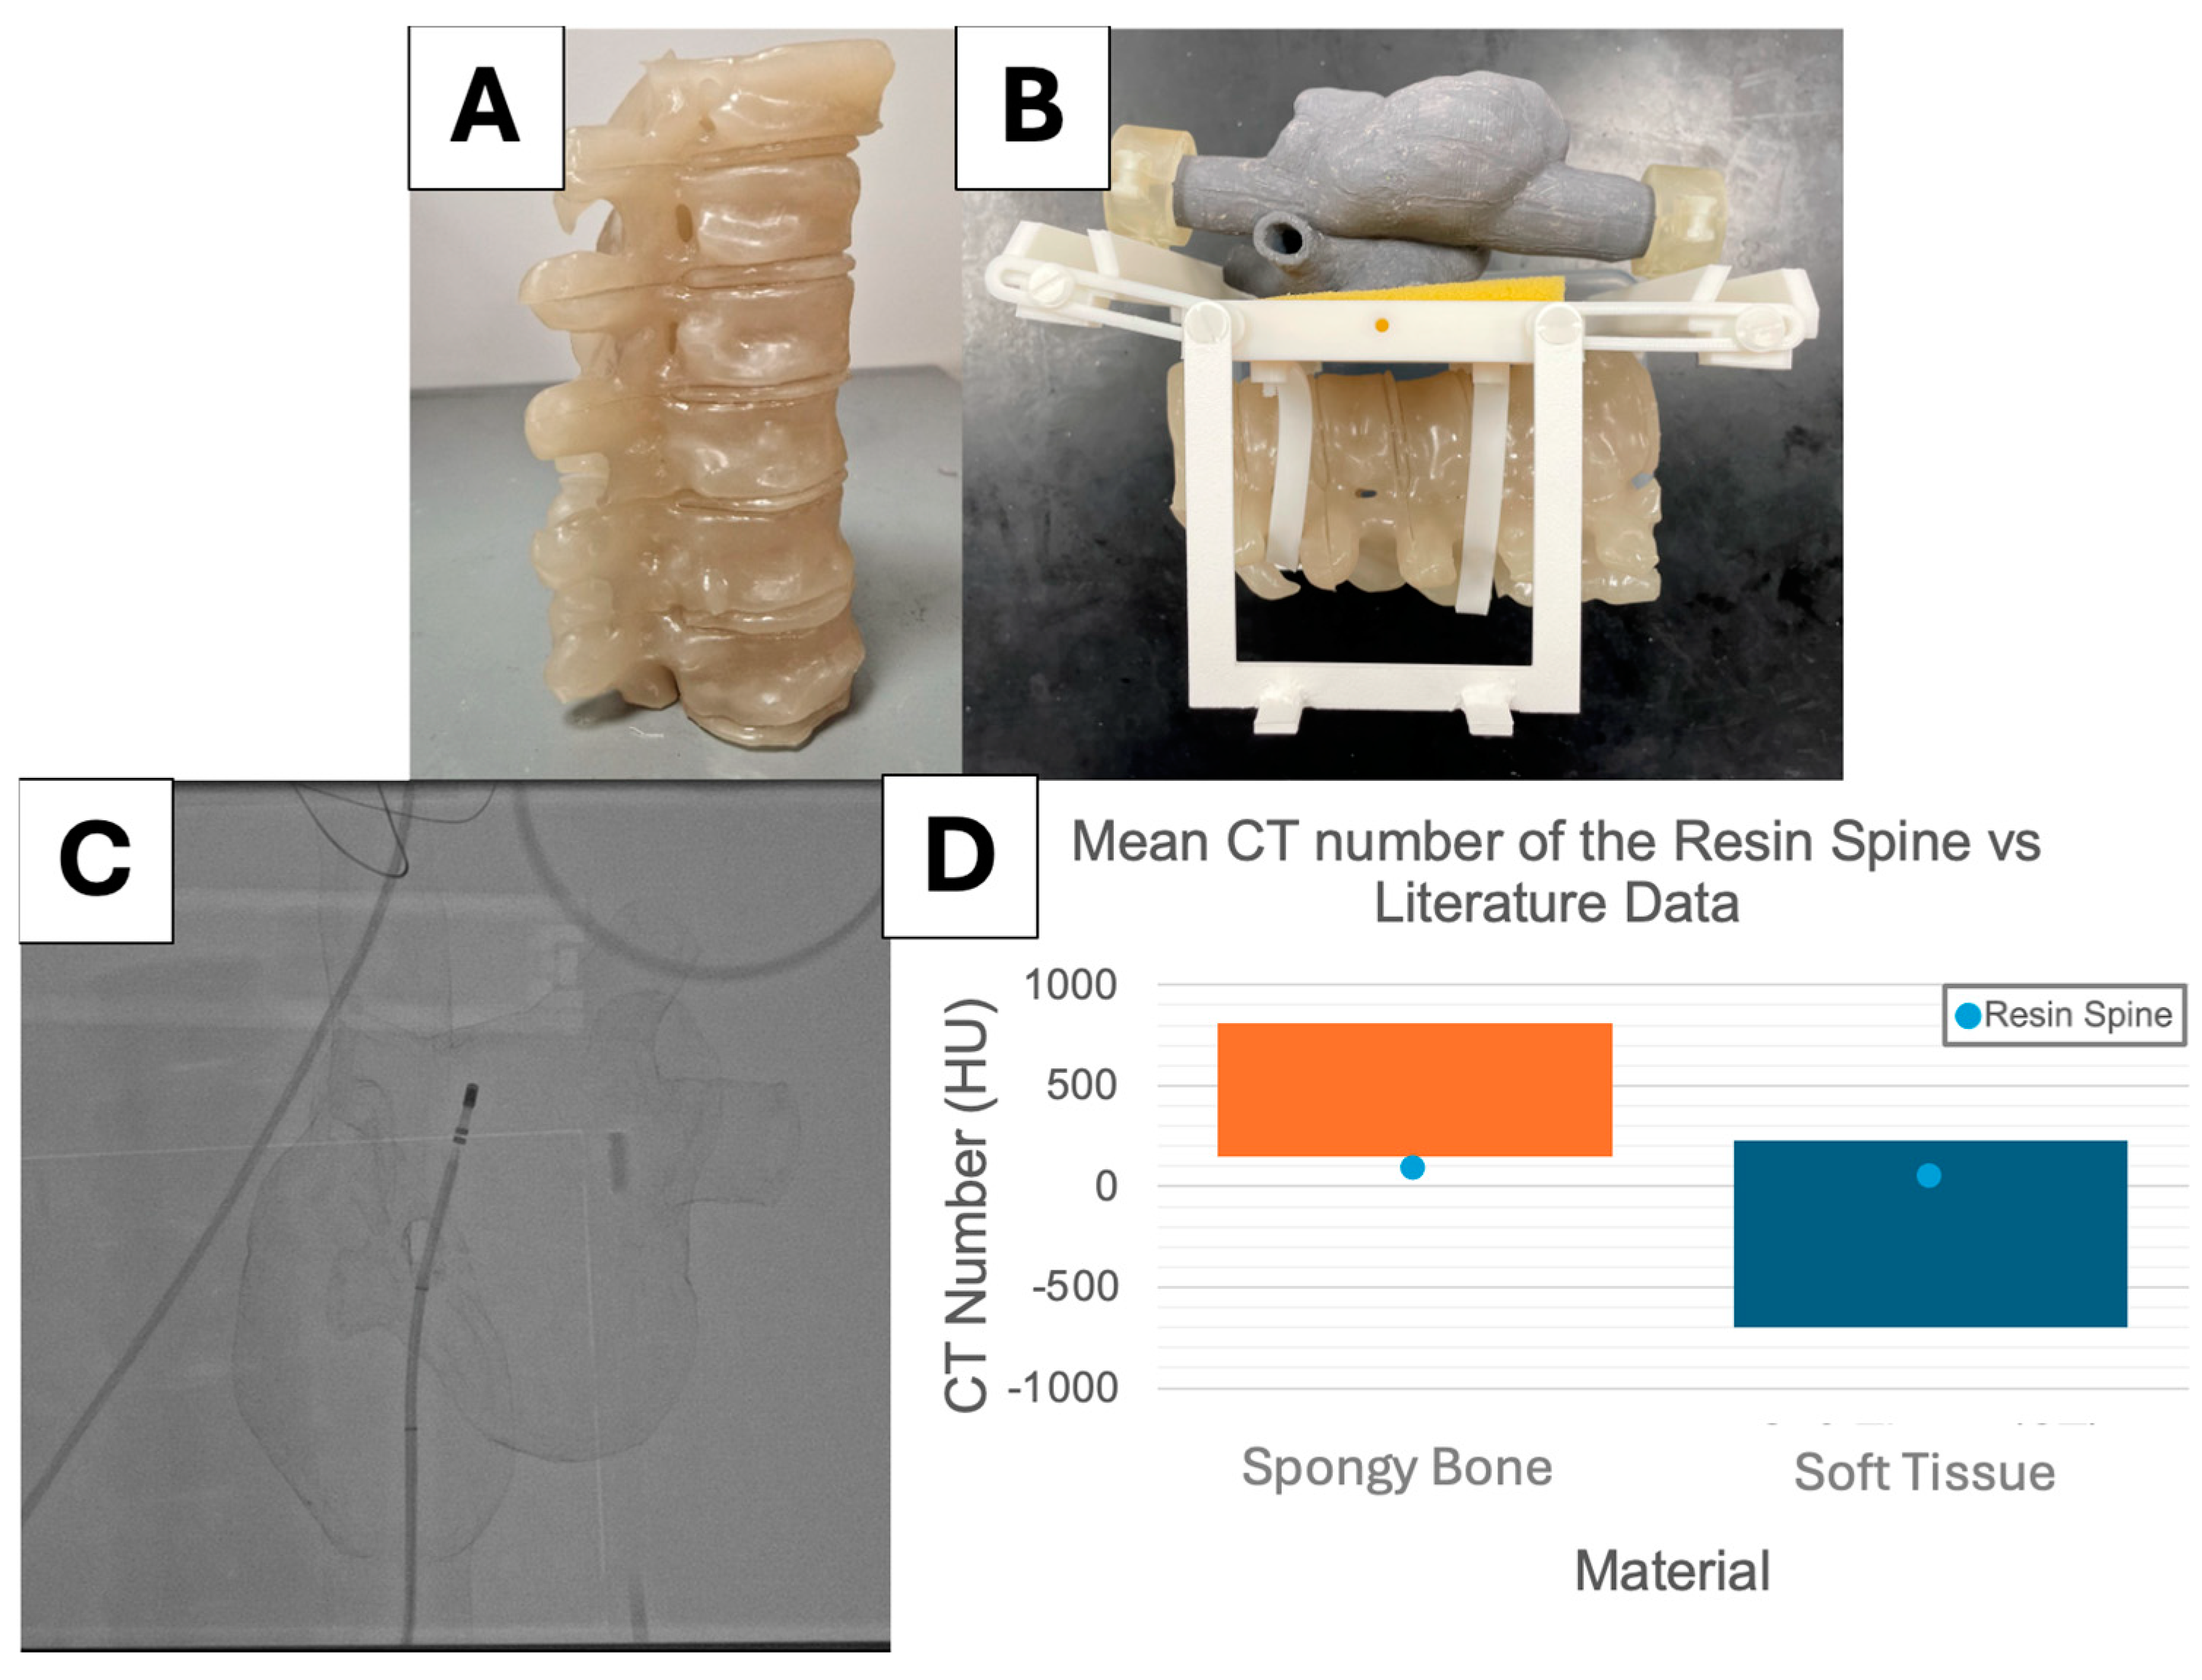
To improve radiographic appearance, an X-ray-visible spine was designed, manufactured, and bolted under the base centerpiece. The design was based on anonymized patient CT data. Thoracic vertebrae T4-T9 and their intervertebral disks were segmented and turned into stereolithography (STL) files for VP 3D printing (Figure 2A). Anycubic Basic Clear resin was doped with CaCO3 and BaSO4 to make the material more radiopaque. The mass attenuation coefficient (MAC) of Anycubic Basic Clear Resin was estimated using the material data sheet [17] and MAC of chemical elements at 80 keV [18]. Similarly, the ideal MACs of BaSO4 and CaCO3 were calculated based on their chemical compositions. To simulate the radiopacity of different tissues during fluoroscopy, the MACs of cortical bone and soft tissue at 80 keV were matched. Subsequently, 20.178 g of BaSO4 was added to 1 kg of resin to simulate cortical bone, while 56.340 g of CaCO3 was added to 1 kg of resin to simulate soft tissue. The literature reports that the average thoracic vertebra is made of 82.87% soft tissue and 17.13% cortical bone by mass [19]; consequently, soft tissue and cortical bone resins were mixed in that ratio to simulate vertebral bone. Thoracic vertebrae T4 to T9 were VP 3D printed using vertebral bone resin (Figure 2B). Soft tissue resin was used to VP 3D print the intervertebral disks.
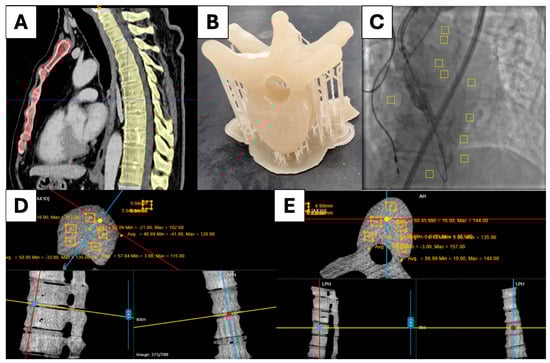
Figure 2.
(A) Segmented CT scan of the ribcage. (B) VP-printed resin vertebra. (C) Fluoroscopy contrast analysis. (D) CT analysis of the resin intervertebral disks. (E) CT analysis of the resin vertebrae.
The experimental simulator was scanned using the Artis Q Biplane C-Arm (Siemens, Munich, Germany) in cone beam CT mode, and 540 voxels were analyzed for each resin vertebra and each disk, to be compared against values in the literature (Figure 2D,E). The simulator was imaged using fluoroscopy with the Artis Q C-Arm. Five samples of 400 pixels were analyzed from the vertebrae and five samples of 400 pixels were analyzed from the background. The same procedure was repeated for anonymized patient data (Figure 2C). Percentage contrast was calculated and compared.
2.3. Electrical Resistivity
To reliably recreate the electrical systems of RCA, the phantom material must have comparable electrical properties to myocardial tissue. Electrical resistivity is the empirical ability of a material to oppose electrical current [20]. It is calculated by measuring the resistance of a material sample, dividing by its cross-sectional area, and multiplying by its length. Its inverse is electrical conductivity [20].
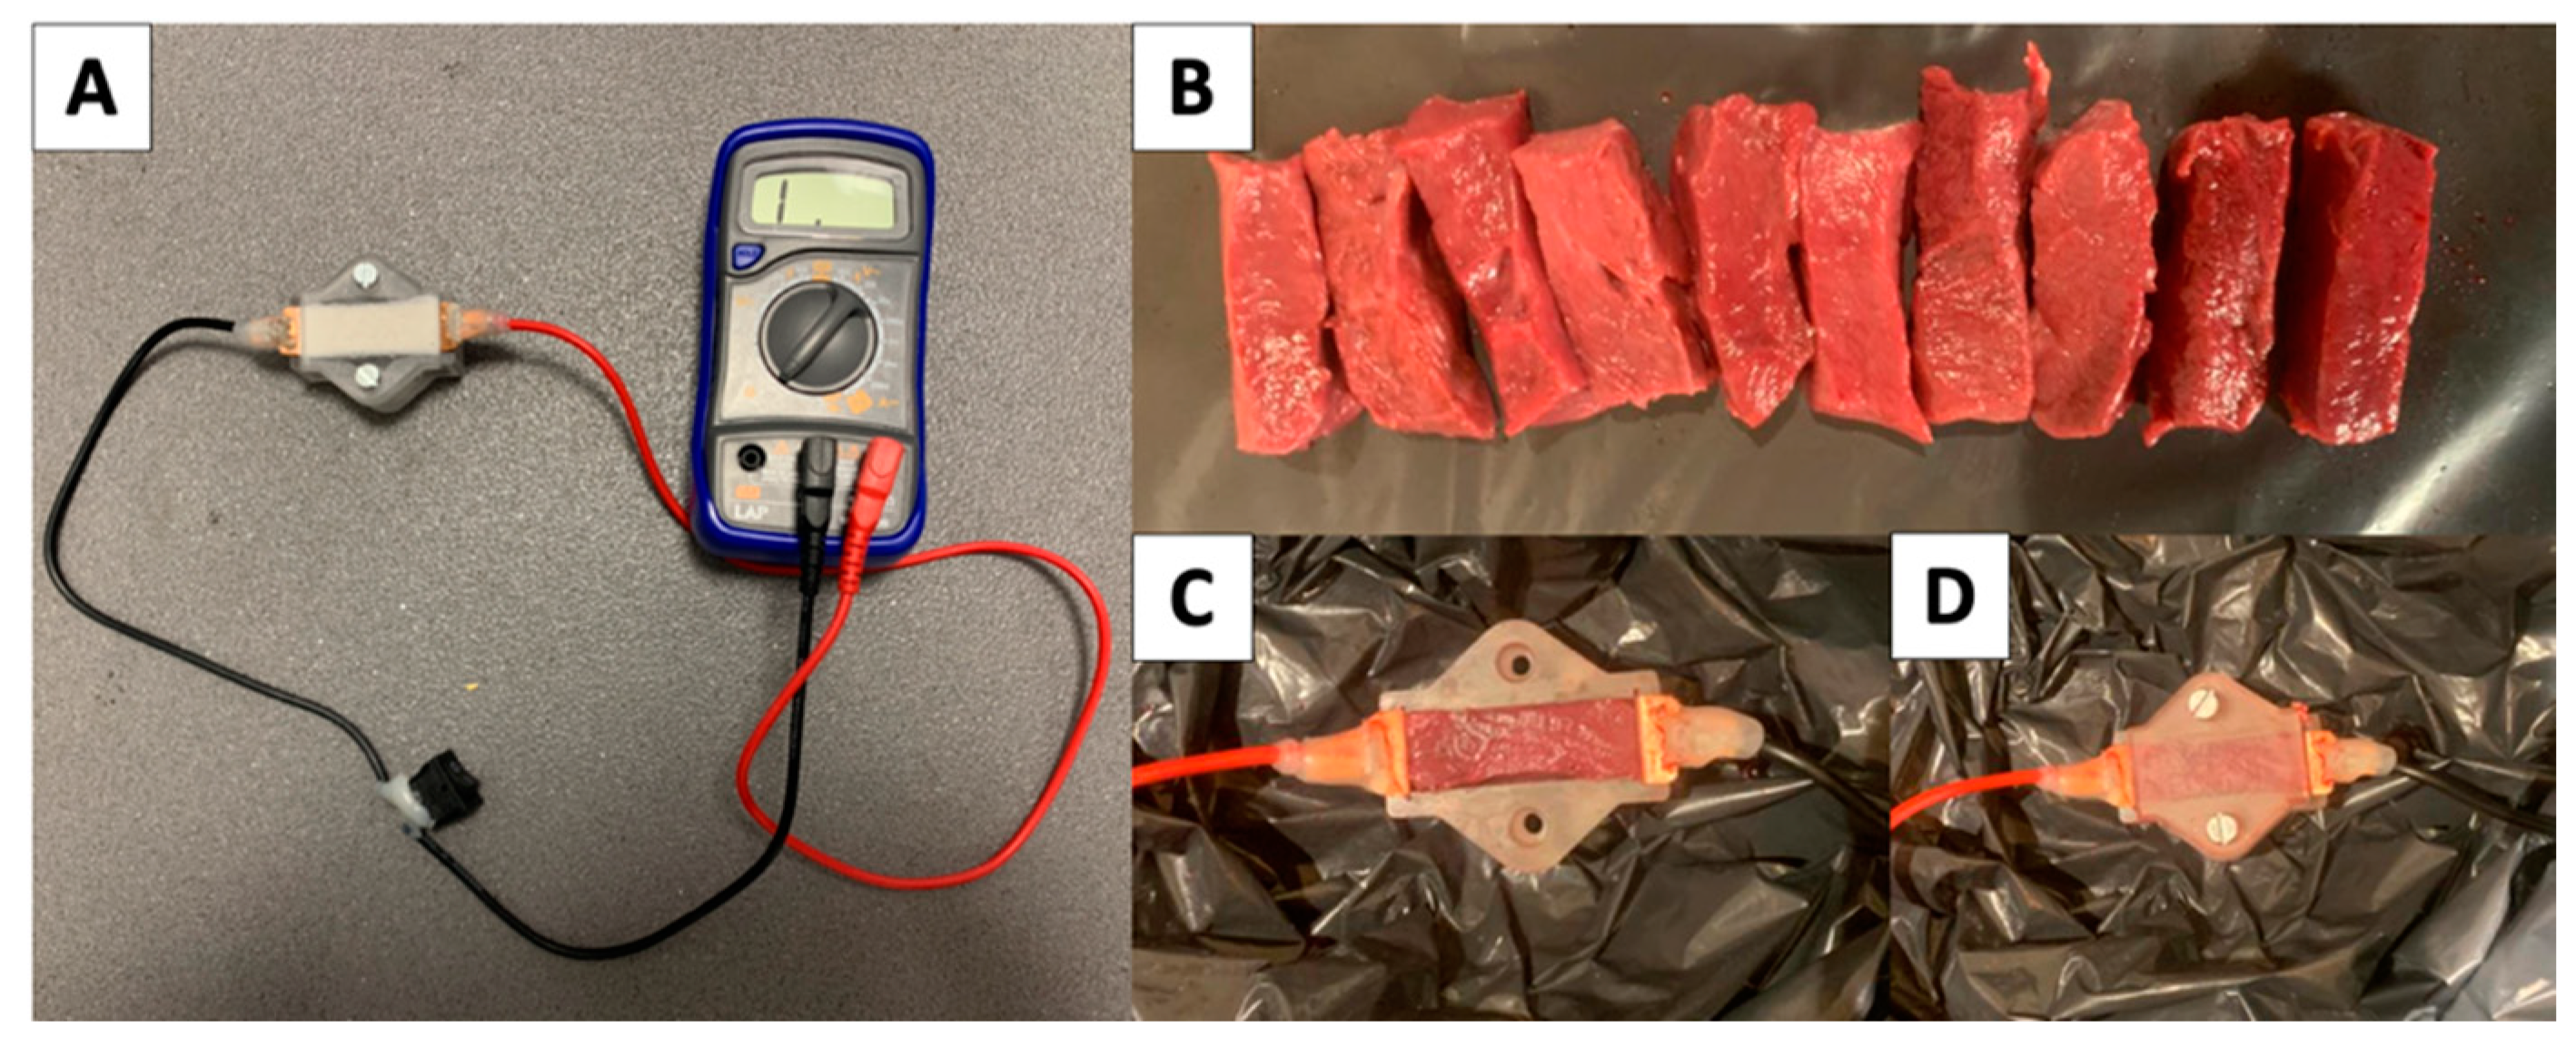
Following methods described by S. Wang et al. [13], 3 mm Layfomm40 slices were FDM 3D printed and painted. Slices were then soaked for 24 h in saline at different concentrations. Five slices were packed in a volume-constrained resin box (45 × 15 × 15 mm) hosting 0.5 × 15 mm square copper electrodes on either side (Figure 3A). The electrodes were connected to a multimeter to measure electrical resistance. Five samples were recorded for each of the following saline concentrations: 0.45%, 0.9%, 1.35%, 1.8%, 2.5%, and 4%. As a control, the experiment was repeated for 10 samples of porcine myocardium (Figure 3B–D), acquired from the heart ventricles of pigs slaughtered 3 days prior and stored at 4 °C. Two outliers were identified among the samples of porcine myocardium using the quartile method on MATLAB with the inbuilt function “isoutlier”. These two outliers were removed from further calculations.
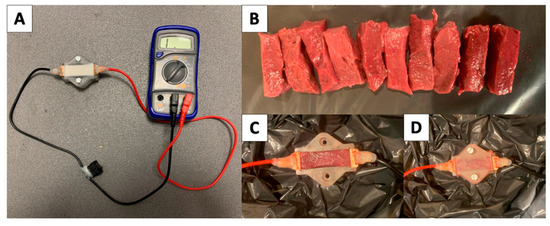
Figure 3.
(A) Resistivity testing setup. (B) Slices of ventricular porcine myocardium. (C,D) Porcine myocardium loaded in the system.
The electrical resistivity of all Layfomm40 samples were compared to the porcine myocardium using a two-tailed, unpaired, multi-variance t-test on MATLAB, using inbuilt function “ttest2” at 5% significance level.
2.4. System Impedance
An inflated tube phantom, with a wall thickness of 3 mm and an oval opening on the side, was printed in Layfomm40, painted, and soaked in 1.35% saline for 24 h following methods described by S. Wang et al. [13]. The simulator tank was filled with 37.0 °C water to a depth of 23.5 cm, and the phantom was secured on the base using the clamps, as shown in Figure 4A–C. A Valleylab Return Patient Electrode Radiofrequency Dissipative Patch (blue patch) (Covidien, Dublin, Ireland) was clipped to the tank, and the unidirectional Thermocool SmartTouch Unidirectional Navigation Catheter (NAV-ST) (Biosense Webster Inc., Irvine, CA, USA) was connected to the SMARTABLATE Radiofrequency Generator (Biosense Webster Inc., Irvine, CA, USA). Salt was added to the tank, progressively increasing the saline concentration (0.1%, 0.2%, 0.25%, 0.3%, 0.4%, 0.5%, 0.6%, 0.7%, 0.8%, and 0.9%). At each salinity interval, baseline impedance was sampled 5 times at different locations in the phantom.

Figure 4.
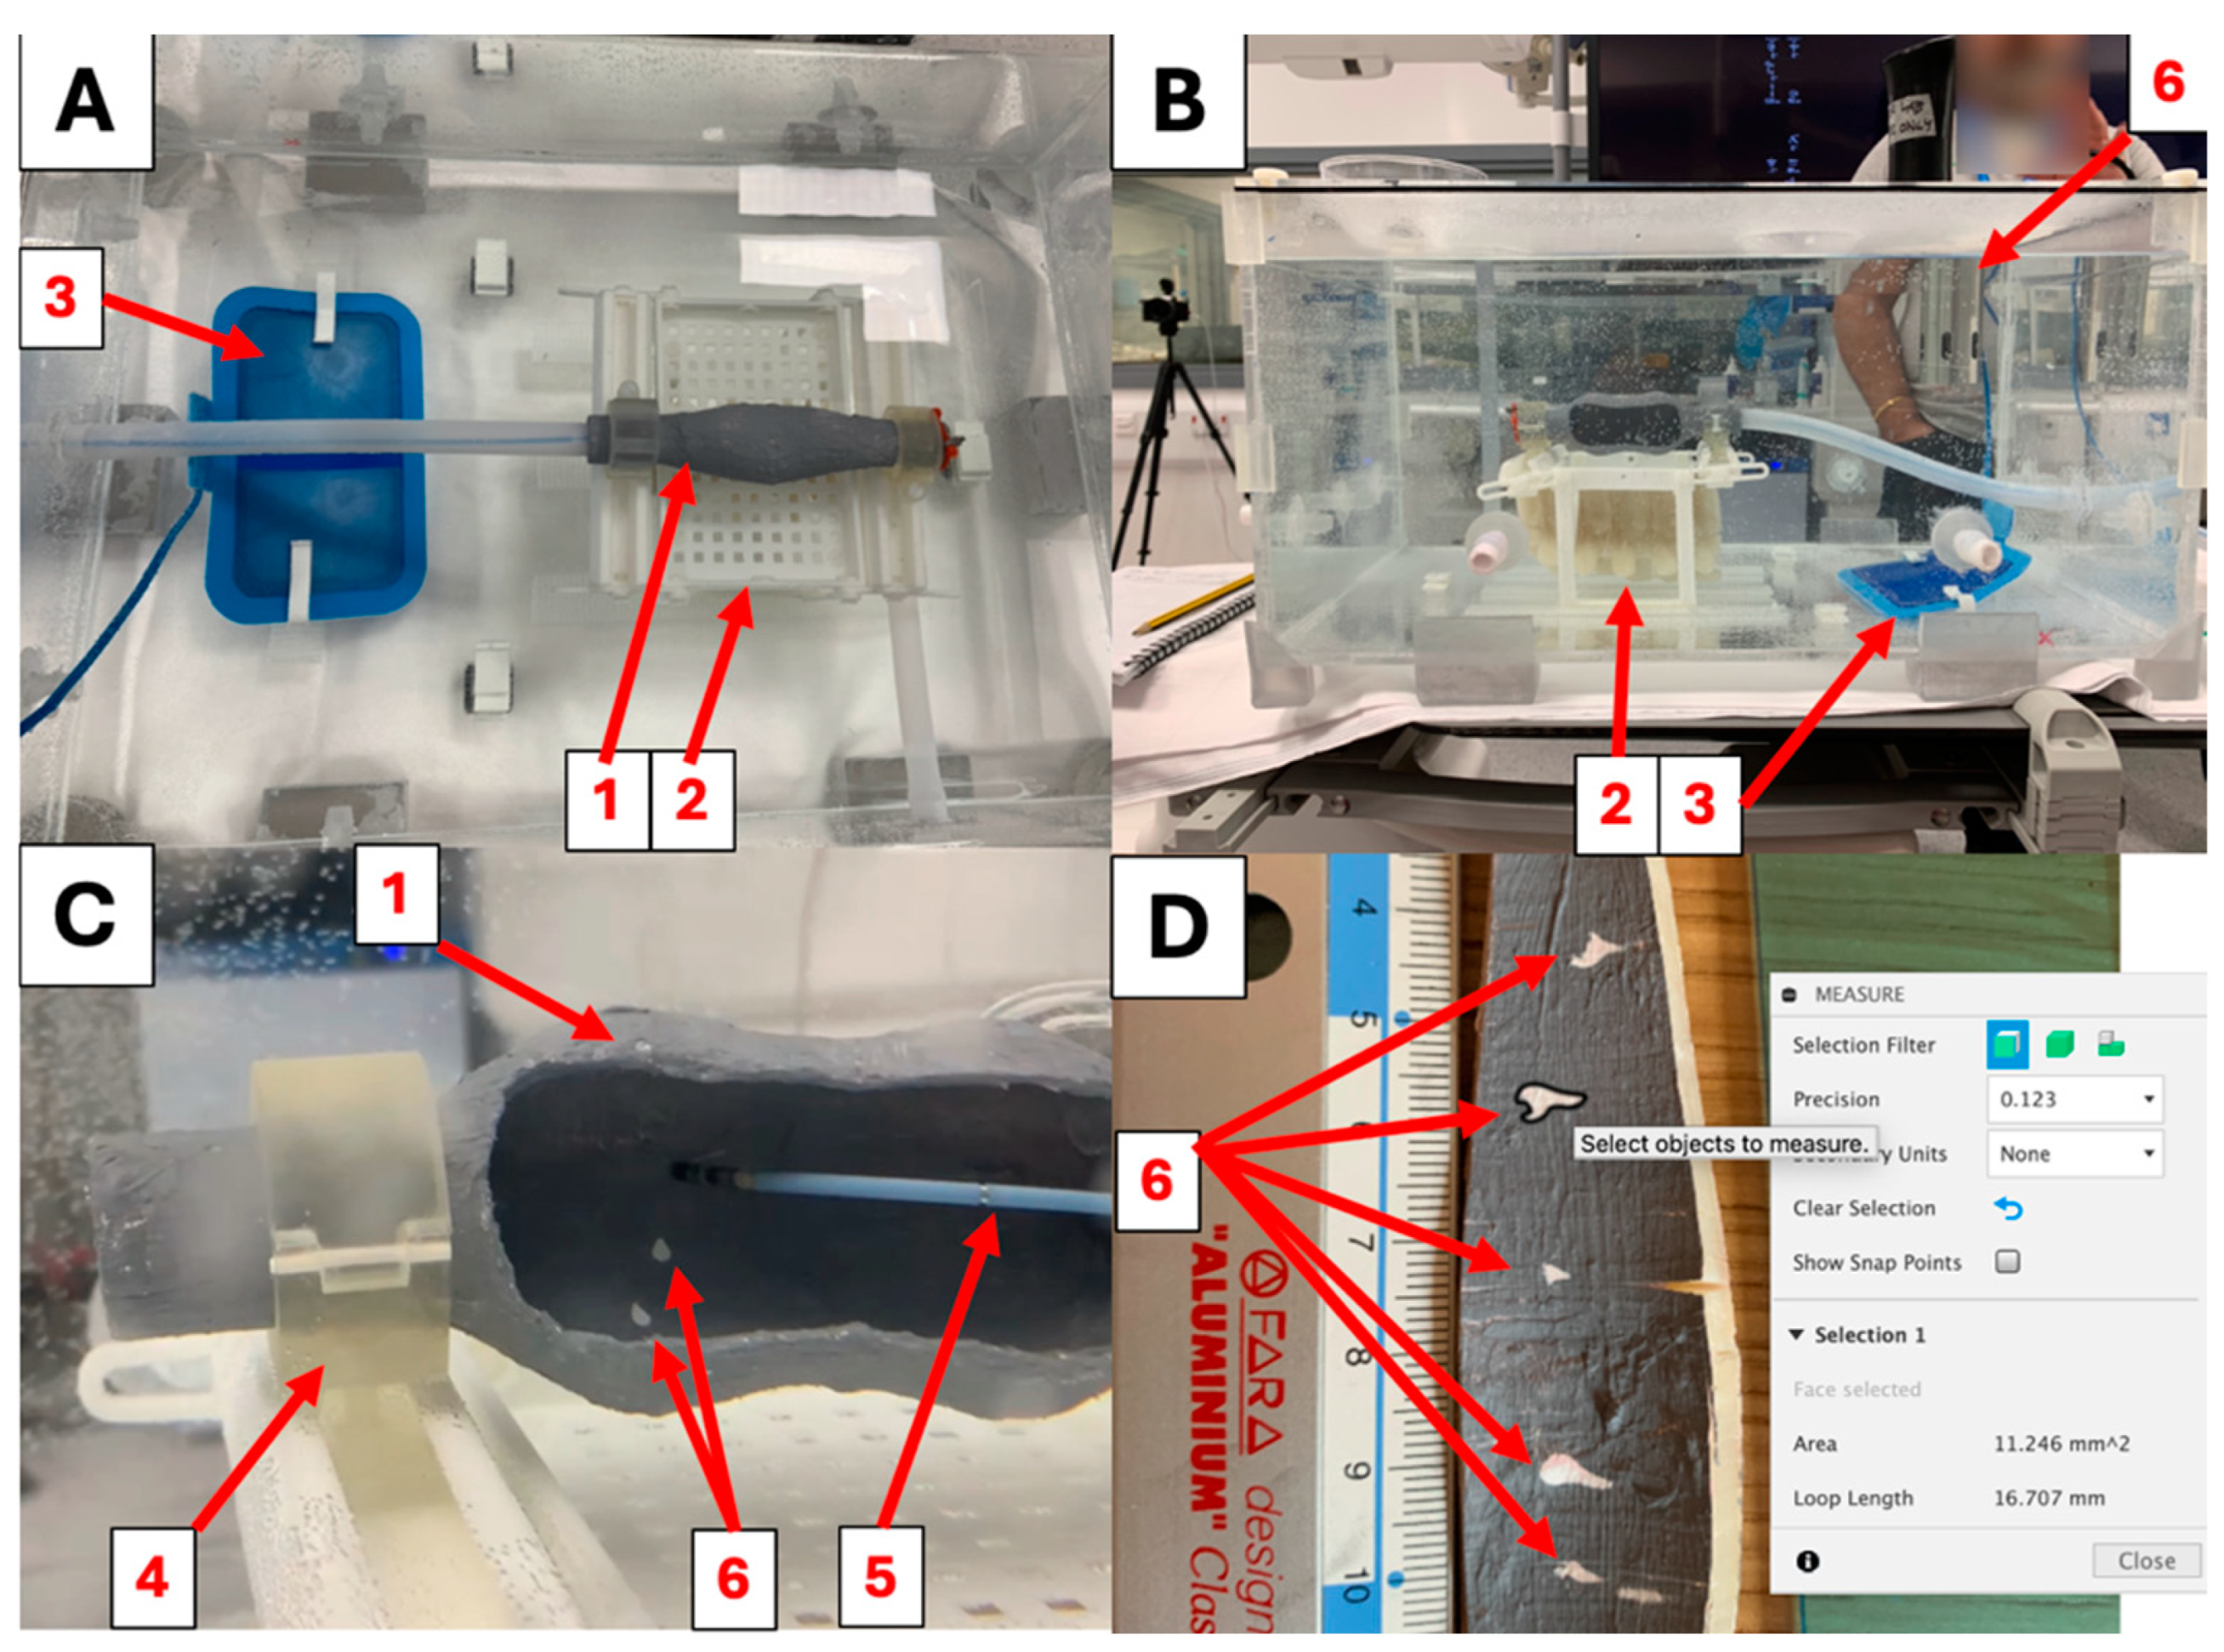
(A,B) The test phantom (1) was clamped in place on the base (2) to record impedance and perform ablation lesions (6). The tank was filled with saline; its temperature was maintained at 37 °C using a thermostat. The blue grounding patch (3) was placed inside the saline, ensuring a secure electrical connection to the radiofrequency generator throughout the simulations. (C) The open test phantom (1) is held by the clamps (4). The Thermocool SmartTouch SF catheter (5) was used to probe system impedance and perform ablation lesions (6). (D) Fusion 360 was used to digitally measure the surface area of each ablation lesion (6).
2.5. Ablation Settings
Three test phantoms were prepared and set up as described in the system impedance investigation. In this experiment, three test phantoms were soaked in 1.35% saline for 24 h and placed in the tank. The simulator was filled with 0.25% concentrated saline and heated to 37 °C (Figure 4A,B). Five RCA lesions were performed on the posterior wall, the lateral wall, and the anterior wall using the unidirectional ThermoCool SmartTouch SF ablation catheter (Biosense Webster Inc., Irvine, CA, USA), as shown in Figure 4C. Their surface areas were measured digitally using Fuion360, as shown in Figure 4D. The process was repeated for the three ablation settings illustrated in Table 1.

Table 1.
The settings used to ablate the open test phantoms. Five ablation lesions were performed on each side.
2.6. Clinical Evaluation
The Heartroid simulator was set up as per manufacturer instructions. The experimental simulator was set up as shown in Figure 5A–C, with a 3 mm thick biatrial thermochromic phantom with the same internal geometry as that used by S. Wang et al. [13]. The ablation catheter was placed inside of the CARTO VIZIGO™ Bi-Directional Guiding Sheath (Biosense Webster Inc., Irvine, CA, USA) and used for mapping and ablation during the simulations. Seven operators at different levels of experience (4 on Heartroid and 3 on the experimental simulator) were each granted one hour to enter tools into the right atrium, map the chamber, pass tools across the atrial septum, map the left atrium, and perform ablation lesions in the pattern of pulmonary vein isolation. The experimental simulator was ablated using the HPI settings from Table 1, and the power was lowered to 4 W for the Heartroid. Operators answered a questionnaire (24 questions) to evaluate the performance of the simulators for atrial CA training. The survey was separated into sections assessing “catheter entry”, “phantom geometry”, “X-ray appearance”, and “mapping and ablation”. Operators were free to answer or omit any questions, scoring each aspect on a Likert scale from 1 to 5. Scores from each section were compared using a two-tailed unpaired t-test at 5% significance.
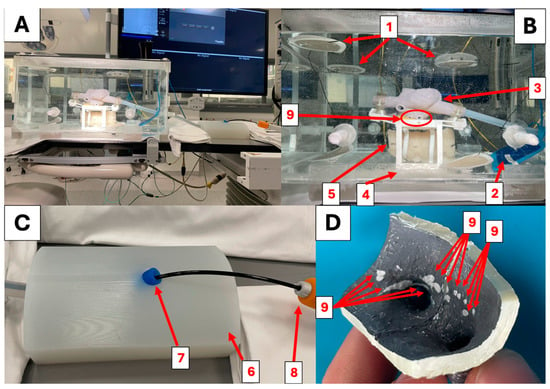
Figure 5.
(A,B) The experimental simulator set up for atrial ablation. The six external reference patches (1) are hooked to the lid and to the bottom of the tank, placing them in contact with the saline. The blue grounding patch (2) is placed on the posterior inferior side of the tank, simulating placement on the lower back. The biatrial cardiac phantom (3) is secured to the base, and its position can be adjusted using the locking system (4). The spine phantom (5) is held posteriorly to the cardiac phantom in the anatomical position. Ablation lesions are performed on the pulmonary veins (right lower pulmonary vein (9)) following the patterns of polmunary vein isolation. (C) The experimental simulator’s catheter entry block (6) uses a silicone hemostatic valve (7) to host the Vizigo steerable sheath (8). (D) A portion of the experimental simulator’s biatrial phantom. The segment comprises the right lower pulmonary vein and the surrounding ablation points (9).
3. Results
3.1. X-ray Visibility
The spine phantom was comprised the thoracic vertebrae T4-T9 and could be mounted underneath the heart phantoms on the base (Figure 6A,B). The MAC of Anycubic Basic clear resin was calculated to be 0.1787 cm2/g. The MACs of BaSO4 and CaCO3 at 80 keV were calculated to be 2.4134 cm2/g and 0.2462 cm2/g, respectively. The average CT number for the thoracic vertebrae was 92.8 ± 10.5 HU, whereas, for the disks, it was 47.6 ± 9.4 HU. The literature reports that spongy bone has a CT number between 148 and 661 HU, while soft tissue has a CT number between −700 and 225 HU, as displayed in Figure 6D. The heart, the spine, and the transeptal hole were visible during operation, though the spine lacked the darker outline of cortical bone that is visible in patients. Fluoroscopy contrast of the spine was marginally higher in the simulator when compared to patient images, as shown in Table 2. Unlike real vertebrae, the phantom vertebrae lack cortical bone on their borders, making the boundary less defined.
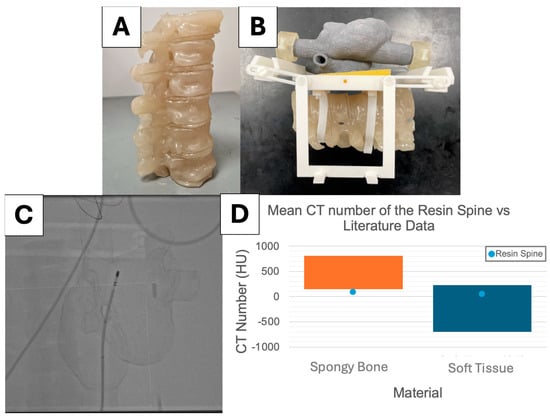
Figure 6.
(A) The final, fully assembled spine. (B) The fully assembled base with the X-ray spine phantom. (C) High-dose fluoroscopy image of the fully assembled simulator, including the spine. (D) The mean CT number acquired from the vertebrae (92.8 ± 10.5 HU) compared to spongy bone (148 to 661 HU) and the intervertebral disks (47.6 ± 9.4 HU) compared to soft tissue (−700 to 225 HU) [21].
Table 2.
Average fluoroscopy contrast between the vertebral bodies and the background.
3.2. Electrical Properties
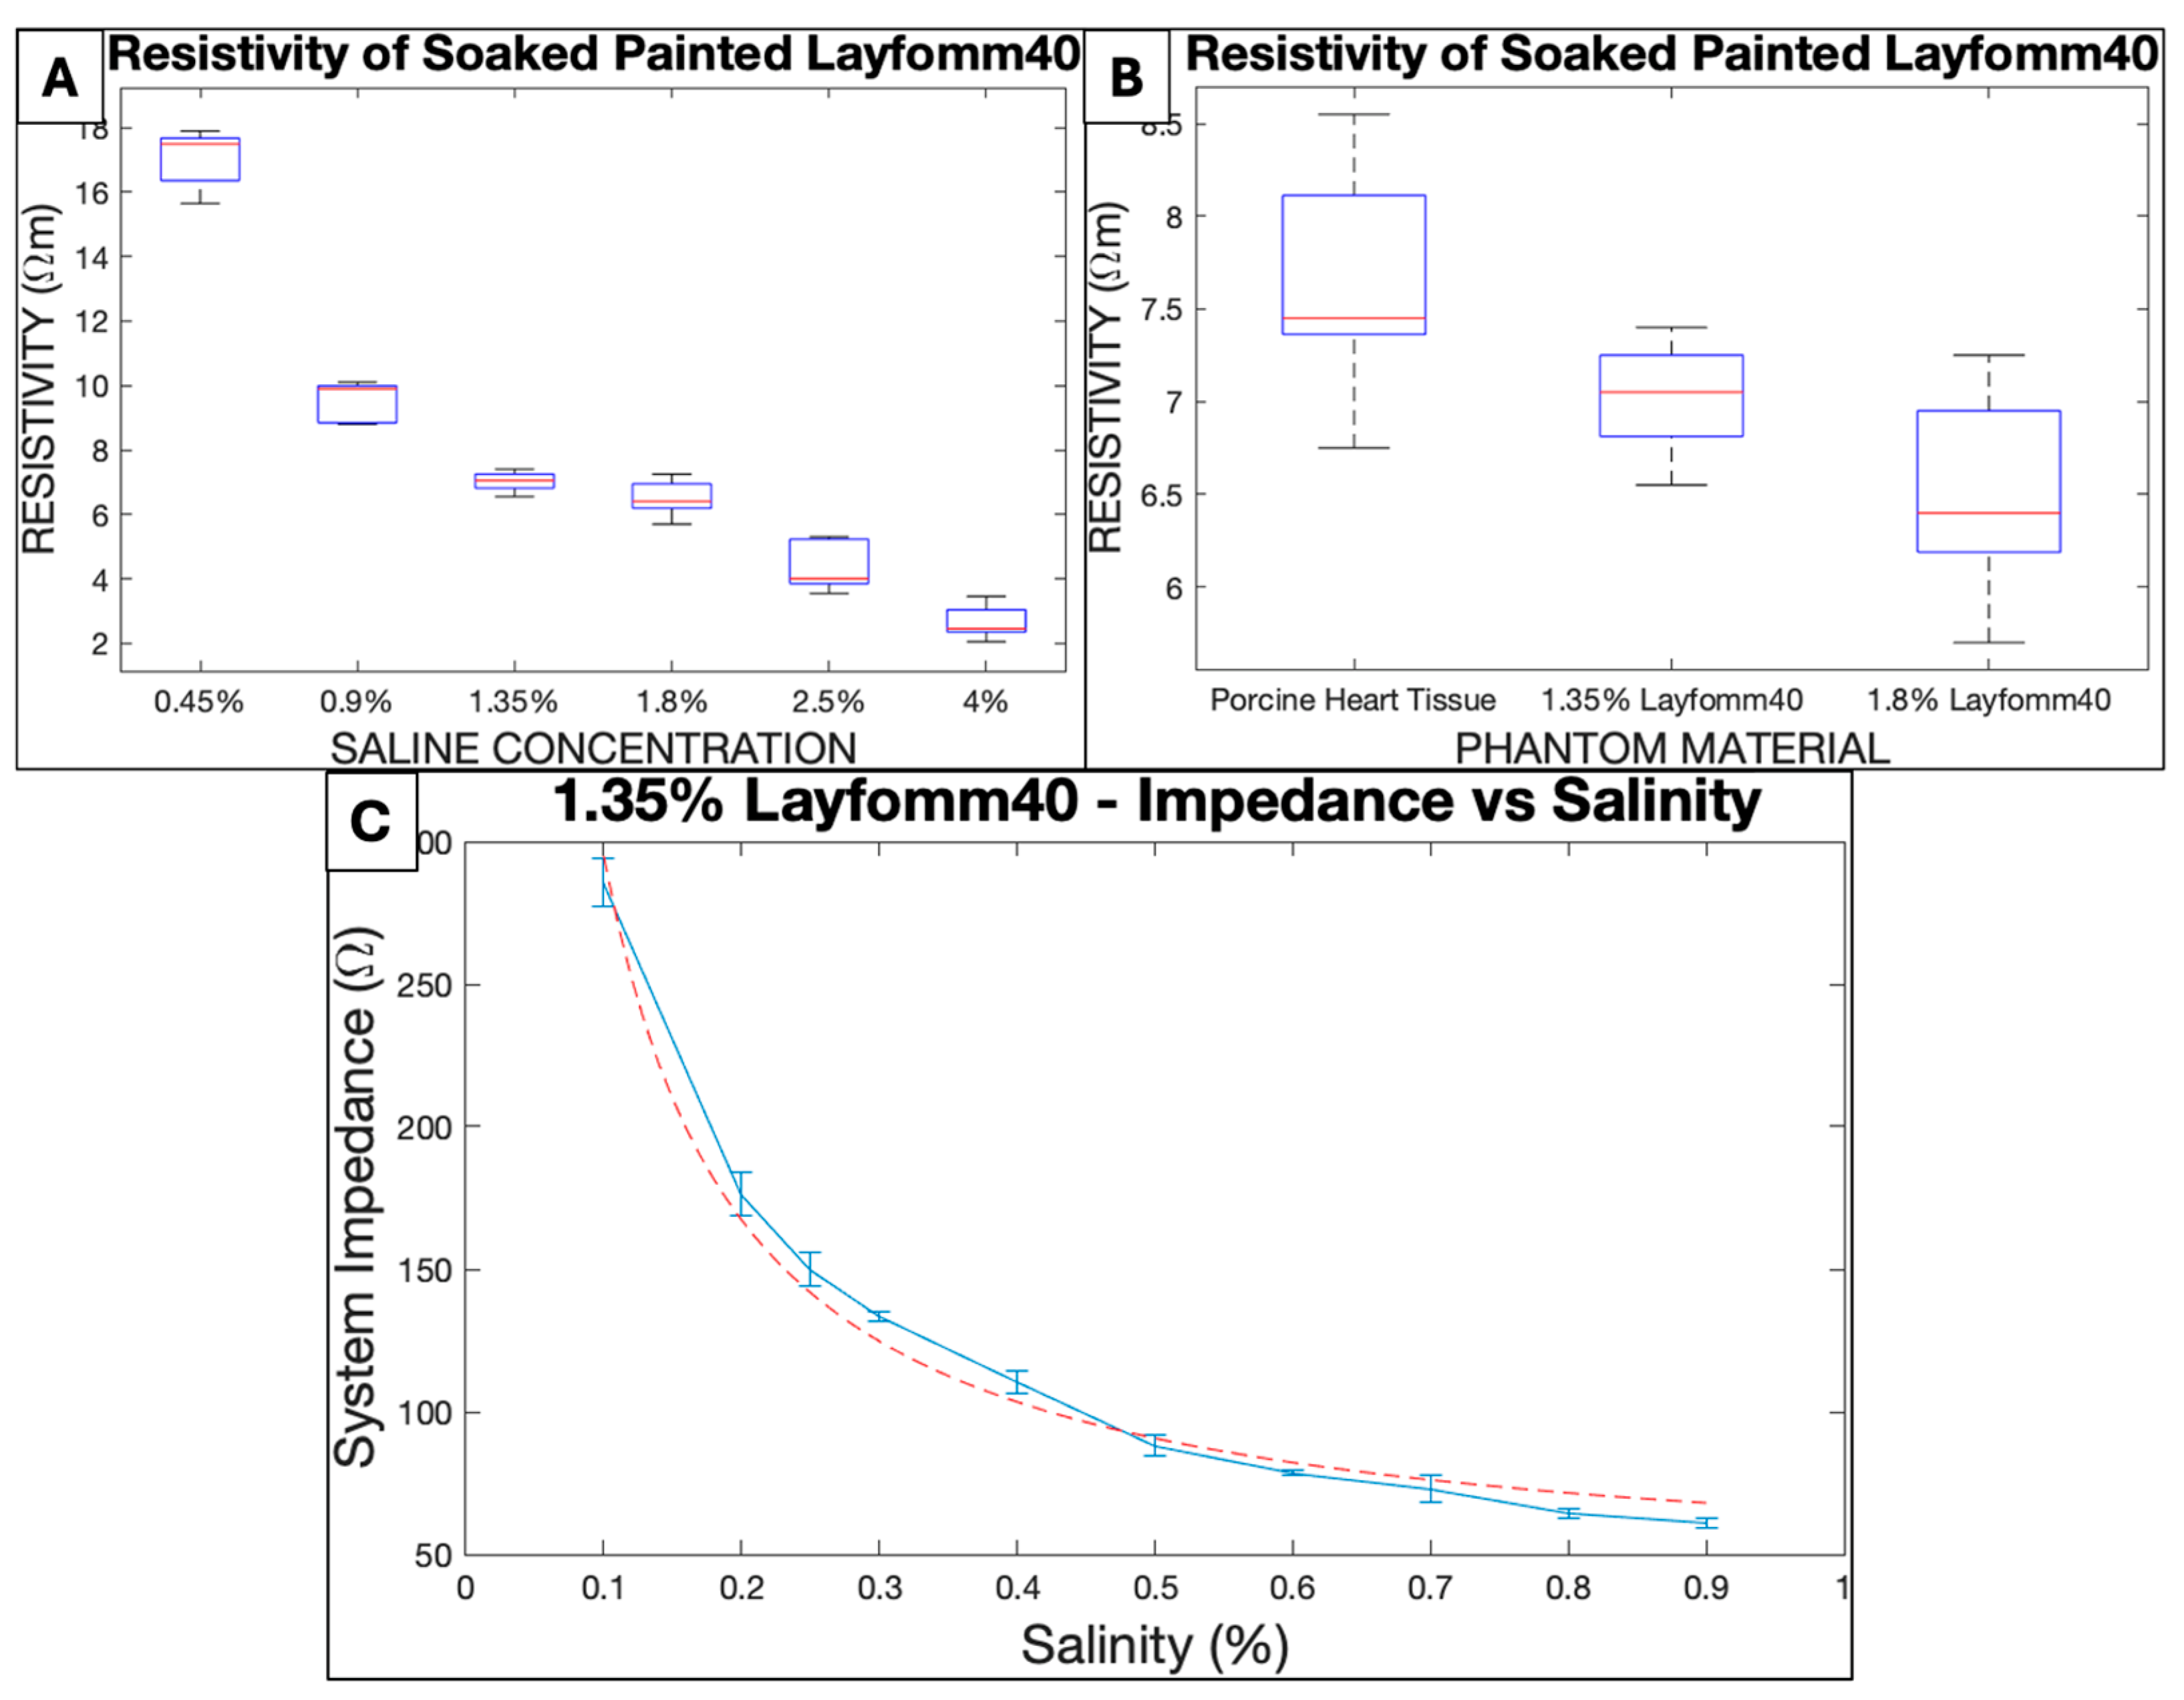
The internal resistance of the system was measured at 0.00 ± 0.00 kΩ. Figure 7A shows that samples with greater salinities showed lower levels of resistivity. The average value of resistivity measured for pig myocardium was 7.6 ± 0.6 Ωm (Figure 7B). Layfomm40 soaked for 24 h in 1.35% saline had a resistivity of 7.0 ± 0.3. It was the only salinity analyzed which showed no statistically significant difference to porcine myocardium (p = 0.0530).

Figure 7.
(A) Resistivity of stacked painted Layfomm40 slices (3 mm). (B) Resistivity of stacked painted Layfomm40 slices (3 mm) in comparison to fresh porcine myocardium. (C) The inverse relationship between system impedance and tank salinity using a painted Layfomm40 phantom (3 mm walls soaked in 1.35% concentration saline for 24 h).
M. Barkagan et al. [22] define 131–180 Ω to be the intermediate impedance for RCA simulations, and 90–130 Ω to be low impedance. Figure 7C shows that impedance and salinity followed an inverse relationship. Intermediate impedance was consistently achieved when the tank was filled with 0.25% saline (impedance = 150.0 ± 5.8 Ω). A tank salinity of 0.4% (110.4 ± 4.2 Ω) consistently achieved values of low impedance.
3.3. Ablation Lesions
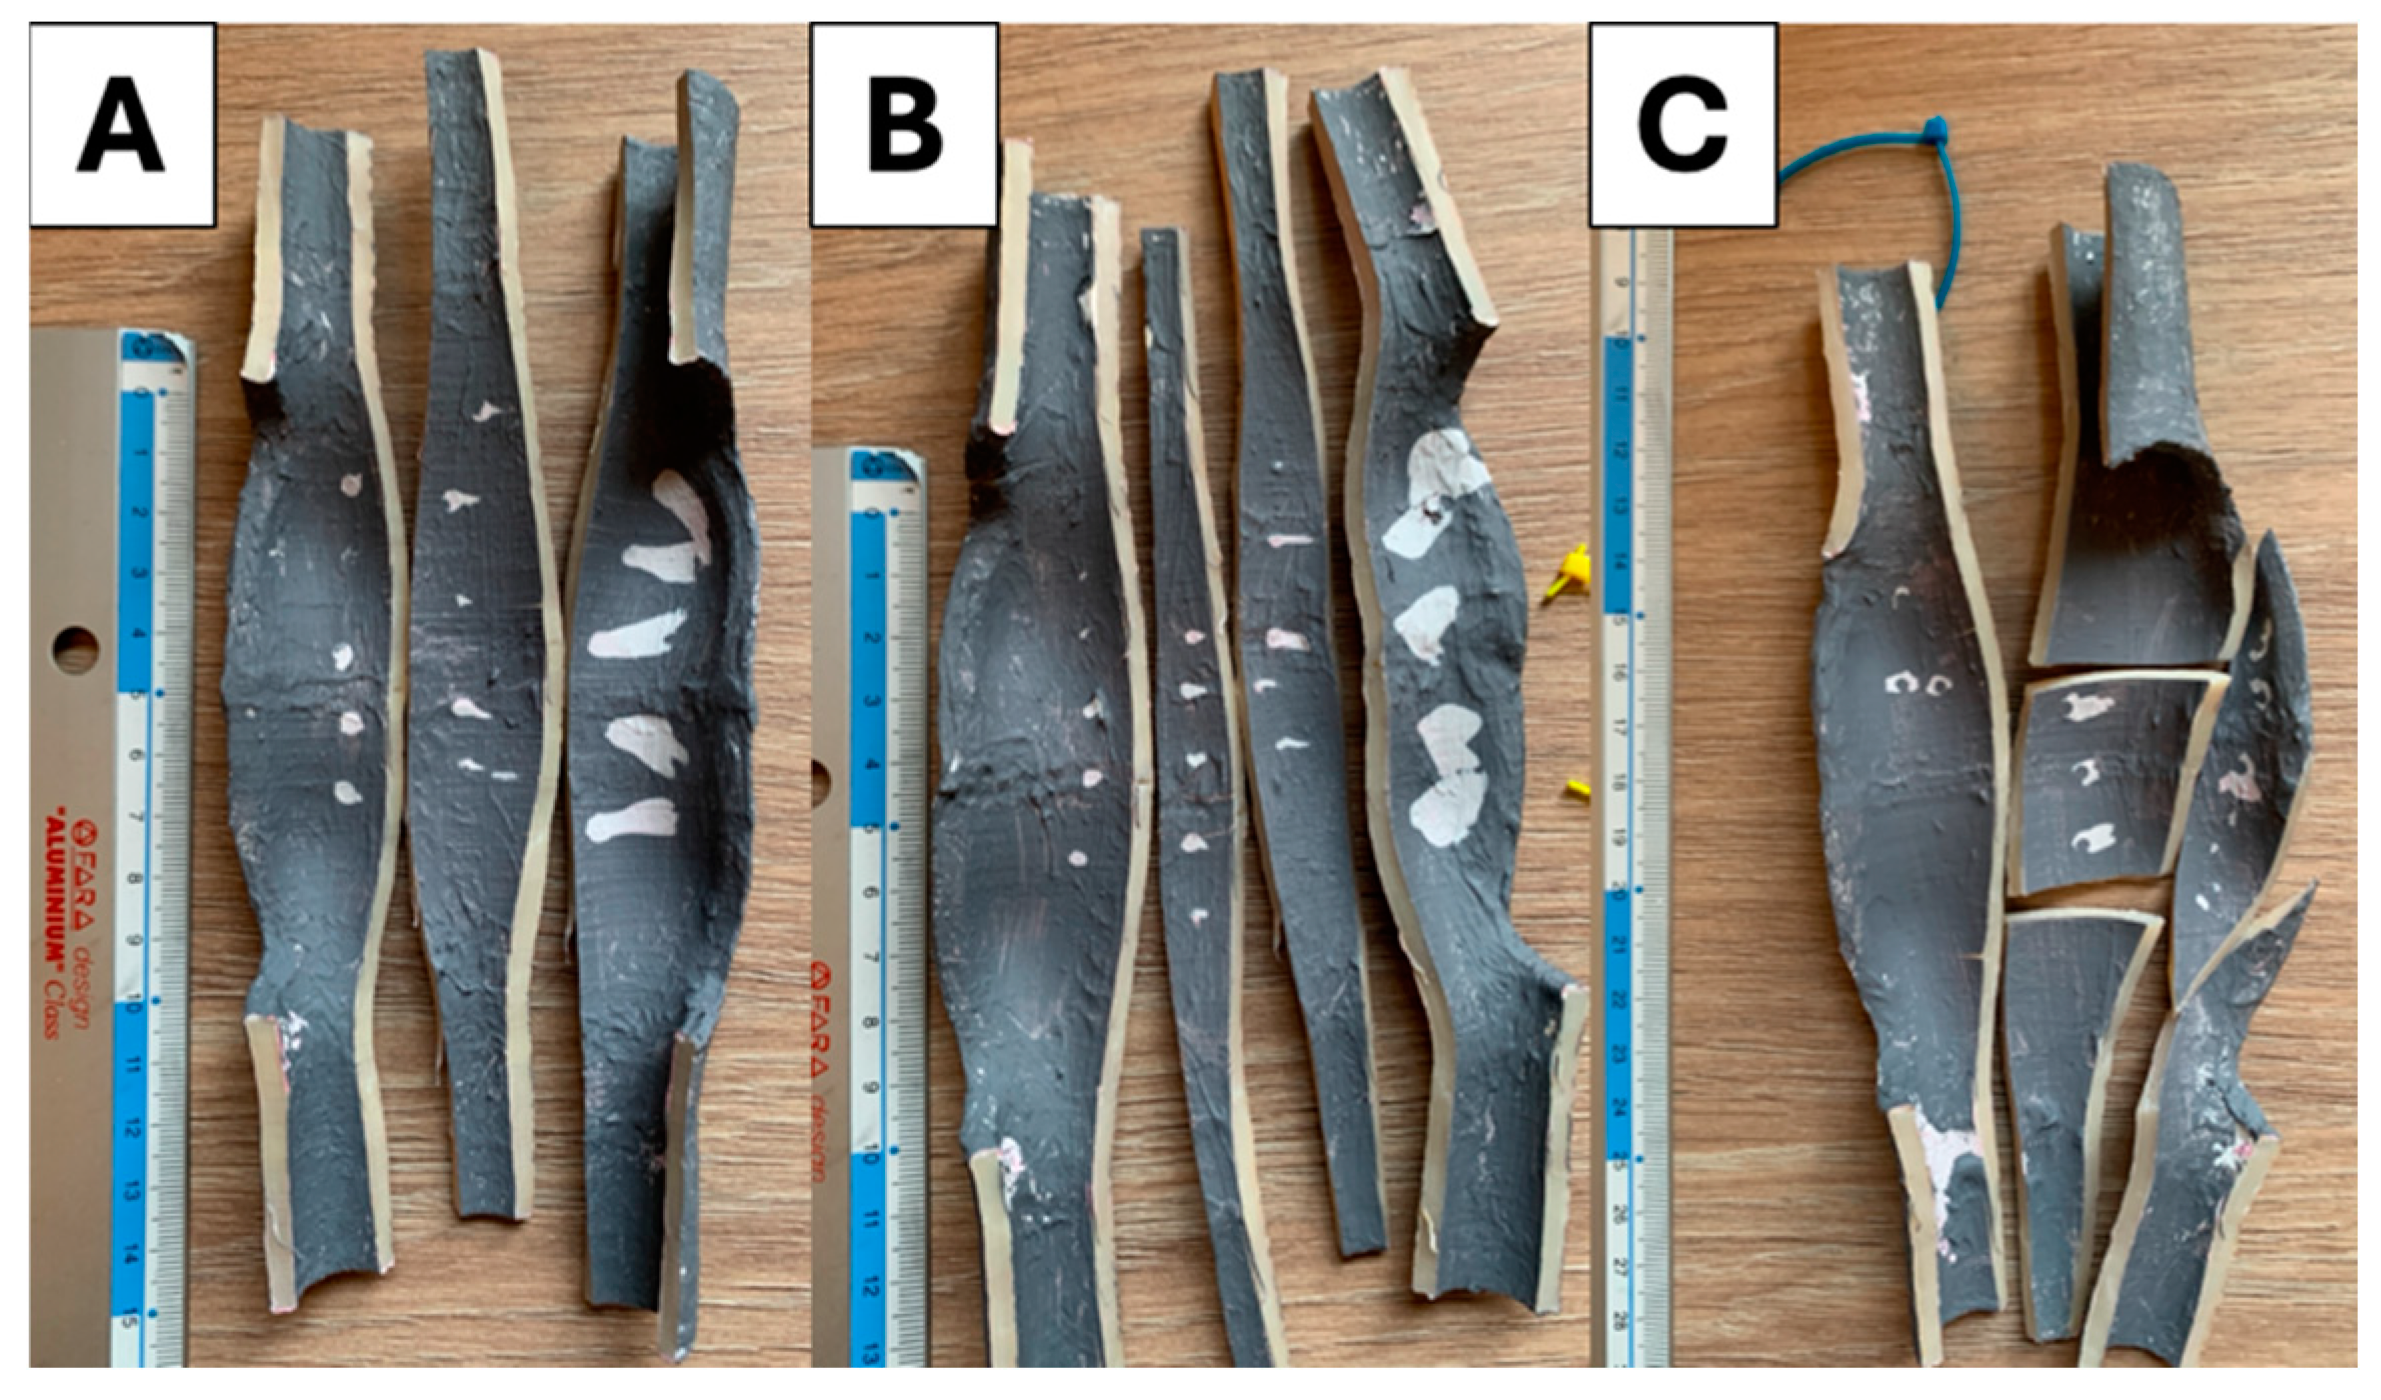
As noticeable in Figure 8, the lateral and anterior lesions became progressively more streaked. Figure 8C shows that the 45 W Lower Power Irrigated (LPI) settings produced small, unreliable lesions that were often undetectable post ablation. The 45 W Lower Power Non-Irrigated (LPNI) settings produced lesions with areas of 4.1 ± 2.7 mm2, 5.6 ± 2.5 mm2, and 86.5 ± 22.4 mm2 on the posterior, lateral, and anterior walls of the phantom, respectively. The 75 W Higher Power Irrigated (HPI) settings produced lesions with areas of 12.1 ± 1.1 mm2, 8.7 ± 3.5 mm2, and 69.4 ± 9.3 mm2 on the posterior, lateral, and anterior walls of the phantom, respectively. As shown in Figure 8A,B, the shape of the anterior lesions achieved with HPI settings are more streaked than those observed with LPI settings, showing the original point of contact with the catheter.

Figure 8.
Ablation lesions from posterior to anterior (left to right). (A) Ablation lesions performed at 75 W Higher Power Irrigated settings. (B) Ablation lesions performed at 45 W Lower Power Non-Irrigated settings. (C) Ablation lesions performed at 45 W Lower Power Irrigated settings.
3.4. Clinical Evaluation
Answers to the questionnaire showed that the two simulators performed similarly in all fields except for X-ray imaging (Table 3). Operators were able to perform more ablation lesions on the Heartroid simulator on average; however, the difference was not statistically significant. On multiple occasions, comments reported that the experimental cardiac phantom felt too hard on the catheter, while the Heartroid phantom felt too large. One user reported that the catheter “fell too” easily into the transeptal holes during mapping of the right atrium when trying the commercial system.
Table 3.
Performance of the experimental simulator compared to the commercial state-of-the-art system.
Table 4 shows that the experimental heart sustained heat during ablation, while the Heartroid had to be maintained at lower temperatures to avoid damage. Both systems showed impedance drops during the ablation tests and maintained realistic levels of impedance while delivering ablation.
Table 4.
Electrophysiological ablation outcomes achieved from 15 ablation points performed on the simulators. The experimental simulator was ablated using the HPI settings. The Heartroid simulator was ablated using the HPI settings with the power set to 4 W.
4. Discussion
Myocardial electrical conductivity is reported to be 0.06–0.4 S/m [23,24]; therefore, the electrical resistivity derived from this range is 2.5–16.7 Ωm. The average resistivity exhibited by myocardium in this study (7.6 ± 0.6 Ωm) agrees with these literature values, thus validating the methodology. Layfomm40 soaked in 1.35% saline produced the best results, having no statistically significant difference from the control. However, resistivity values of Layfomm40 soaked with saline from 0.9% to 2.5% all fall within the literature range. During the simulations, the Layfomm40 was placed in the tank with saline at lower concentrations, meaning it would lose salinity over time and increase its resistivity. To maintain realistic resistivity for the longest duration, 1.35% saline was therefore the optimal phantom salinity. Future investigations should test the significance of change in phantom resistivity over simulation time. Intermediate impedance, as described by M. Barkagan et al. [22], was reliably achieved at 0.25% tank salinity. As higher impedance reduces lesion size [22], intermediate impedance would produce more concise ablation points than low impedance, allowing users to gauge lesion size and deduce the original position of the catheter. Consequently, 0.25% saline was chosen to fill the tank during RCA experiments involving Layfomm40 phantoms.
Experimental data show that ablation lesions created on the lateral and posterior walls were smaller (1–15 mm2) than ablation lesions generated on the anterior wall (50–120 mm2). The streaking shape of the ablation lesions suggests that this change may be caused by the thermal movement of water during ablation, resulting from the lack of flow in the system. As the water around the catheter heats up, it decreases in density and travels upwards, collecting on the top (anterior walls). Irrigation in the catheter controls temperature, resulting in smaller lesions on the anterior wall. The HPI settings produced the best results, resulting in larger lesions on the posterior and lateral walls, but smaller lesions on the anterior wall. Additionally, the streaked shape of the HPI lesions still allows the user to track the original catheter location. Though these settings produced more precise results, the shape was still affected by the movement of hot water. Future efforts should aim to eliminate this phenomenon by investigating the effects of flow, like in the Heartroid simulator, to disrupt the formation of thermal streams during ablation.
The overall scores from the questionnaire suggest that both simulators are effective and realistic training systems for CA training. The experimental simulator made effective use of 3D printing and laser cutting to improve and consolidate the methods previously proposed by S. Wang et al. [13]. The silicone leg block for catheter entry provided a useful and effective layer of realism during catheter manipulation. The two simulators compared in this study performed similarly in the field of catheter entry (p = 0.5551), with scores of approximately 4. The 3D printed phantoms in the experimental simulator provide radiographic landmarks to trainees. The sedimentation of the contrast powders during printing of the vertebrae caused the resins to exhibit a lower CT number than expected; however, the contrast of the spine was realistic against its surroundings. The vertebral phantoms aimed to recreate the average CT number of the vertebrae; future iterations should render the outlines of the vertebrae more evident by adding a layer of cortical bone. In the Heartroid simulator, the lack of radiopaque phantoms and the presence of metal components obstructing the field of view caused it to significantly underperform during X-ray imaging. The placement of patches inside the saline made the electrical connections in the experimental simulator more reliable and robust than in the Heartroid simulator, which was often subject to contact failures; however, this feature increases the costs of operation. Despite the versatility presented by the laser cut tank, its large volume (48 L) makes the assembly process more laborious and impractical. Conversely, the Heartroid system has a volume of only 6 L, making it more practical to fill and drain with saline. 3D printing was an effective manufacturing modality to replicate the geometry of the heart in both simulators. Both simulators achieved high scores in the field of phantom geometry, showing that they both have satisfactory anatomical realism to fit the needs of atrial CA training. In this field, the difference was statistically insignificant (p = 0.1709). The Heartroid had excellent geometry, containing the necessary physical landmarks for atrial and ventricular CA, whereas the experimental phantom was only adapted to atrial CA. Physiologists suggested that it may be “too easy” to access the left atrium through the transeptal apertures in the Heartroid, while, in the experimental simulator, the transeptal hole was considered “too stiff” or “hard”, making it more difficult to maneuver, especially as the contact response between catheter and model is specific to the model material and the behavior of the catheter within the beating heart is observed to be different. Both of the 3D-printed phantoms could be mapped and ablated with ease; however, the higher number of ablations performed on the Heartroid suggests that it was easier to navigate through the commercial simulator. Comments indicate that this was caused by the stiffness of Layfomm40, which complicated navigation and manipulation through the transeptal hole.
The new simulator prototype proposed in this article successfully made use of the concepts previously presented by S. Wang et al. [13] to create a more realistic and reliable training system. The large tank design enabled users to place the patches in realistic positions away from the fluoroscopy field of view. As reported in the feedback, the addition of the leg phantom and the spine phantom improved the overall realism of the system. The use of the HPI setting, paired with the more realistic electrical environment inside the tank, result in a more predictable ablation outcome compared to the previous simulator prototype.
5. Conclusions
To make simulation-based interventional electrorheology training more accessible and promote the training of new operators, this article describes how to construct and utilize an experimental cardiac ablation simulator, based on concepts introduced by S. Wang et al. [13]. The system presented herein boasts comparable, or even enhanced, training capabilities to the commercial state-of-the-art system, offering a realistic customizable alternative for training centers. Though construction may pose challenges, the implementation of experimental simulators can match commercial standards and offer a more tailored training approach. For medical institutions with engineering capabilities, such as university hospitals, this investigation presents a viable method by which to prepare an effective, realistic, reliable, and even custom-made training scenario for interventional electrophysiologists.
Author Contributions
Conceptualization, C.S., R.J.H. and K.R.; methodology, C.S., S.S., L.L., E.L., N.A.-B., K.R., M.A.C.P., M.H., N.M.C., A.A.P., G.G., C.B., N.M.C., J.B., A.G., E.M. and R.C.; electroanatomical mapping system technical operations: M.A.C.P.; software, C.S., N.A.-B. and E.L.; validation, C.S., S.S., L.L., M.A.C.P., M.H., J.B. and K.R.; data curation, C.S., N.A.-B., E.L., A.G., E.M. and R.C.; formal analysis, C.S., P.B.-R., R.J.H. and K.R.; writing—original draft preparation, C.S.; writing—review and editing, C.S., L.L., P.B.-R., R.J.H. and K.R.; supervision, P.B.-R., R.J.H. and K.R.; funding acquisition, K.R. and P.B.-R. All authors have read and agreed to the published version of the manuscript.
Funding
This work was supported by the Wellcome Centre for Medical Engineering at King’s College London [WT203148/Z/16/Z]; the British Heart Foundation (BHF) Centre of Excellence at King’s College London; the Department of Health and Social Care (DHSC) through the National Institute for Health and Care Research (NIHR) MedTech; and Vitro Diagnostic Co-operative (MIC) Award for Cardiovascular Diseases to Guy’s & St Thomas’ NHS Foundation Trust in partnership with King’s College London [MIC-2016-019]. This work was supported by funding from Caranx Medical, Nice, France.
Data Availability Statement
The original contributions presented in the study are included in the article, further inquiries can be directed to the corresponding author/s.
Acknowledgments
The contributions of the cardiologists and engineers who participated in the simulators’ clinical evaluations are gratefully acknowledged. Their invaluable involvement, feedback, and efforts were instrumental for this study. Particular recognition is due to Steven Williams, Aruna Arujuna, Neil Bodagh, Jagan Muthurajah, Viral Sagar, Maria Birsoan, Kouros Shoja-Assadi, and Jamie Dyer. We thank Marco Pinto and his colleagues at Biosense Webster for their assistance with operating the CARTO mapping and ablation system. We thank the technical management team in the Surgical and Interventional Engineering Department at King’s College London for their support during our experiments.
Conflicts of Interest
Author Carlo Saija was employed by the company Caranx Medical. Author Pierre Berthet-Ryne was employed by the company Caranx Medical. Author Marco Antonio Coutinho Pinto was employed by the company Biosense Webster. The remaining authors declare that this research was conducted in the absence of any commercial or financial relationships that could be construed as potential conflicts of interest.
References
- Arrhythmia—NHS. Available online: https://www.nhs.uk/conditions/arrhythmia/ (accessed on 11 September 2024).
- Dai, H.; Zhang, Q.; Much, A.A.; Maor, E.; Segev, A.; Beinart, R.; Adawi, S.; Lu, Y.; Bragazzi, N.L.; Wu, J. Global, regional, and national prevalence, incidence, mortality, and risk factors for atrial fibrillation, 1990–2017: Results from the global burden of disease study 2017. Eur. Heart J. Qual. Care Clin. Outcomes 2020, 7, 574–582. [Google Scholar] [CrossRef] [PubMed]
- Rahman, F.; Kwan, G.F.; Benjamin, E.J. Global Epidemiology of Atrial Fibrillation. Nat. Rev. Cardiol. 2014, 11, 639–654. [Google Scholar] [CrossRef] [PubMed]
- Mujović, N.; Marinković, M.; Lenarczyk, R.; Tilz, R.; Potpara, T.S. Catheter Ablation of Atrial Fibrillation: An Overview for Clinicians. Adv. Ther. 2017, 34, 1897–1917. [Google Scholar] [CrossRef] [PubMed]
- Verma, A.; Haines, D.E.; Boersma, L.V.; Sood, N.; Natale, A.; Marchlinski, F.E.; Calkins, H.; Sanders, P.; Packer, D.L.; Kuck, K.-H.; et al. Pulsed Field Ablation for the Treatment of Atrial Fibrillation: PULSED AF Pivotal Trial. Circulation 2023, 147, 19. [Google Scholar] [CrossRef] [PubMed]
- Gill, J.S. How to perform pulmonary vein isolation. EP Eur. 2003, 6, 83–91. [Google Scholar] [CrossRef] [PubMed]
- De Ponti, R.; Marazzi, R.; Ghiringhelli, S.; Salerno-Uriarte, J.A.; Calkins, H.; Cheng, A. Superiority of simulator-based training compared with conventional training methodologies in the performance of Transseptal Catheterization. J. Am. Coll. Cardiol. 2011, 58, 359–363. [Google Scholar] [CrossRef] [PubMed]
- De Ponti, R.; Marazzi, R.; Doni, L.A.; Tamborini, C.; Ghiringhelli, S.; Salerno-Uriarte, J.A. Simulator training reduces radiation exposure and improves trainees’ performance in placing electrophysiologic catheters during patient-based procedures. Heart Rhythm 2012, 9, 1280–1285. [Google Scholar] [CrossRef] [PubMed]
- Haiser, A.; Aydin, A.; Kunduzi, B.; Ahmed, K.; Dasgupta, P. A systematic review of simulation-based training in Vascular surgery. J. Surg. Res. 2022, 279, 409–419. [Google Scholar] [CrossRef] [PubMed]
- Angio Mentor Surgical Science. Available online: https://surgicalscience.com/simulators/angio-mentor/ (accessed on 11 September 2024).
- Platforms (2023) Surgical Science. Available online: https://surgicalscience.com/simulators/angio-mentor/platforms/ (accessed on 11 September 2024).
- EP Model (2024) Heartroid. Available online: https://www.heartroid.com/ep/ (accessed on 6 September 2024).
- Wang, S.; Saija, C.; Choo, J.; Ou, Z.; Birsoan, M.; Germanos, S.; Rothwell, J.; Vakili, B.; Kotadia, I.; Xu, Z.; et al. Cardiac radiofrequency ablation simulation using a 3D-printed bi-atrial thermochromic model. Appl. Sci. 2022, 12, 6553. [Google Scholar] [CrossRef]
- Mass, P.N.; Contento, J.M.; Opfermann, J.D.; Sumihara, K.; Kumthekar, R.N.; Berul, C.I. An infant Phantom for pediatric pericardial access and electrophysiology training. Heart Rhythm O2 2022, 3, 295–301. [Google Scholar] [CrossRef] [PubMed]
- Rossi, L.; Penela, D.; Doni, L.; Marazzi, R.; Napoli, V.; Napoli, L.; Vilotta, M.; Villani, G.Q.; De Ponti, R. Development of simulation combining a physical heart model and three-dimensional system for electrophysiology training. Pacing Clin. Electrophysiol. 2018, 41, 1461–1466. [Google Scholar] [CrossRef] [PubMed]
- Bourier, F.; Reents, T.; Ammar-Busch, S.; Buiatti, A.; Grebmer, C.; Telishevska, M.; Brkic, A.; Semmler, V.; Lennerz, C.; Kaess, B.; et al. Sensor-based Electromagnetic Navigation (Mediguide): How accurate is it? A phantom model study. J. Cardiovasc. Electrophysiol. 2015, 26, 1140–1145. [Google Scholar] [CrossRef] [PubMed]
- Safety Data Sheet: Anycubic 3D Printing UV Sensitive Resin (2021). Available online: https://cdn.shopify.com/s/files/1/0245/5519/2380/files/EN_SDS_3D_Printing_UV_Sensitive_Resin___SDS_SGS_GHS_ANNEXII_CLP_2021616_SGS-SHENZHEN-03_Shenzhen_Anycubic_Technology_Co._Ltd.pdf?v=1660036934 (accessed on 11 September 2024).
- X-ray Mass Attenuation Coefficients—Table 3 NIST. Available online: https://physics.nist.gov/PhysRefData/XrayMassCoef/tab3.html (accessed on 11 September 2024).
- ICRP. Adult Reference Computational Phantoms; ICRP Publication 110; ICRP: Stockholm, Sweden, 2009; Volume 39. [Google Scholar]
- Britannica, The Editors of Encyclopaedia. “Resistivity”. Available online: https://www.britannica.com/science/resistivity (accessed on 6 September 2024).
- Chougule, V.; Mulay, A.; Ahuja, B.B. Clinical Case Study: Spine Modeling for Minimum Invasive Spine Surgeries (MISS) using Rapid Prototyping. In Proceedings of the COPENA, Chennai, India, 7–9 December 2017. [Google Scholar]
- Barkagan, M.; Rottmann, M.; Leshem, E.; Shen, C.; Buxton, A.E.; Anter, E. Effect of baseline impedance on ablation lesion dimensions. Circ. Arrhythm. Electrophysiol. 2018, 11, e006690. [Google Scholar] [CrossRef] [PubMed]
- Raghavan, K.; Porterfield, J.E.; Kottam, A.T.G.; Feldman, M.D.; Escobedo, D.; Valvano, J.W.; Pearce, J.A. Electrical conductivity and permittivity of murine myocardium. IEEE Trans. Biomed. Eng. 2009, 56, 2044–2053. [Google Scholar] [CrossRef] [PubMed]
- Miklavčič, D.; Pavšelj, N.; Hart, F.X. Electric properties of tissues. Wiley Encycl. Biomed. Eng. 2006. [Google Scholar] [CrossRef]

Disclaimer/Publisher’s Note: The statements, opinions and data contained in all publications are solely those of the individual author(s) and contributor(s) and not of MDPI and/or the editor(s). MDPI and/or the editor(s) disclaim responsibility for any injury to people or property resulting from any ideas, methods, instructions or products referred to in the content. |
© 2024 by the authors. Licensee MDPI, Basel, Switzerland. This article is an open access article distributed under the terms and conditions of the Creative Commons Attribution (CC BY) license (https://creativecommons.org/licenses/by/4.0/).