


Fundus-DANet: Dilated Convolution and Fusion Attention Mechanism for Multilabel Retinal Fundus Image Classification

Abstract
1. Introduction
2. Related Work
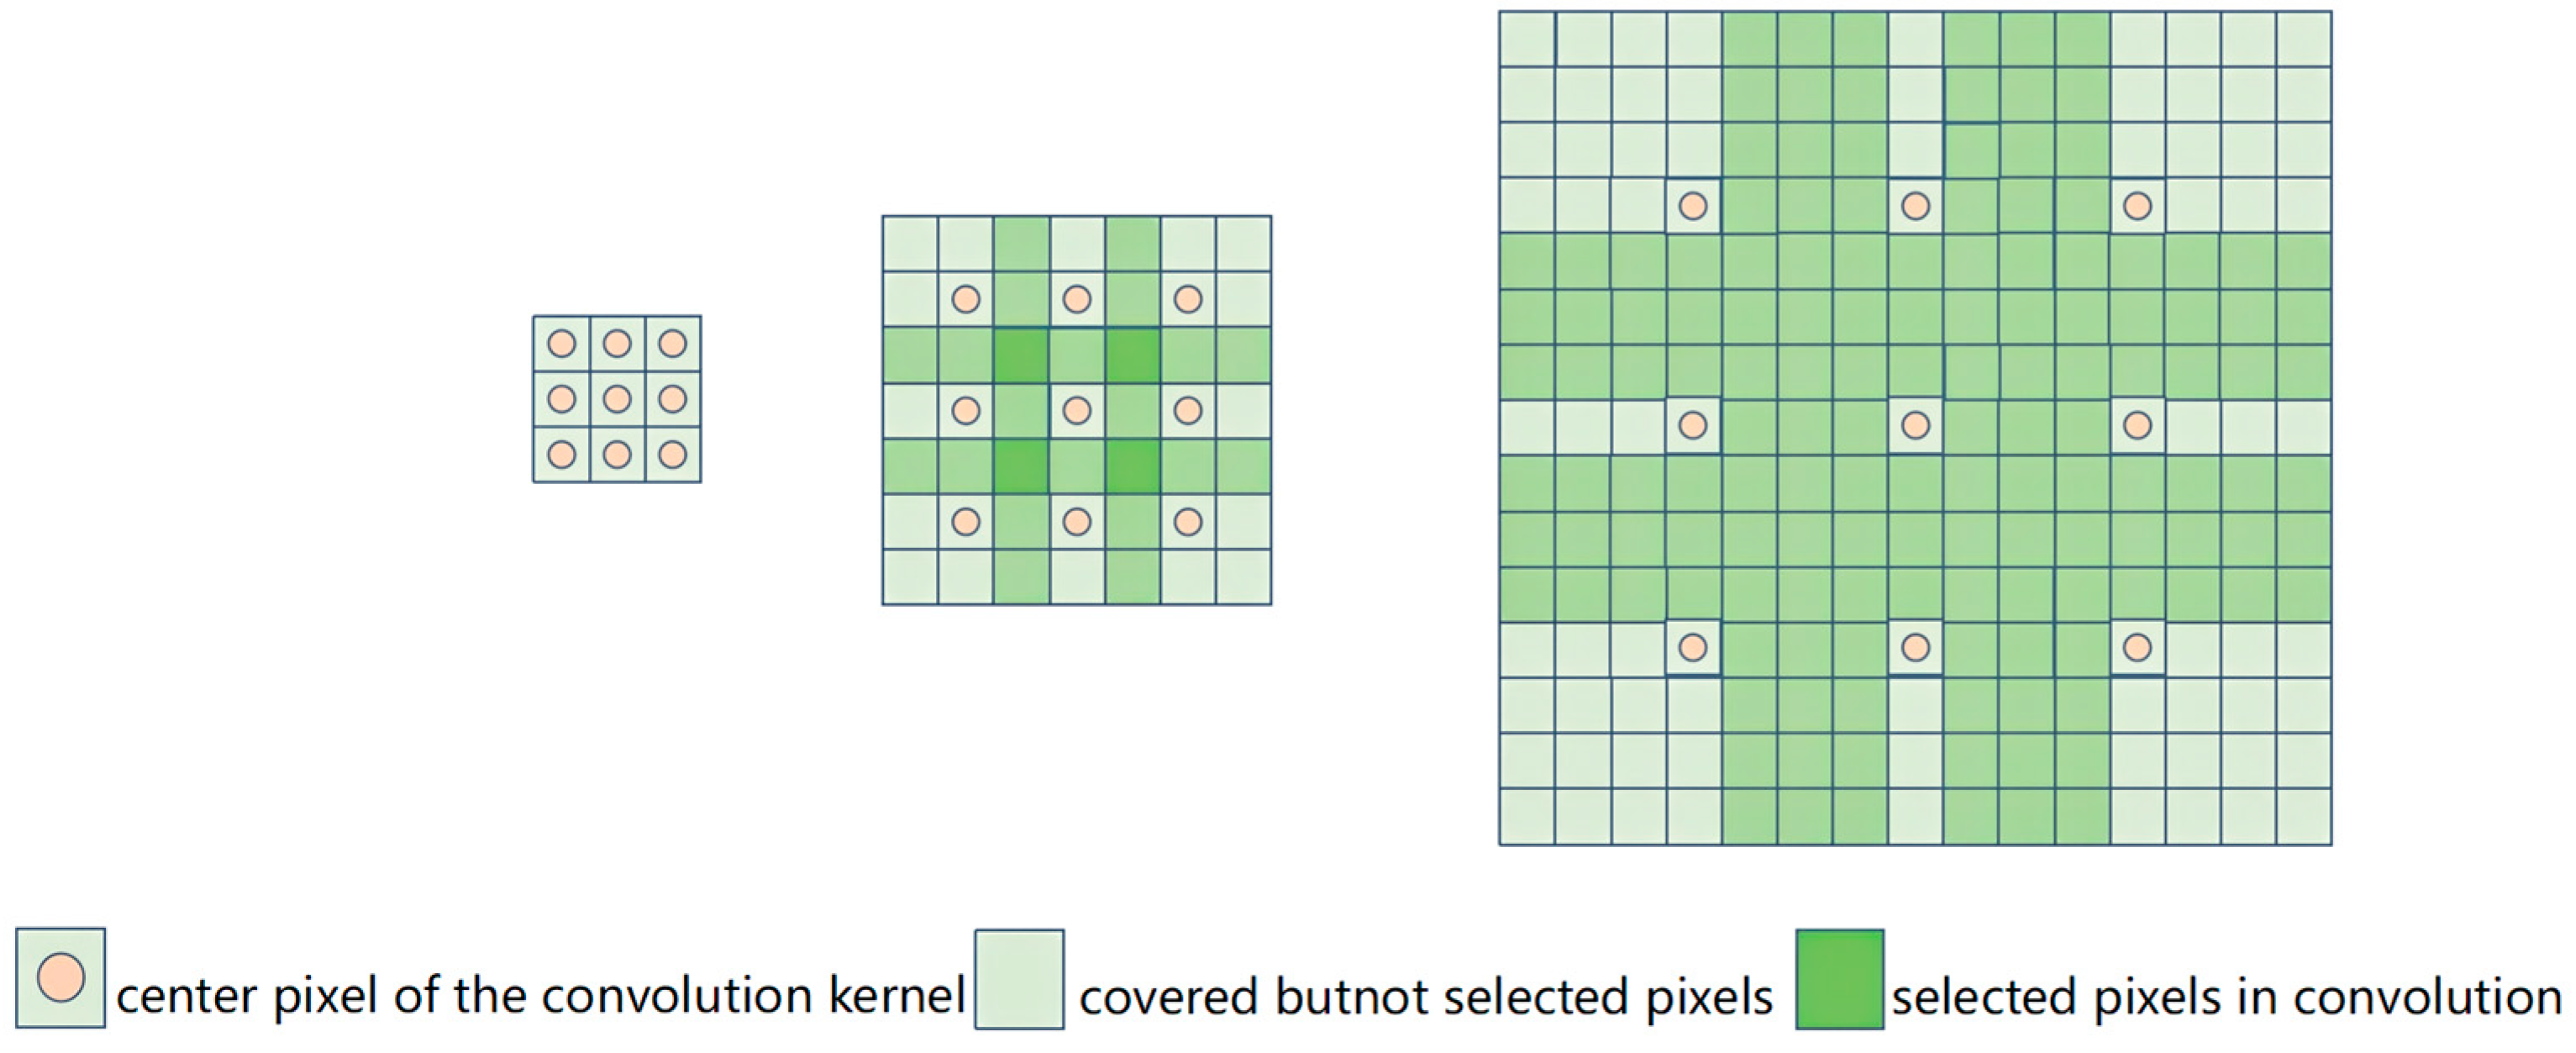
2.1. Dilated-Convolution-Based Methods
2.2. Attention Mechanism-Based Methods
3. Methods
3.1. Fundus-DANet
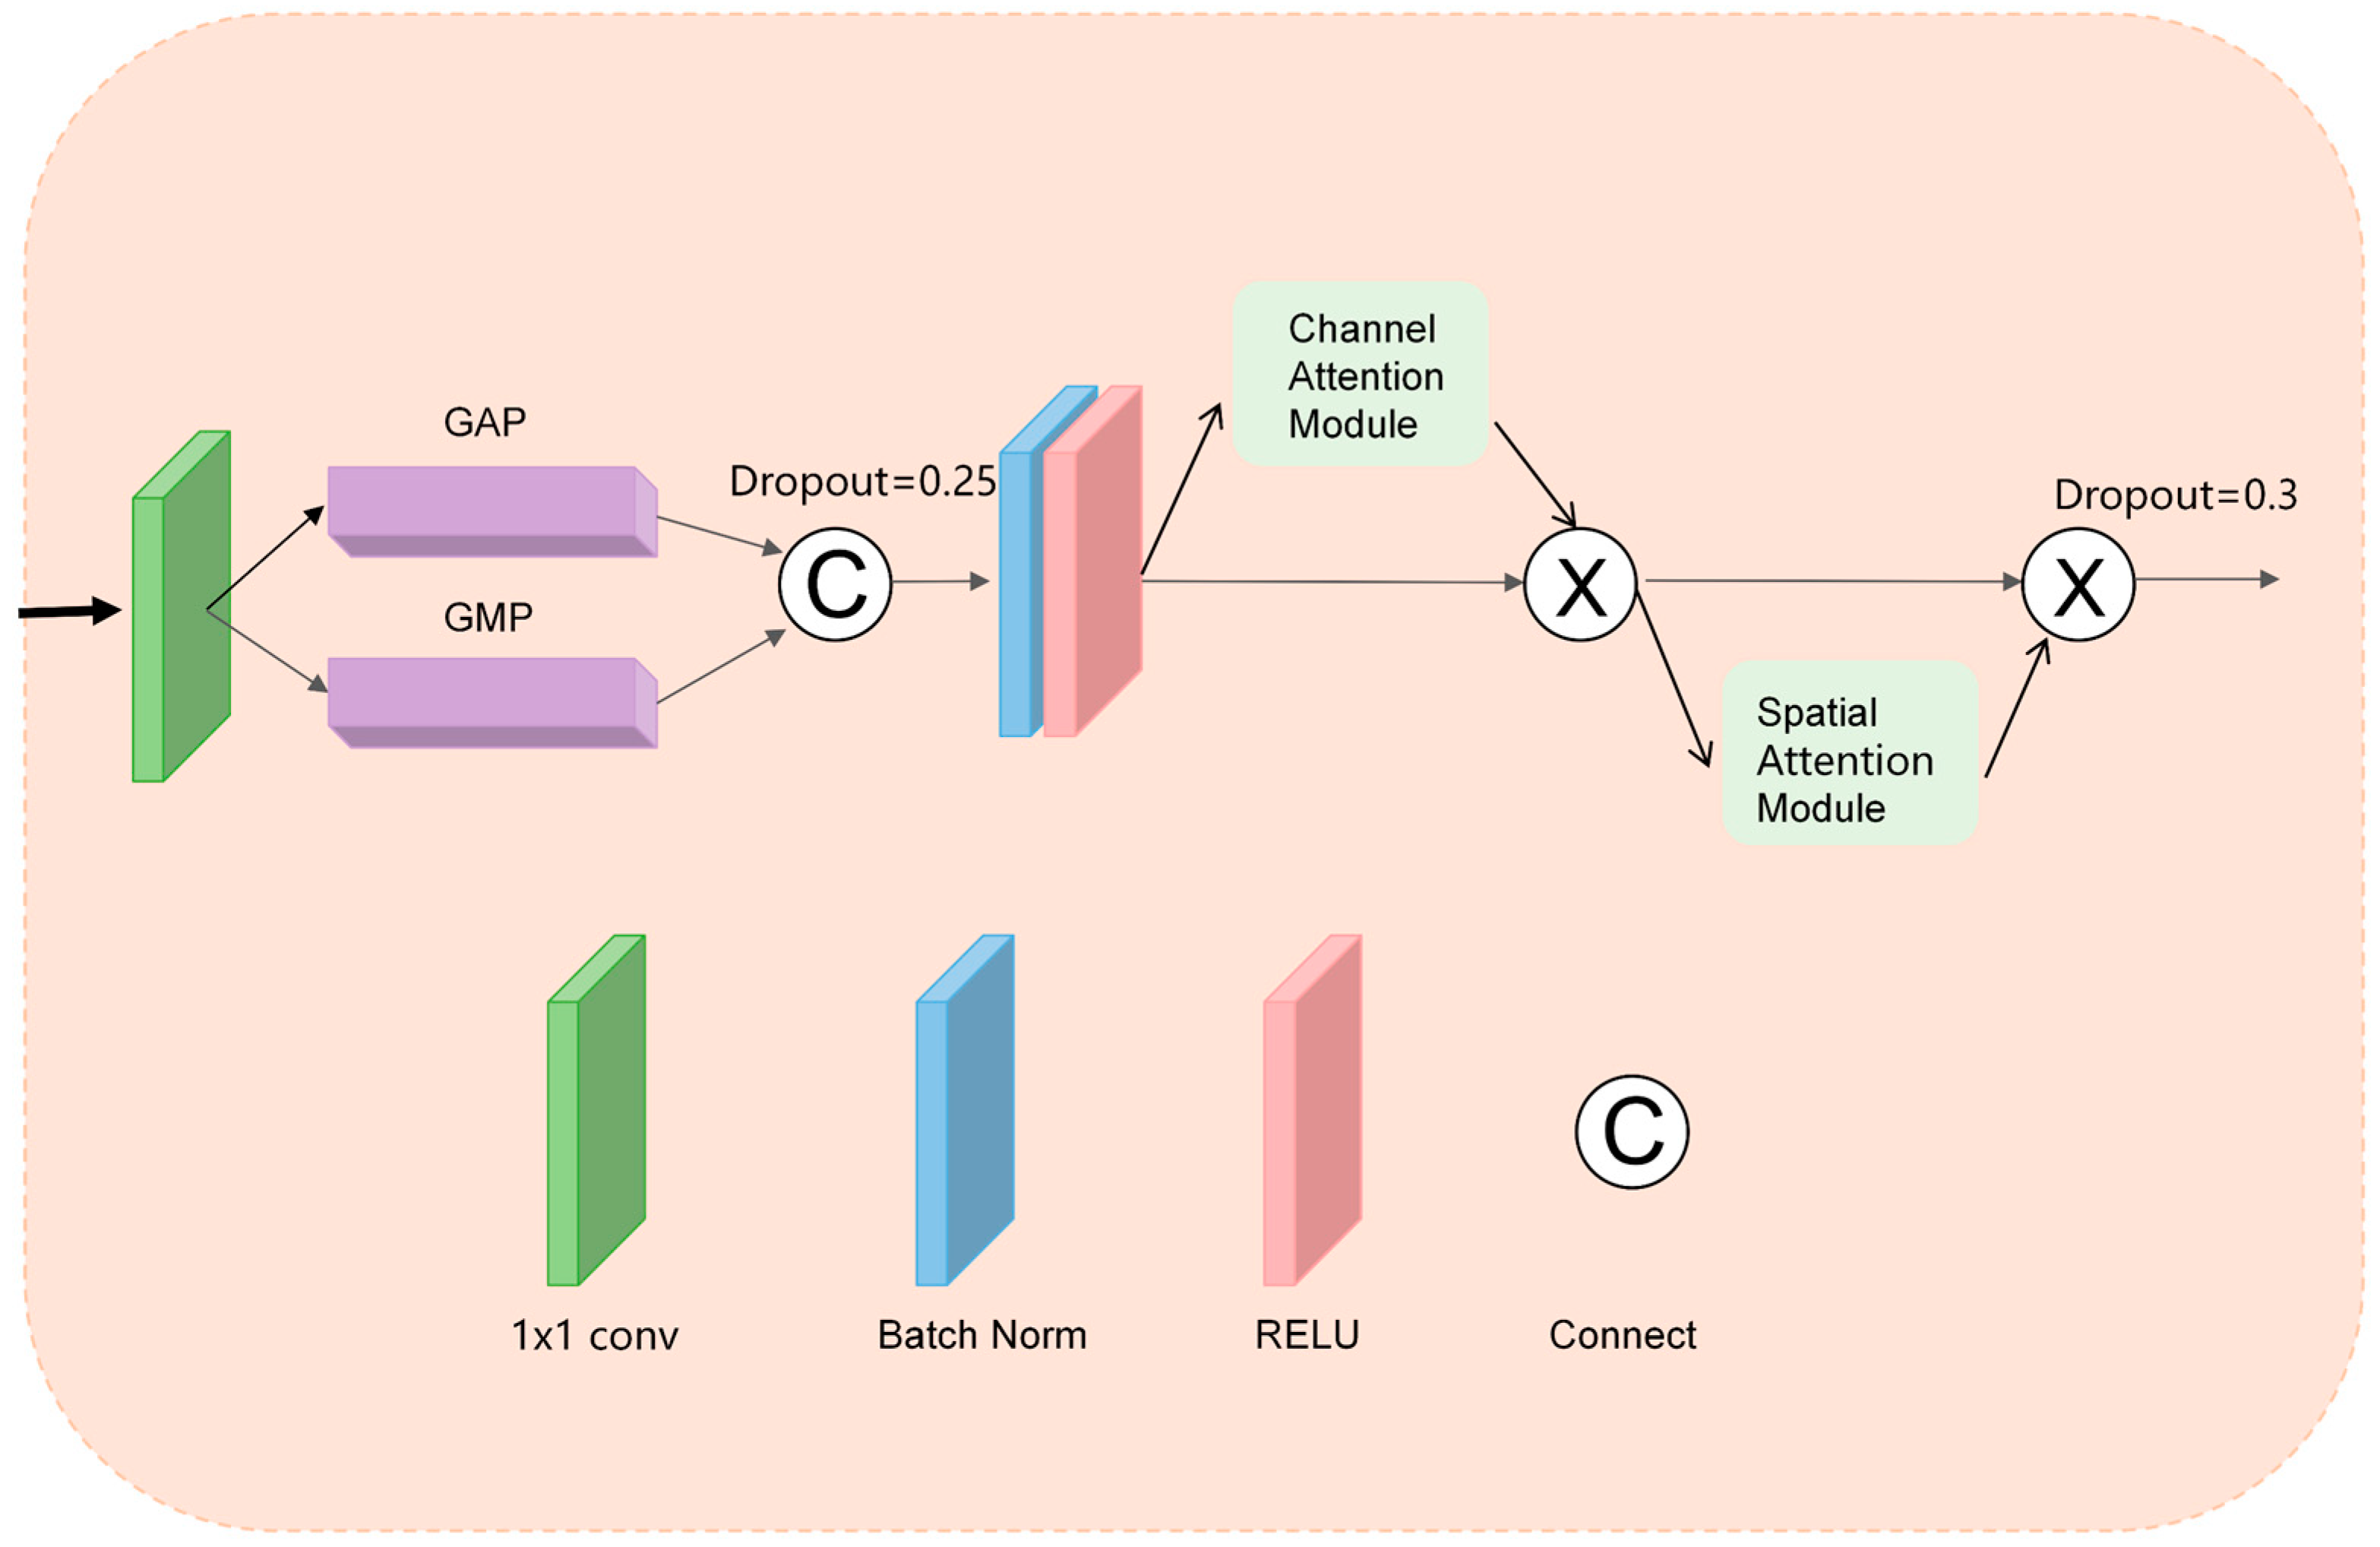
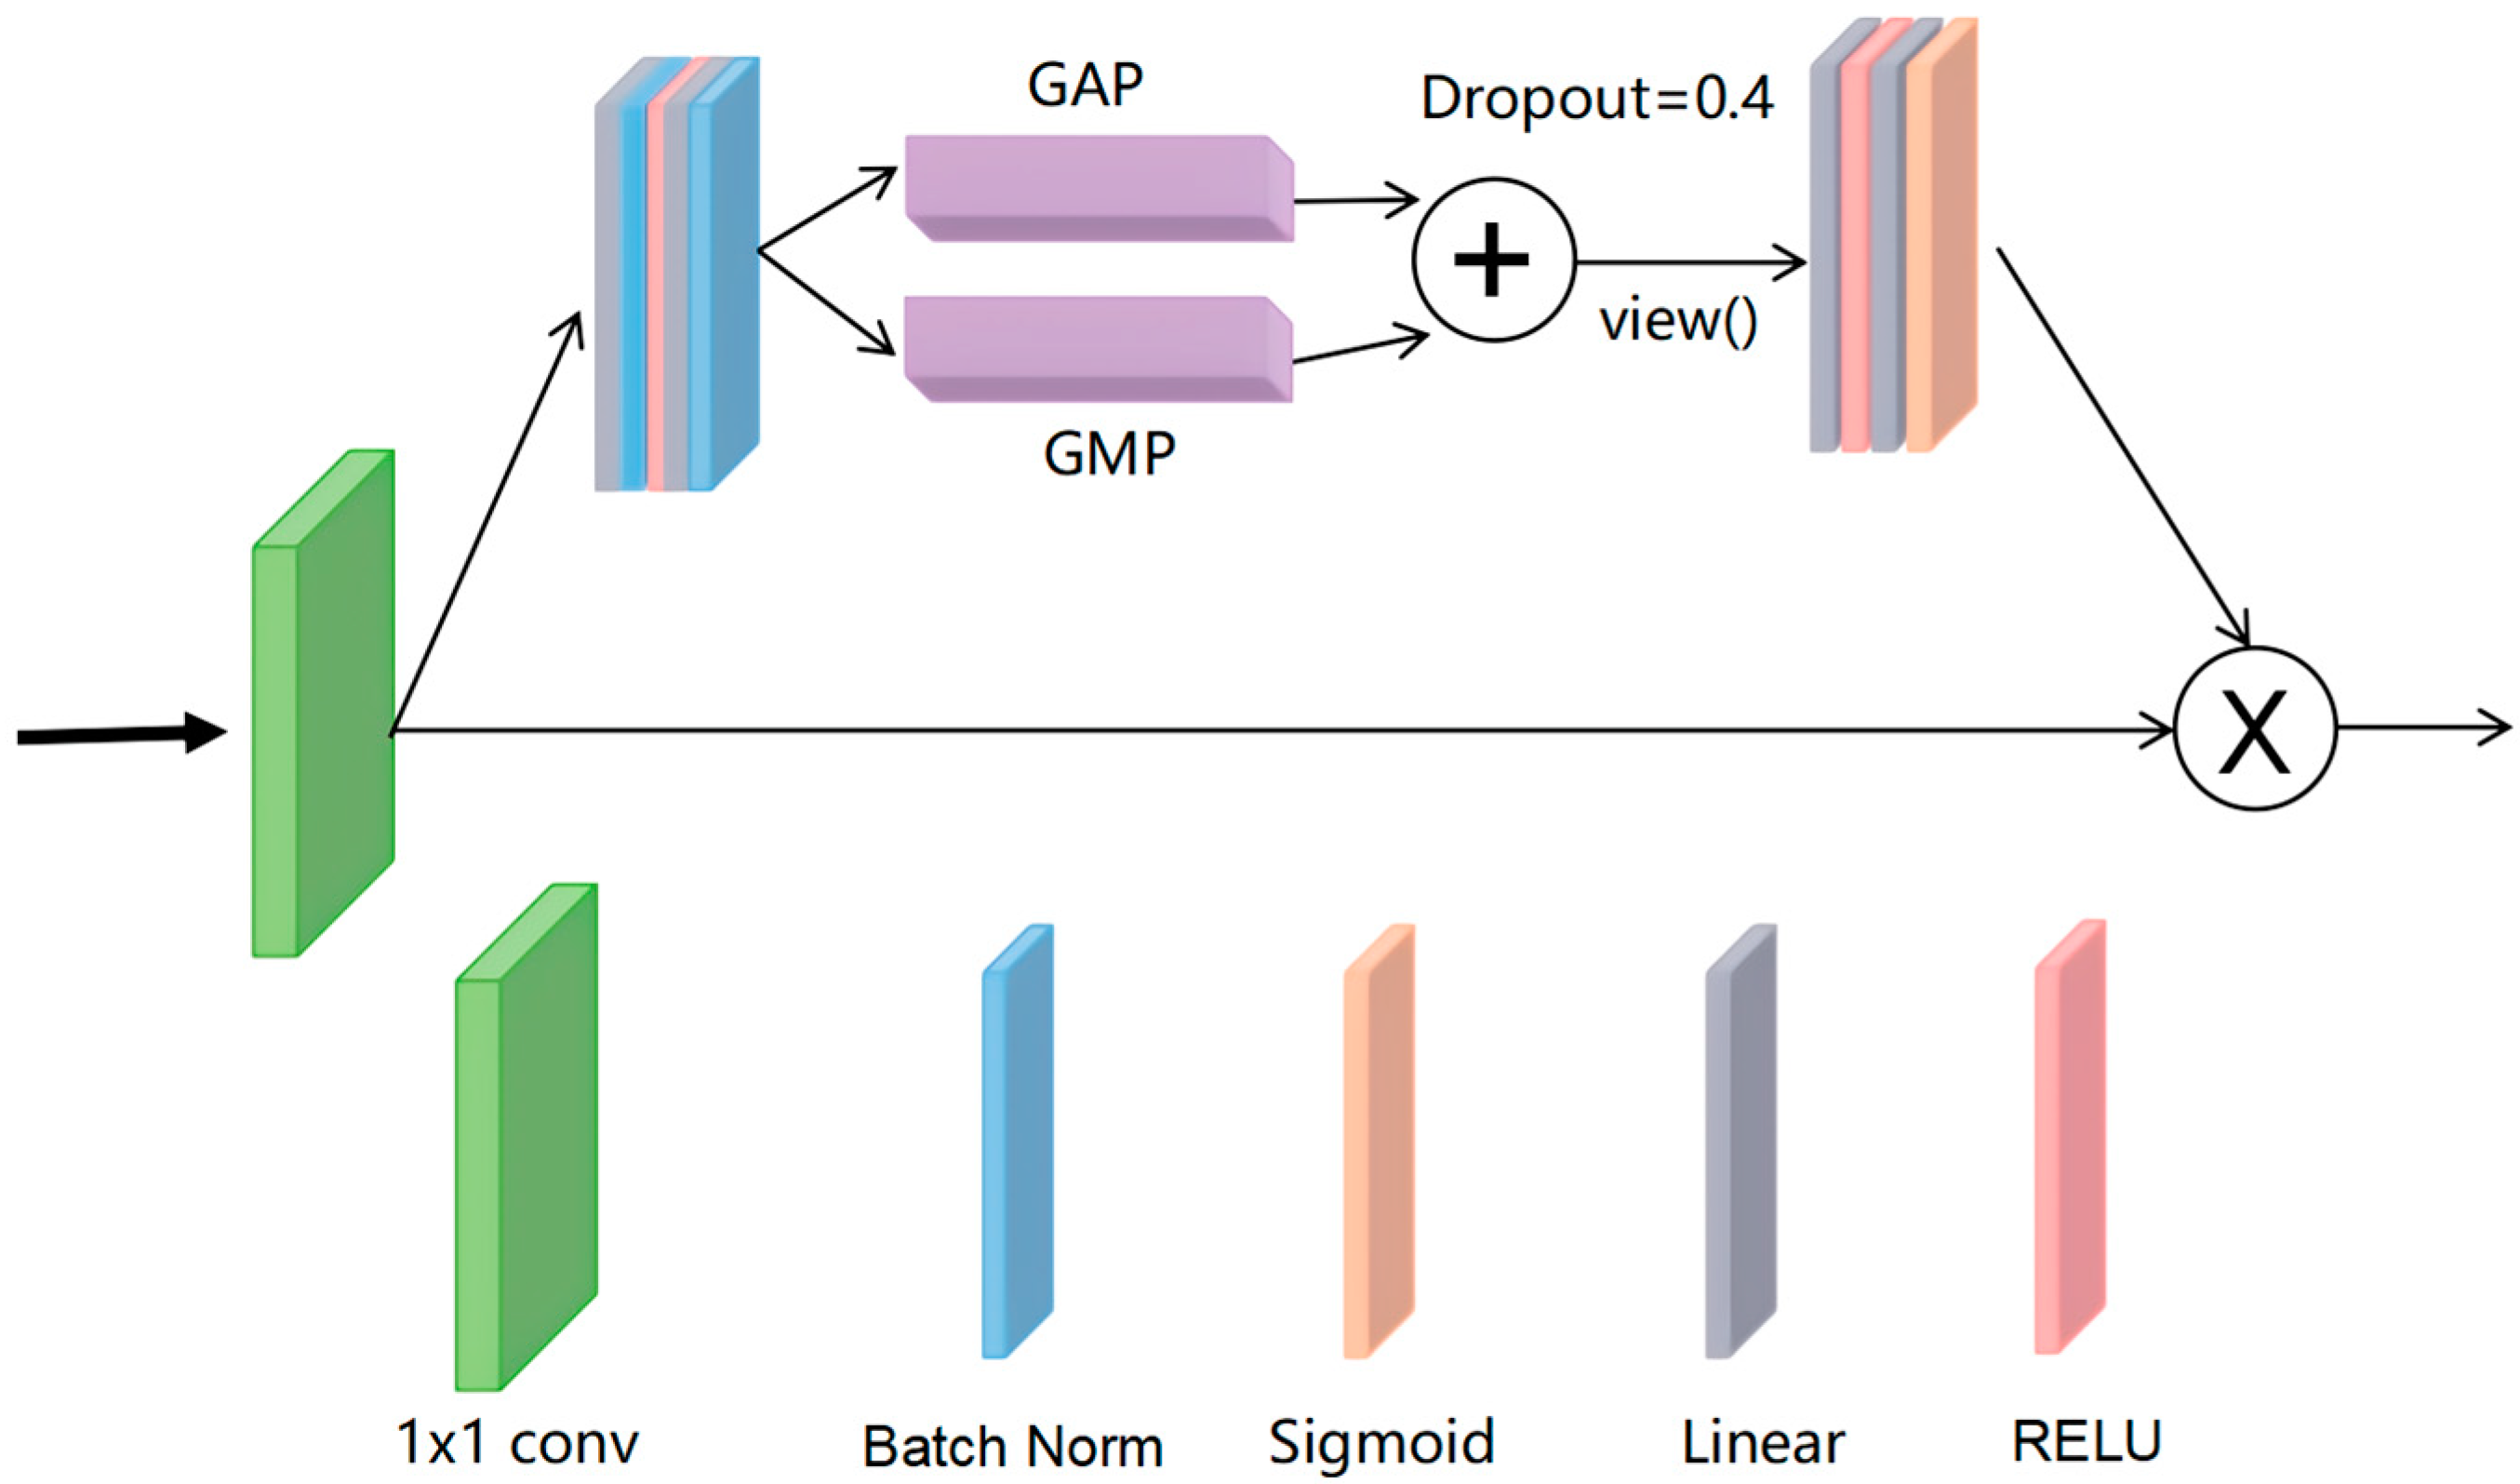
3.1.1. DA-CBAM
3.1.2. ILM
3.2. APL
3.3. Evaluation Metrics
4. Experiments and Results
4.1. Datasets
4.2. Implementation Details
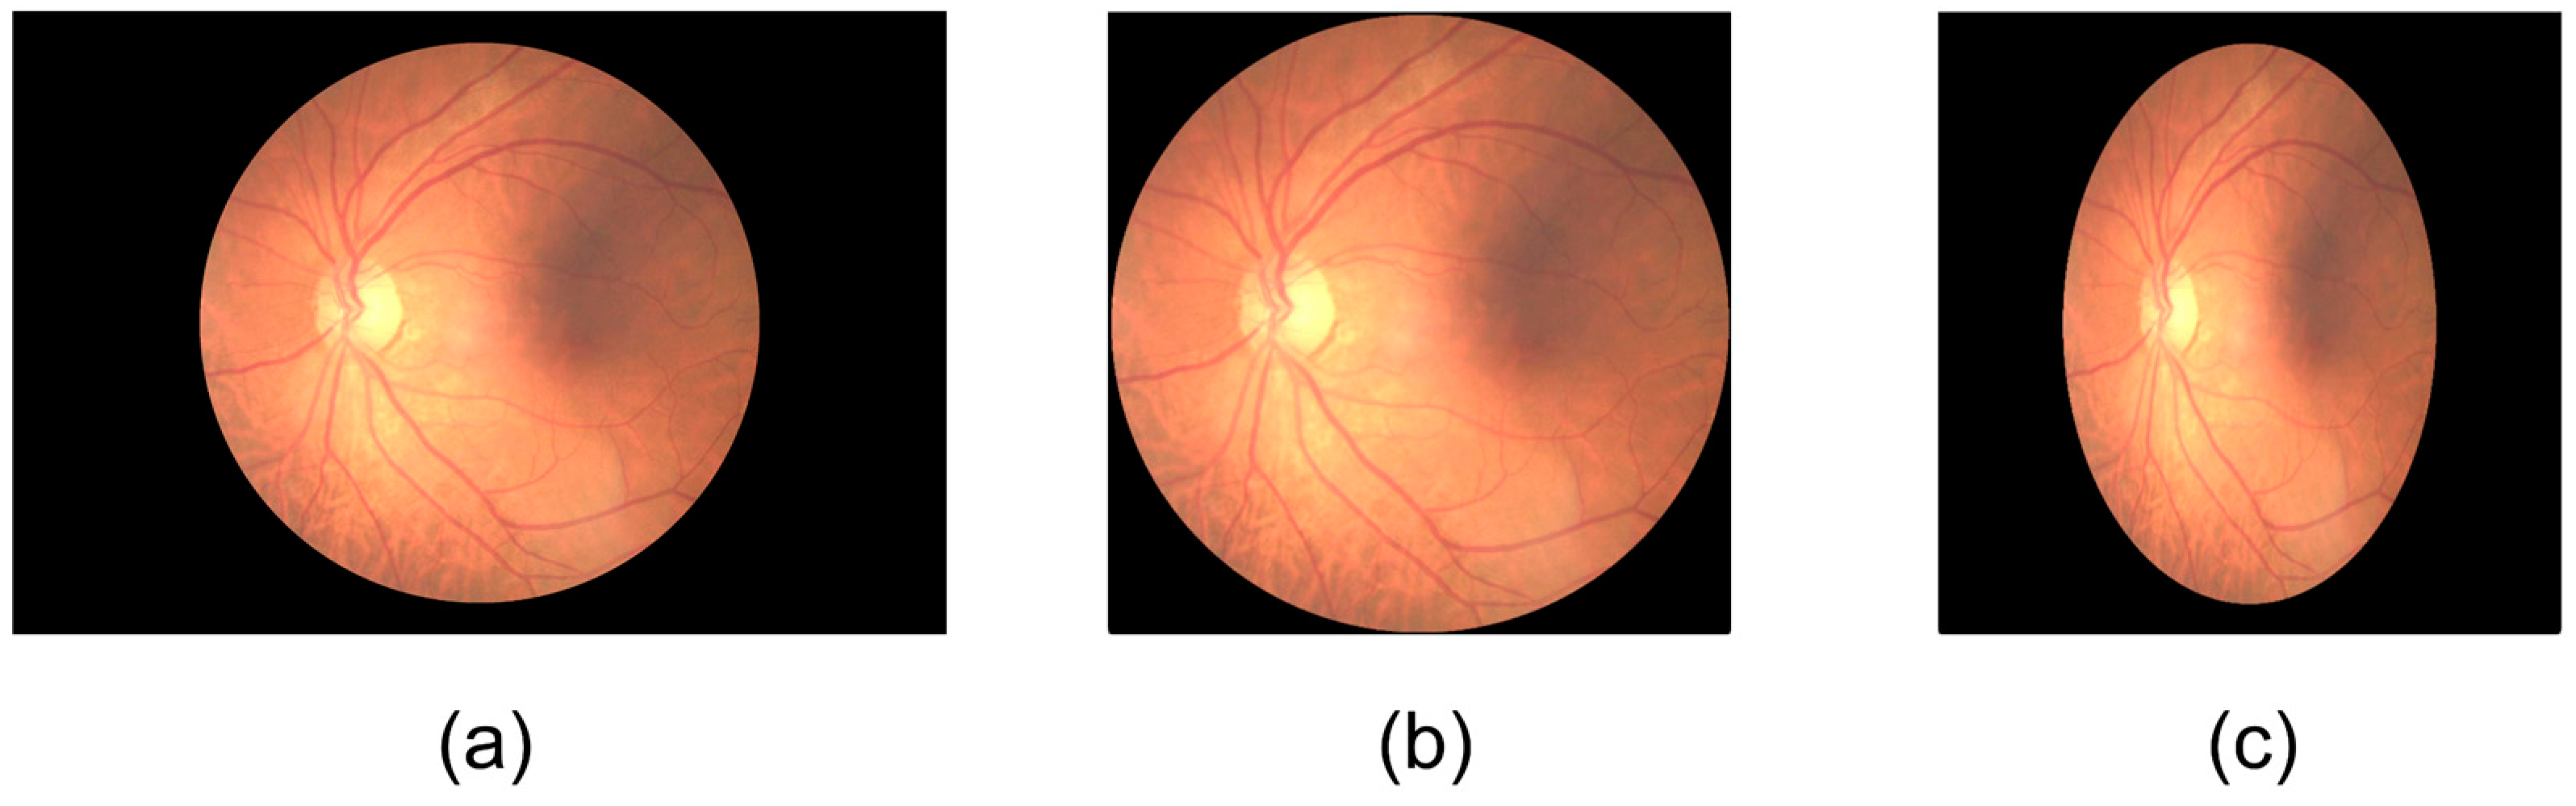
4.3. Image Preprocessing
4.4. Results
4.4.1. Performance Evaluation of Different Backbone Networks
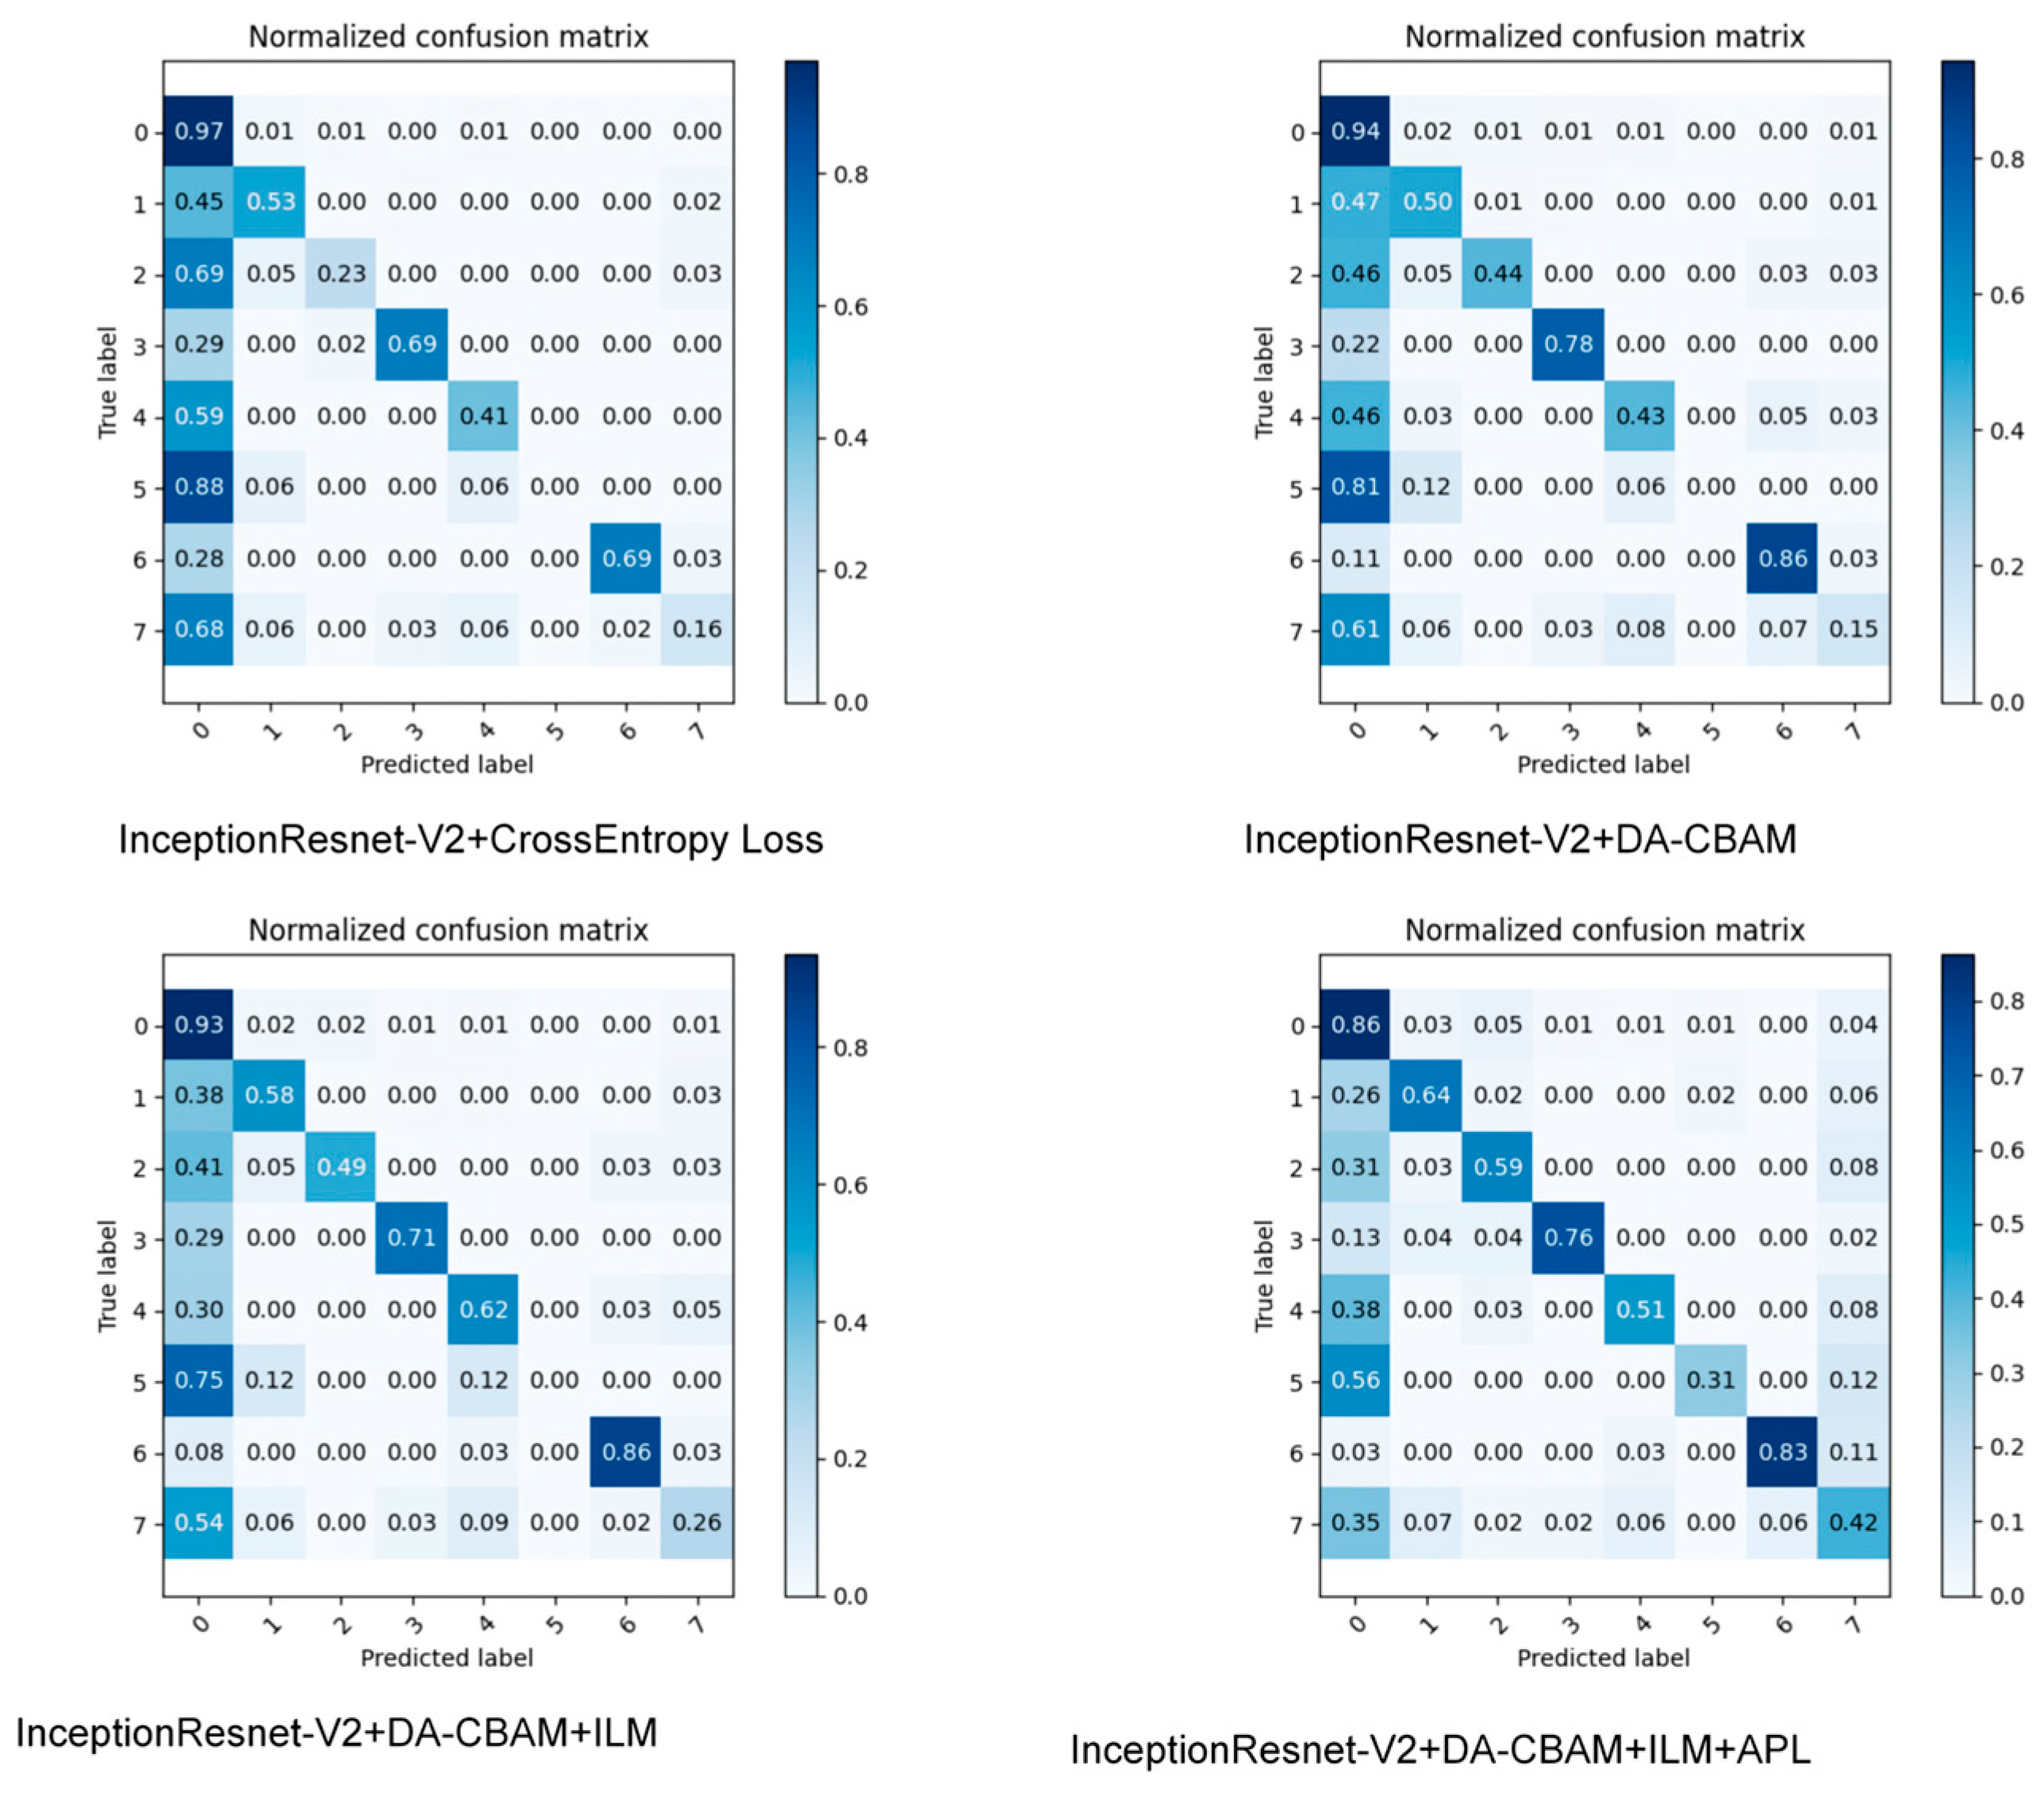
4.4.2. Ablation Experiment
4.4.3. Comparative Experiments between Different Attentional Mechanisms
4.4.4. Comparative Testing of Different Models
5. Discussion and Limitations
6. Conclusions
Author Contributions
Funding
Institutional Review Board Statement
Informed Consent Statement
Data Availability Statement
Acknowledgments
Conflicts of Interest
References
- Burton, M.J.; Ramke, J.; Marques, A.P.; Bourne, R.R.; Congdon, N.; Jones, I.; Tong, B.A.A.; Arunga, S.; Bachani, D.; Bascaran, C. The lancet global health commission on global eye health: Vision beyond 2020. Lancet Glob. Health 2021, 9, e489–e551. [Google Scholar] [CrossRef] [PubMed]
- Bogacsovics, G.; Toth, J.; Hajdu, A.; Harangi, B. Enhancing CNNs through the use of hand-crafted features in automated fundus image classification. Biomed. Signal Process. Control. 2022, 76, 103685. [Google Scholar] [CrossRef]
- Meng, Q.; Zhang, W. Multi-label image classification with attention mechanism and graph convolutional networks. In Proceedings of the 1st ACM International Conference on Multimedia in Asia, Beijing China, 15–18 December 2019; pp. 1–6. [Google Scholar]
- Huo, X.; Sun, G.; Tian, S.; Wang, Y.; Yu, L.; Long, J.; Zhang, W. HiFuse: Hierarchical multi-scale feature fusion network for medical image classification. Biomed. Signal Process. Control 2024, 87, 105534. [Google Scholar] [CrossRef]
- Bhati, A.; Gour, N.; Khanna, P.; Ojha, A. Discriminative kernel convolution network for multi-label ophthalmic disease detection on imbalanced fundus image dataset. Comput. Biol. 2023, 153, 106519. [Google Scholar] [CrossRef]
- Woo, S.; Park, J.; Lee, J.-Y.; Kweon, I.S. Cbam: Convolutional block attention module. In Proceedings of the European Conference on Computer Vision (ECCV), Munich, Germany, 8–14 September 2018; pp. 3–19. [Google Scholar]
- Huang, Y.; Qi, J.; Wang, X.; Lin, Z. Asymmetric polynomial loss for multi-label classification. In Proceedings of the ICASSP 2023–2023 IEEE International Conference on Acoustics, Speech and Signal Processing (ICASSP), Rhodes Island, Greece, 4–10 June 2023; pp. 1–5. [Google Scholar]
- You, G.-R.; Shiue, Y.-R.; Su, C.-T.; Huang, Q.-L. Enhancing ensemble diversity based on multiscale dilated convolution in image classification. Inf. Sci. 2022, 606, 292–312. [Google Scholar] [CrossRef]
- Sun, M.; Li, K.; Qi, X.; Dang, H.; Zhang, G. Contextual information enhanced convolutional neural networks for retinal vessel segmentation in color fundus images. J. Vis. Commun. Image Represent. 2021, 77, 103134. [Google Scholar] [CrossRef]
- Panchal, S.; Kokare, M. ResMU-Net: Residual Multi-kernel U-Net for blood vessel segmentation in retinal fundus images. Biomed. Signal Process. Control 2024, 90, 105859. [Google Scholar] [CrossRef]
- Tu, C.; Liu, W.; Jiang, W.; Zhao, L. Hyperspectral image classification based on residual dense and dilated convolution. Infrared Phys. Technol. 2023, 131, 104706. [Google Scholar] [CrossRef]
- Madarapu, S.; Ari, S.; Mahapatra, K. A multi-resolution convolutional attention network for efficient diabetic retinopathy classification. Comput. Electr. Eng. 2024, 117, 109243. [Google Scholar] [CrossRef]
- Romero-Oraá, R.; Herrero-Tudela, M.; López, M.I.; Hornero, R.; García, M. Attention-based deep learning framework for automatic fundus image processing to aid in diabetic retinopathy grading. Comput. Methods Programs Biomed. 2024, 249, 108160. [Google Scholar] [CrossRef]
- Li, Z.; Xu, M.; Yang, X.; Han, Y. Multi-label fundus image classification using attention mechanisms and feature fusion. Micromachines 2022, 13, 947. [Google Scholar] [CrossRef] [PubMed]
- Madarapu, S.; Ari, S.; Mahapatra, K. A deep integrative approach for diabetic retinopathy classification with synergistic channel-spatial and self-attention mechanism. Expert Syst. Appl. 2024, 249, 123523. [Google Scholar] [CrossRef]
- Das, D.; Nayak, D.R.; Pachori, R.B. AES-Net: An adapter and enhanced self-attention guided network for multi-stage glaucoma classification using fundus images. Image Vis. Comput. 2024, 146, 105042. [Google Scholar] [CrossRef]
- Hu, J.; Shen, L.; Sun, G. Squeeze-and-excitation networks. In Proceedings of the IEEE Conference on Computer Vision and Pattern Recognition, Salt Lake City, UT, USA, 18–22 June 2018; pp. 7132–7141. [Google Scholar]
- Ridnik, T.; Ben-Baruch, E.; Zamir, N.; Noy, A.; Friedman, I.; Protter, M.; Zelnik-Manor, L. Asymmetric loss for multi-label classification. In Proceedings of the IEEE/CVF International Conference on Computer Vision, Montreal, BC, Canada, 11–17 October 2021; pp. 82–91. [Google Scholar]
- Li, N.; Li, T.; Hu, C.; Wang, K.; Kang, H. A benchmark of ocular disease intelligent recognition: One shot for multi-disease detection. In Proceedings of the Benchmarking, Measuring, and Optimizing: Third BenchCouncil International Symposium, Bench 2020, Virtual Event, 15–16 November 2020; pp. 177–193. [Google Scholar]
- Szegedy, C.; Ioffe, S.; Vanhoucke, V.; Alemi, A. Inception-v4, inception-resnet and the impact of residual connections on learning. In Proceedings of the AAAI Conference on Artificial Intelligence, San Francisco, CA, USA, 4–9 February 2017. [Google Scholar]
- Simonyan, K.; Zisserman, A. Very deep convolutional networks for large-scale image recognition. arXiv 2014, arXiv:1409.1556. [Google Scholar]
- Szegedy, C.; Vanhoucke, V.; Ioffe, S.; Shlens, J.; Wojna, Z. Rethinking the inception architecture for computer vision. In Proceedings of the IEEE Conference on Computer Vision and Pattern Recognition, Las Vegas, NV, USA, 27–30 June 2016; pp. 2818–2826. [Google Scholar]
- He, K.; Zhang, X.; Ren, S.; Sun, J. Deep residual learning for image recognition. In Proceedings of the IEEE Conference on Computer Vision and Pattern Recognition, Las Vegas, NV, USA, 27–30 June 2016; pp. 770–778. [Google Scholar]
- Tan, M.; Le, Q. Efficientnet: Rethinking model scaling for convolutional neural networks. In Proceedings of the International Conference on Machine Learning, Long Beach, CA, USA, 9–15 June 2019; pp. 6105–6114. [Google Scholar]
- Vaswani, A.; Shazeer, N.; Parmar, N.; Uszkoreit, J.; Jones, L.; Gomez, A.N.; Kaiser, Ł.; Polosukhin, I. Attention is all you need. Adv. Neural Inf. Process. Syst. 2017, 30. [Google Scholar] [CrossRef]
- Chen, B.; Zhang, Z.; Liu, N.; Tan, Y.; Liu, X.; Chen, T. Spatiotemporal convolutional neural network with convolutional block attention module for micro-expression recognition. Information 2020, 11, 380. [Google Scholar] [CrossRef]
- Wang, Q.; Wu, B.; Zhu, P.; Li, P.; Zuo, W.; Hu, Q. ECA-Net: Efficient channel attention for deep convolutional neural networks. In Proceedings of the IEEE/CVF Conference on Computer Vision and Pattern Recognition, Seattle, WA, USA, 14–19 June 2020; pp. 11534–11542. [Google Scholar]
- Zhang, Y.; Luo, L.; Dou, Q.; Heng, P.-A. Triplet attention and dual-pool contrastive learning for clinic-driven multi-label medical image classification. Med. Image Anal. 2023, 86, 102772. [Google Scholar] [CrossRef]
- Wang, J.; Yang, L.; Huo, Z.; He, W.; Luo, J. Multi-label classification of fundus images with efficientnet. IEEE Access 2020, 8, 212499–212508. [Google Scholar] [CrossRef]
- Sun, K.; He, M.; Xu, Y.; Wu, Q.; He, Z.; Li, W.; Liu, H.; Pi, X. Multi-label classification of fundus images with graph convolutional network and LightGBM. Comput. Biol. Med. 2022, 149, 105909. [Google Scholar] [CrossRef]
- Lin, J.; Cai, Q.; Lin, M. Multi-label classification of fundus images with graph convolutional network and self-supervised learning. IEEE Signal Process. Lett. 2021, 28, 454–458. [Google Scholar] [CrossRef]
- Li, C.; Ye, J.; He, J.; Wang, S.; Qiao, Y.; Gu, L. Dense correlation network for automated multi-label ocular disease detection with paired color fundus photographs. In Proceedings of the 2020 IEEE 17th International Symposium on Biomedical Imaging (ISBI), Iowa City, IA, USA, 3–7 April 2020; pp. 1–4. [Google Scholar]
- Liu, S.; Wang, W.; Deng, L.; Xu, H. Cnn-trans model: A parallel dual-branch network for fundus image classification. Biomed. Signal Process. Control. 2024, 96, 106621. [Google Scholar] [CrossRef]


| Study | Objective | Method | Findings | Limitations | Contribution of This Study |
|---|---|---|---|---|---|
| You et al. (2020) [8] | To propose a new multiscale dilated-convolution-based ensemble learning method (MDCEL) | Introduced dilated convolution and different expansion rates in a traditional CNN with transfer learning, training multiple learners simultaneously through an aggregation strategy, and obtaining the final result using a weighted-voting method | Improved classification performance | Limited information retention and feature collection capacity | Enhanced feature extraction capabilities |
| Sun et al. (2021) [9] | To apply multiple parallel dilated-convolution multiscale fusion of contextual information | Utilized a U-shaped network to fully collect the image multiscale features | Enhanced multiscale feature extraction | Inadequate feature fusion | Used a convolutional block attention module (CBAM) and dilated convolution to extract and merge multiscale information from images. |
| Panchal et al. (2022) [10] | To create the residual multi-kernel dilation convolution U-Net model (ResMU-Net) | Combined U-shaped network structure with hopping connections and cavity convolution at each layer | Broadened sensory field and enhanced feature extraction | High complexity, prone to overfitting | Reduced model complexity |
| Tu et al. (2022) [11] | To propose a method based on residual dense and dilated convolution (RDDC-3DCNN) for hyperspectral image classification | Fused different levels of spatial–spectral features through a dilated convolution of the residual dilated dense block | Effectively extracted spatial–spectral features | High complexity, prone to overfitting | Reduced model complexity |
| Madarapu et al. (2022) [12] | To propose the multiresolution convolutional attention network (MuR-CAN) | Extracted features from the backbone network and then used dilated convolution | Superior performance on two datasets with fewer samples | Small sample size | Validated on larger datasets |
| Romero-Ora et al. (2023) [13] | To develop a novel attentional method for retinal images | Generated independent attentional maps focusing on bright and dark structures | Improved classification accuracy | Applicable only to images with significant feature color variations | Addressed the issue of small interclass differences |
| Li et al. (2023) [14] | To create the BFPC-Net model with improved generalization | Added a residual network and an attention mechanism fusion module | Enhanced feature information extraction | Risk of information loss, overemphasis on local features | Fused multiscale features |
| Madarapu et al. (2023) [15] | To propose a parallel connection of channel and spatial attention mechanisms | Modeled interactions between all locations of the feature mapping using self-attention | Improved feature extraction and classification performance | High modeling overhead | Reduced model complexity |
| Das et al. (2023) [16] | To design the AES-Net model based on parallel connectivity by pooling and three 1 × 1 convolutional kernels | Selectively implemented rich discriminative and stage-specific features from the lesion region | Reduced model overhead | High complexity | Reduced model complexity |
| Hyperparameter | Value |
|---|---|
| Epochs | 30 |
| Batch size | 16 |
| Optimizer | SGD |
| Learning rate | 0.0007 |
| Momentum parameter | 0.9 |
| Weight decay parameter | 1 × 10⁻⁶ |
| Learning rate scheduler | StepLR |
| Scheduler step size | 5 |
| Learning rate decay factor | 0.9 |
| Backbone | No Preprocessing | Preprocessing | ||||||||||
|---|---|---|---|---|---|---|---|---|---|---|---|---|
| ACC | AUC | F1_Score | Final_Score | κ | HL | ACC | AUC | F1_Score | Final_Score | κ | HL | |
| Vgg16 [20] | 88.15 | 85.66 | 73.38 | 68.60 | 46.77 | 11.85 | 89.97 | 91.42 | 74.86 | 72.08 | 49.96 | 10.03 |
| Inception-v3 [21] | 90.42 | 90.68 | 77.44 | 74.35 | 54.94 | 9.58 | 92.28 | 94.62 | 82.49 | 80.70 | 65.00 | 7.72 |
| Resnet101 [22] | 89.35 | 90.45 | 71.99 | 68.95 | 44.42 | 10.65 | 90.70 | 93.52 | 78.02 | 75.88 | 56.11 | 9.30 |
| EfficientNet-B4 [23] | 88.58 | 89.39 | 65.47 | 62.43 | 32.43 | 11.42 | 89.50 | 91.46 | 70.32 | 67.75 | 41.48 | 10.50 |
| InceptionResnetV2 [24] | 90.95 | 92.69 | 77.52 | 85.15 | 55.23 | 9.05 | 93.00 | 95.12 | 83.74 | 82.13 | 67.52 | 7.00 |
| ACC | AUC | F1_Score | Final_Score | κ | HL | |
|---|---|---|---|---|---|---|
| InceptionResnet-V2 | 91.29 | 93.62 | 77.62 | 77.59 | 55.52 | 8.70 |
| InceptionResnet-V2 + DA-CBAM | 91.40 | 93.16 | 77.89 | 75.70 | 56.06 | 8.60 |
| InceptionResnet-V2 + ILM | 90.42 | 92.70 | 74.28 | 72.00 | 49.05 | 9.58 |
| InceptionResnet-V2 + APL | 92.90 | 94.61 | 84.10 | 82.31 | 68.22 | 7.10 |
| InceptionResnet-V2 + DA-CBAM + APL | 92.81 | 94.54 | 83.25 | 81.44 | 66.54 | 7.19 |
| InceptionResnet-V2 + ILM + APL | 90.53 | 92.70 | 74.59 | 72.30 | 49.66 | 9.5 |
| InceptionResnet-V2 + DA-CBAM + ILM | 91.77 | 93.68 | 79.18 | 77.14 | 58.56 | 8.23 |
Disclaimer/Publisher’s Note: The statements, opinions and data contained in all publications are solely those of the individual author(s) and contributor(s) and not of MDPI and/or the editor(s). MDPI and/or the editor(s) disclaim responsibility for any injury to people or property resulting from any ideas, methods, instructions or products referred to in the content. |
© 2024 by the authors. Licensee MDPI, Basel, Switzerland. This article is an open access article distributed under the terms and conditions of the Creative Commons Attribution (CC BY) license (https://creativecommons.org/licenses/by/4.0/).
Share and Cite
Yan, Y.; Yang, L.; Huang, W. Fundus-DANet: Dilated Convolution and Fusion Attention Mechanism for Multilabel Retinal Fundus Image Classification. Appl. Sci. 2024, 14, 8446. https://doi.org/10.3390/app14188446
Yan Y, Yang L, Huang W. Fundus-DANet: Dilated Convolution and Fusion Attention Mechanism for Multilabel Retinal Fundus Image Classification. Applied Sciences. 2024; 14(18):8446. https://doi.org/10.3390/app14188446
Chicago/Turabian StyleYan, Yang, Liu Yang, and Wenbo Huang. 2024. "Fundus-DANet: Dilated Convolution and Fusion Attention Mechanism for Multilabel Retinal Fundus Image Classification" Applied Sciences 14, no. 18: 8446. https://doi.org/10.3390/app14188446
APA StyleYan, Y., Yang, L., & Huang, W. (2024). Fundus-DANet: Dilated Convolution and Fusion Attention Mechanism for Multilabel Retinal Fundus Image Classification. Applied Sciences, 14(18), 8446. https://doi.org/10.3390/app14188446