Article

Studies of Phase Transformation Kinetics in the System of Nanocrystalline Iron/Ammonia/Hydrogen at the Temperature of 350 °C by Means of Magnetic Permeability In Situ Measurement

by
Walerian Arabczyk
1,
Rafał Pelka
1,*,
Agnieszka Brzoza-Kos
2,
Ireneusz Kocemba
3,
Paulina Rokicka-Konieczna
1,
Katarzyna Skulmowska-Polok
1,
Kamila Klimza
1 and
Zofia Lendzion-Bieluń
1
1
Department of Inorganic Chemical Technology and Environment Engineering, Faculty of Chemical Technology and Engineering, West Pomeranian University of Technology in Szczecin, Piastow Ave. 42, 71-065 Szczecin, Poland
2
Faculty of Energy and Fuels, AGH University of Science and Technology, al. A. Mickiewicza 30, 30-059 Krakow, Poland
3
Institute of General and Ecological Chemistry, Lodz University of Technology, 116 Zeromskiego Street, 90-924 Lodz, Poland
*
Author to whom correspondence should be addressed.
Appl. Sci. 2024, 14(18), 8452; https://doi.org/10.3390/app14188452
Submission received: 29 July 2024 / Revised: 11 September 2024 / Accepted: 16 September 2024 / Published: 19 September 2024
(This article belongs to the Section Chemical and Molecular Sciences)

Abstract

:
The kinetics of phase transformations in the nitriding process α-Fe → γ’-Fe4N → ε-Fe3-2N of the pre-reduced iron ammonia synthesis catalyst was investigated under in situ conditions (atmospheric pressure, 350 °C) by measuring changes of mass, gas phase composition, and magnetic permeability in a differential tubular reactor. The iron nanocrystallite size distribution according to their specific active surface areas was measured, and it was found that the catalyst is bimodal as the sum of two Gaussian distributions, also differing in the value of the relative magnetic permeability. Relative magnetic permeability of small α-Fe crystals in relation to large crystals is higher by 0.02. In the area of α → γ’ transformation, the magnetic permeability dependencies change, proving the existence of two mechanisms of the α-Fe structure change in the α-Fe → γ’-Fe4N transformation. In the first area, a solution of α-Fe (N) is formed with a continuous and insignificant change of the crystal lattice parameters of the iron lattice. In the second area, there is a step, oscillatory change in the parameters of the iron crystal lattice in FexN (x = 0.15, 0.20, 0.25 mol/mol). In the range of γ’-Fe4N → ε-Fe3-2N transformation, a solution is formed, with nitrogen concentration varying from 0.25–0.45 mol/mol. During the final stage of the nitriding process, at a constant value of the relative magnetic permeability, only the concentration of nitrogen in the solution εr increases. The rate of the phenomenon studied is limited by a diffusion rate through the top layer of atoms on the surface of iron nanocrystallite. The estimated value of the nitrogen diffusion coefficient varied exponentially with the degree of nitriding. In the area of the solution, the diffusion coefficient is approximately constant and amounts to 5 nm2/s. In the area of oscillatory changes, the average diffusion coefficient changes in the range of 3–11 nm2/s, and is inversely proportional to the nitrogen content degree. The advantage of the research method proposed in this paper is the possibility of simultaneously recording, under reaction conditions, changes in the values of several process parameters necessary to describe the process. The research results obtained in this way can be used to develop such fields of knowledge as heterogeneous catalysis, materials engineering, sensorics, etc.

1. Introduction

During the past decades, nanomaterials have been intensively studied as promising new materials in the field of nanotechnology, catalysis, medicine and others [1]. As for medicine, nanomaterials are applied, among others, as drug carriers and in many diagnostics [2,3,4,5,6]. They are also important in electronics as nano-transistors, conductors, and displays [7,8,9,10]. Nanosubstances may also be used to store energy (batteries or supercapacitors) and to improve efficiency of solar panels [11,12,13,14,15]. Nanomaterials also find wide application in the construction sector, mainly as elements of composites, because of their impact on the properties of the material, such as increased strength, lightness, and better thermal and electrical conductivity, as well as self-healing, corrosion protection capabilities, and many others [16,17,18,19,20,21,22]. In case of this work, an important application of nanomaterials is catalysis. They work well as catalysts because of their large specific surface area and a different structure compared to their macroscale equivalents [23,24,25,26,27,28,29]. Moreover, nanomaterials can potentially play a significant role in advancing quantum technologies. Research into them may open new possibilities for the development of next-generation quantum computers, sensors, and communication systems [30,31,32,33,34,35,36]. Nanomaterials create opportunities for the development of each of the above-mentioned areas and more, that conventional materials do not provide [37,38,39,40,41,42,43,44]. However, it should be remembered that they may be potentially dangerous, as research into their negative impact, especially on health and the environment, is still ongoing [45,46,47,48,49,50].
For some industrial processes and technologies, accurate determining of particle size distributions is a must, especially when dealing with nanomaterials (determining the mean size of nanocrystallites only is not sufficient) [51,52,53,54,55,56,57,58].
Additionally, it is crucial to have a better understanding of phenomena occurring on nanoparticle surfaces under process conditions, in particular in heterogeneous catalysis [59,60,61,62,63,64,65,66,67,68,69,70,71,72,73,74,75]. The iron ammonia synthesis catalyst (a nanoFe-NH3-H2 system), which contains less than 8% of promoters (apart from nano-iron), was the subject of numerous studies related to the determination of the mechanisms of ammonia synthesis and its decomposition [59,60,61,62,76,77], as well as the nitriding process [78,79,80]. Phenomena occurring in the iron catalyst at elevated temperatures were also studied [81]. The sintering of the catalyst that occurred at that time was analyzed in terms of the behavior of the promoters on the catalyst surface.
On the basis of kinetic studies of a nitriding process of the above mentioned catalyst [79], a model of the reactions taking place between iron nanocrystallites and a gas phase was proposed [79,80]. It was observed that α-Fe nanocrystallites undergo a phase transition to γ’-Fe4N nitride in their whole volume in the order of their sizes, from the smallest to the largest [79,80]. These studies were enabled for elaborating two chemical methods for determining the iron nanocrystallite size distributions: (1) involving measurement of the average crystallite size [79] by the XRD technique; and (2) based on determining the rate of chemical reaction corresponding to given conversion degrees [79].
It was determined [78,82,83,84] that during the nitriding of the iron ammonia synthesis catalyst (at a constant temperature) using hydrogen + ammonia gas mixtures of increasing nitriding potential, P, steady states were set up (at a given equilibrium nitriding potential, P0, depending on the size of the nanocrystallites [58]). Under those conditions, the catalytic ammonia decomposition reaction runs at a constant rate but the nitriding reaction rate is zero. Another thing is that iron (or nitride) nanocrystallites undergo phase transformations differently—in the order from the largest to the smallest with increasing (or decreasing) gas phase nitriding potential [58]. The phenomenon of hysteresis in chemical reactions was also observed [59,82].
To sum up, the conducted research [85] showed that phase transformations in the discussed systems occur from nanocrystallites of the biggest active surfaces to those with the smallest, when the actual potential of the adsorbate is much higher from the equilibrium potential of a nanocrystallite of the biggest active surface. If these potentials are similar, the order in which the reaction occurs is reversed. Furthermore, α-Fe(N) nanocrystallites can exist in equilibrium together with γ’-Fe4N nanocrystallites (under constant gas phase nitriding potential) [86], which is understandable when we take into account the nanocrystallite size as an additional parameter in the Gibbs phase rule [58,82].
Using the Crank equations [87], it was stated [88] that the chemical process rate can be limited by diffusion through the top layer of iron atoms on the nanocrystallite surface only. Values of nitrogen diffusion coefficient through the boundary layer of iron atoms was also estimated.
The promoter-doped iron catalyst was also studied using the magnetic resonance method [89]. The study was carried out for samples with different sizes of nanocrystallites. This allowed the influence of medium-sized nanocrystallites on the magnetic properties of this material to be determined.
Recently, an innovative method for the characterization of an iron catalyst under the conditions of a chemical reaction has been developed [90], consisting of the measurement of kinetic quantities with simultaneous measurement of magnetic permeability. The tests were carried out with the use of pressed samples of an industrial iron catalyst at a temperature of 350 °C.
The goal of the present work is to study and explain the phenomenon observed in the nitriding process of the industrial iron ammonia synthesis catalyst under the reaction conditions, simultaneously characterizing this catalyst both in terms of the kinetics of the nitriding process and determining changes in its properties taking place in its volume by measuring changes in magnetic permeability. The result of the work will be to broaden the knowledge about changes in the volume of iron nanocrystals in the nitriding process based on the understanding of the relationship between kinetic and thermodynamic parameters and changes in the transformation process in the volume of nanocrystallites.

2. Materials and Methods

In the experiments, a pre-reduced iron ammonia synthesis catalyst was applied. Samples for the experiments were obtained by fusing magnetite with promoter oxides and then activating them according to the procedure described elsewhere [59,60,61,79,89]. Chemical composition of the catalyst samples was measured using the inductively coupled plasma method (ICP-OES, spectrometer Perkin Elmer, type Optima 5300DV, Perkin Elmer, Woodbridge, Ontario, Canada). The catalyst studied contained, apart from metallic iron, the following promoters: 3.3 wt.% Al2O3, 2.8 wt.% CaO, and 0.7 wt.% K2O.
Studied processes (reduction of a catalyst passive layer, annealing the catalyst under hydrogen atmosphere, and nitriding with gaseous ammonia) were conducted using a differential tubular reactor, which was designed and built at our university [81,90] and then certified by the external authorities). The software controlling this apparatus and recording of the measurement results is also our product, written in Turbo Pascal by the person who built the apparatus. The results recorded in this way were further calculated and visualized using MS Excel™ 2016 software. This apparatus enabled us to perform thermogravimetric measurements (accuracy of 5·10−5 g) as well as examine hydrogen concentration in a gas phase (using a katharometric analyzer; accuracy of 1 vol.%) [58]. Gas samples were taken from the immediate vicinity of the catalyst. Then, ammonia concentration in the gas phase was calculated making use of the mass balance of the reactor. Flow rates of gaseous reactants were regulated by electronic mass flow controllers. A catalyst sample of ca. 1 g (including 0.840 g Fe) was placed in the form of a single layer of grains (grain size in the range of 1.0–1.2 mm) in a glass basket connected with the arm of a balance. Conditions for the chemical processes conducted in the kinetic region were ensured.
Reduction of a passive layer of the catalyst was carried out at 500 °C (the rate of temperature increase was 10 °C min−1) with a flow of hydrogen 0.009 mol min−1 up to the stabilization of the catalyst mass.
Then, the reduced and activated catalyst sample was nitrided at 350 °C with gaseous ammonia (0.009 mol min−1; reactor inlet: 100% of ammonia). After this process, the nitrided sample was reduced at the same temperature. After that, the specific surface area was determined making use of a volumetric method (by means of the Brunnauer-Emmet-Teller (BET) equation; apparatus AutoChem II 2920, Micromeritrics, Norcross, GA, USA).
Additionally, the applied reactor was equipped with a system enabling the in situ measurements of magnetic permeability of the solid samples. Details of the measuring system were presented elsewhere [90].
Samples of identical iron catalyst were also examined using transmission electron microscopy (TEM), scanning electron microscopy (SEM), and X-ray diffraction (XRD) methods. Examples of representative results for samples of the catalyst in the present work are given, e.g., in the works [81,85,88,89].

3. Results

The exemplary results of the performed experiments, including changes of nitriding degree, gas-phase hydrogen concentration and relative magnetic permeability (RMP) during the nitriding at 350 °C as functions of time, are presented in Figure 1. RMP is defined as follows:
R M P = μ N μ P
where μP (marked in Figure 2b) is the counterpart, whereas μN means the value of bridge voltage recorded for the iron sample during its nitriding.
The measured nitriding reaction rate can be described as follows [77]:
d x b t d t = i = m i n i = m a x n i b N i d x b t d t i = i = m i n i = m a x n i b N i d n b t n i b , a d t i = = i = m i n i = m a x f C V D d n b t d t i = d n N / n F e d t = d α d t
where nib—number of moles of nitrogen in i-th nanocrystallite volume, Ni—number of i-th nanocrystallites, CVD—nanocrystallite volume distribution (determined using the chemical method described in [79]), nN/nFe (in short α)—nitriding degree of nanocrystalline iron (ratio of moles of nitrogen, nN, to moles of iron).
Based on the measurements of the catalyst weight changes, the nitriding reaction rate, d(nN/nFe)/dt, and relative magnetic permeability changes, dRMP/dα, viz. the change in relative magnetic permeability with the change in nitriding degree, α (which is a property of the tested substance), were determined and presented as a dependence on the catalyst nitrogenization degree, nN/nFe [mol of nitrogen/mol of iron], in two areas, γ’r and γ’k, in Figure 2. Enlargement of a fragment of the above Figure—increasing the relative magnetic permeability in the field of phase change α → γ’ depending on the degree of nitriding of the catalyst is presented in Figure 2b.
The blue color shows the bimodal size distribution of iron nanocrystallites according to their volume in the range of sample reaction nN/nFe = 0.00–0.25 mol/mol, consisting of two sets of nanocrystallites, marked as γ’r and γ’k, differing in the active specific surface, A, 0.10 nm−1 (in the range of 0.07–0.15 nm−1) and 0.05 nm−1 (in the range of 0.04–0.08 nm−1), respectively [69]. The phase change occurs in direct proportion to the S/V of the nanocrystallites in order from the largest to the smallest [58].
The specific active surface is the ratio of the active area, Sa, to the iron nanocrystallite volume, V, in the sample, A = Sa/V, and is equal to the sum of the areas for the i-th iron nanocrystallites Ai = Sa,i/Vi [nm−1] (can be also expressed in [mol/mol] units when: Sa,i represents number of moles of active sites on the catalyst surface [mol] equal to the total number of moles of surface iron atoms minus the number of these atoms occupied by promoters; Vi represents moles of iron in the volume of a nanocrystallite [mol]). The iron surface is mainly wetted by a two-dimensional layer of groups of surface potassium oxide Fe–O–K, and an active surface is formed [91].
We have two sets of nanocrystallites with different active specific surfaces due to the processes during the reducing of the iron catalyst precursor [92]. The distribution is bimodal and proportional to the rate of the chemical reaction, and the active specific surface area is the proportionality factor [93].
In terms of the formation of the γ’ phase, there are two areas of γ’r and γ’k (points 0–1 and 1–2). In the first area of γ’r, the initial value RMP = 1.02 with a degree of surface coverage equal to 0 was observed, in which the RMP is described with different dependencies of RMP on nitriding degree, as follows:
RMP(γ’r) = 0.06 nN/nFe + 1.02
RMP(γ’k) = 0.20 nN/nFe +1.00
RMP(εr) = −2.92 nN/nFe + 1.76
The lack of oscillation (points 0–1) means that within this range of the degree of conversion, a solution of nitrogen γ′r in the structure of γ′ with continuous change in nitrogen concentration is produced. This solution is stable up to nitriding degree 0.25 mol/mol. The oscillations between points 1 and 2 are the result of the occurrence of α → γ′k phase transitions producing stoichiometric iron nitride γ′ of a crystal structure with a step change in nitrogen concentration, causing oscillating changes in the measured RMP values. The oscillations of the RMP correlate with the oscillation of the nitriding reaction rate. In the transition region (points 2–4), the RMP decreases with increasing nitrogen content, reaching a minimum at 0.47 mol/mol. In the area of ε phase formation (above point 4), no RMP oscillation is also observed, so there is also a nitrogen solution region there, and not a stoichiometric chemical compound.
Taking into account the above discussion and the results shown in Figure 1 and Figure 2, the percent changes in phase composition during the nitriding were determined. The obtained calculation results are presented in Figure 3.
It was observed that for the nitriding degree of 0.00–0.24 mol/mol, α and γ’ phases coexist in the catalyst. In the area of 0.24–0.25 mol/mol there is a transition region in which there are large α phase nanocrystallites, small ε phase nanocrystallites, and the rest of the nanocrystallites are in the γ′ phase. In the range of nitriding degree > 0.25 mol/mol, there is a mixture of γ′ and ε phases (points 4–6).

4. Discussion

4.1. Thermodynamics of Phase Transformation

Phase transformation of single nanocrystallites, including α-Fe(N) ones, was studied and described in detail elsewhere [66,69]. It was concluded there that total change in the Gibbs energy of the Fe-N system, ∆G, is zero and therefore the following balance was applied for model calculations:
Δ G Fe , i b , α γ + Δ G N , i b + Δ G N , i s + Δ G Fe , i s = 0
where:
  • ∆GFe,ib,α-[γ]*–Gibbs free energy change for crystal lattice transformation of phases α-Fe(N) → [γ’]*-Fe4−xN;
  • ∆GN,ib–Gibbs free energy change of nitrogen dissolved in a volume of iron nanocrystallite;
  • ∆GN,is–Gibbs free energy change of nitrogen adsorbed on iron nanocrystallite surface;
  • ∆GFe,is–surface energy change of iron nanocrystallite during phase transition process;
According to the above energy balance, the phase transformation of the i-th iron nanocrystallite will occur after nitrogen reaches the critical Gibbs free energy value related to the nitrogen concentration corresponding to the critical nitriding potential, P0,i. The concentration of nitrogen in the crystal at the time of transformation is an averaged critical concentration, xN,ib,cri, in the volume of the nanocrystallite. It was found [52,58] that the smaller the iron nanocrystallite, the higher the critical concentration that must be achieved for the α → γ′ phase transformation to take place, and this is directly proportional to the active specific surface [30,65]. In this particular chemical system, the energy needed for the phase transformation to occur is supplied with the increasing nitriding potential of a gas phase.

4.2. Kinetics of Phase Transformation

For an individual i-th iron nanocrystallite, the classical equation describing the nitriding reaction rate can be written as follows [88]:
d x N b t d t i = A i P t k 0 e x p E a R T
where x N b ( t )—mean concentration of nitrogen in the volume of iron nanocrystallite, t—time, k0—pre-exponential coefficient, Ea—activation energy of chemical reaction, R—gas constant, T—temperature.
When we take into account the effect of three process parameters (T, P, and Ai) on the chemical reaction progress, the rate of the nitriding reaction can be described as follows [69]:
d x N b t d t i = x N b t d T T   d t + x N b t d P P   d t + x N b t d A i A i   d t
For processes limited by the diffusion rate, the diffusion rate coefficient should be included in the equation:
D = D 0 e x p E a d i f f R T
where D0—pre-exponential coefficient and Eadiff—activation energy of diffusion process in volume of crystallites.
Therefore, combining Equations (5)–(7), the following dependence is derived [85,88]:
d x b t d t i = A i D 0 e x p E a d i f f R T i E a d i f f R T 2 P d T d t + A i d P m a x d t + A i D 0 e x p E a d i f f R T i P d A d t
It can be concluded that the diffusion rate is proportional to the active surface area, Ai, of the i-th nanocrystallite.
From previous studies, it is known [79] that the gaseous adsorbate concentration, xNg(t), varies as follows:
P t = x N g t = x N , 0 g 1 e x p v V r t
where v—gas flow rate, Vr—reactor volume, and xN,0g—maximum concentration in the gas phase.
The mean concentration of nitrogen in the whole volume of a single iron nanocrystallite can be calculated using the following equation proposed by Crank [87]:
x b t A i = 1 3 D i v V r r m a x 2 e x p v V r t 1 v V r r m a x 2 D i 1 2 c o t v V r r m a x 2 D i 1 2 + 6 v V r r m a x 2 π 2 D i n = 1 n exp D i n 2 π 2 t / r m a x 2 n 2 n 2 π 2 v V r r m a x 2 / D i
From literature [94], we know that the actual diffusion coefficients for such chemical elements as nitrogen, oxygen, and carbon in iron (for a temperature range of 200–500 °C) change within the range D = 103–106 nm2/s. Based on the calculation obtained from the above equation and using the literature diffusion coefficients, it was found that the time during which the steady state is established in the volume of the nanocrystal at a given nitriding potential of the gas phase is much shorter than the time during which this state is established during the measurements.
Diffusion in the volume of nanocrystallites is fast and limits the passage of nitrogen through the surface according to the adopted model.
Under the conditions of the performed nitriding process (viz. when actual gaseous phase nitriding potential P(t) >> P0) and the surface concentration of nitrogen is maximum (xN,is = Ai).
Then, concentration values calculated according to Equation (9) in the kinetic area (when P(t) >> P0) change according to the following equation:
l n x N , i s = K a d , i l n P l n A i
where Kad,i—adsorption equilibrium constant.
In the model, where the diffusion rate is limited at the phase boundary, the energy barrier is the difference in the molar Gibbs free energy of dissolved nitrogen in iron volume GN,ib and chemisorbed nitrogen on the surface GN,is:
G N , i b G N , i s = Δ G N , i d i s s
Then, Equation (7), with respect to the area unit of the i-th crystallite, takes the form:
D i s = A i V i exp Δ G d i s s R T
To sum up, the mean concentration of nitrogen in the volume of iron nanocrystallites is calculated taking into account the effect of such thermodynamic parameters as gas phase chemical potential, temperature, and nanocrystallite size according to the equation [88]:
x N , i b t = T 0 T P 0 P A 0 A d x N b t d t i d T d P d A i
On the other hand, the saturation rate of the iron i-th nanocrystallite with nitrogen is related to the nitrogen concentration gradient between surface and volume of the nanocrystallite according to Fick’s equation [88]:
d x N b t d t i = D i s x N , i s x N , i b t
To simplify the experimental system, we operate, at constant, both temperature and potential of the gas phase. Then, the chemical reaction rate can be described as follows [88]:
Δ x N b t Δ t i = n N , i b N i x N b = 0 x N b d x N b t d t n F e , i b Δ t i + C 1 + C 2
where n—number of moles, Ni—number of nanocrystallites in the i-th set of nanocrystallites in the sample, and C1, C2—constants taking into account the influence of temperature and gas phase potential on the reaction rate.
Substituting Equation (15) to (16), we calculate [88]:
Δ x N b t Δ t i = n N , i b N i x N b = 0 x N b x N s x N b t i d t n F e , i b Δ t i = n N , i b N i D i s x N b = 0 x N b 1 x N b t i d t n F e , i b Δ t i
The iron ammonia synthesis catalyst contains a set of huge number of nanocrystallites, which can be described by the distribution density function of their sizes [95]. In the present paper, it was agreed that this distribution is bimodal, which is expected on the basis of both experimental tests [79,95] and model calculations [58].
The sum of all surfaces of nanocrystallites in the catalyst, St, corresponding to 1 mole of nanocrystalline iron, can be calculated as a cumulative distribution function (CDF):
C D F = A m i n A m a x 1 σ 2 π e x p A A m 2 2 σ 2 d A = 1 2 1 + e r f A m a x A m i n A m σ 2
where Amin—active surface area consistent with the minimum gas-phase nitriding potential in the reactor, Amax—active surface area related to the maximum gas-phase nitriding potential in the reactor, and erf—Gauss error function.
Figure 4 presents changes in the diffusion coefficient depending on the degree of nitriding of the catalyst in the γ’ phase, calculated using Equation (17) and taking into account that the nanocrystalline iron sample consists of two nanocrystalline sets of an average active surface area, 0.10 and 0.05 nm−1, respectively. CVD of nanocrystallites is also added to the figure below.
After taking into account the phase composition of the nitrided nanocrystalline iron sample (Figure 3), it can be said that the value of the diffusion coefficient is approximately constant for iron nanocrystallites of nitrogen solution without phase change with a higher average active surface area (0.10 nm−1). For nanocrystallites with a lower average active specific surface (0.05 nm−1) in a phase-change region, a large variation in the value of the diffusion coefficient is observed with the change in the degree of nitriding of nanocrystalline iron. Between the two sets of nanocrystallites, there is a discontinuity in the dependence of the diffusion coefficient on the degree of nitriding for two areas of γ’r and γ’k.
In this work, the value of the diffusion coefficient in the volume of iron nanocrystallite was Ds = 3–11 nm2/s (Figure 4).
On the basis of the calculated values of the diffusion coefficient, using Equation (13), the appropriate Gibbs free energies of nitrogen dissolution in iron volume were calculated for two sets of iron nanocrystallites in the sample, differing in the mean active specific surface area in two regions of γ’r and γ’k (Figure 5).
Based on the results contained in the work [96] in which the interplanar distances in iron nanocrystallites at different levels of nitriding were measured, in this work the volumes of unit cells in these nanocrystallites were calculated. It was found that the bigger nanocrystallite, the smaller the unit cell volume it possesses, and thus it is possible to present the dependence of the calculated diffusion coefficients Ds and Gibbs free energies of nitrogen dissolution (using Equations (13) and (15)) on the unit cell volume of iron in the sample at specific conversion degrees in the range 0.00–0.25 mol N/mol Fe (Figure 6).
It can be concluded that with the increase in the size of nanocrystallites, their unit cell volume and the diffusion coefficient value decrease and the Gibbs free energy of nitrogen dissolution in iron volume increases. In particular, in the first area γ’r (solution, small nanocrystallites), slight changes in both the diffusion coefficient and the unit cell volume are observed. In the second area γ’k (large nanocrystallites) there are significant changes in both the diffusion coefficient and the unit cell volume.
In the study [96], the mean size of nanocrystallites and the interplanar distances were measured, so it is possible to correlate the current results with the results from the previous work (Figure 7).
The dependence of the nitrogen diffusion coefficient in nanocrystalline iron on the mean size of the nanocrystallites, dm, can be described by the following equations:
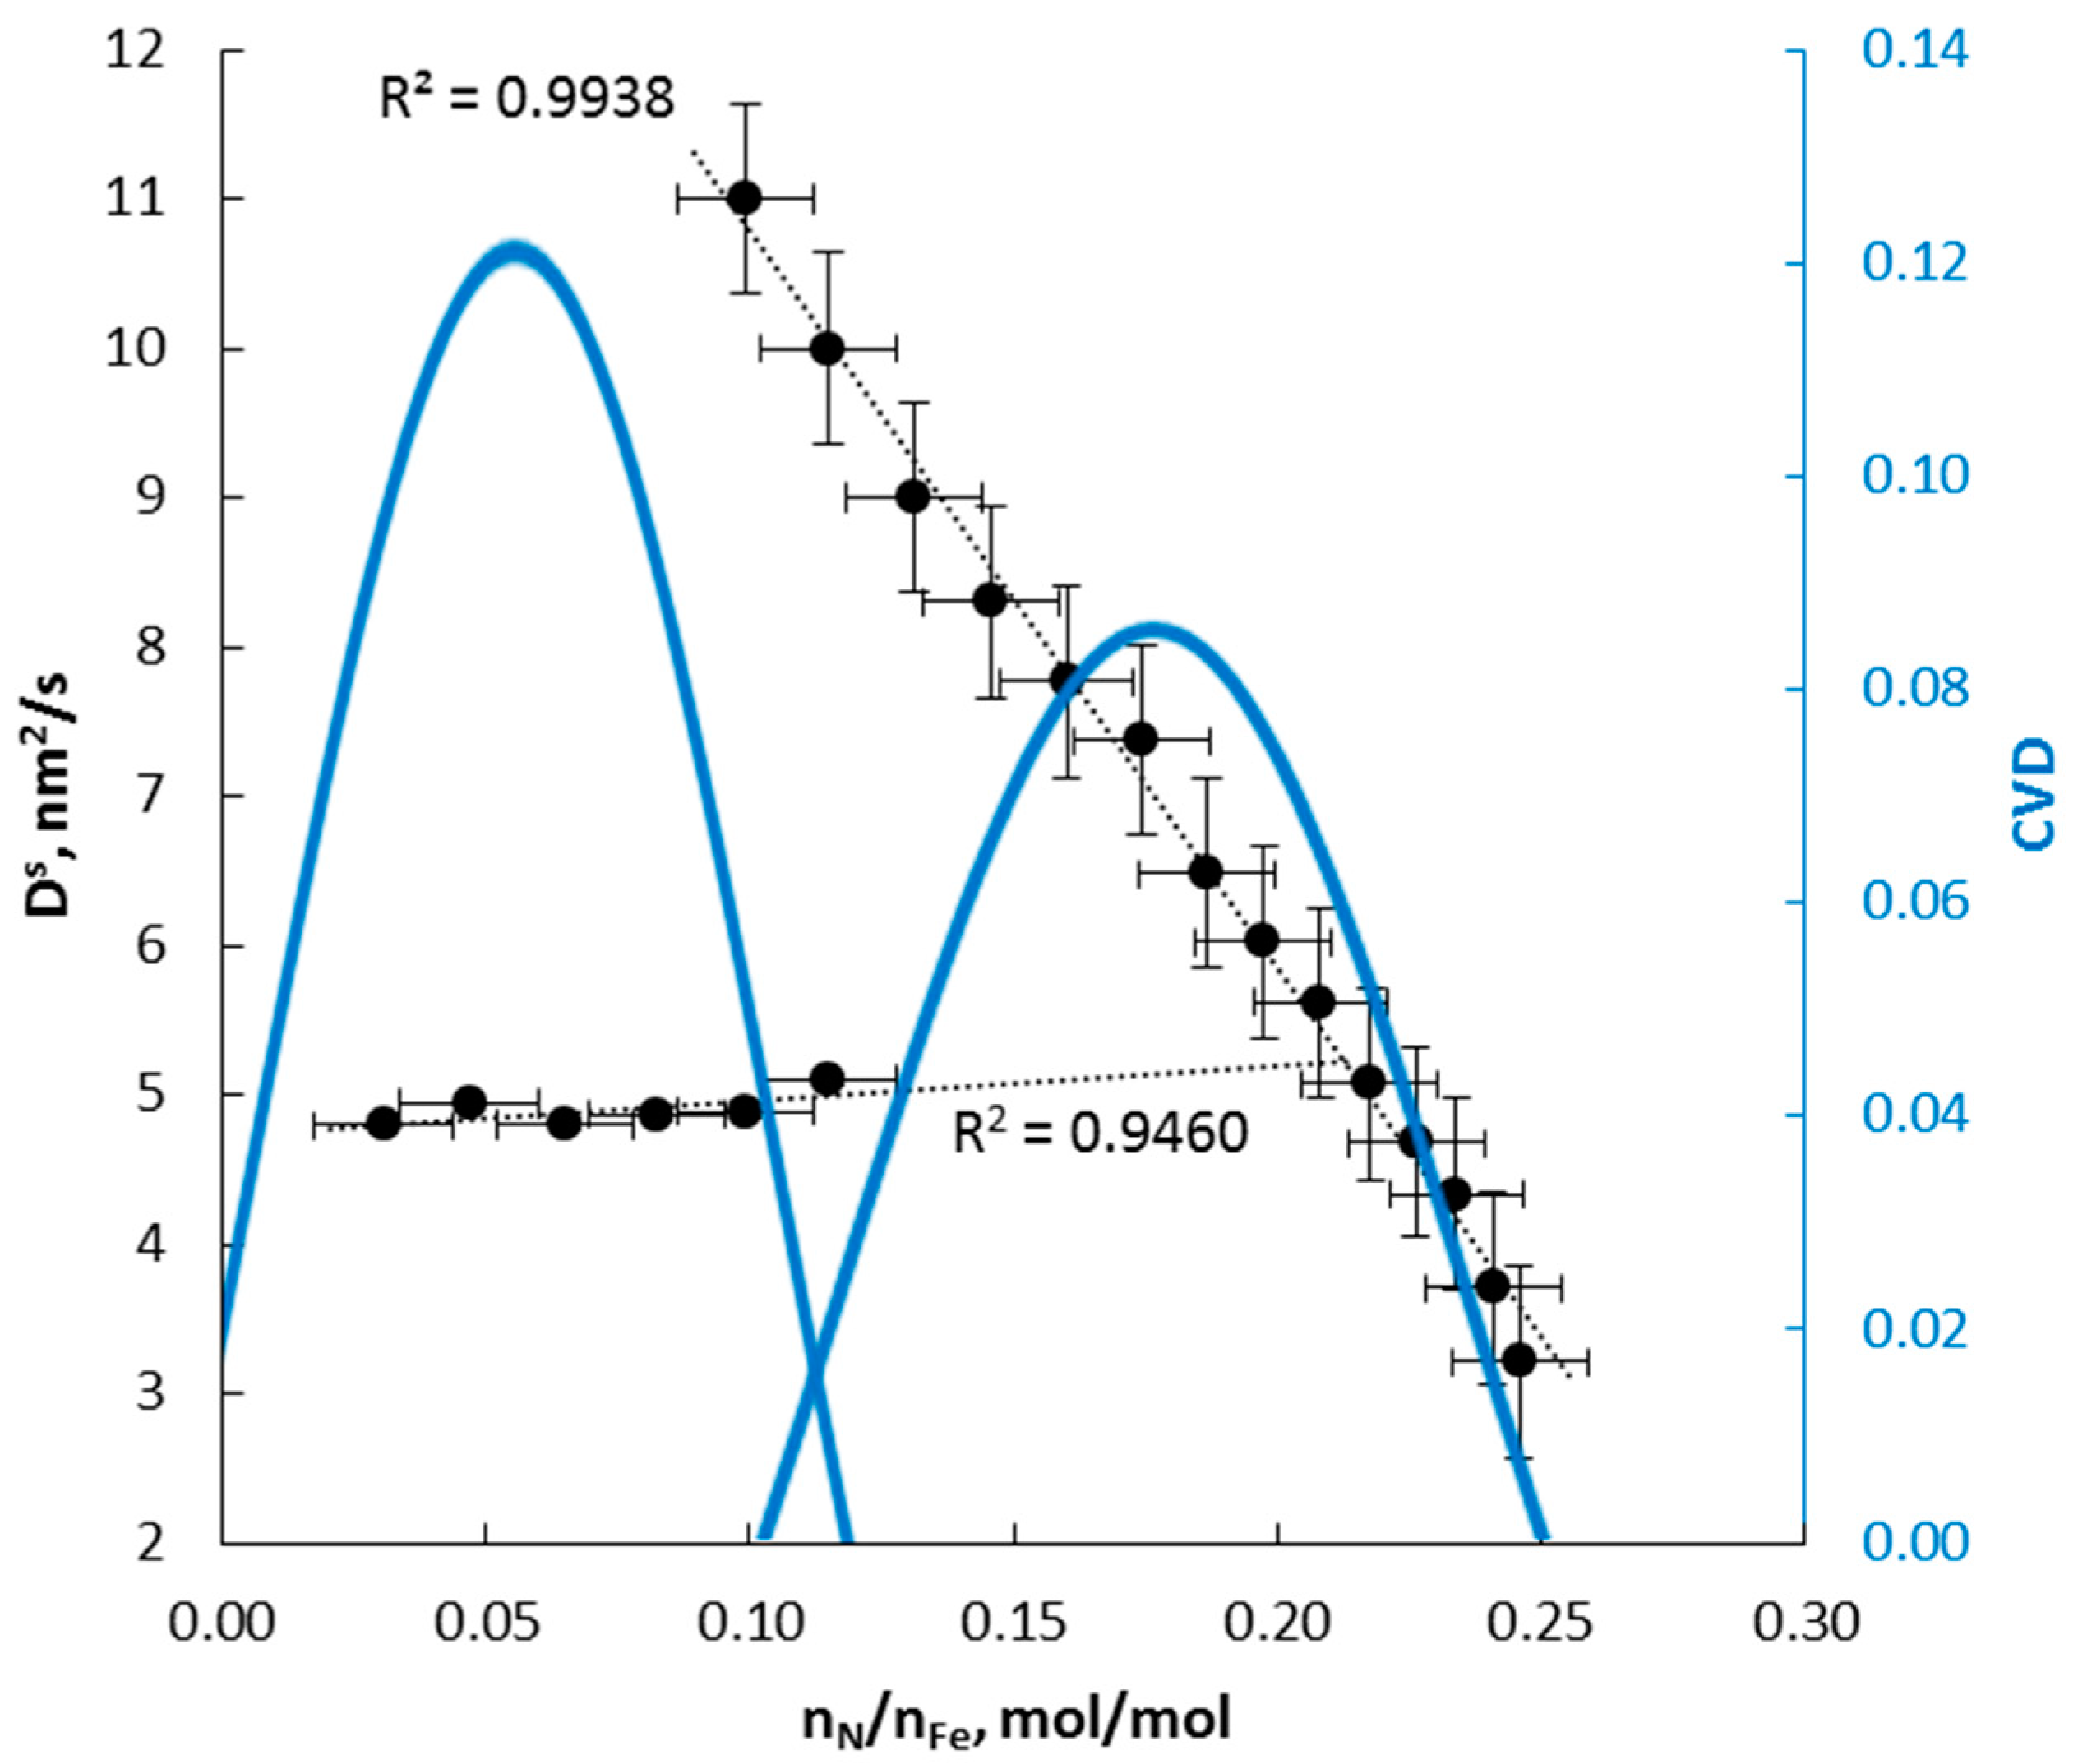
  • for small nanocrystallites and low concentrations (nitrogen solution in the γ’ lattice)
DS = 0.03 dm + 4
  • for large nanocrystallites and high concentrations:
DS = −0.47 dm + 24
It can be seen that in the area γ’k of high nitrogen concentrations, the Gibbs free energy of nitrogen dissolution in iron depends exponentially on the nitrogen concentration in iron. Taking into account the results presented in Figure 5, Figure 6 and Figure 7, it should be stated that the changes in the nitrogen diffusion coefficient in nanocrystalline iron are related to the Gibbs free energy of nitrogen chemisorbed on the surface dissolution in iron volume. It is this parameter that limits the diffusion rate in the tested system. Moreover, it can be observed that there are areas γ’r of nitrogen solution for small nanocrystallites where this enthalpy slightly depends on their size. There are also areas where changes in the structure of nanocrystallites are pronounced, and thus this enthalpy changes. Thus, the Gibbs free energy of nitrogen dissolution is related to the structure of the nanocrystal.
Figure 8 shows the dependencies of the diffusion coefficient, the Gibbs free energy of nitrogen dissolution and iron unit cell volume on RMP for two regions of γ’r and γ’k.
From the above figures, it can be concluded that the values of parameters such as unit cell volume, diffusion coefficient, and activation energy of the diffusion process can be determined by measuring the magnetic permeability of the sample during an in situ chemical reaction.
It was found [96] that in the nitriding process, carried out using the CPPR method, the unit cell volumes depend on the average size of nanocrystallites. It can therefore be concluded that discontinuity in the values of both the diffusion coefficient, the Gibbs free energy of nitrogen dissolution in iron volume, and magnetic permeability are the result of changes in the structure of iron nanocrystallites as a result of increasing nitrogen concentration in nitrogen solution in nanocrystalline α-iron and iron nitrides.
Among the parameters influencing the speed of the process, the surface structure and active specific surface are also decisive. As a model, we assume two values of the active specific surface A, but this is a simplification, and we should remember that each nanocrystallite may have an individual value of A.

5. Conclusions

The phase transformation process α → γ’ is an isothermal-isobaric process and takes place when the nanocrystallites reach the critical concentration of nitrogen in iron and the sum of Gibbs free energy of chemisorbed nitrogen on the surface and dissolved in the volume of an iron nanocrystallite compensates the Gibbs free energy of deformation of the unit cell volume of the α-iron phase. In the kinetic region, the nitrogen potential on the surface is constant and greater than the molar critical potential, the rate limiting step of the process is diffusion through the phase boundary of a single crystal, and the achievement of the critical concentration depends on the crystal volume. The diffusion activation energy is defined by the process enthalpy, which is the difference between the chemical potential of a chemisorbed nitrogen atom on the surface and chemical potential of this atom in the volume of iron. The diffusion coefficient is directly proportional to the degree of nitriding at exponentially changing activation energy. In the nitriding process, nanocrystallites react in their entire volume in the order from the smallest to the largest, which is proportional to the volume of the crystals and inversely proportional to the specific active surface.
The tested catalyst has a bimodal structure consisting of two sets, both from the point of view of the active surface area of the crystal and changes in magnetic permeability. The difference in sets may be due to a change in the concentration of promoters on the catalyst surface. This dependence is related to the change in the diffusion rate related to the changes taking place in the crystal volume. These sets are related to the different diffusion mechanisms in α → γ‘r and in γ‘k → εr solutions and with step changes in the parameters of the crystal lattice, depending on the crystal size and the degree of nitriding α → γ‘k:
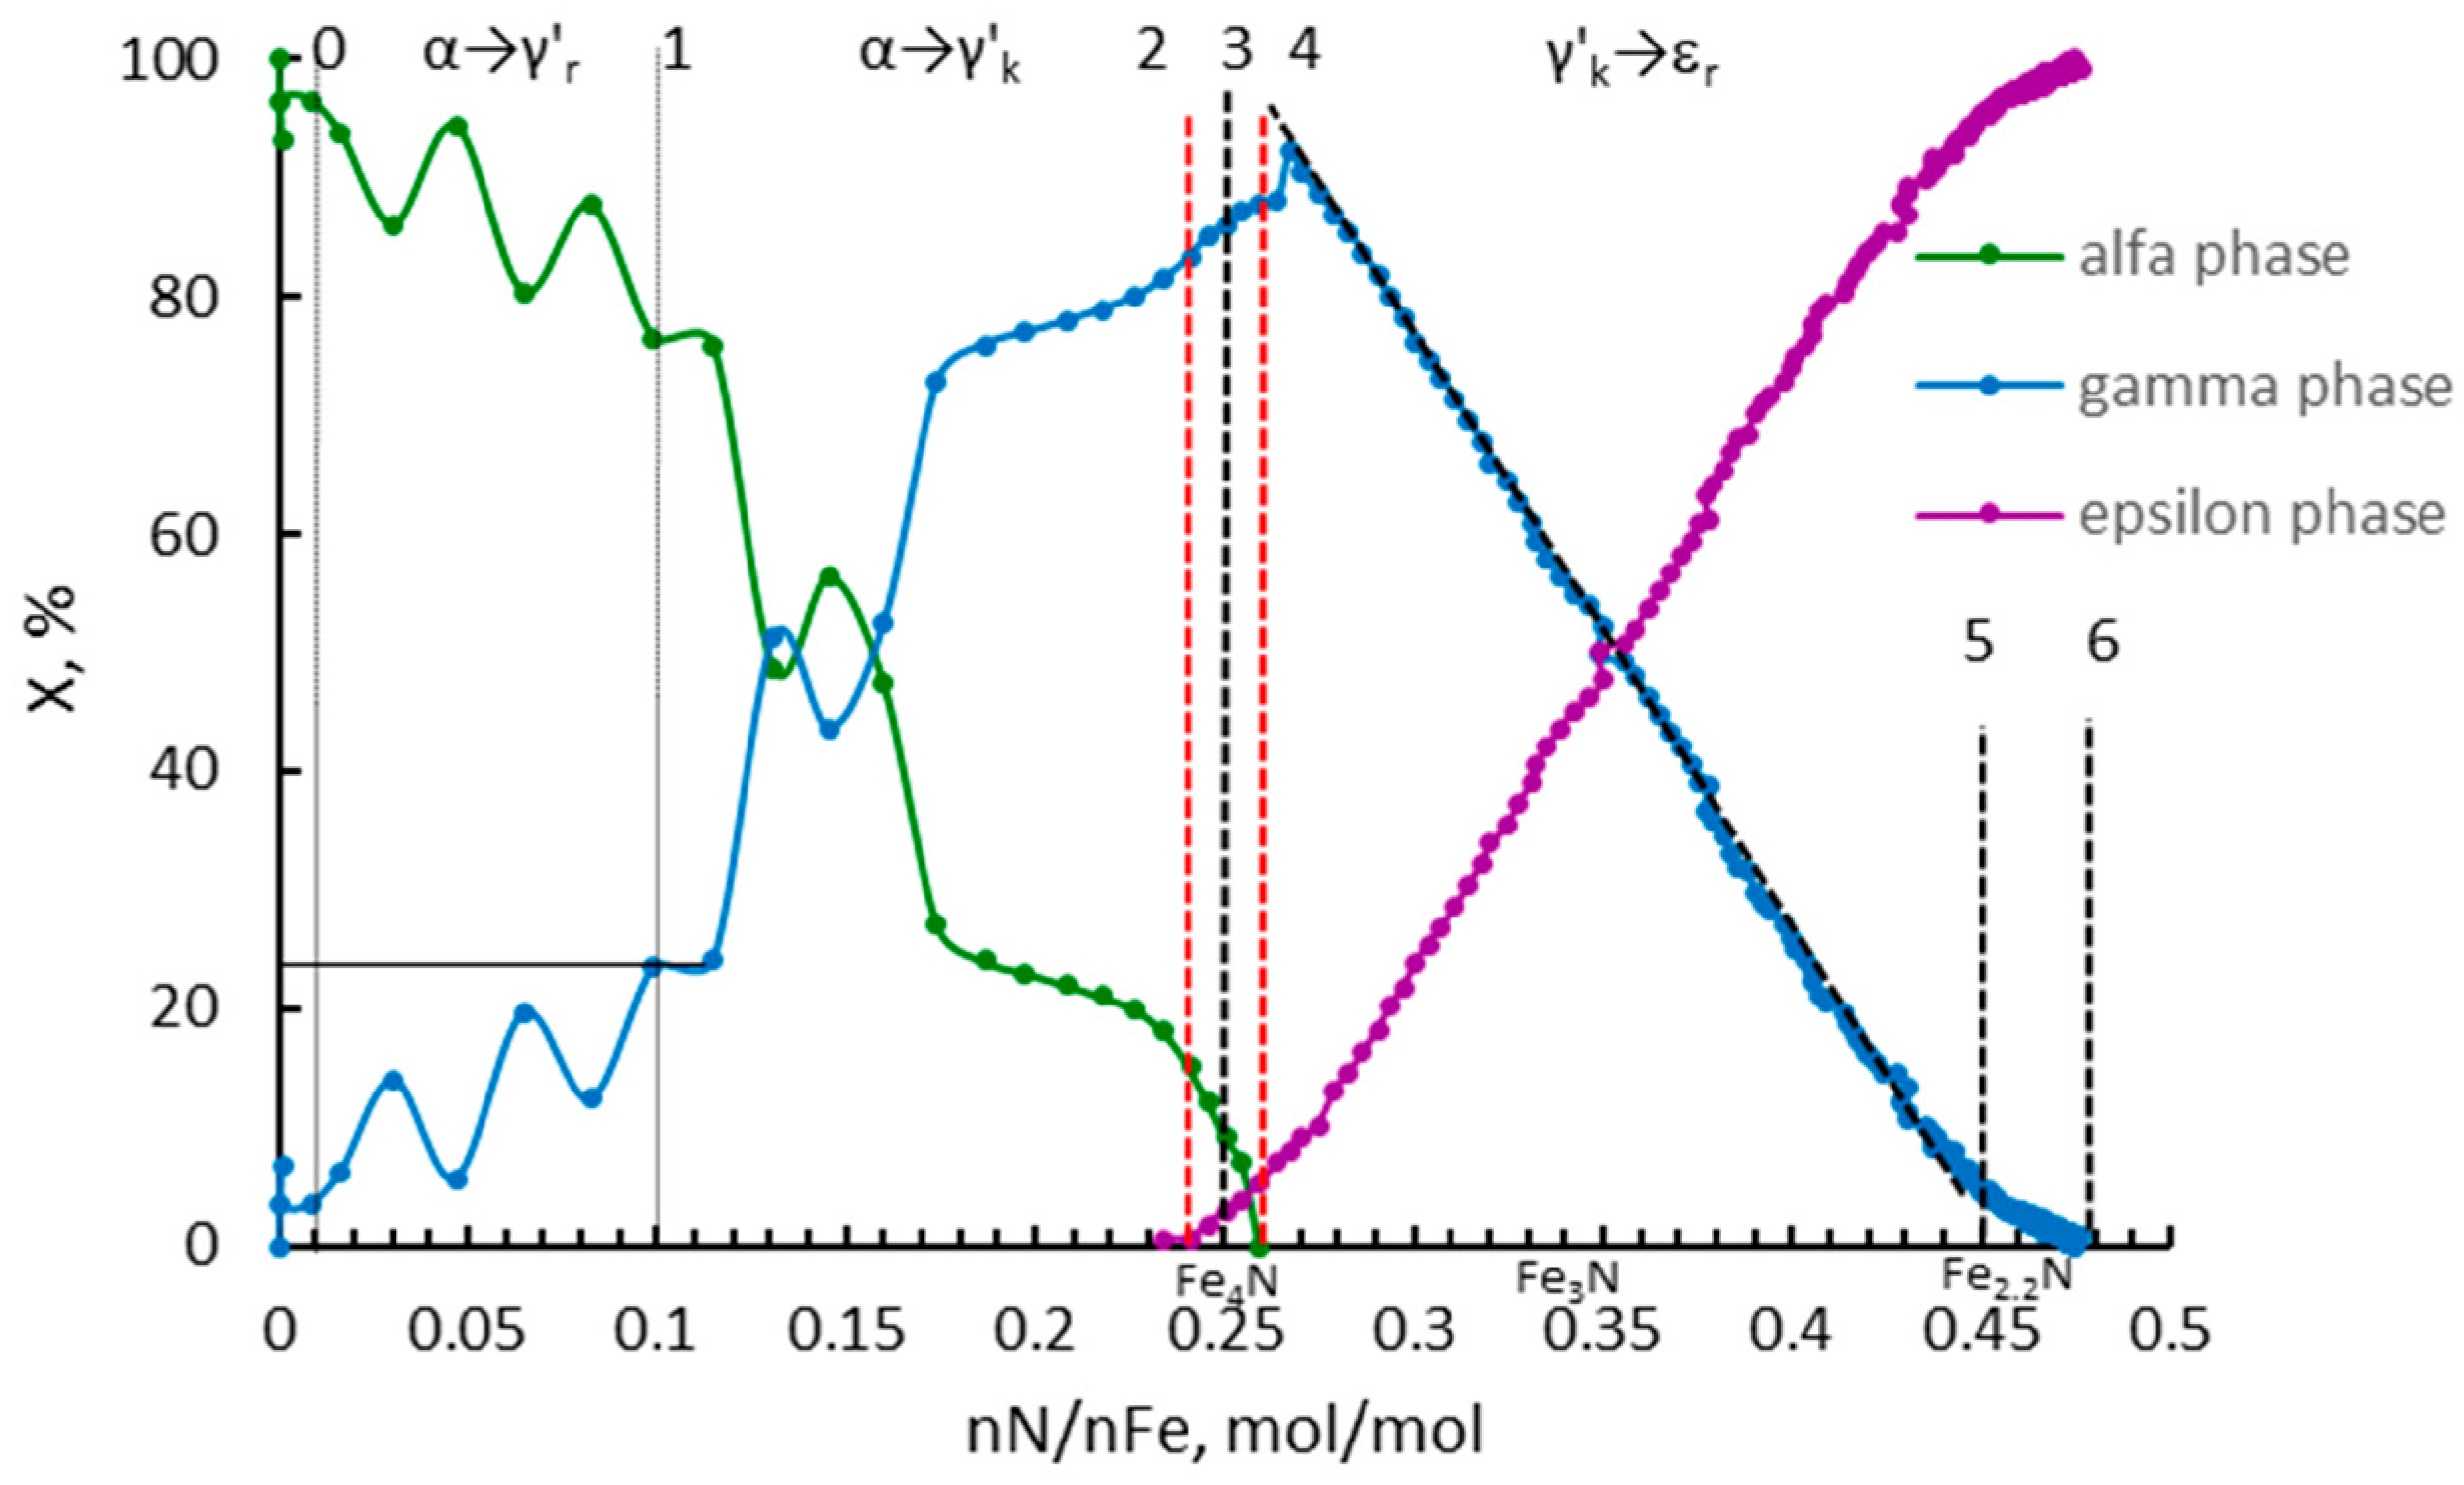
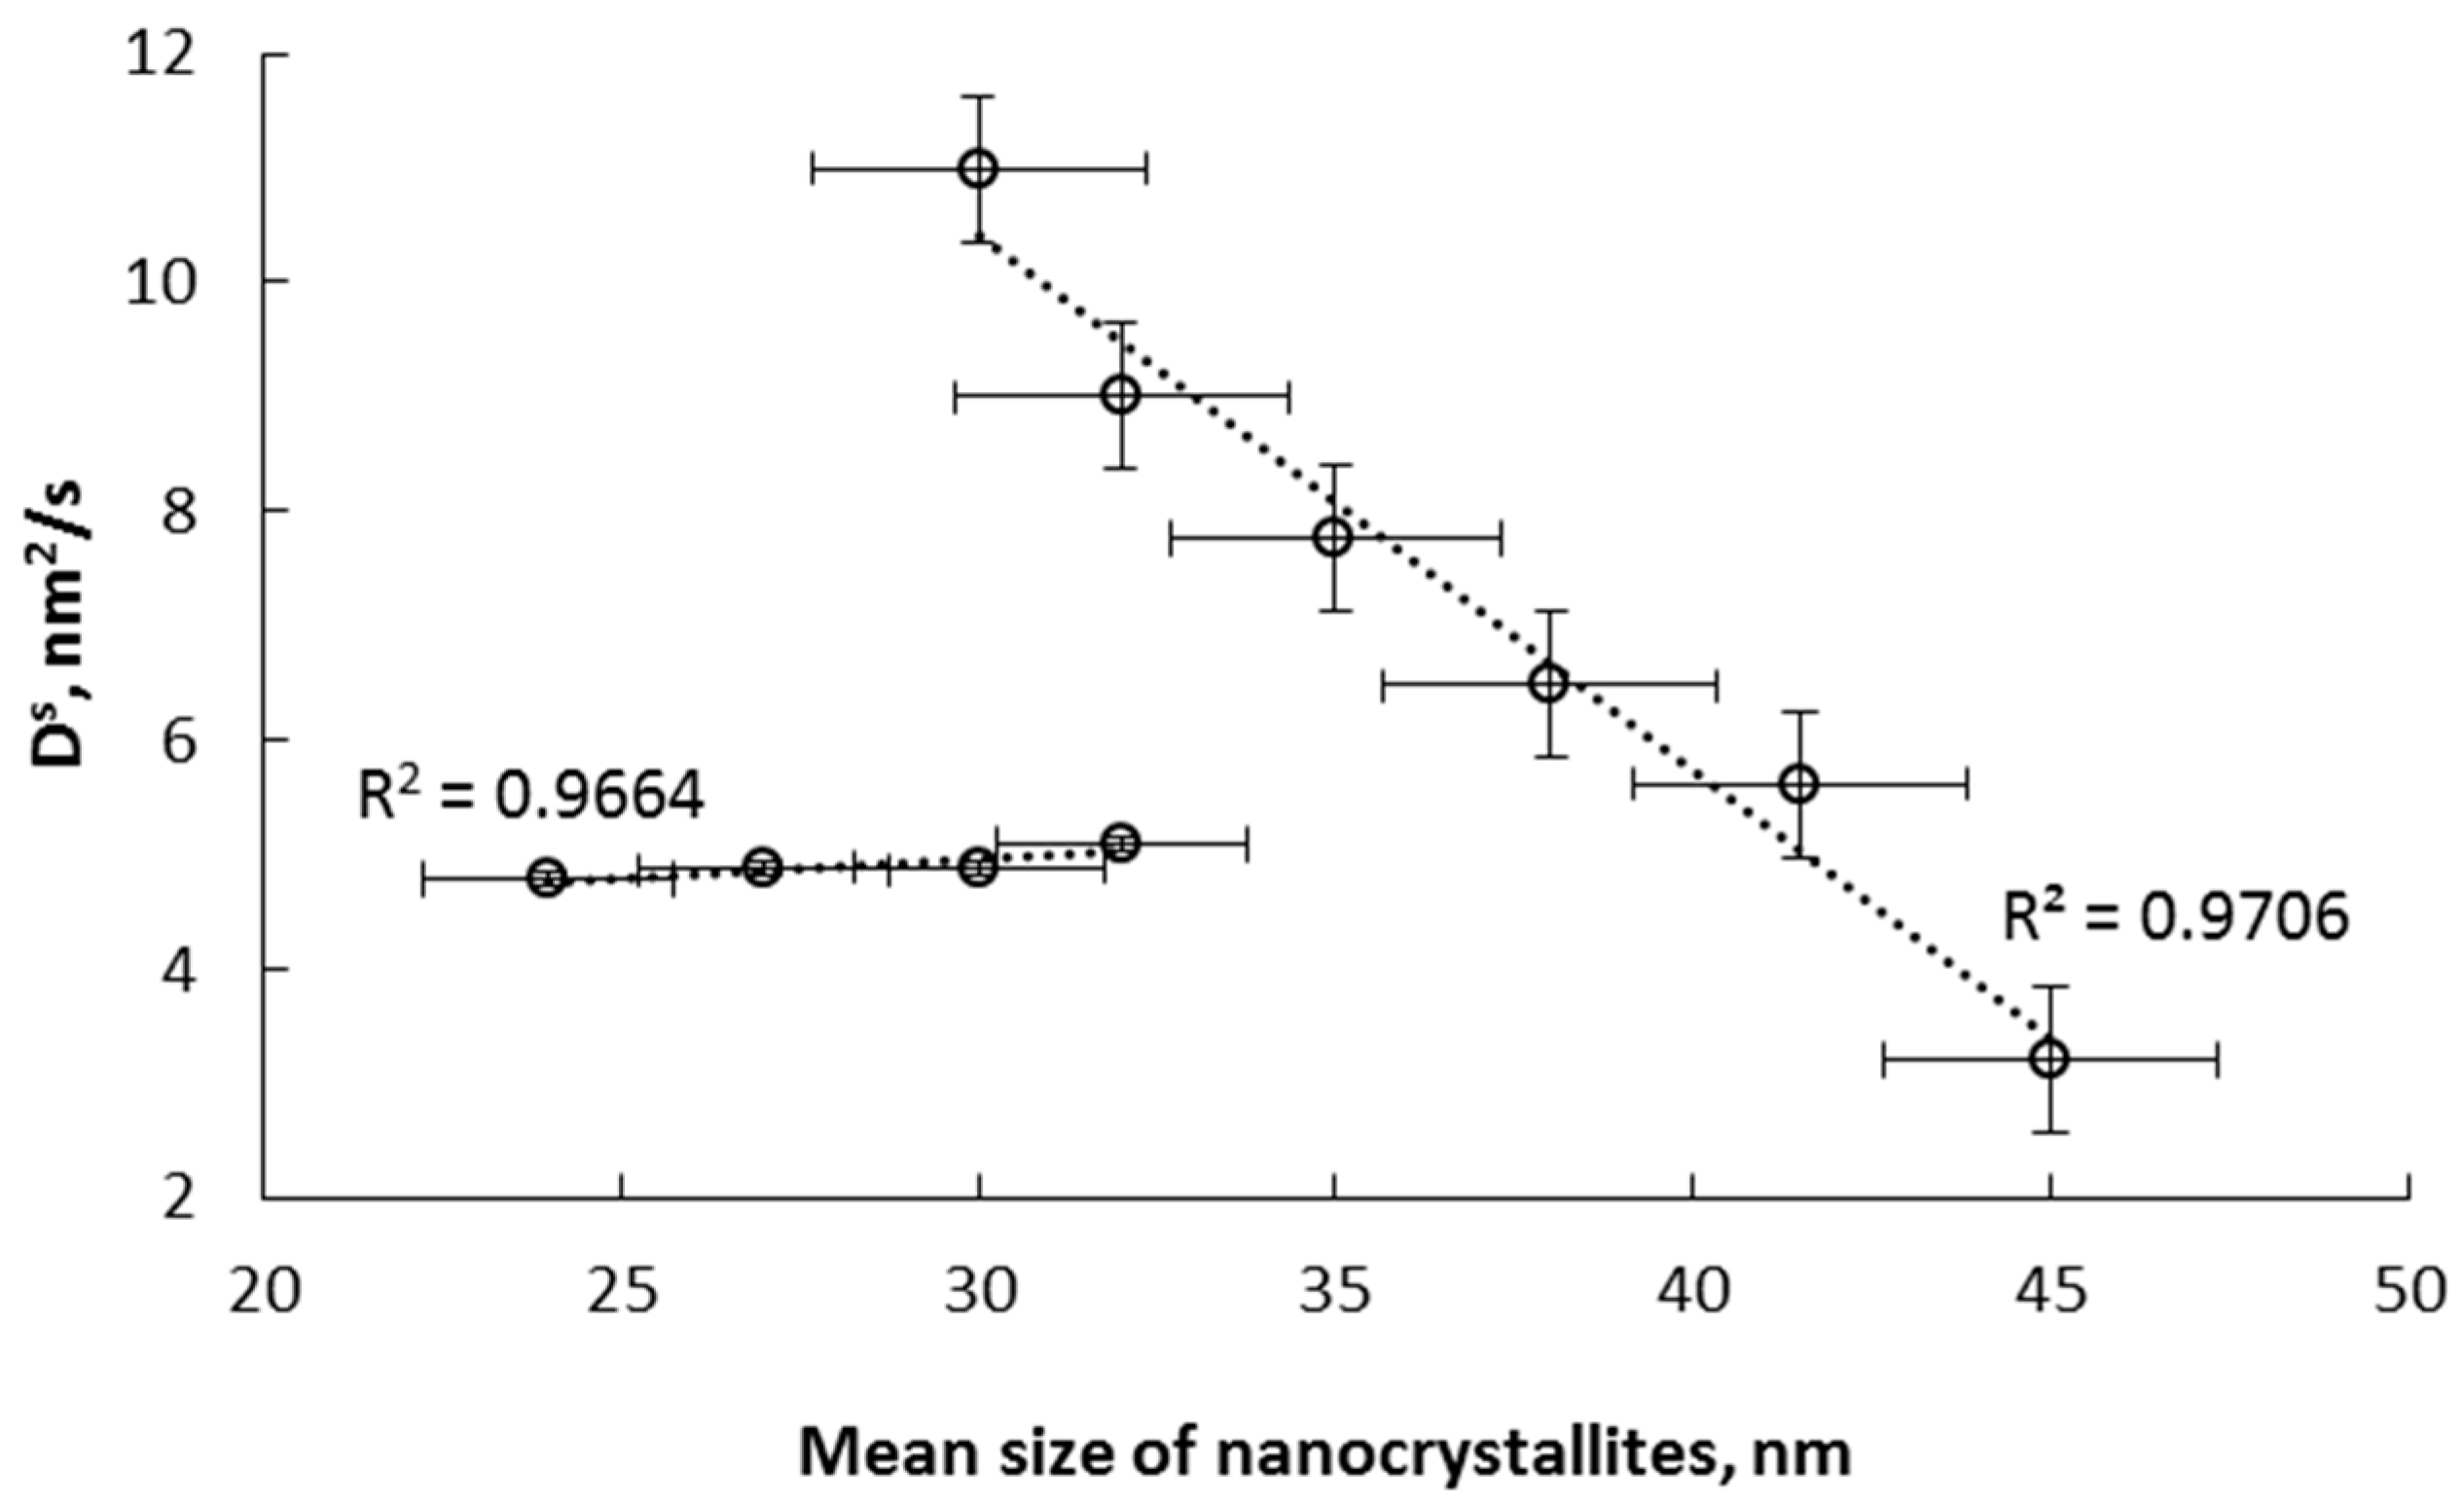
  • α→γ’r (smaller nanocrystallites, relative magnetic permeability of 1.02); the dependencies typical for solutions are observed; the relationships of diffusion coefficient and unit cell volume are linear, with negligible variation in the diffusion coefficient, the volume of unit cells, and relative magnetic permeability,
  • α→γ’k (bigger nanocrystallites, relative magnetic permeability of 1.00); the relationships are also described by a linear function with a significant variation in the diffusion coefficient, the volume of unit cells, mean size of nanocrystallites, and relative magnetic permeability. In the γ‘k area, changes are observed that indicate step changes in the crystal lattice.
  • γ’k→εr: in the range of nitriding degree of 0.25–0.45 mol/mol there is a phase transformation of iron nitride γ’-Fe4N to the εr-FexN solution with concentration x = 0.45 mol/mol in the order of the crystal size from the smallest to the largest, with an approximately constant value of the relative magnetic permeability of 0.42. With the further nitriding process, only the nitrogen concentration in the solution phase εr increases.
Based on the obtained results, we anticipate that the performed experiments and possibilities offered by the apparatus used will open new perspectives of investigations in such fields of knowledge as heterogeneous catalysis, materials engineering, sensorics, etc. We will also use current and future measurement results, among others, to develop novel gas-phase composition sensors and explore issues in the field of spintronics.

Author Contributions

Conceptualization, W.A., I.K. and Z.L.-B.; methodology, W.A. and I.K.; software, R.P. and P.R.-K.; validation, R.P., A.B.-K., P.R.-K. and Z.L.-B.; investigation, A.B.-K., P.R.-K., and K.S.-P.; resources, A.B.-K. and I.K.; data curation, A.B.-K., I.K. and K.K.; writing—original draft preparation, R.P., A.B.-K., P.R.-K. and K.S.-P.; writing—review and editing, W.A., R.P., K.S.-P. and K.K.; visualization, P.R.-K. and K.S.-P.; supervision, Z.L.-B.; project administration, Z.L.-B.; funding acquisition, W.A. All authors have read and agreed to the published version of the manuscript.

Funding

This research was funded by The National Science Centre, Poland, grant number 2017/27/B/ST8/02947.

Institutional Review Board Statement

Not applicable.

Informed Consent Statement

Not applicable.

Data Availability Statement

Data are contained within the article.

Acknowledgments

The scientific work was financed by The National Science Centre, Poland under the program “Opus”, project no. 2017/27/B/ST8/02947.

Conflicts of Interest

The authors declare no conflicts of interest.

References

  1. Siddiquee, S.; Hong, M.G.J.; Rahman, M.M. Nanotechnology: Applications in Energy, Drug and Food, 1st ed.; Springer International Publishing: New York, NY, USA, 2019. [Google Scholar]
  2. Yusuf, A.; Almotairy, A.R.Z.; Henidi, H.; Alshehri, O.Y.; Aldughaim, M.S. Nanoparticles as Drug Delivery Systems: A Review of the Implication of Nanoparticles’ Physicochemical Properties on Responses in Biological Systems. Polymers 2023, 15, 1596. [Google Scholar] [CrossRef] [PubMed]
  3. Damodharan, J. Nano-materials in medicine—An overview. Mater. Today Proc. 2021, 37, 382–385. [Google Scholar] [CrossRef]
  4. Wang, Z.; Colombi Ciacchi, L.; Wei, G. Recent Advances in the Synthesis of Graphene-Based Nanomaterials for Controlled Drug Delivery. Appl. Sci. 2017, 7, 1175. [Google Scholar] [CrossRef]
  5. Thwala, L.N.; Ndlovu, S.C.; Mpofu, K.T.; Lugongolo, M.Y.; Mthunzi-Kufa, P. Nanotechnology-Based Diagnostics for Diseases Prevalent in Developing Countries: Current Advances in Point-of-Care Tests. Nanomaterials 2023, 13, 1247. [Google Scholar] [CrossRef]
  6. Mansuriya, B.D.; Altintas, Z. Graphene Quantum Dot-Based Electrochemical Immunosensors for Biomedical Applications. Materials 2020, 13, 96. [Google Scholar] [CrossRef] [PubMed]
  7. Chen, H.; Guo, X. Unique Role of Self-Assembled Monolayers in Carbon Nanomaterial-Based Field-Effect Transistors. Small 2013, 9, 1144–1159. [Google Scholar] [CrossRef]
  8. Kamyshny, A.; Magdassi, S. Conductive nanomaterials for printed electronics. Small 2014, 10, 3515–3535. [Google Scholar] [CrossRef]
  9. Gohar, O.; Khan, M.Z.; Bibi, I.; Bashir, N.; Tariq, U.; Bakhtiar, M.; Motola, M. Nanomaterials for advanced energy applications: Recent advancements and future trends. Mater. Des. 2024, 241, 112930. [Google Scholar] [CrossRef]
  10. Singh, S.; Kadyan, S.; Sheoran, S.; Mari, B.; Singh, D. Synthesis and optical investigations of Eu3+ activated MYAlO4 (M = Ca and Sr) as promising display nanomaterials. Optik 2020, 208, 164552. [Google Scholar] [CrossRef]
  11. Thiruppathi, A.R.; Sidhureddy, B.; Boateng, E.; Soldatov, D.V.; Chen, A. Synthesis and Electrochemical Study of Three-Dimensional Graphene-Based Nanomaterials for Energy Applications. Nanomaterials 2020, 10, 1295. [Google Scholar] [CrossRef]
  12. Santangelo, S. Electrospun Nanomaterials for Energy Applications: Recent Advances. Appl. Sci. 2019, 9, 1049. [Google Scholar] [CrossRef]
  13. Liao, L.; Wang, M.; Li, Z.; Wang, X.; Zhou, W. Recent Advances in Black TiO2 Nanomaterials for Solar Energy Conversion. Nanomaterials 2023, 13, 468. [Google Scholar] [CrossRef] [PubMed]
  14. Lou, D.; Chen, S.; Langrud, S.; Razzaq, A.A.; Mao, M.; Younes, H.; Xing, W.; Lin, T.; Hong, H. Scalable Fabrication of Si-Graphene Composite as Anode for Li-ion Batteries. Appl. Sci. 2022, 12, 10926. [Google Scholar] [CrossRef]
  15. Khalil, M.; Kadja, G.T.; Ilmi, M.M. Advanced nanomaterials for catalysis: Current progress in fine chemical synthesis, hydrocarbon processing, and renewable energy. J. Ind. Eng. Chem. 2021, 93, 78–100. [Google Scholar] [CrossRef]
  16. Utsev, T.; Tiza, T.M.; Mogbo, O.; Singh, S.K.; Chakravarti, A.; Shaik, N.; Pal Singh, S. Application of nanomaterials in civil engineering. Mater. Today Proc. 2022, 62, 5140–5146. [Google Scholar] [CrossRef]
  17. Papadaki, D.; Kiriakidis, G.; Tsoutsos, T. Applications of Nanotechnology in Construction Industry in Micro and Nano Technologies. In Fundamentals of Nanoparticles, 1st ed.; Barhoum, A., Makhlouf, A.S.H., Eds.; Elsevier Science & Technology: Amsterdam, The Netherlands, 2018; pp. 343–370. [Google Scholar] [CrossRef]
  18. Lazaro, A.; Yu, Q.L.; Brouwers, H.J.H. Nanotechnologies for Sustainable Construction in Sustainability of Construction Materials, 2nd ed.; Khatib, J.M., Ed.; Woodhead Publishing: Cambridge, United Kingdom, 2016; pp. 55–78. [Google Scholar] [CrossRef]
  19. Kirthika, S.K.; Goel, G.; Matthews, A.; Goel, S. Review of the untapped potentials of antimicrobial materials in the construction sector. Prog. Mater. Sci. 2023, 133, 101065. [Google Scholar] [CrossRef]
  20. Mohajerani, A.; Burnett, L.; Smith, J.V.; Kurmus, H.; Milas, J.; Arulrajah, A.; Horpibulsuk, S.; Abdul Kadir, A. Nanoparticles in Construction Materials and Other Applications, and Implications of Nanoparticle Use. Materials 2019, 12, 3052. [Google Scholar] [CrossRef]
  21. Ferreira, M.T.; Soldado, E.; Borsoi, G.; Mendes, M.P.; Flores-Colen, I. Nanomaterials Applied in the Construction Sector: Environmental, Human Health, and Economic Indicators. Appl. Sci. 2023, 13, 12896. [Google Scholar] [CrossRef]
  22. Macías-Silva, M.A.; Cedeño-Muñoz, J.S.; Morales-Paredes, C.A.; Tinizaray-Castillo, R.; Perero-Espinoza, G.A.; Rodríguez-Díaz, J.M.; Jarre-Castro, C.M. Nanomaterials in construction industry: An overview of their properties and contributions in building house. Case Stud. Chem. Environ. Eng. 2024, 10, 100863. [Google Scholar] [CrossRef]
  23. Theofanidis, S.A.; Galvita, V.V.; Konstantopoulos, C.; Poelman, H.; Marin, G.B. Fe-Based Nano-Materials in Catalysis. Materials 2018, 11, 831. [Google Scholar] [CrossRef]
  24. Franco, A.; Balu, A.M.; Luque, R. Nanostructured Porous Materials: Synthesis and Catalytic Applications in Nanotechnology in Catalysis: Applications in the Chemical Industry, Energy Development, and Environment Protection, 1st ed.; Van de Voorde, M., Sels, B., Eds.; Wiley-VCH: Weinheim, Germany, 2017; Volume 1, pp. 119–144. [Google Scholar]
  25. Yentekakis, I.V.; Gournis, D.P.; Karakassides, M.A. Nanomaterials in Catalysis Applications. Catalysts 2023, 13, 627. [Google Scholar] [CrossRef]
  26. Gómez-López, P.; Puente-Santiago, A.; Castro-Beltrán, A.; do Nascimento, L.A.S.; Balu, A.M.; Luque, R.; Alvarado-Beltrán, C.G. Nanomaterials and catalysis for green chemistry. Curr. Opin. Green Sustain. Chem. 2020, 24, 48–55. [Google Scholar] [CrossRef]
  27. Fiuza, T.E.; Gonçalves, D.S.; Kokumai, T.M.; Resende, K.A.; Destro, P.; Zanchet, D. Nanomaterials and catalysis in Materials Nanoarchitectonics, 1st ed.; Ariga, K., Azzaroni, O., Eds.; Elsevier: Amsterdam, The Netherlands, 2024; pp. 519–559. [Google Scholar] [CrossRef]
  28. Zhong, C.J.; Maye, M.M.; Luo, J.; Han, L.; Kariuki, N. Nanoparticles in Catalysis. In Nanoparticles. Nanostructure Science and Technology, 1st ed.; Rotello, V., Ed.; Springer: Boston, MA, USA, 2004; pp. 113–143. [Google Scholar] [CrossRef]
  29. Gleiter, H. Nanostructured materials: Basic concepts and microstructure. Acta Mater. 2000, 48, 1–29. [Google Scholar] [CrossRef]
  30. Segawa, T.F.; Igarashi, R. Nanoscale quantum sensing with Nitrogen-Vacancy centers in nanodiamonds—A magnetic resonance perspective. Prog. Nucl. Magn. Reson. Spectrosc. 2023, 134, 20–38. [Google Scholar] [CrossRef] [PubMed]
  31. Tian, Y.; Nusantara, A.C.; Hamoh, T.; Mzyk, A.; Tian, X.; Martinez, F.P.; Li, R.; Permentier, H.P.; Schirhagl, R. Functionalized Fluorescent Nanodiamonds for Simultaneous Drug Delivery and Quantum Sensing in HeLa Cells. ACS Appl. Mater. Interfaces 2022, 14, 38421–39680. [Google Scholar] [CrossRef] [PubMed]
  32. Urdampilleta, M.; Nguyen, N.-V.; Cleuziou, J.-P.; Klyatskaya, S.; Ruben, M.; Wernsdorfer, W. Molecular Quantum Spintronics: Supramolecular Spin Valves Based on Single-Molecule Magnets and Carbon Nanotubes. Int. J. Mol. Sci. 2011, 12, 6656–6667. [Google Scholar] [CrossRef]
  33. Lee, J.; Jeon, D.J.; Yeo, J.S. Quantum plasmonics: Energy transport through plasmonic gap. Adv. Mater. 2021, 33, 2006606. [Google Scholar] [CrossRef]
  34. Iyengar, S.A.; Puthirath, A.B.; Swaminathan, V. Realizing Quantum Technologies in Nanomaterials and Nanoscience. Adv. Mater. 2023, 35, 2107839. [Google Scholar] [CrossRef]
  35. Kloeffel, C.; Loss, D. Prospects for Spin-Based Quantum Computing in Quantum Dots. Annu. Rev. Condens. Matter Phys. 2013, 4, 51–81. [Google Scholar] [CrossRef]
  36. Winkler, R.; Ciria, M.; Ahmad, M.; Plank, H.; Marcuello, C. A Review of the Current State of Magnetic Force Microscopy to Unravel the Magnetic Properties of Nanomaterials Applied in Biological Systems and Future Directions for Quantum Technologies. Nanomaterials 2023, 13, 2585. [Google Scholar] [CrossRef]
  37. Jandt, K.D.; Watts, D.C. Nanotechnology in dentistry: Present and future perspectives on dental nanomaterials. Dent. Mater. 2020, 36, 1365–1378. [Google Scholar] [CrossRef] [PubMed]
  38. Gupta, C.; Bhardwaj, A. Summary and Future Perspectives of Nanomaterials and Technologies: Special Emphasis on Energy and Environment in Nanomaterials for Sustainable Energy and Environmental Remediation, 1st ed.; Naushad, M., Saravanan, R., Kumar, R., Eds.; Elsevier: Amsterdam, The Netherlands, 2020; pp. 333–353. [Google Scholar] [CrossRef]
  39. Siddique, J.A.; Numan, A. Perspective Future Development of Nanomaterials. In Contemporary Nanomaterials in Material Engineering Applications, 1st ed.; Mubarak, N.M., Khalid, M., Walvekar, R., Numan, A., Eds.; Springer: Cham, Switzerland, 2021; pp. 319–343. [Google Scholar] [CrossRef]
  40. Liang, W.; Zhou, C.; Bai, J.; Zhang, H.; Long, H.; Jiang, B.; Dai, H.; Wang, J.; Zhang, H.; Zhao, J. Current developments and future perspectives of nanotechnology in orthopedic implants: An updated review. Front. Bioeng. Biotechnol. 2024, 12, 1342340. [Google Scholar] [CrossRef] [PubMed]
  41. Rahimi-Iman, A. Advances in functional nanomaterials science. Ann. Der Phys. 2020, 532, 2000015. [Google Scholar] [CrossRef]
  42. Thiruvengadam, M.; Rajakumar, G.; Chung, I.M. Nanotechnology: Current uses and future applications in the food industry. 3 Biotech 2018, 8, 74. [Google Scholar] [CrossRef]
  43. Usman, M.; Farooq, M.; Wakeel, A.; Nawaz, A.; Cheema, S.A.; ur Rehman, H.; Ashraf, I.; Sanaullah, M. Nanotechnology in agriculture: Current status, challenges and future opportunities. Sci. Total Environ. 2020, 721, 137778. [Google Scholar] [CrossRef]
  44. Eftekhari, A.; Maleki Dizaj, S.; Sharifi, S.; Salatin, S.; Rahbar Saadat, Y.; Zununi Vahed, S.; Samiei, M.; Ardalan, M.; Rameshrad, M.; Ahmadian, E.; et al. The Use of Nanomaterials in Tissue Engineering for Cartilage Regeneration; Current Approaches and Future Perspectives. Int. J. Mol. Sci. 2020, 21, 536. [Google Scholar] [CrossRef]
  45. Fadel, T.R.; Steevens, J.A.; Thomas, T.A.; Linkov, I. The challenges of nanotechnology risk management. Nano Today 2015, 10, 6–10. [Google Scholar] [CrossRef]
  46. Pandey, G.; Jain, P. Assessing the nanotechnology on the grounds of costs, benefits, and risks. Beni Suef Univ. J. Basic Appl. Sci. 2020, 9, 63. [Google Scholar] [CrossRef]
  47. Singh, S.; Nalwa, H.S. Nanotechnology and health safety–toxicity and risk assessments of nanostructured materials on human health. J. Nanosci. Nanotechnol. 2007, 7, 3048–3070. [Google Scholar] [CrossRef]
  48. Pérez-Hernández, H.; Pérez-Moreno, A.; Sarabia-Castillo, C.R.; García-Mayagoitia, S.; Medina-Pérez, G.; López-Valdez, F.; Campos-Montiel, R.G.; Jayanta-Kumar, P.; Fernández-Luqueño, F. Ecological Drawbacks of Nanomaterials Produced on an Industrial Scale: Collateral Effect on Human and Environmental Health. Water Air Soil Pollut. 2021, 232, 435. [Google Scholar] [CrossRef]
  49. Kumar, A.; Gupta, K.; Dixit, S.; Srivastava, S. A review on positive and negative impacts of nanotechnology in agriculture. Int. J. Environ. Sci. Technol. 2019, 16, 2175–2184. [Google Scholar] [CrossRef]
  50. Fojtů, M.; Teo, W.Z.; Pumera, M. Environmental impact and potential health risks of 2D nanomaterials. Environ. Sci. Nano 2017, 4, 1617–1633. [Google Scholar] [CrossRef]
  51. Bhattacharyya, S. Iron Nitride Family at Reduced Dimensions: A Review of Their Synthesis Protocols and Structural and Magnetic Properties. J. Phys. Chem. C 2015, 119, 1601–1622. [Google Scholar] [CrossRef]
  52. Pelka, R.; Kiełbasa, K.; Arabczyk, W. Catalytic Ammonia Decomposition During Nanocrystalline Iron Nitriding at 475 °C with NH3/H2 Mixtures of Different Nitriding Potential. J. Phys. Chem. C 2014, 118, 6178–6185. [Google Scholar] [CrossRef]
  53. Karch, J.; Birringer, R.; Gleiter, H. Ceramics Ductile at Low Temperature. Nature 1987, 330, 556–558. [Google Scholar] [CrossRef]
  54. Ruhle, M.; Dosch, H.; Mittemejer, E.J.; van de Voorde, M.H. European White Book on Fundamental Research in Materials Science; Max-Planck Institute for Metals Research: Stuttgart, Germany, 2001. [Google Scholar]
  55. Lojkowski, W.; Fecht, H.J. Structure of Intercrystalline Interfaces. Prog. Mater. Sci. 2000, 45, 339–568. [Google Scholar] [CrossRef]
  56. Poliakoff, M.; King, P. Phenomenal Fluids. Nature 2001, 412, 125. [Google Scholar] [CrossRef]
  57. Beck, I.E.; Bukhtiyarov, V.I.; Pakharukov, I.Y.; Zaikovsky, V.I.; Kriventsov, V.V.; Parmon, V.N. Platinum Nanoparticles on Al2O3: Correlation Between the Particle Size and Activity in Total Methane Oxidation. J. Catal. 2009, 268, 60–67. [Google Scholar] [CrossRef]
  58. Arabczyk, W.; Ekiert, E.; Pelka, R. Size-dependent transformation of α-Fe into γ’-Fe4N in nanocrystalline the Fe-NH3-H2 system. J. Phys. Chem. C 2016, 120, 17989. [Google Scholar] [CrossRef]
  59. Jennings, J.R. Catalytic Ammonia Synthesis Fundamentals and Practice; Plenum Press: New York, NY, USA, 1991. [Google Scholar]
  60. Liu, H. Ammonia Synthesis Catalysts: Innovation and Practice; World Scientific: Singapore, 2013. [Google Scholar]
  61. Nielsen, A. Ammonia: Catalysis and Manufacture; Springer-Verlag: Berlin, Germany, 1995. [Google Scholar]
  62. Schlögl, R. Handbook of Heterogeneous Catalysis; Wiley-VCH: Weinheim, Germany, 2008. [Google Scholar]
  63. Kuznetsov, L.D.; Lachinov, S.S. The Effect of Al2O3 and K2O Promoters on the Activity of Iron Catalyst in the Synthesis of Ammonia. Zhurnal Fiz. Khimii 1959, 33, 2542. [Google Scholar]
  64. Boudart, M. Ammonia synthesis: The bellwether reaction in heterogeneous catalysis. Top. Catal. 1994, 1, 405. [Google Scholar] [CrossRef]
  65. Nørskov, J.K. From quantum physics to heterogeneous catalysis. Top. Catal. 1994, 1, 385. [Google Scholar] [CrossRef]
  66. Somorjai, G.A. Introduction to Surface Chemistry and Catalysis; John Wiley & Sons: New York, NY, USA, 1994. [Google Scholar]
  67. Ozaki, A.; Aika, K. Catalysis—Science and Technology; Anderson, J.R., Boudart, M., Eds.; Springer: Berlin, Germany, 1982; Volume 1. [Google Scholar]
  68. Ertl, G. Surface Science and Catalysis—Studies on the Mechanism of Ammonia Synthesis: The P. H. Emmett Award Address. Catal. Rev. Sci. Eng. 1980, 21, 201–223. [Google Scholar] [CrossRef]
  69. Ertl, G. Physical characterization of industrial catalysts: The mechanism of ammonia synthesis. Stud. Surf. Sci. Catal. 1989, 44, 315. [Google Scholar] [CrossRef]
  70. Ertl, G. Reactions at Solid Surfaces; John Wiley & Sons: Hoboken, NJ, USA, 2009. [Google Scholar]
  71. Somorjai, G.A.; Materer, N. Surface structure in ammonia synthesis. Top. Catal. 1994, 1, 215. [Google Scholar] [CrossRef]
  72. Mbaraka, I.; Shanks, B. Conversion of Oils and Fats Using Advanced Mesoporous Heterogeneous Catalysts. J. Am. Oil Chem. Soc. 2006, 83, 79–91. [Google Scholar] [CrossRef]
  73. Borges, M.E.; Díaz, L. Recent Developments on Heterogeneous Catalysts for Biodiesel Production by Oil Esterification and Transesterification Reactions: A Review, Renew. Sustain. Energy Rev. 2012, 16, 2839–2849. [Google Scholar] [CrossRef]
  74. Savchenko, V.I.; Makaryan, I.A. Palladium Catalyst for the Production of Pure Margarine. Platin. Met. Rev. 1999, 43, 74–82. [Google Scholar] [CrossRef]
  75. Heck, R.M.; Farrauto, R.J.; Gulati, S.T. Catalytic Air Pollution Control; John Wiley & Sons: Hoboken, NJ, USA, 2009. [Google Scholar]
  76. Aika, K.; Christiansen, L.J.; Dybkjaer, I.; Hansen, J.B.; Nielsen, P.E.H.; Nielsen, A.; Stolze, P.; Tamaru, K. Ammonia Catalysis and Manufacture; Springer: Berlin/Heidelberg, Germany, 1995. [Google Scholar]
  77. Farrauto, R.J.; Bartholomew, C.H. Fundamentals of Industrial Catalytic Processes; Chapman & Hall: London, UK, 1997. [Google Scholar]
  78. Kunze, J. Nitrogen and Carbon in Iron and Steels Thermodynamics. In Physical research; Akademie Verlag: Berlin, Germany, 1990; Volume 16. [Google Scholar]
  79. Pelka, R.; Arabczyk, W. Studies of the Kinetics of Reaction Between Iron Catalysts and Ammonia—Nitriding of Nanocrystalline Iron with Parallel Catalytic Ammonia Decomposition. Top. Catal. 2009, 52, 1506–1516. [Google Scholar] [CrossRef]
  80. Wróbel, R.; Arabczyk, W. Solid-Gas Reaction with Adsorption as the Rate Limiting Step. J. Phys. Chem. A 2006, 110, 9219–9224. [Google Scholar] [CrossRef]
  81. Arabczyk, W.; Pelka, R.; Jasińska, I.; Lendzion-Bieluń, Z. Thermodynamics of Iron Ammonia Synthesis Catalyst Sintering. Crystals 2024, 14, 188. [Google Scholar] [CrossRef]
  82. Moszyńska, I.; Moszyński, D.; Arabczyk, W. Hysteresis in nitriding and reduction in the nanocrystalline iron-ammonia-hydrogen system. Przemysł Chem. 2009, 88, 526–529. [Google Scholar]
  83. Moszyński, D.; Moszyńska, I. Phase transformations during nitriding of nanocrystalline iron. Przemysł Chem. 2013, 92, 1332–1335. [Google Scholar]
  84. Moszyński, D. Nitriding of Nanocrystalline Iron in the Atmospheres with Variable Nitriding Potential. J. Phys. Chem. C 2014, 118, 15440–15447. [Google Scholar] [CrossRef]
  85. Arabczyk, W.; Pelka, R.; Wilk, B.; Lendzion-Bieluń, Z. Kinetics and Thermodynamics of the Phase Transformation in the Nanocrystalline Substance—Gas Phase System. Crystals 2024, 14, 129. [Google Scholar] [CrossRef]
  86. Lehrer, E. Über das Eisen-Waserstoff-Amoniak Gleichgewicht. Z. Für Elektrochem. 1930, 36, 383–392. [Google Scholar]
  87. Crank, J. The Mathematics of Diffusion; Clarendon Press: Oxford, UK, 1975. [Google Scholar]
  88. Arabczyk, W.; Pelka, R.; Jasińska, I.; Lendzion-Bieluń, Z. Reaction Model Taking into Account the Catalyst Morphology and Its Active Specific Surface in the Process of Catalytic Ammonia Decomposition. Materials 2021, 14, 7229. [Google Scholar] [CrossRef]
  89. Pelka, R.; Nowosielecka, U.; Klimza, K.; Moszyńska, I.; Aidinis, K.; Żołnierkiewicz, G.; Guskos, A.; Guskos, N. Nanocrystalline Iron Oxides with Various Average Crystallite Size Investigated Using Magnetic Resonance Method. Crystals 2024, 14, 363. [Google Scholar] [CrossRef]
  90. Arabczyk, W.; Pelka, R.; Kocemba, I.; Brzoza-Kos, A.; Wyszkowski, A.; Lendzion-Bieluń, Z. Study of Phase Transformation Processes Occurring in the Nanocrystalline Iron/Ammonia/Hydrogen System by the Magnetic Permeability Measurement Method. J. Phys. Chem. C 2022, 126, 7704–7710. [Google Scholar] [CrossRef]
  91. Arabczyk, W.; Rogowski, J.; Pelka, R.; Lendzion-Bieluń, Z. Application of TOF-SIMS Method in the Study of Wetting the Iron (111) Surface with Promoter Oxides. Molecules 2022, 27, 648. [Google Scholar] [CrossRef]
  92. Lendzion-Bieluń, Z.; Jędrzejewski, R.; Ekiert, E.; Arabczyk, W. Heterogeneity of ingot of the fused iron catalyst for ammonia synthesis. Appl. Catal. A: Gen.L 2011, 400, 48–53. [Google Scholar] [CrossRef]
  93. Pelka, R.; Arabczyk, W. Modelling of nanocrystalline iron nitriding process—Influence of specific surface area. Chem. Pap. 2011, 65, 198–202. [Google Scholar] [CrossRef]
  94. Website. Available online: https://www.tf.uni-kiel.de/matwis/amat/iss/kap_5/illustr/s5_2_3d.html (accessed on 21 June 2022).
  95. Pelka, R. A method of determining nanoparticle size distribution in iron ammonia synthesis catalyst by measuring mass changes during the nitriding process. Catal. Today 2017, 286, 118–123. [Google Scholar] [CrossRef]
  96. Ekiert, E.; Wilk, B.; Lendzion-Bieluń, Z.; Pelka, R.; Arabczyk, W. Study of Phase Transitions Occurring in a Catalytic System of ncFe-NH3/H2 with Chemical Potential Programmed Reaction (CPPR) Method Coupled with In Situ XRD. Catalysts 2021, 11, 183. [Google Scholar] [CrossRef]
Figure 1. Nitriding degree, relative magnetic permeability (RMP), and concentration of hydrogen in the gas phase as functions of time during nitriding reaction.
Applsci 14 08452 g001
Figure 2. (a) Dependence of the rate of the nitriding reaction ( d n N / n F e d t ), relative magnetic permeability (RMP), and the relative magnetic permeability rate (dRMP/d α) during the nitriding process depending on the degree of nitriding of the catalyst (CVD—nanocrystallite volume distribution). (b) The relative magnetic permeability in the field of phase change α → γ’ depending on the degree of nitriding of the catalyst.
Applsci 14 08452 g002
Figure 3. Dependence of the phase composition of the catalyst during nitriding, depending on the degree of nitriding.
Applsci 14 08452 g003
Figure 4. Dependence of the diffusion coefficient and nanocrystallite size distribution according to their volume (CVD) on the degree of nitrogenization of the catalyst.
Applsci 14 08452 g004
Figure 5. Dependence of the Gibbs free energies of nitrogen dissolution in iron on nitriding degree of the catalyst.
Applsci 14 08452 g005
Figure 6. Dependence of the calculated diffusion coefficients Ds and Gibbs free energies of nitrogen dissolution ΔGN,idiss on the unit cell volume of iron in the sample.
Applsci 14 08452 g006
Figure 7. Dependence of the diffusion coefficient Ds on the mean size of nanocrystallites.
Applsci 14 08452 g007
Figure 8. Dependence of the diffusion coefficient and the Gibbs free energy of nitrogen dissolution in iron volume (a) and dependence of α-iron unit cell volume (b) on RMP (blue points—stationary conditions, red points—kinetic measurements).
Applsci 14 08452 g008
Disclaimer/Publisher’s Note: The statements, opinions and data contained in all publications are solely those of the individual author(s) and contributor(s) and not of MDPI and/or the editor(s). MDPI and/or the editor(s) disclaim responsibility for any injury to people or property resulting from any ideas, methods, instructions or products referred to in the content.

