Featured Application
The serious game could be used for hand rehabilitation, since it is controlled using five hand movements: wrist extension, wrist flexion, ulnar and radial deviations, and fist movements. Moreover, it has two game modes: a non-tailored mode in which the game difficulty is set randomly, and a tailored mode in which the game difficulty is adjusted according to the participants’ range of motion, determined during the hand movements.
Abstract
Background: Traditional physical rehabilitation involves participants performing repetitive body movements with the assistance of physiotherapists. Owing to the exercises’ monotonous nature and lack of reward, participants may become disinterested and cease their recovery. Games could be used as tools to engage participants in the rehabilitation process. Consequently, participants could perform rehabilitation exercises while playing the game, receiving rewards from the experience. Maintaining the players’ engagement requires regularly adjusting the game difficulty. The players’ engagement can be measured using questionnaires and biosignals (e.g., electroencephalography signals—EEG). This study aims to determine whether there is a significant difference in players’ engagement between two game modes with different game difficulty adjustments: non-tailored and tailored modes. Methods: We implemented two game modes which were controlled using hand movements. The features of the game rewards (position and size) were changed in the game scene; hence, the game difficulty could be modified. The non-tailored mode set the features of rewards in the game scene randomly. Conversely, the tailored mode set the features of rewards in the game scene based on the participants’ range of motion using fuzzy logic. Consequently, the game difficulty was adjusted dynamically. Additionally, engagement was computed from 53 healthy participants in both game modes using two EEG sensors: Bitalino Revolution and Unicorn. Specifically, the theta (θ) and alpha (α) bands from the frontal and parietal lobes were computed from the EEG data. A questionnaire was applied to participants after finishing playing both game modes to collect their impressions on the following: their favorite game mode, the game mode that was the easiest to play, the game mode that was the least frustrating to play, the game mode that was the least boring to play, the game mode that was the most entertaining to play, and the game mode that had the fastest game response time. Results: The non-tailored game mode reported the following means of engagement: 6.297 ± 11.274 using the Unicorn sensor, and 3.616 ± 0.771 using the Bitalino sensor. The tailored game mode reported the following means of engagement: 4.408 ± 6.243 using the Unicorn sensor, and 3.619 ± 0.551 using Bitalino. The non-tailored mode reported the highest mean engagement (6.297) when the Unicorn sensor was used to collect EEG signals. Most participants selected the non-tailored game mode as their favorite, and the most entertaining mode, irrespective of the EEG sensor. Conversely, most participants chose the tailored game mode as the easiest, and the least frustrating mode to play, irrespective of the EEG sensor. Conclusions: A Wilcoxon-Signed-Rank test revealed that there was only a significant difference in engagement between game modes when the EEG signal was collected via the Unicorn sensor (p value = 0.04054). Fisher’s exact tests showed significant associations between the game modes (non-tailored, tailored) and the following players’ variables: ease of play using the Unicorn sensor (p value = 0.009341), and frustration using Unicorn sensor (p value = 0.0466).
1. Introduction
Hand movements are used to perform daily living activities. Unfortunately, for people suffering medical conditions (e.g., rheumatoid arthritis [1,2], stroke [3], systemic sclerosis [4,5]) or accidents, their hand functionality might have been compromised; hence, they might require traditional physical rehabilitation to restore their hand motor functions. According to [6], hand therapy seeks to increase the range of motion (ROM) and muscle strength, so that people might achieve optimal functioning. Specifically, ROM is “the arc of motion that occurs at a joint or a series of joints” [7].
During traditional rehabilitation, people perform repetitive body movements according to physiotherapist advice and assistance, frequently with no visual feedback. Consequently, people might drop the rehabilitation process due to a lack of engagement and the exercises’ monotonous nature. Serious games have been developed to assist people in their rehabilitation process. Serious games are defined as “games that allow the player to achieve a specific purpose using the entertainment and engagement component provided by the experience of the game” [8]. Specifically, reviews have been published on the use of games for upper limb rehabilitation [9,10,11,12]. These games for upper limb rehabilitation have used sensors (e.g., cameras, electromyography sensors) to detect the body movements employed in physiotherapy; therefore, these movements can be used to control serious games. As mentioned previously, a key point during the rehabilitation process is the participants’ engagement. According to [13], the engagement “refers to sustained involvement with an activity”. In the context of videogames, there is a technique called “Dynamic Difficulty Adjustment (DDA)”; according to [14], DDA “is a technique of automatic real-time adjustment of scenarios, parameters, and behaviors in video games, which follows the player’s skill and keeps them from boredom (when the game is too easy) or frustration (when the game is too difficult)”. Based on this, engaging participants in the rehabilitation process could be facilitated by the use of games. Therefore, participants perform their rehabilitation exercises while playing the game and receiving rewards from the experience. Moreover, adjusting the game difficulty on a regular basis is necessary to keep players engaged. Reviews have been published regarding DDA on videogames [14,15]. Nevertheless, few studies have implemented DDA in their serious games for upper limb rehabilitation. Additionally, the players’ engagement can be measured using questionnaires or biosignals (i.e., electrical activity from the human body: EEG signals—electroencephalography signals: electrical activity from the brain; ECG—electrocardiography signals: electrical activity from the heart; electrodermal activity).
1.1. Research Problem
Based on this, it is important to motivate patients to finish their rehabilitation exercises. A key motivating factor to continue playing the game (i.e., in this case, continue playing the game for rehabilitation purposes) is the game difficulty. Therefore, it is important to adjust the game difficulty considering participants’ features, so that the game is not too difficult to play and not too easy to play. As mentioned previously, hand movements are used to control serious games for hand rehabilitation. Moreover, the participant’s ROMs are considered to analyze the progress of rehabilitation. Based on Klum et al. [16], the participant’s ROMs vary according to age; consequently, the ROMs involved during the performance of hand movements are not the same for everybody. Hence, the game difficulty could be adjusted according to the participant’s ROMs so that they can feel that the game is entertaining to play (i.e., not too difficult, and not too easy). As a result, people could continue their rehabilitation through engagement with the game. The research problem of this study aims to answer the following main research question: is there any significant difference in terms of players’ engagement measured using EEG signals between a game mode with a random difficulty adjustment and a game mode with a dynamic difficulty adjustment based on players’ features?
1.2. Research Variables
This study involves the following dependent variables: (i) engagement index computed from EEG signals, and (ii) players’ opinion variables (favorite game mode, ease of play, frustration, boredom, entertainment, and game response time). The independent variable of the study is the game mode, which can be tailored and non-tailored game modes.
1.3. Research Objectives
This study has the following objectives:
- To implement a game mode for hand rehabilitation (non-tailored game mode), in which the game difficulty is adjusted randomly.
- To implement a game mode for hand rehabilitation (tailored game mode), in which the game difficulty is adjusted dynamically according to participants’ features (i.e., the participants’ ROMs).
- To compute the players’ engagement during the playing of both game modes using EEG signals collected via the Bitalino and Unicorn sensors.
- To analyze if there are significant differences in terms of engagement between the game modes.
- To analyze the players’ opinions using a questionnaire in terms of the following variables: favorite game mode, the game that is the easiest to play (i.e., ease of play), the game mode that is the least frustrating to play (i.e., frustration), the game mode that is the least boring to play (i.e., boredom), the game mode that is the most entertaining to play (i.e., entertainment), and the game mode that has the fastest game response time (i.e., game response time).
- To analyze if there are significant associations between the game modes and players’ opinion variables.
1.4. Research Questions
This study aims to answer the following research questions (RQ):
- RQ1: Is there any significant difference in terms of engagement index measured using EEG signals between the non-tailored game mode and the tailored game mode?
- RQ2: Which game mode is the favorite?
- RQ3: Which game mode is the easiest to play?
- RQ4: Which game mode is the least frustrating to play?
- RQ5: Which game mode is the least boring to play?
- RQ6: Which game mode is the most entertaining to play?
- RQ7: Which game mode has the fastest game response time to control commands?
- RQ8: Is there any significant association between the game modes and the players’ opinion variables (favorite game mode, ease of play, frustration, boredom, entertainment, and game response time)?
1.5. Importance and Scope of the Study
The key contributions of this research are as follows:
- To determine whether there is a significant difference in terms of engagement collected from a Unicorn sensor between the non-tailored game mode and the tailored game mode.
- To determine whether there is a significant difference in terms of engagement collected from a Bitalino sensor between the non-tailored game mode and the tailored game mode.
- To determine the favorite game mode, the game mode that is the easiest to play, the game mode that is the most entertaining to play, the game mode that is the least frustrating to play, the game mode that is the least boring to play, and the game mode that has the fastest game response time to control commands.
- To determine whether there is any significant association between the game modes and the players’ opinion variables (favorite game mode, ease of play, frustration, boredom, entertainment, and game response time).
In this study, healthy volunteers with no motor conditions and over eighteen years old participated in the experiments. Furthermore, only the following hand movements used in rehabilitation were considered in this study: wrist extension, wrist flexion, ulnar and radial deviations, and fist movements.
1.6. Limitations of the Study
This study has the following limitations: (i) most of the volunteers that participated in the experiments (i.e., 77.35%) were between 18 and 29 years old; (ii) the samples of participants were small, unequal, and non-randomized; and (iii) all the volunteers were healthy.
1.7. Structure of the Article
The rest of the article is organized as follows: Section 2 presents the state of the art on serious games for hand rehabilitation. Section 3 provides the materials and methods used to develop the study. Specifically, it describes the sensors used to interact with the game and to collect the EEG signals, as well as the computers and software employed in the research. Furthermore, the following is explained: the game description, the identification of the hand movements, the game modes, the dynamic difficulty adjustment using fuzzy logic in the tailored game mode, the engagement measurement and participants’ opinions on game mode preferences, the experimental setting, and the statistical tests applied on the data. Section 4 reports the results. Section 5 presents the discussion of the results. Finally, Section 6 provides the conclusions of the study.
2. Literature Review
In the last five years, several studies have implemented games for upper limb rehabilitation. For instance, a study [17] proposed a ski driving game which is controlled using hand gripping, balance handle operation, as well as the extension, flexion, pronation, and supination of the shoulder, elbow, and forearm. Electromyography (EMG) signals were used to detect the extension, flexion, pronation, and supination movements, whereas electroencephalography (EEG) signals were used to detect intentions to carry out the hand gripping and balance handle movements. Similarly, Nasri et al. [18] created a game for hand rehabilitation in which a ball is controlled using hand movements (e.g., closed hand, open hand, wrist extension, and wrist flexion) to avoid obstacles and drop it into a basket. EMG signals were collected via a Myo armband sensor and processed using convolutional neural networks to detect the hand movements. Another study [19] designed a lightweight and portable hand exoskeleton with a hand-sensing glove to play an archery game for hand rehabilitation. In the same vein, Sanders et al. [20] developed a wearable grip sensor to detect finger flexions to play piano melodies in a serious game. Jha et al. [21] created a glove to identify hand movements that were used to control two games for hand rehabilitation. Specifically, the players move a character in the air to collect coins using flexion and extension hand movements in game 1, whereas they grab and squeeze fruits using grip and release hand movements in game 2.
Several studies have used a Leap Motion Controller (LMC) sensor to develop games for hand and upper limb rehabilitation [22,23,24,25,26]. This sensor has infrared cameras that identify X, Y, Z positions of the phalanges, palm, and wrist. A study [27] has assessed the performance of the LMC (i.e., feasibility, accuracy, and repeatability) when used in conjunction with a serious game for upper limb rehabilitation. They conducted experiments using a Yaskawa industrial robot that mimics upper limb motions and is tracked by LMC. They concluded that the LMC has a satisfactory performance regarding tracking accuracy.
In the context of using LMC for serious games for upper limb rehabilitation, Vidal et al. [22] implemented a game to improve fine motor control in children with epileptic encephalopathy. Specifically, the game simulates the preparation of a pizza using movements such as picking up, grasping, manipulating, and releasing objects with the fingers. These movements were detected using an LMC sensor. Al Nattah et al. [23] implemented three games to improve hand function and grip strength: (i) a “counting with fingers” game, in which the player performs finger flexion and extension; (ii) a “pronation and supination, wrist flexion, and extension” game, in which the player performs these movements; and (iii) a “hand grasp” game, in which the player grasps a cube. All the movements were identified using an LMC. Another study [24] implemented a piano game which was played using finger movements detected via an LMC. Fotopoulos et al. [25] implemented a game which is controlled using the flexion, extension, pronation, and supination of the hand. These movements were identified via an LMC and used to control and set an airplane on gates. Another study [26] implemented a game to train shoulder horizontal adduction, in which the player moves a virtual cursor using arm movements to color tiles that define specific trajectories. The arm movements were detected via an LMC.
Song et al. [28] fused data from a force myography sensor, an electromyography sensor, and inertial measurement unit to identify hand movements (e.g., thumb adduction, wrist flexion, wrist dorsiflexion, forearm pronation, and forearm supination) that were employed to play two games: (i) “find the sheep”, in which the player performs hand movements to find the sheep card; and (ii) “Best Salesman”, in which the player delivers the food to customers using hand movements.
However, these games have just one difficulty level [17,18,19] or fixed difficulty levels [20,21,22,23,24,25,26,28]. They are not dynamically adjusted to the people’s needs. Reviews have been published regarding DDA on videogames [14,15]. Nevertheless, few studies have implemented DDA in their serious games for upper limb rehabilitation. For instance, Cardia da Cruz et al. [29] implemented a game in which the player pops balloons which are moving in the game scene using pinch hand movement. This hand movement was identified using an LMC. Furthermore, Q-learning was used to modify the balloons’ movement time. They evaluated the user experience using the system usability scale (SUS) questionnaire. The SUS scores determined the game as a usable and satisfactory environment for the user. Another study [30] implemented a game, in which a plane is controlled using flexion, extension, ulnar, and radial hand movements. The player collects rewards that are displayed in the game scene. An LMC was used to identify the hand movements. DDA was implemented in the game by setting the rewards at positions that are difficult, moderately difficult, and easy to collect by the player in the game scene. The DDA was performed using fuzzy logic and according to the range of motion of the player’s hand. Additionally, the player’s engagement was estimated using a GEQ (Game Experience Questionnaire). Another study [31] has implemented three games for arm rehabilitation: (i) target reach, in which the players move their arms to reach a sphere displayed in the game; (ii) line draw, in which the players perform flexion and extension movements to draw straight lines; and (iii) shape draw, in which the players draw shapes indicated by the physiotherapist. Difficulty adjustments were performed according to rules defined by authors. They considered the reaction time and range of motion of the participant to perform the game difficulty adjustment by changing the shape to be drawn, and the time that they had to do the task. Authors applied a system usability scale questionnaire to assess their proposal. The three games reported above average system usability scale scores. Finally, a virtual reality game [32] was implemented for arm rehabilitation. Specifically, this game was a first-person-shooter, in which the player kills zombie enemies. Two strategies were used to adjust the game difficulty: (i) adjust the number of enemies, and (ii) adjust the health of enemies. Support vector machines were used for classifying three levels of players’ stress based on electrodermal activity, electrocardiogram, and electromyography signals. A NASA-TLX (NASA Task Load Index) questionnaire was used to assess the participants’ affective state. No statistical differences were found between the two strategies for adjusting the game difficulty in terms of the workload induced by the participants.
As mentioned previously, a key aspect in continuing with the rehabilitation process is the participant’s engagement. The engagement could be measured using questionnaires (e.g., NASA-TLX (NASA Task Load Index) [33], and GEQ—Game Experience Questionnaire [34]) or biosignals (e.g., electrodermal activity (EDA) [35], electrocardiogram (ECG) [36], electroencephalography signals (EEG) [37,38], and electrooculography signals (EOG) [36]). A review on the use of biosignals for assessing players’ emotions in games can be found in a study by Calvo-Morata et al. [35].
Nevertheless, few studies have analyzed engagement during the playing of serious games for upper limb rehabilitation. Specifically, these studies have used questionnaires (i.e., GEQ [30,39], NASA-TLX [32]) and numerical rating scales [40] to determine the players’ engagement.
3. Materials and Methods
3.1. Materials
3.1.1. Bitalino (R)evolution Board Kit BLE/BT
This sensor was used to collect the EEG data from two channels (AF3, P7) according to the 10–20 system (PLUX, Lisbon, Portugal). Specifically, it has the following features: sample frequencies at 1, 10, 100, and 1000 Hz; Bluetooth communication; battery: 500 mA 3.7 V, sensitivity: ±37.5 μV; impedance: >100 GΩ; and the following biosignals that can be collected: electromyography signals (EMG); electrocardiography signals (ECG); electrodermal activity; and electroencephalography signals (one EEG channel to be selected by the user). A study [41] compared a Bitalino sensor and a BioPac MP35 Student Lab Pro device (i.e., a gold-standard device for education and research purposes) in terms of recording electrodermal activity, electrocardiography, electromyography, and electroencephalography signals. Root mean square errors were computed to assess the sensors’ performances. As a result, the differences between the recordings of the sensors in terms of the EEG signals were small. The Bitalino sensor was chosen in this study because (i) it is an affordable sensor to collect EEG signals [42] (cost: EUR 149); (ii) it allows us to select the desired position to obtain the EEG signal; and (iii) based on [41], it is a reliable sensor that provides valid EEG data.
3.1.2. Unicorn Brain Interface Hybrid Black
This sensor was used to collect the EEG data from two channels (Fz, PO7) according to the 10–20 system (g.tec Medical Engineering, Schiedlberg, Austria). Specifically, it has the following features: sample frequency at 250 Hz; Bluetooth communication; battery: 350 mA 3.7 V; sensitivity: ±750 mV; and impedance: >100 M Ω; and the following eight EEG channels: Fz, C3, Cz, C4, Pz, PO7, Oz, and PO8. This sensor provides dry EEG electrodes. A study [43] compared the Unicorn sensor and a Neuroscan SynAmpsRT amplifier using a Neuroscan QuikCap (i.e., a traditional high-end wired low-impedance laboratory system) in terms of recording EEG power spectrum data. As a result, the Unicorn sensor, according to the authors, offers reliable measurements for frequency spectrum data. The Unicorn sensor was selected in this study because, (i) based on [43], it is a sensor that offers reliable EEG measurements; and (ii) it provides eight channels to collect EEG signal from the frontal, parietal and occipital lobes, and the central sulcus.
3.1.3. Leap Motion Controller (LMC)
This sensor was employed to collect the positions of the phalanges of the hand, wrist, and palm (Ultraleap, Bristol, UK). Consequently, the hand movements can be computed. This sensor is composed of three infrared cameras that identify X, Y, Z coordinates of the phalanges, wrist, palm, and elbow [44]. It is important to remark that this sensor is non-intrusive because the participants never came into contact with it. The participants placed their hands on a support, so that their hands were above the LMC.
3.1.4. Computers
Two laptops were employed in the experiments. Laptop A was used to collect the EEG data only; whereas Laptop B was employed to identify the hand movements and execute the game.
Laptop A was a MSI GF63-Thin-9SCX with the following features: Intel(R) Core (TM) i5-9300H processor at 2.40 GHz, SDD: 250 GB, HDD: 300 GB, RAM: 32 GB DDR4 2667 MHz SODIMM (Intel, Santa Clara, CA, USA), and GPU: Nvidia GeForce GTX 1650 Max-Q 4 GB. Operating system: Windows 10 Home 22H2 (Nvidia, Santa Clara, CA, USA).
Laptop B was a DELL G3 3579 with the following features: Intel(R) Core (TM) i7-8750H processor at 2.20 GHz, SDD: 128 GB, HDD: 1 TB, RAM: 16 GB DDR4 2667 MHz SODIMM, and GPU: Nvidia GeForce GTX 1050 Ti 4 GB. Operating system: Windows 10 Home 22H2.
3.1.5. Software
The following software was used in this study:
- To implement the game and fuzzy logic: Unity version 2021.3.24f1 and C#
- To identify hand movements: Leap Motion Controller API (Application Programming Interface). Specifically, Ultraleap tracking service version 5.7.2., Control panel version 3.1.0, and Unity package Ultraleap tracking version 6.7.0.
- To collect and process the EEG signal: OpenSignals Version 1, EEGLab v2023.1., and Python version 3.10.12.
- To conduct the statistical analysis: R version 4.2.2
3.2. Methods
3.2.1. Game Description
The game was implemented using Unity 2021.3.24f1. Specifically, it has two stages and is controlled using hand movements.
Game Stage 1
The aim of the first stage is to learn how to play the game and familiarize oneself with controlling it via hand movements. In this stage, a wall of boxes is displayed in the scene (see Figure 1a). This wall is fixed in the game scene. The participant throws balls to bring down the boxes to pass to the second stage. The balls are thrown by performing a fist movement with the right hand. Additionally, the participant can modify the position at which the ball is created in the scene by executing the following movements with the left hand (see Figure 2): (i) ulnar deviation to move to the left; (ii) radial deviation to move to the right; (iii) wrist extension to move upward; and (iv) wrist flexion to move downward.
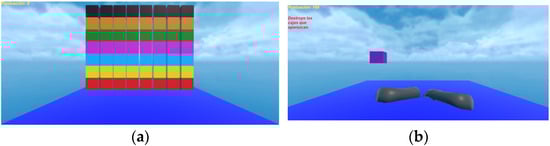
Figure 1.
Game stages: (a) Game stage 1. (b) Game stage 2.
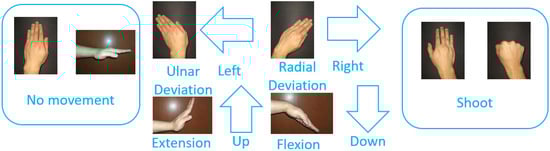
Figure 2.
Hand movements used to play the game stages.
Game Stage 2
At this stage, only one box is displayed; however, this box is moving in the game scene (see Figure 1b). The participant controls the game by using the same hand movements explained in Stage 1. This stage has two game modes: a non-tailored game mode and a tailored game mode.
3.2.2. Identification of Hand Movements
The X, Y, and Z coordinates of the wrist and the distal phalanx from the middle finger were computed as follows to obtain geometric features (i.e., angles of ROM—range of motion):
For extension and flexion movements:
- First, the vector is computed:
- Second, the ROM angle is computed as follows:
For ulnar and radial deviations:
- First, the vector is computed:
- Second, the ROM angle is computed:
- Finally, once the ROM angle is computed, the direction function from the LMC API is used to identify the hand movements. This function retrieves a vector composed of X, Y and Z coordinates (each one has values between −1 and 1) corresponding to the direction that the palm is pointing with respect to the LMC. Specifically, a negative X value is associated with an ulnar deviation, whereas a positive X value corresponds to a radial deviation. Conversely, a negative Y value is associated with a flexion movement, and a positive Y value corresponds to an extension movement.
For the fist movement:
The “grabStrength” function provided in the LMC API was used to identify the fist movement. This function gives values between 0 (i.e., fully opened hand) and 1 (i.e., fully closed hand; a fist movement).
3.2.3. Game Modes
Before implementing these game modes, it is important to remark that the authors RDGR and EJRR tested the game. They played the games using hand movements. The hand movements were identified accurately. They did not find any significant error that might make the game difficult to control using the hand movements. Based on this, we decided to implement the non-tailored and tailored game modes.
The box position and box size at the game stage 2 are modified to change the game difficulty. This game difficulty is set using two game modes:
- (a)
- Non-tailored game mode. In this game mode, random values are used to set the position and size of the box displayed in the game scene. None of the participants’ features are considered to set the game difficulty.
- (b)
- Tailored game mode. In this game mode, the range of motion (ROM) employed by the participants in the execution of a hand movement is used to adjust dynamically the game difficulty. Specifically, a fuzzy logic system was implemented to set the position and size of the box according to the participants’ ROMs.
3.2.4. Dynamic Difficulty Adjustment (DDA) Using Fuzzy Logic in the Tailored Game Mode
DDA was implemented in the tailored game mode using a fuzzy logic system (FLS). ROM for the ulnar deviation and extension movements from the participant were used to set the X and Y positions of the box shown in the game scene, respectively. Conversely, radial deviation and flexion movements from the participant were employed to set the X-axis and Y-axis sizes of the box, respectively. For instance, the FLS will display a big box at the center of the game scene if the difficulty is easy in terms of size and position. Conversely, the FLS will show a small box far from the center of the game scene if the difficulty is hard in terms of size and position.
Three processes were performed to compute the box size and the box position: fuzzification, fuzzy inference, and defuzzification.
Fuzzification
The ROMs of the hand movements were used to define fuzzy input sets. For instance, the ROM of the extension movement is low, or the ROM of the radial deviation is high. Specifically, three fuzzy input sets (i.e., low, medium, and high) were defined with triangular membership functions for each hand movement. The values of the fuzzy input sets were defined according to the ROMs proposed by Klum et al. [16].
Figure 3 presents the fuzzy input sets employed to compute the box position. ROMs from the ulnar movement were employed to compute the box position in X-axis, whereas ROMs from the extension movement were used to calculate the box position in Y-axis.
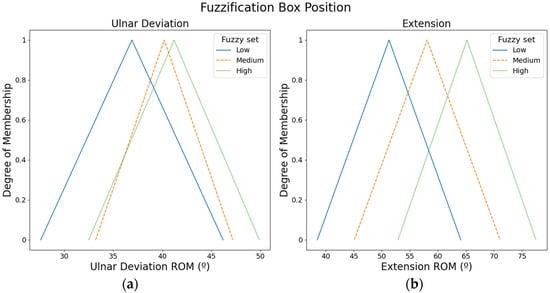
Figure 3.
Fuzzy input sets based on the ROMs that were used to compute the box position: (a) Fuzzy input sets for ulnar movement. (b) Fuzzy input sets for the extension movement.
Figure 4 shows the fuzzy input sets used to calculate the box size. ROMs from the radial movement were used to compute the box size in X-axis, whereas ROMs from the flexion movement were employed to compute the box size in Y-axis.
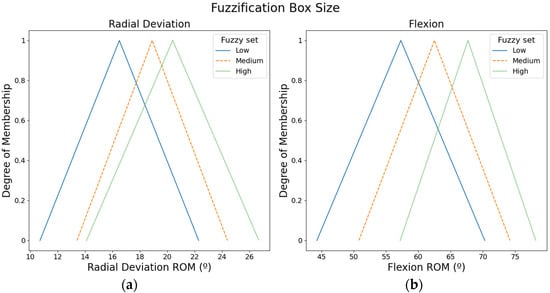
Figure 4.
Fuzzy input sets based on the ROMs that were used to compute the box size: (a) Fuzzy input sets for radial movement. (b) Fuzzy input sets for the flexion movement.
Fuzzy Inference
- Adjustment of the box position
Six fuzzy output sets with trapezoidal membership functions were defined to adjust the box position. Figure 5 shows the three fuzzy output sets for the X axis and three fuzzy output sets for the Y axis (i.e., easy, medium, and hard).
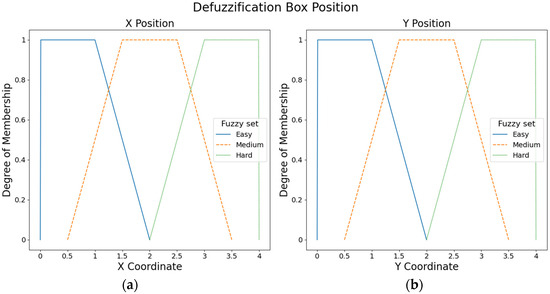
Figure 5.
Fuzzy output sets for the box position: (a) Fuzzy output sets for the X axis. (b) Fuzzy output sets for the Y axis.
Additionally, six rules were defined to compute the fuzzy output for the box position:
- IF ulnar_ROM is low THEN X-position_difficulty is easy
- IF ulnar_ROM is medium THEN X-position_difficulty is medium
- IF ulnar_ROM is high THEN X-position_difficulty is hard
- IF extension_ROM is low THEN Y-position_difficulty is easy
- IF extension_ROM is medium THEN Y-position_difficulty is medium
- IF extension_ROM is high THEN Y-position_difficulty is hard
- Adjustment of the box size
Similarly, six fuzzy output sets with trapezoidal membership functions were created to set the box size. Figure 6 presents the three fuzzy output sets for the X axis and three fuzzy output sets for the Y axis (i.e., easy, medium, and hard).
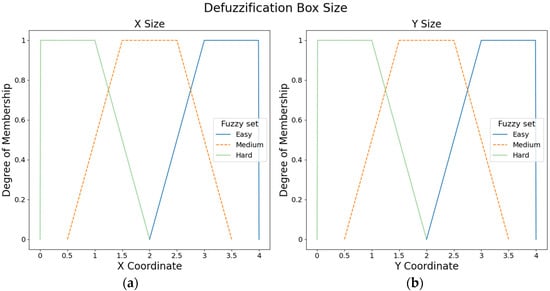
Figure 6.
Fuzzy output sets for the size position: (a) Fuzzy output sets for the X axis. (b) Fuzzy output sets for the Y axis.
Moreover, six rules were defined to compute the fuzzy output of the box size:
- IF radial_ROM is low THEN X-size_difficulty is easy
- IF radial_ROM is medium THEN X-size_difficulty is medium
- IF radial_ROM is high THEN X-size_difficulty is hard
- IF flexion_ROM is low THEN Y-size_difficulty is easy
- IF flexion_ROM is medium THEN Y-size_difficulty is medium
- IF flexion_ROM is high THEN Y-size_difficulty is hard
Defuzzification
Once the fuzzy rules were aggregated, the fuzzy outcome was defuzzified to obtain either the specific box position in X and Y, or the specific box size in X and Y. The center of sums method was used to defuzzify:
where n is the number of fuzzy output sets (i.e., three fuzzy output sets), zi is the center of each fuzzy output set (e.g., easy, medium, and hard), and is the area of each fuzzy output set.
The box position in the Z axis was kept the same for all the boxes displayed in the game scene. Regarding the box size in the Z axis, this was the average of X and Y axes that were computed.
3.2.5. Engagement Measurement and Participants’ Opinions on Game Mode Preferences
Engagement Measurement
The engagement index was computed using the equation proposed by Ruqeyya et al. [38]. This equation considers the theta (θ) and alpha (α) bands from the frontal and parietal lobes. Due to the EEG channels provided by each EEG sensor, the engagement index was computed from the participants using variations on the EEG channels:
where θ corresponds to the theta band (4–8 Hz) and α band (8–12 Hz). Equation (6) is the one proposed by Ruqeyya et al., and it was used when the Bitalino sensor was employed to collect the EEG signal. AF stands for anterior frontal, P stands for parietal, and odd numbers (3, 7) refer to the left hemisphere of the brain. These positions (AF3, P7) were set according to the 10–20 system.
The Unicorn sensor does not provide AF3 and P7 channels; consequently, Equation (7) was used when this EEG sensor was employed to collect the EEG signal. The Fz and PO7 channels were selected, as they were the channels closest to AF3 and P7 channels proposed by Ruqeyya et al.
Participants’ Opinions on Game Mode Preferences
A questionnaire was given to the participants once they finished playing both game modes. This questionnaire asked them to select their favorite game mode and to rate the non-tailored game mode and the tailored game mode using a Likert scale in terms of: (i) ease of play (1: easy; 2, 3, 4, and 5: hard), (ii) entertainment (0: nothing; 1, 2, 3, 4, and 5: high), (iii) game response time to commands (1: slow; 2, 3, 4, and 5: fast), (iv) frustration (0: nothing; 1, 2, 3, 4, and 5: high), and (v) boredom (0: nothing; 1, 2, 3, 4, and 5: high) during the playing. Each Likert scale was explained to the participants.
3.2.6. Experiments
Participants and Ethical Considerations
Fifty-three volunteers participated in the experiments (mean age = 27.88, standard deviation = 9.71). All the volunteers gave their informed consent for inclusion prior participating in the experiments. The participants met the following inclusion criteria: (i) they were healthy, and (ii) they were over eighteen years old. The exclusion criteria for participants were as follows: (i) they were pregnant, (ii) they had a motor impairment or motor medical condition (e.g., Parkinson), and (iii) they had a hand injury. This study was conducted in accordance with the Declaration of Helsinki, and the protocol was approved by the Ethical Committee of the School of Engineering and Science at Tecnológico de Monterrey (Protocol identification code: CA-EIC-2403-01).
Experiment
Each participant played the non-tailored game and the tailored game. Each game mode was played for three minutes. During the playing, EEG signals were collected using the respective EEG sensor according to the experimental group. Specifically, EEG signals were collected for 3 min per game mode and per participant.
A numerical id was given to each participant. Participants with an odd id played the non-tailored game mode first, whereas participants with even id played the tailored game mode first, to reduce the “learning effect”.
- Experimental group 1—Bitalino sensor
EEG signals from AF3 and P7 positions were recorded at a sampling rate of 1000 Hz using two Bitalino sensors (i.e., one Bitalino sensor per position) on twenty participants (see Figure 7). Two participants were left-handed, whereas the remaining participants were right-handed. Three volunteers had experience in using LMC.
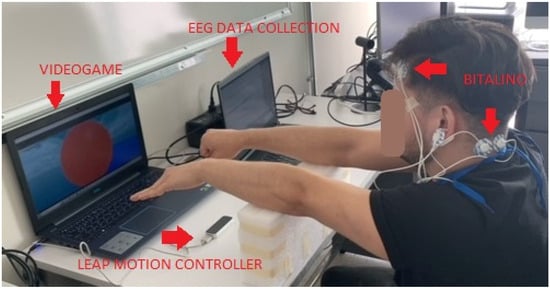
Figure 7.
Experimental setting using the Bitalino sensor to collect the EEG signal.
The experimental setting of the Bitalino sensors was as follows:
- (1)
- First, the distance between each participant’s inion and nasion was measured.
- (2)
- Then, following the 10–20 system, AF3 and P7 positions were localized.
- (3)
- The AF3 and P7 positions, and the earlobes, were cleaned with alcohol.
- (4)
- Then, the electrodes of one Bitalino were placed at AF3 and the electrodes of the other Bitalino were placed at P7. The reference electrodes were placed on the earlobes.
- (5)
- Finally, OpenSignals Version 1 was used to acquire the EEG data. Before starting the experiments, the EEG activity was revised in OpenSignals while participants were resting, so that abnormal activity could be detected visually from the acquisition software (i.e., a flat line signal or high activity signal when volunteers were resting).
Specifically, a Butterworth bandpass filter of the 6th order with the frequency range of 4–12 Hz was used to preprocess the EEG signals. Then, the power spectral density was computed to the filtered EEG signal using the Welch method. Finally, the α and θ bands were computed from the power spectral density. This processing was performed using Python 3.10.12.
- Experimental group 2—Unicorn sensor
EEG signals were recorded at a sampling rate of 250 Hz using the Unicorn sensor on thirty-three participants (see Figure 8). Only one participant was left-handed, whereas the remaining participants were right-handed. Only one participant had experience in using LMC.

Figure 8.
Experimental setting using the Unicorn sensor to collect the EEG signal.
The experimental setting of the Unicorn sensor was as follows:
- First, the distance between each participant’s inion and nasion was measured.
- Then, following the 10–20 system, the Cz position was localized.
- The EEG cap of the Unicorn sensor was placed based on the Cz position.
- Then, saline solution was placed on eight positions of the EEG cap.
- Electrodes were placed on the eight positions of the EEG cap. The reference electrodes were placed on the mastoids.
- Finally, EEGLab v2023.1. was used to acquire the EEG data. Before starting the experiments, the EEG activity was revised in EEGLab while participants were resting, so that abnormal activity could be detected visually from the acquisition software (i.e., a flat line signal or high activity signal when volunteers were resting). It is important to remark that the engagement index was computed only using EEG data from Fz and PO7 positions.
Specifically, a Butterworth bandpass filter of the 6th order with the frequency range 1–30 Hz was used to preprocess the EEG signals. The ICA (Independent Component Analysis) algorithm was applied to filtered EEG signals. ICA components with brain activity lower than 20% were discarded. This processing was performed using EEGLab v2023.1. Then, the power spectral density was computed to the remaining ICA components using the Welch method. Finally, α and θ bands were computed from the power spectral density. This processing was performed using Python 3.10.12.
3.2.7. Statistical Analysis
Statistical Analysis on Engagement Index
The following two comparisons were performed to determine whether there was a significant difference in terms of engagement index between game modes using the two EEG sensors:
- Comparison 1 (Unicorn: tailored game mode versus non-tailored game mode). The difference in terms of engagement collected via a Unicorn sensor between the non-tailored game mode and the tailored game mode.
- Comparison 2 (Bitalino: tailored game mode versus non-tailored game mode). The difference in terms of engagement collected via a Bitalino sensor between the non-tailored game mode and the tailored game mode.
First, Shapiro–Wilk tests were performed to determine whether the data followed a normal distribution. As a result of the Shapiro–Wilk tests, we performed a Wilcoxon-Signed-Rank test to determine whether there was a significant difference between the engagement index and the game modes in each EEG sensor used to collect the EEG data. We used an alpha = 0.05 for both statistical tests.
Statistical Analysis on Participants’ Opinions on Game Mode Preferences
Regarding the participants’ opinions on game mode preferences, we collected their opinions using questionnaires after finishing playing both game modes on the following: their favorite game mode, the easiest game mode to play (ease of play), the least frustrating game mode to play (frustration), the least boring game mode to play (boredom), the game mode with the fastest game response time to commands (game response time), and the most entertaining game mode (entertainment).
We divided the questionnaires into two groups based on the sensor used to collect the EEG signal (i.e., experimental group 1—Bitalino sensor, and experimental group 2—Unicorn sensor). For each experimental group, the responses of each participant for each opinion (i.e., ease of play, frustration, boredom, game response time, and entertainment) and for each Likert scale value were added. As a result, there were frequency tables for ease of play, frustration, boredom, game response time, and entertainment per EEG sensor. Each frequency table showed the frequencies obtained in each Likert scale value. Additionally, a frequency table for each EEG sensor regarding the favorite mode was obtained. Specifically, these tables summarized the “favorite mode” frequencies reported for the non-tailored and the tailored modes in the experimental group 1 (Bitalino sensor) and experimental group 2 (Unicorn sensor). These tables were used to present the results and conduct the statistical analysis regarding the participants’ opinions on game mode preferences.
Table 1 presents the statistical tests performed to determine whether there was a significant association between the participants’ opinion variables and the game modes; specifically, we performed chi-squared and Fisher’s exact tests to analyze this depending on the frequencies reported in each variable. It is important to note that a requirement for applying a chi-squared test is that the frequencies reported in each variable (i.e., in this case, the frequency reported in each Likert scale value) should be higher than five. Fisher’s exact test was applied in cases where a value of a Likert scale was lower than five. Furthermore, we considered only the Likert scale values that reported values higher than zero for both game modes. We used alpha = 0.05 for both statistical tests.

Table 1.
Statistical tests used to analyze whether there was a significant association between the game modes and the participants’ opinions on game mode preferences.
4. Results
4.1. Engagement Index Results
It can be seen from Table 2 and Table 3 that the engagement values reported by each EEG sensor varied; this might be due to the difference in their technical specifications and in the participants of each experimental group (age, unequal samples). Despite this fact, there was a similarity in one statistical measure; that is, the maximum engagement values were reported in the non-tailored game mode in both experimental groups (Bitalino and Unicorn sensors). The results of the engagement index for each experimental group (Unicorn sensor—Comparison 1, and Bitalino sensor—Comparison 2) will be explained next.
4.1.1. Comparison 1 (Unicorn: Tailored Game Mode Versus Non-Tailored Game Mode)
The experimental results revealed that the non-tailored game mode using the Unicorn sensor to collect the EEG signals (mean = 6.297 ± 11.274, median = 2.065) reported a higher mean score and median for the engagement index than the tailored game mode using the Unicorn sensor to record the EEG signal (mean = 4.408 ± 6.243, median = 1.777). Further details can be seen in Table 2.
Table 2.
Statistical measures of the engagement index using Unicorn sensor. The highest value for each statistical measure is highlighted in bold.
Table 2.
Statistical measures of the engagement index using Unicorn sensor. The highest value for each statistical measure is highlighted in bold.
| Statistical Measures of Engagement Index | Unicorn Sensor | |
|---|---|---|
| Non-Tailored Game Mode | Tailored Game Mode | |
| Mean | 6.297 | 4.408 |
| Standard deviation | 11.274 | 6.243 |
| Median | 2.065 | 1.777 |
| Maximum | 57.638 | 24.890 |
| Minimum | 0.350 | 0.353 |
Additionally, Shapiro–Wilk tests (α = 0.05) revealed that the engagement index data obtained via Unicorn sensor from both game modes did not follow a normal distribution (non-tailored game mode: p value = 3.847 × 10⁻⁹, tailored game mode: p value = 4.628 × 10⁻⁸). Based on this, Wilcoxon-Signed-Rank test (α = 0.05) was applied. As a result, there was a significant difference in terms of the engagement index obtained via a Unicorn sensor between the non-tailored game mode and the tailored game mode (p value = 0.04054).
4.1.2. Comparison 2 (Bitalino: Tailored Game Mode versus Non-Tailored Game Mode)
In the case of using the Bitalino sensor for collecting the EEG signals, the experimental results revealed that both game modes achieved similar mean scores and medians for the engagement index (tailored game mode: mean = 3.619 ± 0.551, median = 3.630; non-tailored game mode: mean = 3.616 ± 0.771, median = 3.630). Table 3 shows further statistical measures.
Table 3.
Statistical measures of the engagement index using Bitalino sensor. The highest value for each statistical measure is highlighted in bold.
Table 3.
Statistical measures of the engagement index using Bitalino sensor. The highest value for each statistical measure is highlighted in bold.
| Statistical Measures of Engagement Index | Bitalino Sensor | |
|---|---|---|
| Non-Tailored Game Mode | Tailored Game Mode | |
| Mean | 3.616 | 3.619 |
| Standard deviation | 0.771 | 0.551 |
| Median | 3.630 | 3.630 |
| Maximum | 6.340 | 4.941 |
| Minimum | 2.344 | 2.206 |
Moreover, Shapiro–Wilk tests (α = 0.05) revealed that the engagement index data obtained via Bitalino in the non-tailored game mode did not follow a normal distribution (p value = 0.000031). Conversely, the engagement index data in the tailored game mode followed a normal distribution (p value = 0.152). Based on this, Wilcoxon-Signed-Rank test (α = 0.05) was applied. As a result, there was no significant difference in terms of the engagement index obtained via a Bitalino sensor between the non-tailored game mode and the tailored game mode (p value = 0.3884).
4.2. Results on Participants’ Opinions on Game Mode Preferences
Most participants in both experimental groups (Bitalino and Unicorn) answered that their favorite mode was the non-tailored game mode. Additionally, chi-squared test (α = 0.05) revealed no significant association between the game modes (non-tailored, tailored) and the sensors used to collect the EEG signal for computing the engagement (Bitalino, Unicorn) in terms of the favorite mode (p value = 1). The results of the participants’ opinions for each experimental group (Bitalino and Unicorn sensors) will be explained next.
4.2.1. Experimental Group 1—Unicorn Sensor
As mentioned earlier, 33 volunteers played the game modes, and their EEG signals were collected using the Unicorn sensor. More than a half of the volunteers selected the non-tailored game mode as their favorite game mode (57.58%: 19 out of 33 participants), see Figure 9.
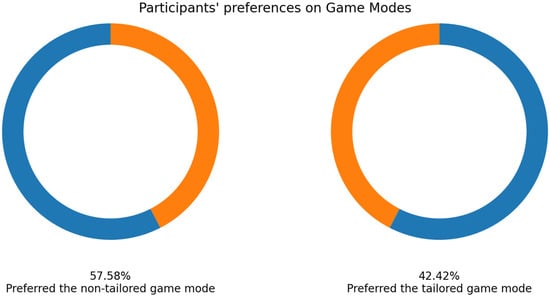
Figure 9.
Participants’ favorite game mode in experimental group 1—Unicorn sensor.
In terms of the easiest mode to play, the participants reported higher ease-of-play rates (score of 1) on a Likert scale (1: easy; 2, 3, 4, and 5: hard) when using the tailored game mode (20 out of 33 participants: 60.60%) than when using the non-tailored game mode (9 out of 33 participants: 27.27%), see Figure 10. Additionally, the participants did not report any hard play rates for the tailored game mode (score of 5), which is one of the DDA goals. Furthermore, Fisher’s exact test (α = 0.05) revealed that there was a significant association between the game modes (non-tailored, tailored) and the ease-of-play variable in the Likert scale values (1, 2, 3, 4); p value = 0.009341. The Likert scale value of 5 was not considered, because its frequency was zero in the tailored game mode.
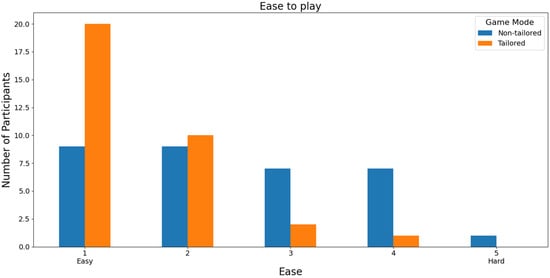
Figure 10.
Participants’ opinions on the ease of playing the game modes using the Unicorn sensor.
Regarding the least frustrating game mode, the tailored game mode reported the lowest frustration scores (a score of 0: 36.36%, i.e., 12 out of 33 volunteers; a score of 1: 39.39%, i.e., 13 out of 33 volunteers) on a Likert scale (0: nothing; 1, 2, 3, 4, and 5: high); see Figure 11. Furthermore, the participants did not report any high frustration rates for the tailored game mode (scores of 4 and 5), which is one of the DDA goals. Fisher’s exact test (α = 0.05) revealed that there was a significant association between the game modes (non-tailored, tailored) and the frustration variable in the Likert scale values (0, 1, 2, 3); p value = 0.0466. The Likert scale values of 4 and 5 were not considered, because their frequencies were zero in the tailored game mode.

Figure 11.
Participants’ opinions on frustration in game modes using the Unicorn sensor.
With respect to the least boring game mode, 78.79% of those interviewed rated both game modes as not boring (a score of 0) on a Likert scale (0: nothing; 1, 2, 3, 4, and 5: high); see Figure 12. In this case, the participants did not report high boredom rates, either for the non-tailored game mode or for the tailored mode (scores of 4 and 5), which is one of the DDA goals. Moreover, Fisher’s exact test (α = 0.05) revealed no significant association between the game modes (non-tailored, tailored) and the boredom variable in the Likert scale values (0, 1, 2, 3); p value = 1. The Likert scale values of 4 and 5 were not considered, because their frequencies were zero in both game modes.
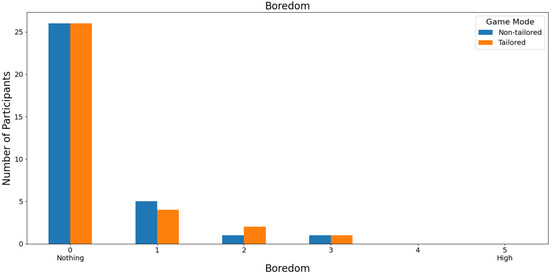
Figure 12.
Participants’ opinions on boredom in game modes using the Unicorn sensor.
Focusing on the speed of the game response time to the commands executed by the participants, most participants rated both games with a score of 4 (non-tailored game mode: 42.43%, i.e., 14 out of 33 volunteers; tailored game mode: 63.64%, i.e., 21 out of 33 volunteers) based on a Likert scale (1: slow; 2, 3, 4, and 5: fast), see Figure 13. Furthermore, Fisher’s exact test (α = 0.05) revealed no significant association between the game modes (non-tailored, tailored) and the game response time variable in the Likert scale values (2, 3, 4, 5); p value = 0.1844. The Likert scale value of 1 was not considered, because its frequency was zero in both game modes.
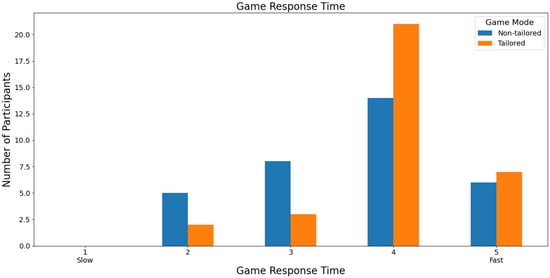
Figure 13.
Participants’ opinions on game response time to commands in game modes using the Unicorn sensor.
Finally, almost half of the volunteers (45.46%: 15 out of 33) rated the game modes with high scores in terms of entertainment. Specifically, the non-tailored game mode was rated with a score of 5 and the tailored game mode with a score of 4 on a Likert scale (0: nothing; 1, 2, 3, 4, and 5: high); see Figure 14. Moreover, Fisher’s exact test (α = 0.05) revealed no significant association between the game modes (non-tailored, tailored) and the entertainment variable in the Likert scale values (3, 4, 5); p value = 0.787. The Likert scale values of 0, 1, and 2 were not considered, because their frequencies were zero in the game modes.

Figure 14.
Participants’ opinions on entertainment in game modes using the Unicorn sensor.
4.2.2. Experimental Group 2—Bitalino Sensor
Twenty volunteers played both game modes and EEG signals were collected using the Bitalino sensor. Regarding their favorite game mode, most participants preferred the non-tailored game mode (60%: 12 out of 20 volunteers); see Figure 15.
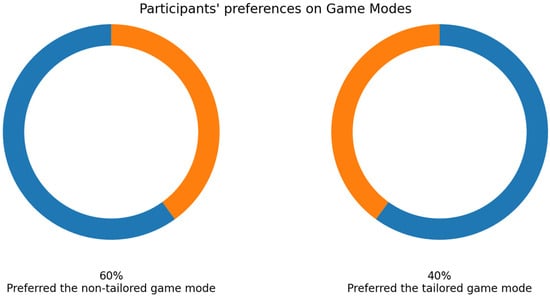
Figure 15.
Participants’ favorite game mode in experimental group 2—Bitalino sensor.
Half of the participants ranked the tailored game mode as not frustrating (score 0) on a Likert scale (0: nothing; 1, 2, 3, 4, and 5: high), see Figure 16. Additionally, Fisher’s exact test (α = 0.05) revealed no significant association between the game modes (non-tailored, tailored) and the frustration variable in the Likert scale values (0, 1, 2, 3, 5), p value = 0.1438. The Likert scale value of 4 was not considered, because the frequency was zero in the tailored game mode. Similarly, over half of the participants (55%: 11 out of 20 participants) ranked the tailored game mode with the highest score (a score of 1) in terms of ease of play based on a Likert scale (1: easy; 2, 3, 4, and 5: hard); see Figure 17. Furthermore, neither the tailored game mode nor the non-tailored mode reported hard play rates (a score of 5), which is one of the DDA goals. Fisher’s exact test (α = 0.05) revealed no significant association between the game modes (non-tailored, tailored) and the ease-of-play variable in the Likert scale values (1, 2, 3, 4); p value = 0.7366. The Likert scale value of 5 was not considered, because its frequency was zero in the game modes.
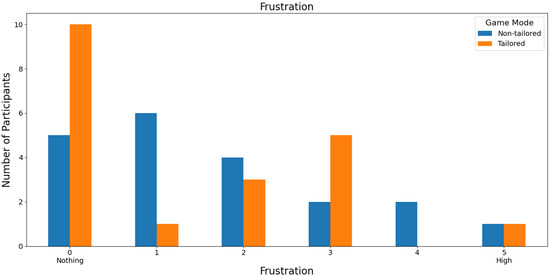
Figure 16.
Participants’ opinions on frustration in game modes using the Bitalino sensor.
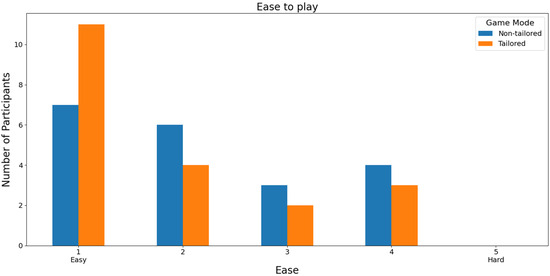
Figure 17.
Participants’ opinions on the ease of playing in game modes using the Bitalino sensor.
Most participants ranked both game modes as non-boring (0 score) on a Likert scale (0: nothing; 1, 2, 3, 4, and 5: high); see Figure 18. Specifically, 80% and 85% of the participants rated the non-tailored game mode and the tailored game mode with a score of 0, respectively. Furthermore, neither the non-tailored game mode nor the tailored mode received high boredom rates (scores of 3, 4, and 5), which is one of the DDA goals. Fisher’s exact test (α = 0.05) revealed no significant association between the game modes (non-tailored, tailored) and the boredom variable in the Likert scale values (0, 1, 2); p value = 1. The Likert scale values 3, 4, and 5 were not considered, because their frequencies were zero in the game modes.
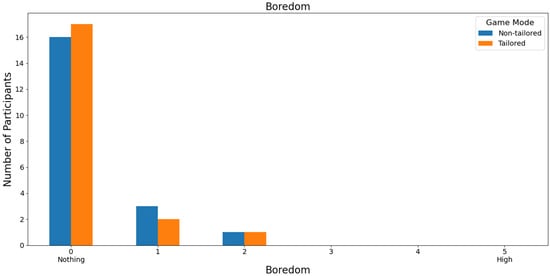
Figure 18.
Participants’ opinions on boredom in game modes using the Bitalino sensor.
Figure 19 shows that most participants ranked both games with a score of 4 (35%: 7 out of 20 participants) in terms of game response time to the commands executed by the participants based on a Likert scale (1: slow; 2, 3, 4, and 5: fast). Additionally, Fisher’s exact test (α = 0.05) revealed no significant association between the game modes (non-tailored, tailored) and the game response time variable in the Likert scale values (2, 3, 4, 5); p value = 1. The Likert scale value 1 was not considered because its frequency was zero in the game modes.
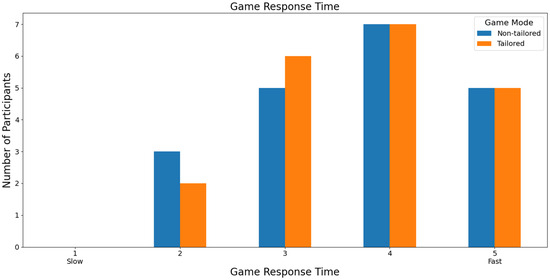
Figure 19.
Participants’ opinions on game response time to the commands in game modes using the Bitalino sensor.
Additionally, the majority of participants ranked both game modes with the highest score, a score of 5 (non-tailored game mode: 55%, i.e., 11 out of 20 volunteers; tailored game mode: 45%, i.e., 9 out of 20 volunteers), in terms of entertainment based on a Likert scale (0: nothing; 1, 2, 3, 4, and 5: high); see Figure 20. Furthermore, Fisher’s exact test (α = 0.05) revealed no significant association between the game modes (non-tailored, tailored) and the entertainment variable in the Likert scale values (2, 3, 4, 5); p value = 0.5836. The Likert scale values 0 and 1 were not considered, because their frequencies were zero in the game modes.
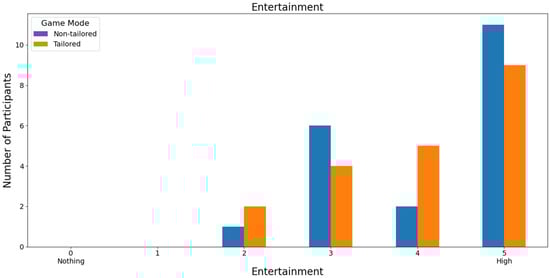
Figure 20.
Participants’ opinions on entertainment in game modes using the Bitalino sensor.
5. Discussion
This research aims to answer eight research questions (RQs) explained earlier.
Regarding RQ1 (Is there any significant difference in terms of the engagement index measured using EEG signals between the non-tailored game mode and the tailored game mode?), two comparisons were performed to analyze the engagement index in the two game modes: tailored game mode, and non-tailored game mode. In terms of the Unicorn sensor, contrary to expectations, the non-tailored game mode reported the highest mean engagement index (mean = 6.297, standard deviation = 11.274). Additionally, the statistical analysis revealed that there was a significant difference in the engagement index between game modes using the Unicorn sensor to collect the EEG signals (p value = 0.04054).
Conversely, with regard to the Bitalino sensor, the tailored game mode achieved the highest mean engagement index (mean = 3.619, standard deviation = 0.551); nevertheless, the statistical analysis concluded that there was no significant difference in the engagement index between game modes using Bitalino sensor to collect the EEG signals (p value = 0.3884).
Furthermore, both sensors achieved the highest engagement index values in the non-tailored game modes (Unicorn: 57.638; Bitalino: 6.340).
Focusing on RQ2 (Which game mode is the favorite?), most participants agreed that the non-tailored game mode was their favorite game mode, irrespective of the EEG sensor used to obtain the engagement index (Unicorn sensor: 57.58% of the participants, Bitalino sensor: 60% of the participants). Furthermore, it is important to remark that a chi-squared test revealed (α = 0.05) no significant association in terms of “favorite game mode” between the EEG sensors used to collect the EEG data to process the engagement (Bitalino, Unicorn) and the game modes (non-tailored, tailored); p value = 1.
With respect to RQ3 (Which game mode is the easiest to play?), the majority of participants selected the tailored game mode as the easiest game mode to play, irrespective of the EEG sensor used (Unicorn sensor: 60.60% of the participants, Bitalino Sensor: 55% of the participants), i.e., they ranked the tailored game mode with the highest score (a score of 1) in terms of the ease-of-play Likert scale (1: easy, 2, 3, 4, and 5: hard). Additionally, Fisher’s exact test (α = 0.05) revealed a significant association between the game modes (non-tailored, tailored) and the ease-of-play variable in the Likert scale values (1, 2, 3, 4) when the Unicorn sensor was used to collect the EEG data for processing the engagement (p value = 0.009341).
In the case of RQ4 (Which game mode is the least frustrating to play), similarly to RQ3, over half of the participants ranked the tailored game mode with low frustration rates (scores of 0 and 1) on a Likert scale (0: nothing; 1, 2, 3, 4, and 5: high), irrespective of the EEG sensor, i.e., 75.75% of the participants that used the Unicorn sensor (a score of 0: 36.36% of the participants, and a score of 1: 39.39% of the participants) and 55% of the participants that used the Bitalino sensor (a score of 0: 50% of the participants, and a score of 1: 5% of the participants). Moreover, Fisher’s exact test (α = 0.05) revealed a significant association between the game modes (non-tailored, tailored) and the frustration variable in the Likert scale values (0, 1, 2, 3) when the Unicorn sensor was used to collect the EEG data for processing the engagement (p value = 0.0466).
Focusing on RQ5 (Which game mode is the least boring to play?), most participants agreed that both game modes were not boring (i.e., a score of 0 on a Likert scale [0: nothing; 1, 2, 3, 4, and 5: high]), irrespective of the EEG sensor used in the experiments, i.e., the Unicorn sensor (non-tailored mode and tailored mode: 78.79% of the participants) and the Bitalino sensor (non-tailored mode: 80% of the participants, and tailored mode: 85% of the participants). Fisher’s exact tests did not show any significant associations between the game modes and boredom.
With reference to RQ6 (Which game mode is the most entertaining to play?), most of the participants ranked the non-tailored game mode with the highest score (5) of the Likert scale [0: nothing; 1, 2, 3, 4, and 5: high], irrespective of the EEG sensor employed in the experiments (i.e., Unicorn: 45.46% of the volunteers, Bitalino: 55% of the volunteers). Fisher’s exact tests did not show any significant associations between the game modes and entertainment.
With respect to RQ7 (Which game mode has the fastest game response time to control commands?), most participants that used the Unicorn sensor to collect the EEG signals considered the tailored game mode the game mode with the fastest game response time to control commands. Specifically, 63.64% of the participants rated the tailored game mode with a high score (4) of the Likert scale (1: slow; 2, 3, 4, and 5: fast). On the other hand, most participants that used the Bitalino sensor in the experiments considered both game modes to offer a fast response time. In particular, 35% of the participants ranked both game modes with a high score (4) of the Likert scale. Additionally, Fisher’s exact tests did not reveal any significant associations between the game modes and game response time.
Finally, regarding the last RQ (Is there any significant association between the game modes and the players’ opinion variables (favorite game mode, ease of play, frustration, boredom, entertainment, and game response time)?), Fisher’s exact tests showed significant associations between the game modes (non-tailored, tailored) and the following players’ variables: ease of play when the Unicorn sensor was used to collect the EEG in the Likert scale values (1, 2, 3, 4), p value = 0.009341; and frustration when the Unicorn sensor was used to collect the EEG in the Likert scale values (0, 1, 2, 3), p value = 0.0466.
Although studies have analyzed emotions in games according to Calvo-Morata et al. [35], few studies have performed this in serious games with DDA for upper limb rehabilitation. Specifically, studies have employed the system usability scale questionnaire to assess the system usability of games with DDA for hand [29] and arm rehabilitation [31]. Similarly, the GEQ questionnaire has been used to assess the participants’ engagement during the playing of a serious game with DDA and the same game without DDA for hand rehabilitation [30]. This study reported no significant difference between the game modes in terms of the GEQ scores. Another study has used EMG, ECG, and electrodermal activity to adjust the game difficulty of a serious game for arm rehabilitation [32]. Furthermore, this study [32] used the NASA-TLX questionnaire to assess the participants’ affective state. The authors reported no significant difference between the two strategies for adjusting the game difficulty in terms of the workload induced by the participants. It is important to remark that this study used a questionnaire and EEG signals to determine the participants’ engagement and preferences. As can be seen, further research could focus on using other biosignals (e.g., respiration, electrocardiogram, and electrodermal activity) to determine the participants’ engagement.
As mentioned earlier, this study has the following limitations: (i) the majority of the participants (i.e., 77.35%) were between 18 and 29 years old; consequently, further experiments considering participants past their twenties can be conducted, so that opinions from participants of other ages can be added to improve the game and the DDA method; (ii) the samples of participants are small, unequal, and non-randomized; therefore, further experiments using randomized equal samples with a higher number of participants might be conducted; and (iii) all the participants were healthy; therefore, further experiments with participants needing hand rehabilitation should be performed, so that the game can be refined. Although the experiments were performed with small non-randomized unequal samples of healthy participants, this comparative study is a starting point to analyze the difference between the engagement computed from EEG signals in two game modes for hand rehabilitation with different adjustments of game difficulty (non-tailored and tailored).
Furthermore, this study implemented one method (fuzzy logic) to perform DDA and considered the participants’ ROMs to adjust the game difficulty. Further research could explore the implementation of other artificial intelligence methods (e.g., Q-learning, neural networks) to perform DDA.
Additionally, this study has used the means of ROMs provided by Klum et al. [16]. Klum et al. mentioned that the ROM varies according to people’s age; consequently, adjustments on the input fuzzy sets can be performed using the participants’ ROMs based on their ages, so that the DDA can be fitted more appropriately to the participants. Moreover, other membership functions and defuzzification methods can be implemented. Similarly, other participants’ features could be used as inputs to adjust the game difficulty (e.g., the participants’ muscle effort, which can be obtained via electromyography signals, and the participants’ engagement, which can be computed via biosignals). Additionally, non-player-characters’ features (e.g., position and size) were modified to dynamically adjust the game difficulty in this study. Consequently, other non-player-characters’ features (e.g., color, shape, and speed) can be used as well to perform DDA.
6. Conclusions and Future Work
This study implemented two game modes for hand rehabilitation. Both game modes were controlled using the following hand movements: wrist extension, wrist flexion, ulnar and radial deviations, and fist. The game difficulty was randomly adjusted in the non-tailored game mode, whereas the game difficulty was dynamically adjusted using a fuzzy logic system in the tailored game mode based on the participants’ ROMs. Additionally, participants’ engagement was computed using EEG signals collected via a Unicorn sensor and a Bitalino sensor. Moreover, questionnaires were applied to participants after finishing playing both game modes to gather their opinions on their favorite game mode, the game mode that is the easiest to play, the game mode that is the least frustrating to play, the game mode that is the least boring to play, the game mode that is the most entertaining to play, and the game mode that has the fastest game response time. The non-tailored game mode reported the highest mean engagement index (mean = 6.297, standard deviation = 11.274) when the EEG signal was collected via a Unicorn sensor, whereas the tailored game mode achieved the highest mean engagement index (mean = 3.619, standard deviation = 0.551) when the EEG signal was collected via the Bitalino sensor. Nevertheless, Wilcoxon-Signed-Rank test revealed that there was only a significant difference in the engagement index between game modes when the EEG signal was collected via the Unicorn sensor (p value = 0.04054). Regarding the players’ opinions, Fisher’s exact tests revealed significant associations between the game modes (non-tailored, tailored) and only the following players’ variables: ease of play when the Unicorn sensor was used to collect the EEG (p value = 0.009341); and frustration when the Unicorn sensor was used to collect the EEG (p value = 0.0466).
As mentioned earlier, future research could focus on (i) employing other biosignals (e.g., respiration, electrocardiogram, and electrodermal activity) to compute the participants’ engagement; (ii) conducting further experiments with participants with hand injuries and those past their twenties; (iii) implementing other membership functions and defuzzification methods to perform DDA; (iv) implementing other artificial intelligence methods (e.g., Q-learning, neural networks) to perform DDA; (v) using other participants’ features as inputs to adjust the game difficulty (e.g., the participants’ muscle effort and the participants’ engagement); and (vi) using other non-player-characters’ features (e.g., color, shape, and speed) to perform DDA.
Author Contributions
Conceptualization, R.D.G.-R. and E.J.R.-R.; methodology, R.D.G.-R., E.J.R.-R. and L.M.A.-V.; software, R.D.G.-R.; validation, R.D.G.-R., E.J.R.-R. and L.M.A.-V.; formal analysis, R.D.G.-R., E.J.R.-R., L.M.A.-V. and A.M.-H.; investigation, R.D.G.-R. and E.J.R.-R.; data curation, R.D.G.-R.; writing—original draft preparation, R.D.G.-R., E.J.R.-R., L.M.A.-V. and A.M.-H.; writing—review and editing, R.D.G.-R., E.J.R.-R., L.M.A.-V. and A.M.-H.; visualization, R.D.G.-R., E.J.R.-R., L.M.A.-V. and A.M.-H.; supervision, E.J.R.-R., L.M.A.-V. and A.M.-H. All authors have read and agreed to the published version of the manuscript.
Funding
This research received no external funding and The APC was funded by Universidad Veracruzana.
Institutional Review Board Statement
The study was conducted in accordance with the Declaration of Helsinki, and approved by the Ethical Committee of the School of Engineering and Science at Tecnológico de Monterrey (protocol code CA-EIC-2403-01, 15 April 2024).
Informed Consent Statement
Informed consent was obtained from all subjects involved in the study.
Data Availability Statement
The data presented in this study are available on request from the corresponding author. The data are not publicly available due to privacy concerns.
Acknowledgments
R.D. García-Ramón thanks Mexican National Council of Humanities, Science and Technology Conahcyt (Consejo Nacional de Humanidades, Ciencias y Tecnologías) for funding his MPhil studies (CVU number: 1221049, scholarship number: 821654).
Conflicts of Interest
The authors declare no conflicts of interest.
References
- Bergstra, S.A.; Murgia, A.; Te Velde, A.F.; Caljouw, S.R. A systematic review into the effectiveness of hand exercise therapy in the treatment of rheumatoid arthritis. Clin. Rheumatol. 2014, 33, 1539–1548. [Google Scholar] [CrossRef] [PubMed]
- O’brien, A.V.; Jones, P.; Mullis, R.; Mulherin, D.; Dziedzic, K. Conservative hand therapy treatments in rheumatoid arthritis—A randomized controlled trial. Rheumatology 2006, 45, 577–583. [Google Scholar] [CrossRef] [PubMed]
- Vinstrup, J.; Calatayud, J.; Jakobsen, M.D.; Sundstrup, E.; Jørgensen, J.R.; Casaña, J.; Andersen, L.L. Hand strengthening exercises in chronic stroke patients: Dose-response evaluation using electromyography. J. Hand Ther. 2018, 31, 111–121. [Google Scholar] [CrossRef] [PubMed]
- Horváth, J.; Bálint, Z.; Szép, E.; Deiszinger, A.; Minier, T.; Farkas, N.; Török, E.; Papp, É.H.; Komjáti, D.; Mándó, Z.; et al. Efficacy of intensive hand physical therapy in patients with systemic sclerosis. Clin. Exp. Rheumatol. 2017, 35 (Suppl. 106), 159–166. [Google Scholar] [PubMed]
- Young, A.; Namas, R.; Dodge, C.; Khanna, D. Hand impairment in systemic sclerosis: Various manifestations and currently available treatment. Curr. Treat. Opt. Rheumatol. 2016, 2, 252–269. [Google Scholar] [CrossRef]
- Tofani, M.; Santecchia, L.; Conte, A.; Berardi, A.; Galeoto, G.; Sogos, C.; Petrarca, M.; Panuccio, F.; Castelli, E. Effects of Mirror Neurons-Based Rehabilitation Techniques in Hand Injuries: A Systematic Review and Meta-Analysis. Int. J. Environ. Res. Public Health 2022, 19, 5526. [Google Scholar] [CrossRef]
- American Physical Therapy Association. Guide to physical therapist practice. Phys. Ther. 2001, 81, 9–746. [Google Scholar]
- Rego, P.; Moreira, P.M.; Reis, L.P. Serious games for rehabilitation: A survey and a classification towards a taxonomy. In Proceedings of the 5th Iberian Conference on Information Systems and Technologies, Santiago de Compostela, Spain, 16–19 June 2010; pp. 1–6. [Google Scholar]
- Proença, J.P.; Quaresma, C.; Vieira, P. Serious games for upper limb rehabilitation: A systematic review. Disabil. Rehabil. Assist. Technol. 2017, 13, 95–100. [Google Scholar] [CrossRef]
- Amorim, P.; Santos, B.S.; Dias, P.; Silva, S.; Martins, H. Serious games for stroke telerehabilitation of upper limb-a review for future research. Int. J. Telerehabil. 2020, 12, 65. [Google Scholar] [CrossRef]
- Koutsiana, E.; Ladakis, I.; Fotopoulos, D.; Chytas, A.; Kilintzis, V.; Chouvarda, I. Serious gaming technology in upper extremity rehabilitation: Scoping review. JMIR Serious Games 2020, 8, e19071. [Google Scholar] [CrossRef]
- Doumas, I.; Everard, G.; Dehem, S.; Lejeune, T. Serious games for upper limb rehabilitation after stroke: A meta-analysis. J. NeuroEng. Rehabil. 2021, 18, 100. [Google Scholar] [CrossRef] [PubMed]
- McCullagh, P.; Lightbody, G.; Galway, L.; Brennan, C.; Trainor, D. Assessment of task engagement using brain computer interface technology. In Workshop Proceedings of the 11th International Conference on Intelligent Environments; IOS Press: Amsterdam, The Netherlands, 2015; pp. 244–251. [Google Scholar] [CrossRef]
- Zohaib, M.; Nakanishi, H. Dynamic difficulty adjustment (DDA) in computer games: A review. Adv. Hum.-Comput. Interact 2018, 2018, 5681652. [Google Scholar] [CrossRef]
- Mortazavi, F.; Moradi, H.; Vahabie, A.H. Dynamic difficulty adjustment approaches in video games: A systematic literature review. Multimed. Tools Appl. 2024. [Google Scholar] [CrossRef]
- Klum, M.; Wolf, M.B.; Hahn, P.; Leclère, F.M.; Bruckner, T.; Unglaub, F. Normative data on wrist function. J. Hand Surg. 2012, 37, 2050–2060. [Google Scholar] [CrossRef] [PubMed]
- Park, J.-H.; Moon, H.-S.; Kim, H.; Chung, S.-T. Detection of Movement Intention for Operating Methods of Serious Games. Appl. Sci. 2021, 11, 883. [Google Scholar] [CrossRef]
- Nasri, N.; Orts-Escolano, S.; Cazorla, M. An sEMG-Controlled 3D Game for Rehabilitation Therapies: Real-Time Time Hand Gesture Recognition Using Deep Learning Techniques. Sensors 2020, 20, 6451. [Google Scholar] [CrossRef]
- Yang, S.-H.; Koh, C.-L.; Hsu, C.-H.; Chen, P.-C.; Chen, J.-W.; Lan, Y.-H.; Yang, Y.; Lin, Y.-D.; Wu, C.-H.; Liu, H.-K.; et al. An Instrumented Glove-Controlled Portable Hand-Exoskeleton for Bilateral Hand Rehabilitation. Biosensors 2021, 11, 495. [Google Scholar] [CrossRef]
- Sanders, Q.; Chan, V.; Augsburger, R.; Cramer, S.C.; Reinkensmeyer, D.J.; Do, A.H. Feasibility of wearable sensing for in-home finger rehabilitation early after stroke. IEEE Trans. Neural Syst. Rehabil. Eng. 2020, 28, 1363–1372. [Google Scholar] [CrossRef]
- Jha, C.K.; Shukla, Y.; Mukherjee, R.; Rathva, P.; Joshi, M.; Jain, D. A Glove-based Virtual Hand Rehabilitation System for Patients with Post-traumatic Hand Injuries. IEEE Trans. Biomed. Eng. 2024, 71, 2033–2041. [Google Scholar] [CrossRef]
- Vidal, E.; Castro-Gutierrez, E.; Arisaca, R.; Paz-Valderrama, A.; Albiol-Pérez, S. Serious Game for Fine Motor Control Rehabilitation for Children with Epileptic Encephalopathy: Development and Usability Study. JMIR Form. Res. 2023, 7, 1. [Google Scholar] [CrossRef]
- Al Nattah, M.M.A.; Tiberti, S.; Segaletti, L. Semi-Immersive Virtual Reality Exercise Therapy for Upper Limb Rehabilitation in Patients with Spinal Cord Injury Using the Leap Motion Controller. Cureus 2024, 16, e52261. [Google Scholar] [CrossRef] [PubMed]
- Aguilar-Lazcano, C.A.; Rechy-Ramirez, E.J. Performance analysis of Leap motion controller for finger rehabilitation using serious games in two lighting environments. Measurement 2020, 157, 107677. [Google Scholar] [CrossRef]
- Fotopoulos, D.; Ladakis, I.; Kilintzis, V.; Chytas, A.; Koutsiana, E.; Loizidis, T.; Chouvarda, I. Gamifying rehabilitation: MILORD platform as an upper limb motion rehabilitation service. Front. Comput. Sci. 2022, 4, 932342. [Google Scholar] [CrossRef]
- Viglialoro, R.M.; Turini, G.; Carbone, M.; Condino, S.; Mamone, V.; Coluccia, N.; Dell’Agli, S.; Morucci, G.; Ryskalin, L.; Ferrari, V.; et al. A Projected AR Serious Game for Shoulder Rehabilitation Using Hand-Finger Tracking and Performance Metrics: A Preliminary Study on Healthy Subjects. Electronics 2023, 12, 2516. [Google Scholar] [CrossRef]
- de Souza, M.R.; Gonçalves, R.S.; Carbone, G. Feasibility and performance validation of a leap motion controller for upper limb rehabilitation. Robotics 2021, 10, 130. [Google Scholar] [CrossRef]
- Song, X.; van de Ven, S.S.; Chen, S.; Kang, P.; Gao, Q.; Jia, J.; Shull, P.B. Proposal of a wearable multimodal sensing-based serious games approach for hand movement training after stroke. Front. Physiol. 2022, 13, 811950. [Google Scholar] [CrossRef] [PubMed]
- Cardia da Cruz, L.; Sierra-Franco, C.A.; Silva-Calpa, G.F.M.; Barbosa Raposo, A. A self-adaptive serious game for eye-hand coordination training. In International Conference on Human-Computer Interaction; Springer International Publishing: Cham, Switzerland, 2020; pp. 385–397. [Google Scholar] [CrossRef]
- Vargas-Bustos, J.I.; Rechy-Ramirez, E.J. Dynamic Difficulty Adjustment (DDA) on a Serious Game Used for Hand Rehabilitation. In Perspectives and Considerations on the Evolution of Smart Systems; IGI Global: Hershey, PA, USA, 2023; pp. 35–66. [Google Scholar] [CrossRef]
- Alves, T.; Carvalho, H.; Lopes, D.S. Winning compensations: Adaptable gaming approach for upper limb rehabilitation sessions based on compensatory movements. J. Biomed. Inform. 2020, 108, 103501. [Google Scholar] [CrossRef]
- Orozco-Mora, C.E.; Fuentes-Aguilar, R.Q.; Hernández-Melgarejo, G. Dynamic Difficulty Adaptation Based on Stress Detection for a Virtual Reality Video Game: A Pilot Study. Electronics 2024, 13, 2324. [Google Scholar] [CrossRef]
- Hart, S.G.; Staveland, L.E. Development of NASA-TLX (Task Load Index): Results of empirical and theoretical research. Adv. Psychol. 1988, 52, 139–183. [Google Scholar] [CrossRef]
- Brockmyer, J.H.; Fox, C.M.; Curtiss, K.A.; McBroom, E.; Burkhart, K.M.; Pidruzny, J.N. The development of the Game Engagement Questionnaire: A measure of engagement in video game-playing. J. Exp. Soc. Psychol. 2009, 45, 624–634. [Google Scholar] [CrossRef]
- Calvo-Morata, A.; Freire, M.; Martínez-Ortiz, I.; Fernández-Manjón, B. Scoping review of bioelectrical signals uses in videogames for evaluation purposes. IEEE Access 2022, 10, 107703–107715. [Google Scholar] [CrossRef]
- Moinnereau, M.A.; Oliveira, A.A.; Falk, T.H. Instrumenting a virtual reality headset for at-home gamer experience monitoring and behavioural assessment. Front. Virtual Real. 2022, 3, 971054. [Google Scholar] [CrossRef]
- McMahan, T.; Parberry, I.; Parsons, T.D. Evaluating player task engagement and arousal using electroencephalography. Procedia Manuf. 2015, 3, 2303–2310. [Google Scholar] [CrossRef]
- Ruqeyya, G.; Hafeez, T.; Saeed, S.M.U.; Ishwal, A. EEG-based Engagement Index for Video Game Players. In Proceedings of the International Conference on Emerging Trends in Electrical, Control, and Telecommunication Engineering (ETECTE), Lahore, Pakistan, 2–4 December 2022; pp. 1–6. [Google Scholar] [CrossRef]
- Pereira, F.; Bermúdez i Badia, S.; Jorge, C.; Cameirão, M.S. The use of game modes to promote engagement and social involvement in multi-user serious games: A within-person randomized trial with stroke survivors. J. NeuroEng. Rehabil. 2021, 18, 1–15. [Google Scholar] [CrossRef] [PubMed]
- Ito, K.; Uehara, S.; Yuasa, A.; Kim, C.M.; Kitamura, S.; Ushizawa, K.; Tanabe, S.; Otaka, Y. Electromyography-controlled gamified exercise system for the distal upper extremity: A usability assessment in subacute post-stroke patients. Disabil. Rehabil. Assist. Technol. 2023, 18, 883–888. [Google Scholar] [CrossRef]
- Batista, D.; Plácido da Silva, H.; Fred, A.; Moreira, C.; Reis, M.; Ferreira, H.A. Benchmarking of the BITalino biomedical toolkit against an established gold standard. Healthc. Technol. Lett. 2019, 6, 32–36. [Google Scholar] [CrossRef] [PubMed]
- BITalino (R)evolution Board Kit BLE/BT. Available online: https://www.pluxbiosignals.com/products/bitalino-revolution-board-kit-ble-bt?srsltid=AfmBOooE4kGdENgnUPX4M_vzaatXFtz4jsBR93rwFtnsUXfRx2MihY82 (accessed on 12 September 2024).
- Pontifex, M.B.; Coffman, C.A. Validation of the g. tec Unicorn Hybrid Black wireless EEG system. Psychophysiology 2023, 60, e14320. [Google Scholar] [CrossRef]
- Weichert, F.; Bachmann, D.; Rudak, B.; Fisseler, D. Analysis of the Accuracy and Robustness of the Leap Motion Controller. Sensors 2013, 13, 6380–6393. [Google Scholar] [CrossRef]

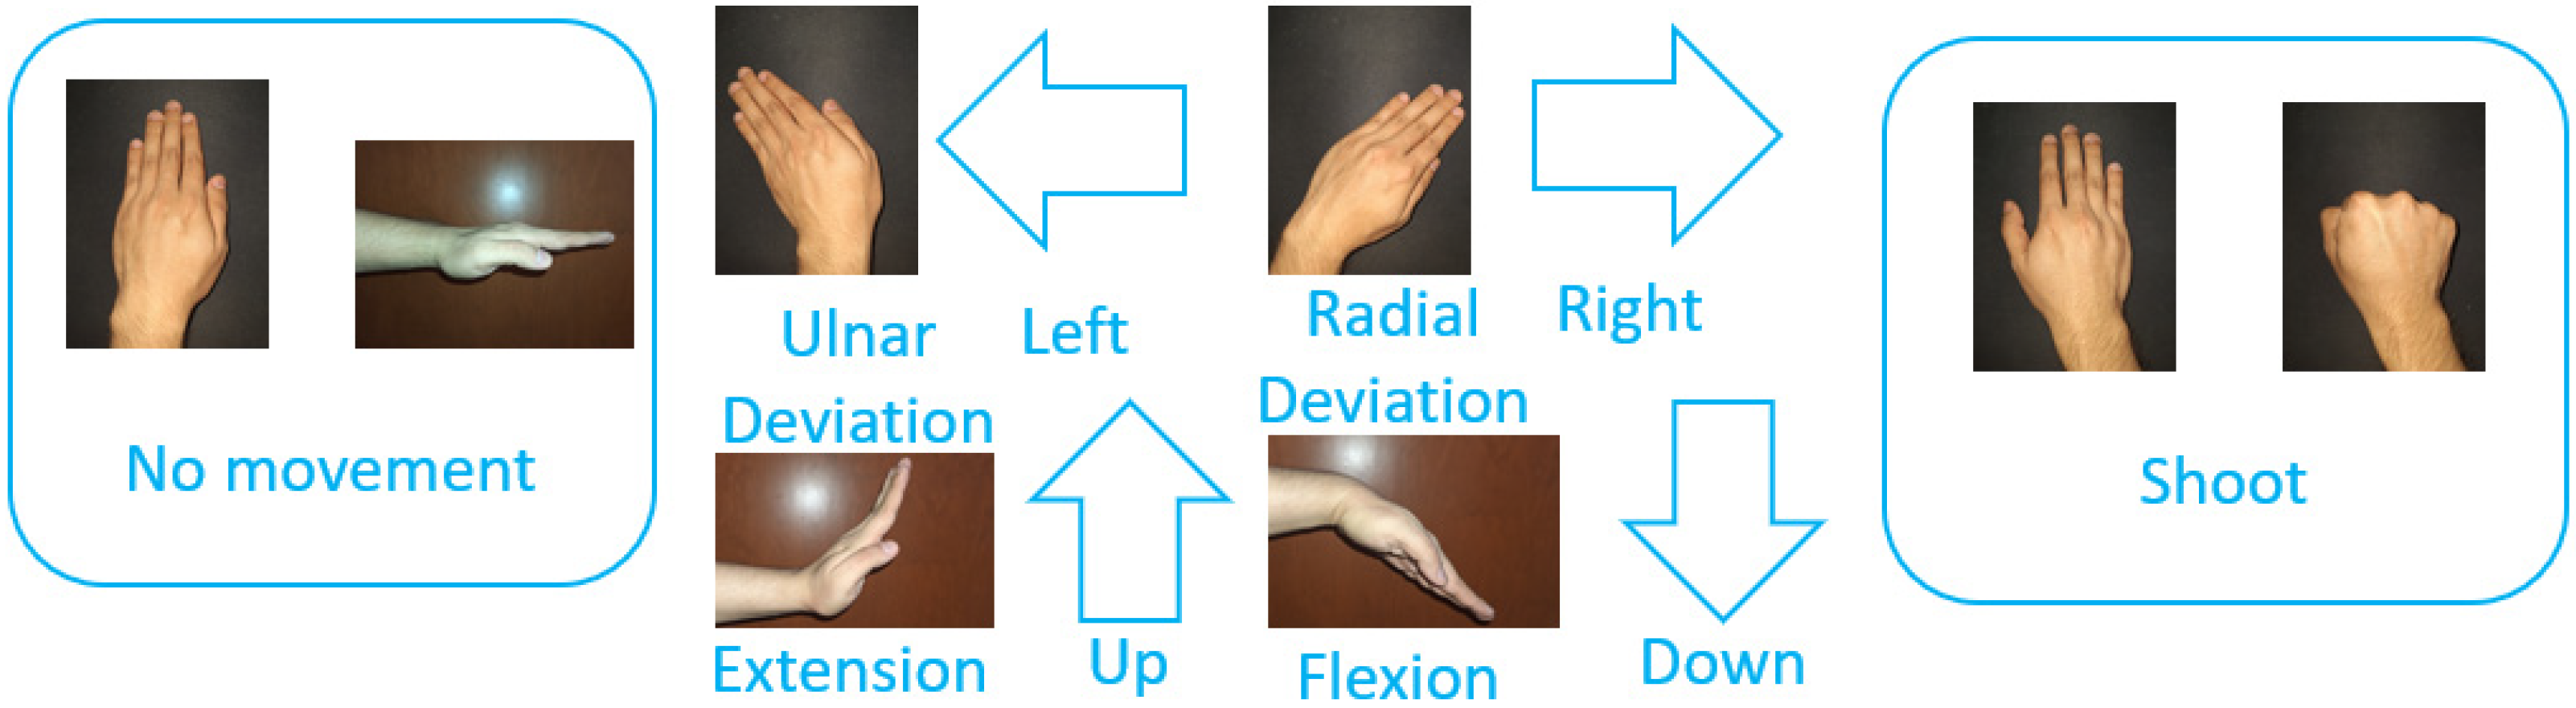
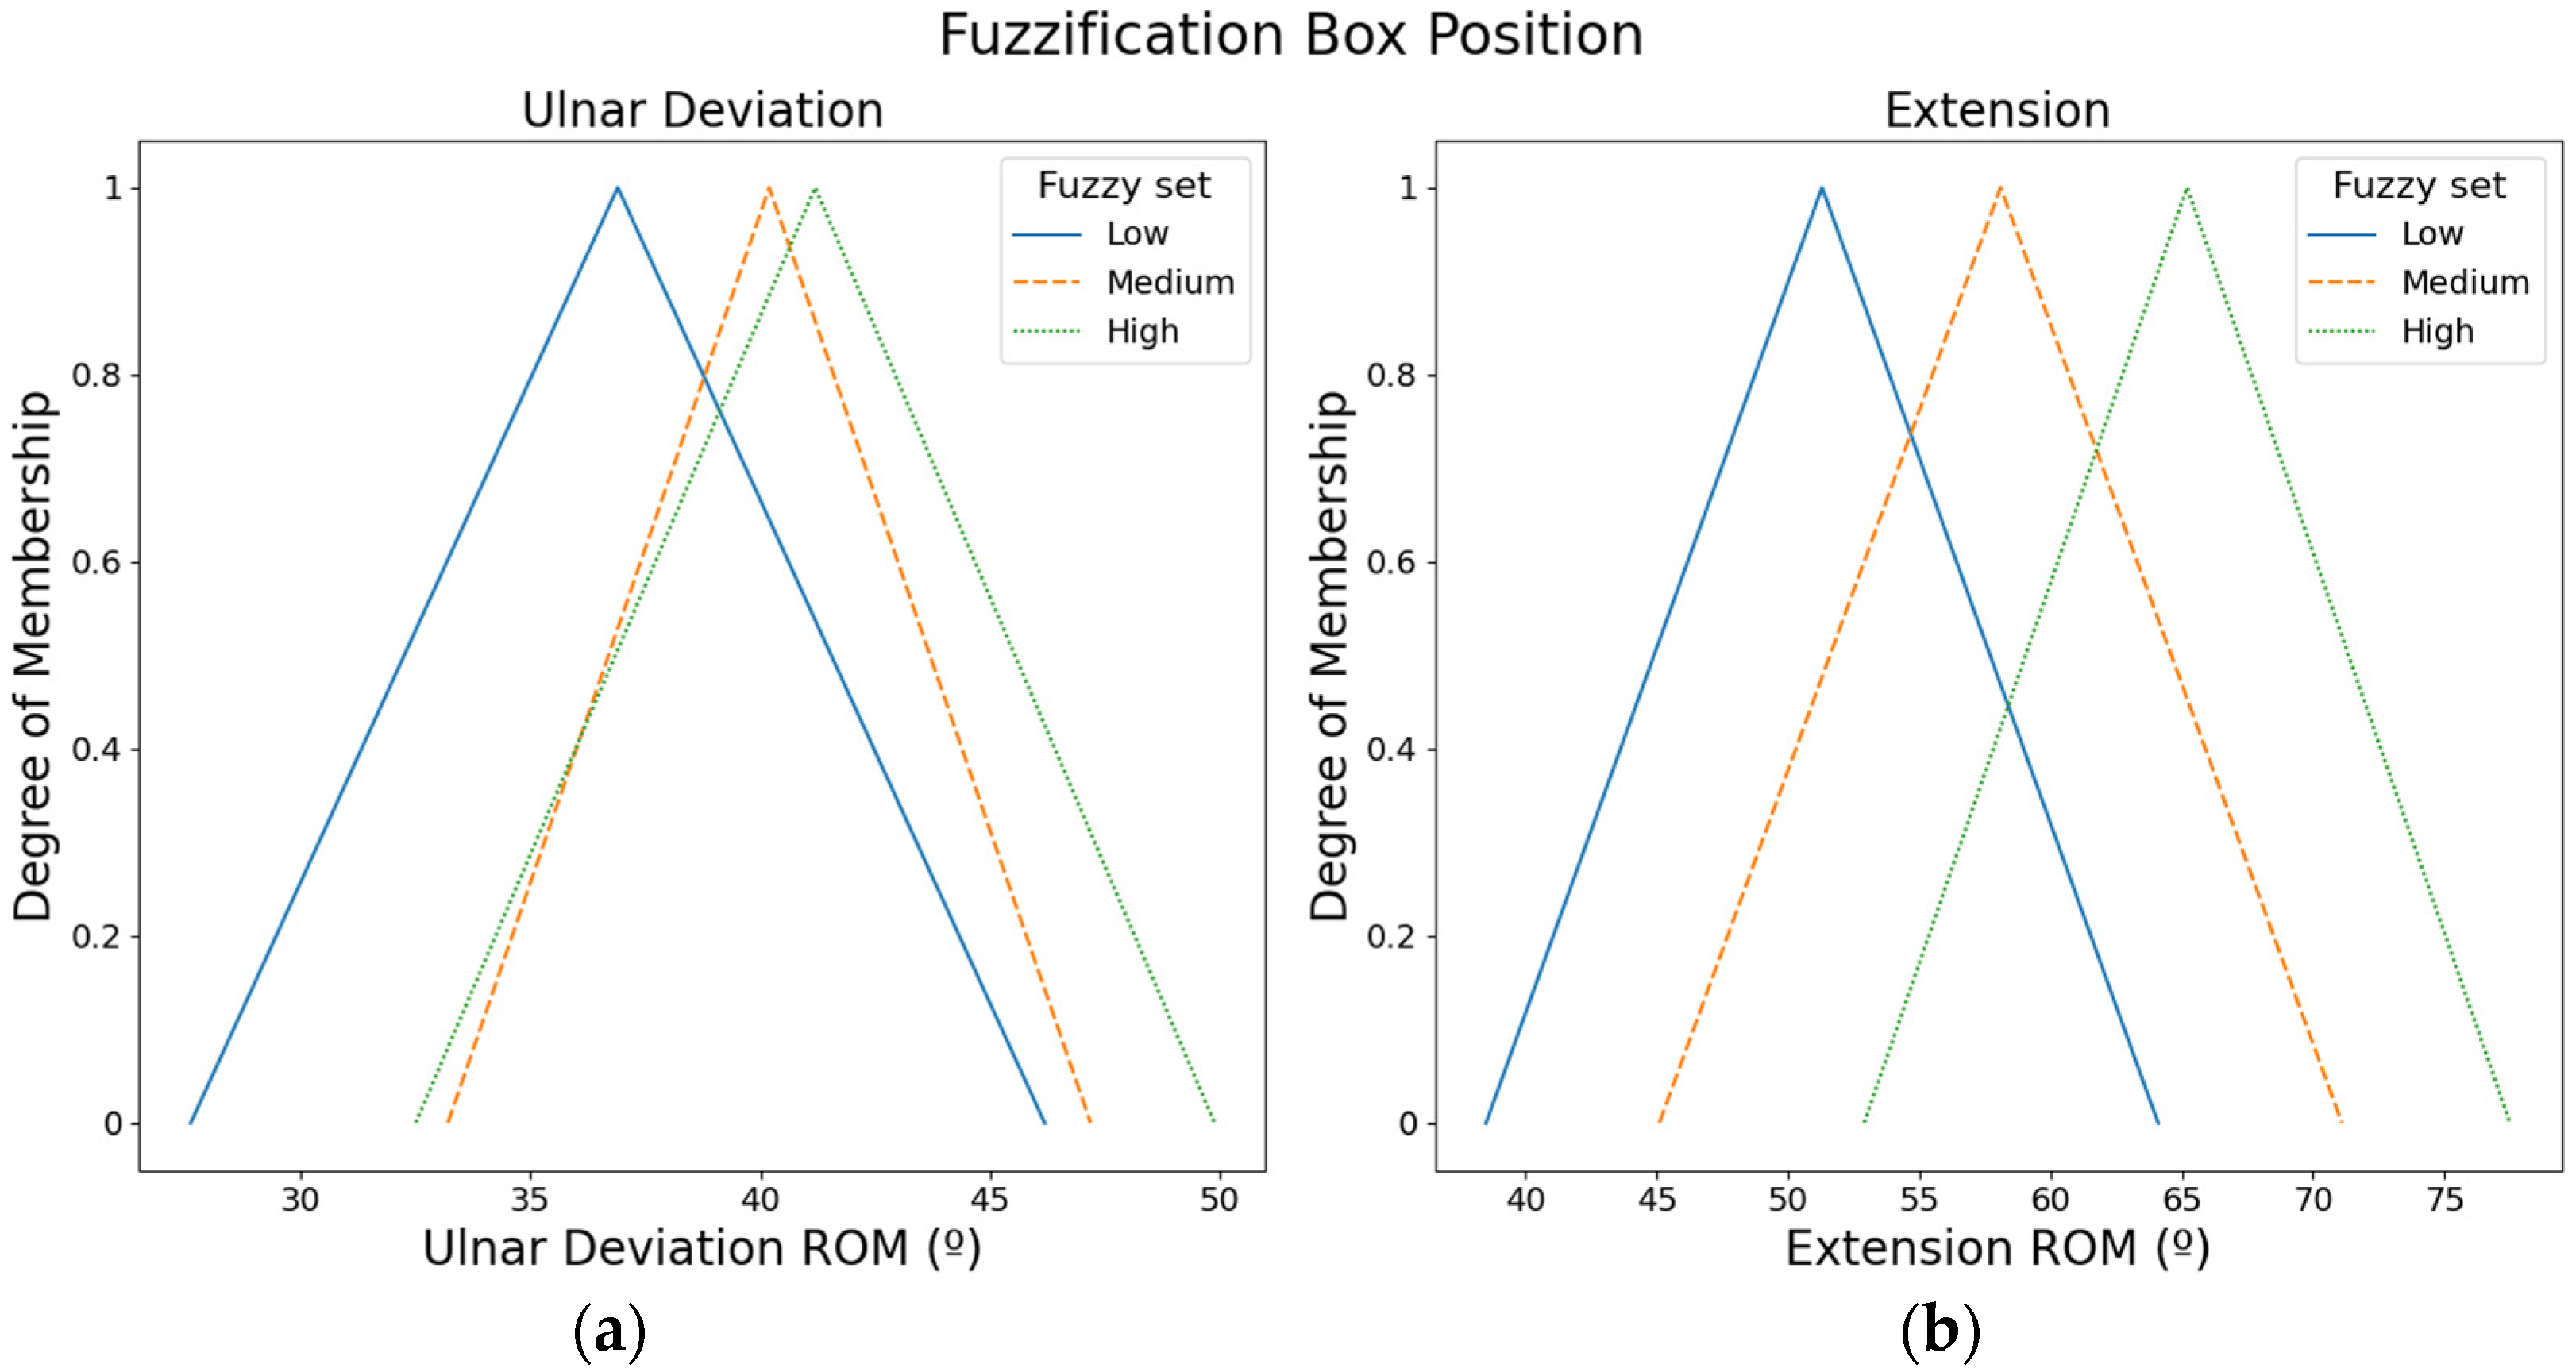
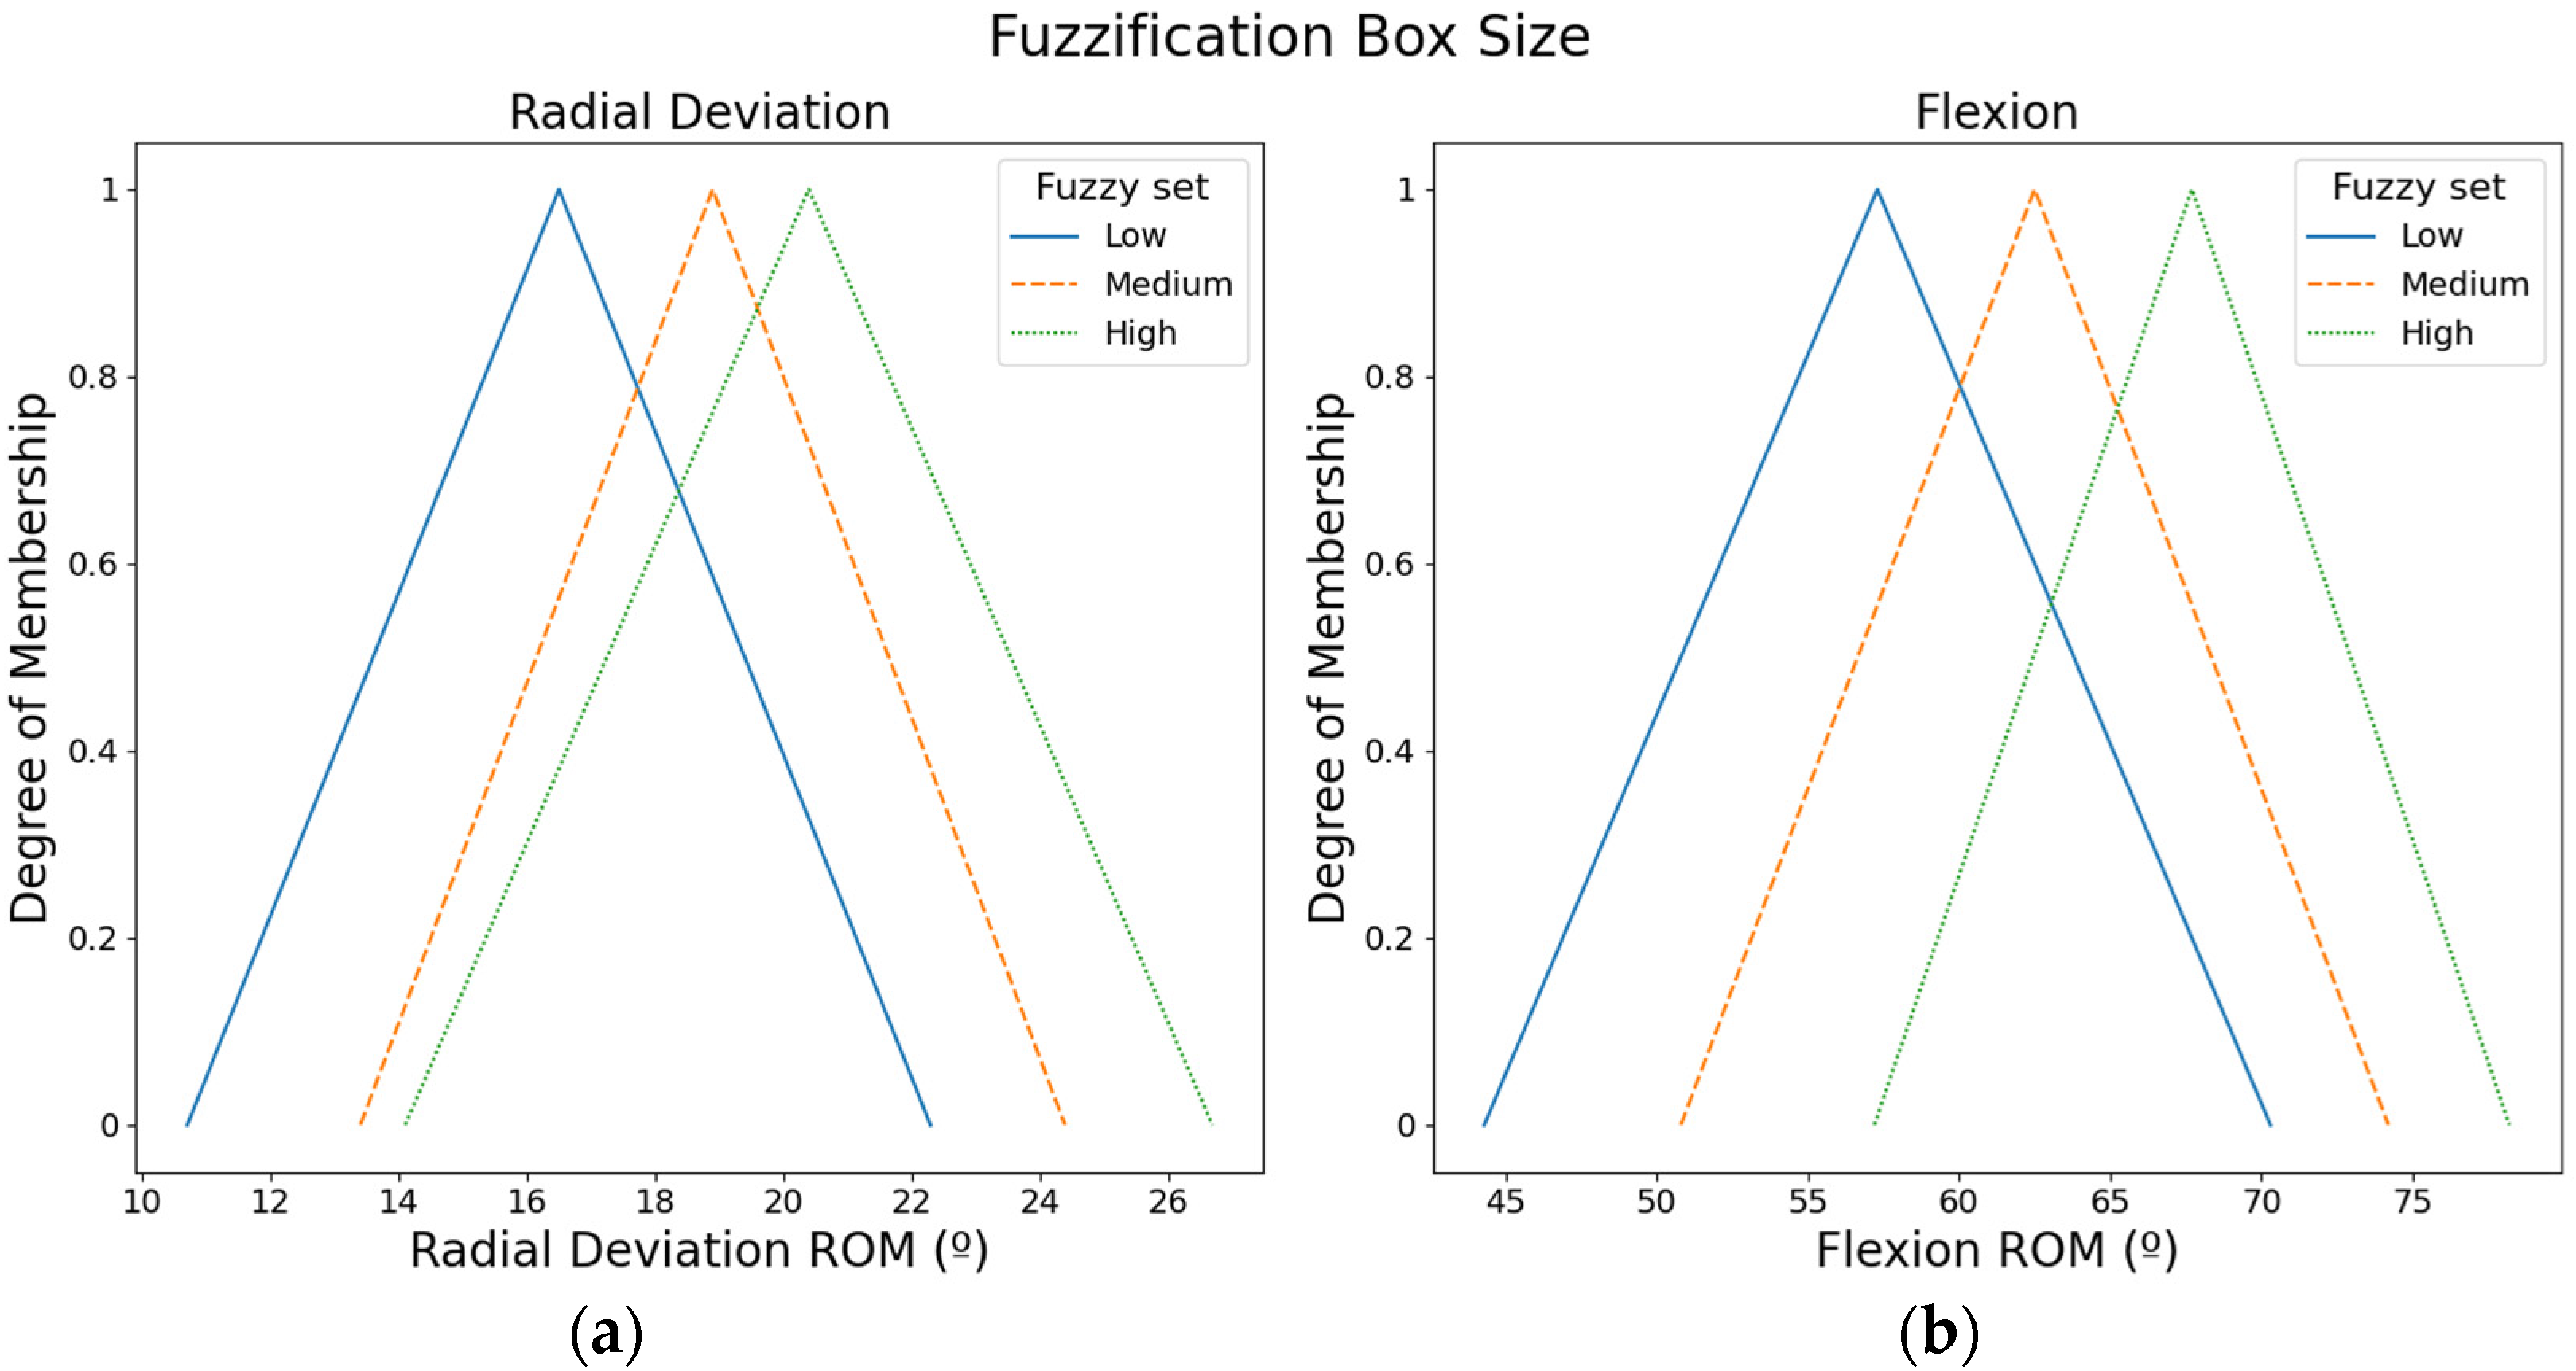
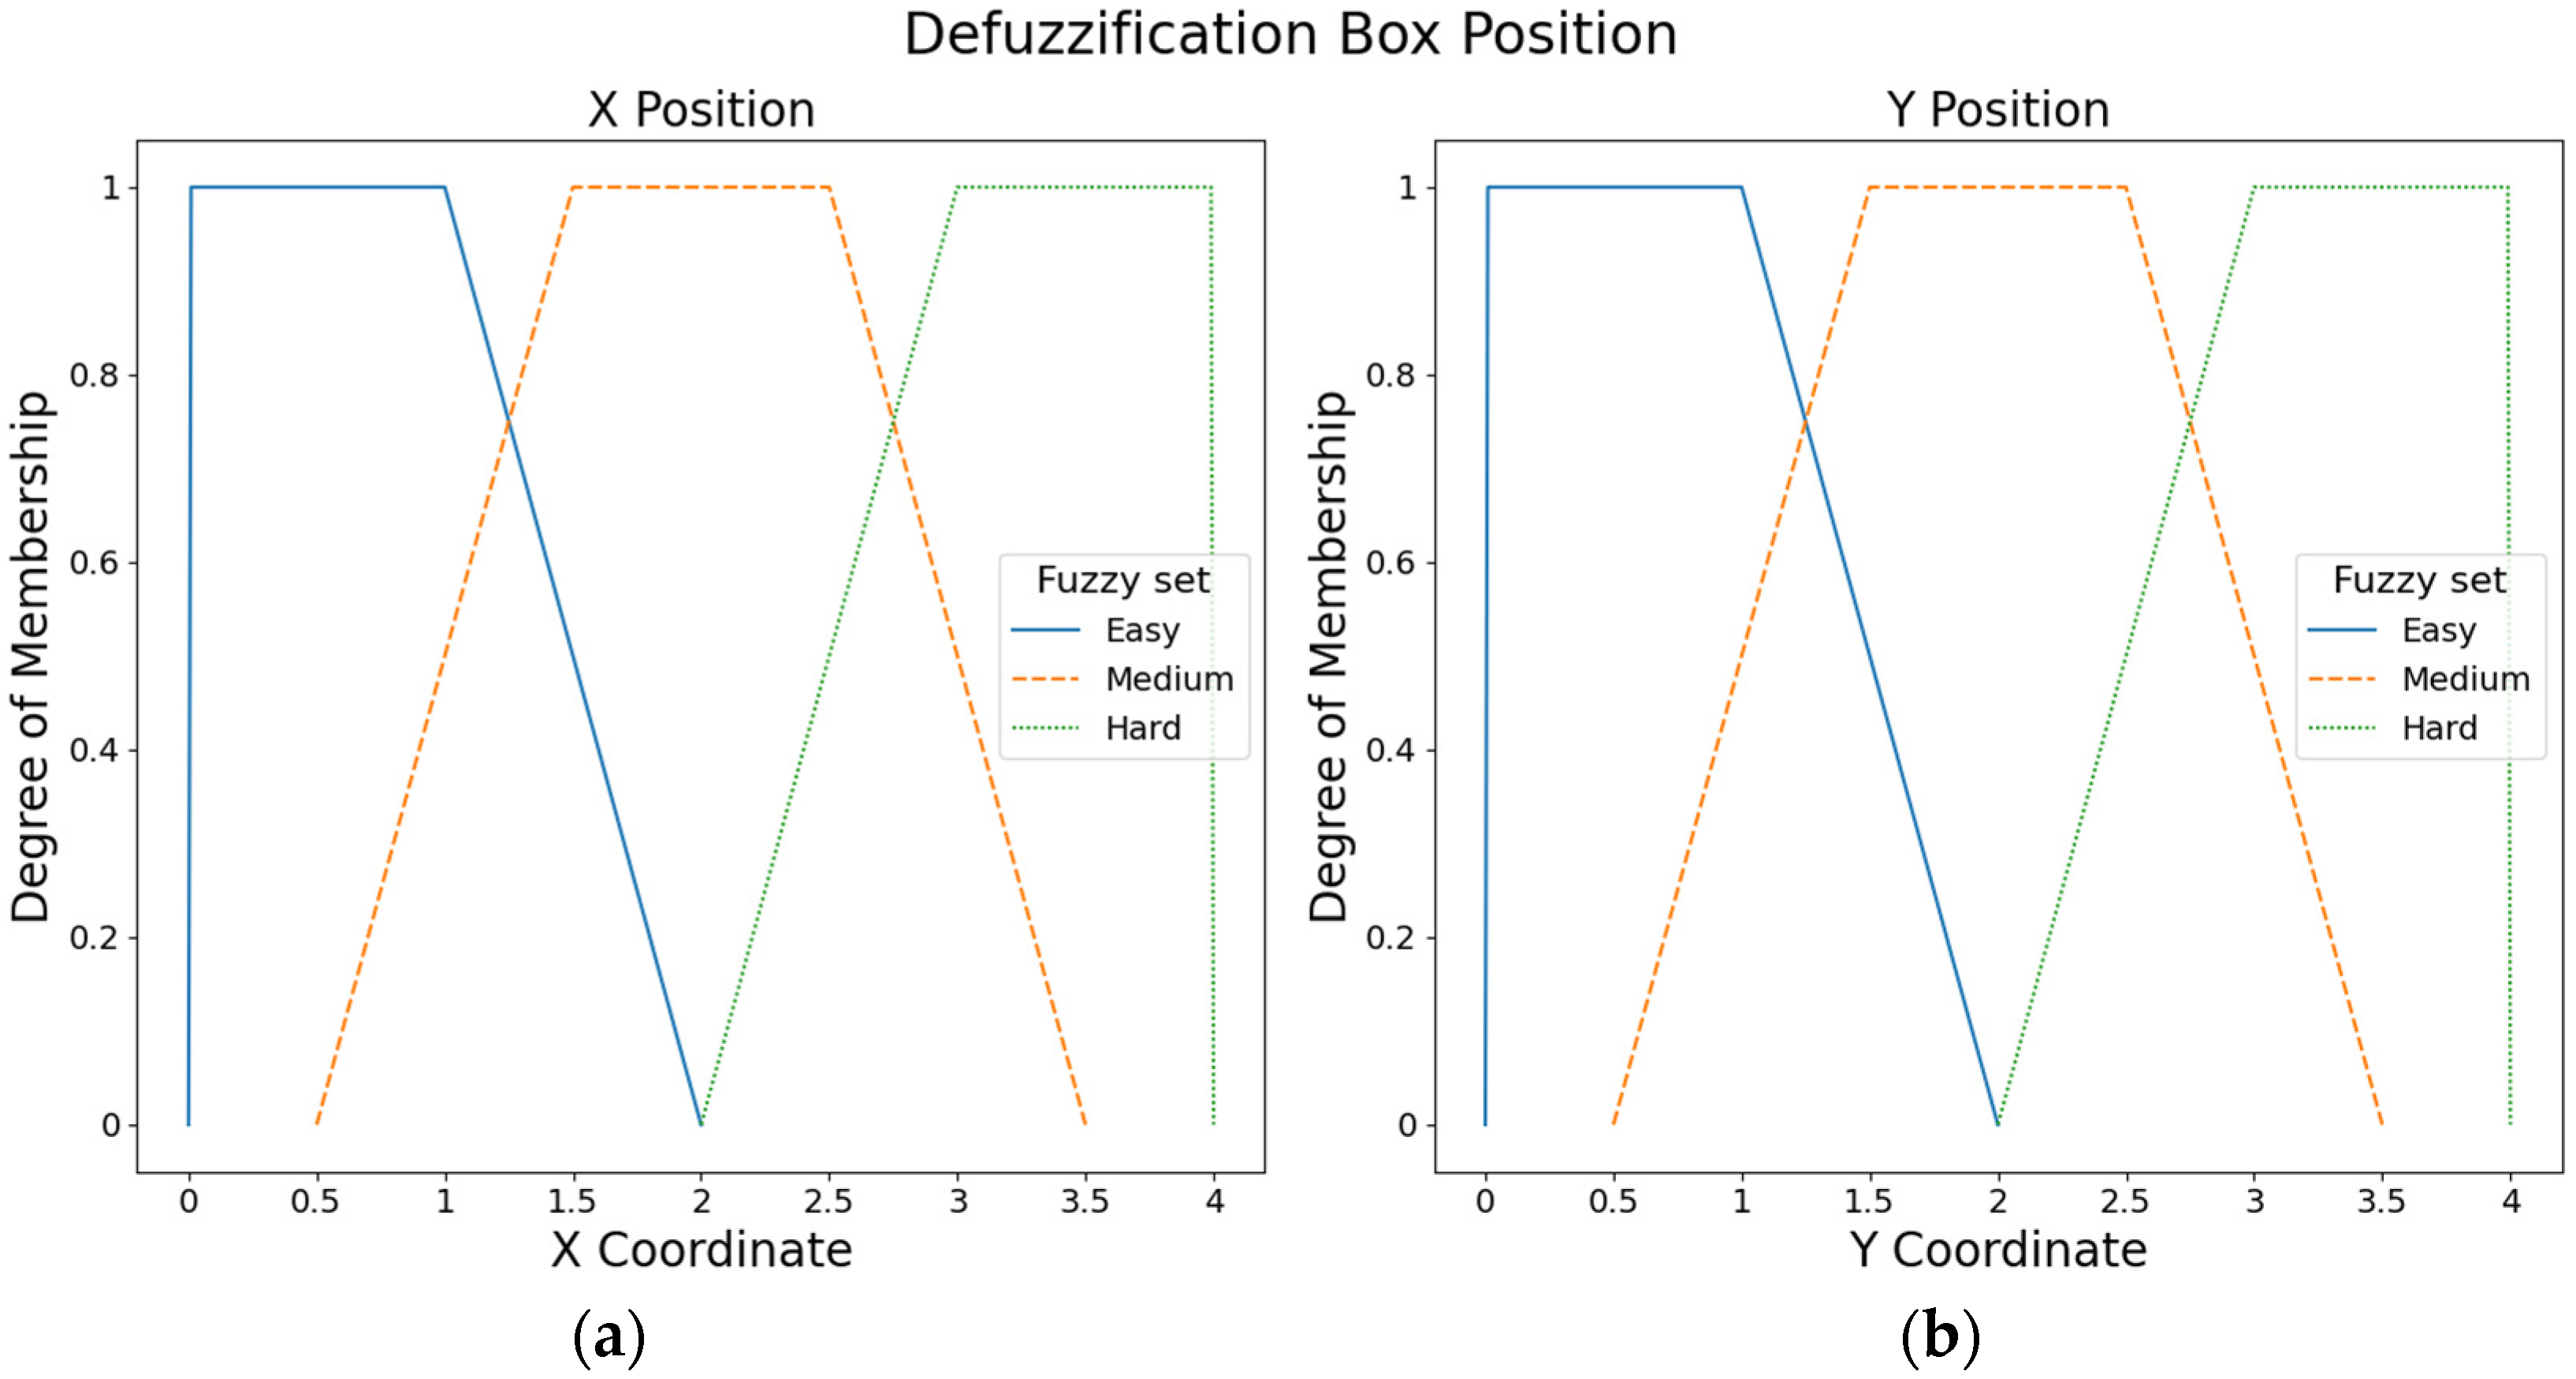
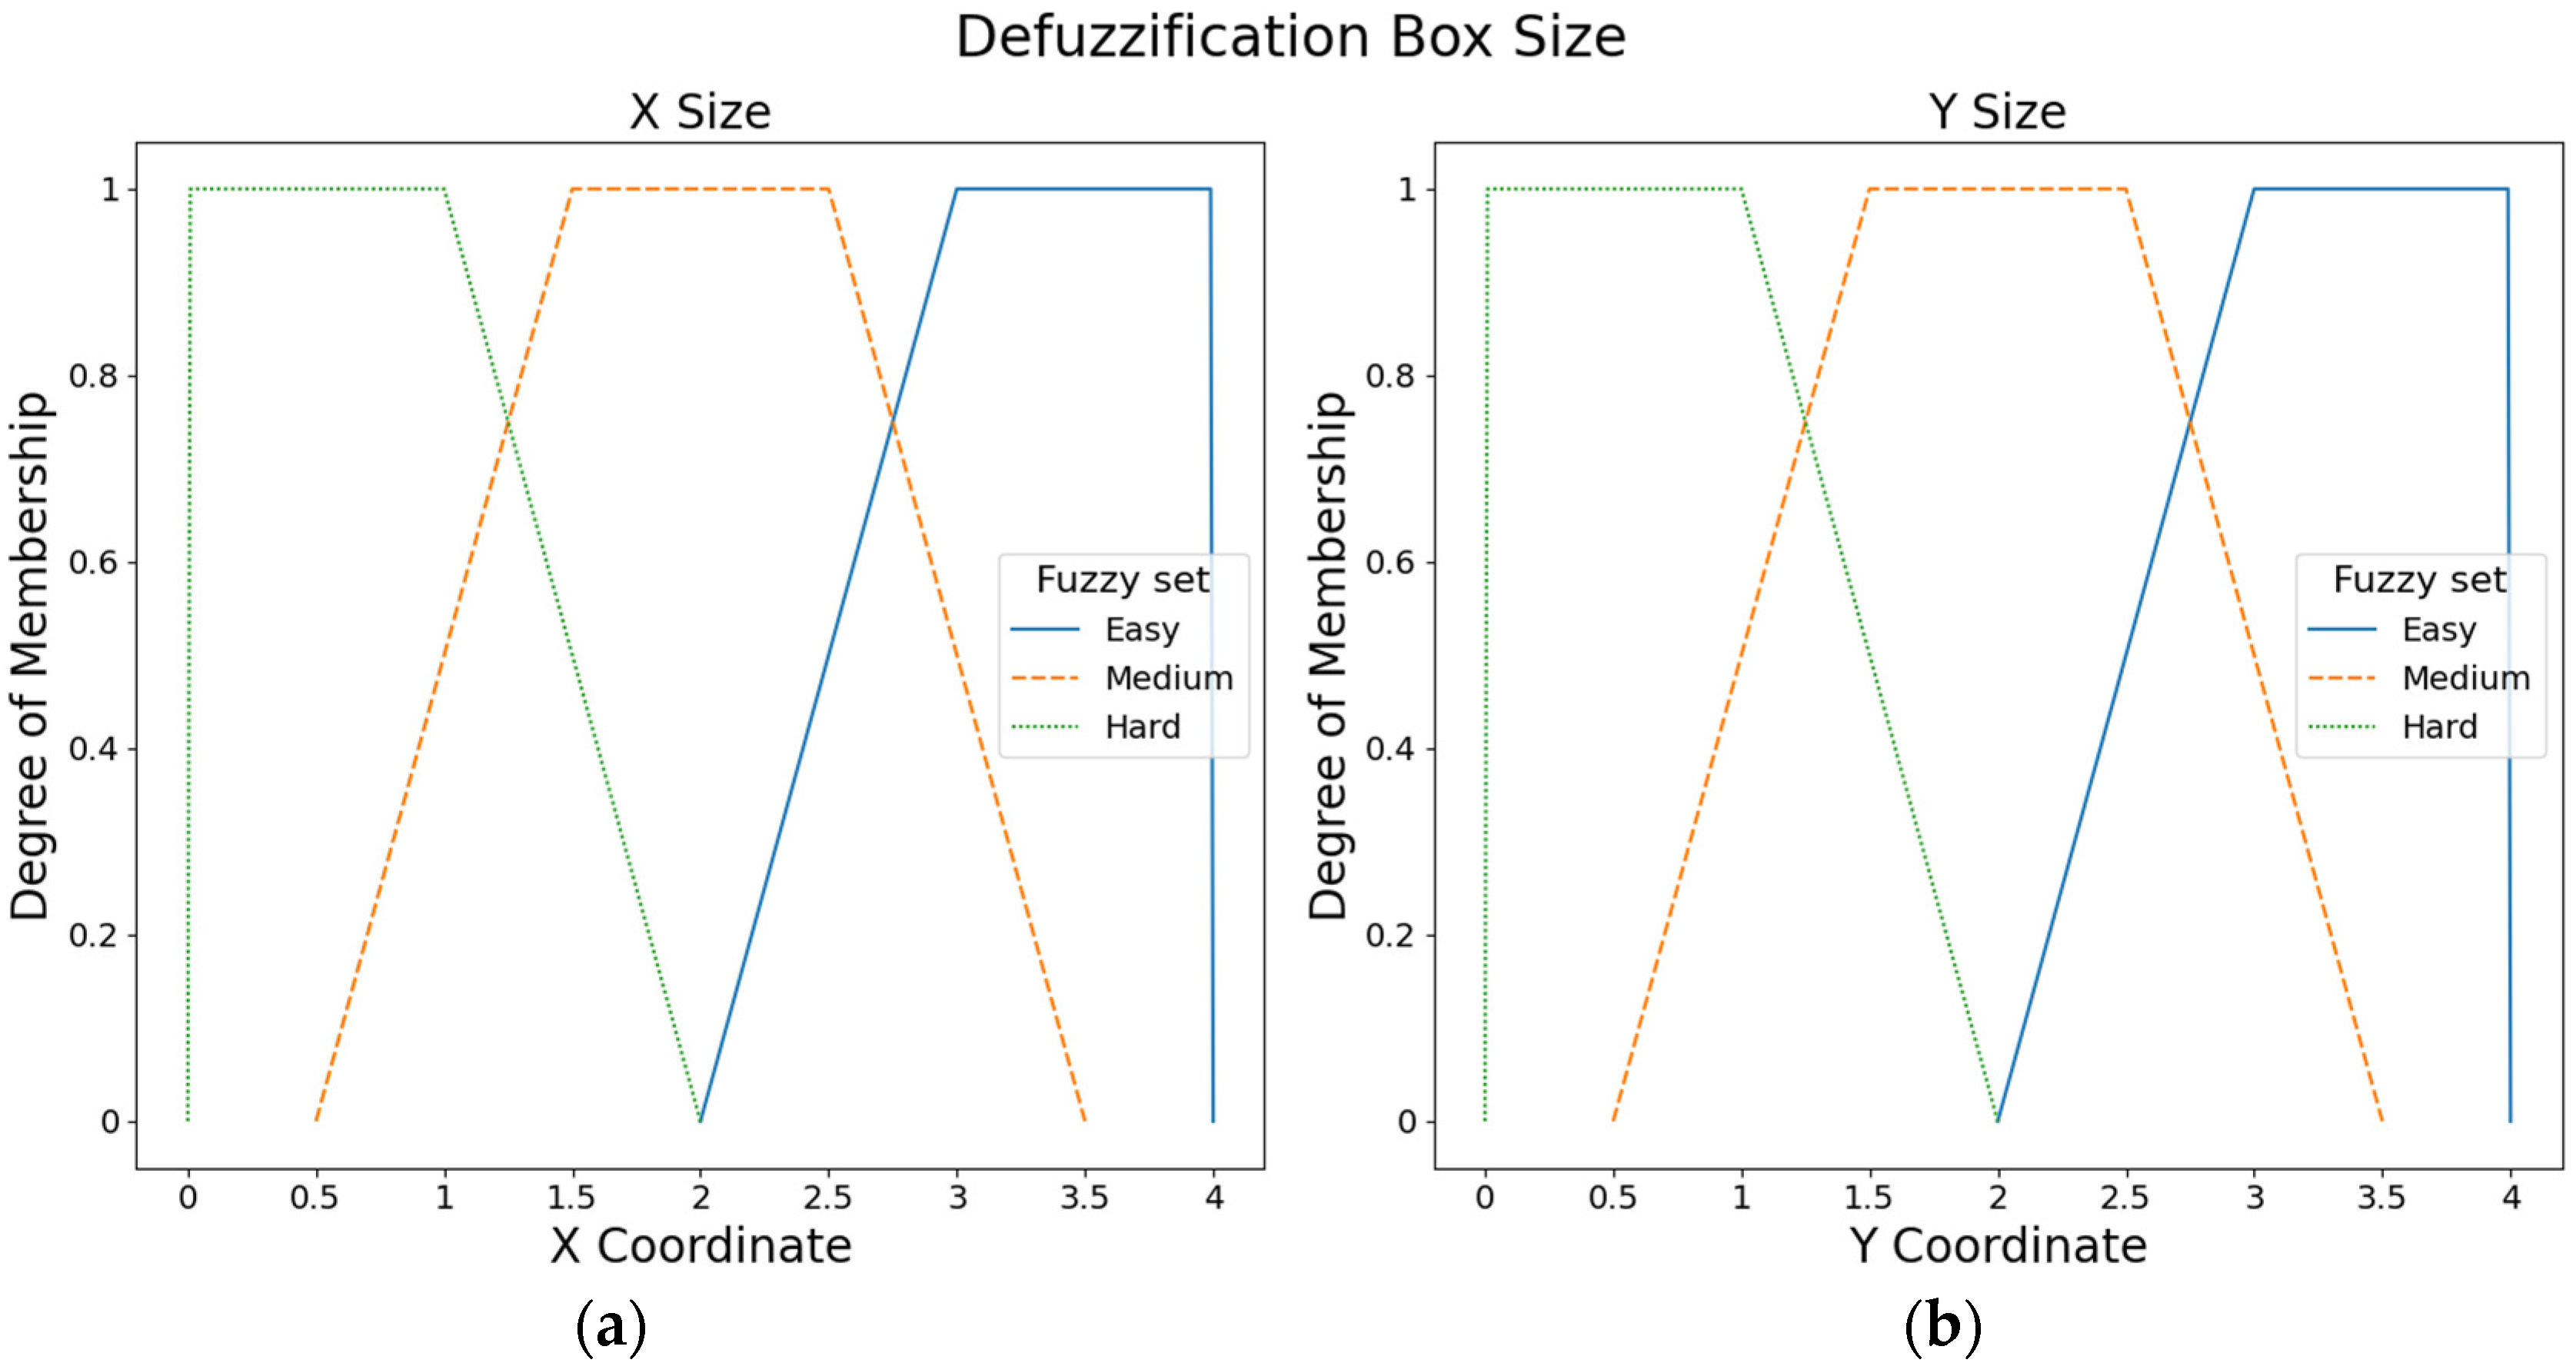

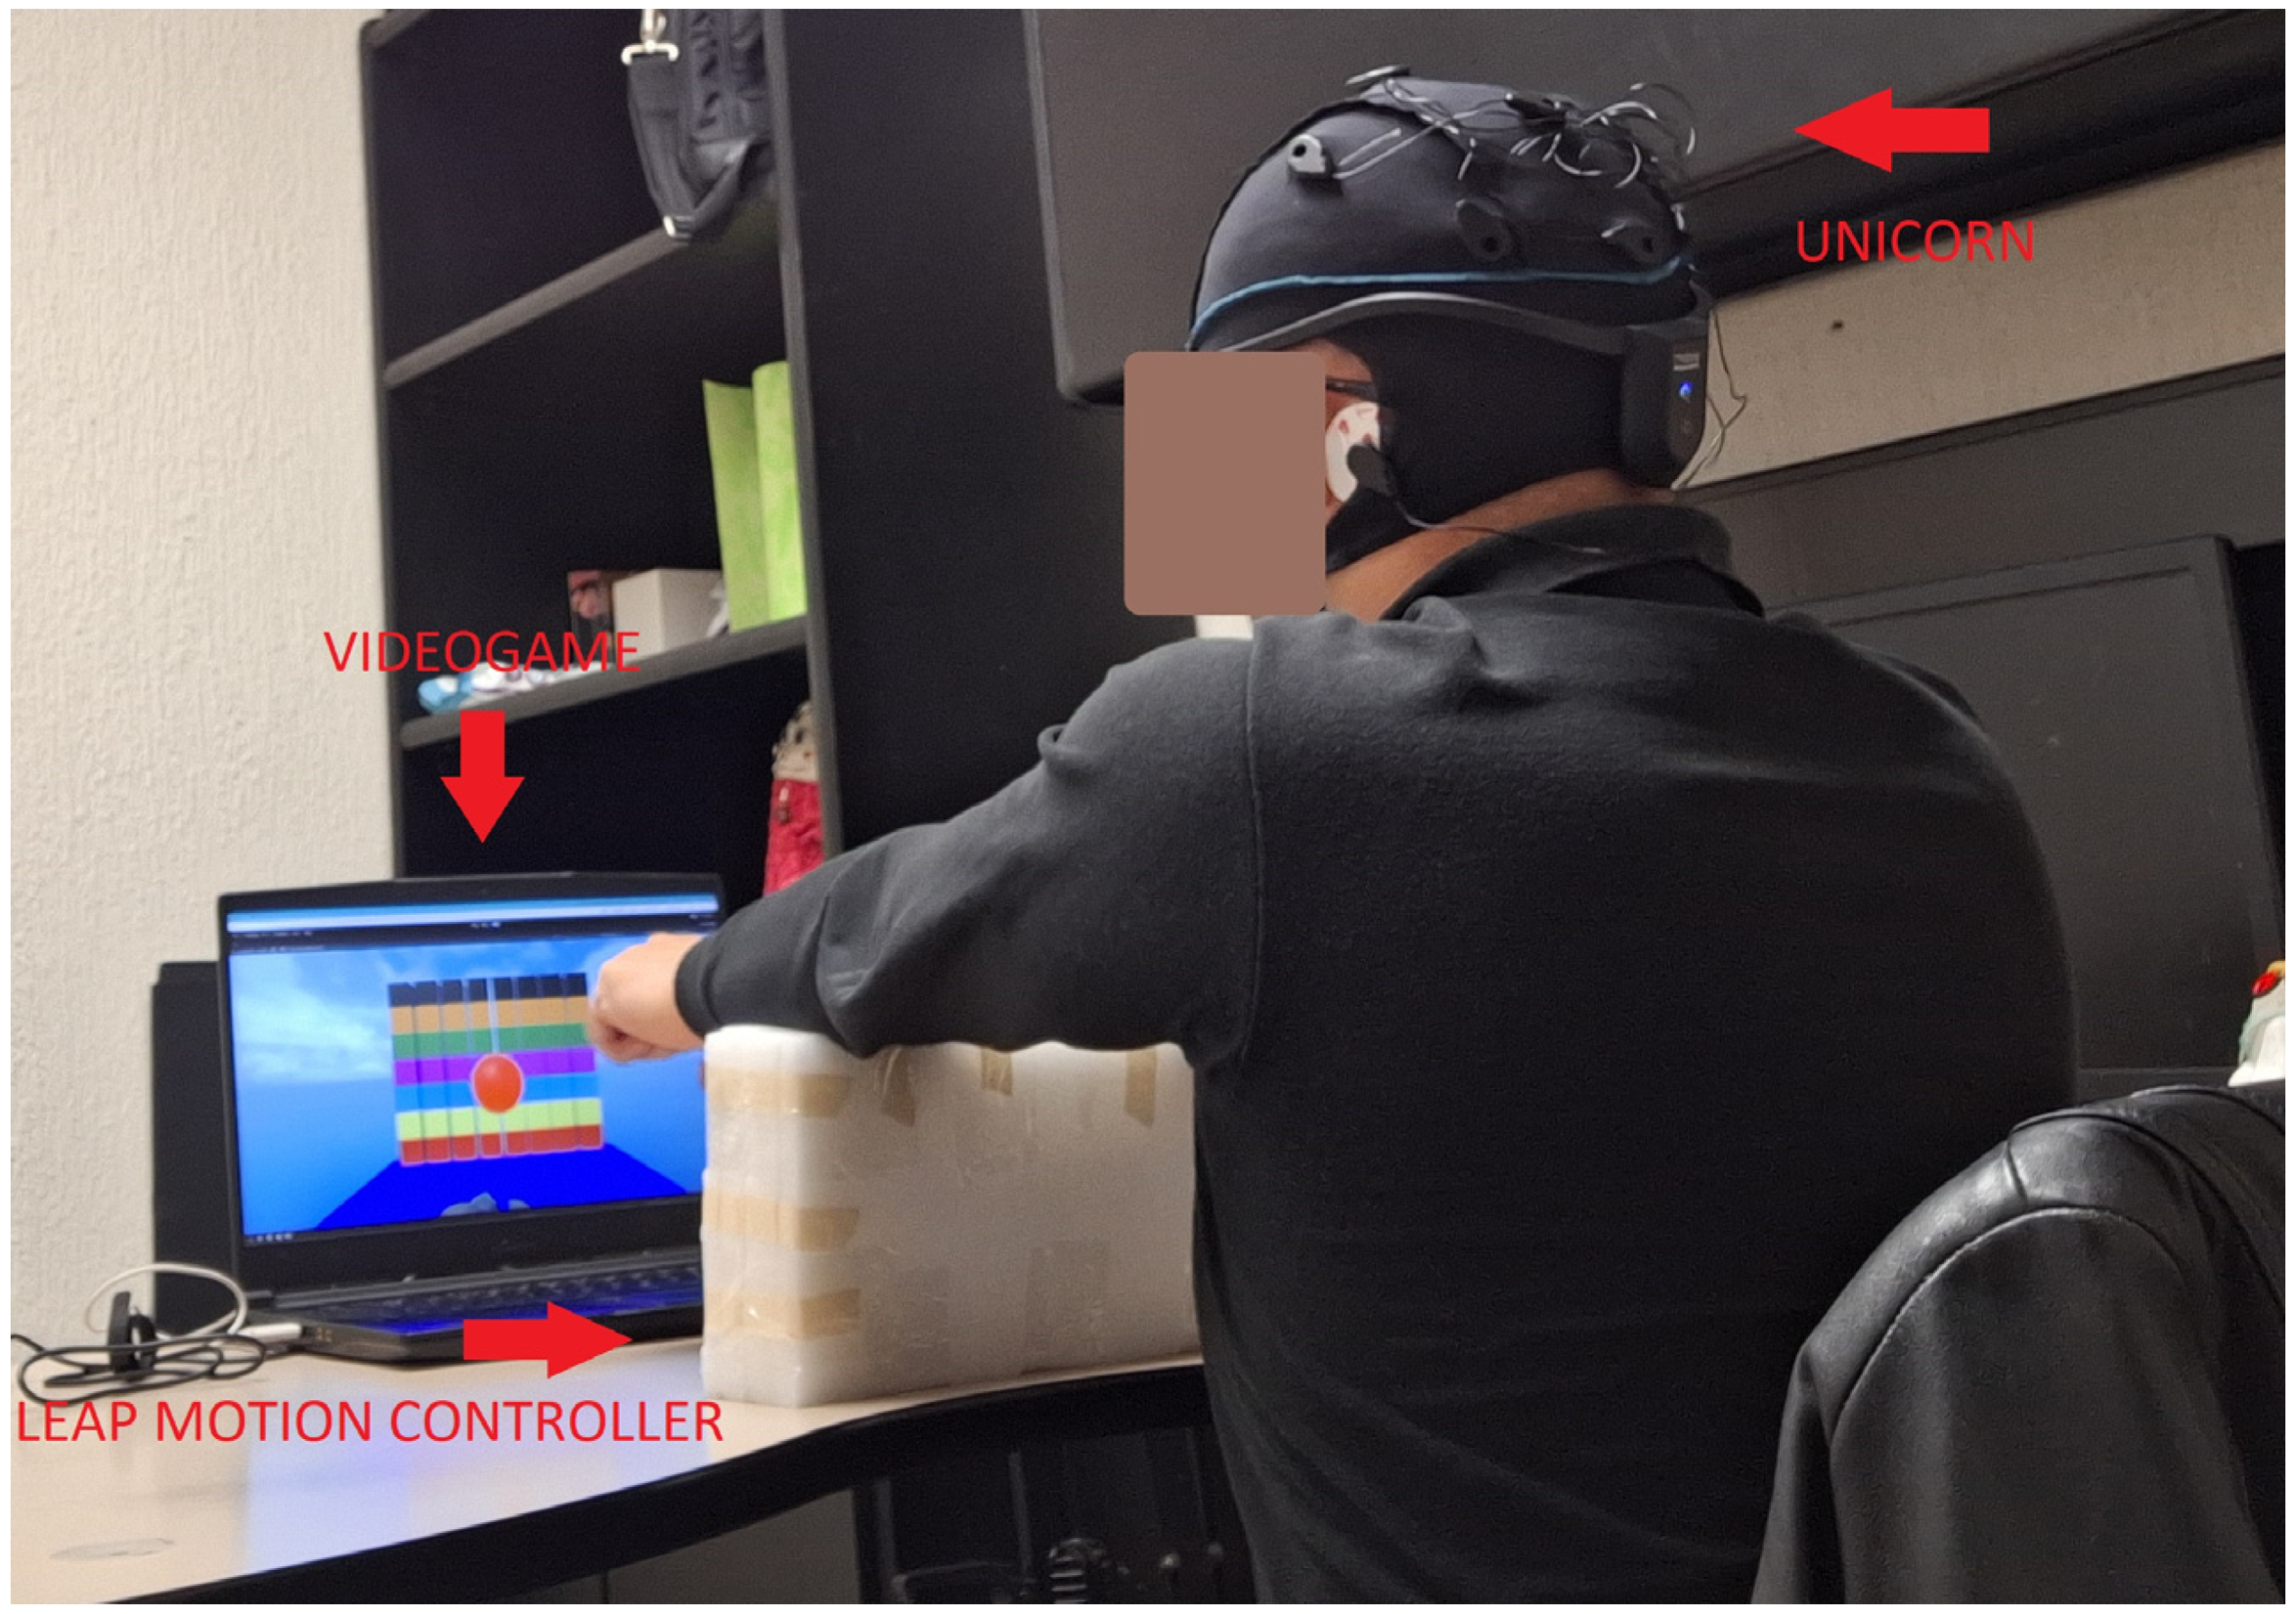
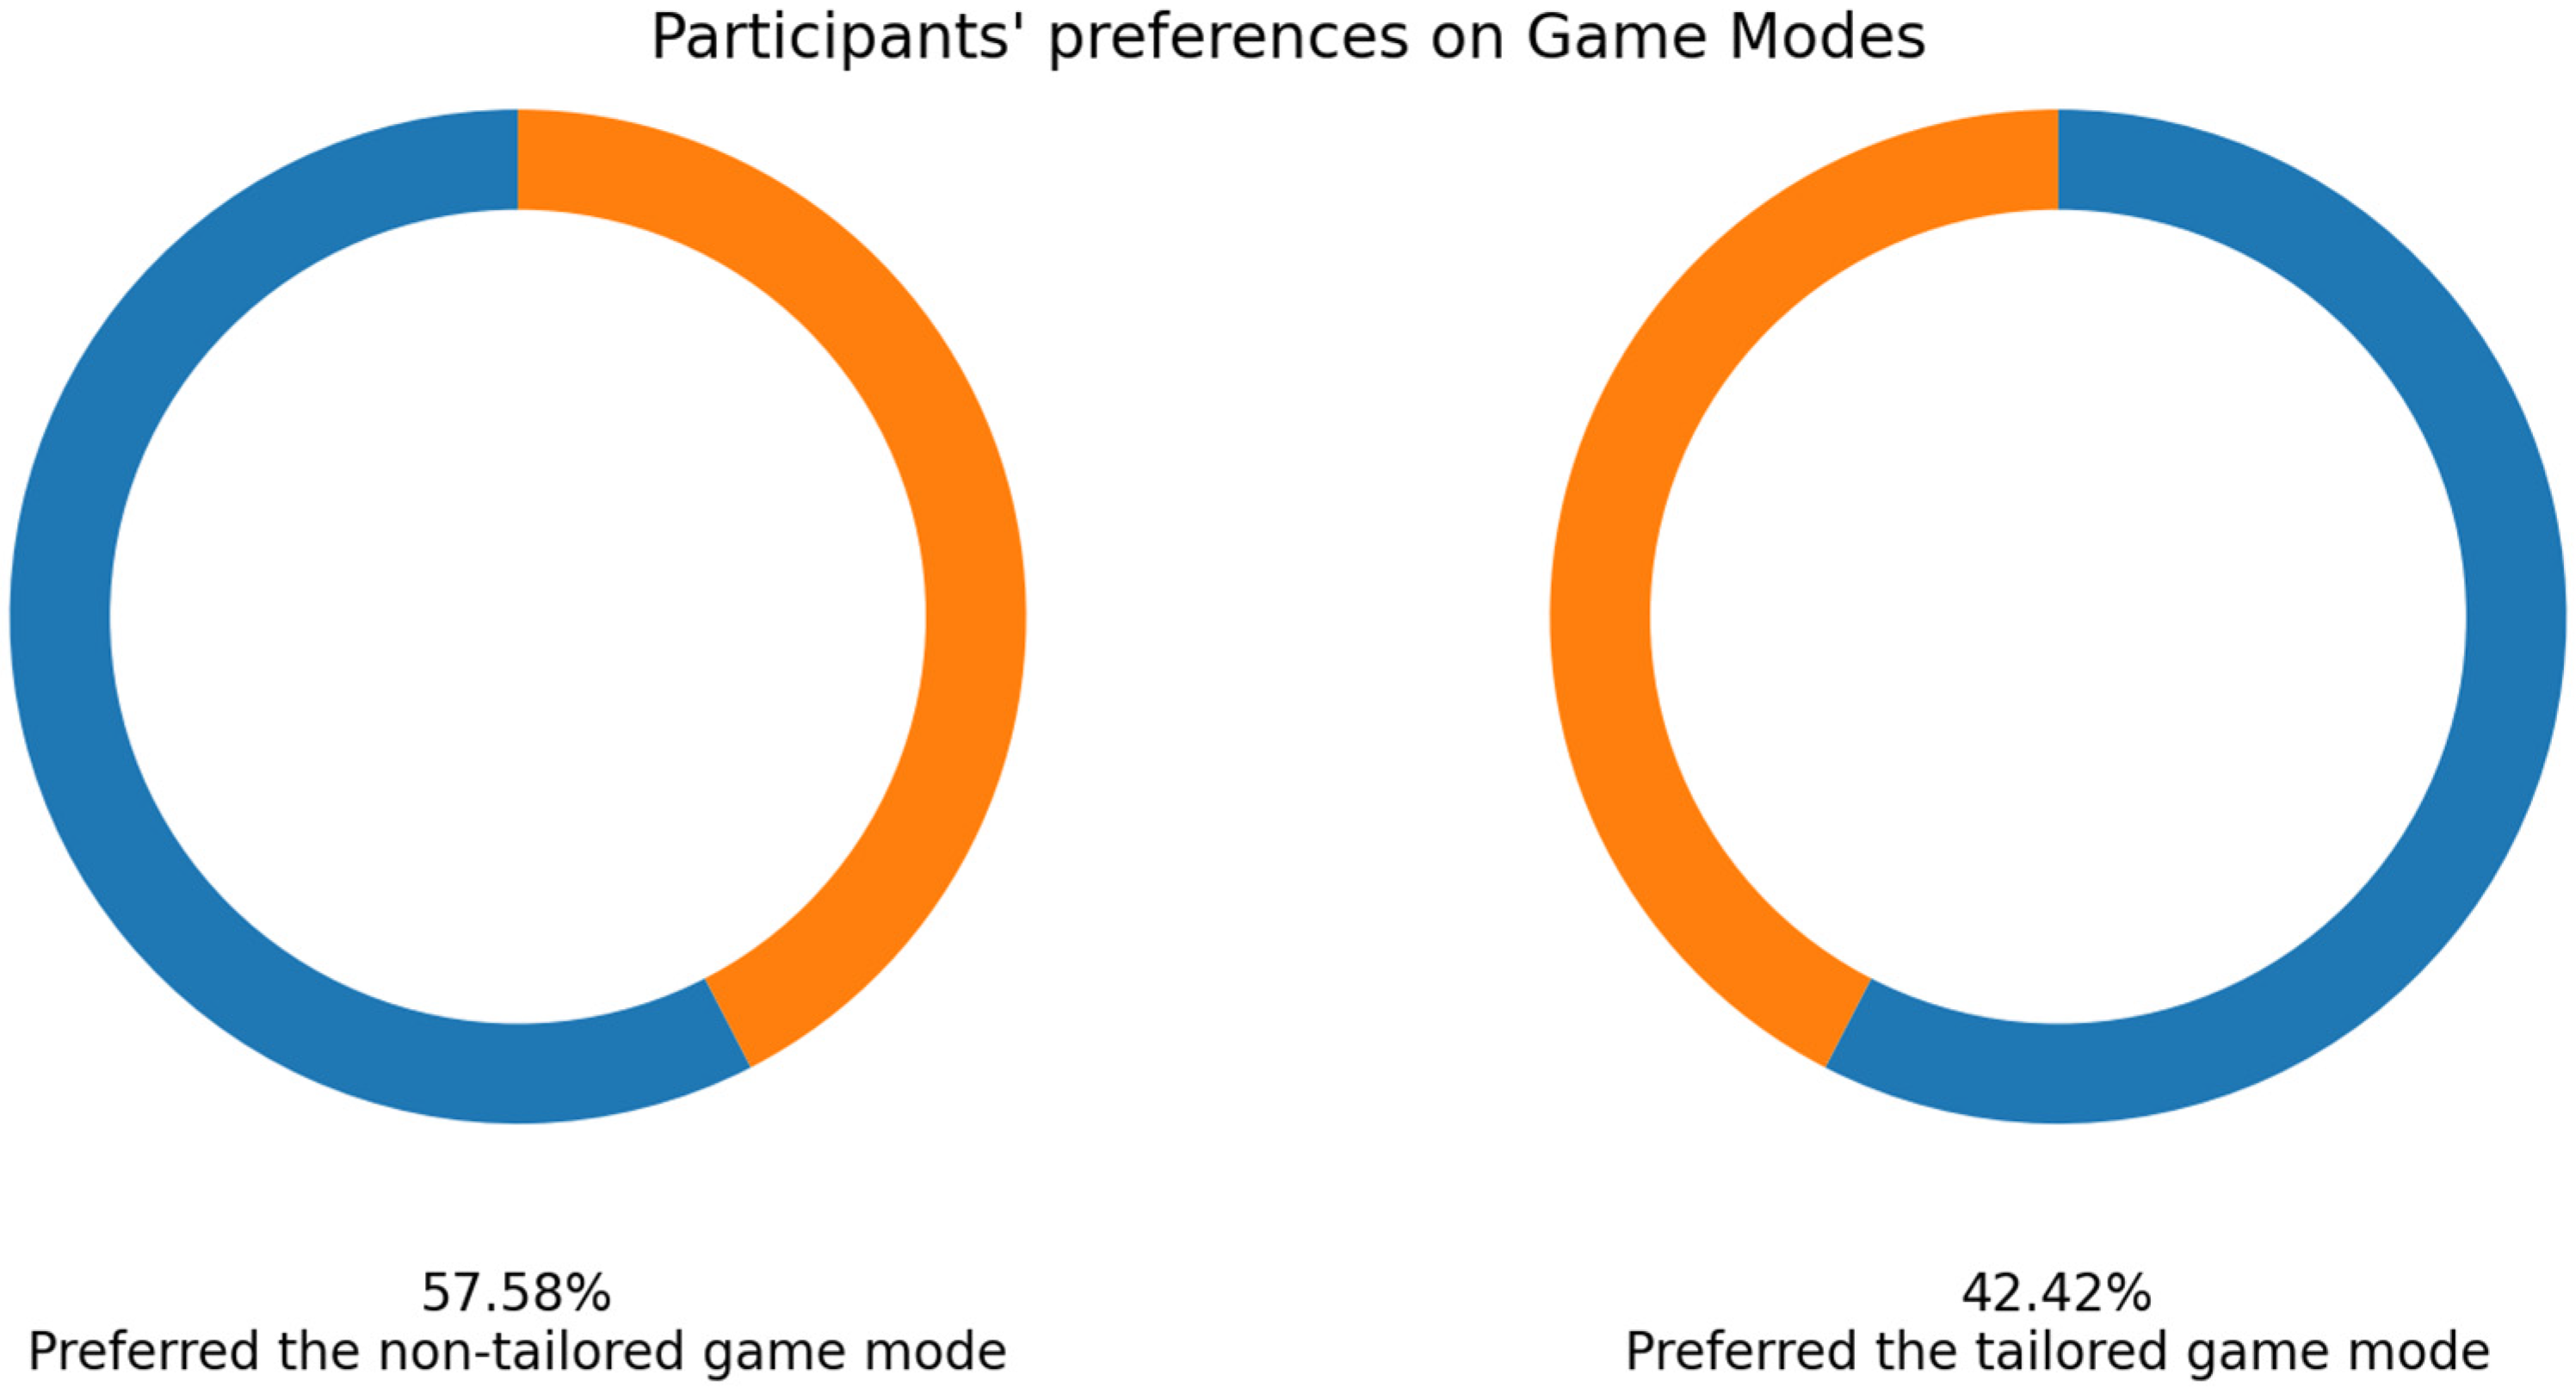
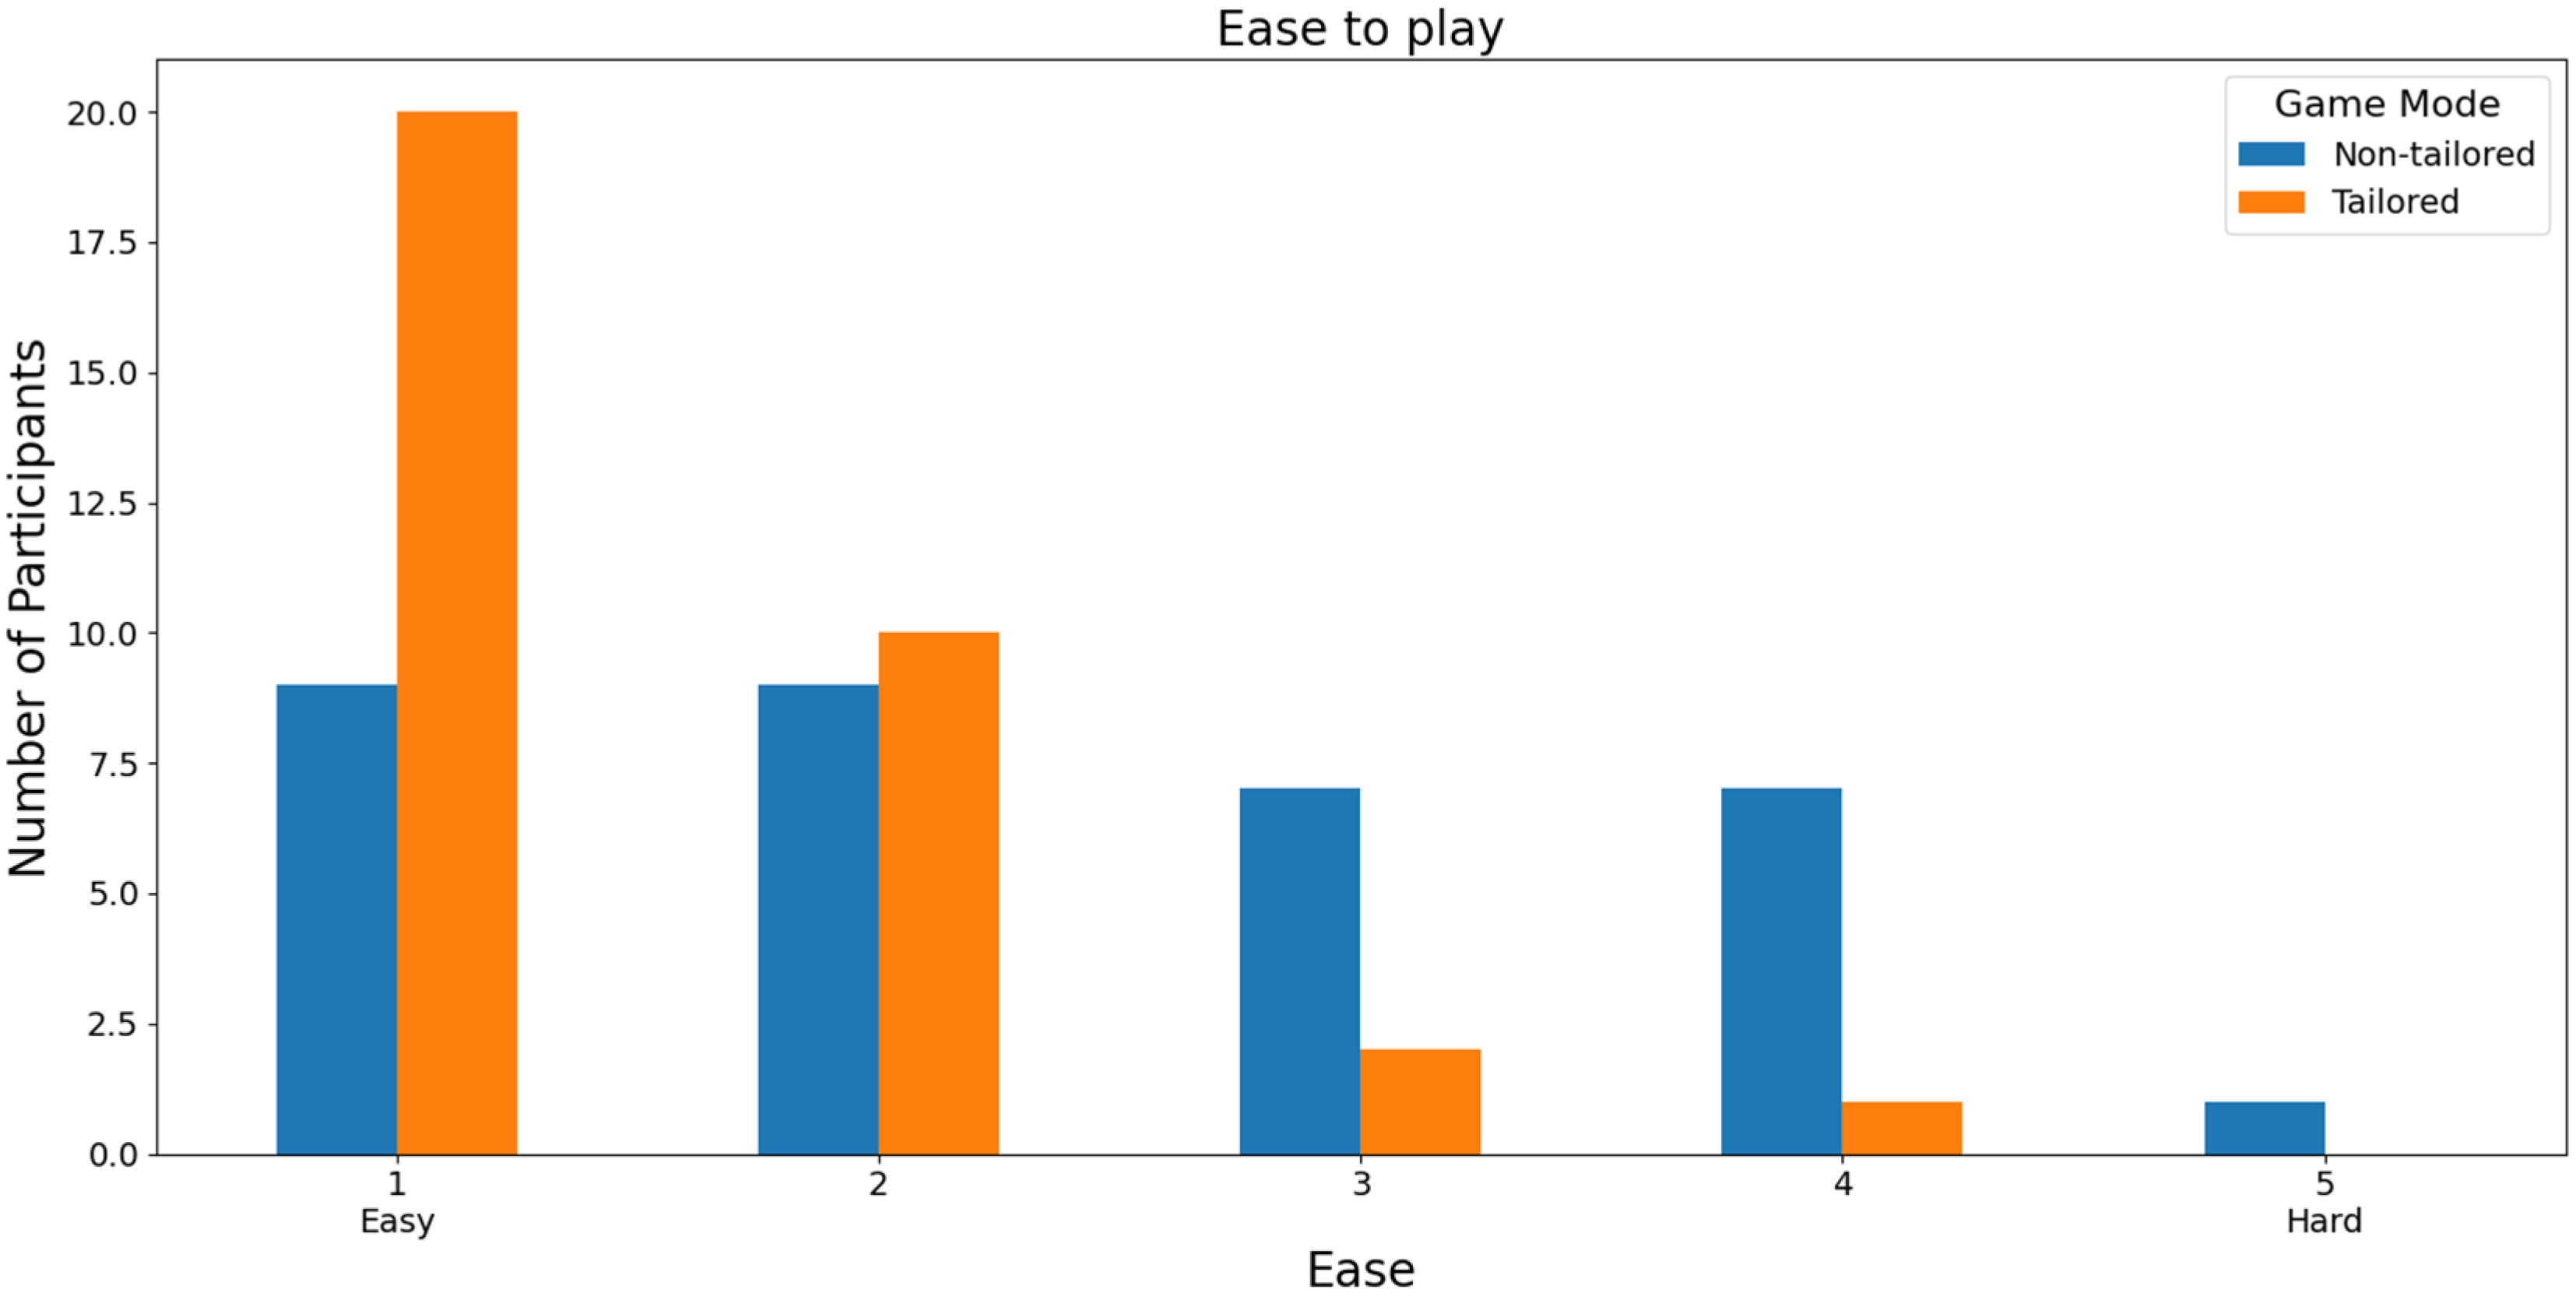
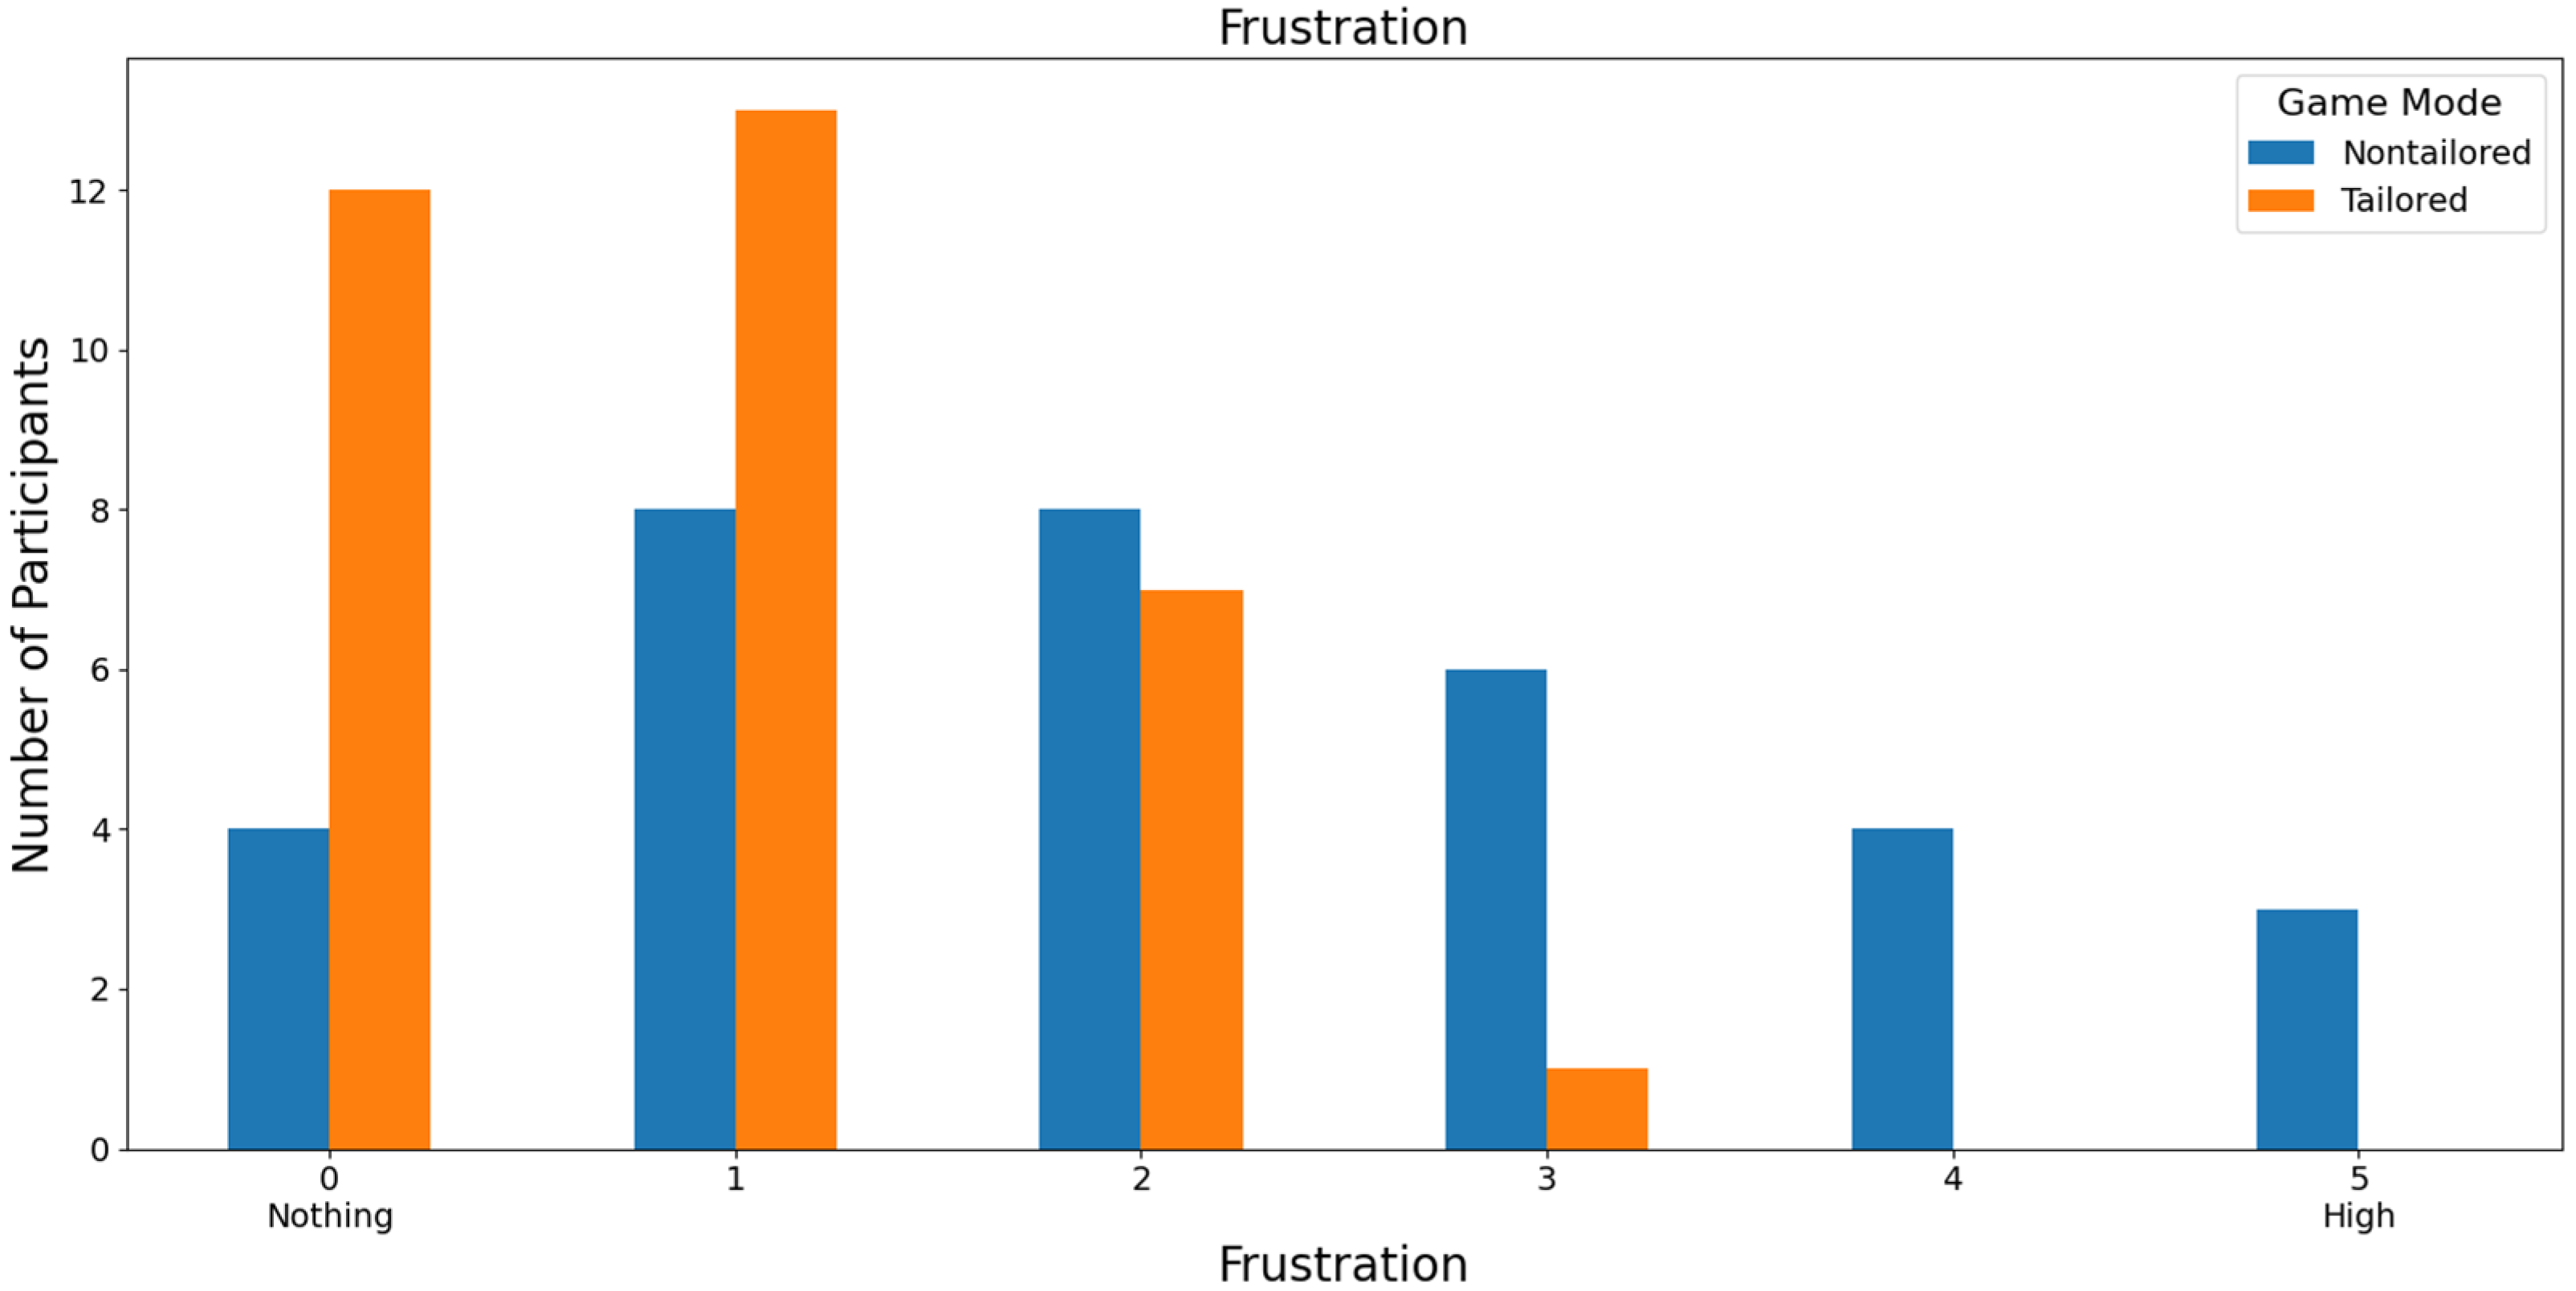

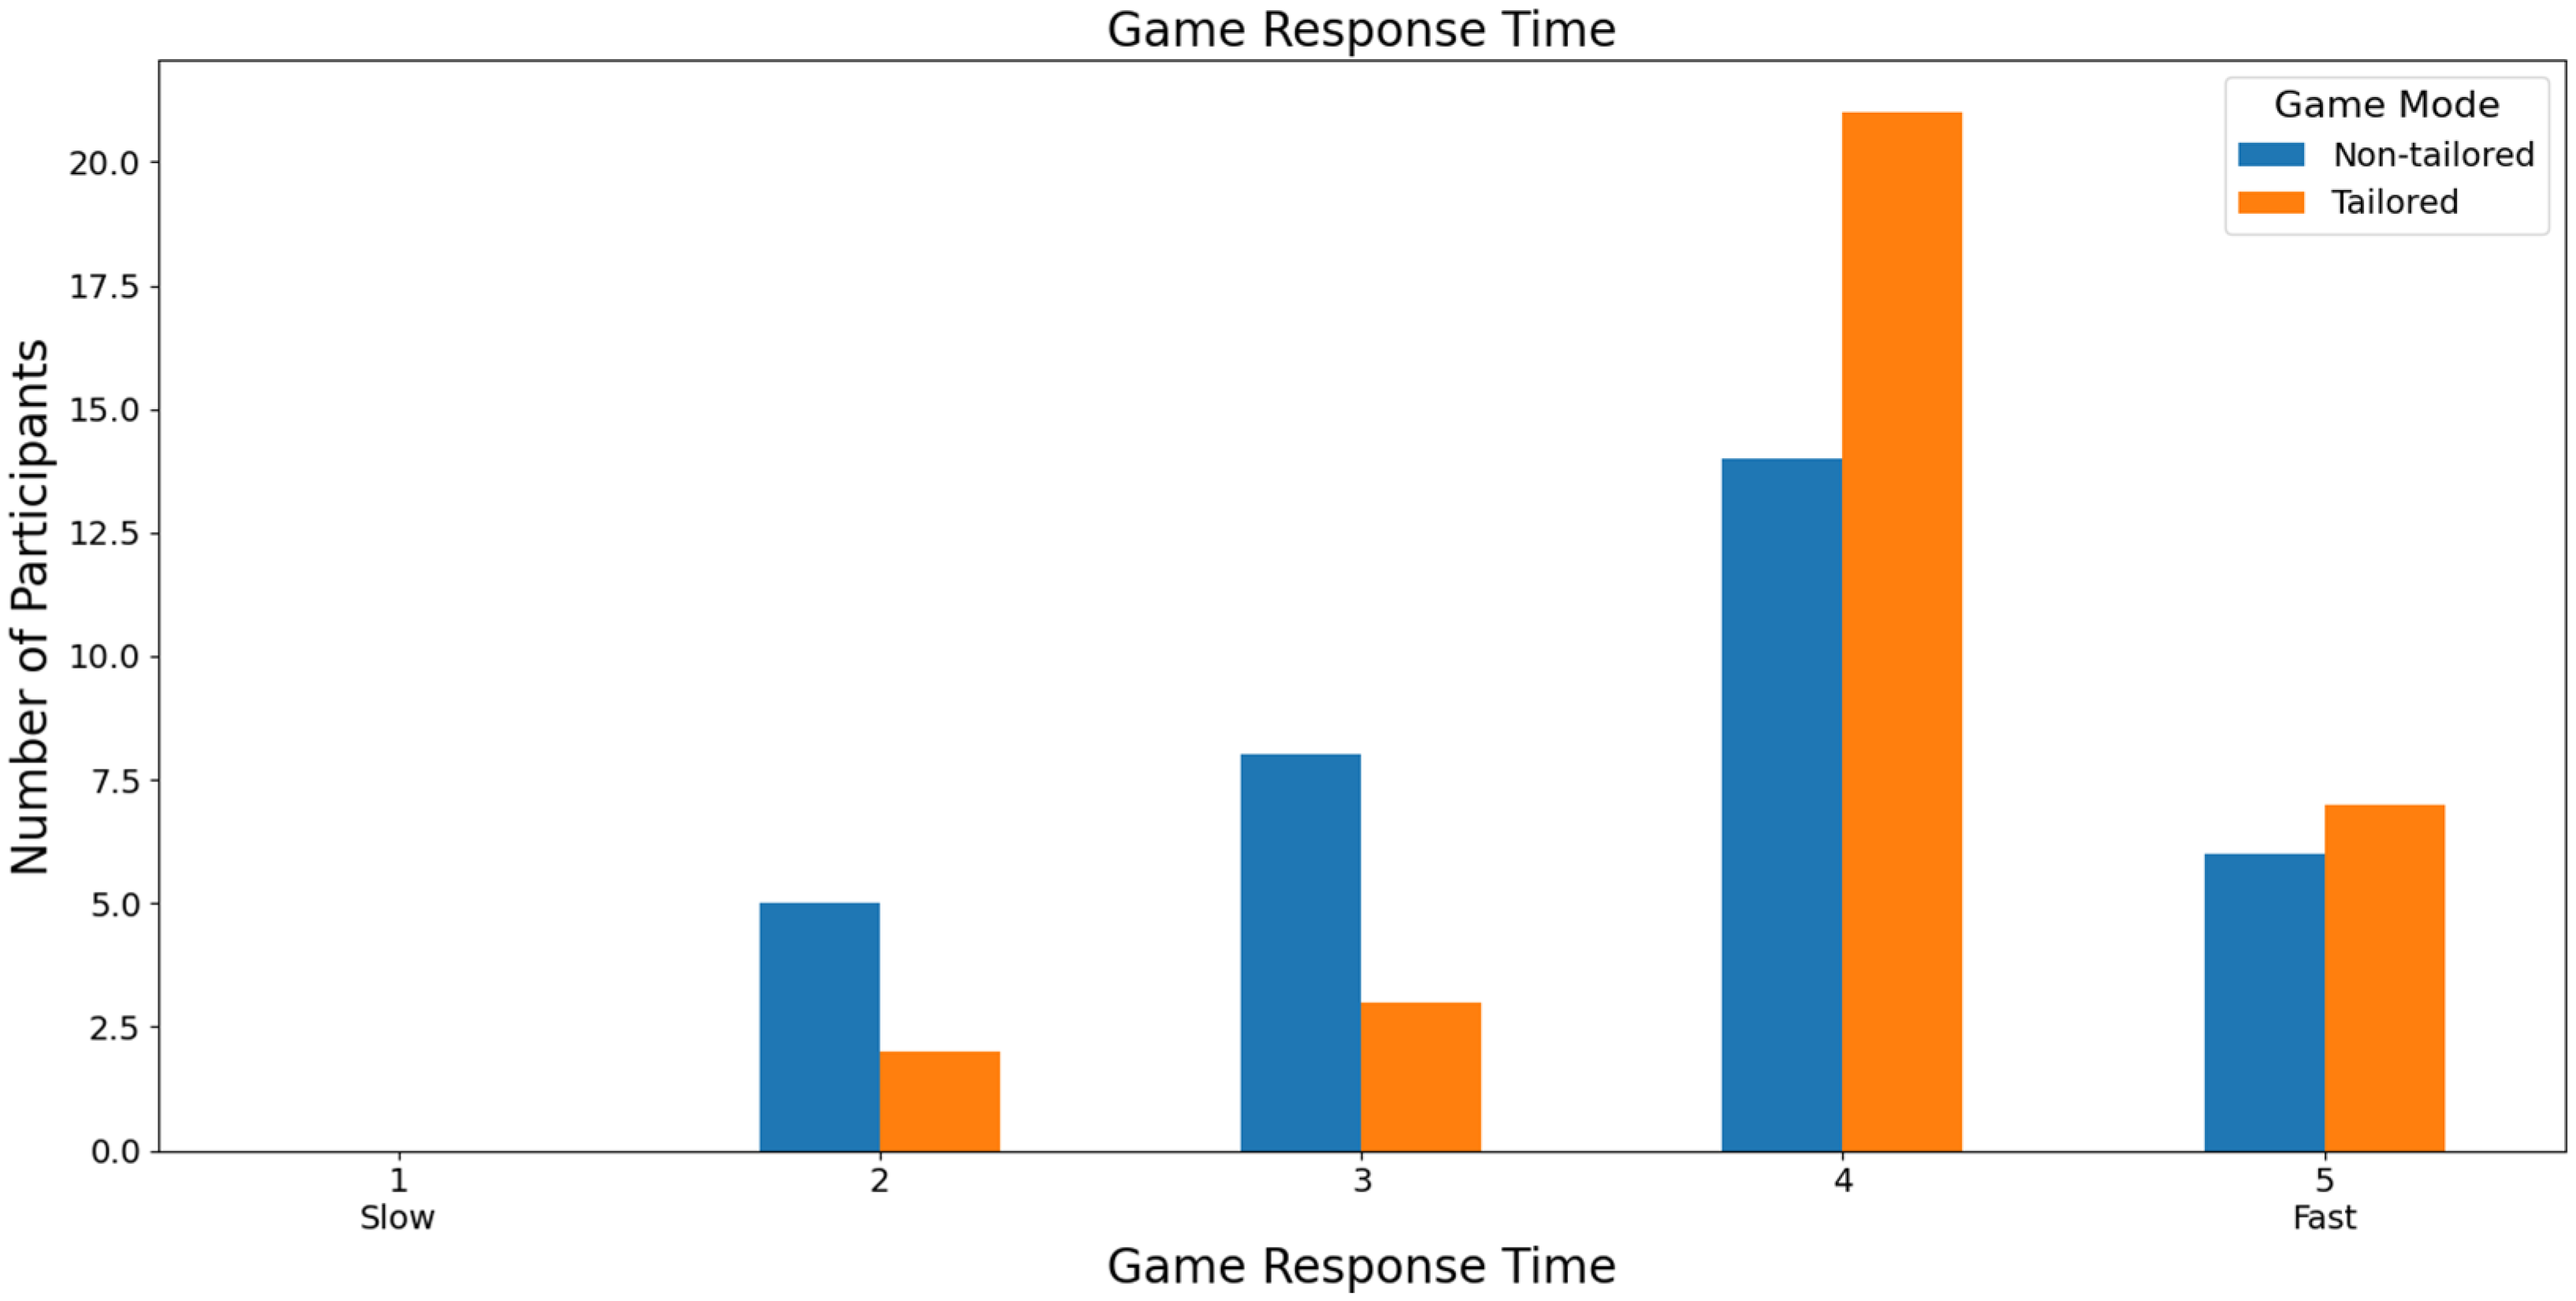
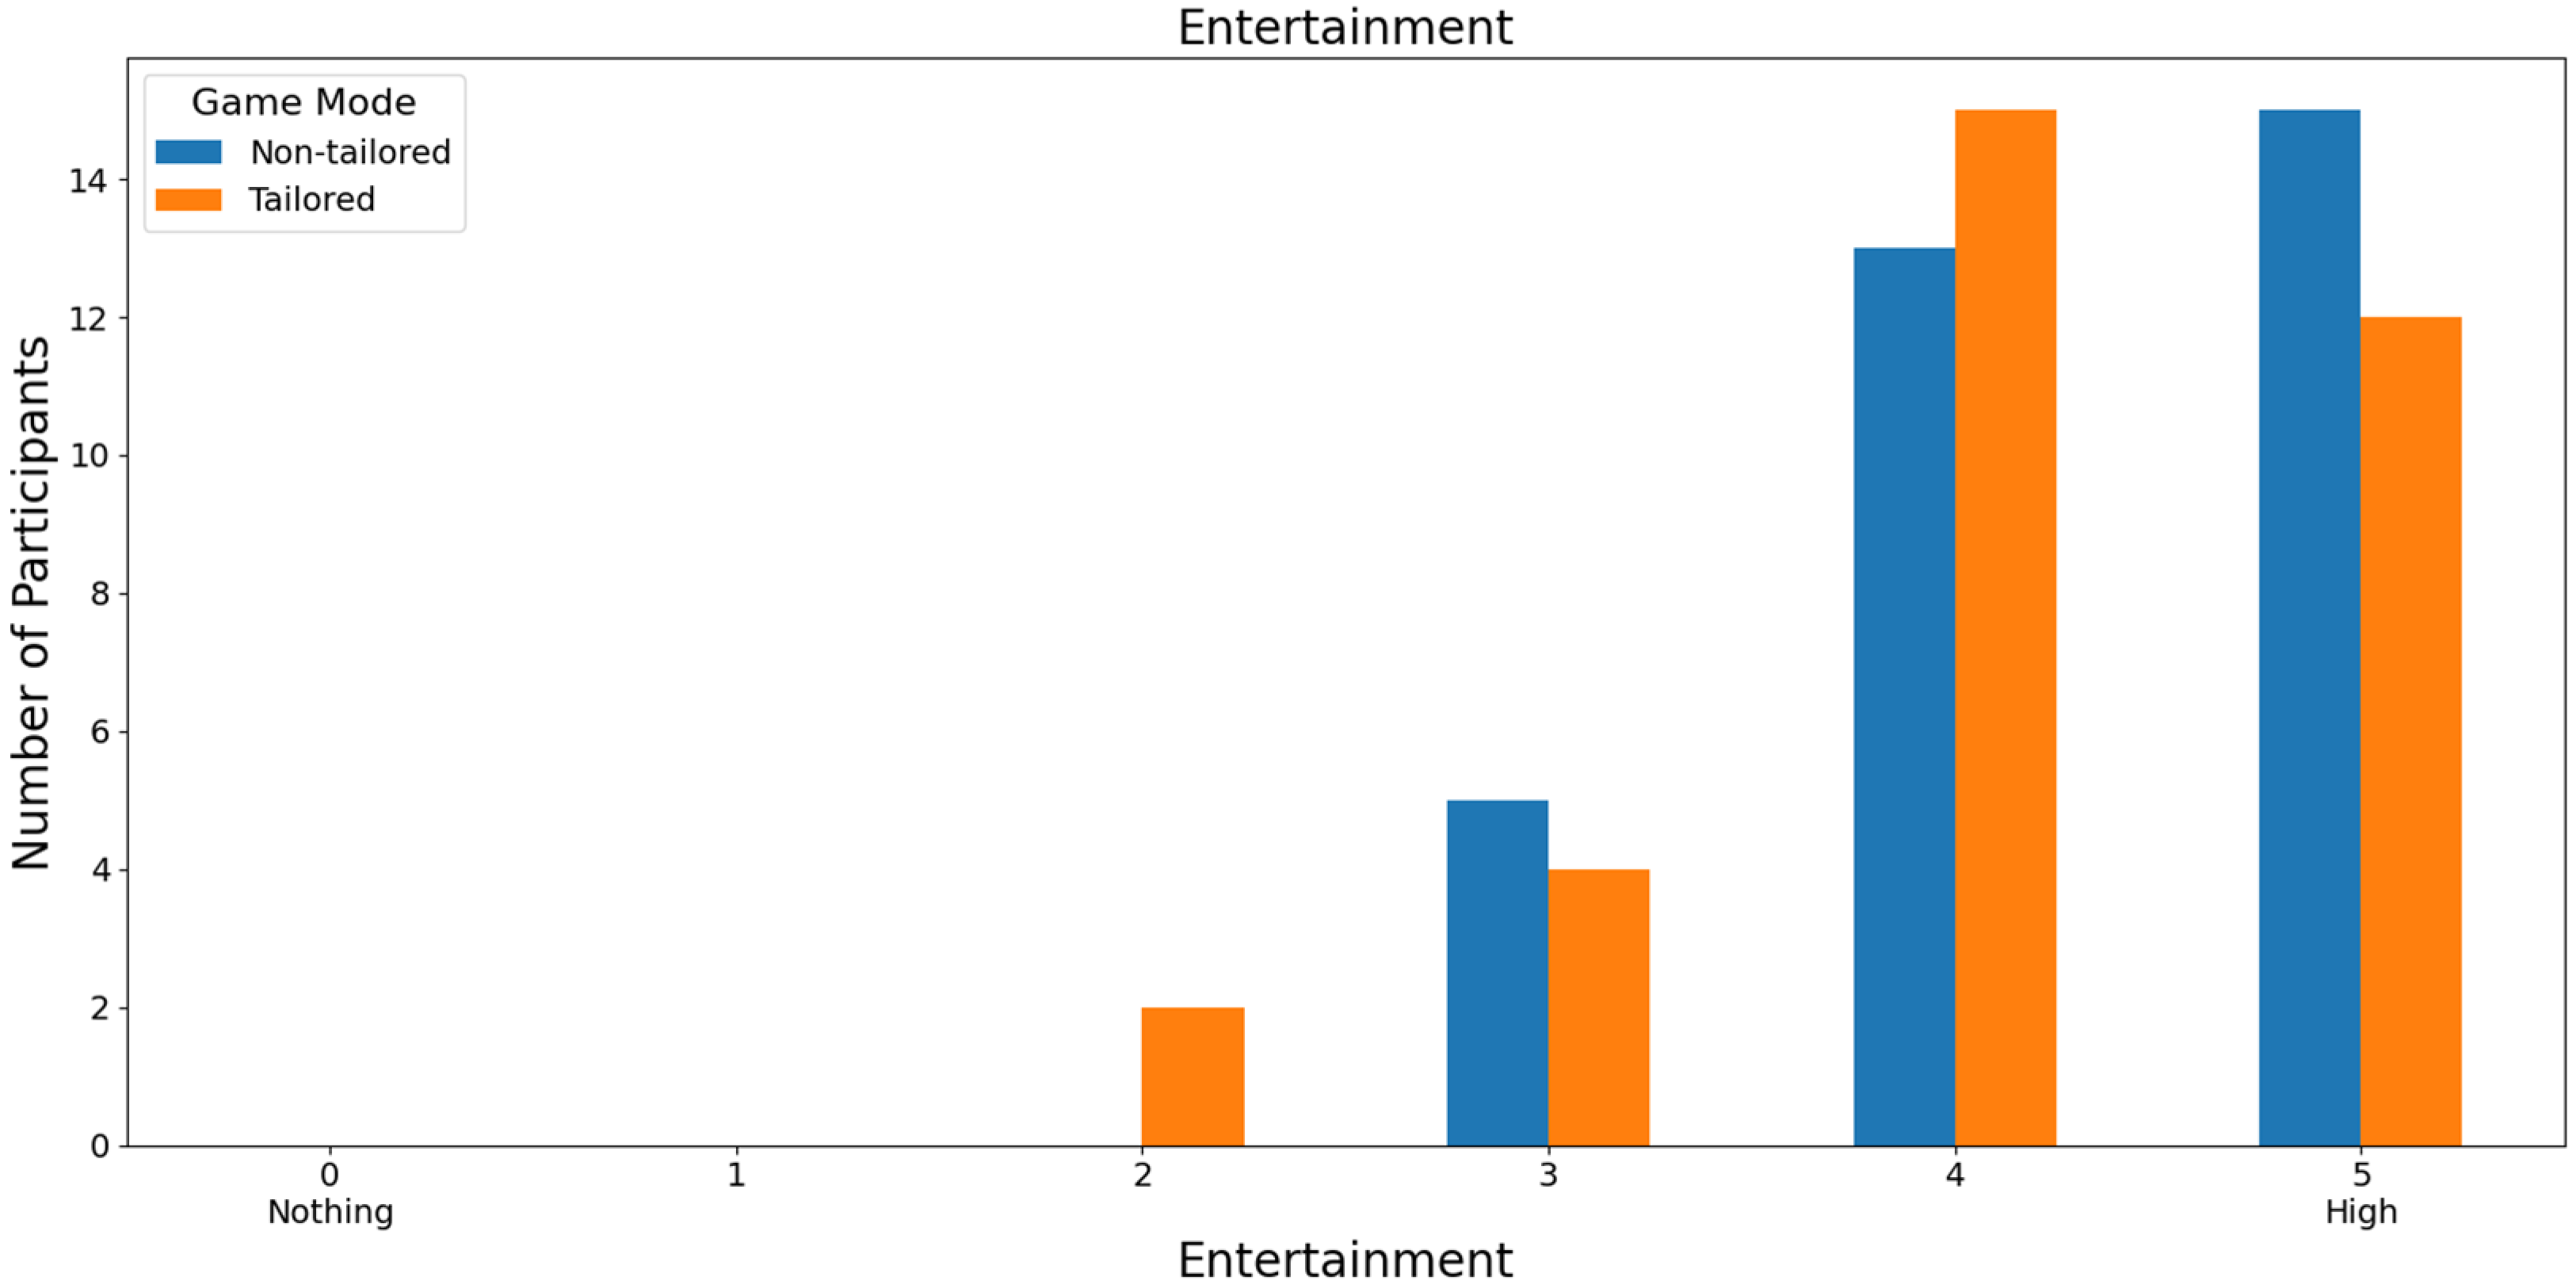
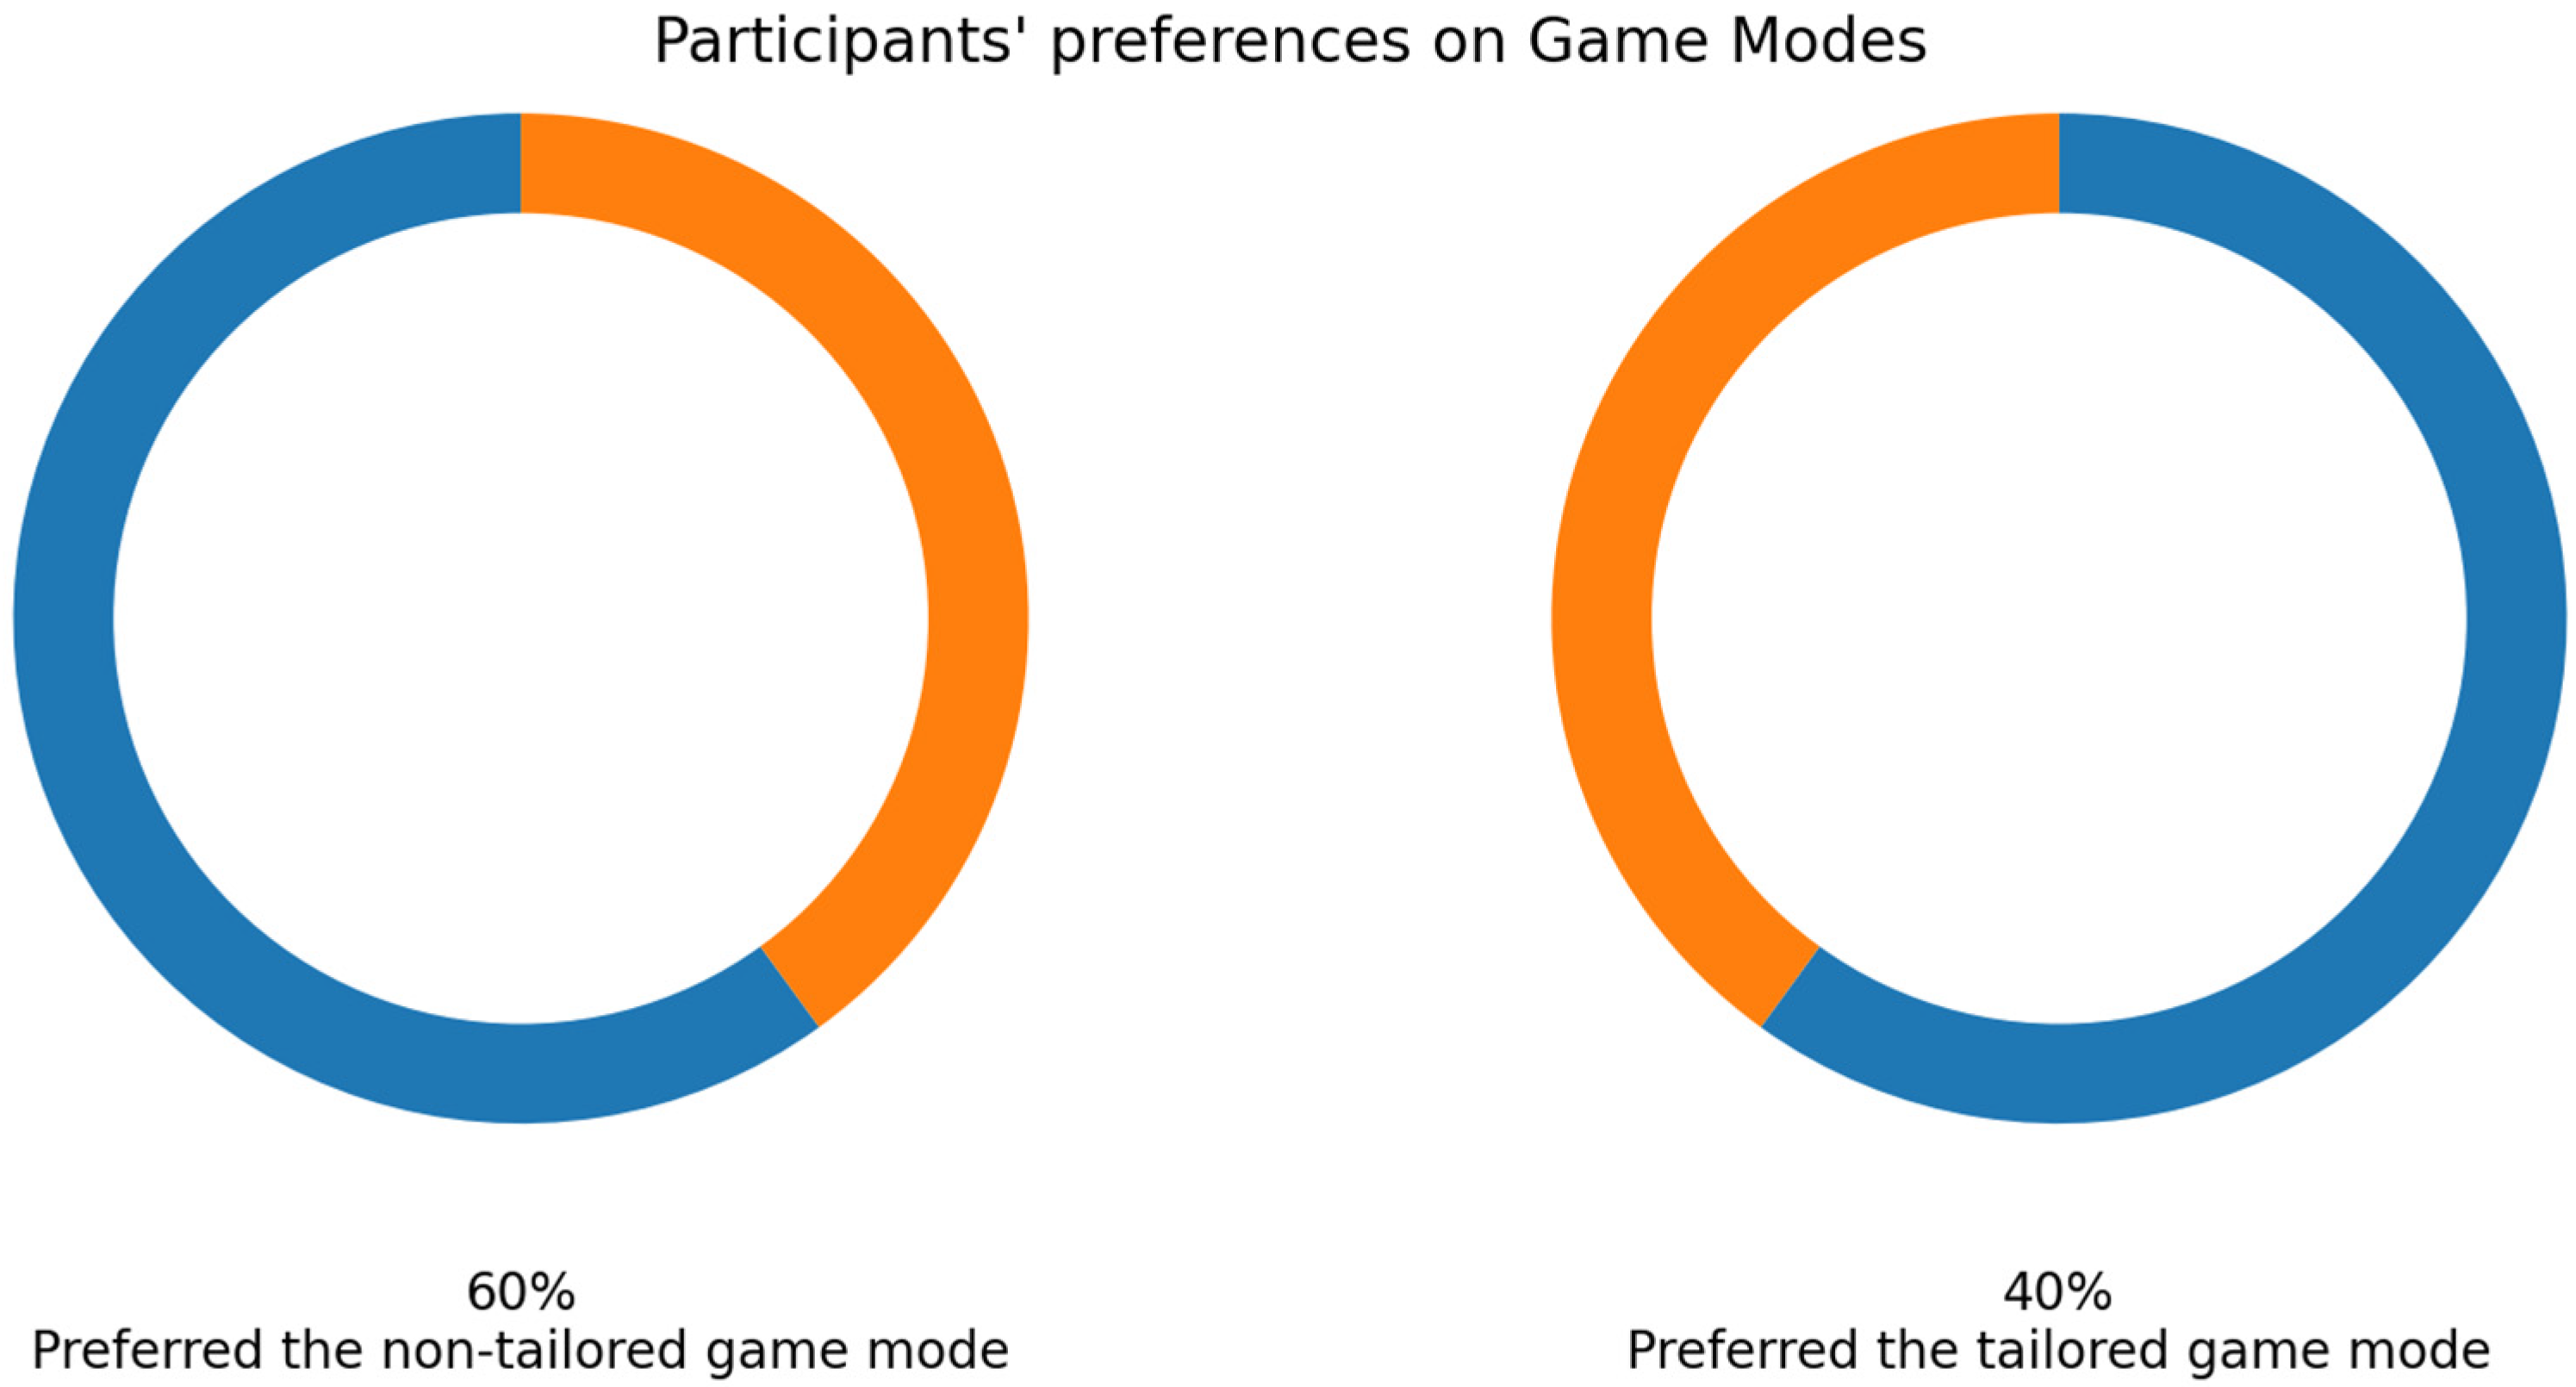
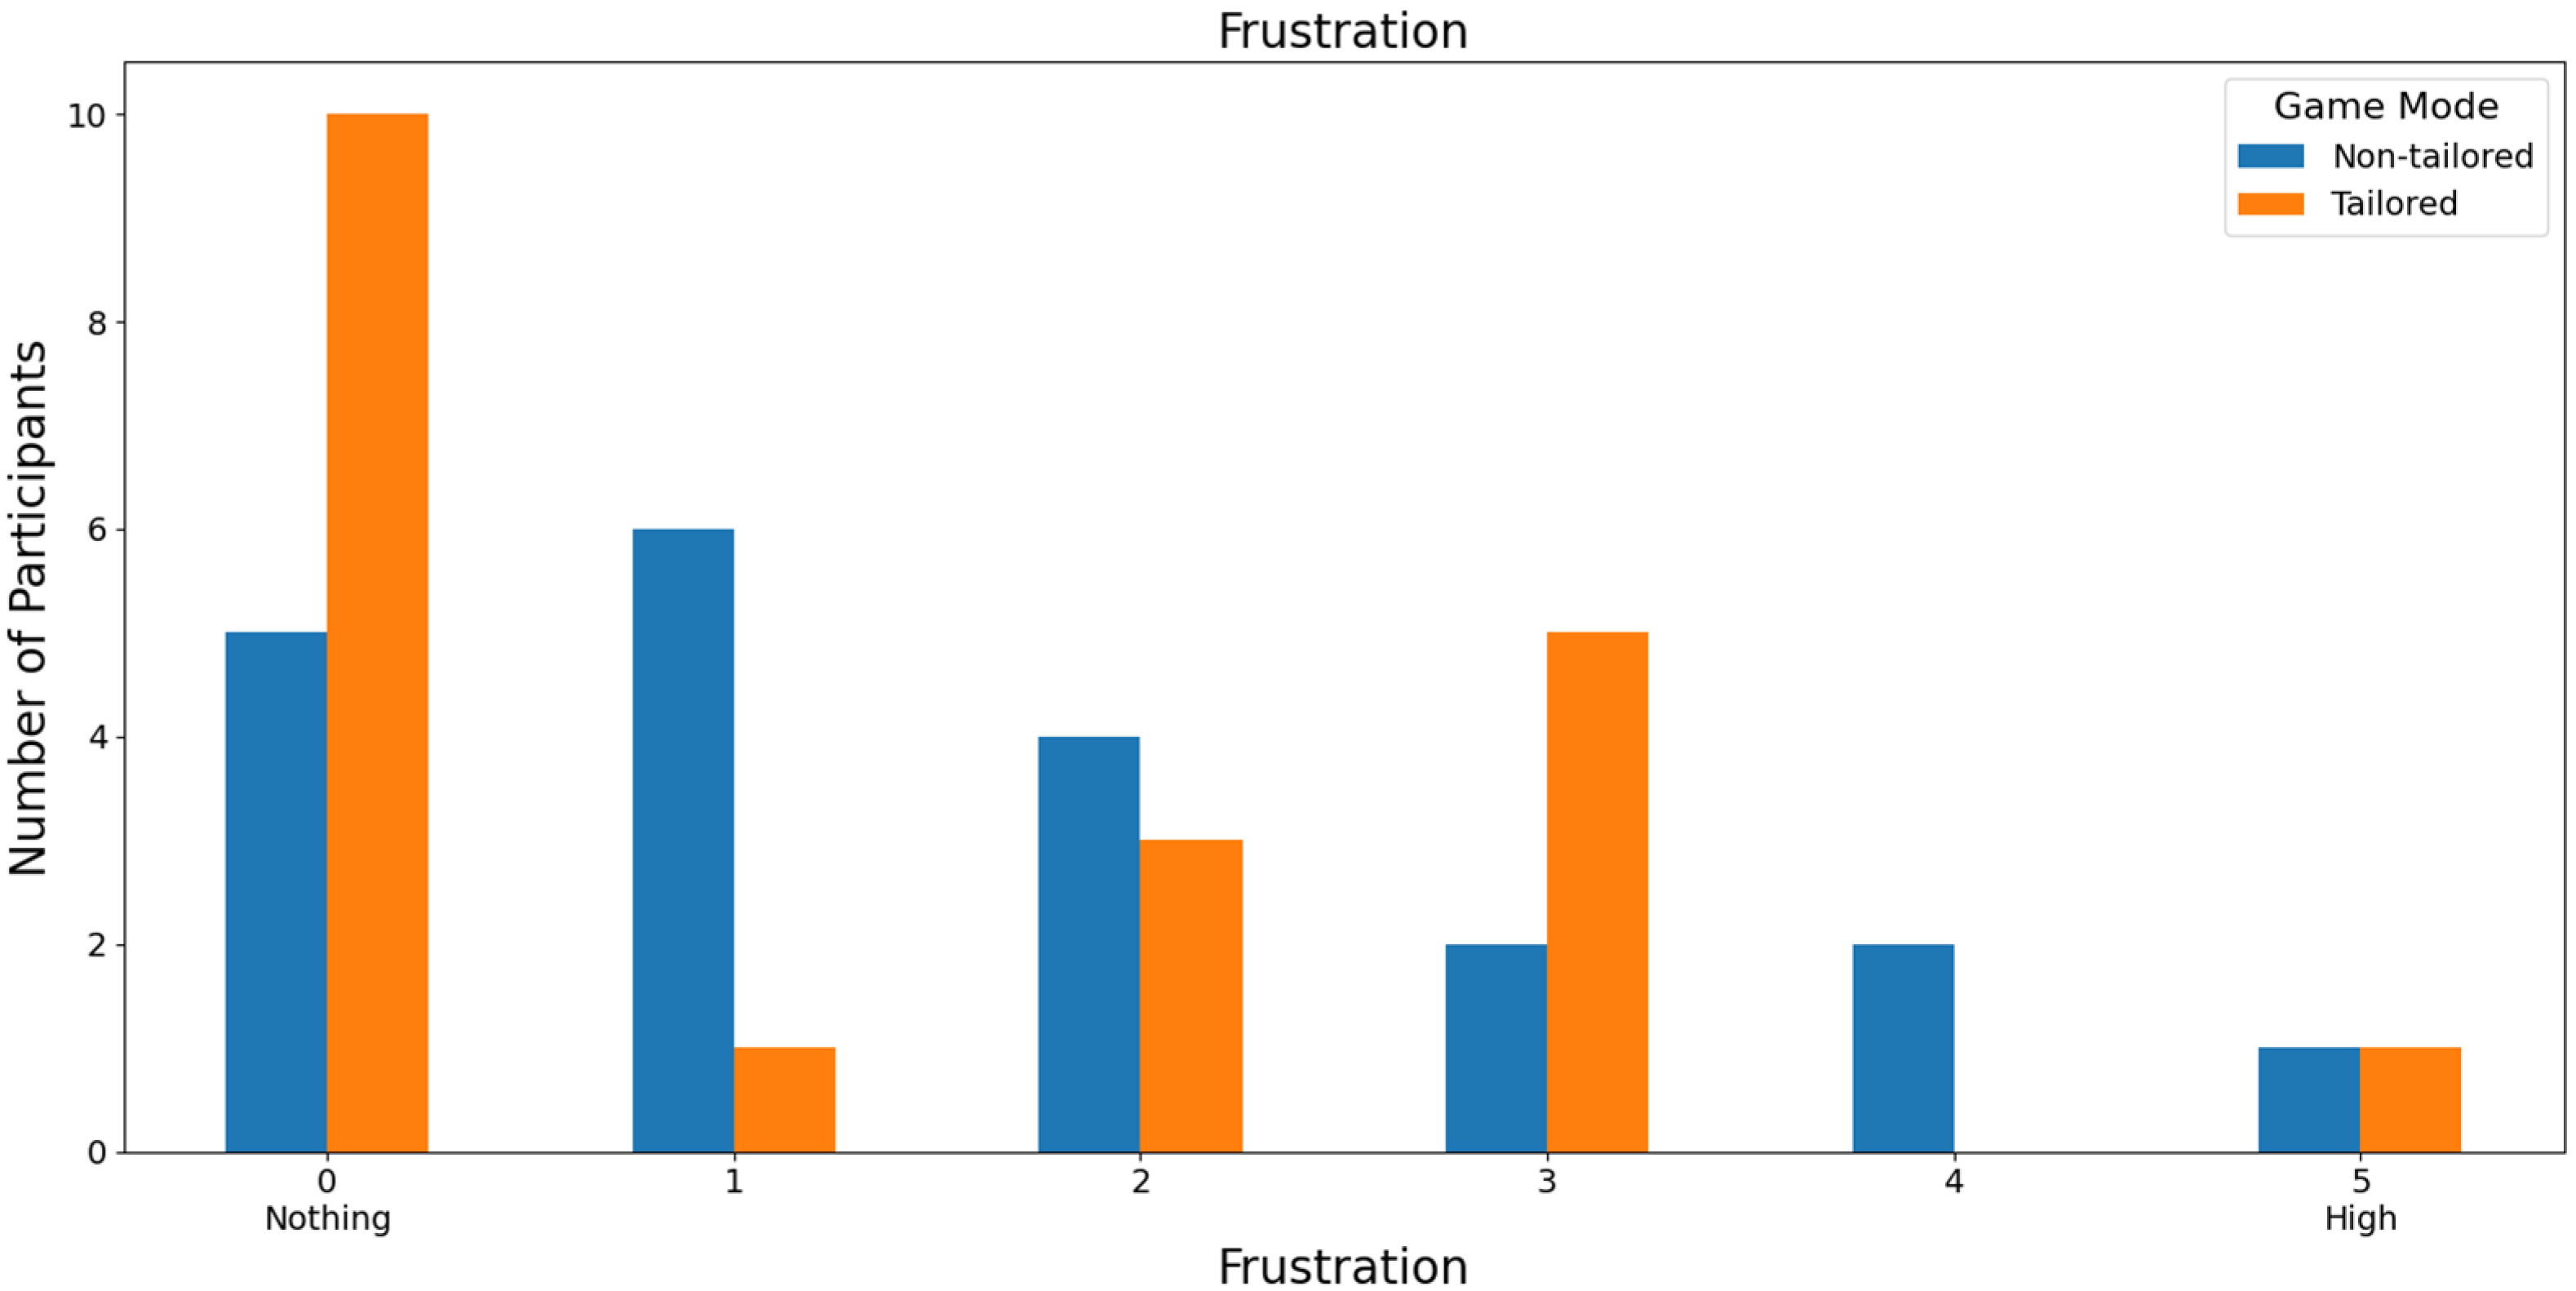
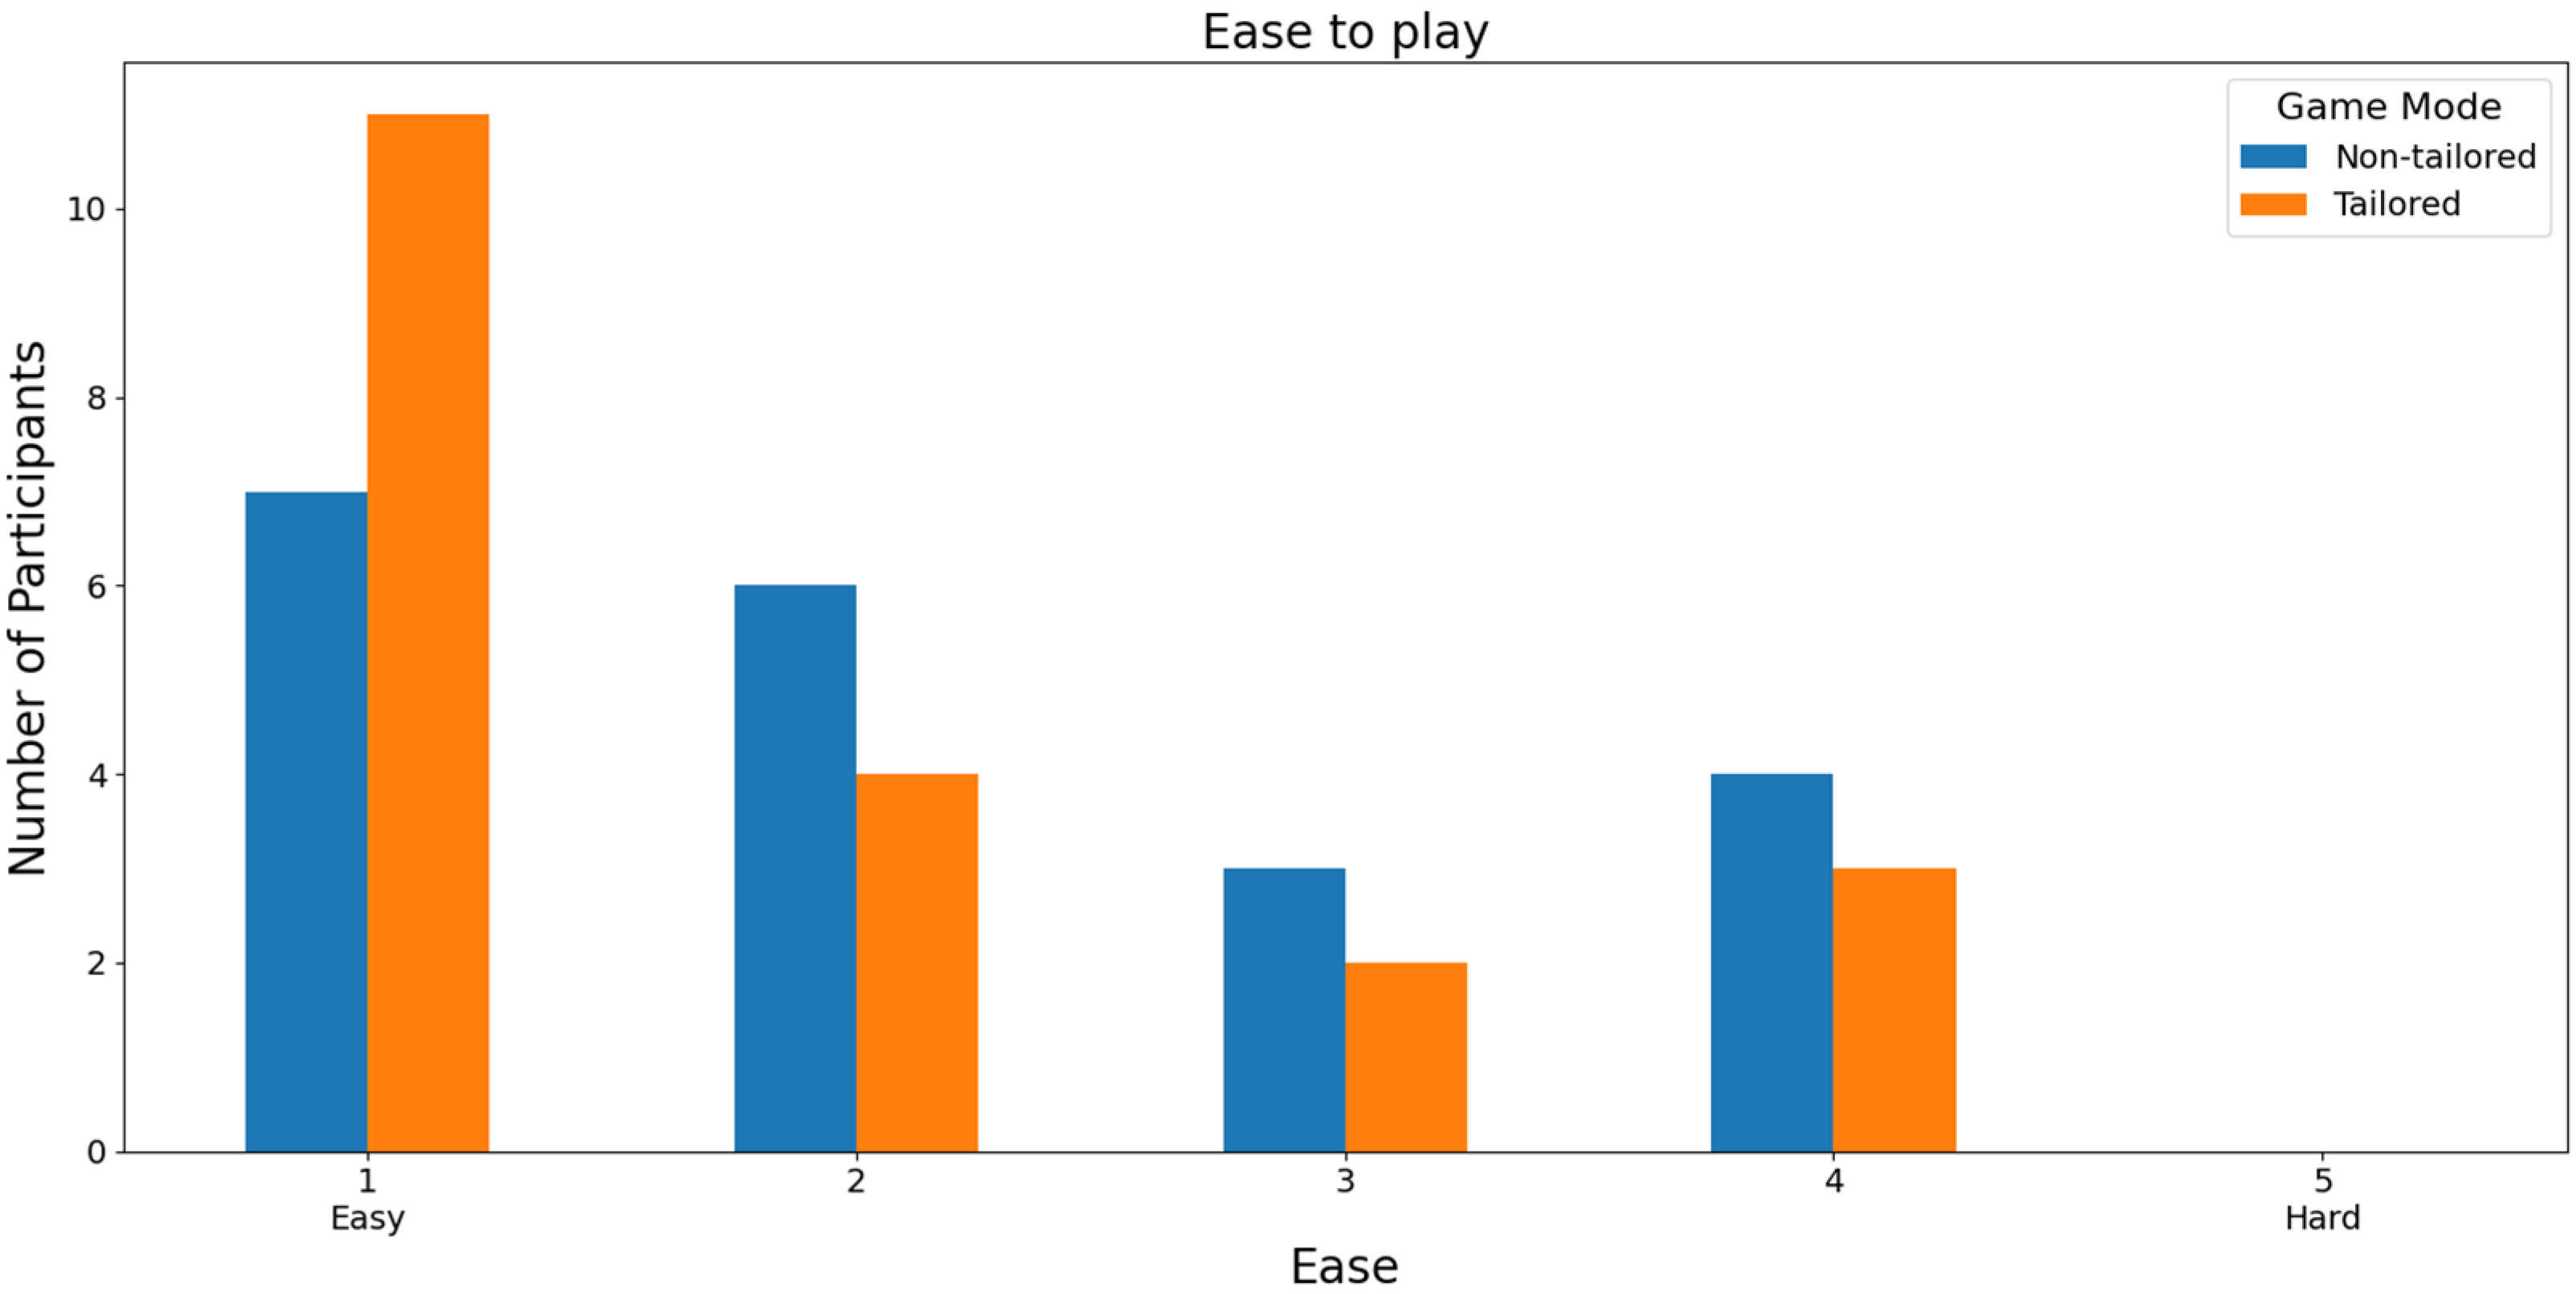
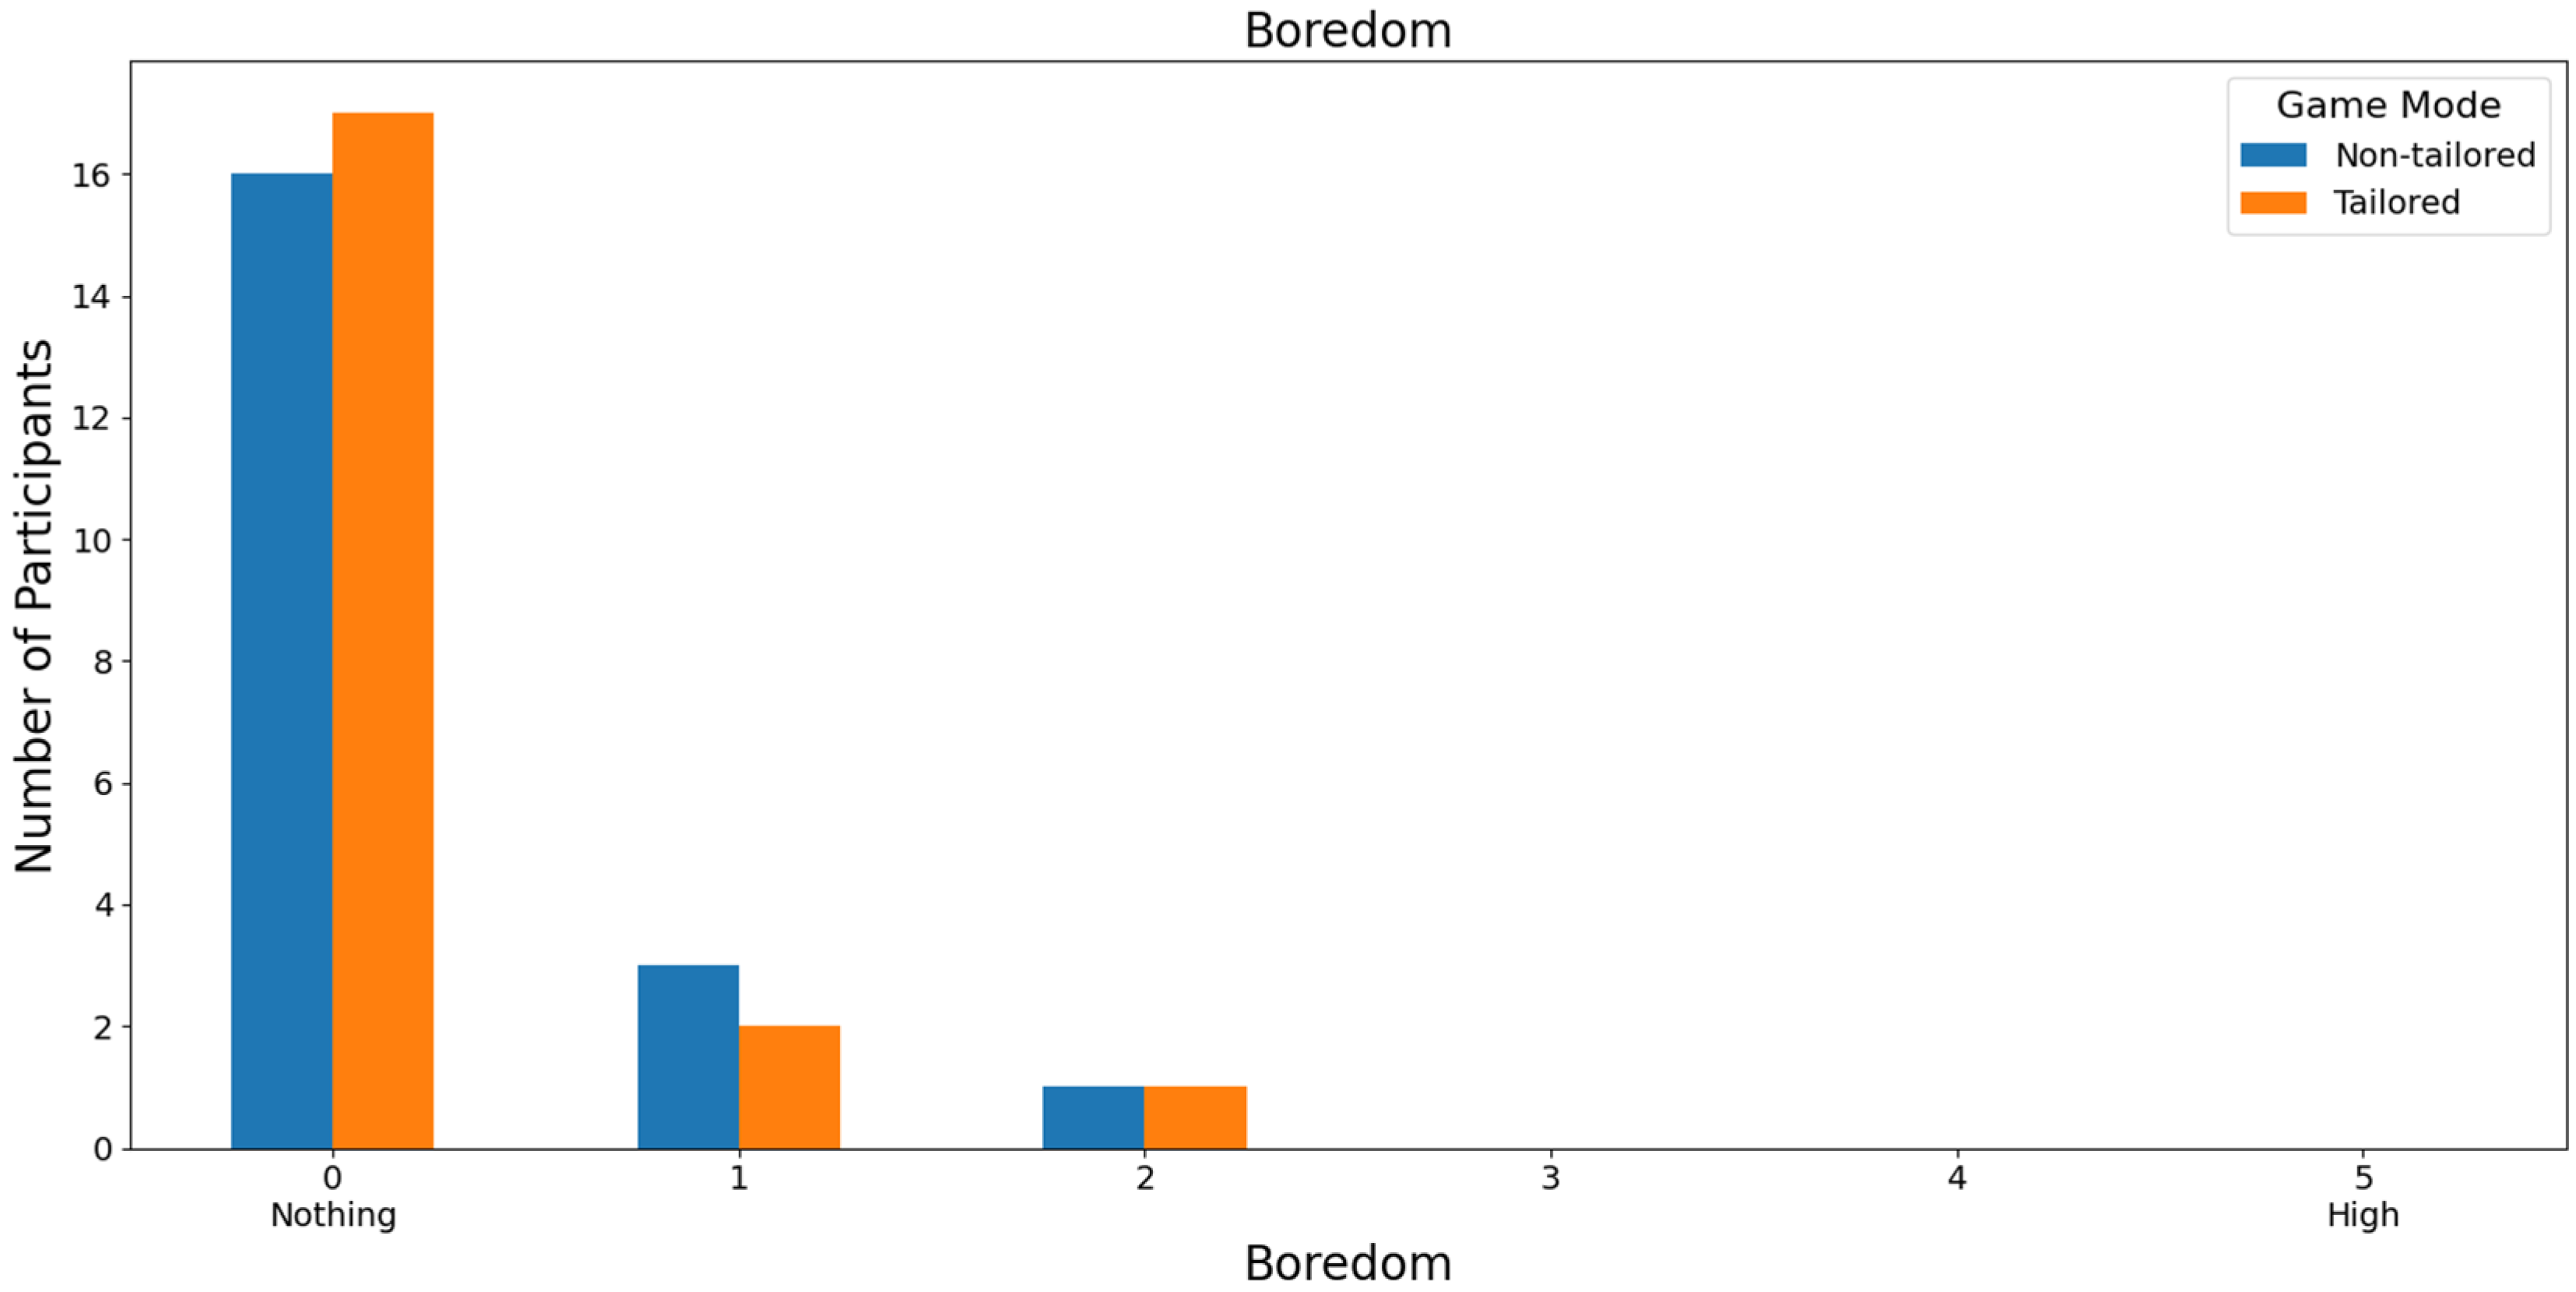

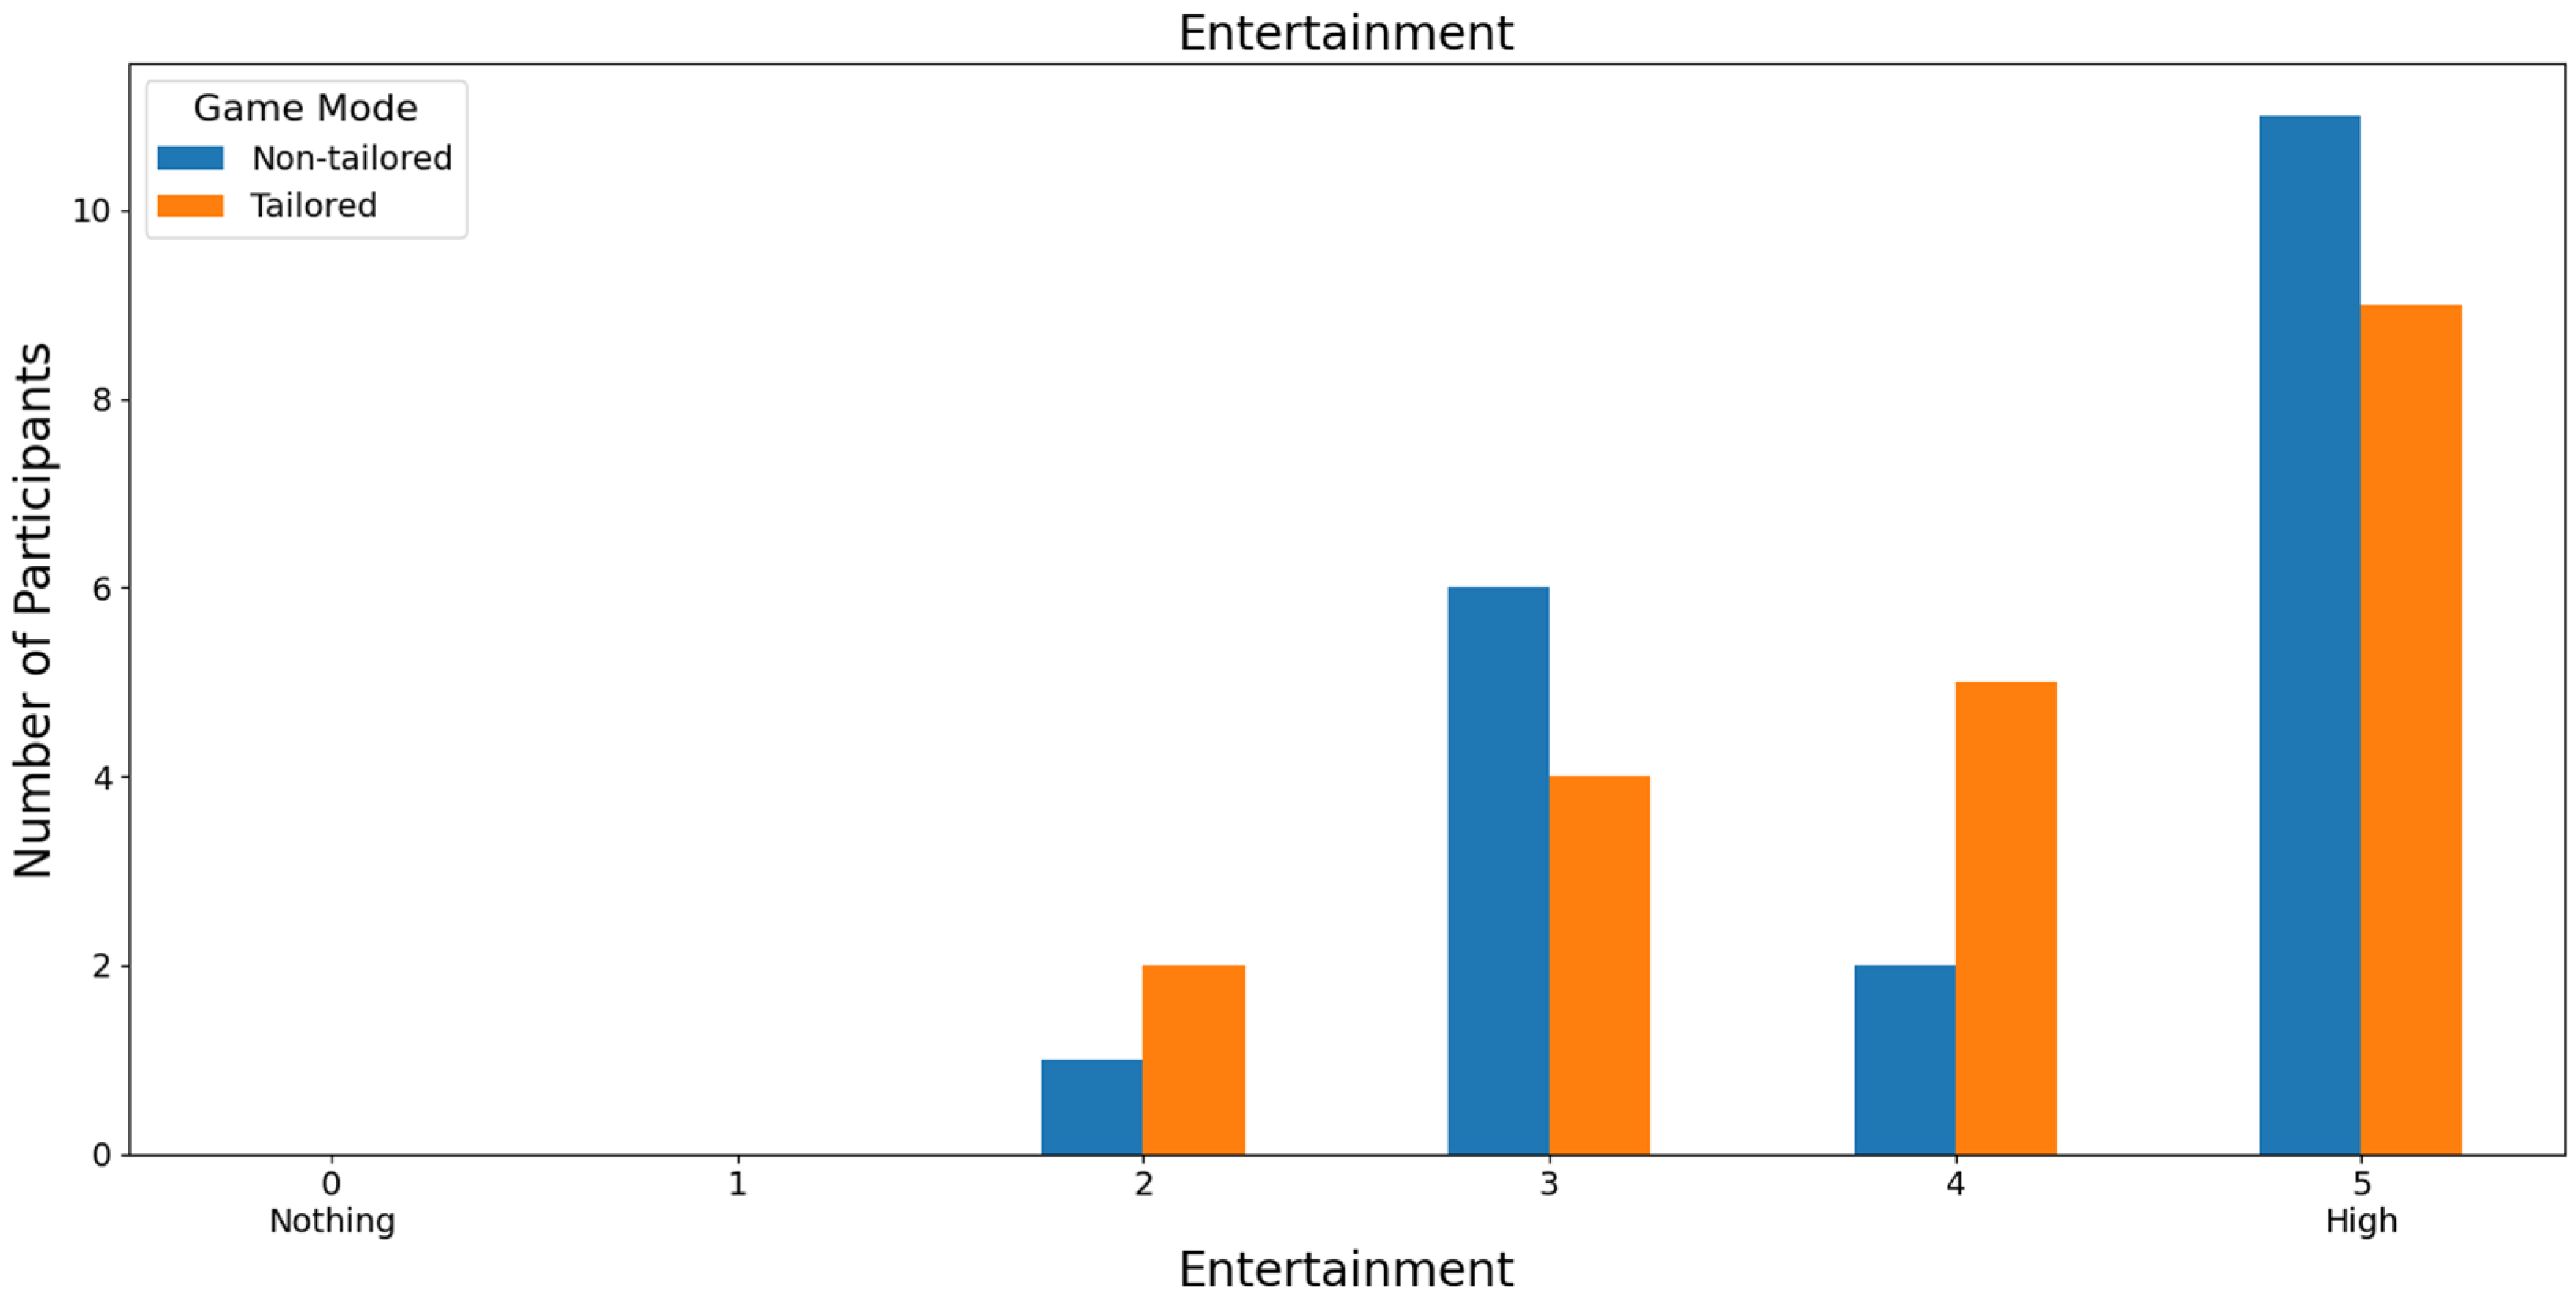
Disclaimer/Publisher’s Note: The statements, opinions and data contained in all publications are solely those of the individual author(s) and contributor(s) and not of MDPI and/or the editor(s). MDPI and/or the editor(s) disclaim responsibility for any injury to people or property resulting from any ideas, methods, instructions or products referred to in the content. |
© 2024 by the authors. Licensee MDPI, Basel, Switzerland. This article is an open access article distributed under the terms and conditions of the Creative Commons Attribution (CC BY) license (https://creativecommons.org/licenses/by/4.0/).