

Enhancing Breast Cancer Risk Prediction with Machine Learning: Integrating BMI, Smoking Habits, Hormonal Dynamics, and BRCA Gene Mutations—A Game-Changer Compared to Traditional Statistical Models?

 ,
,  ,
,  and
and
Abstract
:1. Introduction
2. Materials and Methods
2.1. Design
2.2. Inclusion and Exclusion Criteria
2.3. Survey Instrument
2.4. Ethical Considerations
2.5. Statistical Analysis
2.6. Machine Learning
3. Results
3.1. Baseline Characteristics and Exposure to Risk Factors
3.2. Machine Learning Predictive Model
4. Discussion
5. Conclusions
Author Contributions
Funding
Institutional Review Board Statement
Informed Consent Statement
Data Availability Statement
Conflicts of Interest
References
- Bray, F.; Ferlay, J.; Soerjomataram, I.; Siegel, R.L.; Torre, L.A.; Jemal, A. Global cancer statistics 2018: GLOBOCAN estimates of incidence and mortality worldwide for 36 cancers in 185 countries. CA Cancer J. Clin. 2018, 68, 394–424. [Google Scholar] [CrossRef] [PubMed]
- Amuta, A.O.; Mkuu, R.S.; Jacobs, W.; Ejembi, A.Z. Influence of Cancer Worry on Four Cancer Related Health Protective Behaviors among a Nationally Representative Sample: Implications for Health Promotion Efforts. J. Cancer Educ. 2018, 33, 1002–1010. Available online: http://www.ncbi.nlm.nih.gov/pubmed/28251521 (accessed on 6 August 2024). [CrossRef] [PubMed]
- AIOM-AIRTUM-Siapec-Iap. I Numeri del Cancro in Italia 2022. Available online: https://www.aiom.it/wp-content/uploads/2022/12/2022_AIOM_NDC-web.pdf (accessed on 10 October 2023).
- Conte, L.; De Nunzio, G.; Lupo, R.; Mieli, M.; Lezzi, A.; Vitale, E.; Carriero, M.C.; Calabrò, A.; Carvello, M.; Rubbi, I.; et al. Breast Cancer Prevention: The Key Role of Population Screening, Breast Self-Examination (BSE) and Technological Tools. Survey of Italian Women. J. Cancer Educ. 2023, 38, 1728–1742. [Google Scholar] [CrossRef] [PubMed]
- Conte, L.; Lupo, R.; Lezzi, A.; Sciolti, S.; Rubbi, I.; Carvello, M.; Calabrò, A.; Botti, S.; Fanizzi, A.; Massafra, R.; et al. Breast Cancer Prevention Practices and Knowledge in Italian and Chinese Women in Italy: Clinical Checkups, Free NHS Screening Adherence, and Breast Self-Examination (BSE). J. Cancer Educ. 2024. [Google Scholar] [CrossRef] [PubMed]
- Conte, L.; Lupo, R.; Sciolti, S.; Lezzi, A.; Rubbi, I.; Botti, S.; Carvello, M.; Fanizzi, A.; Massafra, R.; Vitale, E.; et al. Exploring the Landscape of Breast Cancer Prevention among Chinese Residents in Italy: An In-Depth Analysis of Screening Adherence, Breast Self-Examination (BSE) Practices, the Role of Technological Tools, and Misconceptions Surrounding Risk Factors and Sy. Int. J. Environ. Res. Public. Health 2024, 21, 308. Available online: https://www.mdpi.com/1660-4601/21/3/308 (accessed on 6 August 2024). [CrossRef]
- Conte, L.; Tafuri, B.; Portaluri, M.; Galiano, A.; Maggiulli, E.; De Nunzio, G. Breast Cancer Mass Detection in DCE–MRI Using Deep-Learning Features Followed by Discrimination of Infiltrative vs. In Situ Carcinoma through a Machine-Learning Approach. Appl. Sci. 2020, 10, 6109. Available online: https://www.mdpi.com/2076-3417/10/17/6109 (accessed on 6 August 2024).
- Tafuri, B.; Conte, L.; Portaluri, M.; Galiano, A.; Maggiulli, E.; De Nunzio, G. Radiomics for the Discrimination of Infiltrative vs. In Situ Breast Cancer. Biomed. J. Sci. Tech. Res. 2019, 24, 17890–17893. [Google Scholar]
- Conte, L.; Rizzo, E.; Grassi, T.; Bagordo, F.; De Matteis, E.; De Nunzio, G. Artificial Intelligence Techniques and Pedigree Charts in Oncogenetics: Towards an Experimental Multioutput Software System for Digitization and Risk Prediction. Computation 2024, 12, 47. Available online: https://www.mdpi.com/2079-3197/12/3/47 (accessed on 6 August 2024). [CrossRef]
- Hereditary Breast Cancer and BRCA Genes. Centers for Disease Control and Prevention 2023. Available online: https://www.cdc.gov/cancer/breast/young_women/bringyourbrave/hereditary_breast_cancer/index.htm (accessed on 6 August 2024).
- Baretta, Z.; Mocellin, S.; Goldin, E.; Olopade, O.I.; Huo, D. Effect of BRCA germline mutations on breast cancer prognosis: A systematic review and meta-analysis. Medicine 2016, 95, e4975. Available online: http://www.ncbi.nlm.nih.gov/pubmed/27749552 (accessed on 6 August 2024). [CrossRef]
- Gail, M.H.; Brinton, L.A.; Byar, D.P.; Corle, D.K.; Green, S.B.; Schairer, C.; Mulvihill, J.J. Projecting Individualized Probabilities of Developing Breast Cancer for White Females Who Are Being Examined Annually. JNCI J. Natl. Cancer Inst. 1989, 81, 1879–1886. Available online: https://academic.oup.com/jnci/article-lookup/doi/10.1093/jnci/81.24.1879 (accessed on 6 August 2024). [CrossRef]
- Claus, E.B.; Risch, N.; Thompson, W.D. The calculation of breast cancer risk for women with a first degree family history of ovarian cancer. Breast Cancer Res. Treat. 1993, 28, 115–120. Available online: http://link.springer.com/10.1007/BF00666424 (accessed on 6 August 2024). [CrossRef] [PubMed]
- Antoniou, A.C.; Cunningham, A.P.; Peto, J.; Evans, D.G.; Lalloo, F.; Narod, S.A.; A Risch, H.; E Eyfjord, J.; Hopper, J.L.; Southey, M.C.; et al. The BOADICEA model of genetic susceptibility to breast and ovarian cancers: Updates and extensions. Br. J. Cancer 2008, 98, 1457–1466. Available online: https://www.nature.com/articles/6604305 (accessed on 6 August 2024). [CrossRef] [PubMed]
- Ahn, J.S.; Shin, S.; Yang, S.-A.; Park, E.K.; Kim, K.H.; Cho, S.I.; Ock, C.-Y.; Kim, S. Artificial Intelligence in Breast Cancer Diagnosis and Personalized Medicine. J. Breast Cancer 2023, 26, 405–435. Available online: http://www.ncbi.nlm.nih.gov/pubmed/37926067 (accessed on 6 August 2024). [CrossRef] [PubMed]
- Wang, X.; Huang, Y.; Li, L.; Dai, H.; Song, F.; Chen, K. Assessment of performance of the Gail model for predicting breast cancer risk: A systematic review and meta-analysis with trial sequential analysis. Breast Cancer Res. 2018, 20, 18. Available online: http://www.ncbi.nlm.nih.gov/pubmed/29534738 (accessed on 6 August 2024). [CrossRef]
- Amir, E.; Evans, D.G.; Shenton, A.; Lalloo, F.; Moran, A.; Boggis, C.; Wilson, M.; Howell, A. Evaluation of breast cancer risk assessment packages in the family history evaluation and screening programme. J. Med. Genet. 2003, 40, 807–814. Available online: http://www.ncbi.nlm.nih.gov/pubmed/14627668 (accessed on 6 August 2024). [CrossRef]
- Brentnall, A.R.; Harkness, E.F.; Astley, S.M.; Donnelly, L.S.; Stavrinos, P.; Sampson, S.; Fox, L.; Sergeant, J.C.; Harvie, M.N.; Wilson, M.; et al. Mammographic density adds accuracy to both the Tyrer-Cuzick and Gail breast cancer risk models in a prospective UK screening cohort. Breast Cancer Res. 2015, 17, 147. Available online: http://www.ncbi.nlm.nih.gov/pubmed/26627479 (accessed on 6 August 2024). [CrossRef]
- Meads, C.; Ahmed, I.; Riley, R.D. A systematic review of breast cancer incidence risk prediction models with meta-analysis of their performance. Breast Cancer Res. Treat. 2012, 132, 365–377. Available online: http://www.ncbi.nlm.nih.gov/pubmed/22037780 (accessed on 6 August 2024). [CrossRef]
- Tice, J.A.; Cummings, S.R.; Smith-Bindman, R.; Ichikawa, L.; Barlow, W.E.; Kerlikowske, K. Using clinical factors and mammographic breast density to estimate breast cancer risk: Development and validation of a new predictive model. Ann. Intern. Med. 2008, 148, 337–347. Available online: http://www.ncbi.nlm.nih.gov/pubmed/18316752 (accessed on 6 August 2024). [CrossRef]
- Lee, A.J.; Cunningham, A.P.; Tischkowitz, M.; Simard, J.; Pharoah, P.D.; Easton, D.F.; Antoniou, A.C. Incorporating truncating variants in PALB2, CHEK2, and ATM into the BOADICEA breast cancer risk model. Genet. Med. 2016, 18, 1190–1198. Available online: https://linkinghub.elsevier.com/retrieve/pii/S1098360021014118 (accessed on 6 August 2024). [CrossRef]
- Brentnall, A.R.; Cuzick, J. Risk Models for Breast Cancer and Their Validation. Stat. Sci. 2020, 35, 14–30. Available online: http://www.ncbi.nlm.nih.gov/pubmed/32226220 (accessed on 6 August 2024). [CrossRef]
- Parmigiani, G.; Berry, D.A.; Aguilar, O. Determining Carrier Probabilities for Breast Cancer–Susceptibility Genes BRCA1 and BRCA2. Am. J. Hum. Genet. 1998, 62, 145–158. Available online: https://linkinghub.elsevier.com/retrieve/pii/S0002929707601323 (accessed on 6 August 2024). [CrossRef] [PubMed]
- Tyrer, J.; Duffy, S.W.; Cuzick, J. A breast cancer prediction model incorporating familial and personal risk factors. Stat. Med. 2004, 23, 1111–1130. [Google Scholar] [CrossRef] [PubMed]
- Mavaddat, N.; Michailidou, K.; Dennis, J.; Fachal, L.; Lee, A.; Tyrer, J.P.; Chen, T.-H.; Wang, Q.; Bolla, M.K.; Yang, X.; et al. Polygenic Risk Scores for Prediction of Breast Cancer and Breast Cancer Subtypes. Am. J. Hum. Genet. 2019, 104, 21–34. Available online: https://linkinghub.elsevier.com/retrieve/pii/S0002929718304051 (accessed on 6 August 2024). [CrossRef] [PubMed]
- Tice, J.A.; Miglioretti, D.L.; Li, C.-S.; Vachon, C.M.; Gard, C.C.; Kerlikowske, K. Breast Density and Benign Breast Disease: Risk Assessment to Identify Women at High Risk of Breast Cancer. J. Clin. Oncol. 2015, 33, 3137–3143. [Google Scholar] [CrossRef]
- Rice, M.S.; Tworoger, S.S.; Hankinson, S.E.; Tamimi, R.M.; Eliassen, A.H.; Willett, W.C.; Colditz, G.; Rosner, B. Breast cancer risk prediction: An update to the Rosner–Colditz breast cancer incidence model. Breast Cancer Res. Treat. 2017, 166, 227–240. Available online: http://link.springer.com/10.1007/s10549-017-4391-5 (accessed on 6 August 2024). [CrossRef]
- Zhang, X.; Rice, M.; Tworoger, S.S.; Rosner, B.A.; Eliassen, A.H.; Tamimi, R.M.; Joshi, A.D.; Lindstrom, S.; Qian, J.; Colditz, G.A.; et al. Addition of a polygenic risk score, mammographic density, and endogenous hormones to existing breast cancer risk prediction models: A nested case–control study. Zheng W, editor. PLoS Med. 2018, 15, e1002644. [Google Scholar] [CrossRef]
- Rockhill, B.; Spiegelman, D.; Byrne, C.; Hunter, D.J.; Colditz, G.A. Validation of the Gail et al. Model of Breast Cancer Risk Prediction and Implications for Chemoprevention. JNCI J. Natl. Cancer Inst. 2001, 93, 358–366. Available online: https://academic.oup.com/jnci/article-lookup/doi/10.1093/jnci/93.5.358 (accessed on 6 August 2024). [CrossRef]
- Sharpe, M.; Strong, V.; Allen, K.; Rush, R.; Postma, K.; Tulloh, A.; Maguire, P.; House, A.; Ramirez, A.; Cull, A. Major depression in outpatients attending a regional cancer centre: Screening and unmet treatment needs. Br. J. Cancer 2004, 90, 314–320. Available online: https://www.nature.com/articles/6601578 (accessed on 6 August 2024). [CrossRef]
- Gray, S.W.; Martins, Y.; Feuerman, L.Z.; Biesecker, B.B.; Christensen, K.D.; Joffe, S.; Rini, C.; Veenstra, D.; McGuire, A.L. Social and behavioral research in genomic sequencing: Approaches from the Clinical Sequencing Exploratory Research Consortium Outcomes and Measures Working Group. Genet. Med. 2014, 16, 727–735. Available online: https://linkinghub.elsevier.com/retrieve/pii/S1098360021031725 (accessed on 6 August 2024). [CrossRef]
- Lazzeroni, L.C. Linkage Disequilibrium and Gene Mapping: An Empirical Least-Squares Approach. Am. J. Hum. Genet. 1998, 62, 159–170. Available online: https://linkinghub.elsevier.com/retrieve/pii/S0002929707601335 (accessed on 6 August 2024). [CrossRef]
- Euhus, D.M.; Smith, K.C.; Robinson, L.; Stucky, A.; Olopade, O.I.; Cummings, S.; Garber, J.E.; Chittenden, A.; Mills, G.B.; Rieger, P.; et al. Pretest Prediction of BRCA1 or BRCA2 Mutation by Risk Counselors and the Computer Model BRCAPRO. JNCI J. Natl. Cancer Inst. 2002, 94, 844–851. Available online: https://academic.oup.com/jnci/article/94/11/844/2519752 (accessed on 6 August 2024). [CrossRef] [PubMed]
- Jo, H.M.; Lee, E.H.; Ko, K.; Kang, B.J.; Cha, J.H.; Yi, A.; Jung, H.K.; Jun, J.K. Prevalence of Women with Dense Breasts in Korea: Results from a Nationwide Cross-sectional Study. Cancer Res. Treat. 2019, 51, 1295–1301. Available online: https://pubmed.ncbi.nlm.nih.gov/30699499/ (accessed on 6 August 2024). [CrossRef] [PubMed]
- Sprague, B.L.; Gangnon, R.E.; Burt, V.; Trentham-Dietz, A.; Hampton, J.M.; Wellman, R.D.; Kerlikowske, K.; Miglioretti, D.L. Prevalence of Mammographically Dense Breasts in the United States. JNCI J. Natl. Cancer Inst. 2014, 106, dju255. Available online: https://academic.oup.com/jnci/article-lookup/doi/10.1093/jnci/dju255 (accessed on 6 August 2024). [CrossRef] [PubMed]
- Rosner, B.; Colditz, G.A. Nurses’ Health Study: Log-Incidence Mathematical Model of Breast Cancer Incidence. JNCI J. Natl. Cancer Inst. 1996, 88, 359–364. [Google Scholar] [CrossRef]
- Habel, L.A.; Dignam, J.J.; Land, S.R.; Salane, M.; Capra, A.M.; Julian, T.B. Mammographic Density and Breast Cancer After Ductal Carcinoma In Situ. JNCI J. Natl. Cancer Inst. 2004, 96, 1467–1472. [Google Scholar] [CrossRef]
- Ming, C.; Viassolo, V.; Probst-Hensch, N.; Chappuis, P.O.; Dinov, I.D.; Katapodi, M.C. Machine learning techniques for personalized breast cancer risk prediction: Comparison with the BCRAT and BOADICEA models. Breast Cancer Res. 2019, 21, 75. [Google Scholar] [CrossRef]
- Rao, A.R.; Wang, H.; Gupta, C. Predictive Analysis for Optimizing Port Operations. Available online: http://arxiv.org/abs/2401.14498 (accessed on 25 January 2024).
- Yala, A.; Lehman, C.; Schuster, T.; Portnoi, T.; Barzilay, R. A Deep Learning Mammography-based Model for Improved Breast Cancer Risk Prediction. Radiology 2019, 292, 60–66. [Google Scholar] [CrossRef]
- Weng, S.F.; Reps, J.; Kai, J.; Garibaldi, J.M.; Qureshi, N. Can machine-learning improve cardiovascular risk prediction using routine clinical data? Liu B, editor. PLoS ONE 2017, 12, e0174944. [Google Scholar] [CrossRef]
- Feng, J.; Phillips, R.V.; Malenica, I.; Bishara, A.; Hubbard, A.E.; Celi, L.A.; Pirracchio, R. Clinical artificial intelligence quality improvement: Towards continual monitoring and updating of AI algorithms in healthcare. npj Digit. Med. 2022, 5, 66. Available online: https://www.nature.com/articles/s41746-022-00611-y (accessed on 6 August 2024). [CrossRef]
- Data Mining Elsevier; 2012. Available online: https://linkinghub.elsevier.com/retrieve/pii/C20090618195 (accessed on 6 August 2024).
- Hastie, T.; Tibshirabni, R.; Jerome, F. The Elements of Statistical Learning. Data Mining, Inference, and Prediction, 2nd ed.; Springer Series in Statistics; Springer: Berlin/Heidelberg, Germany, 2009. [Google Scholar]
- Han, J.; Kamber, M.; Pei, J. Data Mining. Concepts and Techniques, 3rd ed.; The Morgan Kaufmann Series in Data Management Systems; University of Illinois at Urbana-Champaign: Champaign, IL, USA, 2012. [Google Scholar]
- Sun, Y.-S.; Zhao, Z.; Yang, Z.-N.; Xu, F.; Lu, H.-J.; Zhu, Z.-Y.; Shi, W.; Jiang, J.; Yao, P.-P.; Zhu, H.-P. Risk Factors and Preventions of Breast Cancer. Int. J. Biol. Sci. 2017, 13, 1387–1397. Available online: http://www.ncbi.nlm.nih.gov/pubmed/29209143 (accessed on 6 August 2024). [CrossRef]
- Dehesh, T.; Fadaghi, S.; Seyedi, M.; Abolhadi, E.; Ilaghi, M.; Shams, P.; Ajam, F.; Mosleh-Shirazi, M.A.; Dehesh, P. The relation between obesity and breast cancer risk in women by considering menstruation status and geographical variations: A systematic review and meta-analysis. BMC Womens Health 2023, 23, 392. Available online: http://www.ncbi.nlm.nih.gov/pubmed/37496015 (accessed on 6 August 2024). [CrossRef] [PubMed]
- Cortesi, L.; Galli, G.R.; Domati, F.; Conte, L.; Manca, L.; Berio, M.A.; Toss, A.; Iannone, A.; Federico, M. Obesity in Postmenopausal Breast Cancer Patients: It Is Time to Improve Actions for a Healthier Lifestyle. The Results of a Comparison Between Two Italian Regions With Different “Presumed” Lifestyles. Front. Oncol. 2021, 11, 769683. [Google Scholar] [CrossRef] [PubMed]
- Chan, D.S.M.; Vieira, A.R.; Aune, D.; Bandera, E.V.; Greenwood, D.C.; McTiernan, A.; Rosenblatt, D.N.; Thune, I.; Vieira, R.; Norat, T. Body mass index and survival in women with breast cancer-systematic literature review and meta-analysis of 82 follow-up studies. Ann. Oncol. Off. J. Eur. Soc. Med. Oncol. 2014, 25, 1901–1914. Available online: http://www.ncbi.nlm.nih.gov/pubmed/24769692 (accessed on 6 August 2024). [CrossRef] [PubMed]
- Picon-Ruiz, M.; Morata-Tarifa, C.; Valle-Goffin, J.J.; Friedman, E.R.; Slingerland, J.M. Obesity and adverse breast cancer risk and outcome: Mechanistic insights and strategies for intervention. CA Cancer J. Clin. 2017, 67, 378–397. Available online: http://www.ncbi.nlm.nih.gov/pubmed/28763097 (accessed on 6 August 2024). [CrossRef]
- Lee, K.; Kruper, L.; Dieli-Conwright, C.M.; Mortimer, J.E. The Impact of Obesity on Breast Cancer Diagnosis and Treatment. Curr. Oncol. Rep. 2019, 21, 41. Available online: http://link.springer.com/10.1007/s11912-019-0787-1 (accessed on 6 August 2024). [CrossRef]
- Jones, M.E.; Schoemaker, M.J.; Wright, L.B.; Ashworth, A.; Swerdlow, A.J. Smoking and risk of breast cancer in the Generations Study cohort. Breast Cancer Res. 2017, 19, 118. Available online: http://www.ncbi.nlm.nih.gov/pubmed/29162146 (accessed on 6 August 2024). [CrossRef]
- Bishop, J.D.; Killelea, B.K.; Chagpar, A.B.; Horowitz, N.R.; Lannin, D.R. Smoking and breast cancer recurrence after breast conservation therapy. Int. J. Breast Cancer 2014, 2014, 327081. Available online: http://www.ncbi.nlm.nih.gov/pubmed/24693439 (accessed on 6 August 2024). [CrossRef]
- Padubidri, A.N.; Yetman, R.; Browne, E.; Lucas, A.; Papay, F.; Larive, B.; Zins, J. Complications of postmastectomy breast reconstructions in smokers, ex-smokers, and nonsmokers. Plast. Reconstr. Surg. 2001, 107, 342–349, discussion 350–351. Available online: http://www.ncbi.nlm.nih.gov/pubmed/11214048 (accessed on 6 August 2024). [CrossRef]
- Taylor, C.; Correa, C.; Duane, F.K.; Aznar, M.C.; Anderson, S.J.; Bergh, J.; Dodwell, D.; Ewertz, M.; Gray, R.; Jagsi, R.; et al. Estimating the Risks of Breast Cancer Radiotherapy: Evidence From Modern Radiation Doses to the Lungs and Heart and From Previous Randomized Trials. J. Clin. Oncol. 2017, 35, 1641–1649. Available online: http://www.ncbi.nlm.nih.gov/pubmed/28319436 (accessed on 6 August 2024). [CrossRef]
- Dall, G.V.; Britt, K.L. Estrogen Effects on the Mammary Gland in Early and Late Life and Breast Cancer Risk. Front. Oncol. 2017, 7, 110. Available online: http://www.ncbi.nlm.nih.gov/pubmed/28603694 (accessed on 6 August 2024). [CrossRef]
- Chowdhury, R.; Sinha, B.; Sankar, M.J.; Taneja, S.; Bhandari, N.; Rollins, N.; Bahl, R.; Martines, J. Breastfeeding and maternal health outcomes: A systematic review and meta-analysis. Acta Paediatr. 2015, 104, 96–113. Available online: http://www.ncbi.nlm.nih.gov/pubmed/26172878 (accessed on 6 August 2024). [CrossRef] [PubMed]
- Kim, S.; Ko, Y.; Lee, H.J.; Lim, J.-E. Menopausal hormone therapy and the risk of breast cancer by histological type and race: A meta-analysis of randomized controlled trials and cohort studies. Breast Cancer Res. Treat. 2018, 170, 667–675. Available online: http://www.ncbi.nlm.nih.gov/pubmed/29713854 (accessed on 6 August 2024). [CrossRef] [PubMed]
- Yuan, X.; Yi, F.; Hou, C.; Lee, H.; Zhong, X.; Tao, P.; Li, H.; Xu, Z.; Li, J. Induced Abortion, Birth Control Methods, and Breast Cancer Risk: A Case-Control Study in China. J. Epidemiol. 2019, 29, 173–179. Available online: http://www.ncbi.nlm.nih.gov/pubmed/30101815 (accessed on 6 August 2024). [CrossRef] [PubMed]
- Fitzpatrick, D.; Pirie, K.; Reeves, G.; Green, J.; Beral, V. Combined and progestagen-only hormonal contraceptives and breast cancer risk: A UK nested case-control study and meta-analysis. PLoS Med. 2023, 20, e1004188. Available online: http://www.ncbi.nlm.nih.gov/pubmed/36943819 (accessed on 6 August 2024). [CrossRef] [PubMed]
- Menarche, menopause, and breast cancer risk: Individual participant meta-analysis, including 118 964 women with breast cancer from 117 epidemiological studies. Lancet Oncol. 2012, 13, 1141–1151. Available online: https://linkinghub.elsevier.com/retrieve/pii/S1470204512704254 (accessed on 6 August 2024). [CrossRef]
- Huber, D.; Seitz, S.; Kast, K.; Emons, G.; Ortmann, O. Hormone replacement therapy in BRCA mutation carriers and risk of ovarian, endometrial, and breast cancer: A systematic review. J. Cancer Res. Clin. Oncol. 2021, 147, 2035–2045. Available online: http://www.ncbi.nlm.nih.gov/pubmed/33885953 (accessed on 6 August 2024). [CrossRef]
- Deli, T.; Orosz, M.; Jakab, A. Hormone Replacement Therapy in Cancer Survivors—Review of the Literature. Pathol. Oncol. Res. 2020, 26, 63–78. Available online: http://www.ncbi.nlm.nih.gov/pubmed/30617760 (accessed on 6 August 2024). [CrossRef]
- Conte, L.; Lupo, R.; Lezzi, A.; Paolo, V.; Rubbi, I.; Rizzo, E.; Carvello, M.; Calabrò, A.; Botti, S.; De Matteis, E.; et al. A Nationwide Cross-Sectional Study Investigating Adherence to the Mediterranean Diet, Smoking, Alcohol and Work Habits, Hormonal dynamics between Breast Cancer Cases and Healthy Subjects. Clin. Nutr. Open Sci. 2024, 55, 1–19. Available online: https://linkinghub.elsevier.com/retrieve/pii/S2667268524000135 (accessed on 6 August 2024). [CrossRef]

| Group A Healthy Subjects with a Family History of Breast Cancer (n = 473) N (%) | Group B Subjects with Cancer (n = 916) N (%) | p-Value | |
|---|---|---|---|
| Age | <0.001 *** | ||
| Range | 18–93 | 26–95 | |
| Median | 47.00 | 55.53 | |
| STD | 16.47 | 12.44 | |
| Indicate body weight (kg) | 0.26 | ||
| Range | 40–130 | 42–154 | |
| Median | 64.00 | 67.00 | |
| STD | 15.44 | 14.22 | |
| Indicates height (cm) | 0.02 * | ||
| Range | 146–183 | 144–188 | |
| Median | 165.00 | 162.00 | |
| STD | 6.20 | 6.42 | |
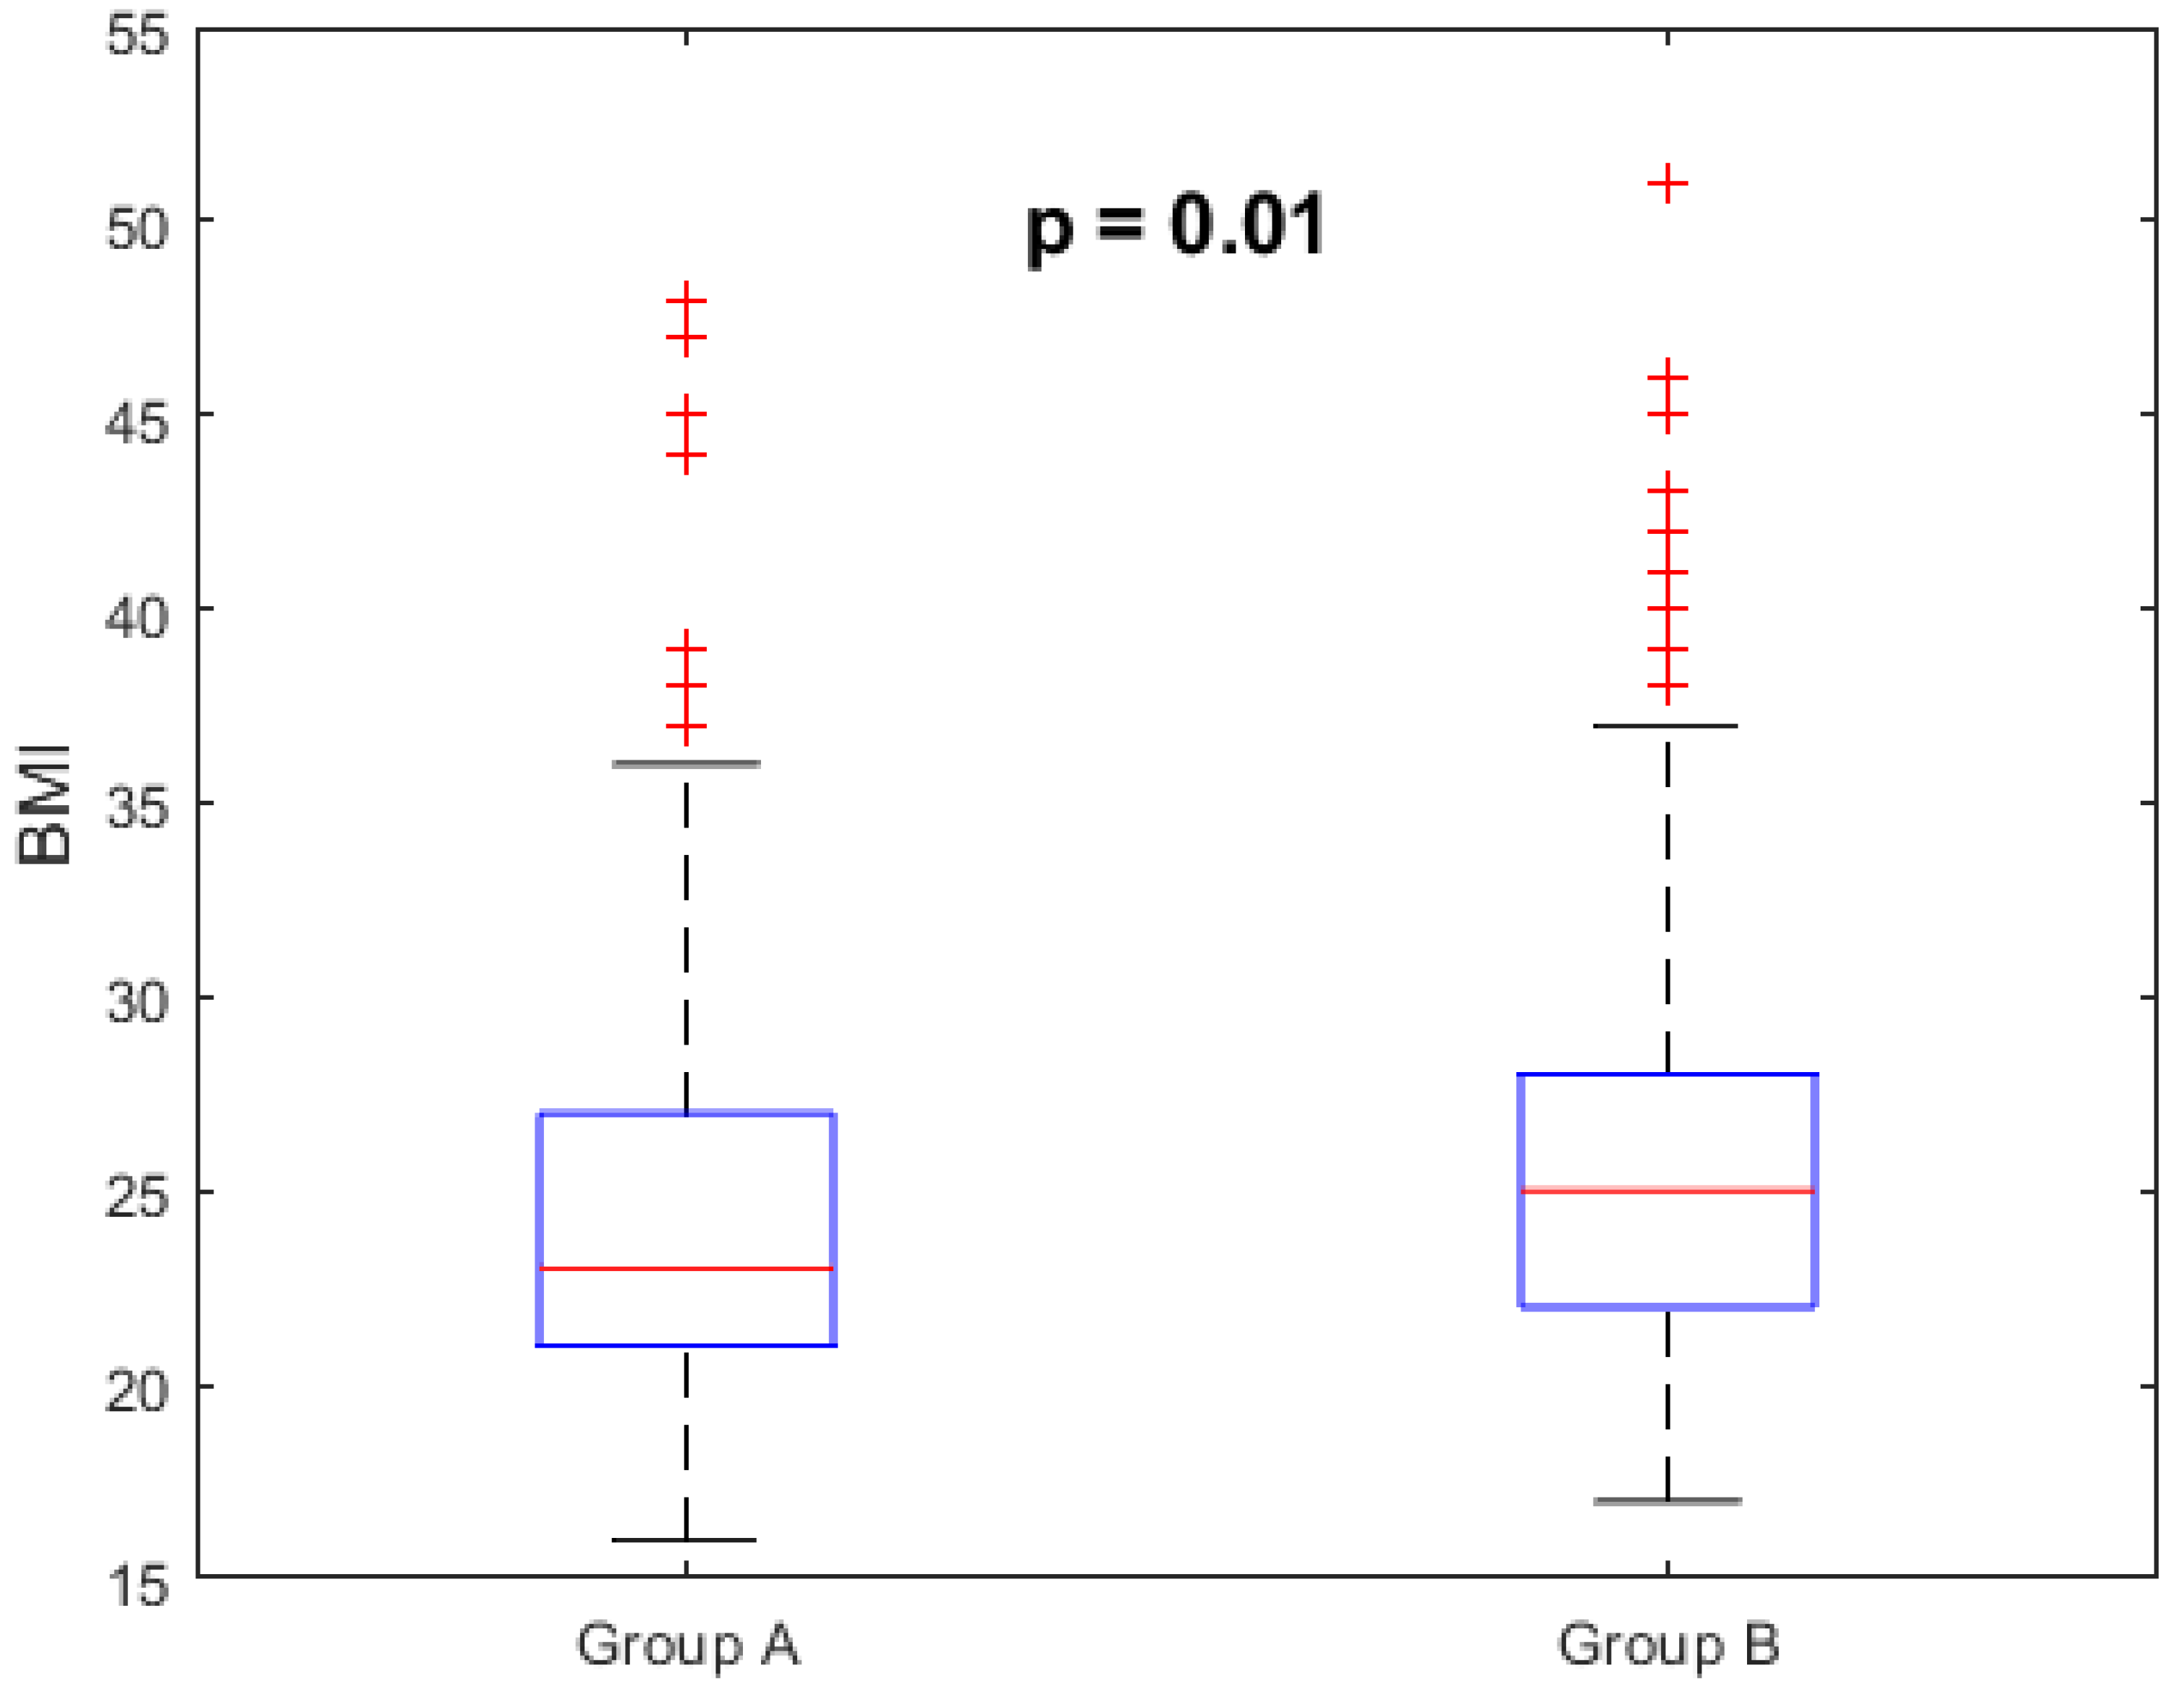
| Body mass index (BMI) | 0.01 ** | ||
| Range | 16–48 | 17–69 | |
| Median | 23.45 | 25.87 | |
| STD | 6.08 | 5.34 | |
| Being a smoker | 0.28 | ||
| No | 130 (27.5) | 455 (49.7) | |
| Yes | 36 (7.6) | 100 (10.9) | |
| Ex-smoker | 24 (5.1) | 106 (11.6) | |
| Missing | 283 (59.8) | 255 (27.8) | |
| Smoking duration (years) | 0.009 ** | ||
| Range | 1–46 | 2–61 | |
| Median | 15.00 | 20.00 | |
| STD | 11.99 | 11.90 | |
| Number of cigarettes smoked | 0.91 | ||
| Range | 1–30 | 1–40 | |
| Median | 10.00 | 10.00 | |
| STD | 6.26 | 6.56 |
| Group A Healthy Subjects with a Family History of Breast Cancer (n = 473) N (%) | Group B Subjects with Cancer (n = 916) N (%) | p-Value | |
|---|---|---|---|
| Age at menarche <45 Range Median STD ≥45 Range Median STD | 9–16 12.00 1.43 9–17 12.41 12.00 | 9–16 12.00 1.53 9–18 12.44 12.00 | 0.40 0.79 |
| Number of pregnancies <45 Range Median STD ≥45 Range Median STD | 0–3 1.00 0.96 0–11 2.00 1.48 | 0–4 1.00 0.96 0–9 2.00 1.31 | 0.65 0.28 |
| Age at first pregnancy <45 Range Median STD ≥45 Range Median STD | 18–38 29.00 4.78 16–44 25.00 5.93 | 13–42 29.00 5.80 13–55 26.00 6.01 | 0.55 0.20 |
| Number of abortions <45 Range Median STD ≥45 Range Median STD | 0–3 0.29 0.56 0–6 0.71 1.07 | 0–4 0.39 0.76 0–10 0.72 1.20 | 0.62 0.74 |
| Did you breastfeed your children? <45 No Yes ≥45 No Yes Missing | 182 (85) 32 (15) 180 (74.1) 63 (25.9) 16 (3.4) | 108 (57.8) 79 (42.2) 342 (47.9) 372 (52.1) 15 (1.6) | <0.001 *** <0.001 *** |
| If you answered yes to the previous question, please indicate the duration in months <45 Range Median STD ≥45 Range Median STD | 1–44 11.00 13.75 1–50 6.00 11.42 | 1–66 9.00 13.87 1–60 8.00 9.31 | 0.74 0.49 |
| Are you in the age of menopause? <45 No Yes ≥45 No Yes Missing | 212 (99.1) 2 (0.9) 183 (75.3) 60 (24.7) 16 (3.4) | 148 (79.1) 39 (20.9) 323 (45.2) 391 (54.8) 15 (1.6) | <0.001 *** <0.001 *** |
| Indicate the age at menopause <45 Range Median STD ≥45 Range Median STD | 39–41 40.00 1.41 30–59 50.00 5.10 | 33–44 39.00 2.93 33–66 50.00 4.47 | 0.71 0.12 |
| Contraceptives assumption <45 No Yes ≥45 No Yes Missing | 189 (88.3) 25 (11.7) 224 (92.2) 19 (7.8) 16 (3.4) | 135 (72.2) 52 (27.8) 592 (82.9) 122 (17.1) 15 (1.6) | <0.001 *** <0.001 *** |
| Hormonal stimulation for assisted reproduction (PMA) <45 No Yes ≥45 No Yes Missing | 211 (98.3) 3 (1.4) 242 (99.6) 1 (0.4) 16 (3.4) | 178 (95.2) 9 (4.8) 700 (98) 114 (2) 15 (1.6) | 0.05 * 0.98 |
| Hormonal replacement therapy <45 No Yes ≥45 No Yes Missing | 212 (99.1) 2 (0.9) 241 (99.2) 2 (0.8) 16 (3.4) | 172 (92) 15 (8) 668 (93.6) 46 (6.4) 15 (1.6) | <0.001 *** <0.001 *** |
| Group A Healthy Subjects with a Family History of Breast Cancer (n = 473) N (%) | Group B Subjects with Cancer (n = 916) N (%) | p-Value | |
|---|---|---|---|
| Mutation outcomes | <0.001 *** | ||
| Negative | 162 (34.2) | 640 (69.9) | |
| Positive | 194 (41.0) | 115 (12.6) | |
| VUSs | 8 (1.7) | 50 (5.5) | |
| Not screened | 109 (23) | 111 (12.1) | |
| Specific found mutations | <0.001 *** | ||
| BRCA1 | 118 (58.4) | 75 (45.4) | |
| BRCA2 | 83 (41.0) | 87 (52.7) | |
| BRCA1/2 | 1 (0.5) | 3 (1.8) |
Disclaimer/Publisher’s Note: The statements, opinions and data contained in all publications are solely those of the individual author(s) and contributor(s) and not of MDPI and/or the editor(s). MDPI and/or the editor(s) disclaim responsibility for any injury to people or property resulting from any ideas, methods, instructions or products referred to in the content. |
© 2024 by the authors. Licensee MDPI, Basel, Switzerland. This article is an open access article distributed under the terms and conditions of the Creative Commons Attribution (CC BY) license (https://creativecommons.org/licenses/by/4.0/).
Share and Cite
Conte, L.; Rizzo, E.; Civino, E.; Tarantino, P.; De Nunzio, G.; De Matteis, E. Enhancing Breast Cancer Risk Prediction with Machine Learning: Integrating BMI, Smoking Habits, Hormonal Dynamics, and BRCA Gene Mutations—A Game-Changer Compared to Traditional Statistical Models? Appl. Sci. 2024, 14, 8474. https://doi.org/10.3390/app14188474
Conte L, Rizzo E, Civino E, Tarantino P, De Nunzio G, De Matteis E. Enhancing Breast Cancer Risk Prediction with Machine Learning: Integrating BMI, Smoking Habits, Hormonal Dynamics, and BRCA Gene Mutations—A Game-Changer Compared to Traditional Statistical Models? Applied Sciences. 2024; 14(18):8474. https://doi.org/10.3390/app14188474
Chicago/Turabian StyleConte, Luana, Emanuele Rizzo, Emanuela Civino, Paolo Tarantino, Giorgio De Nunzio, and Elisabetta De Matteis. 2024. "Enhancing Breast Cancer Risk Prediction with Machine Learning: Integrating BMI, Smoking Habits, Hormonal Dynamics, and BRCA Gene Mutations—A Game-Changer Compared to Traditional Statistical Models?" Applied Sciences 14, no. 18: 8474. https://doi.org/10.3390/app14188474