A Novel Technique Using Confocal Raman Spectroscopy Coupled with PLS-DA to Identify the Types of Sugar in Three Tropical Fruits

 ,
,  , , , and
Abstract
1. Introduction
2. Materials and Methods
2.1. Reagents
2.2. Fruit Sampling
2.3. Raman Spectroscopy (RS)
2.4. Chemometric Analysis
3. Results and Discussion
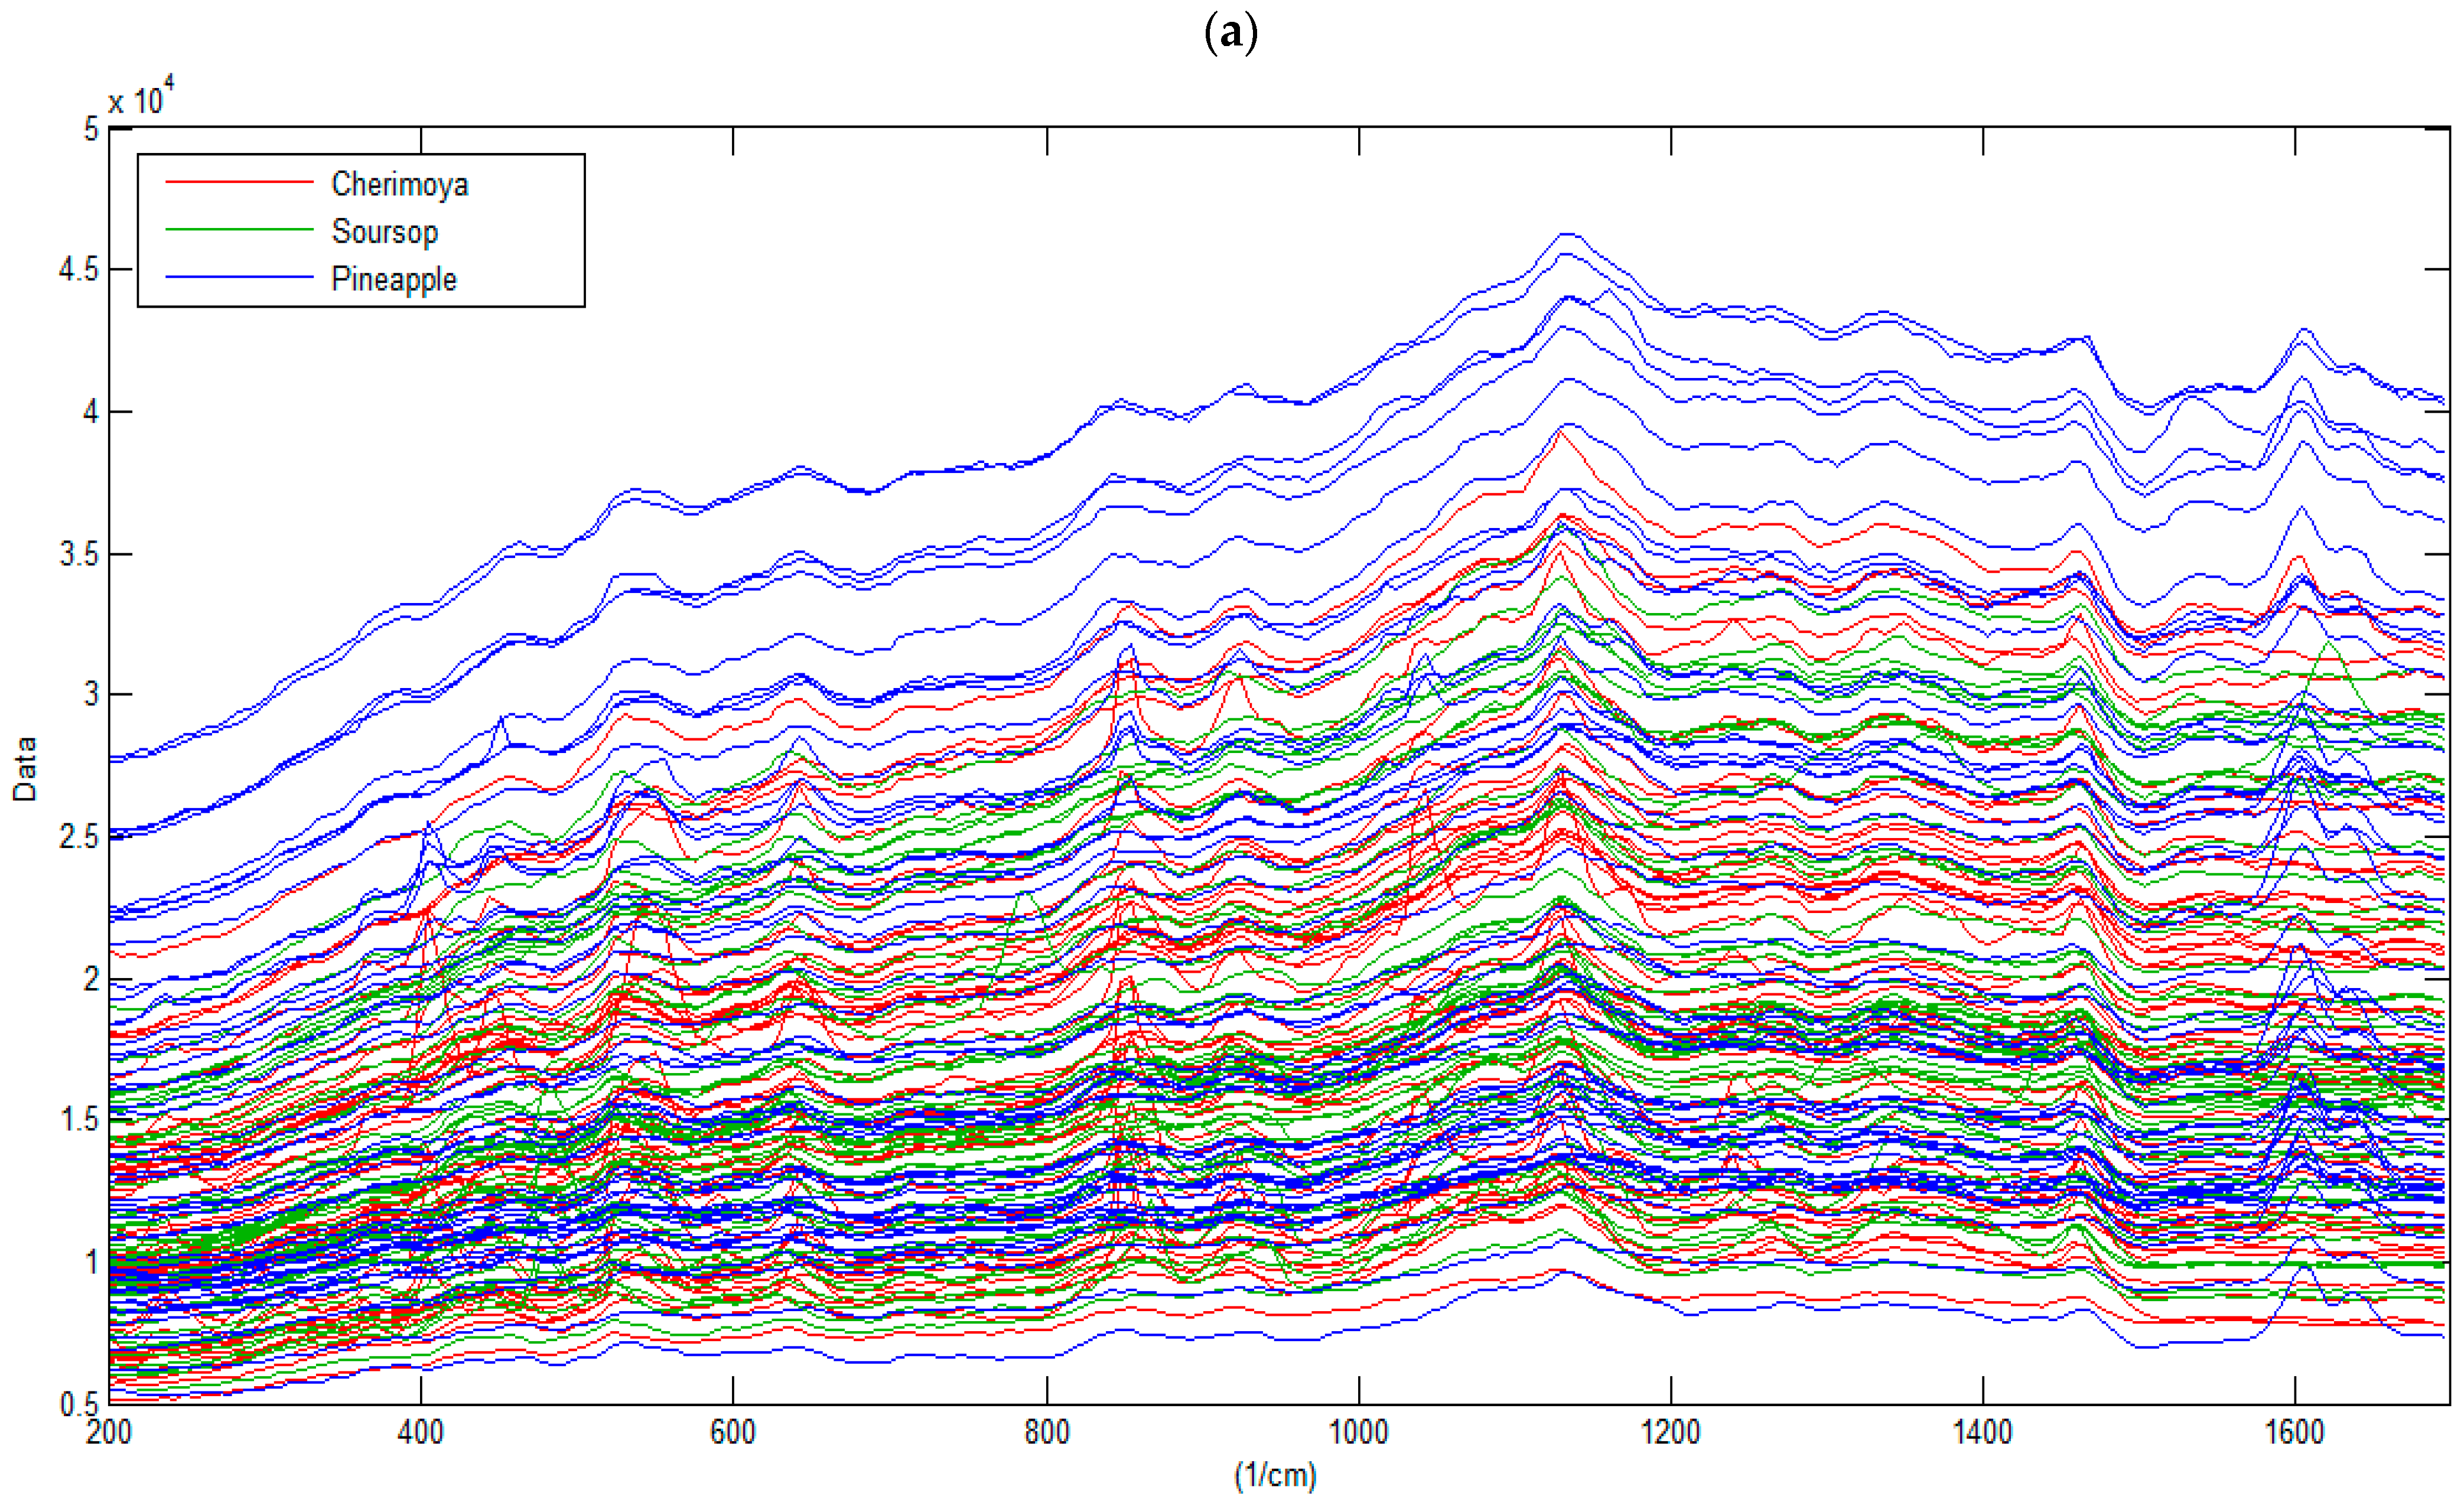
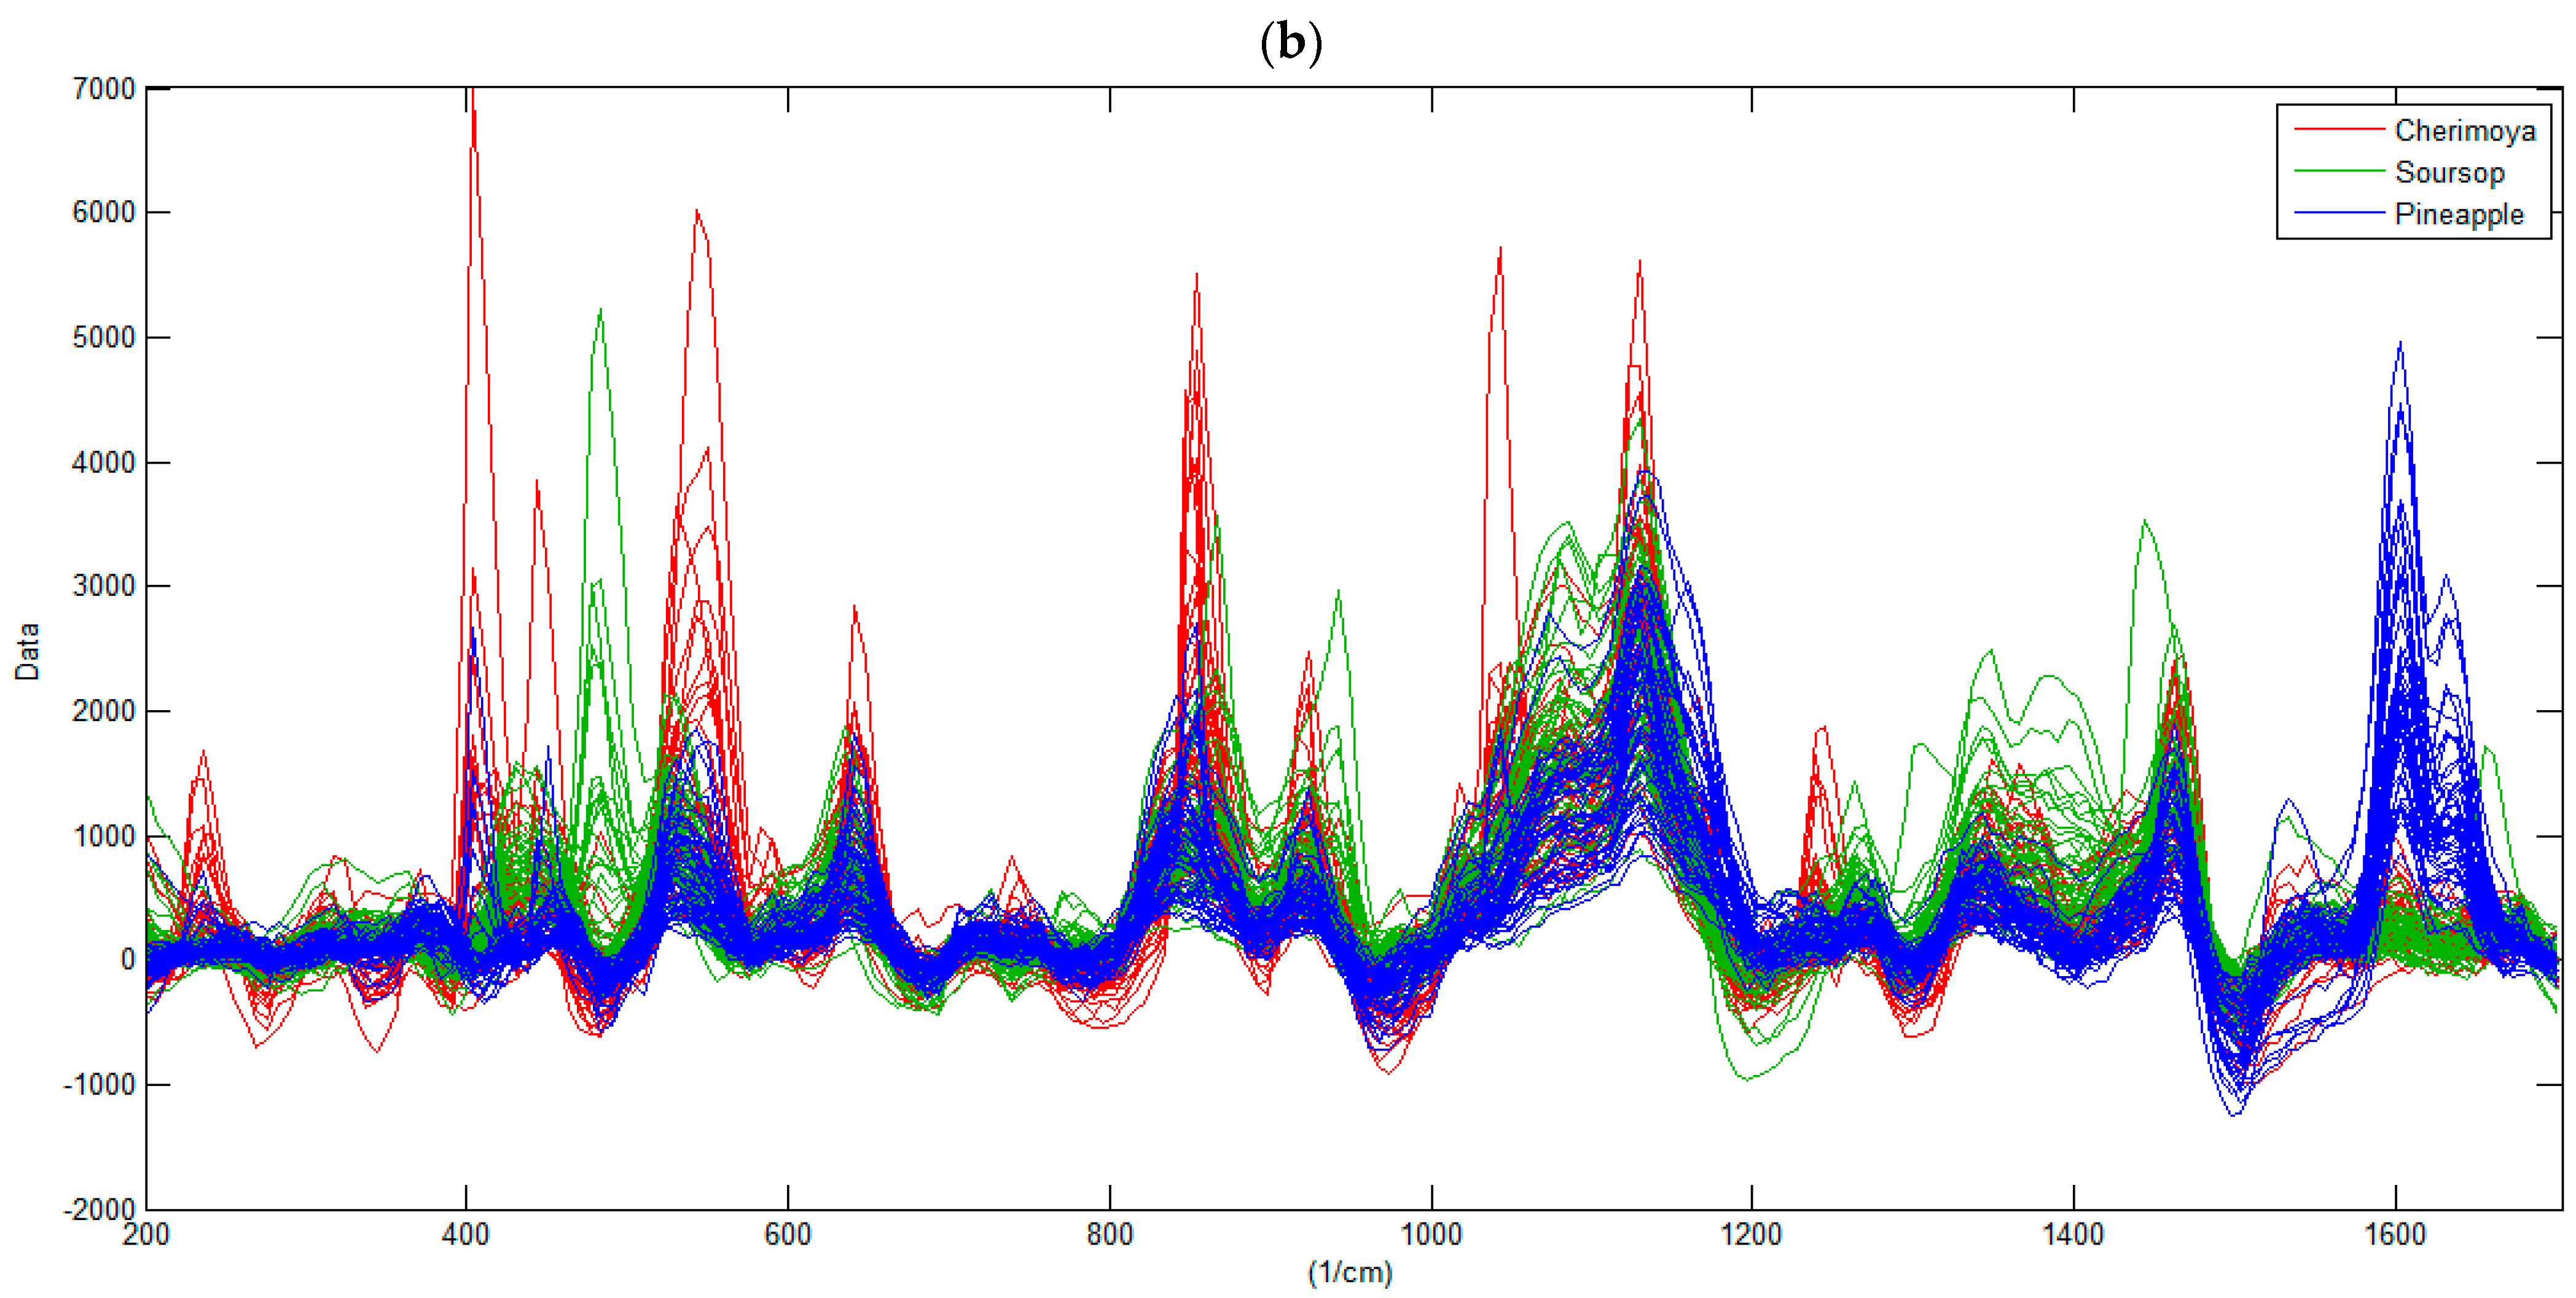
3.1. Characterization of the Raman Spectra of Fruits
3.2. Multivariate Analysis
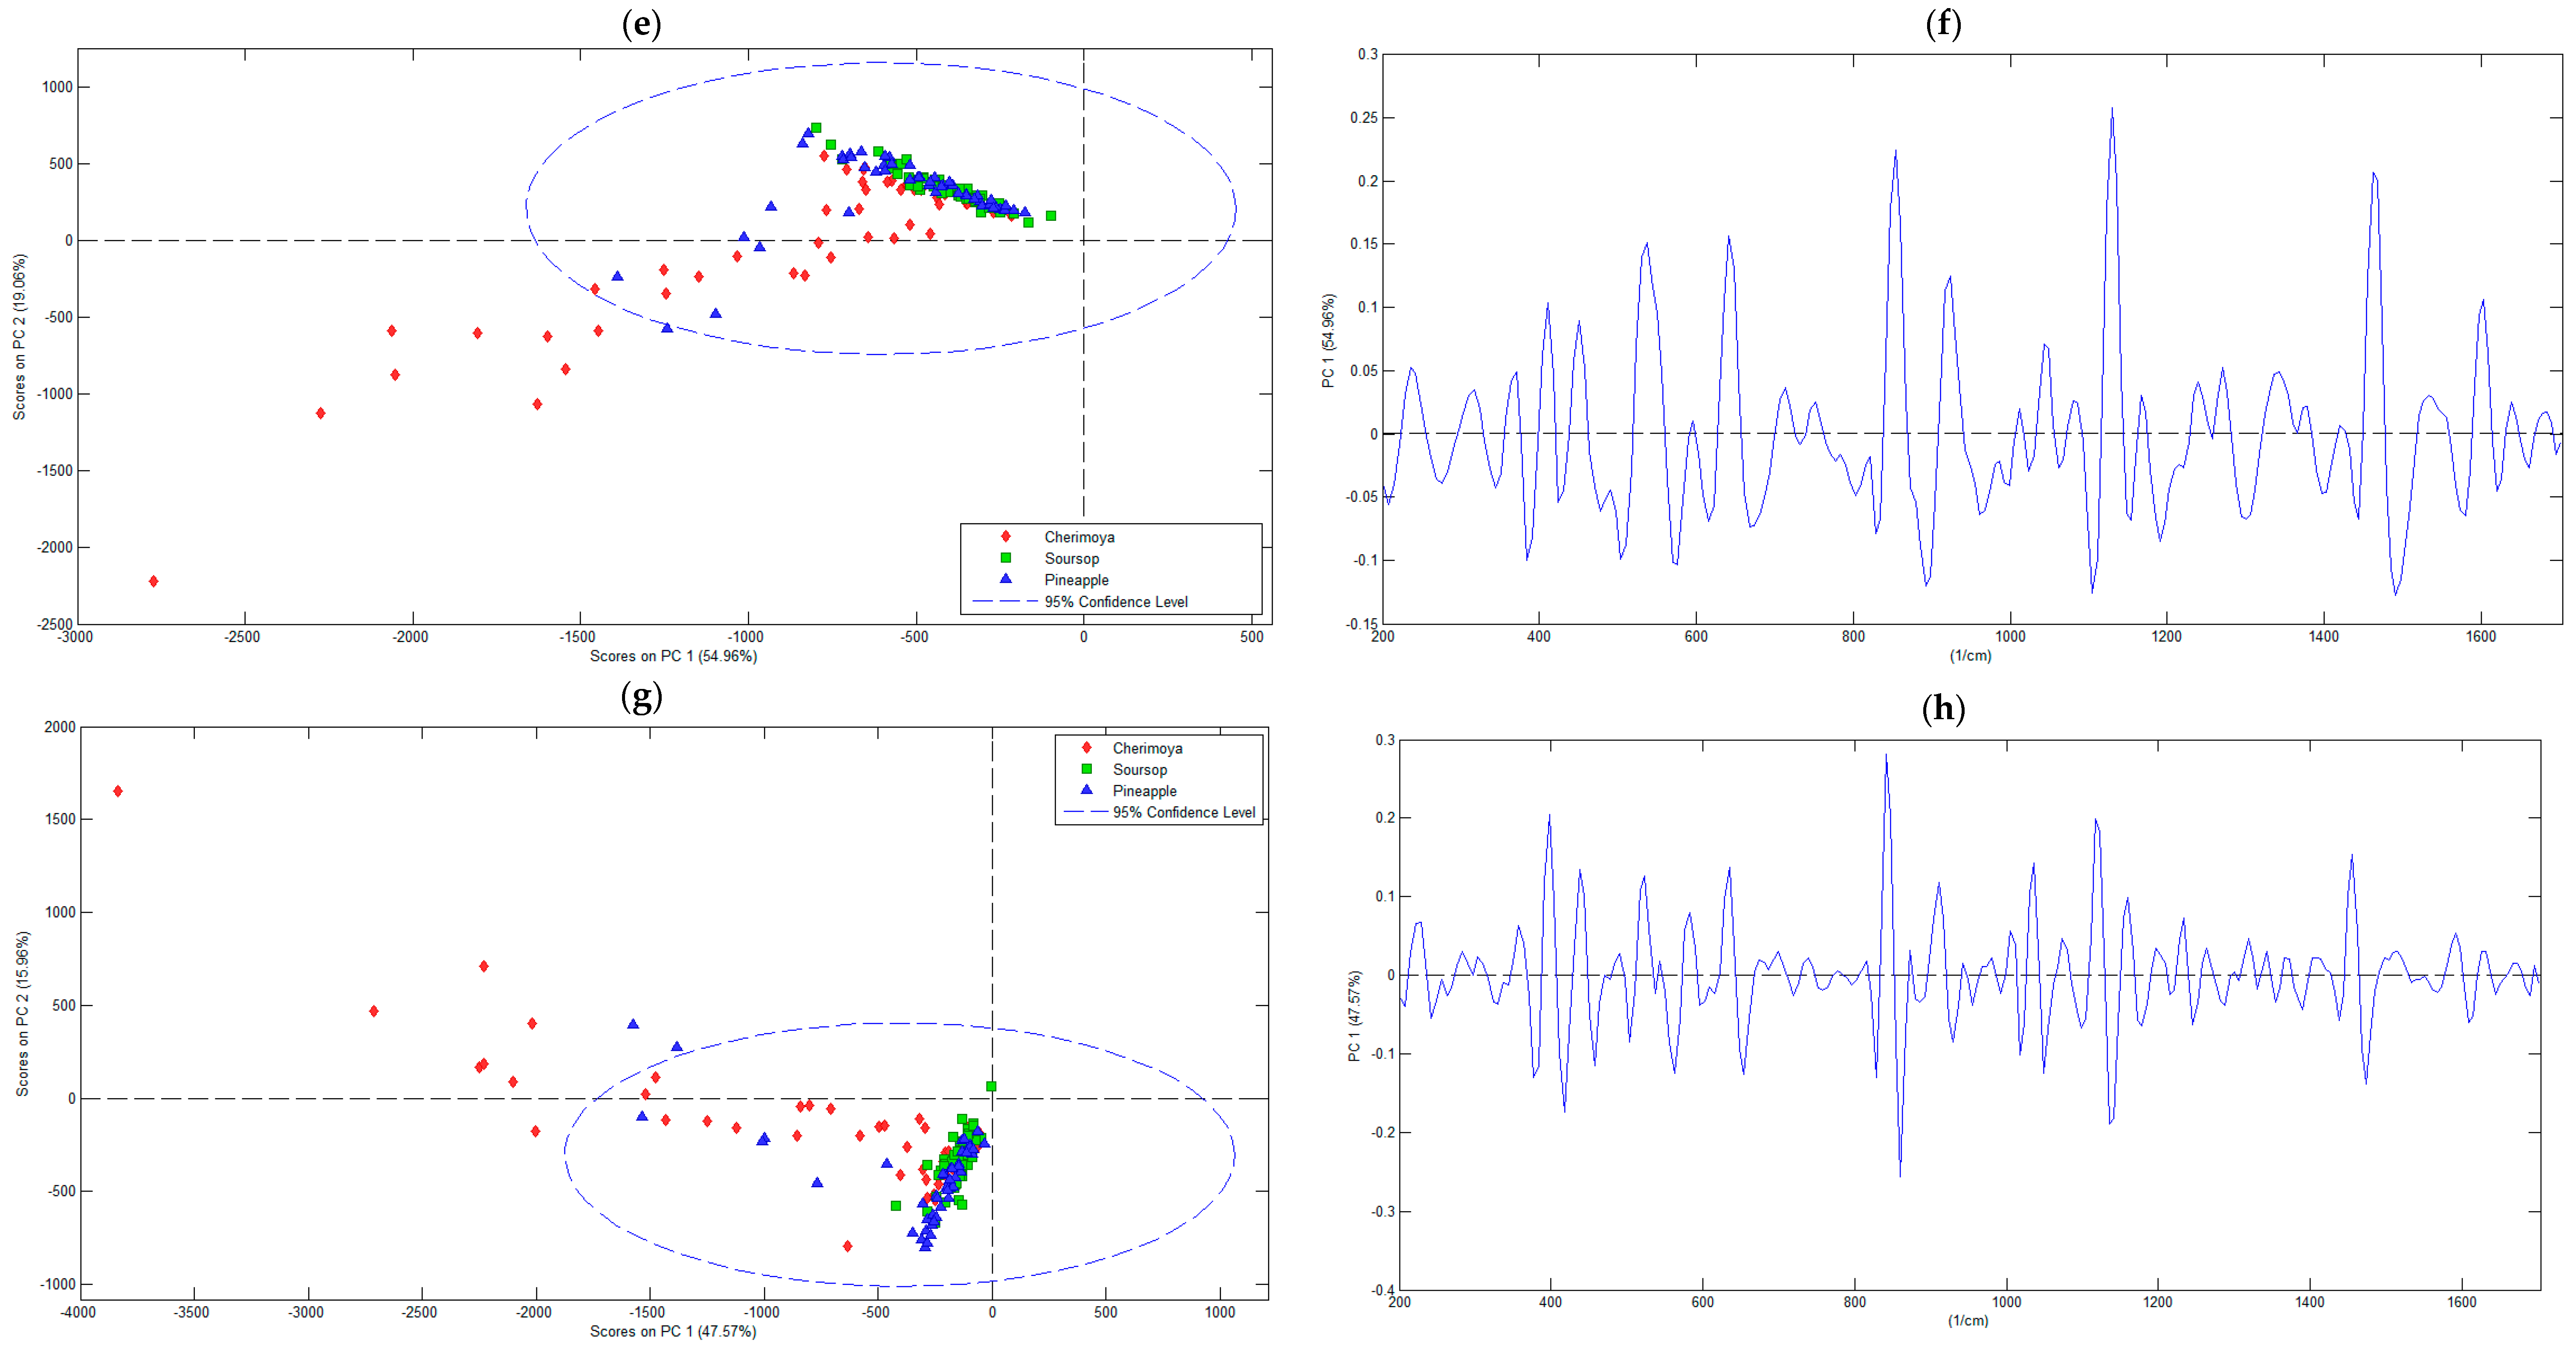
3.2.1. Principal Component Analysis
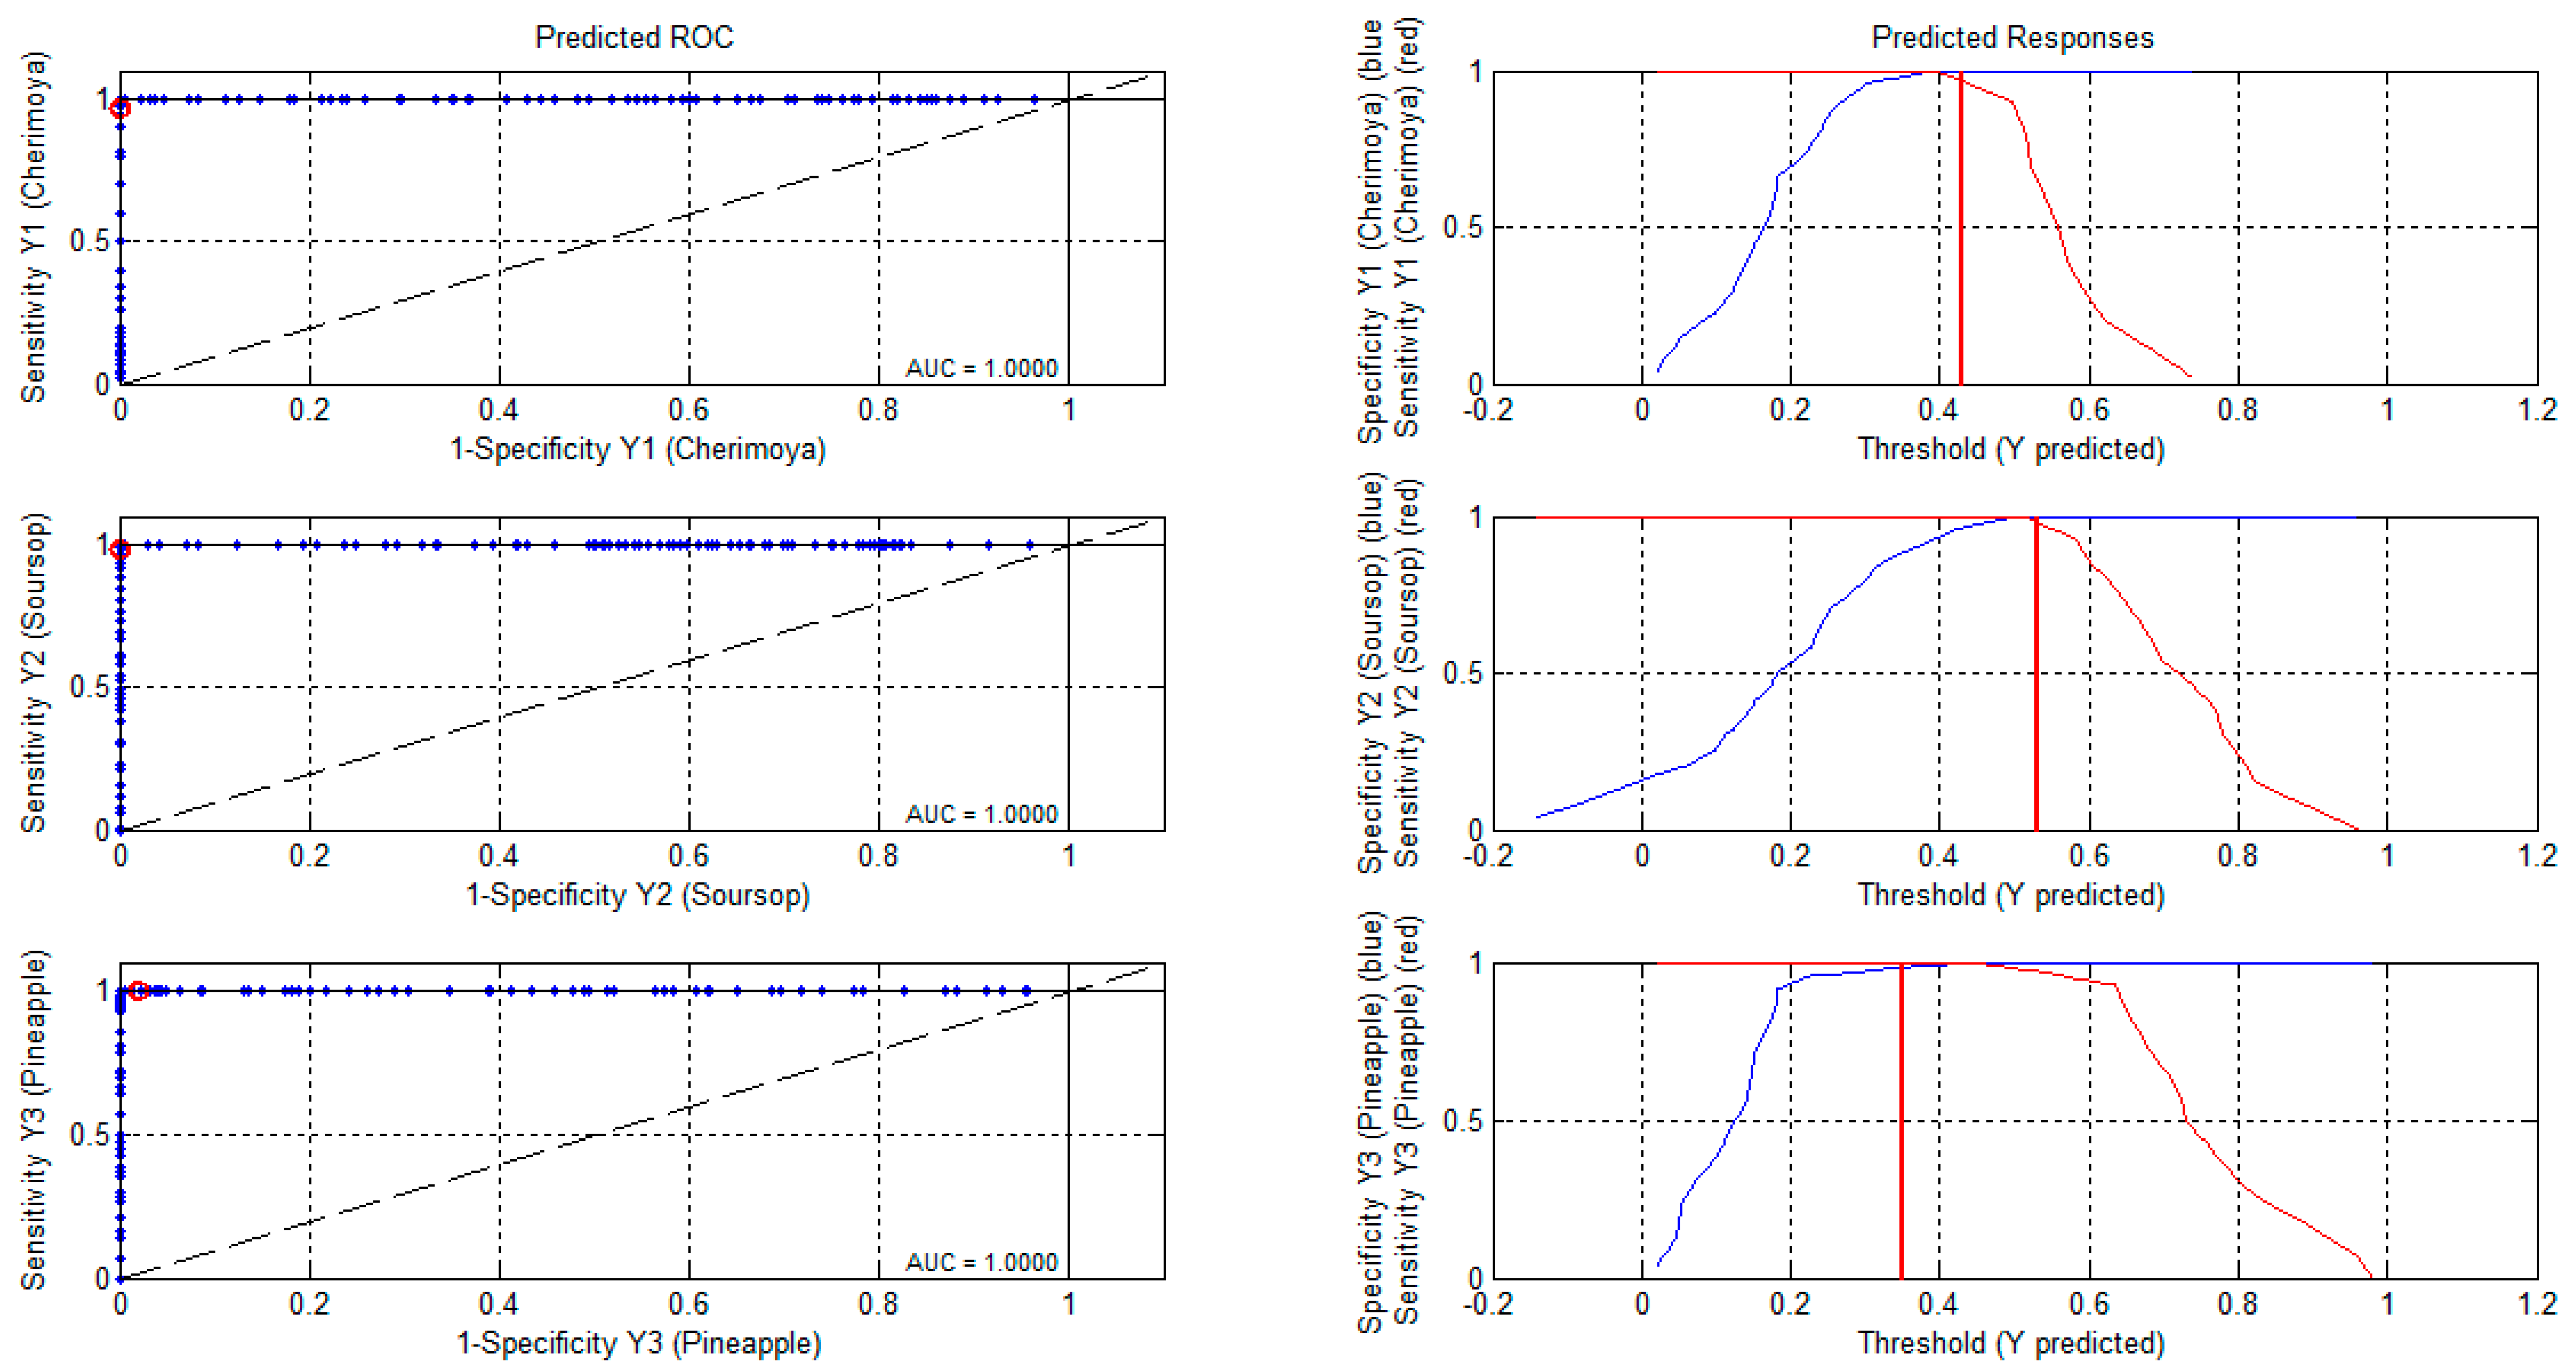
3.2.2. Partial Least Square Discriminant Analysis
4. Conclusions
Supplementary Materials
Author Contributions
Funding
Institutional Review Board Statement
Informed Consent Statement
Data Availability Statement
Acknowledgments
Conflicts of Interest
References
- Mohan, K.; Muralisankar, T.; Uthayakumar, V.; Chandirasekar, R.; Revathi, N.; Ramu Ganesan, A.; Velmurugan, K.; Sathishkumar, P.; Jayakumar, R.; Seedevi, P. Trends in the Extraction, Purification, Characterisation and Biological Activities of Polysaccharides from Tropical and Sub-Tropical Fruits—A Comprehensive Review. Carbohydr. Polym. 2020, 238, 116185. [Google Scholar] [CrossRef] [PubMed]
- Isas, A.S.; Mariotti Celis, M.S.; Pérez Correa, J.R.; Fuentes, E.; Rodríguez, L.; Palomo, I.; Mozzi, F.; Van Nieuwenhove, C. Functional Fermented Cherimoya (Annona Cherimola Mill.) Juice Using Autochthonous Lactic Acid Bacteria. Food Res. Int. 2020, 138, 109729. [Google Scholar] [CrossRef] [PubMed]
- Perrone, A.; Yousefi, S.; Salami, A.; Papini, A.; Martinelli, F. Botanical, Genetic, Phytochemical and Pharmaceutical Aspects of Annona Cherimola Mill. Sci. Hortic. 2022, 296, 110896. [Google Scholar] [CrossRef]
- Monarres-Cuevas, O.; Alia-Tejacal, I.; Pérez-Arias, G.A.; López-Martínez, V.; Juarez-Lopez, P.; Valle-Guadarrama, S.; Rodríguez-Verastegui, L.L. Physical, Chemical, and Physiological Characterization of Chilling Injury in Soursop Fruit (Anonna Muricata L.). Postharvest Biol. Technol. 2022, 193, 112052. [Google Scholar] [CrossRef]
- Berumen-Varela, G.; Hernández-Oñate, M.A.; Tiznado-Hernández, M.E. Utilization of Biotechnological Tools in Soursop (Annona Muricata L.). Sci. Hort. 2019, 245, 269–273. [Google Scholar] [CrossRef]
- Zhou, D.; Liu, Q.; Wu, C.; Li, T.; Tu, K. Characterization of Soluble Sugars, Glycosidically Bound and Free Volatiles in Fresh-Cut Pineapple Stored at Different Temperature. Food Biosci. 2021, 43, 101329. [Google Scholar] [CrossRef]
- Dorey, E.; Fournier, P.; Léchaudel, M.; Tixier, P. Modeling Sugar Content of Pineapple under Agro-Climatic Conditions on Reunion Island. Eur. J. Agron. 2016, 73, 64–72. [Google Scholar] [CrossRef]
- Batsoulis, A.N.; Siatis, N.G.; Kimbaris, A.C.; Alissandrakis, E.K.; Pappas, C.S.; Tarantilis, P.A.; Harizanis, P.C.; Polissiou, M.G. FT-Raman Spectroscopic Simultaneous Determination of Fructose and Glucose in Honey. J. Agric. Food Chem. 2005, 53, 207–210. [Google Scholar] [CrossRef]
- González-Viveros, N.; Gómez-Gil, P.; Castro-Ramos, J.; Cerecedo-Núñez, H.H. On the Estimation of Sugars Concentrations Using Raman Spectroscopy and Artificial Neural Networks. Food Chem. 2021, 352, 129375. [Google Scholar] [CrossRef]
- Kolašinac, S.; Pećinar, I.; Danojević, D.; Stevanović, Z.D. Raman Spectroscopy Coupled with Chemometric Modeling Approaches for Authentication of Different Paprika Varieties at Physiological Maturity. LWT 2022, 162, 113402. [Google Scholar] [CrossRef]
- Wang, K.; Li, Z.; Li, J.; Lin, H. Raman Spectroscopic Techniques for Nondestructive Analysis of Agri-Foods: A State-of-the-Art Review. Trends Food Sci. Technol. 2021, 118, 490–504. [Google Scholar] [CrossRef]
- Monago-Maraña, O.; Afseth, N.K.; Knutsen, S.H.; Wubshet, S.G.; Wold, J.P. Quantification of Soluble Solids and Individual Sugars in Apples by Raman Spectroscopy: A Feasibility Study. Postharvest Biol. Technol. 2021, 180, 111620. [Google Scholar] [CrossRef]
- Xu, S.; Huang, X.; Lu, H. Advancements and Applications of Raman Spectroscopy in Rapid Quality and Safety Detection of Fruits and Vegetables. Horticulturae 2023, 9, 843. [Google Scholar] [CrossRef]
- Wu, L.; Tang, X.; Wu, T.; Zeng, W.; Zhu, X.; Hu, B.; Zhang, S. A Review on Current Progress of Raman-Based Techniques in Food Safety: From Normal Raman Spectroscopy to SESORS. Food Res. Int. 2023, 169, 112944. [Google Scholar] [CrossRef] [PubMed]
- Andersen, P.V.; Afseth, N.K.; Aaby, K.; Gaarder, M.Ø.; Remberg, S.F.; Wold, J.P. Prediction of Chemical and Sensory Properties in Strawberries Using Raman Spectroscopy. Postharvest Biol. Technol. 2023, 201, 112370. [Google Scholar] [CrossRef]
- Dehelean, A.; Cristea, G.; Feher, I.; Hategan, A.R.; Magdas, D.A. Differentiation of Transylvanian Fruit Distillates Using Supervised Statistical Tools Based on Isotopic and Elemental Fingerprint. J. Sci. Food Agric. 2023, 103, 1454–1463. [Google Scholar] [CrossRef]
- Fernández, J.A.; Abbas, O.; Dardenne, P.; Baeten, V. Discrimination of Corsican Honey by FT-Raman Spectroscopy and Chemometrics. Biotechnol. Agron. Soc. Environ. 2011, 15, 75–83. [Google Scholar]
- Li, W.; Tan, F.; Cui, J.; Ma, B. Fast Identification of Soybean Varieties Using Raman Spectroscopy. Vib. Spectrosc. 2022, 123, 103447. [Google Scholar] [CrossRef]
- Yazgan Karacaglar, N.N.; Bulat, T.; Boyaci, I.H.; Topcu, A. Raman Spectroscopy Coupled with Chemometric Methods for the Discrimination of Foreign Fats and Oils in Cream and Yogurt. J. Food Drug Anal. 2019, 27, 101–110. [Google Scholar] [CrossRef]
- Nakajima, S.; Kuroki, S.; Ikehata, A. Selective Detection of Starch in Banana Fruit with Raman Spectroscopy. Food Chem. 2023, 401, 134166. [Google Scholar] [CrossRef]
- da Mata, M.M.D.; Rocha, P.D.; Farias, I.K.T.D.; Silva, J.L.B.D.; Medeiros:, E.P.; Silva, C.S.; Simões, S.D.S. Distinguishing Cotton Seed Genotypes by Means of Vibrational Spectroscopic Methods (NIR and Raman) and Chemometrics. Spectrochim. Acta Part A Mol. Biomol. Spectrosc. 2022, 266, 120399. [Google Scholar] [CrossRef] [PubMed]
- Alamar, P.D.; Caramês, E.T.S.; Poppi, R.J.; Pallone, J.A.L. Detection of Fruit Pulp Adulteration Using Multivariate Analysis: Comparison of NIR, MIR and Data Fusion Performance. Food Anal. Methods 2020, 13, 1357–1365. [Google Scholar] [CrossRef]
- Sun, M.; Jiang, H.; Yuan, W.; Jin, S.; Zhou, H.; Zhou, Y.; Zhang, C. Discrimination of Maturity of Camellia Oleifera Fruit On-Site Based on Generative Adversarial Network and Hyperspectral Imaging Technique. Food Meas. 2024, 18, 10–25. [Google Scholar] [CrossRef]
- Balcázar-Zumaeta, C.R.; Castro-Alayo, E.M.; Cayo-Colca, I.S.; Idrogo-Vásquez, G.; Muñoz-Astecker, L.D. Metabolomics during the Spontaneous Fermentation in Cocoa (Theobroma Cacao L.): An Exploraty Review. Food Res. Int. 2023, 163, 112190. [Google Scholar] [CrossRef]
- Kniese, J.; Race, A.M.; Schmidt, H. Classification of Cereal Flour Species Using Raman Spectroscopy in Combination with Spectra Quality Control and Multivariate Statistical Analysis. J. Cereal Sci. 2021, 101, 103299. [Google Scholar] [CrossRef]
- Deng, H.; He, R.; Long, M.; Li, Y.; Zheng, Y.; Lin, L.; Liang, D.; Zhang, X.; Liao, M.; Lv, X.; et al. Comparison of the Fruit Volatile Profiles of Five Muscadine Grape Cultivars (Vitis Rotundifolia Michx.) Using HS-SPME-GC/MS Combined With Multivariate Statistical Analysis. Front. Plant Sci. 2021, 12, 728891. [Google Scholar] [CrossRef]
- Balcázar-Zumaeta, C.R.; Pajuelo-Muñoz, A.J.; Trigoso-Rojas, D.F.; Iliquin-Chavez, A.F.; Fernández-Romero, E.; Yoplac, I.; Muñoz-Astecker, L.D.; Rodríguez-Hamamura, N.; Maza Mejía, I.M.; Cayo-Colca, I.S.; et al. Reduction in the Cocoa Spontaneous and Starter Culture Fermentation Time Based on the Antioxidant Profile Characterization. Foods 2023, 12, 3291. [Google Scholar] [CrossRef]
- Castro-Alayo, E.M.; Torrejón-Valqui, L.; Cayo-Colca, I.S.; Cárdenas-Toro, F.P. Evaluation of the Miscibility of Novel Cocoa Butter Equivalents by Raman Mapping and Multivariate Curve Resolution–Alternating Least Squares. Foods 2021, 10, 3101. [Google Scholar] [CrossRef]
- Huang, Y.; Karashima, T.; Yamamoto, M.; Hamaguchi, H. Molecular-level Pursuit of Yeast Mitosis by Time- and Space-resolved Raman Spectroscopy. J Raman Spectrosc. 2003, 34, 1–3. [Google Scholar] [CrossRef]
- Ditta, A.; Nawaz, H.; Mahmood, T.; Majeed, M.I.; Tahir, M.; Rashid, N.; Muddassar, M.; Al-Saadi, A.A.; Byrne, H.J. Principal Components Analysis of Raman Spectral Data for Screening of Hepatitis C Infection. Spectrochim. Acta Part A Mol. Biomol. Spectrosc. 2019, 221, 117173. [Google Scholar] [CrossRef]
- Gersony, J.T.; McClelland, A.; Holbrook, N.M. Raman Spectroscopy Reveals High Phloem Sugar Content in Leaves of Canopy Red Oak Trees. New Phytol. 2021, 232, 418–424. [Google Scholar] [CrossRef] [PubMed]
- Logan, B.G.; Hopkins, D.L.; Schmidtke, L.M.; Fowler, S.M. Assessing Chemometric Models Developed Using Raman Spectroscopy and Fatty Acid Data for Northern and Southern Australian Beef Production Systems. Meat Sci. 2022, 187, 108753. [Google Scholar] [CrossRef] [PubMed]
- Banerjee, S.; Ranganathan, V.; Patti, A.; Arora, A. Valorisation of Pineapple Wastes for Food and Therapeutic Applications. Trends Food Sci. Technol. 2018, 82, 60–70. [Google Scholar] [CrossRef]
- Agu, K.C.; Okolie, P.N. Proximate Composition, Phytochemical Analysis, and in Vitro Antioxidant Potentials of Extracts of Annona Muricata (Soursop). Food Sci. Nutr. 2017, 5, 1029–1036. [Google Scholar] [CrossRef]
- Leivas, C.; Cantu-Jungles, T.; Barbosa, B.; De Paula Werner, M.; Iacomini, M.; Cordeiro, L.M.C. Investigation of the Chemical Structure and Analgesic and Anti-Inflammatory Properties of Polysaccharides That Constitute the Dietary Fibers of Soursop (Annona Muricata) Fruit. Food Res. Int. 2023, 166, 112588. [Google Scholar] [CrossRef]
- Schulz, H.; Baranska, M. Identification and Quantification of Valuable Plant Substances by IR and Raman Spectroscopy. Vib. Spectrosc. 2007, 43, 13–25. [Google Scholar] [CrossRef]
- Wiercigroch, E.; Szafraniec, E.; Czamara, K.; Pacia, M.Z.; Majzner, K.; Kochan, K.; Kaczor, A.; Baranska, M.; Malek, K. Raman and Infrared Spectroscopy of Carbohydrates: A Review. Spectrochim. Acta Part A Mol. Biomol. Spectrosc. 2017, 185, 317–335. [Google Scholar] [CrossRef]
- Zheng, Z.; Yao, X.; Zhang, S.; Fang, L.; Jiang, Z. In-Situ Raman Study of α-D-Glucose under Different Pressure and Temperature. J. Mol. Struct. 2023, 1274, 134539. [Google Scholar] [CrossRef]
- Yao, X.; Fu, C.; Zhang, S.; Cheng, L.; Jiang, Z. Structure Investigation of β-D-Fructose Crystal under High Pressure: Raman Scattering, IR Absorption, and Synchrotron X-Ray Diffraction. J. Mol. Struct. 2020, 1220, 128746. [Google Scholar] [CrossRef]
- Mihaylova, D.; Popova, A.; Dincheva, I.; Pandova, S. HS-SPME-GC–MS Profiling of Volatile Organic Compounds and Polar and Lipid Metabolites of the “Stendesto” Plum–Apricot Kernel with Reference to Its Parents. Horticulturae 2024, 10, 257. [Google Scholar] [CrossRef]
- Guo, Y.; Jin, W.; Wang, W.; He, Y.; Qiu, S. Baseline Correction for Raman Spectra Using a Spectral Estimation-Based Asymmetrically Reweighted Penalized Least Squares Method. Appl. Opt. AO 2023, 62, 4766–4776. [Google Scholar] [CrossRef] [PubMed]
- Hu, H.; Bai, J.; Xia, G.; Zhang, W.; Ma, Y. Improved Baseline Correction Method Based on Polynomial Fitting for Raman Spectroscopy. Photonic Sens 2018, 8, 332–340. [Google Scholar] [CrossRef]
- Brereton, R.G. Applied Chemometrics for Scientists, 1st ed.; Wiley: Hoboken, NJ, USA, 2007; ISBN 978-0-470-01686-2. [Google Scholar]
- Esbensen, K.H.; Geladi, P. 2.13-Principal Component Analysis: Concept, Geometrical Interpretation, Mathematical Background, Algorithms, History, Practice. In Comprehensive Chemometrics; Elsevier: Oxford, UK, 2009; pp. 211–226. ISBN 978-0-444-52701-1. [Google Scholar]
- Roger, J.-M.; Boulet, J.-C.; Zeaiter, M.; Rutledge, D.N. 3. 01-Pre-Processing Methods. In Comprehensive Chemometrics; Elsevier: Oxford, UK, 2020; pp. 1–75. ISBN 978-0-444-64166-3. [Google Scholar]
- De Almeida, M.R.; Correa, D.N.; Rocha, W.F.C.; Scafi, F.J.O.; Poppi, R.J. Discrimination between Authentic and Counterfeit Banknotes Using Raman Spectroscopy and PLS-DA with Uncertainty Estimation. Microchem. J. 2013, 109, 170–177. [Google Scholar] [CrossRef]
- Padmanabhan, P.; Paliyath, G. Annonaceous Fruits. In Encyclopedia of Food and Health; Caballero, B., Finglas, P.M., Toldrá, F., Eds.; Academic Press: Oxford, UK, 2016; pp. 169–173. ISBN 978-0-12-384953-3. [Google Scholar]
- Devos, O.; Downey, G.; Duponchel, L. Simultaneous Data Pre-Processing and SVM Classification Model Selection Based on a Parallel Genetic Algorithm Applied to Spectroscopic Data of Olive Oils. Food Chem. 2014, 148, 124–130. [Google Scholar] [CrossRef] [PubMed]


| Assignment 1 | Literature | Fructose | Glucose | Sucrose | Cherimoya | Soursop | Pineapple |
|---|---|---|---|---|---|---|---|
| δ (CH2) | 1460 [37] | 1473.93 | 1471.74 | 1472.81 | 1464.22 | 1467.44 | 1464.22 |
| ρ (CH2) | 1346 [37] | 1356.80 | 1359.73 | 1355.73 | 1355.73 | 1352.50 | 1353.58 |
| ν (CC), ν (CO), β (COH) | 1142 [37] | 1133.37 | 1133.37 | 1133.37 | 1131.22 | 1134.44 | 1133.37 |
| ν (CC), ν (CO) | 1074 [37] | 1080.73 | 1081.81 | 1080.73 | 1078.58 | 1085.03 | 1085.03 |
| CH, COH bending | 924 [38] | 932.49 | 929.27 | 933.57 | 928.20 | 928.20 | 918.53 |
| ν (CH) | 867 [38] | 859.45 | 853.00 | 860.52 | 855.15 | 854.08 | 851.93 |
| β (CCO) | 596 [39] | 594.12 | 595.20 | 601.64 | 595.12 | ||
| β (CCO), β (CCC) | 527 [39] | 536.12 | 537.19 | 536.12 | 535.04 | 535.04 | |
| β (CCC) | 465 [39] | 456.63 | 455.55 | 457.70 | 453.40 | 455.55 | 455.55 |
| β (CCC),β (CCO),β (OCO) | 424 [38] | 416.88 | 415.81 | 416.88 | 417.95 |
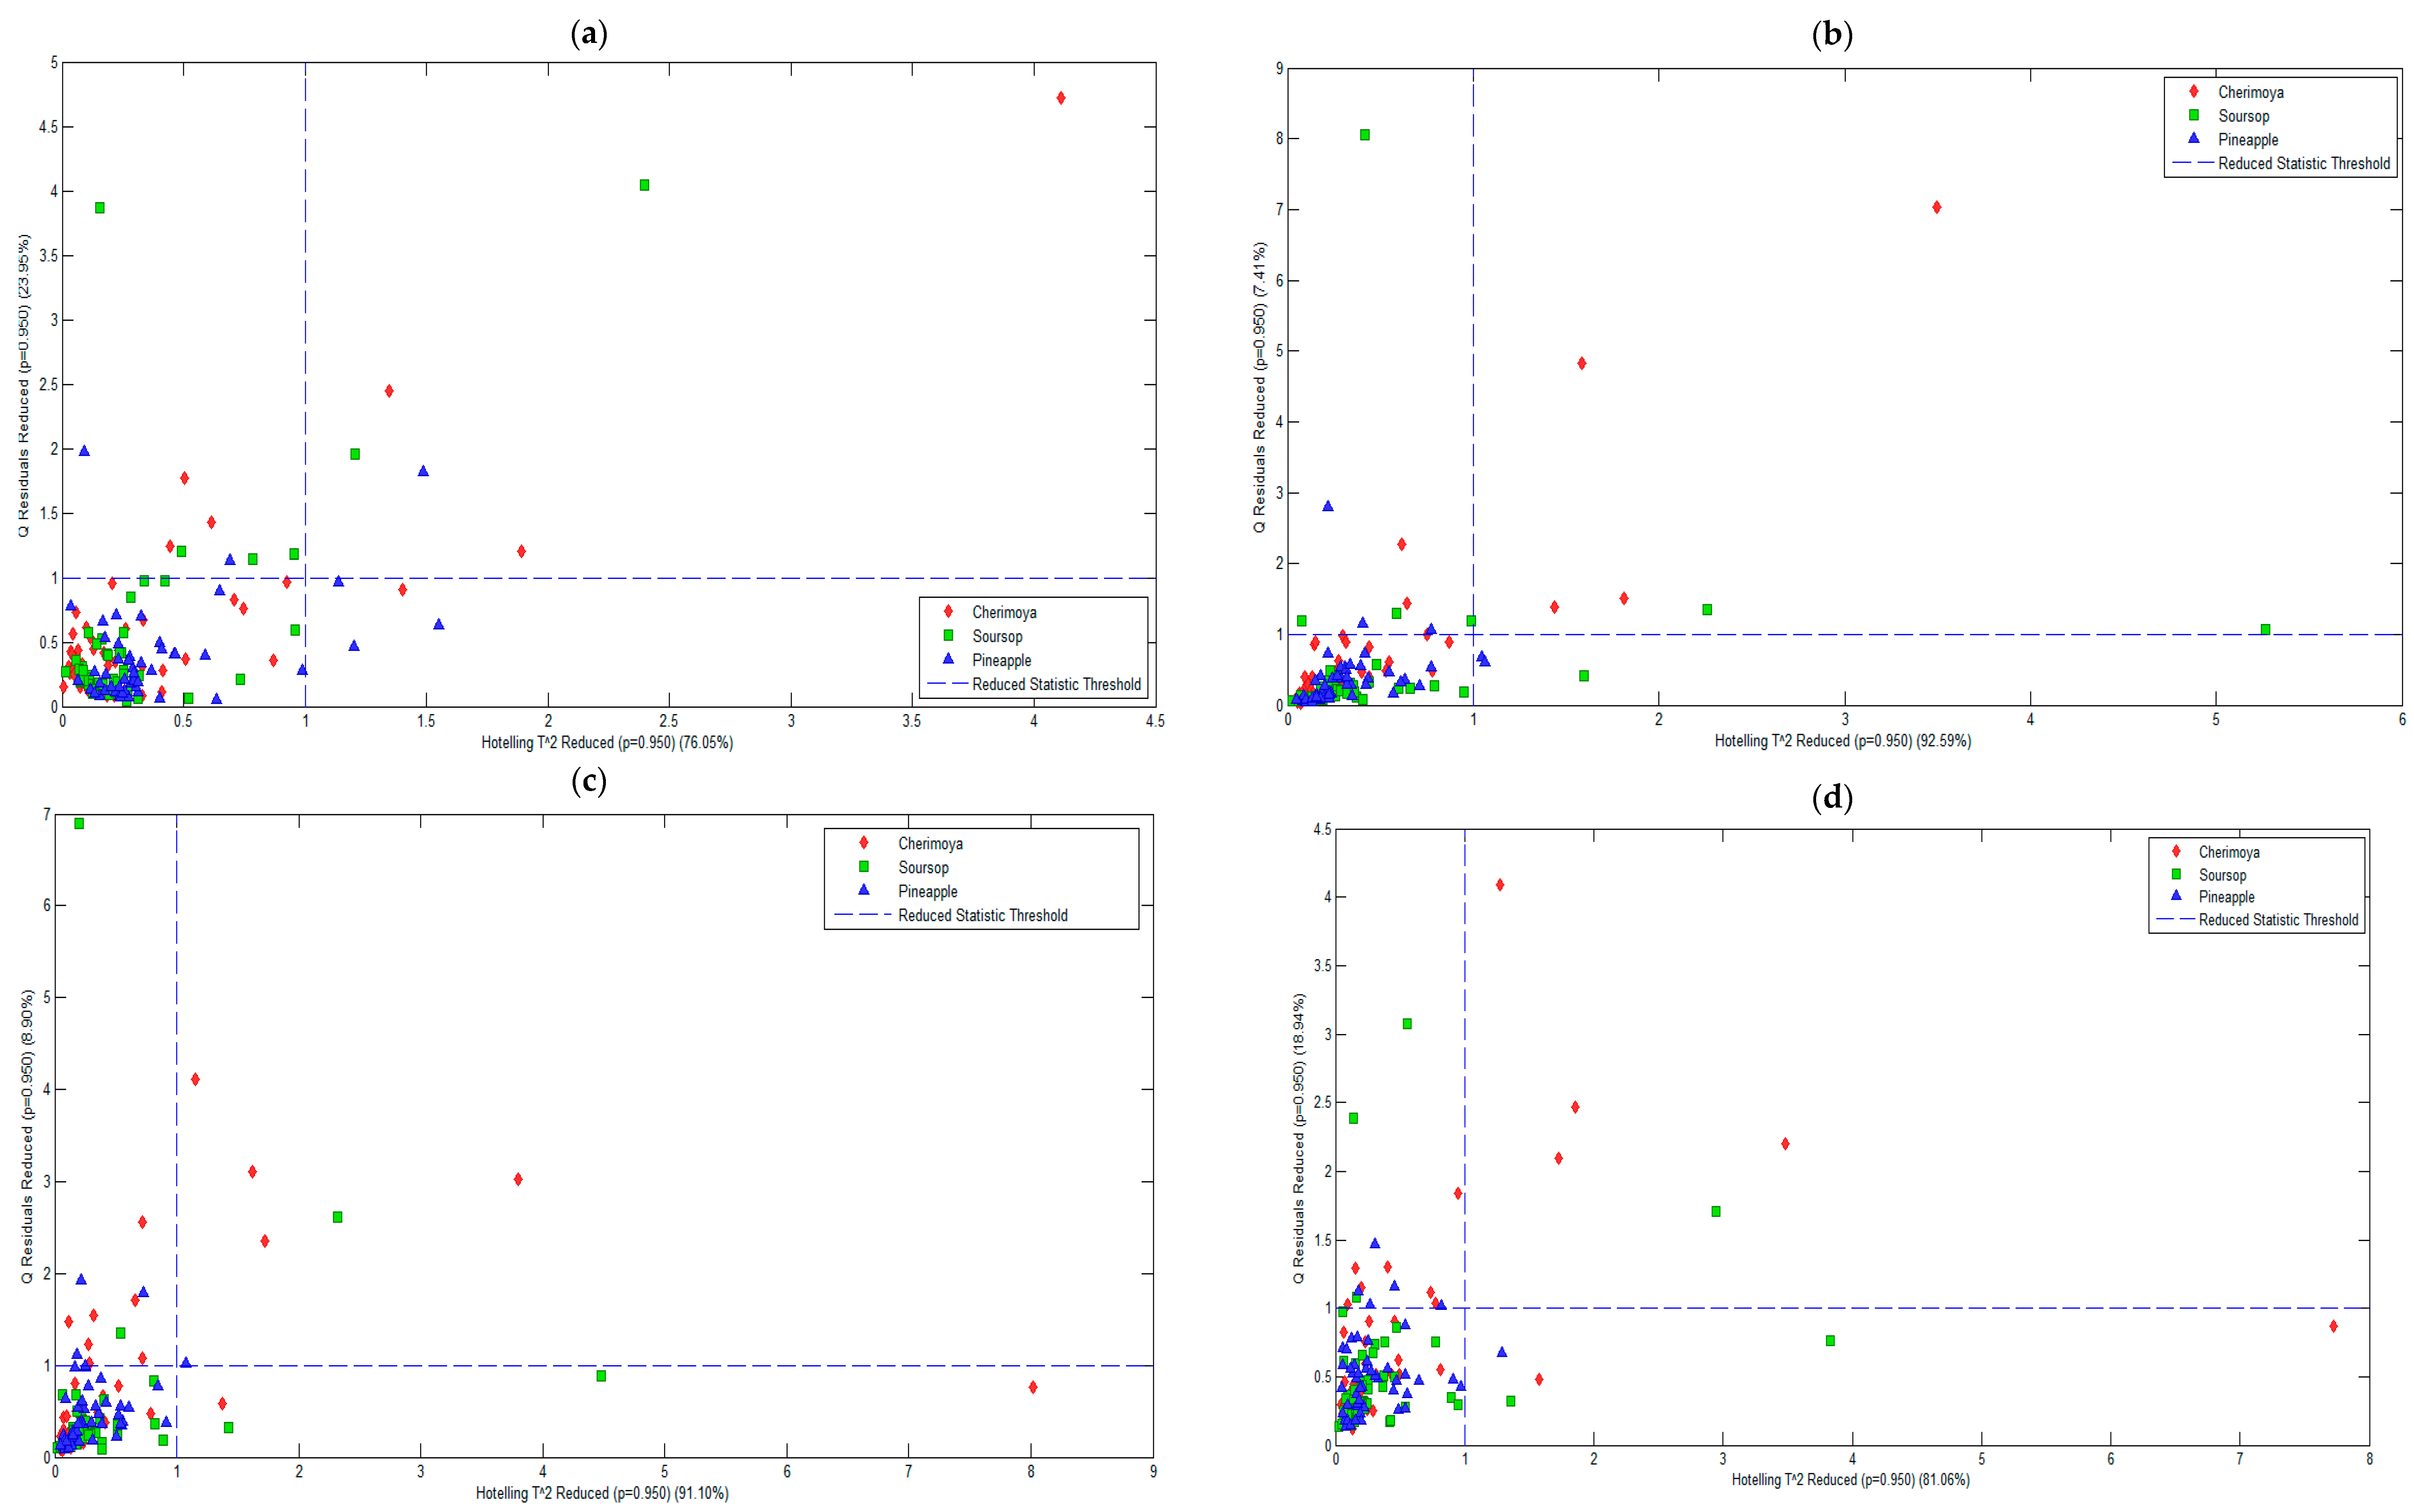
| Pre-Processing Method | PC | RMSECV | % Variance Captured Total | Q Residual | Hotelling’s T2 |
|---|---|---|---|---|---|
| Mean centering | 3 | 254.18 | 76.05 | 23.95 | 76.05 |
| First derivative of Savitzky–Golay | 4 | 44.06 | 92.59 | 7.41 | 92.59 |
| Second derivative of Savitzky–Golay | 5 | 25.86 | 91.10 | 8.90 | 91.10 |
| Third derivative of Savitzky–Golay | 5 | 39.32 | 81.06 | 18.94 | 81.06 |
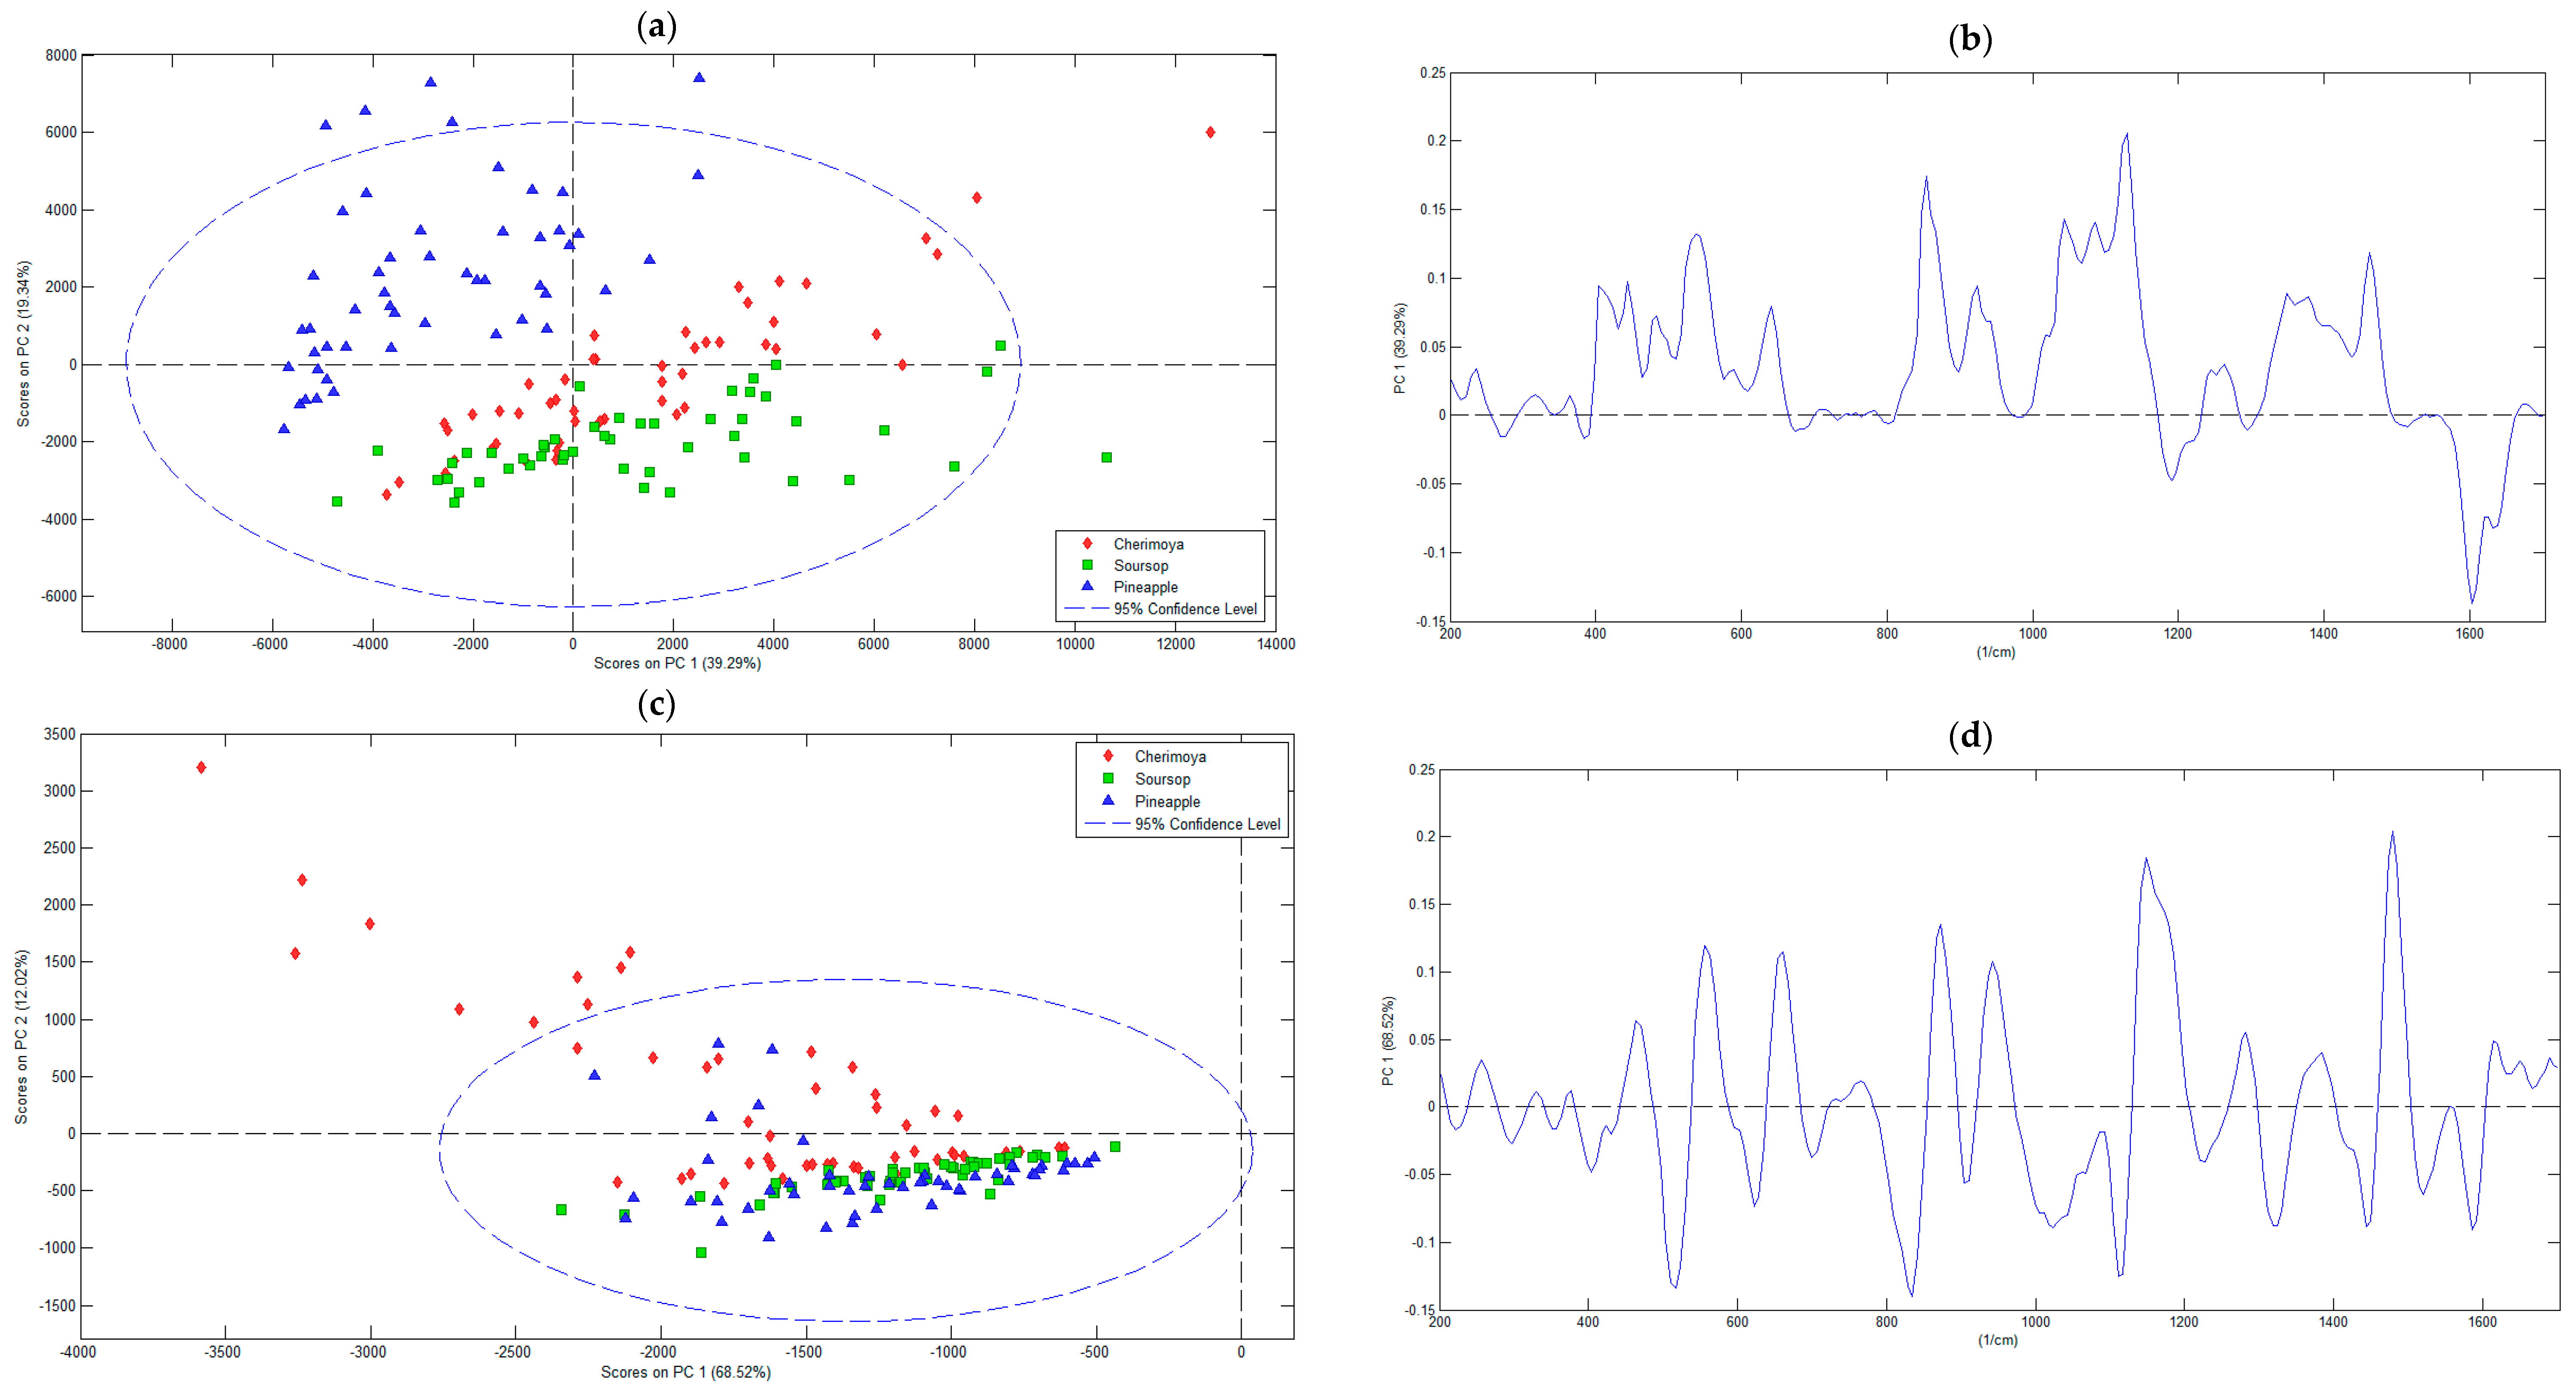
| Pre-Processing Methods | RMSEC | RMSECV | Principal Component Number | Eigenvalue of Cov (X) | % Variance Captured This PC | % Variance Captured Total |
|---|---|---|---|---|---|---|
| Mean centering | 180.47 | 254.18 | 1 | 1.29 × 10⁷ | 39.29 | 39.29 |
| 2 | 6.36× 10⁶ | 19.34 | 58.64 | |||
| 3 | 5.72 × 10⁶ | 17.42 | 76.05 | |||
| First derivative of Savitzky–Golay | 31.30 | 44.06 | 1 | 2.17 × 10⁶ | 68.52 | 68.52 |
| 2 | 3.81 × 10⁵ | 12.02 | 80.54 | |||
| 3 | 2.75 × 10⁵ | 8.66 | 89.20 | |||
| 4 | 1.08 × 10⁵ | 3.39 | 92.59 | |||
| Secondderivative ofSavitzky–Golay | 19.20 | 25.86 | 1 | 5.47 × 10⁵ | 54.96 | 54.96 |
| 2 | 1.90 × 10⁵ | 19.06 | 74.01 | |||
| 3 | 8.61 × 10⁴ | 8.65 | 82.67 | |||
| 4 | 4.62 × 10⁴ | 4.65 | 87.31 | |||
| 5 | 3.77 × 10⁴ | 3.79 | 91.10 | |||
| Thirdderivative ofSavitzky–Golay | 29.15 | 39.31 | 1 | 5.12 × 10⁵ | 47.57 | 47.57 |
| 2 | 1.72 × 10⁵ | 15.96 | 63.53 | |||
| 3 | 8.88 × 10⁴ | 8.24 | 71.77 | |||
| 4 | 6.25 × 10⁴ | 5.80 | 77.57 | |||
| 5 | 3.75 × 10⁴ | 3.48 | 81.06 |
| Pre-Processing Method | Sweet Fruit | Training Data Set | Prediction Data Set | ||||
|---|---|---|---|---|---|---|---|
| P 1 (%) | SE 2 (%) | SP 3 (%) | P (%) | SE (%) | SP (%) | ||
| Mean centering | Cherimoya | 93.06 | 93.87 | 97.98 | 100.00 | 100.00 | 100.00 |
| Soursop | 97.02 | 97.95 | 96.97 | 100.00 | 100.00 | 100.00 | |
| Pineapple | 100.00 | 98.00 | 100.00 | 100.00 | 100.00 | 100.00 | |
| First derivative of Savitzky–Golay | Cherimoya | 100.00 | 97.43 | 100.00 | 100.00 | 100.00 | 100.00 |
| Soursop | 98.68 | 100.00 | 98.66 | 100.00 | 100.00 | 100.00 | |
| Pineapple | 100.00 | 100.00 | 100.00 | 100.00 | 100.00 | 100.00 | |
| Second derivative of Savitzky–Golay | Cherimoya | 96.68 | 54.83 | 98.11 | 100.00 | 12.50 | 100.00 |
| Soursop | 84.44 | 92.00 | 83.05 | 80.00 | 100.00 | 75.00 | |
| Pineapple | 100.00 | 89.28 | 100.00 | 100.00 | 100.00 | 100.00 | |
| Third derivative of Savitzky–Golay | Cherimoya | 98.13 | 71.79 | 98.61 | 100.00 | 20.00 | 100.00 |
| Soursop | 87.94 | 97.22 | 86.67 | 80.59 | 69.23 | 83.33 | |
| Pineapple | 98.68 | 100.00 | 98.67 | 100.00 | 100.00 | 100.00 | |
| Pre-Processing Method | Modeled Class | Cherimoya | Soursop | Pineapple |
|---|---|---|---|---|
| Mean centering | Sensitivity (Cal) | 0.959 | 1.000 | 1.000 |
| Specificity (Cal) | 0.929 | 0.949 | 1.000 | |
| Sensitivity (CV) | 0.939 | 1.000 | 1.000 | |
| Specificity (CV) | 0.909 | 0.949 | 1.000 | |
| Class. Err (Cal) | 0.0557617 | 0.0252525 | 0 | |
| Class. Err (CV) | 0.0760668 | 0.0252525 | 0 | |
| RMSEC | 0.31426 | 0.273395 | 0.217022 | |
| RMSECV | 0.333692 | 0.289513 | 0.229203 | |
| Bias | 1.66533× 10⁻¹⁶ | 1.66533× 10⁻¹⁶ | 1.11022 × 10⁻¹⁶ | |
| CV Bias | 0.00127205 | −0.00184987 | 0.000577824 | |
| R2 Cal | 0.554066 | 0.662499 | 0.78946 | |
| R2 CV | 0.501205 | 0.622938 | 0.766066 | |
| First derivative of Savitzky–Golay | Sensitivity (Cal) | 0.974 | 1.000 | 1.000 |
| Specificity (Cal) | 0.972 | 0.987 | 1.000 | |
| Sensitivity (CV) | 0.897 | 0.972 | 1.000 | |
| Specificity (CV) | 0.958 | 0.987 | 1.000 | |
| Class. Err (Cal) | 0.0267094 | 0.00666667 | 0 | |
| Class. Err (CV) | 0.0721154 | 0.0205556 | 0 | |
| RMSEC | 0.26207 | 0.197014 | 0.198749 | |
| RMSECV | 0.311281 | 0.252941 | 0.209272 | |
| Bias | −0.00915475 | 0.00408662 | 0.00506812 | |
| CV Bias | 0.00775709 | −0.0145767 | 0.00681962 | |
| R2 Cal | 0.699008 | 0.822952 | 0.819861 | |
| R2 CV | 0.595265 | 0.717618 | 0.800737 | |
| Secondderivative ofSavitzky–Golay | Sensitivity (Cal) | 0.548 | 1.000 | 0.964 |
| Specificity (Cal) | 0.906 | 0.831 | 1.000 | |
| Sensitivity (CV) | 0.548 | 0.960 | 0.929 | |
| Specificity (CV) | 0.887 | 0.831 | 1.000 | |
| Class. Err (Cal) | 0.272976 | 0.0847458 | 0.0178571 | |
| Class. Err (CV) | 0.28241 | 0.104746 | 0.0357143 | |
| RMSEC | 0.397685 | 0.343363 | 0.242586 | |
| RMSECV | 0.400828 | 0.351006 | 0.244279 | |
| Bias | 0.0964188 | −0.131557 | 0.0351384 | |
| CV Bias | 0.0958097 | −0.13477 | 0.0389599 | |
| R2 Cal | 0.366397 | 0.538207 | 0.740784 | |
| R2 CV | 0.356427 | 0.518102 | 0.740114 | |
| Thirdderivative ofSavitzky–Golay | Sensitivity (Cal) | 0.821 | 0.944 | 1.000 |
| Specificity (Cal) | 0.889 | 0.813 | 0.987 | |
| Sensitivity (CV) | 0.821 | 0.917 | 1.000 | |
| Specificity (CV) | 0.875 | 0.813 | 0.973 | |
| Class. Err (Cal) | 0.145299 | 0.121111 | 0.00666667 | |
| Class. Err (CV) | 0.152244 | 0.135 | 0.0133333 | |
| RMSEC | 0.348922 | 0.32159 | 0.208805 | |
| RMSECV | 0.361874 | 0.336387 | 0.234444 | |
| Bias | −0.00584702 | 0.000421702 | 0.00542532 | |
| CV Bias | −0.00528552 | −0.00200115 | 0.00728667 | |
| R2 Cal | 0.465947 | 0.528059 | 0.801175 | |
| R2 CV | 0.425925 | 0.486149 | 0.749947 |
Disclaimer/Publisher’s Note: The statements, opinions and data contained in all publications are solely those of the individual author(s) and contributor(s) and not of MDPI and/or the editor(s). MDPI and/or the editor(s) disclaim responsibility for any injury to people or property resulting from any ideas, methods, instructions or products referred to in the content. |
© 2024 by the authors. Licensee MDPI, Basel, Switzerland. This article is an open access article distributed under the terms and conditions of the Creative Commons Attribution (CC BY) license (https://creativecommons.org/licenses/by/4.0/).
Share and Cite
Balcázar-Zumaeta, C.R.; Maicelo-Quintana, J.L.; Salón-Llanos, G.; Barrena, M.; Muñoz-Astecker, L.D.; Cayo-Colca, I.S.; Torrejón-Valqui, L.; Castro-Alayo, E.M. A Novel Technique Using Confocal Raman Spectroscopy Coupled with PLS-DA to Identify the Types of Sugar in Three Tropical Fruits. Appl. Sci. 2024, 14, 8476. https://doi.org/10.3390/app14188476
Balcázar-Zumaeta CR, Maicelo-Quintana JL, Salón-Llanos G, Barrena M, Muñoz-Astecker LD, Cayo-Colca IS, Torrejón-Valqui L, Castro-Alayo EM. A Novel Technique Using Confocal Raman Spectroscopy Coupled with PLS-DA to Identify the Types of Sugar in Three Tropical Fruits. Applied Sciences. 2024; 14(18):8476. https://doi.org/10.3390/app14188476
Chicago/Turabian StyleBalcázar-Zumaeta, César R., Jorge L. Maicelo-Quintana, Geidy Salón-Llanos, Miguel Barrena, Lucas D. Muñoz-Astecker, Ilse S. Cayo-Colca, Llisela Torrejón-Valqui, and Efraín M. Castro-Alayo. 2024. "A Novel Technique Using Confocal Raman Spectroscopy Coupled with PLS-DA to Identify the Types of Sugar in Three Tropical Fruits" Applied Sciences 14, no. 18: 8476. https://doi.org/10.3390/app14188476
APA StyleBalcázar-Zumaeta, C. R., Maicelo-Quintana, J. L., Salón-Llanos, G., Barrena, M., Muñoz-Astecker, L. D., Cayo-Colca, I. S., Torrejón-Valqui, L., & Castro-Alayo, E. M. (2024). A Novel Technique Using Confocal Raman Spectroscopy Coupled with PLS-DA to Identify the Types of Sugar in Three Tropical Fruits. Applied Sciences, 14(18), 8476. https://doi.org/10.3390/app14188476