Article

Analysis of Development Coordination Levels between Skywalk Systems and Urban Spatial Environments

1
North China Power Engineering Co., Ltd. of China Power Engineering Consulting Group, Beijing 100120, China
2
School of Architecture and Design, Beijing Jiaotong University, Beijing 100044, China
*
Author to whom correspondence should be addressed.
Appl. Sci. 2024, 14(18), 8488; https://doi.org/10.3390/app14188488
Submission received: 20 April 2024 / Revised: 26 May 2024 / Accepted: 30 May 2024 / Published: 20 September 2024

Abstract

:
Skywalk systems serve as a three-dimensional transportation solutions to address insufficient ground capacity and spatial fragmentation in high-density cities, thereby enhancing the pedestrian experience and representing an urban design strategy aimed at creating diversified and composite spaces. Previous studies have not included a quantitative analysis of the coordination levels between skywalk systems and the urban spatial environment, thus leading to a lack of understanding of the current state of built systems. In this study, we employ coupled modeling and cluster analysis methods to reveal the differences between North American and Asian skywalk systems by analyzing the level of coordination in their development and summarizing the existing typologies based on the analysis results. The results show that the skywalk systems in Minneapolis, Shanghai Hongqiao, and Osaka Umeda Hub are well-coordinated with their urban spatial environment. In contrast, the systems in Toledo, Seattle, and Oklahoma City exhibit significant dissonance. A cluster analysis has identified four distinct types of skywalk models: the attached and nodal closed skywalk network system, the traversing and attached covered and windowless skywalk node system, the traversing and nodal closed skywalk node system, and the attached closed skywalk linear system. These models provide an evaluation framework for their construction.

1. Introduction

The acceleration of urbanization, population explosion, and land use constraints has led to a number of challenges for high-density cities, including insufficient basal capacity and spatial fragmentation [1]. The traditional planarized development mode is no longer aligned with contemporary society’s demand for composite space [2]. As a result, three-dimensional transportation has become an effective means of addressing these issues [3].
Skywalk systems are vital components of three-dimensional transportation infrastructure, which refers to the above-ground level that connects buildings and spaces through corridors to provide safe, comfortable, and convenient pedestrian access [4]. The development of skywalk systems can be traced back to the middle of the 20th century, initially emerging in North American cities, such as Minneapolis, Montreal, and Toronto. Its primary purpose was to mitigate the challenges posed by cold climates, protecting the pedestrians during their walking trip. By the end of the 20th century, skywalk systems had also been developed in some cities in Asia, such as Hong Kong, China, Singapore, and Tokyo, with the focus having shifted to alleviating ground traffic congestion and enhancing the plot ratio. At present, skywalk systems serve three main functions. First, they connect public transportation stations with the surrounding commercial, office, residential, and other functional areas by creating a three-dimensional pedestrian system that combines the ground and underground, thus shortening the walking distance and time, and improving the convenience and comfort of public transportation [5]. Second, it increases the amount of above-ground public space, expanding the space for urban activities such as communication, and stopping and resting [6]. At the same time, it creates a large amount of gray space at the ground level through an elevated design to enrich the spatial interface. The third purpose is to create a distinctive urban landscape [7], such as New York’s High Line Park, which was converted from an abandoned railroad, incorporating art installations and landscape design along the way, to become an iconic community activity space.
Despite the importance of skywalk systems, their construction is met with some controversy. Skywalk systems are influenced by various aspects of the urban environment [8], and their advantages in promoting urban development are mainly reflected in two aspects: First, they are integrated into urban life as a critical component of three-dimensional transportation, thereby reducing the reliance on high-carbon-emitting transportation modes (e.g., private cars) in cities and mitigating tailpipe pollution from slow-moving vehicles [9]. Second, they can improve the efficiency of urban space utilization and promote the three-dimensional development of the city. By utilizing the space resources above the city, the potential of urban three-dimensional space can be exploited to relieve the pressure of ground transportation and conserve land resources [10]. However, these benefits do not apply to all cities [7,11]; they are particularly effective in cities with relatively spacious streets, high white-collar employment rate, and cold and rainy weather, such as Minneapolis, St. Paul, Cincinnati, Toronto, Calgary, Edmonton, and Sapporo. Constructed skywalks also present challenges in four ways: Firstly, they can diminish the commercial vitality at street level, leading to a decline in ground-level retail activity, thus reducing the value of stores and discouraging ground-level engagement [12,13]. Secondly, the privatization of public space becomes an issue, with the opening hours of the skywalk system being influenced by architecture and resources being taken away from public space [14,15]. Thirdly, the lack of cohesive planning and management results in a fragmented system with subpar connectivity and accessibility [16]. Lastly, the construction cost is high, and the subsequent maintenance is challenging [8]. Taken together, this study concludes that skywalk systems play an important role in the overall development of cities, especially when they have a certain level of coherent development and promote sustainable urban development.
Of all the cases analyzed, North America and Asia stand at the forefront in terms of the quantity and quality of construction. After World War II, North American cities, especially those with severe climates, used skywalk systems as a means of rejuvenating older urban areas and providing citizens with a warm, convenient walking environment [17]. Originating in the mid-twentieth century, North American skywalk systems, often characterized by enclosed glass galleries connecting high-rise buildings, established an independent pedestrian network above ground level. These systems have the advantage of enhancing pedestrian mobility and safety, improving the walking environment, and driving economic revitalization in urban centers. However, since the end of the last century, the pace of skywalk system development in North America has slowed down or even stopped, with some cities beginning to dismantle them in favor of valuing the vitality of the ground floor. Unlike North America, Asia’s skywalk systems have shown new features and advantages in their development in recent years, especially in densely populated cities [18], embodying the concepts of sharing and inclusiveness [19,20,21]. Skywalk systems in Asia show localized characteristics, such as the Central–Mid-Levels skywalk system in Hong Kong, China, which utilizes mid-level walkways, building rooftops, and other spatial resources to form a three-dimensional shared space [22]. Similarly, the Umeda skywalk in Osaka, Japan, creates a multifunctional platform that is well articulated with its surroundings. The skywalk system is also used by different social groups for various purposes, especially during off-peak hours, such as Central’s skywalk system in Hong Kong, China, serving as a social place for foreign domestic helpers or a shelter for the homeless [23,24]. In Bandung, Indonesia, the skywalk system organizes street vendors to provide space and enhance the city’s image [25]. However, skywalk systems in Asia still need to address a number of issues, including the need for more sophisticated designs interfacing with neighboring buildings and the imperative to reincorporate completed zero-walks in the context of three-dimensional urban development [26,27].
With the acceleration of urbanization and the growing demand for transportation, environment, and space utilization, researchers have explored the relationship between skywalk systems and the urban environment. Currently, the research mainly focuses on the following aspects. Firstly, space integration and allocation. Public transportation-oriented three-dimensional pedestrian systems are crucial for expanding the boundaries of public space, and serve as the “glue” that binds and integrates various urban resources, such as public space, public transportation, and public buildings [28]. Built in the 1970s, the Central District of Hong Kong, China, is a successful example of the use of this strategy in urban renewal. This privately funded, 3.6 km long covered, semi-open skywalk system, resembling a fishbone along the main road, interconnects over 30 commercial and office complexes in a 1.8 km2 area, seamlessly linking Hong Kong Station and Central Station [26]. Secondly, pedestrian network stitching. The “stitching” effect of the skywalk system on urban road networks is mainly reflected in two aspects: first, as an instrument for downtown economic rejuvenation, as observed in cities like Minneapolis and Cincinnati in the United States, where pedestrianization development strategy serves as an important means of inner-city regeneration; second, as a remedy for the lack of vitality of the streets in historic cities such as Suzhou, China, where skywalk systems mend fragmented urban spaces [22] and restore connectivity [12,22,29]. Thirdly, regulation of the walking environment. Climate-oriented skywalk systems regulate the urban thermal environment while enhancing walkability. Cities like Minneapolis, USA, and Calgary, Canada, have adopted fully enclosed aerial walking systems to cope with severe cold [29,30]. Conversely, subtropical cities like Hong Kong, China and Guangzhou, China, utilize natural ventilation and roof outcroppings to temper heat and solar exposure. In addition, a study on “urban agriculture” in Java, Indonesia, has found that incorporating vegetation into the urban environment mitigates the heat island effect and improves the walkability of the city [31]. Finally, the aggregation of multiple urban functions. The skywalk system not only serves as a transportation carrier, but also combines with the landscape, commercial business, leisure and recreation, tourism and sightseeing, and social activities, yielding promising outcomes in Asian countries.
Previous studies have mainly focused on case-by-case empirical evidence for a single city or country, typically using single-factor correlation and influence factor analysis. However, there are fewer studies on the comparison and overall coherence between different cities. The research objective of this study is to explore the relationship between skywalk systems and urban environments and the development of coherence law, and at the same time to summarize the construction types and characteristics of existing skywalk systems, thus forming a reference to assist decision making.
The Section 2 of this paper is the literature review, screening specific evaluation indexes and constructing the index systems. The Section 3 constructs the research method. This is followed by the results of an empirical analysis in Section 4. Finally, Section 5 conducts a discussion and derives the study’s conclusions.

2. Literature

This section summarizes the classification of evaluation indicators and specific evaluation factors for assessing each skywalk system and its corresponding urban environmental system through a literature study, thus laying the foundation for the subsequent construction of the evaluation system.

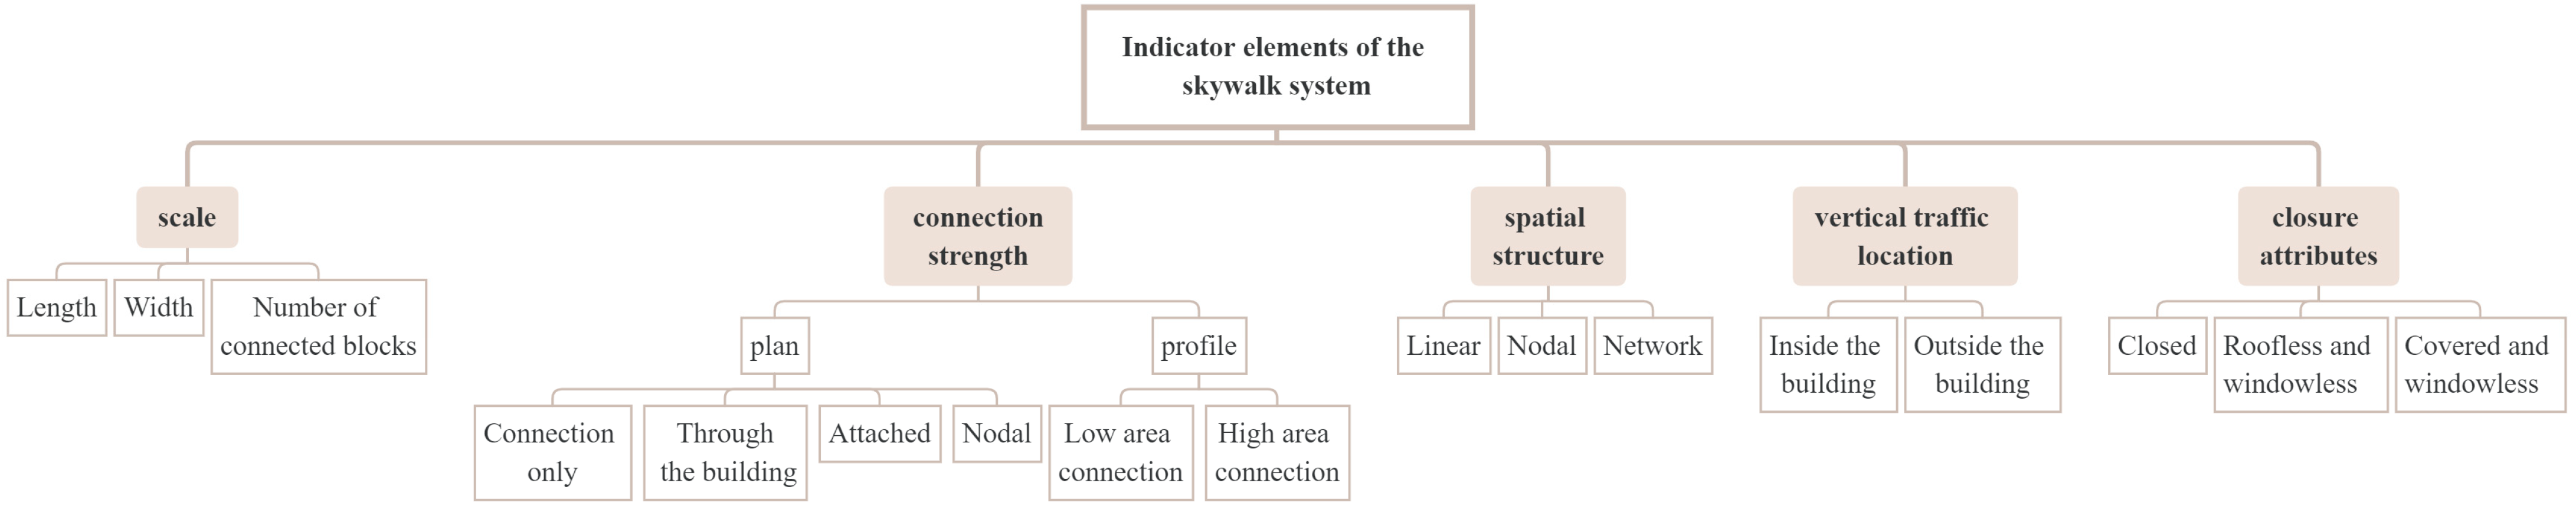
2.1. Elements of Skywalk System Indicators

2.1.1. Classification of Indicators

This subsection summarizes five categories of important skywalk system components as classification indexes based on relevant research from both domestic and international sources. These categories are scale, connection strength, spatial structure, vertical transportation location, and closure attributes [18] (Figure 1). The scale of the skywalk directly affects its coverage and the service capacity of the pedestrian system, and the size of the scale influences the accessibility and sustainability of the skywalk system. The level of connection strength of the skywalk system affects its accessibility, continuity, and vitality [32]. A higher connection strength facilitates better adaptation to different neighborhood forms, scales, and functions. The spatial structure affects the accessibility, connectivity, and utilization efficiency of the system. The category of vertical transportation location impacts the interchangeability and accessibility of a skywalk system [33], and if designed effectively, a skywalk system can seamlessly connect with the surface and underground transportation networks. Closure attributes can directly affect the appearance and degree of shading of a skywalk system [34]. Systems with higher closure attributes typically provide a more private and secure travel environment, with better insulation effects that enhance the comfort and security of pedestrians [35].

2.1.2. Evaluation Factors

Factor parsing was performed based on the five dimensions selected above: scale, connection strength, spatial structure, vertical transportation locations, and closure attributes.
Scale includes three evaluation factors: length, width, and number of connected blocks. A longer length indicates a more extensive skywalk system, facilitating greater connectivity between more buildings and functional areas [36]. The width of a skywalk reflects its capacity and comfort, with wider skywalks accommodating more people and activities [37]. A greater number of connected blocks indicates more connectivity and diversity, thus meeting the characteristics and needs of different neighborhoods while facilitating interactions between them [6].
Connection strength is categorized in terms of plan and profile. Plan connection strength is subdivided into four evaluation factors: connecting only, through the building, attached, and nodal. Skywalks connecting buildings only provide the shortest path of passage between two buildings, while skywalks through buildings integrate with architectural spaces. Skywalks attaching buildings combine the characteristics of the above two categories, and skywalks forming nodes can expand the walking space and the range of activities [38]. The strength of profile connections is divided into two categories: low area connections and high area connections [12]. Low area connections provide walking paths between businesses on the ground floor of the building, and high area connections allow for quick access between high-rise offices and rooftop terraces.
The spatial structure is divided into three categories: linear, nodal, and network. Linear structures are more commonly situated along the main access routes and can connect the main nodes through the shortest paths. Nodal structures enhance the radiation and convenience of the skywalk system in the core area. Network structures provide multiple paths, increasing the flexibility of the skywalk system [20].
Vertical transportation locations are divided into two categories: inside the building and outside the building [5]. Vertical transportation set inside the building can utilize the building’s infrastructure, saving pedestrians space and time by providing easy access to building elevators while protecting pedestrians from inclement weather. Vertical transportation set outside the building is not affected by the building operation hours, allowing for 24-h public access and better integration into the three-dimensional transportation system.
Closure attributes are divided into three categories: closed, roofless and windowless, and covered and windowless. Closed skywalks protect pedestrians from external environmental factors such as rain, snow, cold, and heat [39]. Covered, windowless skywalks provide a more open, natural environment that allows pedestrians to walk while enjoying the surrounding landscape. Covered and windowless skywalks blur the boundary between buildings and public spaces, facilitating transitions and enhancing connectivity between buildings and public spaces [40].

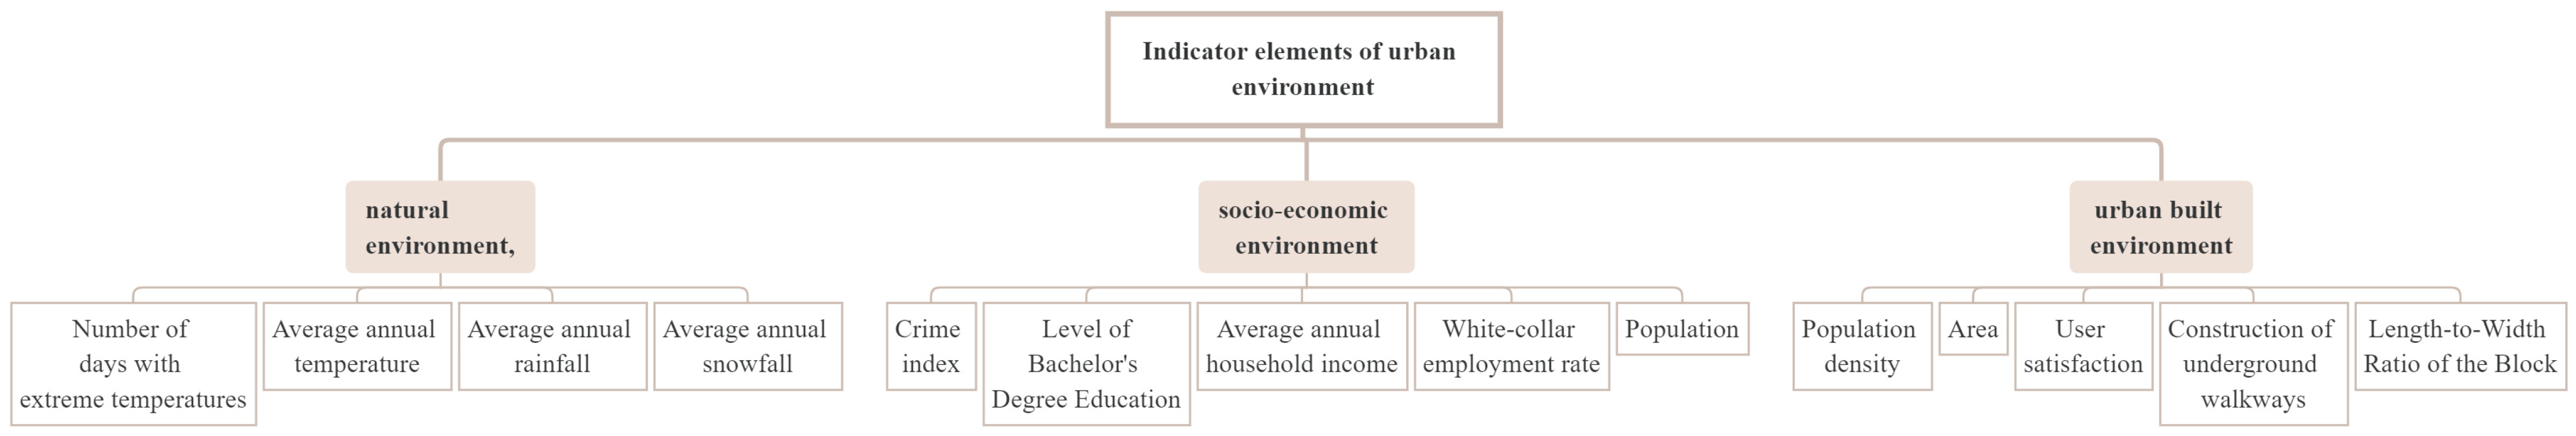
2.2. Elements of Urban Environment Indicators

2.2.1. Classification of Indicators

This subsection summarizes three types of environmental factors affecting the construction of a skywalk system, namely the natural environment, the socio-economic environment, and the urban built environment, based on relevant domestic and international research (Figure 2). The natural environment has a significant impact on the feasibility and comfort of the skywalk system [36]. Cities with extreme climates, such as high temperatures, cold weather, and heavy precipitation, are more likely to develop skywalk systems, with walkways serving as climate shelters. Socio-economic environmental factors play a crucial role in the acceptance and contestability of skywalk systems [41]. Cities with more complex social environments (e.g., high population density, high transportation demand, etc.) are more likely to generate skywalks, which can alleviate surface traffic congestion and provide alternative walking paths [7]. The urban built environment profoundly influences the form of skywalks. In addition, it is imperative to take into account the characteristics of existing buildings and the organic connection with above-ground and underground transportation systems while designing skywalks [5,8]. This ensures a harmonious integration with the surrounding environment.

2.2.2. Evaluation Factors

Factor analysis is based on the three dimensions mentioned above, namely the natural environment, social and economic environment, and urban built environment.
The natural environment includes four factors: number of days with extreme temperatures, average annual temperature, average annual rainfall, and average annual snowfall. The number of days with extreme temperatures reflects climatic extremes, with a greater number indicating a higher need for a skywalk system to provide a comfortable walking environment [42]. The average annual temperature reflects the heat profile of the climate and can influence the choice of form in which the skywalk is constructed [43]. Average annual rainfall reflects the climate’s wetness, with walkways providing rain shelter, while average annual snowfall reflects its coldness, with walkways providing shelter from wind and snow [44].
In previous studies, the social and economic environment would be measured using five factors: total crime index, level of bachelor’s degree education, average annual household income, white-collar employment rate, and regional population; in addition, they would also have an impact on the construction of the skywalk. It has been shown that population size affects the size, location, and type of skywalk systems [45]. A lower crime index suggests a less safe city, leading pedestrians to prefer closed, separate, off-the-ground walking systems [46]. A higher level of bachelor’s degree education increases the need for skywalk construction [47]. Similarly, higher average annual household incomes boost funding for skywalk construction. Additionally, a higher white-collar employment rate indicates a more modernized economic structure, driving the construction and demand for skywalks [8,36,41].
The urban built environment encompasses five factors: population density, area, user satisfaction, construction of underground walkways, and length-to-width ratio of the block. High-density areas require more access and connectivity to accommodate large volumes of pedestrian traffic [8]; in areas with dispersed populations, aerial pedestrian systems need to address issues such as connectivity, convenience, and attractiveness. The size of the tract area affects the size and layout of the aerial walk system. Larger districts allow the skywalk to function as an efficient transportation mode, connecting various functional areas [5]. User satisfaction can assess the degree of acceptance of the skywalk system by walkers, enabling targeted improvements and optimizations based on walker experiences. As a part of three-dimensional transportation improvement, the demand for aerial walking systems may be equally present in areas where underground walkways are constructed [8,39], while the aspect ratio of a block affects the design and layout of a skywalk system [3].
Therefore, this study selects indicators that have a significant impact on skywalk system design, as determined in previous research, in the construction of an evaluation system for conducting subsequent research.

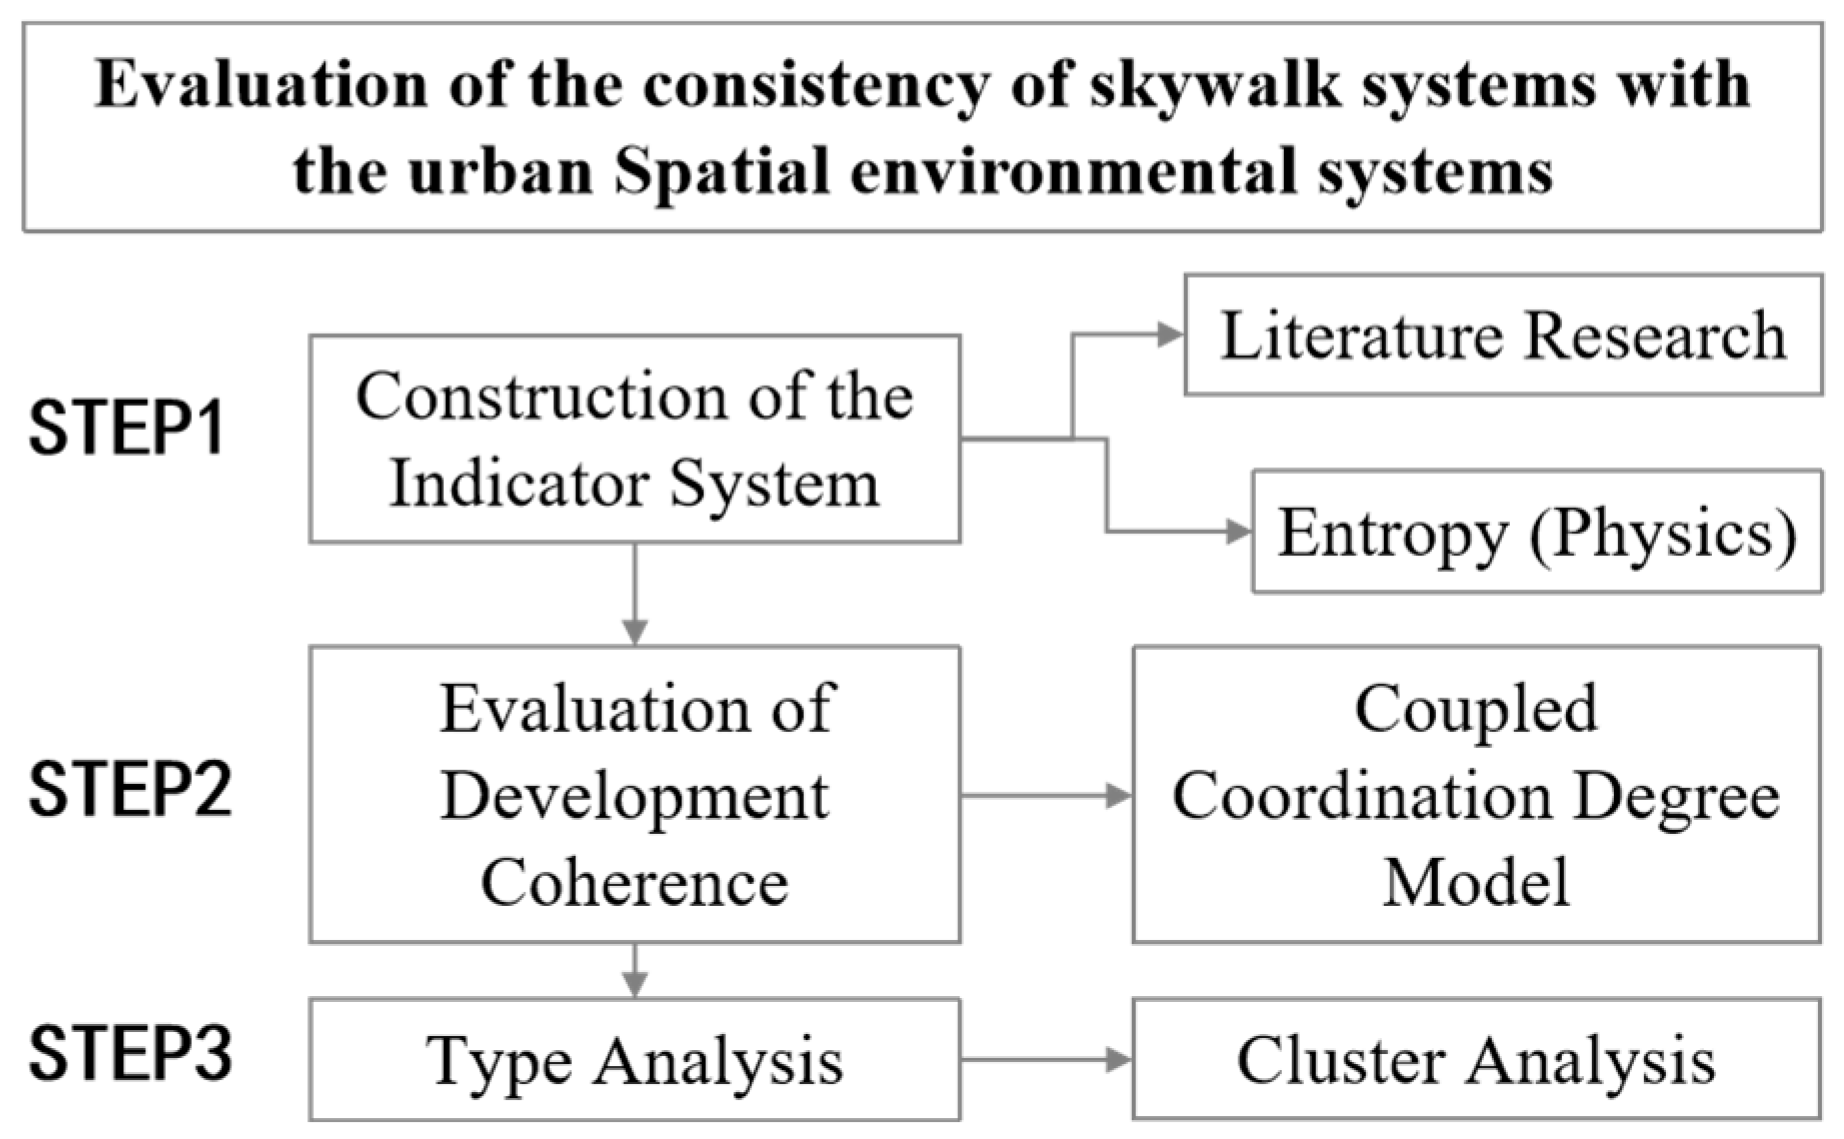
3. Materials and Methods

3.1. Coupling Degree Model

The coupled coordination model is a tool for analyzing the interactions and impacts of two or more systems and facilitates the assessment of the level of system coordination development [48]. The degree of coupling reflects the degree of interdependence between systems, and the degree of coordination measures the harmony of their interaction. In urban research, the model is widely used to assess the coordinated development of cities, infrastructure, and ecological environment. Studies such as Wang (2022), Li (2011), Wang (2019), Teng (2023), Li (2010), Xiao (2020), and Pan (2005) [49,50,51,52,53,54,55] used the model to analyze rail transit, urbanization, tourism, transportation-oriented development (TOD) station areas, commercial pedestrian neighborhoods, and the urban environment, providing valuable references for urban design.
When discussing the level of consistency between skywalk systems and the urban environment, the coupled coordination model can provide an in-depth understanding and a comprehensive assessment, and it boasts two major advantages: systematic comprehensive analysis and complexity treatment [56,57]. The coupling degree model considers the skywalk system and the urban environment as a holistic system, reveals the degree of mutual influence and coordination between the two through comprehensive analysis, and addresses the complexity of the urban environment, so as to better understand their respective levels of development consistency.

3.2. Experimental Design

The two systems of the air walking system and the urban spatial environment are selected. Firstly, two evaluation index systems are constructed separately by combining the literature research above. Secondly, the entropy value method is used to determine the weight of each index. Third, the coupling degree between the air walking system and urban spatial environment in each city is calculated. Finally, a cluster analysis is carried out according to the coupling results to classify the aerial walking system into different types and analyze the spatial distribution characteristics.
The experimental flow of this study is shown in Figure 3:

3.2.1. Experiment 1: Indicator System Construction

Firstly, the two systems of aerial walking system and urban spatial environment are selected, and the main factors affecting the development of skywalk construction are screened from the natural environment, socio-economic environment, urban built environment, and skywalk construction based on the literature research, so as to construct the two indicator systems. Secondly, the entropy value method is used to determine the weight of each indicator, which will enable the calculation of the coupling degree between each urban aerial walking system and the urban spatial environment in the next step. The calculation formula is as follows:
  • Information entropy value e
Calculate the weight of the ith sample value under the jth indicator for that indicator.
P i j = X i j i = 1 n X i j
where i is the ith row, and j is the jth column.
Calculate the information entropy for each indicator (column).
e j = K i = 1 n P i j ln ( P i j )
where n is the row.
There are logarithms in Equation (3) to determine if there is any significance. Usually, k takes the following values:
k = 1 ln ( n ) , 0 e j < 1
2.
Information utility value
d j = 1 e j
where dj is the coefficient of variation of the jth indicator.
3.
Weighting coefficient value
w j = d j j = 1 m d j
The weight values obtained will be used for subsequent composite score calculation.

3.2.2. Experiment 2: Evaluating the Coordination Levels between Skywalk Systems and Urban Development

In this study, the coupling degree model is used to analyze the development level and degree of coordination of skywalk systems in North America and Asia. First, the degree of coupling and coordination of the skywalk system is evaluated by calculating the coupling degree between the skywalk system and the urban spatial environment in each city, and analyzing the interactions and influences between the two [58]. Second, each city is classified into a different type according to the coupling results, so as to better understand the relationship between the skywalk system and urban development. Based on the literature, the coupling degree model of the two systems is constructed as follows:
C = i = 1 n X i 1 n i = 1 n X i n n
where n is the number of subsystems, and n = 2, and X represents the value of each subsystem, with a distribution interval of [0, 1]. The coupling degree C-value interval is [0, 1]. Only two subsystems are involved in this study, so n = 2 and the traditional model function can be simplified.
C = 2 x x + 1 = 2 x + 1 x , x = m i n X 1 , X 2 m a x X 1 , X 2 , x ( 0,1 ]
In the traditional model for calculating the degree of coupling, the uneven distribution of C-values can have a great impact on the evaluation results. In addition, the use of traditional models involves a variety of criteria for categorizing the degree of coupling, which can undermine the validity of the use of the C-value [59]. Therefore, referring to related studies [60], the original coupling degree calculation formula is amended as follows:
C * = 1 i > j , j = 1 n X i X j 2 λ = 1 n λ × i = 1 n X i m a x ( X i ) n 1
where xi ∈ [0, 1] and C ∈ [0, 1]. When the subsystem is more discrete, the C-value is lower, and vice versa. Compared with the traditional model, the distribution of the C-value in [0, 1] is as decentralized as possible, making the difference in C-value more pronounced and suitable for studying the two systems in this study.
Considering that the coupling degree C cannot effectively evaluate the coordination degree of the two systems, it is necessary to introduce coupling coordination degree D to construct the coordination model:
D = C * × T
T = α v 1 + β v 2
where D represents the degree of coupling coordination (coordination degree), T is the comprehensive evaluation index of the two systems, and α and β are coefficients to be determined. This study considers the skywalk and urban environment to have equal importance in this evaluation system, so α = β = 0.5, C, D ∈ [0, 1]. The specific classification criteria of coupling and coordination status are shown in Table 1:

3.2.3. Experiment 3: Cluster Analysis of Coordination Evaluation Results

In this study, a cluster analysis is used to classify urban skywalk systems in North America and Asia into different types based on the coupling results, and the characteristics of and differences between each type are analyzed. In a cluster analysis, data with similar characteristics are grouped together, and when studying the relationship between skywalk systems and urban environments, it helps identify the correspondence between different types of skywalk systems and different urban environments to better understand their construction in urban environments [61].
This study utilized K-mean clustering to divide the dataset into K clusters so that the data points within each cluster were as similar as possible and the data points between different clusters were as different as possible. The measure of similarity is usually the distance between the data points, whereby the closer the distance, the higher the similarity. The process of a K-means cluster analysis involves iteratively updating the centroids of the clusters and the division of the clusters until certain stopping conditions are met, such as the maximum number of iterations being reached, or the change in the clusters being less than a certain threshold value [62].
In the K-means program, a simple and widely used squared error cost function is used to measure the distance. It is defined as follows [63]:
E = j = 1 k i = 1 N v i c j 2
where N and k represent the data and the number of centers, respectively; and vj is a sample of the data, in this case, the location (coordinates) of the ith collision belonging to the center cj. The Euclidean norm is typically used, but other distances such as Manhattan distance or road network distance can also be employed. During the clustering process, the centers are adjusted according to specific rules to minimize the total distance inequality (11) by searching for the center cj when the data are presented. The Euclidean distance between the data samples and all centers is calculated, and the nearest center is updated according to [63]:
Δ C z t = η t ν t c z t 1
where z denotes the nearest center to the data v(t); note that the center and the data are represented at time t, where cz(t − 1) denotes the center position at the time of the previous clustering step. The adaptation rate, η(t), can be chosen in several ways. MacQueen [63] set η(t) = 1/nz(t), where nz(t) is the number of data samples that have been assigned to the center up to time t.

3.3. Selection of Influencing Factors
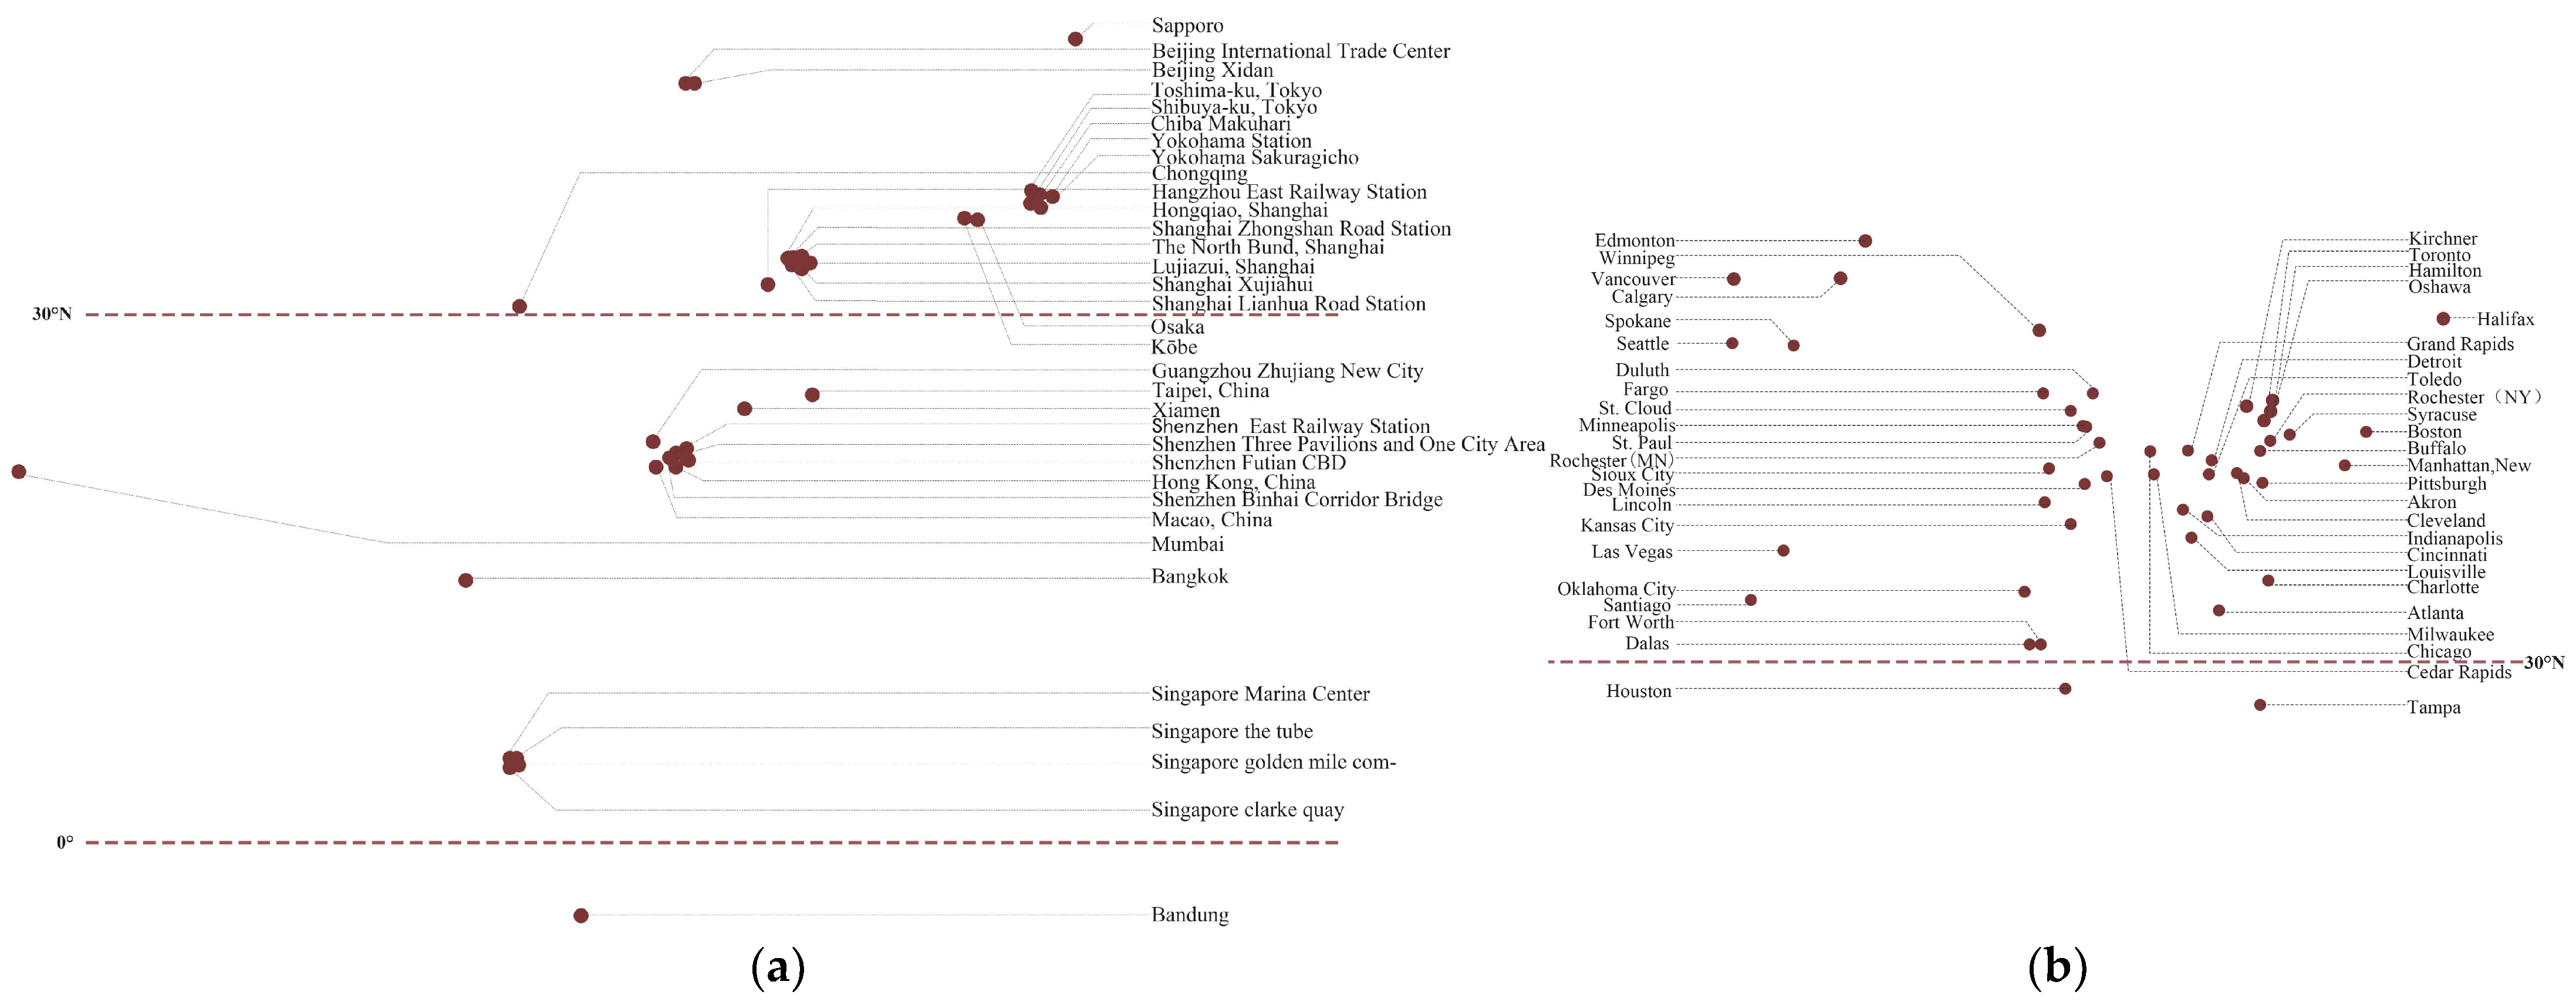
This summary constructs a system of indicators for evaluating the consistency of the development of the skywalk system and the urban spatial environment, based on the literature study mentioned above. The urban spatial environment and the skywalk system include 17 and 14 evaluation factors, respectively (Table 2). The research data are mainly sourced from official city websites, Wikipedia, Google Earth, climate websites, and transportation websites, and the data are current as of 2023. Specific indicators and their interpretations are shown in Table 2:

3.4. Cases

The reasons for selecting North America and Asia as the study areas are two fold: firstly, from an economic perspective, both North America and Asia are important regions of the global economy, and the degree of urbanization is also relatively high. This leads to cities in these regions experiencing a greater demand, and potential, for the construction of skywalk systems. Secondly, from the perspective of the urban built environment, North America and Asia differ greatly. North American cities are characterized by well-planned, spacious roads and a high greening rate, while Asian cities are characterized by high density, vertical development, and busy traffic. This contrast reflects the varied application of skywalk systems. Therefore, selecting North America and Asia as the research focus can not only reflect the global development trends of skywalk systems but also illustrate the effects of these system when applied in different environments and cultural contexts.
Eighty representative or typical cases of skywalk systems from North America and Asia were selected for this study (Figure 4). This includes 47 cases in North America and 33 in Asia. Specifically, they include America’s Minneapolis, St. Paul, Duluth, St. Cloud, Rochester, Cincinnati, Cleveland, Toledo, Akron, Des Moines, Cedar Rapids, Sioux City, Milwaukee, Dallas, Houston, Fort Worth, Rochester, New York, Buffalo, Syracuse, Boston, Atlanta, Charlotte, Chicago, Pittsburgh, Spokane, Seattle, Oklahoma City, Detroit, Grand Rapids, Tampa, San Diego, Fargo, Indianapolis, Louisville, Kansas City, Las Vegas, Lincoln. Canada’s Toronto, Hamilton, Kitchener, Oshawa, Calgary, Edmonton, Winnipeg, Vancouver, and Halifax; China’s Hong Kong, China, Taipei, China, Beijing, Macao, China, Shanghai, Hangzhou, Shenzhen, and Guangzhou; Japan’s Osaka, Chiba Makuhari, Sapporo, Tokyo, Yokohama, and Kobe; Mumbai in India; Singapore; Bandung in Indonesia; and Bangkok in Thailand.

4. Results

4.1. Coupled Coordination Analysis

By the end of 2023, 47 cases of skywalk systems were evident in North America, spreading across the United States and Canada, and 33 cases were apparent in Asia, spanning China, Japan, Southeast Asia, and India. Relevant data from these regions were input into the coupled coordination model (see Section 3.2. Experimental design for specific steps), and 80 data points that reflect the level of consistency between skywalk systems and the urban spatial environment’s development were obtained (Table 3).
From the calculation results, it is evident that the D-values of Minneapolis, Shanghai Hongqiao, Shanghai Lujiazui, and Osaka Umeda Hub are 0.815, 0.884, 0.873, and 0.857, respectively, and these skywalk systems are well coordinated with the urban spatial environment. The two systems in Toledo, Seattle, Oklahoma City, San Diego, Fargo, Kansas City, and Shanghai’s North Bund showed severe dissonance.
In terms of spatial distribution, the cases of harmonization exhibit a certain distribution pattern: the construction of skywalk systems in Asia is mainly driven by the three-dimensional development of cities, while in North America, they are more reflective of climate adaptation. In Asia, taking China as an example, pedestrian systems with higher consistency with urban development are mainly located in the Pearl River Delta and Yangtze River Delta regions, including economic and financial centers such as Hong Kong, China, Shanghai, Shenzhen, and Guangzhou. These cities, which attract significant populations and investments, are facing the challenges of “big city disease” associated with rapid urbanization, such as land scarcity, traffic congestion, and environmental pollution. Consequently, many cities have begun to explore and promote the public transportation-oriented development (TOD) mode. The skywalk system can improve the transportation facilities, increase the space utilization rate of the city, and shorten the travel time in the city. In North America, taking the United States as an example, the consistency between pedestrian systems and urban development is highest in the cold climate region around the Great Lakes and the hot climate region of southern Texas. Cities around the Great Lakes, such as Minneapolis, Chicago, and Detroit, experience harsh winters that pose significant inconvenience to pedestrian travel. Skywalk systems are constructed in these cities to ensure that pedestrians can easily reach various destinations regardless of the weather. In southern Texas, cities like Houston and Dallas require skywalk systems to provide cool and refreshing walking spaces during their hot and humid summers, which can greatly reduce walking comfort.

4.2. Cluster Analysis

As shown in Table 4, the degree of coordination between the skywalk system and the urban spatial environment was categorized using K-means cluster analysis with SPSSAU (18.0) software. As can be seen from the following table, four types of clusters were obtained with proportions of 13.75%, 28.75%, 15.00%, and 42.50%, respectively. Overall, the distribution of the four types of clusters appears to be more uniform, suggesting a better clustering effect.
After obtaining the clustering categories, an analysis of variance (ANOVA) was performed to explore the differential characteristics of each category. Referring to Table 5, it can be seen that the clustering category groups showed a statistical significance (p < 0.05) for all the research items, and the specific differences can be assessed by comparing means and eventually combining with the naming process of the clustering categories.
Cluster naming was determined based on the variability of the mean values across the four classes of clusters. The class with low coupling and low coordination was designated the first class, with a D-value interval of 0.25 ± 0.09 and a C-value interval of 0.58 ± 0.13. The second category has a D-value interval of 0.71 ± 0.10 and a C-value interval of 0.98 ± 0.02 and is named the high-coupling high-coordination category. The third category has a D-value interval of 0.52 ± 0.07 and a C-value interval of 0.70 ± 0.05 and is named the low-coupling high-coordination category. The fourth category has a D-value interval of 0.39 ± 0.11 and a C-value interval of 0.91 ± 0.07 and is named the high-coupling low-coordination category.

5. Discussion

5.1. Characteristics of Clustering

The characteristics of the four types of skywalk system types (Figure 5) and their corresponding urban environments are as follows:

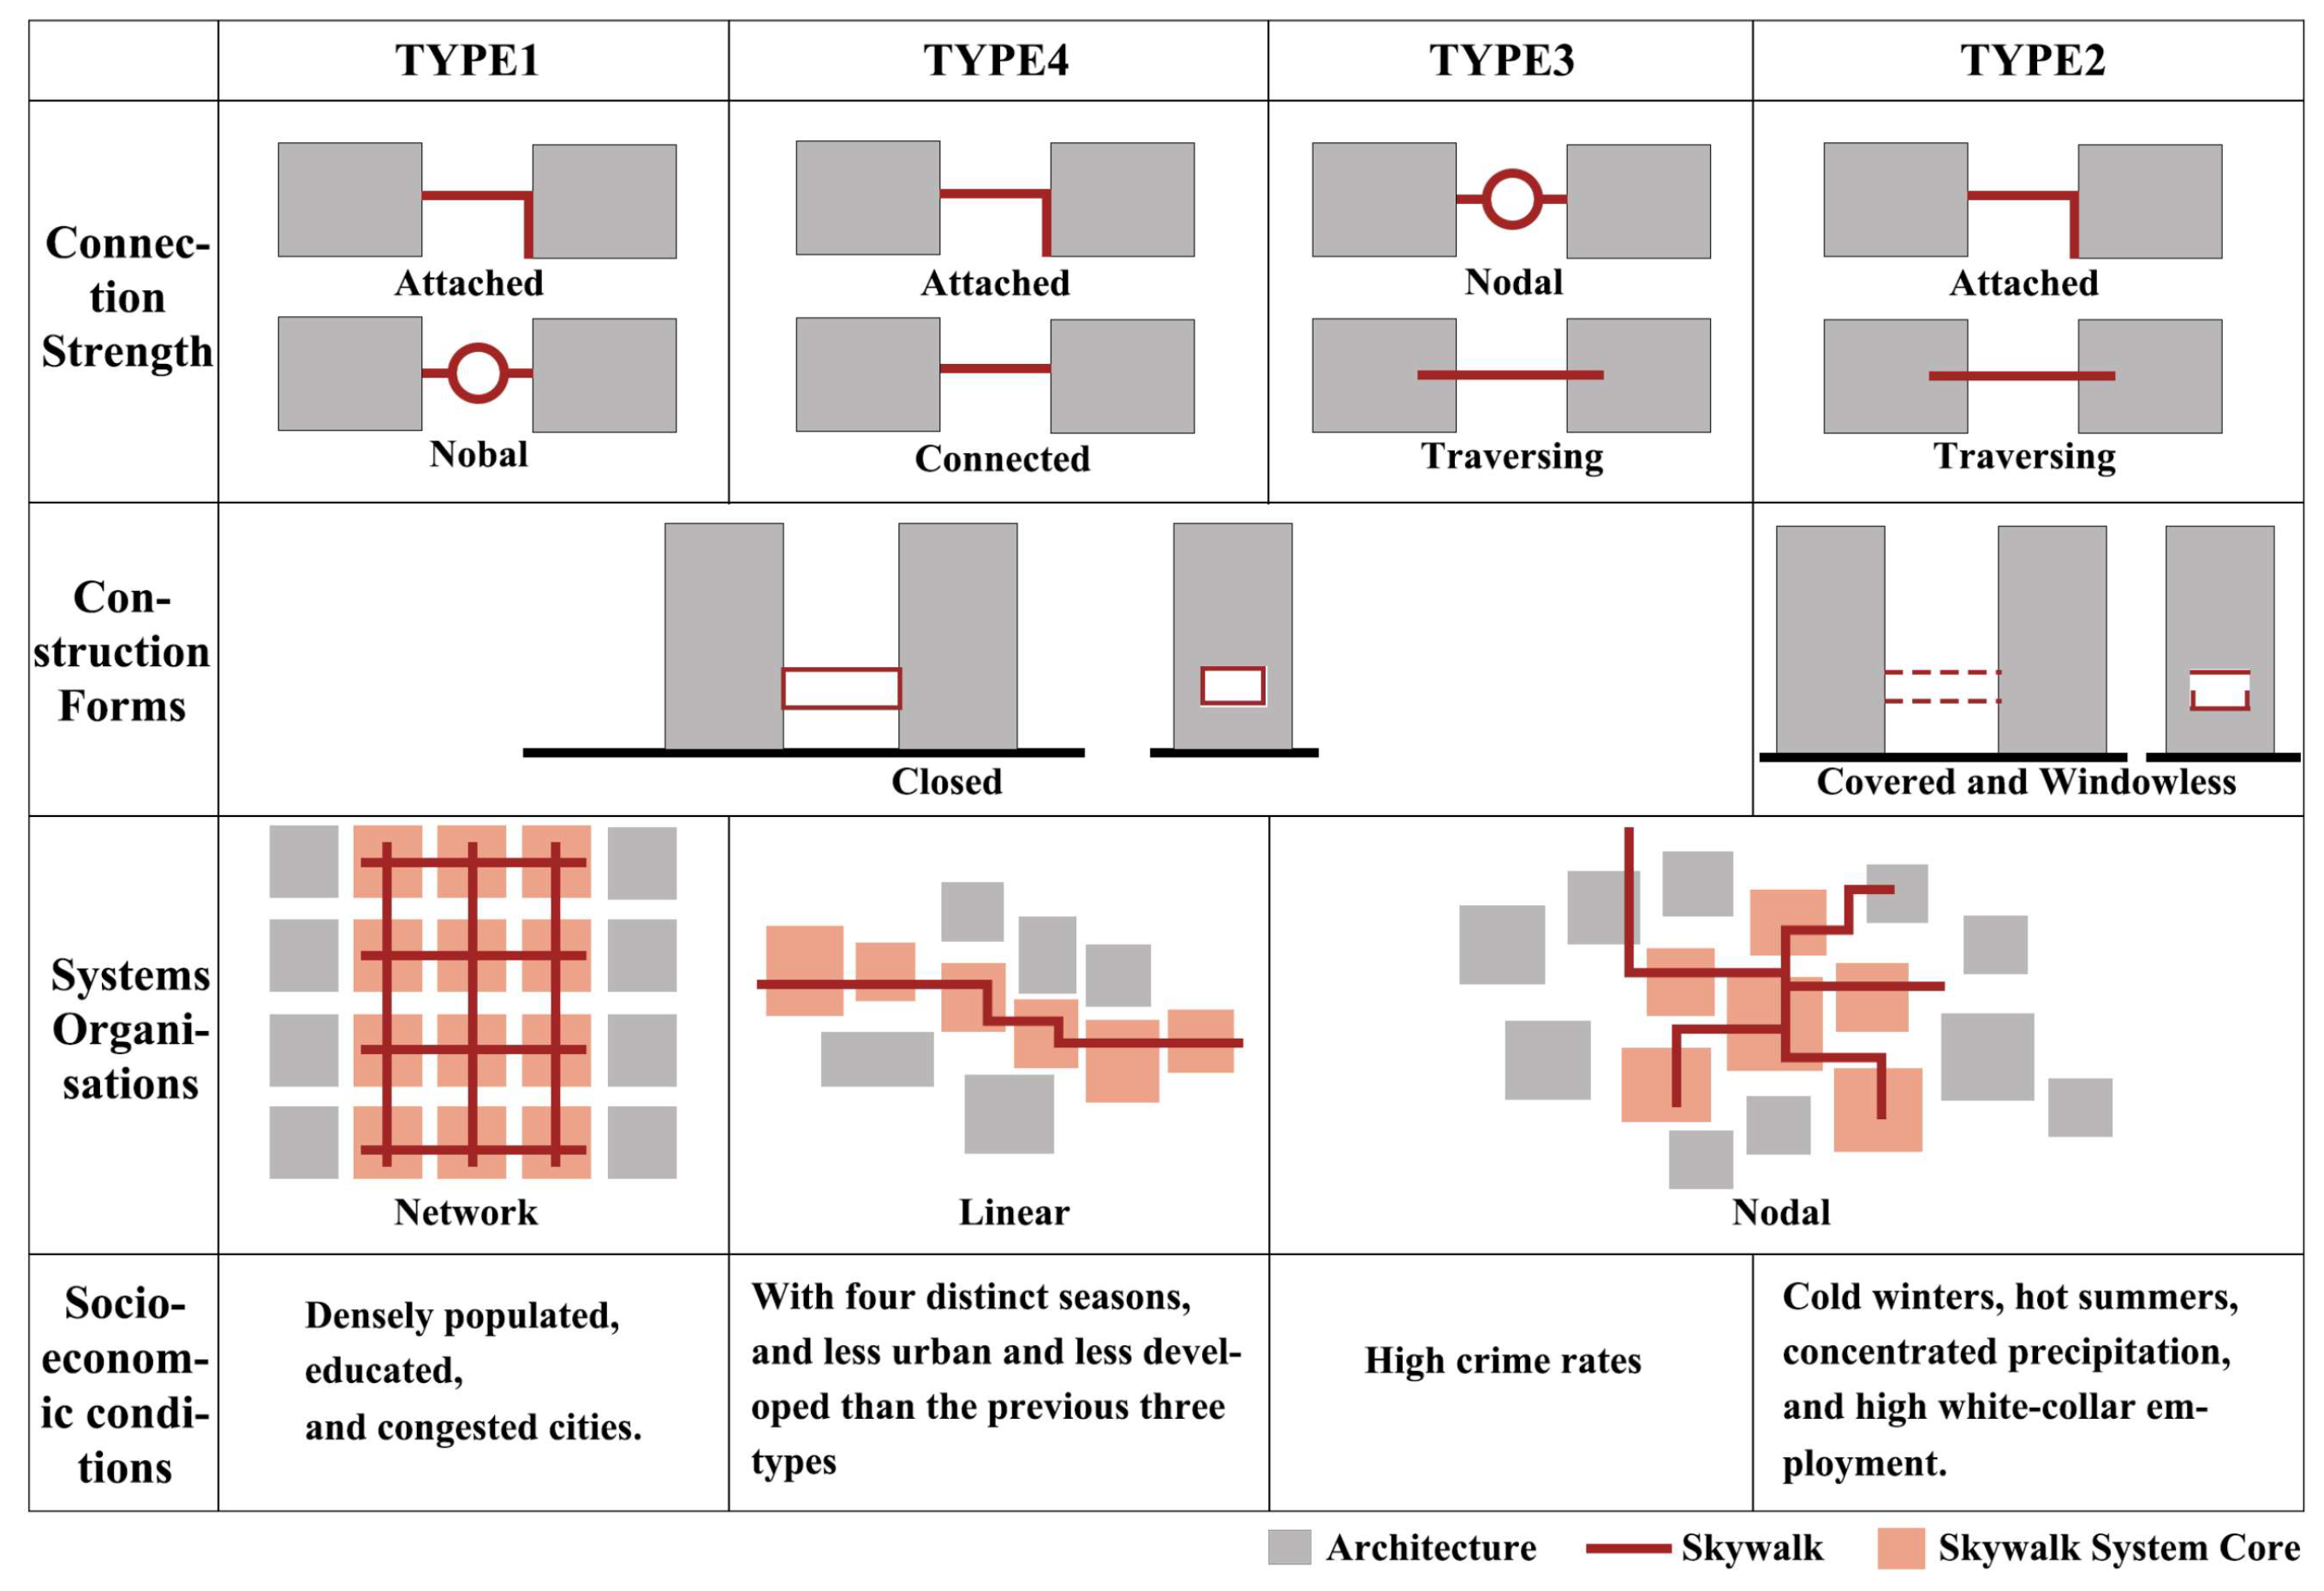
5.1.1. Type 1 (High Coupling, High Coordination): Attached and Nodal Closed Skywalk Network System

This type of system is applicable to temperate or subtropical economic centers and is suitable for densely populated, highly educated, and congested cities such as Taipei, China, Hangzhou, Hong Kong, China, Osaka, and others (Table 6). This type of skywalk system is typically longer and wider, connecting more neighborhoods to form a network structure, and constructed in the form of mostly closed and covered windowless corridors, adapting to various climates around the world.
From another point of view, the construction of such large-scale skywalks comes with high costs and management challenges, leading to increased maintenance expenses for the city. For example, the skywalk system in Guangzhou’s Zhujiang New City has encountered problems with damaged facilities thus requiring maintenance; however, despite the investment, the skywalk is not highly utilized, resulting in idle resources and a waste of urban capital.

5.1.2. Type 2 (High Coupling, Low Coordination): Traversing and Attached Covered and Windowless Skywalk Nodal System

This type of system is suitable for cities with cold winters, hot summers, concentrated precipitation, and high white-collar employment, such as Yokohama, Chiba Makuhari, New York, and Cincinnati (Table 7). The skywalks in this type of system are more moderate in length, width, and number of connected neighborhoods, forming a nodal structure. The skywalks mainly traverse and attach to increase the connectivity and flexibility of the city, promoting the functional and spatial integration of the city. They are constructed in the form of enclosed, covered, and windowless corridors.
However, this type of highly coupled pedestrian system can have a significant negative impact on ground vitality. For example, in Cincinnati, USA, the removal of the skywalk system began around 2000 to address this issue. So far, nearly a dozen skywalks have been removed, accounting for about 30% of the total volume.

5.1.3. Type 3 (Low Coupling, High Coordination): Traversing and Nodal Closed Skywalk Node Systems

Representative examples include Fargo, Oklahoma City, and Rochester (Table 8). Comparing Type 2 with Type 3, the difference is that the skywalks of this type of system are mainly traversing and nodal, the construction form is mostly closed corridor, and they are more suitable for construction in cities with high crime rates.
However, closed skywalks can result in the walking system being affected by the business hours of the interconnected buildings, thereby compromising its public accessibility. Taking the United States as an example, most of the U.S. aerial walking systems are privately owned, only accessible to the people in the building, and have set opening times (part of the building’s opening time is less than 12 h), thus not fully serving the public.

5.1.4. Type 4 (Low Coupling, Low Coordination): Attached Enclosed Skywalk Linear System

This type of system is suitable for cities with four distinct seasons, which are less urban and less developed than the previous three types. Representative examples include Tampa, Syracuse, Kansas City, and Akron (Table 9). The skywalks in this type of system are typically shorter and narrower, and connect fewer neighborhoods to form a linear structure. The skywalks are predominantly enclosed, connecting only two buildings.
However, this type of skywalk system is susceptible to a lack of unified planning and management, and the connectivity and accessibility of the skywalk system may not be as effective as expected. For example, in Rochester, New York, there are three separate skywalks, each connecting three or four buildings, but they are not connected to each other, so it is impossible to establish a complete walking system.

5.2. Limitations

There are two research shortcomings in this study: First, the sample size needs to be increased [62]. The selection of cases in this study was based on research drawn from sources in the literature and from the Internet, which could have led to an incomplete sample set. Efforts should be made to increase the sample size in future studies to explore the issues more comprehensively. Second, the study only utilized objective empowerment, whereas a combination of subjective and objective empowerment would be more appropriate [63]. This approach may have neglected subjective factors such as expert opinions or practical situations. Objective data and subjective judgment should be combined for a more comprehensive assessment of the problem.

6. Conclusions

This study quantifies the level of coordinated development and spatial distribution patterns of skywalk systems and urban spatial environments in North America and Asia through coupled coordination modeling and cluster analysis methods. It summarizes the distribution pattern of coordinated and consistent development between skywalk systems and the urban environment in North America and Asia. Specifically, this study concentrates on the cold region of the Great Lakes and the hot region of southern U.S.A., while targeting high-density cities in Asia. Four types of skywalk systems are summarized: attached and nodal closed skywalk network systems, traversing and attached covered and windowless skywalk node systems, traversing and nodal closed skywalk node systems, and attached closed skywalk linear systems; it is found that attached and nodal closed skywalk network systems tend to result in a significant waste of urban resources. The traversing and attached covered and windowless skywalk node systems have a more substantial effect on ground vitality reduction. This suggests that the higher the degree of coupling, the greater the impact on the city. Moreover, all closed skywalk systems risk undermining the positive attributes of the public spaces they occupy.
The innovation of this research lies in applying coupled coordination modeling and cluster analysis methods to study skywalk systems. An evaluation system is constructed to assess the interplay between skywalk systems and urban spatial environments. The study then evaluates the level of developmental coordination and contrasts the coordination levels between two distinct regions: North America and Asia. This study concludes that the coupling degree model can be used as an effective instrument for gauging the level of coordination level between skywalk systems and the urban environment. Furthermore, the results of the existing cases can provide data support and inform decision making for the next steps in urban renewal.

7. Data Sources

Author Contributions

Conceptualization, X.Z. and Y.H.; methodology, X.Z. and Y.H.; software, X.Z.; validation, Y.H.; formal analysis, X.Z.; investigation, X.Z.; resources, X.Z. and Y.H.; data curation, X.Z.; writing—original draft preparation, X.Z.; writing—review and editing, Y.H.; visualization, X.Z.; supervision, Y.H.; project administration, Y.H. All authors have read and agreed to the published version of the manuscript.

Funding

Beijing Social Science Foundation Planning Project (22LSB006).

Institutional Review Board Statement

This study did not require ethical approval.

Informed Consent Statement

Informed consent was obtained from all subjects involved in the study.

Data Availability Statement

See Table 2 for details.

Conflicts of Interest

Author Xiaoqian Zhang was employed by the company North China Power Engineering Co., Ltd. of China Power Engineering Consulting Group. The remaining authors declare that the research was conducted in the absence of any commercial or financial relationships that could be construed as a potential conflict of interest.

References

  1. Xia, C.; Yeh, A.G.O.; Zhang, A. Analyzing spatial relationships between urban land use intensity and urban vitality at street block level: A case study of five Chinese megacities. Landsc. Urban Plan. 2020, 193, 103669. [Google Scholar] [CrossRef]
  2. Thomas, D. Architecture and the Urban Environment, 1st ed.; Routledge: London, UK, 2007. [Google Scholar]
  3. Sun, G.; Webster, C.; Zhang, X. Connecting the city: A three-dimensional pedestrian network of Hong Kong. Environ. Plan. B Urban Anal. City Sci. 2021, 48, 60–75. [Google Scholar] [CrossRef]
  4. Zhao, J.; Sun, G.; Webster, C. Walkability scoring: Why and how does a three-dimensional pedestrian network matter? Environ. Plan. B Urban Anal. City Sci. 2021, 48, 2418–2435. [Google Scholar] [CrossRef]
  5. Chen, J.Y.; Yan, Z.F.; Fan, R. Elements of the core area transport system oriented to station–city integration. Comput. Electr. Eng. 2023, 110, 108842. [Google Scholar] [CrossRef]
  6. Samant, S. Cities in the Sky: Elevating Singapore’s Urban Spaces. Int. J. High-Rise Build. 2019, 8, 137–154. [Google Scholar]
  7. Silvia, G. Skywalks as Heritage: Exploring Alternatives for the Cincinnati Skywalk System; University of Cincinnati: Cincinnati, OH, USA, 2009. [Google Scholar]
  8. Cui, J.; Allan, A.; Lin, D. The development of grade separation pedestrian system: A review. Tunn. Undergr. Space Technol. 2013, 38, 151–160. [Google Scholar] [CrossRef]
  9. Nurcahya, Y.; Hadiansyah, T.; Yosita, L.; Akbar, A.S.; Allatif, I.G.M.; Hilmayani, S.L. Revitalization Skywaklk Bandung 2021 Reviving the Urban Area “Urban Space” in Bandung. J. Archit. Res. Educ. 2021, 3, 128–135. [Google Scholar] [CrossRef]
  10. Wang, W. The Vertical Street as Everyday Place in the High-Density City: A Case Study of Mong Kok, Hong Kong. Space Cult. 2023, 2023, 12063312231159197. [Google Scholar] [CrossRef]
  11. Kim, C.S. A Recommendation for Improving the Sense of Orientation by Enhancing Visual Communication on Wayfinding Systems: A Case Study of Minneapolis Skyway System; Iowa State University: Ames, IA, USA, 2008. [Google Scholar]
  12. Robertson, K.A. Pedestrianization strategies for downtown planners: Skywalks versus pedestrian malls. J. Am. Plan. Assoc. 1993, 59, 361–370. [Google Scholar] [CrossRef]
  13. Gehl, J. Cities for People; Island Press: Washington, DC, USA, 2013. [Google Scholar]
  14. Byers, J. The privatization of downtown public space: The emerging grade-separated city in North America. J. Plan. Educ. Res. 1998, 17, 189–205. [Google Scholar] [CrossRef]
  15. Lee, B.S. Privatization of Urban Public Space: A Case Study of des Moines Skywalk System; Iowa State University: Ames, IA, USA, 1989. [Google Scholar]
  16. Pai, J.T.; Lee, C.P.; Cheng, J.J. Exploring issues and strategies of developing skyway systems: A case study of the Taipei Shin-Yi district. In Proceedings of the Eastern Asia Society, Tokyo, Japan, 1 December 2007. [Google Scholar]
  17. Robertson, K.A. Downtown retail revitalization: A review of American development strategies. Plan. Perspect. 1997, 12, 383–401. [Google Scholar] [CrossRef]
  18. Wan, S.W.S. The role of the skywalk system in the development of Hong Kong’s central business district. In Proceedings of the Annual Meeting of the Association of American Geographers, San Francisco, CA, USA, 17–21 April 2007. [Google Scholar]
  19. Xiao, R. Refined design and inspiration of Hong Kong’s skywalk system. Shanghai Urban Plan. 2021, 1, 119–126. (In Chinese) [Google Scholar]
  20. Wu, L.; Lu, W.; Yu, H.; Gu, Z.C. Patterns, logic and mechanisms of pedestrian system development in rail hub station areas-a comparative study based on three asian cases. Int. Urban Plan. 2020, 35, 88–95. (In Chinese) [Google Scholar]
  21. Zhuang, Y.; Chen, J. Exploring the three-dimensional city under high density. Times Archit. 2023, 2, 6–13. (In Chinese) [Google Scholar]
  22. Wu, L.; Lu, W.; Zhang, S. Composition and characteristics of public space system of rail transit hubs under the mode of “station-city integration development”-taking osaka-umeda hub as an example. New Archit. 2017, 6, 142–146. (In Chinese) [Google Scholar]
  23. Villani, C.; Talamini, G. Socialising on a Skywalk: How Hong Kong’s elevated walkways become public open spaces. Asian J. Environ.-Behav. Stud. 2020, 5, 57–72. [Google Scholar] [CrossRef]
  24. Harris, A. Engineering Formality: Flyover and Skywalk Construction in Mumbai. Int. J. Urban Reg. Res. 2018, 42, 295–314. [Google Scholar] [CrossRef]
  25. Dewa, Z.R. Revitalization of PKL in the Skywalk Area, Cihampelas, Bandung City: Between Policy and Reality. Cosmogov. J. Ilmu. Pemerintah. 2019, 5, 58–70. [Google Scholar]
  26. Wu, J.; Zhuang, Y.; Chen, J. Study on the airborne pedestrian system in rail station area and its driven urban development. Archit. Tech. 2020, 26, 46–51. (In Chinese) [Google Scholar]
  27. Xiao, R.; Liu, L. A study on the planning and implementation operation of Hong Kong’s skywalk system. Int. Urban Plan. 2020, 35, 136–143. (In Chinese) [Google Scholar]
  28. Lv, X.; Zhu, R.; Zhang, R.; Zhou, S. A Study on Urban Spatial Resources Integration in the Center of Metropolis: Urban Regeneration in ‘Golden Triangle’ Area, Shenzhen. Urban Plan. Int. 2010, 2, 48–52. (In Chinese) [Google Scholar]
  29. Kent, A.R. Pedestrian skywalks in Calgary, Canada: A comparison with US downtown systems. Cities 1987, 4, 207–214. [Google Scholar]
  30. Wang, X.; Chen, X. A Preliminary Study of the Aerial Walking System in the City Center—Taking the “+15 walkway” in Calgary, Canada as an example. Sichuan Build. Sci. 2013, 39, 267–273. (In Chinese) [Google Scholar]
  31. Mahendra, F.; Andriansyah, D.; Permata, N.I. Skywalk Farming and Interactive Space: The Application of Urban Farming in Urban Area as a Media for Reducing Outdoor Temperature, Improving Economic Quality, Environmental ducation, and City Reforestation. In Proceedings of the 3rd International Conference of Integrated Intellectual Community, Hanover, Germany, 28–29 April 2018. [Google Scholar]
  32. Kwok, E.; Spurr, S. Skywalking in Hong Kong: Disrupting flows in the consumerist wonderland. Lusofona J. Archit. Educ. 2013, 8–9, 387–406. [Google Scholar]
  33. Al-Kodmany, K.; Xue, Q.; Sun, C. Reconfiguring Vertical Urbanism: The Example of Tall Buildings and Transit-Oriented Development (TB-TOD) in Hong Kong. Buildings 2022, 12, 197. [Google Scholar] [CrossRef]
  34. Peng, Q. Construction mode and applicability of elevated pedestrian walkway. Urban Transp. 2011, 9, 34–42. (In Chinese) [Google Scholar]
  35. Miao, P. Public Places in Asia Pacific Cities: Current Issues and Strategies; Springer Science & Business Media: Dordrecht, The Netherlands, 2001. [Google Scholar]
  36. Woo, P.; Malone-Lee, L.C. Evaluating skywalk systems as a response to high-density living in Hong Kong. Dialogues Urban Reg. Plan. 2013, 5, 264–279. [Google Scholar]
  37. Banerjee, A.; Maurya, A.K. Planning for Better Skywalk Systems Using Perception of Pedestrians: Case Study of Mumbai, India. J. Urban Plan. Dev. 2020, 146, 05020003. [Google Scholar] [CrossRef]
  38. Ye, J. Systematic Research on Urban Skywalks; Tongji University: Shanghai, China, 2005. [Google Scholar]
  39. Cui, J.; Allan, A.; Lin, D. Assessing grade separation pedestrian systems: Planning, design and operation. Urban Des. Int. 2015, 20, 241–252. [Google Scholar] [CrossRef]
  40. Chen, L. From Industrial Remains to Urban Public Space—The Adaptive Design and Use of La Promenade Plantée in Paris. Survey, Research and Protection of China’s Industrial Architectural Heritage. In Proceedings of the 6th Symposium on Industrial Architectural Heritage in China 2015, Guangzhou, China, 21 November 2015. (In Chinese). [Google Scholar]
  41. Murakami, J.; Villani, C.; Talamini, G. The capital value of pedestrianization in Asia’s commercial cityscape: Evidence from office towers and retail streets. Transp. Policy 2021, 107, 72–86. [Google Scholar] [CrossRef]
  42. Crane, J.F. An Indoor Public Space for a Winter City; Massachusetts Institute of Technology: Cambridge, MA, USA, 2005. [Google Scholar]
  43. Ruefenacht, L.; Acero, J.A. Strategies for Cooling Singapore: A Catalogue of 80+ Measures to Mitigate Urban Heat Island and Improve Outdoor Thermal Comfort; Cooling Singapore (CS): Singapore, 2017. [Google Scholar]
  44. Davies, W.K.D. Theme Cities: Solutions for Urban Problems; Springer: Dordrecht, The Netherlands, 2015; pp. 277–310. [Google Scholar]
  45. Banerjee, A.; Das, S.; Maurya, A.K. Behavioural characteristics influencing walking speed of pedestrians over elevated facilities: A case study of India. Transp. Policy 2024, 147, 169–182. [Google Scholar] [CrossRef]
  46. Minton, A. The Privatisation of Public Space; Royal Institute of Chartered Surveyors: London, UK, 2006. [Google Scholar]
  47. Tesfaldet, Y.T.; Ndeh, N.T.; Budnard, J.; Treeson, P. Assessing face mask littering in urban environments and policy implications: The case of Bangkok. Sci. Total Environ. 2022, 806, 150952. [Google Scholar] [CrossRef] [PubMed]
  48. Mulas, M.G.; Lai, E.; Lastrico, G. Coupled analysis of footbridge-pedestrian dynamic interaction. Eng. Struct. 2018, 176, 127–142. [Google Scholar] [CrossRef]
  49. Wang, Z.; Li, X.; Bobylev, N.; Li, S.; Liu, J. Coupling Coordination of “Urban Rail Transit—Social Economy” Composite System. Infrastructures 2022, 7, 56. [Google Scholar] [CrossRef]
  50. Li, Y.; Li, Y.; Zhou, Y.; Shi, Y.; Zhu, X. Investigation of a coupling model of coordination between urbanization and the environment. J. Environ. Manag. 2012, 98, 127–133. [Google Scholar] [CrossRef] [PubMed]
  51. Wang, Q.; Mao, Z.; Xian, L.; Liang, Z. A study on the coupling coordination between tourism and the low-carbon city. Asia Pac. J. Tour. Res. 2019, 24, 550–562. [Google Scholar] [CrossRef]
  52. Li, T.; Zhong, C.; Cai, L. Study on the Spatial Type Differentiation of Guangzhou Metro TOD Zones: Based on “Node-Place-Linkage” Coupling Model. Urban Insight 2023, 4, 103–111. (In Chinese) [Google Scholar]
  53. Li, C. Study on the Degree of Spatial Coupling between Rail Station Areas and Urban Public Center Areas; South China University of Technology: Guangzhou, China, 2010. (In Chinese) [Google Scholar]
  54. Xiao, Y.; Li, Z.; Wang, B.; Wu, D. Quantitative Research on Spatial Vitality of Commercial Pedestrian Neighborhoods Based on System Coupling—Taking Dalian City as an Example. Urban Constr. 2020, 31, 16–20. (In Chinese) [Google Scholar]
  55. Pan, H.; Ren, C. The Spatial Coupling Relationship between Rail Transit and Urban Public Activity Center System—Taking Shanghai as an Example. J. Urban Plan. 2005, 4, 76–82. (In Chinese) [Google Scholar]
  56. Liu, N.; Liu, C.; Xia, Y.; Da, B. Examining the coordination between urbanization and eco-environment using coupling and spatial analyses: A case study in China. Ecol. Indic. 2018, 93, 1163–1175. [Google Scholar] [CrossRef]
  57. Luo, D.; Liang, L.; Wang, Z.; Chen, L.; Zhang, F. Exploration of coupling effects in the Economy–Society–Environment system in urban areas: Case study of the Yangtze River Delta Urban Agglomeration. Ecol. Indic. 2021, 128, 107858. [Google Scholar]
  58. Wang, S.J.; Kong, W.; Ren, L.; Zhi, D.D.; Dai, B.T. Research on misuses and modification of couplingcoordination degree model in China. J. Nat. Resour. 2021, 36, 793–810. [Google Scholar]
  59. Matamoros-Jiménez, C.; Hernández-Vega, H. Clustering Approach to Generate Pedestrian Traffic Pattern Groups: An Exploratory Analysis. Cienc. Ing. Neogranadina 2021, 31, 41–59. [Google Scholar]
  60. Kim, K.; Yamashita, E.Y. Using ak-means clustering algorithm to examine patterns of pedestrian involved crashes in Honolulu, Hawaii. J. Adv. Transp. 2007, 41, 69–89. [Google Scholar] [CrossRef]
  61. MacQueen, J. Some methods for classification and analysis of multivariate observations. In Proceedings of the Fifth Berkeley Symposium on Mathematical Statistics and Probability, Los Angeles, CA, USA, 21 June 1965; University of California: Los Angeles, CA, USA, 1965. [Google Scholar]
  62. Vasileiou, K.; Barnett, J.; Thorpe, S.; Young, T. Characterising and justifying sample size sufficiency in interview-based studies: Systematic analysis of qualitative health research over a 15-year period. BMC Med. Res. Methodol. 2018, 18, 148. [Google Scholar] [CrossRef] [PubMed]
  63. Xu, B.; Qi, N.; Zhou, J.; Li, Q. Reliability assessment of highway bridges based on combined empowerment–TOPSIS method. Sustainability 2022, 14, 7793. [Google Scholar] [CrossRef]
Figure 1. Indicator elements of a skywalk system.
Applsci 14 08488 g001
Figure 2. Indicator elements of urban environment.
Applsci 14 08488 g002
Figure 3. Experimental flowchart.
Applsci 14 08488 g003
Figure 4. (a) North American case distribution; (b) Asian case distribution.
Applsci 14 08488 g004
Figure 5. Summary of skywalk system types.
Applsci 14 08488 g005
Table 1. Criteria for categorizing states of coupling and coordination.
Value[0, 0.2)[0.2, 0.4)[0.4, 0.6)[0.6, 0.8)[0.8, 1.0]
CNarrow couplingLow
coupling
Middle couplingGood
coupling
High
coupling
DSerious imbalanceGeneral imbalanceNarrow coordinationGeneral coordinationHigh coordination
Table 2. Indicators for evaluating the consistency between skywalks and urban environmental construction.
OBJFirst IndicatorsSecondary IndicatorsInterpretation of IndicatorsReferences
Skywalk
Indicator System
B1 ScaleC1 LengthThe existing length of the skywalk[36]
C2 WidthAverage of all skywalk widths[37]
C3 Number of connected blocksTotal number of neighborhoods traversed by the skywalk[6]
B2 Plan connection strengthC4 Connection onlyThe skywalk only serves to connect the two buildings[38]
C5 Through the buildingSkywalk runs through the building and takes up space within the building
C6 AttachedSkywalk is attached to the building
C7 NodalThe skywalk zooms in locally to form spatial nodes
B3 Profile connection strengthC8 Low area connectionThe skywalk is located on the lower level of the building and connects the commercial[12]
C9 High area connectionThe skywalk is located on the upper floors of the building and connects the offices
B4 The spatial structureC10 LinearOnly linear and weakly connected[20]
C11NodalDiffuse and more connected
C12 NetworkBuild on the first two to a particular scale
B5 Vertical
transportation connection
C13 Inside the buildingVertical transportation on the skywalk is located indoors or outdoors[5]
C14 Outside the building
B6 Closure attributeC15 ClosedForms of enclosure for skywalks[39]
C16 Roofless and windowless[40]
C17 Covered and windowless
Urban spatial environmental indicator systemB1
Natural
Environment
C1 Number of days with extreme temperaturesNumber of days with daily minimum temperature less than 0 °C or daily maximum temperature greater than 35 °C[42]
C2 Average annual temperatureAverage of daily temperatures for each day of the year[43]
C3 Average annual rainfallTotal rainfall for a given location over a number of years divided by the number of years[44]
C4 Average annual snowfallTotal snowfall for a given location for many years divided by the number of years
B2 Socio-economic environmentC5 Crime indexCrime rates or safety factors published on websites/reports[46]
C6 Level of Bachelor’s Degree EducationThe proportion of the total population with a university degree or higher in the region[47]
C7 Average annual household incomeAverage annual household income as published on websites/reports
C8 White-collar employment rateWhite-collar workers in the region as a percentage of the employed population[8,36,41]
C9 PopulationTotal population in areas with skywalk construction[45]
B3 Urban built environmentC10 Population densityThe ratio of regional population to the regional area[8]
C11 AreaThe site area of the area where the skywalk is constructed[5]
C12 User satisfactionPedestrian perceptions of skywalk use[36]
C13 Construction of underground walkwaysWhether an underground walkway is also being constructed in the area where the skywalk is installed[8,39]
C14 Length-to-Width Ratio of the BlockThe ratio of the long side to the short side of the block[3]
Among these indictors, C4–C17 are logic variables, with data derived from map analysis and street view observations. The assignment rule is “1” for “yes”, and “0” for “no”. The C12 indicators of an urban environment are categorical variables, sourced from questionnaires. The assignment rules are “1” for “good feeling”, “2” for “fair feeling”, and “3” for “poor feeling”. The C13 indicators of the urban environment are also logic variables. The assignment rule is “1” for “yes” and “0” for “no.” The C12 data are taken from a questionnaire; the link to the questionnaire is https://www.wjx.cn/vm/P07rmQ6.aspx# (accessed on 15 January 2024)
Table 3. Calculation results of coupling coordination degree.
CityC-ValueT-ValueD-ValueLevelCityC-ValueT-ValueD-ValueLevel
Minneapolis0.9540.6970.8159Kirchner0.9860.1450.3774
St. Paul0.7390.5140.6177Oshawa0.8860.1370.3494
Duluth0.6160.4660.5366Calgary0.7380.5380.6307
St. Cloud0.5600.3290.4295Edmonton0.9920.5640.7488
Rochester0.6660.4830.5676Winnipeg0.9360.2020.4355
Cincinnati0.8880.2610.4825Vancouver0.8900.1760.3964
Cleveland0.9780.1190.3424Halifax0.8790.1900.4095
Toledo0.9890.0120.1102Hong Kong, China0.9840.6300.7878
Akron0.4190.2760.3404Taipei, China1.0000.4790.6927
Des Moines0.8510.2870.4945Beijing Xidan0.9090.3320.5496
Cedar Rapids0.8150.2600.4605Beijing International Trade Center0.8430.3020.5056
Sioux City0.5310.2210.3424Macao, China0.8780.2740.4905
Milwaukee0.7440.3280.4945Hongqiao, Shanghai0.9730.8040.8849
Dalas0.7630.3370.5076Lujiazui, Shanghai0.9660.7880.8739
Houston0.9920.4940.7008Shanghai Zhongshan Road Station0.9940.3330.5756
Fort Worth1.0000.0960.3104Shanghai Lianhua Road Station0.9660.3700.5986
Rochester0.3940.2310.3024Shanghai Xujiahui0.7220.2330.4105
Manhattan0.9720.6290.7818The North Bund, Shanghai0.7920.0490.1982
Buffalo0.9880.1100.3294Hangzhou East Railway Station0.9890.3680.6037
Syracuse0.6320.0710.2123Shenzhen Futian CBD0.9980.5020.7088
Boston0.4250.1060.2123Shenzhen Three Pavilions and One City Area0.9810.3610.5956
Atlanta0.6540.3210.4585Shenzhen East Railway Station0.9800.3620.5966
Charlotte0.9780.1430.3734Shenzhen Binhai Corridor Bridge0.9660.5910.7568
Chicago0.9700.4310.6477Shekou, Shenzhen0.9930.1950.4405
Pittsburgh0.7500.2900.4675Guangzhou Zhujiang New City0.9880.4990.7028
Spokane0.8140.1630.3644Osaka0.9800.7500.8579
Seattle0.9950.0150.1222Makuhari Messe0.6700.5280.5946
Oklahoma City0.6880.0560.1952Sapporo0.9310.2930.5226
Detroit1.0000.1280.3584Toshima-ku, Tokyo0.9990.2000.4475
Grand Rapids0.9230.2600.4905Shibuya-ku, Tokyo0.9930.5950.7688
Tampa0.6520.0660.2073Yokohama Station0.9650.5580.7348
Santiago0.7580.0420.1782Yokohama Sakuragicho0.6730.3550.4895
Fargo0.7240.0470.1842Kōbe0.6400.4380.5306
Indianapolis0.8360.1810.3884Mumbai1.0000.3250.5706
Louisville0.8650.1670.3804Singapore Marina Center0.8500.2900.4965
Kansas City0.5880.0520.1752Singapore Clarke Quay0.9080.2050.4325
Las Vegas0.9000.2160.4415Singapore The Tube0.8660.2710.4855
Lincoln0.7950.0530.2053Singapore Golden Mile Complex0.9380.1920.4255
Toronto0.9940.5710.7538Bandung0.9380.3520.5756
Hamilton0.9720.1610.3964Bangkok0.9120.1860.4115
Among them, the C-value is the coupling degree. The more significant the value, the greater the system interaction. The D-value is the coupling coordination degree. The larger the value, the higher the degree of coordination between the systems. The T-value is the coordination index. The coordination level is divided into 2–9 levels, representing the coupling coordination degree of severe disorder, moderate disorder, mild disorder, on the verge of dissonance, some coordination, primary coordination, intermediate-level coordination, well-coordinated.
Table 4. Summary of basic information on clustering categories.
Clustering CategoryFrequencyPercentage (%)
cluster_11113.75%
cluster_22328.75%
cluster_31215.00%
cluster_43442.50%
Total80100%
Table 5. Clustered category ANOVA difference comparison results.
Results of Clustered Category ANOVA Difference Comparisons (Mean ± Standard Deviation)Fp
Low Coupling and Low Coordination (n = 11)High Coupling and High Coordination (n = 23)Low Coupling and High Coordination (n = 12)High Coupling and Low Coordination (n = 34)
D 20.25 ± 0.090.71 ± 0.100.52 ± 0.070.39 ± 0.1172.5510.000 1
C 30.58 ± 0.130.98 ± 0.020.70 ± 0.050.91 ± 0.07121.1610.000 1
1 p < 0.05. 2 D-values represent coupling coordination. 3 C-values represent coupling.
Table 6. Data on Elements of Urban Environment Indicators for typical cities of type 1.
C1C2 (°C)C3
(mm)
C4
(mm)
C5C6
(%)
C7
(USD)
C8
(%)
C9
(Thousands)
C10 (km2)C11 (Thousands/km2)C12C13C14
Hong Kong, China1425.02131.00.021.660.6762,7750.51243.312.5519.38311.0
Taipei, China821.12219.00.014.830.6556,528.60.53206.011.2118.38310.9
Hangzhou7117.11492.0176.017.340.1441,324.50.411323.59.30142.31111.2
Osaka1815.81475.0439.033.430.5450,3700.39129.410.3312.53311.0
Table 7. Data on Elements of Urban Environment Indicators for typical cities of type 2.
C1C2 (°C)C3
(mm)
C4
(mm)
C5C6
(%)
C7
(USD)
C8
(%)
C9
(Thousands)
C10 (km2)C11 (Thousands/km2)C12C13C14
Cincinnati11612.81206.2289.650.39115,2780.9415.22.545.98301.0
New York6613.21257.8756.9150.39203,1490.96304.01.75173.71303.8
Chiba Makuhari6015.51768.01510.030.970.5374,8750.3326.05.224.98201.2
Yokohama1115.31508.0723.014.60.5745,0370.37105.37.0314.98211.0
Table 8. Data on Elements of Urban Environment Indicators for typical cities of type 3.
C1C2 (°C)C3
(mm)
C4
(mm)
C5C6
(%)
C7
(USD)
C8
(%)
C9
(Thousands)
C10 (km2)C11 (Thousands/km2)C12C13C14
Rochester1577.1880.61348.7190.2279,1590.554.00.2516.00201.0
New York9816.3924.3170.240.1762,4630.7411.82.414.90102.3
Yokohama1745.2608.31305.620.2275,3890.781.87.500.24201.0
Table 9. Data on Elements of Urban Environment Indicators for typical cities of type 4.
C1C2 (°C)C3
(mm)
C4
(mm)
C5C6
(%)
C7
(USD)
C8
(%)
C9
(Thousands)
C10 (km2)C11 (Thousands/km2)C12C13C14
Akron12110.91055.91198.940.0835,0740.755.31.084.89101.0
Syracuse1389.21013.03246.180.1746,6770.917.45.691.30200.5
Tampa022.81256.80.0200.32118,6570.9316.07.582.11301.0
Kansas City1811.0637.0140.720.3470,8580.914.10.2516.14200.6
Disclaimer/Publisher’s Note: The statements, opinions and data contained in all publications are solely those of the individual author(s) and contributor(s) and not of MDPI and/or the editor(s). MDPI and/or the editor(s) disclaim responsibility for any injury to people or property resulting from any ideas, methods, instructions or products referred to in the content.

