Abstract
The evaluation methods for shale gas resources and the key parameters involved are diverse. The main research object of this article is the key parameters in shale gas resource evaluation, and this study aims to quantitatively evaluate the required key parameters for calculation, thereby improving the credibility of shale gas resource evaluation results. This article mainly analyzes the weight analysis of the key parameters used in the resource evaluation process, focusing on the analysis and determination of key parameters controlling the generation, enrichment, and preservation of shale gas. The key parameters are graded and evaluated layer by layer, and the common key parameters that participate in the determination are extracted. Based on the above analysis, a weight conversion model is proposed to quantitatively evaluate the actual importance of key parameters in resource evaluation. By combining statistical research, the partial correlation coefficients in the correlation coefficients are applied to estimate the resource quantities in the exploration field in order to quantitatively evaluate the credibility of the resource evaluation results. This article focuses on the weight assignment of key parameters for calculating the resource quantity of the Jiaoshiba shale gas field in the Fuling area of Chongqing and obtains different weight results for different parameters. Using this method to assign key parameter weights to the target block can provide reliable parameter support for shale gas resource evaluation and provide strong support for shale gas resource estimation.
1. Introduction
Shale gas refers to the accumulation of natural gas mainly in the form of adsorption or free state, located in dark shale or high-carbon shale. Regarding the research on shale gas development in China, Zhang Jinchuan and others began research on shale gas generation, enrichment, evaluation, and development as early as 1999. Years of exploration work have shown that China has excellent conditions for shale gas development and enormous resource potential [1,2]. The geological conditions for the development of shale gas in China are variable. Gas-bearing shale in China has the overall characteristics of high organic matter abundance, a high degree of thermal evolution, and a high degree of later changes. Shale varies greatly with the general gas content, but single-well production varies greatly [3]. At the same time, it has hidden characteristics for traditional gas reservoirs. Regarding the enrichment law, shale gas reservoirs are self-generating and self-storing gas reservoirs that are rich in organic matter shale, integrating generation, storage, and sealing. There are various types of gas sources, and the enrichment of shale gas reservoirs is influenced by various factors. Among them, the effective thickness of shale, organic carbon content, and the development degree of pores and fractures have the greatest impact on the enrichment of shale gas reservoirs [4].
China has abundant shale gas resources. Currently, many experts and scholars in China have conducted detailed and comprehensive research on shale gas resource evaluation, mainly focusing on geological conditions, reservoir formation mechanisms, enrichment patterns, evaluation methods, and other aspects of shale gas development. Over the years, authoritative units have used various means and methods to estimate resource quantities (Table 1), indicating the importance of resource evaluation in resource exploration and development. Evaluating and improving the accuracy of resource evaluation is of utmost importance in resource quantity estimation and evaluation [5,6,7,8]. Therefore, evaluating the key parameters involved in resource evaluation and quantitatively evaluating their accuracy is the focus of research in this field and the main object of this article.

Table 1.
Results of China′s previous resource evaluation [9].
2. Resource Evaluation Methods and Parameters
Over the past 20 years, domestic scholars such as Zhang Jinchuan and Jin Zhijun [3,10,11] have gradually conducted in-depth discussions on the occurrence status, accumulation mechanism, and accumulation conditions of shale gas, and China′s shale gas has gradually become a research hotspot. The methods of resource evaluation can be divided into two categories based on exploration, development, production, and operation: static resource evaluation methods and dynamic resource evaluation methods. According to the principles of these methods, they can be further divided into four categories: the genetic method, analogy method, statistical method, and comprehensive method. Each method has its own applicability and limitations. Using multiple methods for shale gas resource evaluation and mutual verification can improve the reliability of shale gas resource evaluation.
The genetic method is widely used in the early and middle stages of shale gas exploration and development. It mainly starts from the theory of shale gas generation and estimates the amount of shale gas based on the principle of material balance. The genetic methods mainly include the basin simulation method, thermal simulation method, geochemical material balance method, kerogen thermal degradation method, etc. These methods all achieve the purpose of quantitatively evaluating shale gas resources through the mechanism of oil and gas genesis [12,13]. Analogy is often used in the early stages of exploration and is a classic geological idea that is known and speculated to be unknown. Based on the similarity of shale gas reservoir formation conditions between the evaluation area and the analogical area, a resource evaluation method is proposed to estimate the resource abundance and quantity of the unknown (evaluation) area from the known (analogical) shale gas resource abundance [9,12,14]. The volumetric method is currently a relatively widely used method in China, mainly aimed at evaluating shale gas resources based on their unique occurrence patterns [15,16,17,18,19,20]. The comprehensive method mainly refers to the Delphi method. Due to its comprehensive characteristics, based on multiple methods to calculate the resource quantity of the evaluation area, weights are assigned to the resource quantity calculated using each method according to the actual geological background, data mastery level, and expert experience and understanding, and a more reliable evaluation result is obtained [13] (Table 2).
Table 2.
List of resource evaluation methods.
Due to differences in method selection, there are differences and commonalities in the parameters involved in different methods. According to research methods, they can be divided into two types: qualitative research parameters and quantitative research parameters. Due to the different geological conditions in different regions, and based on the principles of hydrocarbon generation, storage mechanisms, and reservoir formation mechanisms, combined with the structural control of a sedimentary environment and diagenesis, a sedimentary environment controls the logical relationship of shale gas reservoir formation. In the selected methods, the importance of different direct parameters is also different. Different methods have multiple common parameters, including structural and sedimentary parameters, specifically the shale area, thickness, density, etc. The specific classification of parameters is as follows (Table 3).
Table 3.
Classification of Factors Influencing Resource Evaluation.
There are significant differences between conventional and unconventional oil and gas in terms of distribution characteristics, source reservoir combinations, migration modes, accumulation mechanisms, and seepage characteristics [21]. Similarly, in the process of resource evaluation, different evaluation methods will be selected based on the exploration degree and geological understanding of the basin/region to be evaluated [22,23,24,25]. There are various methods for resource evaluation, and existing research on key parameters generally corresponds to resource evaluation methods, mainly focusing on the selection of specific parameters for a certain method and the selection of parameters based on actual production conditions. There is relatively little research on the analysis of parameters themselves [26].
In resource evaluation, key parameters refer to the direct parameters of quantitative analysis that directly affect the accuracy of resource estimation. Different resource evaluation methods involve different direct parameters, such as genetic methods, which mainly involve geochemical parameters such as the hydrocarbon generation potential index, TOC, total hydrocarbon content, and hydrocarbon production rate. The analogy rule focuses on standard zone parameters and analogy coefficients. The statistical method parameters involve geological parameters such as area and thickness. The comprehensive rules reflect various resource calculation results and weight analogies (Table 4).
Table 4.
Parameters related to different resource evaluation methods.
When conducting resource evaluation, key parameters can be divided into two categories: direct parameters that directly participate in the calculation and indirect parameters that do not directly participate in the calculation. The accuracy of common parameters that participate in direct calculation will affect the accuracy of resource evaluation. There are many existing resource evaluation methods, but the key parameters are relatively consistent, generally considering the shale thickness, area, density, etc. Due to the varying degrees and ranges of parameter values of these key parameters with geological conditions such as sedimentary structures, if the importance of all parameters is considered unified, this will result in significant errors. Therefore, in resource evaluation, it is crucial to conduct a weight analysis of the key parameters in the selected methods. By determining the importance of different parameters, the actual geological conditions of the target block can be introduced into the calculation of resource evaluation, thereby improving the accuracy of resource estimation.
3. Key Parameter Weights
There are many factors that affect the amount of shale gas resources, and their evaluation indicators and parameters are also relatively rich. Given that a single evaluation cannot meet the actual needs of exploration and development, previous studies have proposed evaluation index weights [27,28,29,30]. The weights of key parameters in the analysis and calculation method are determined to explore the correlation between different parameters and resource calculation results. The weights of evaluation indicators reflect the actual importance of evaluation indicators in shale gas selection. There are currently two main methods for determining the weights of evaluation indicators, namely the objective weighting method and the subjective weighting method. Objective weighting methods mainly include the dispersion method, entropy method, Nemero index method, grey relational analysis method, correlation method, principal component analysis method, etc.; the subjective weighting rule relies heavily on expert experience [31,32,33,34,35] and existing data and does not provide a quantitative representation method for weights (Table 5). In the existing weight analysis, the above methods are mostly applied in soil analysis and in the CNC electromechanical, ultrasonic medical, and even civil engineering and construction fields, and the expert experience scoring mode generally accounts for a large proportion.
Table 5.
Existing weight assignment methods.
Currently, research on weights mainly focuses on assigning weights to blocks with different reserves or developing engineering conditions such as fracturing. There is relatively little targeted research on the calculation methods of resource quantities and geological parameter weights. As a geological exploration field for evaluating shale gas resources, the actual importance of different geological parameters in the calculation process is not exactly the same. Analyzing the importance of parameters, assigning weights in calculation, and adjusting the importance of the main parameters before beginning resource estimation can effectively improve the accuracy of resource estimation.
Therefore, it is important and necessary to assign weights and evaluate the geological parameters used for resource calculation and then determine the resource quantity. By analyzing the resource quantity and key parameters, it can be concluded that each method of calculating resource quantity involves multiple parameters, and the relationship between multiple parameters and resource quantity is the relationship between a set of random independent variables and a dependent variable. The weights of different key parameters in the calculation method are analyzed to explore the degree of correlation between different parameters and resource calculation results. The higher the correlation of parameters, the greater their weight in resource estimation, and the higher the accuracy of this parameter.
4. Weight Conversion Model
To conduct research on resource estimation and related key parameter weight assignment, a weight transformation model is proposed, which uses the correlation coefficient representing the relationship between different variables and the complex correlation coefficient representing the correlation degree between a set of random variables and a random variable in the field of statistics to characterize the correlation degree between different parameters and resource calculation results.
The correlation coefficient is a statistical indicator used to reflect the degree of correlation between variables, usually represented by the letter r. Due to different research subjects and purposes, there are multiple correlation coefficients in the field of statistics. The complex correlation coefficient is an indicator that reflects the degree of correlation between a random variable and a group of random variables (two or more). It is a comprehensive measurement index that includes all variables and is generally used for measuring the degree of correlation between many variables to one variable. The complex correlation coefficient ranges from 0 to 1 (0 ≤ ≤ 1). The larger the complex correlation coefficient, the closer the correlation between elements (variables). The complex correlation coefficient of 1 indicates a complete correlation; the complex correlation coefficient of 0 indicates complete independence. At the same time, each factor also has its partial regression coefficient, which means that the average change in the dependent variable Y when the independent variable Xi changes by one unit, while keeping other independent variables constant, can measure the individual correlation of a certain factor. The F-test, initially known as the Variance Ratio or Joint Hypotheses Test, was proposed by British statistician Fisher. Initially, it mainly compared the variance of two sets of data to determine whether there was a significant difference in their density. It reflects whether the linear relationship between the dependent variable and all explanatory variables in the multiple linear regression model is significant overall [36].
In the practical application of weight conversion models, the first step is to determine whether the selected multiple parameters are relevant or effective and to test their correlation through significance testing to avoid false correlations caused by data coincidences. Next, the partial correlation coefficients of the key parameters are obtained to determine their correlation, and multiple regression is used to fit them. This can determine the degree of correlation between numerous parameters and resource levels and assign different weights to the corresponding parameters.
The specific method for assigning weights to key parameters is as follows:
Firstly, calculate the complex correlation coefficient and partial correlation coefficient.
Perform a regression analysis on X1, X2, …, Xk using ;
In the formula, is a constant term, and , , …, is called the partial regression coefficient. is a random error, also known as the residual, which represents the part of the variation in Y that cannot be explained by the independent variable Xi (i = 1, 2, …, m).
Next, use the least squares method to estimate the vector parameter ,
Organize and obtain the estimated vector parameter , where is the partial correlation coefficient matrix:
Then, calculate the simple correlation coefficient between Y and , which is the complex correlation coefficient between Y and X1, X2, …, Xk, where R is the complex correlation coefficient.
Based on the β matrix in the calculation, the complex correlation coefficients of the key parameters can be obtained. After obtaining the complex correlation coefficients of the variables, significance testing should be conducted to check whether they conform to the correlation. The purpose of significance testing here is to eliminate interference and determine their true correlation rather than low probability events with accidental correlation and to eliminate human errors. The F-test is generally used, and the specific methods are as follows:
Make an alternative hypothesis: the complex correlation coefficient between the dependent variable y and the independent variables X1, X2, …, Xk is 0, indicating complete independence.
The calculation formula is
In the above formula, k is the number of independent variables, n is the sample size, and the statistic follows an F-distribution of n – k − 1 degrees of freedom, where F is the test value. The critical value of the F-value is not a fixed value, but it is obtained by looking up the table based on the degrees of freedom and significance level used. Here, we choose 0.01 as the significance level, which is highly statistically significant. The F-test threshold table (Table 6) is shown below.
Table 6.
F-test critical value table (α = 0.01).
Firstly, hypothesis H0 is proposed: the complex correlation coefficient between dependent variable y and the independent variables X1, X2, …, Xk is 0.
Then, make a decision at a significance level of α = 0.01: determine the number of samples and independent variables and calculate the value of F according to the formula.
When F > F0.01 (n – k − 1), the null hypothesis is rejected at the 1% level (y has a complex correlation coefficient of 0 with a series of variables, X), indicating correlation. The correlation coefficient corresponds to the correlation degree table (Table 7).
Table 7.
Correlation degree table.
After determining the correlation, the partial correlation coefficient matrix can be used to synchronously determine the single correlation degree between different parameters and resource quantities. This article proposes a weight conversion model based on partial correlation coefficients with the following formula:
where M is the weight conversion coefficient. The weight of a certain parameter in all key parameters is determined based on its partial correlation coefficient, which is the proportion of the degree of correlation to the partial correlation coefficients of all parameters, and the M value between 0 and 1 is calculated. The closer the value of a certain parameter, M, is to 1, the greater its weight in the resource estimation method. After assigning weights to each parameter, a resource estimation evaluation can be conducted again to obtain a resource with high reliability.
5. Case Applications
The Jiaoshiba area in the Sichuan Basin is located in the southeastern part of the Sichuan Basin, with a structural location in the southern uplift section of the Wanxian syncline in the steep fold belt of the eastern Sichuan Basin. The steep fold belt in Eastern Sichuan is an important gas-producing area in the Sichuan Basin. The surrounding areas mainly develop reverse faults, with good conditions for reservoir formation and preservation. They mainly develop deep-water shelf facies, which are in the early stage of over maturity. They mainly develop nano-scale organic pores and micropores between clay minerals, and the fracture system is not developed, which is conducive to the enrichment and preservation of shale gas [37,38]. The high and steep fold belt in Eastern Sichuan runs from the south to the north, with a structural trend from the NNW to NNE, and then to the NE, forming the most distinctive arc-shaped fold belt in the Sichuan Basin. The Jiaoshiba block is mainly located in the southern part of the Wanxian syncline, a third-level structural unit. Overall, it is wide in the south and narrow in the north, wide in the middle, and gentle in the NE direction. It intersects with the Fangdoushan anticline of the third-level structural unit on the west side. The main structure is a box-shaped anticline, which is relatively stable. The boundary faults are mostly reverse faults, with good sealing, a high pressure coefficient, and good preservation conditions [39]. The shale gas layer is composed of the Upper Ordovician Wufeng Formation to the Lower Silurian Longmaxi Formation Longyi Member, mainly developed in deep-water continental shelf facies. The lithology is mainly composed of grey black radiolarian carbonaceous gracilite shale and carbonaceous siltstone shale; it is vertically distributed continuously with a total thickness ranging from 70.1 to 86.6 m. The organic matter type is mainly type I, with a TOC content ranging from 0.46% to 7.13% with an average of 2.66%. The Ro value ranges from 2.2% to 3.1%, indicating an early stage of over maturity. The content of brittle minerals is high, ranging from 33.9% to 90.3% with an average of 56.5%, which is beneficial for later transformation. The porosity of shale gas reservoirs ranges from 1.17% to 8.61% with an average of 4.87%. The on-site gas content ranges from 0.63% to 9.63% m3/t with an average of 4.61 m3/t [40,41,42,43,44,45,46,47,48,49].
The Jiaoshiba area of the Fuling shale gas field belongs to an area with a high exploration degree, and the upper gas layer in the Jiaoshiba area of the Fuling shale gas field does not contain crude oil. Therefore, the volume method should be used to calculate the adsorbed gas resources [50,51]. According to the basic principle of the probability volume method, shale gas resources are the probability product of shale mass and the natural gas content (gas content) per unit mass of shale. The specific formula is as follows:
where Q is the shale gas resource, A is the gas bearing shale area (km2), h is the effective shale thickness (m), ρ is the shale density (t/m3), and q is the gas content (m3/t).
Among them, the calculation of the gas content, q, is relatively complex, and the decomposition method can be used to separately calculate the (total) gas content. In the shale layer system, the occurrence mode of natural gas may be in the free, adsorbed, or dissolved state, and different methods can be used for calculation. The discussion on gas content data is not the focus of this article, so only existing data will be used for method introduction here. The data source of this article is the data obtained by the author’s team in 2019. After preliminary data processing and screening, 20 original data points were selected for instance application (Table 8).
Table 8.
Raw data.
Organize the parameters into matrices:
Calculate the resource amount of each group of data using the volume method:
Invert the matrix:
Using the least squares method to calculate the regression vector parameters, the following matrix is the calculation process:
Calculate based on the multiple linear regression equation model, where is the predicted value of the regression equation for the resource quantity Y:
Calculate the complex correlation coefficient:
Through the above formula calculations and matrix operations, the complex correlation coefficient R can be determined to be 0.831, indicating that these four factors are the main influencing factors for calculating shale gas resources using the volume method, namely the gas shale area, effective thickness, and density. The positive gas content influencing factors are directly related to the local resource quantity, and their changes will directly affect the value of the resource quantity in the region. Therefore, the next step of analysis is carried out.
Perform significance testing on the data using the F-distribution:
Among these, the sample size, n, is 20, and the number of independent variables, k, is 4. Calculate F = 8.37 according to the formula. According to the table, the critical value for the bilateral test for significance level α = 0.001 is Fα = 4.893. Due to F > Fα, the null hypothesis is rejected, indicating a correlation between the dependent variable y, shale gas resources, and the independent variables X1, the effective shale thickness; X2, the shale density; and X3, the gas-bearing shale area. At the same time, the partial correlation coefficients of the parameters were obtained. The coefficient of influence for the gas content, q, was 0.219, the coefficient of influence for the effective shale thickness, h, was 0.205, the coefficient of influence for the shale density, ρ, was 0.166, and the coefficient of influence for the gas bearing shale area, A, was 0.166 (Table 9).
Table 9.
Partial phase relation table.
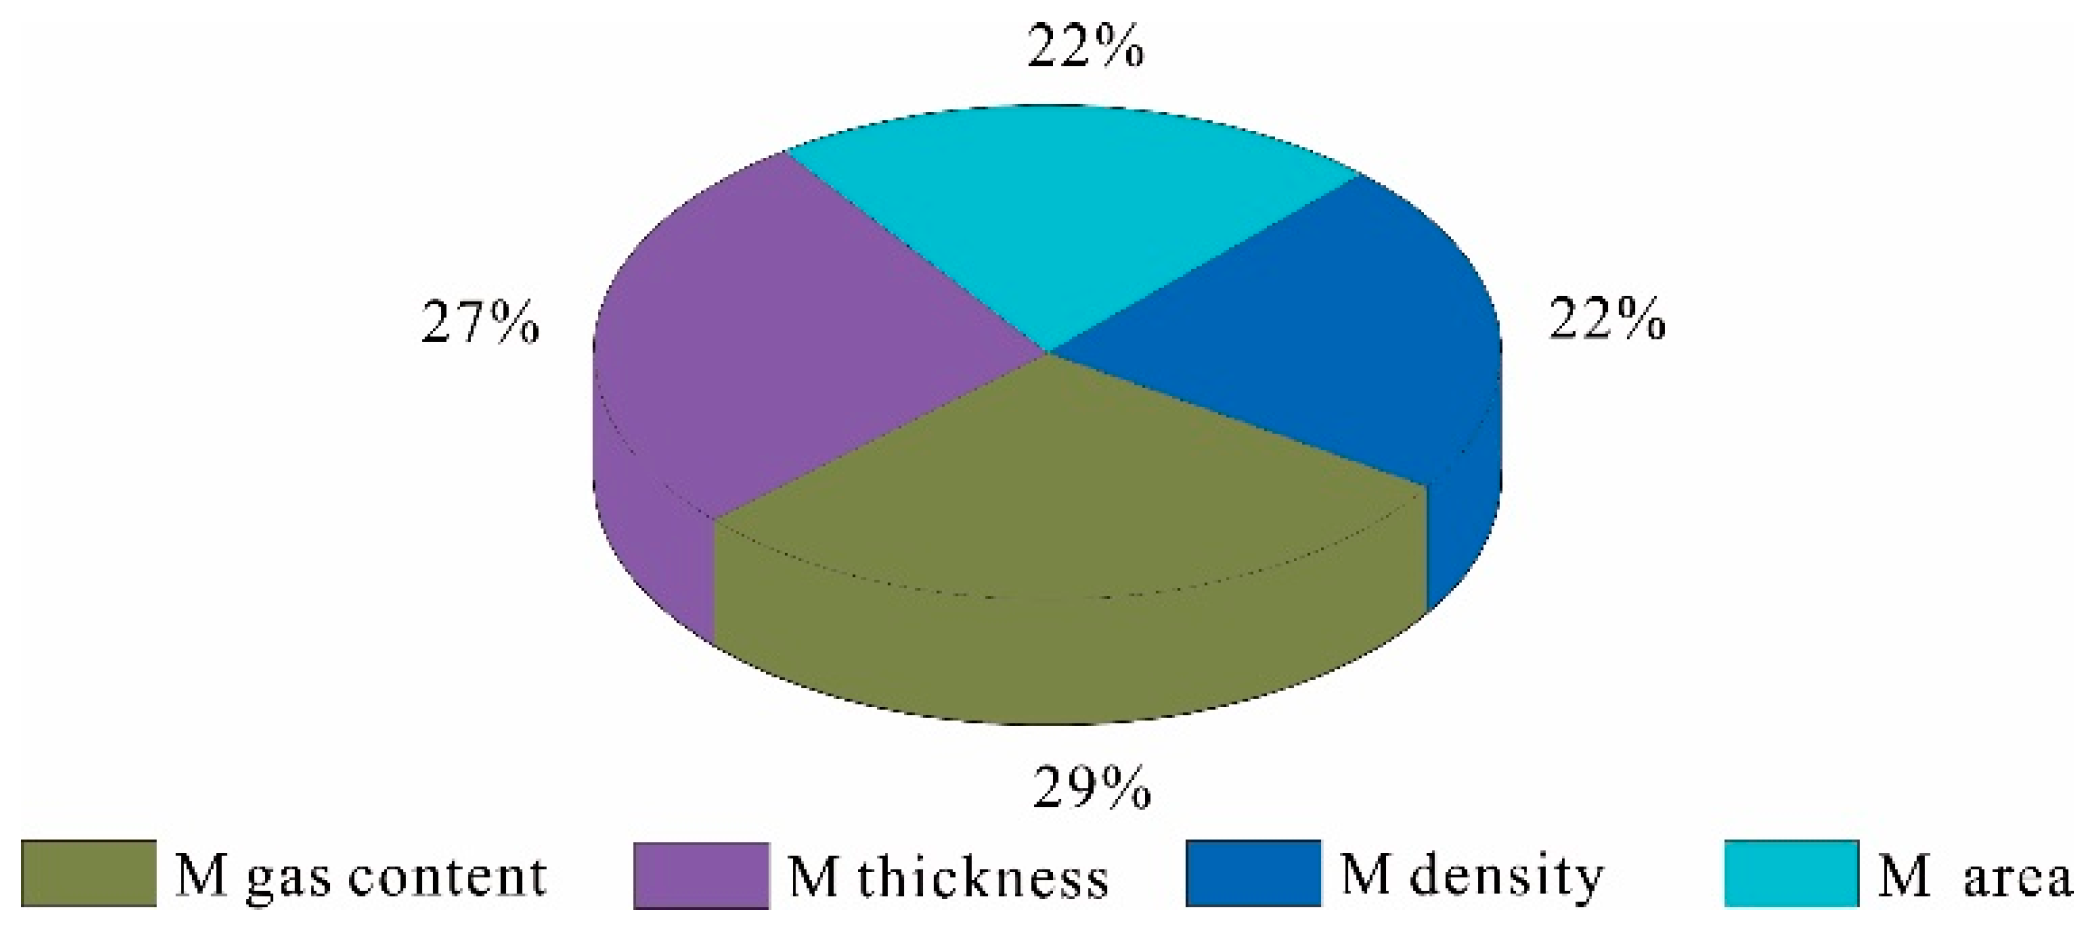
According to the weight conversion model, by substituting the partial correlation coefficients of the main parameters, it can be obtained that the M gas content is 0.29, the M thickness is 0.27, the M density is 0.22, and the M area is 0.22, respectively. Therefore, the main factor in the region is the gas content, followed by the effective shale thickness, shale density, and gas-bearing shale area, which are the parameters with lower influence. Their weight proportions are 29%, 27%, 22%, and 22%, respectively.
According to the volumetric method for resource estimation, without assigning weights to the parameters, the calculated result is 782 × 108 m3. After using the method proposed in this article to perform parameter weight overlap addition, the estimated resource quantity is 759 × 108 m3. Due to the fact that these data were obtained in 2019, its value is closer to the cumulative production of 688.25 × 10⁸ m3 as of 2020, which proves the high reliability of its predicted resource quantity [52].
By calculating the weight of key parameters in resource evaluation, the next step of analysis such as error transmission in the calculation process can be carried out. At the same time, data processing for the main parameters is also the key and core of the next research step. The method roadmap proposed in this article is as follows (Figure 1).

Figure 1.
Weight distribution diagram of different main control factors.
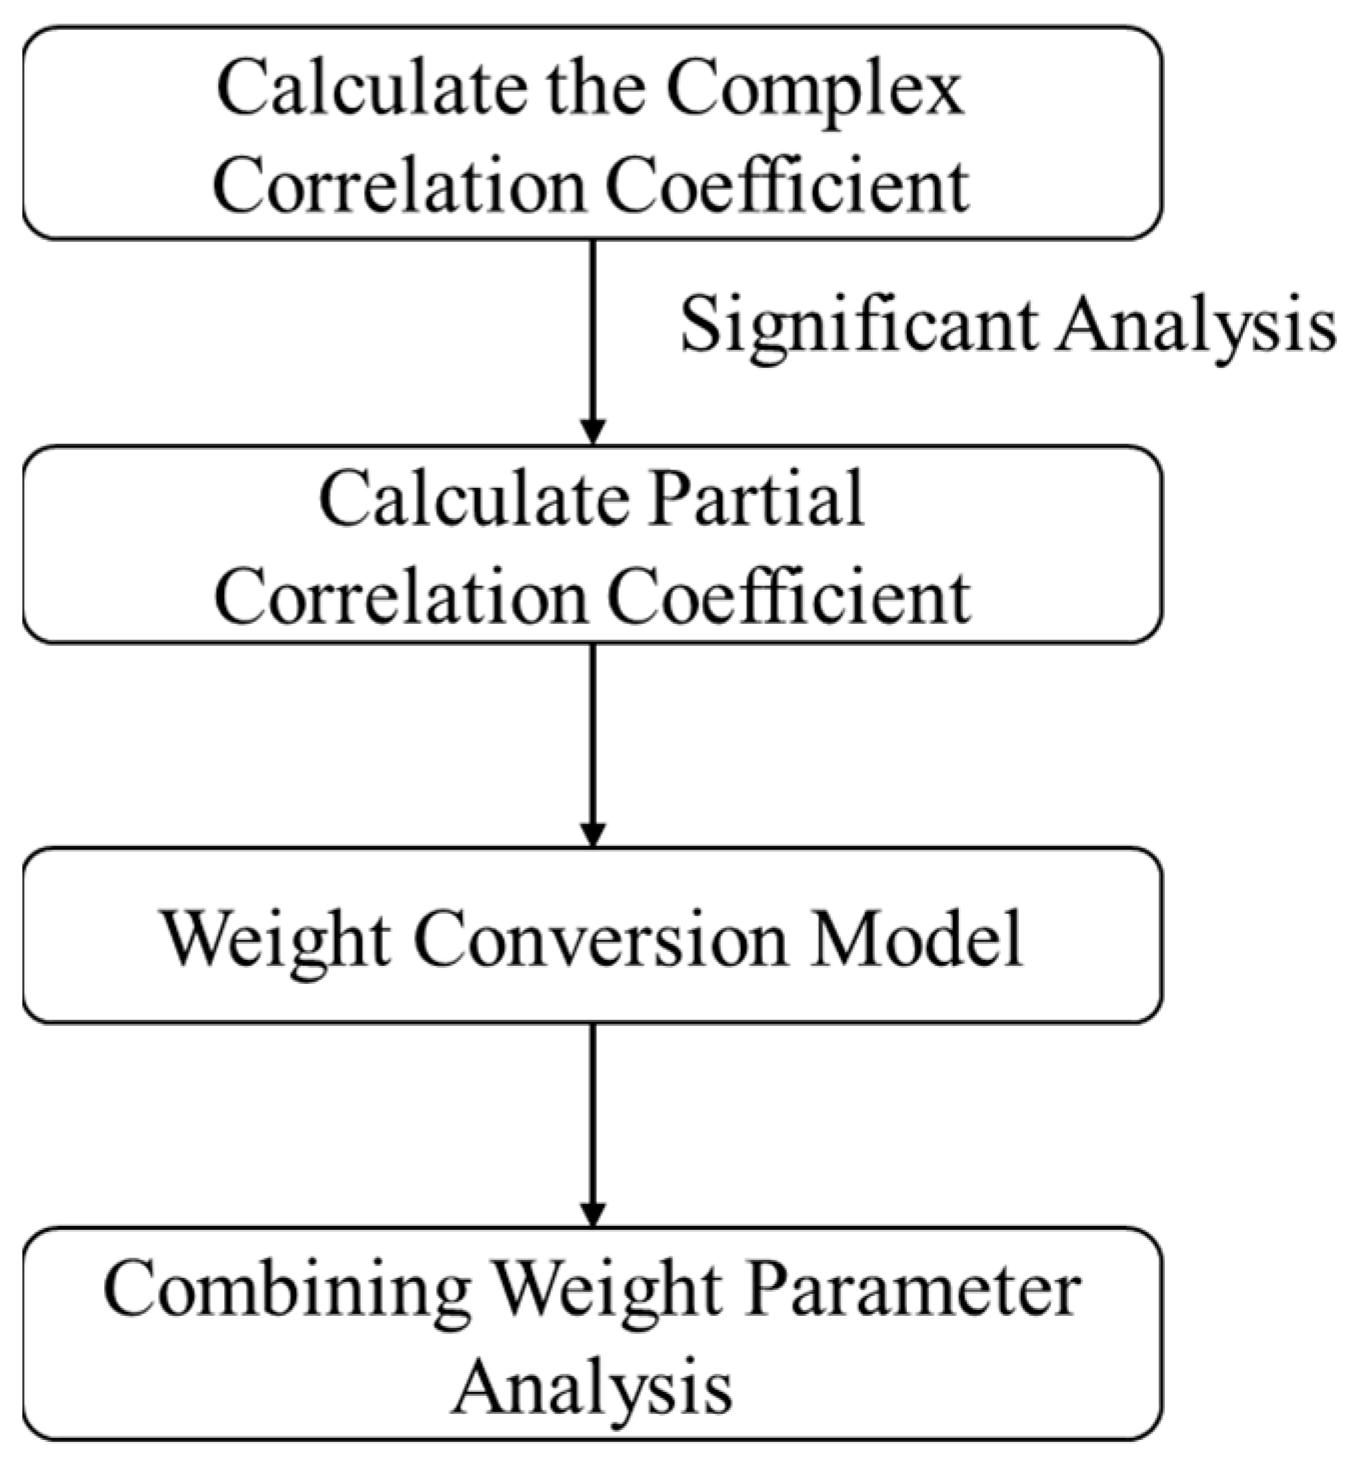
Therefore, we can use this method to analyze the parameter weights (see Figure 2):

Figure 2.
Analysis steps for assigning weights to key parameters.
6. Conclusions
(1) This article analyzes the parameters of resource evaluation methods, analyzes the types of parameters, evaluates the parameters in a hierarchical manner, and identifies the common key parameters of each evaluation method. The determination of parameters in this article is carried out to analyze the parameters in the initial stage of resource evaluation, which is beneficial for subsequent resource calculation and parameter processing steps, and it is a prerequisite for resource estimation.
(2) This article proposes a method for assigning weights to key parameters in shale gas resource evaluation, namely the weight conversion model. It combines statistics and geology and combines the correlation coefficients in existing mathematical methods to quantitatively analyze the research content, forming a set of operable method processes and calculation modes. This method focuses on obtaining the weights of key parameters in resource estimation, further enriching the evaluation content of resource estimation, and constructing a part of resource evaluation credibility analysis, providing a basis for improving the credibility of resource evaluation results.
(3) This article mainly uses the complex correlation coefficient and partial correlation coefficient in statistics to calculate the degree of correlation and determines the weights of key factors for resource quantity based on the weight conversion model. Therefore, the impact of key parameters on shale gas resource estimation is obtained, and the importance of controlling factors for shale gas resource quantity in the region is further determined. The method proposed in this article can be used for resource estimation blocks using computation, effectively quantitatively judging the weights of key parameters.
The aim of the weight conversion model is to quantitatively analyze the weights of key parameters in resource evaluation, and this method has feasibility and certain generalizability. The method proposed in this article can be extended to various parameter data evaluation methods for resource estimation and can be simultaneously applied to the estimation of unconventional oil and gas resources, such as coalbed methane, tight sandstone gas, geothermal resources, etc. It has high significance and foresight.
Author Contributions
T.Y.: Conceptualization, Methodology, Investigation, Formal Analysis, and Writing—Original Draft. J.Z.: Funding Acquisition, Writing—Review and Editing, Resources, Supervision, and Project Administration. B.Y.: Writing—Review and Editing, Resources, Supervision, and Project Administration. X.T.: Resources and Supervision. J.N.: Methodology and Writing—Review and Editing. M.S.: Investigation and Validation. All authors have read and agreed to the published version of the manuscript.
Funding
This work was funded by the National Natural Science Foundation of China (41927801) through the large-scale instrument project; the Yunnan Province Key Research and Development Plan project (202303AA080006), namely the Yunnan Province mining area project; and the National Natural Science Foundation of China (42372164) through the “Study on the interaction mechanism between supercritical CO2 and terrestrial kerogen-oil-water system”.
Institutional Review Board Statement
Not applicable.
Informed Consent Statement
Not applicable.
Data Availability Statement
The raw data supporting the conclusions of this article will be made available by the authors on request.
Acknowledgments
This work was financially supported by the National Natural Science Foundation of China (41927801) through the large-scale instrument project; the Yunnan Province Key Research and Development Plan project (202303AA080006), namely the Yunnan Province mining area project; and the National Natural Science Foundation of China (42372164) through the “Study on the interaction mechanism between supercritical CO2 and terrestrial kerogen-oil-water system”.
Conflicts of Interest
The authors declare that they have no known competing financial interests or personal relationships that could have appeared to influence the work reported in this paper.
References
- Dong, D.; Zou, C.; Dai, J. Suggestions on the development strategy of shale gas in China. Nat. Gas Geosci. 2016, 27, 397–406. [Google Scholar] [CrossRef]
- Zou, C.; Zhao, Q.; Dong, D. Geological characteristics, main challenges and future prospect of shale gas. Nat. Gas Geosci. 2017, 28, 1781–1796. [Google Scholar] [CrossRef]
- Zhang, J.; Jin, Z.; Yuan, M. Reservoiring mechanism of shale gas and its distribution. Nat. Gas Ind. 2004, 24, 15–18. [Google Scholar]
- Chen, G.; Dong, D.; Wang, S. A Preliminary study on accumulation mechanism and enrichment pattern of shale gas. Nat. Gas Ind. 2009, 29, 17–21. [Google Scholar]
- Klett, T.R.; Charpentier, R.R. FORSPAN Model Users Guide; Center for Integrated Data Analytics Wisconsin Science Center: Madison, WI, USA, 2003. [Google Scholar]
- Crovelli R, A. Analytic Resource Assessment Method for Continuous (Unconventional) Oil and Gas Accumulations; the “ACCESS” Method; Open File Report; U.S. Geological Survey: Reston, VA, USA, 2000. [Google Scholar]
- Chen, S.; Zhu, Y.; Chen, S. Hydrocarbon generation and shale gas accumulation in the Longmaxi Formation, Southern Sichuan Basin, China. Mar. Pet. Geol. 2017, 86, 248–258. [Google Scholar]
- Zhang, J.; Nie, H.; Liu, Q. Source and seal coupling mechanism for shale gas enrichment in upper Ordo-vician Wufeng Formation-Lower Silurian Longmaxi Formation in Sichuan Basin and its periphery. Mar. Pet. Geol. 2018, 97, 78–93. [Google Scholar]
- Song, Z.; Xu, X.; Wang, B. Advances in shale gas resource assessment methods and their future evolvement. Oil Gas Geol. 2020, 41, 1038–1047. [Google Scholar]
- Jin, Z.; Zhang, J. Fundamental principles for petroleum resources assessment. Acta Pet. Sin. 2002, 23, 19. [Google Scholar]
- Zhang, J.; Jiang, S.; Tang, X. Accumulation types and resources characteristics of shale gas in China. Nat. Gas Ind. 2009, 29, 109–114. [Google Scholar]
- Jiang, S.; Zhang, J.; Li, B. Analysis of shale gas resources assessment method in China. Fault Block Oil Gas Field 2017, 24, 642–646. [Google Scholar]
- Zhao, Q. Optimization of Evaluation Methods for Shale Gas Resources; China University of Geosciences: Beijing, China, 2017. [Google Scholar]
- Chen, X.; Bao, S.; Hou, D. Methods and key parameters of shale gas resources evaluation. Pet. Explor. Dev. 2012, 39, 566–571. [Google Scholar] [CrossRef]
- Zhang, J.; Nie, H.; Xu, B. Geological conditions of shale gas accumulation in Sichuan Basin. Nat. Gas Ind. 2008, 28, 151–156. [Google Scholar]
- Dong, D.; Cheng, K.; Wang, S. An evaluation methed of shale gas resource and its application in the Sichuan Basin. Nat. Gas Ind. 2009, 29, 33–39. [Google Scholar]
- Li, Y.; Liu, H.; Liu, J. Geological regional selection and an evaluation metheod of resource potential of shale gas. J. Southwest Pet. Univ. 2011, 33, 28–34. [Google Scholar]
- Li, Y.X.; Qiao, D.W.; Jiang, W.L. Gas content of gas bearing shale gas its geological evaluation summary. Geol. Bull. China 2011, 30, 308–317. [Google Scholar]
- NB/T 14007-2015; Technical Specification for Shale Gas Resource Evaluation. Xinhua Publishing House: Beijing, China, 2016.
- Qiao, H.; Jia, A.; Jia, C. Research Progress in Key Parameters of Shale Gas Reservoir Evaluation. Geol. Sci. Technol. Inf. 2018, 37, 157–164. [Google Scholar]
- Yang, Z.; Zou, C.N. Orderly “symbiotic enrichment” of conventional & unconventional oil and gas: Discussion on theory and technology of conventional & unconventional petroleum geology. Acta Geol. Sin. 2022, 96, 1635–1653. [Google Scholar]
- Xu, X.; Zhou, Z.; Song, Z. Methods and key parameters for oil and gas resource assessment and distribu-tion characteristics of oil and gas resource: A case study of resource assessment of SINOPEC during the 13th Five-Year Plan period. Pet. Geol. Exp. 2023, 45, 832–843. [Google Scholar]
- Dong, D.; Wang, Y.; Huang, X. Discussion about geological characteristic, resource evaluation methods and its key parameters of shale gas in China. Nat. Gas Geosci. 2016, 27, 1583–1601. [Google Scholar]
- Li, G.; Zhang, W.; Luo, H. Research onmethods and technologies for identifying “Sweet spots” in Yan’an continental shale gas reservoir. Geotech. Eng. World 2022, 13, 288–296. [Google Scholar]
- Song, Z.; Qiu, Q.; Zhao, L. A shale gas resource evaluation method based on retention coefficient. Nat. Gas Dustry 2020, 40, 12–19. [Google Scholar]
- Tang, L.; Song, Y.; Chen, X.Z. Key parameters and the upper-lower limits of shale gas selection evaluation: Case study from the Wufeng-Longmaxi formations in the Sichuan Basin. Nat. Gas Geosci. 2023, 34, 153–168. [Google Scholar]
- Guo, X.Y.; Chen, Y.C.; Zhang, J. Assessment index selection and weight determination of shale gas plays: A case study of marine shale in the Sichuan Basin. Nat. Gas Ind. 2015, 35, 57–64. [Google Scholar]
- Zhang, L.; Wei, S.L.; Huang, X.B. Shale gas reserve quality evaluation based on a comprehensive weighting method. Pet. Geol. Exp. 2017, 39, 694–699. [Google Scholar]
- Guo, X. The entropy method is improved by the weight of interval number index. Stat. Decis. 2012, 28, 32–34. [Google Scholar]
- Guo, X.; Chen, Y. An deviation method for determining the weights of the interval number attributes. Stat. Decis. 2013, 392, 61–63. [Google Scholar]
- Shi, W. Method for Evaluation of Gas-Bearing Potential Withe Well Logging and Mud Logging Data in Shale Gas Reservoir: A Case Study of Wufeng-Longmaxi Formation in Fuling Pingqiao Block; Southwest Petroleum University: Chengdu, China, 2020. [Google Scholar]
- Li, M.; Sun, J.; Hu, J. Evaluation Model of Shale Gas Horizontal Well Section Based on Combination Weigh Method and Its Applications. J. Math. Pract. Theory 2020, 50, 90–98. [Google Scholar]
- Wang, H.Q.; Chen, J.B.; Zhang, J. A new method of fracability evaluation of shale gas reservoir based of weight allocation. Pet. Drill. Tech. 2016, 44, 88–94. [Google Scholar]
- Chen, H.; Liu, Z.; Zhu, J. The determination of the index systemand weights for the development optimism of oil shale potential areas. Geol. China 2009, 36, 1359–1365. [Google Scholar]
- Wang, W.F.; Liu, P.; Chen, C. The study of shale gas reservoir theory and resources evaluaion. Nat. Gas Geosci. 2013, 24, 429–439. [Google Scholar]
- Jia, J. Introduction to Statistics; China Renmin University Press: Beijing, China, 2011. [Google Scholar]
- Liu, Y.; Wang, J.; Zhang, M. Pore features of shale gas layer in Wufeng-Longmaxi formations in Fuling area of Sichuan Basin and the application to development. Pet. Geol. Exp. 2018, 40, 44–50. [Google Scholar]
- Li, B.; Guo, Q.; Luo, Q. Comparative analysis on geological condition of shale gas accumulation of Longmaxi For-mation in eastern Sichuan Basin. Geol. Surv. China 2018, 5, 25–32. [Google Scholar]
- Shu, Z.; Wang, J. Geological characteristics and optimization of favorble areas in the upper gas reservoir of Jiaoshiba block in the Fuling Shale Gsa Field. Pet. Geol. Exp. 2021, 43, 34–44. [Google Scholar]
- Wang, Z.G. Breakthrough of Fuling shale gas exploration and development and its inspiration. Oil Gas Geol. 2015, 36, 1–6. [Google Scholar]
- Sun, B.; Deng, B.; Liu, S. Discussion on correlation between multistage superimposed tectonic deformation and shale gas preservation conditions in the Jiaoshiba shale-gas field, Sichuan, China. J. Chengdu Univ. Technol. 2018, 45, 109–120. [Google Scholar]
- Lin, J.; Hu, H.; Li, Q. Geochemical characteristics and implications of shale gas in Jiaoshiba, Eastern Sichuan, China. Earth Sci. 2017, 42, 1124–1133. [Google Scholar]
- Lu, Z.; He, Z.; Yu, C. Characteristics of shale gas enrichment in tectonically col mplex regions: A case study of the Wufeng-Longmaxi formations of Lower Paleozoic in southeastern Sichuan Basin. Oil Gas Geol. 2021, 42, 86–97. [Google Scholar]
- Shang, X.; Duan, T.; Bao, H.; Long, S.; Li, D. A new model of natural fractures in shale gas reservoirs based on fracture facies characterization: A case study from the Jiaoshiba Block of the Fuling Shale Gas Field. Nat. Gas Ind. 2023, 43, 44–56. [Google Scholar]
- Bao, H.; Meng, Z.; Li, K. Plane Heterogenity Characteristics and Main Controlling Factors of Development of Upper Gas Layer in Gas-Bearing Shale of Longmaxi Formation in Fuling Area, Sichuan Basin. Earth Sci. 2023, 48, 2750–2763. [Google Scholar]
- Sun, H.; Cai, X.; Hu, D. Theory, technology and pratice of shale gas three-dimensional development: A case study of Fuling shale gas field in Sichuan Basin, SW China. Pet. Explor. Dev. 2023, 50, 573–584. [Google Scholar] [CrossRef]
- Guo, X.; Hu, D.; Wei, Z. Discovery and exploration of Fuling shale gas field. China Pet. Explor. 2016, 21, 24–37. [Google Scholar]
- Li, D.; Liu, G.; Nie, H. Development Characteristics and Influencing Factors of Upper Gas Reservoir in Jiaoshiba Anticline. Earth Sci. 2019, 44, 3653–3661. [Google Scholar]
- Nie, H.; He, Z.; Liu, G. Genetic mechanism of high-quality shale gas reservoirs in the Wufeng-LongmaxiFms in the Sichuan Basin. Nat. Gas Ind. 2020, 40, 31–41. [Google Scholar] [CrossRef]
- Cai, J.; Liu, L.; Ji, J. Shale gas resource evaluation method and application: An example of Wufeng Formation-Longmaxi Formation in Jiaoshiba area. Geol. Surv. China 2020, 7, 7–13. [Google Scholar]
- Zhang, J.; Lin, L.; Li, Y. The method of shale gas assessment: Probability volume method. Earth Sci. Front. 2012, 19, 184–191. [Google Scholar]
- Hu, D.; Wei, Z.; Liu, R. Major breakthrough of shale oil and gas in Well Taiye 1 in Bashansi Synclinein the Sichuan Basin and its significance. China Pet. Explor. 2021, 26, 21–32. [Google Scholar]
Disclaimer/Publisher’s Note: The statements, opinions and data contained in all publications are solely those of the individual author(s) and contributor(s) and not of MDPI and/or the editor(s). MDPI and/or the editor(s) disclaim responsibility for any injury to people or property resulting from any ideas, methods, instructions or products referred to in the content. |
© 2024 by the authors. Licensee MDPI, Basel, Switzerland. This article is an open access article distributed under the terms and conditions of the Creative Commons Attribution (CC BY) license (https://creativecommons.org/licenses/by/4.0/).