Article

Sustainable Utilization of Stabilized Dredged Material for Coastal Infrastructure: Innovations in Non-Fired Brick Production and Erosion Control

by
Thi Thuy Minh Nguyen
1,
Saeed Rabbanifar
2,
Aalok Sharma Kafle
2,
Reid Johnson
2,
Brian Bonner
2,
Dason Fernandez
2,
Fernando Aleman
2,
Jared Defrancis
2,
Chun-Wei Yao
3,
Xianchang Li
3,
Mien Jao
2,* and
Paul Bernazzani
1,*
1
Department of Chemistry and Biochemistry, Lamar University, Beaumont, TX 77710, USA
2
Department of Civil and Environmental Engineering, Lamar University, Beaumont, TX 77710, USA
3
Department of Mechanical Engineering, Lamar University, Beaumont, TX 77710, USA
*
Authors to whom correspondence should be addressed.
Appl. Sci. 2024, 14(18), 8544; https://doi.org/10.3390/app14188544
Submission received: 28 July 2024 / Revised: 5 September 2024 / Accepted: 16 September 2024 / Published: 23 September 2024

Abstract

:
The deterioration of dams and levees is an increasing concern for both infrastructure integrity and environmental sustainability. The extensive repercussions, including the displacement of communities, underscore the imperative for sustainable interventions. This study addresses these challenges by investigating the stabilization of dredged material (DM) for diverse applications. Seven mixtures incorporating fly ash, lime, and cement were formulated. The Standard Compaction Test was used to determine optimal density–moisture conditions, which helped with brick fabrication. Bricks were tested for compressive strength over various curing periods, and the durability of the 28-day-cured samples was evaluated by performing water immersion tests following the New Mexico Code specifications. Scanning electron microscopy (SEM) was used to assess microstructural bonding. Results confirm that the inclusion of cementitious stabilizers modifies the material’s microstructure, resulting in enhancements of both strength and water resistance. Notably, the stabilized material demonstrates potential for use in non-fired brick manufacturing and as bridge stones for waterway erosion control. This dual-function application offers a sustainable and economically feasible approach to managing dredged materials.

1. Introduction

Dredged material refers to the soil, sediments, and debris collected from the bottom of navigable bodies of water. The US Army Corps of Engineers (USACE) conducts dredging activities to maintain the navigability of shipping channels across the United States [1,2,3]. The process of dredging and dumping the dredged material causes significant environmental problems in coastal and marine areas [4]. Before 1992, it was common to dispose of dredge material (DM) in its untreated form in the open ocean [5]; since then, dredged materials are placed in designated placement areas. Safely reusing DM would be an ideal solution to the increasingly challenging storage problem of overfilling placement areas. However, DM has very weak engineering properties, making its reuse difficult.
A wide array of cementitious materials, includeincludeing cement, lime, gypsum, fly ash, and other calcium-based materials, are utilized to improve the engineering properties of soils. Significant contributions to this field have been made by various researchers who have documented the effects of such materials on soil stabilization [1,6,7,8,9,10,11,12,13,14,15,16,17,18,19,20,21,22,23]. Type II cement, specifically, has been shown to enhance the workability of deep mixing techniques [24]. Milburn and Parsons [25] conducted studies on the impact of adding lime and cement to soil samples of diverse classifications. They reported that the addition of lime yielded varying results depending on the soil type. Specifically, it decreased the plasticity index (PI) values in some soil samples, while increasing them in others. This variability underscores the complexity of soil stabilization and the necessity for tailored approaches based on specific soil characteristics.
Recycling dredged sediments is a cost-effective alternative to traditional disposal methods. Its appeal stems not only from the material’s low cost and widespread availability but also from its potential applications. Stabilized material shows several potential applications, for example, in the creation of dredge stones, which can serve as effective solutions for mitigating waterway erosion. By repurposing dredged sediments for these varied applications, we not only reduce waste but also contribute to the development of cost-effective and environmentally friendly construction materials and erosion control solutions. One particularly promising use of stabilized dredged material is the fabrication of bricks, an area that has attracted significant research interest. The feasibility of producing bricks using stabilized soil has been extensively studied.
In stabilized earth, a pozzolanic reaction occurs between the calcium hydroxide present in lime and the silica and alumina in the soil, resulting in a cementitious precipitate [26]. Sandy soils are rich in SiO2, and lime contains substantial amounts of Ca(OH)2, while Portland cement typically comprises more CaO (about 62%) and less SiO2 (about 20%), depending on the manufacturer. The strength of the mixture can be enhanced by adding stabilizers such as Class F fly ash, which promotes further pozzolanic reactions. When Class F fly ash is used with an activator like lime, it enhances cementitious properties and thus increases the compressive strength [27].
Kumar [28] investigated the production of bricks using soil stabilized by different ratios of fly ash, lime, and calcined gypsum. The study found sufficient strength in the bricks for potential use in low-cost housing developments. Occasionally, sand is incorporated into the mixture to further enhance strength, while an optimal raw material ratio of 68% fly ash, 20% sand, and 12% hydrated lime was identified for the production of light-weight bricks [29]. Turgut [30] assessed the use of limestone powder, Class C fly ash, silica fume, and water (excluding Portland cement as a binder) in brick production. His findings indicated that low-cost masonry bricks costing 6.4 times less than conventional fired clay bricks could be manufactured using these waste materials without the need for Portland cement. Further, Vinai et al. [31] examined the compressive strength of unfired bricks made from coal combustion residues such as fly ash. The bricks produced were lightweight, demonstrated good mechanical resistance, and posed no health threats. The design specifications suggest that to achieve a compressive strength of 7–8 Mpa (1015–1160 psi), a 10% inclusion of cement is required. Consequently, ratios of 10% and 15% by weight of cement were explored to assess if a reduction in cement use could still meet the 1000 psi strength requirement [32]. This was corroborated by Sitton [33], who determined an optimal mix achieving a strength of 15.15 MPa (approximately 2200 psi), with a cement ratio of 10.91%, significantly exceeding the required strength of 1000 psi (6.89 Mpa).
Based on these findings, we will test the idea that stabilized dredged materials from the Southeast Texas waterways can be used to produce non-fired bricks for building construction. According to Section 14.7.4.11 C of the New Mexico Building Code (2009), the average strength of cured adobe bricks must be at least 300 psi (2068 kPa), with no individual specimen falling below 250 psi (1724 kPa) [34]. Similarly, the International Building Code (2003), in Section 2109.8.1.1, requires that five adobe units be tested with the same minimum average strength of 300 psi and no individual unit having a strength below 250 psi (1724 kPa) [35]. Previous research by Nguyen [1] demonstrated that a combination of 7% hydrated lime (HL) and 14% fly ash (FA) failed to meet the specifications outlined by the New Mexico Code. However, further findings [1,36] indicated that a FA/HL ratio between 2 and 3 yielded the most significant strength improvements. Taking these findings into consideration, we produced bricks made from DM, a FA/HL ratio of 2.3, and the addition of 10, 15, and 20% Portland cement (PC) based on the dry weight of the mix. Our objective was for the bricks to achieve a compressive strength of at least 1000 psi (6895 kPa), thereby surpassing the requirements set by both cited codes.

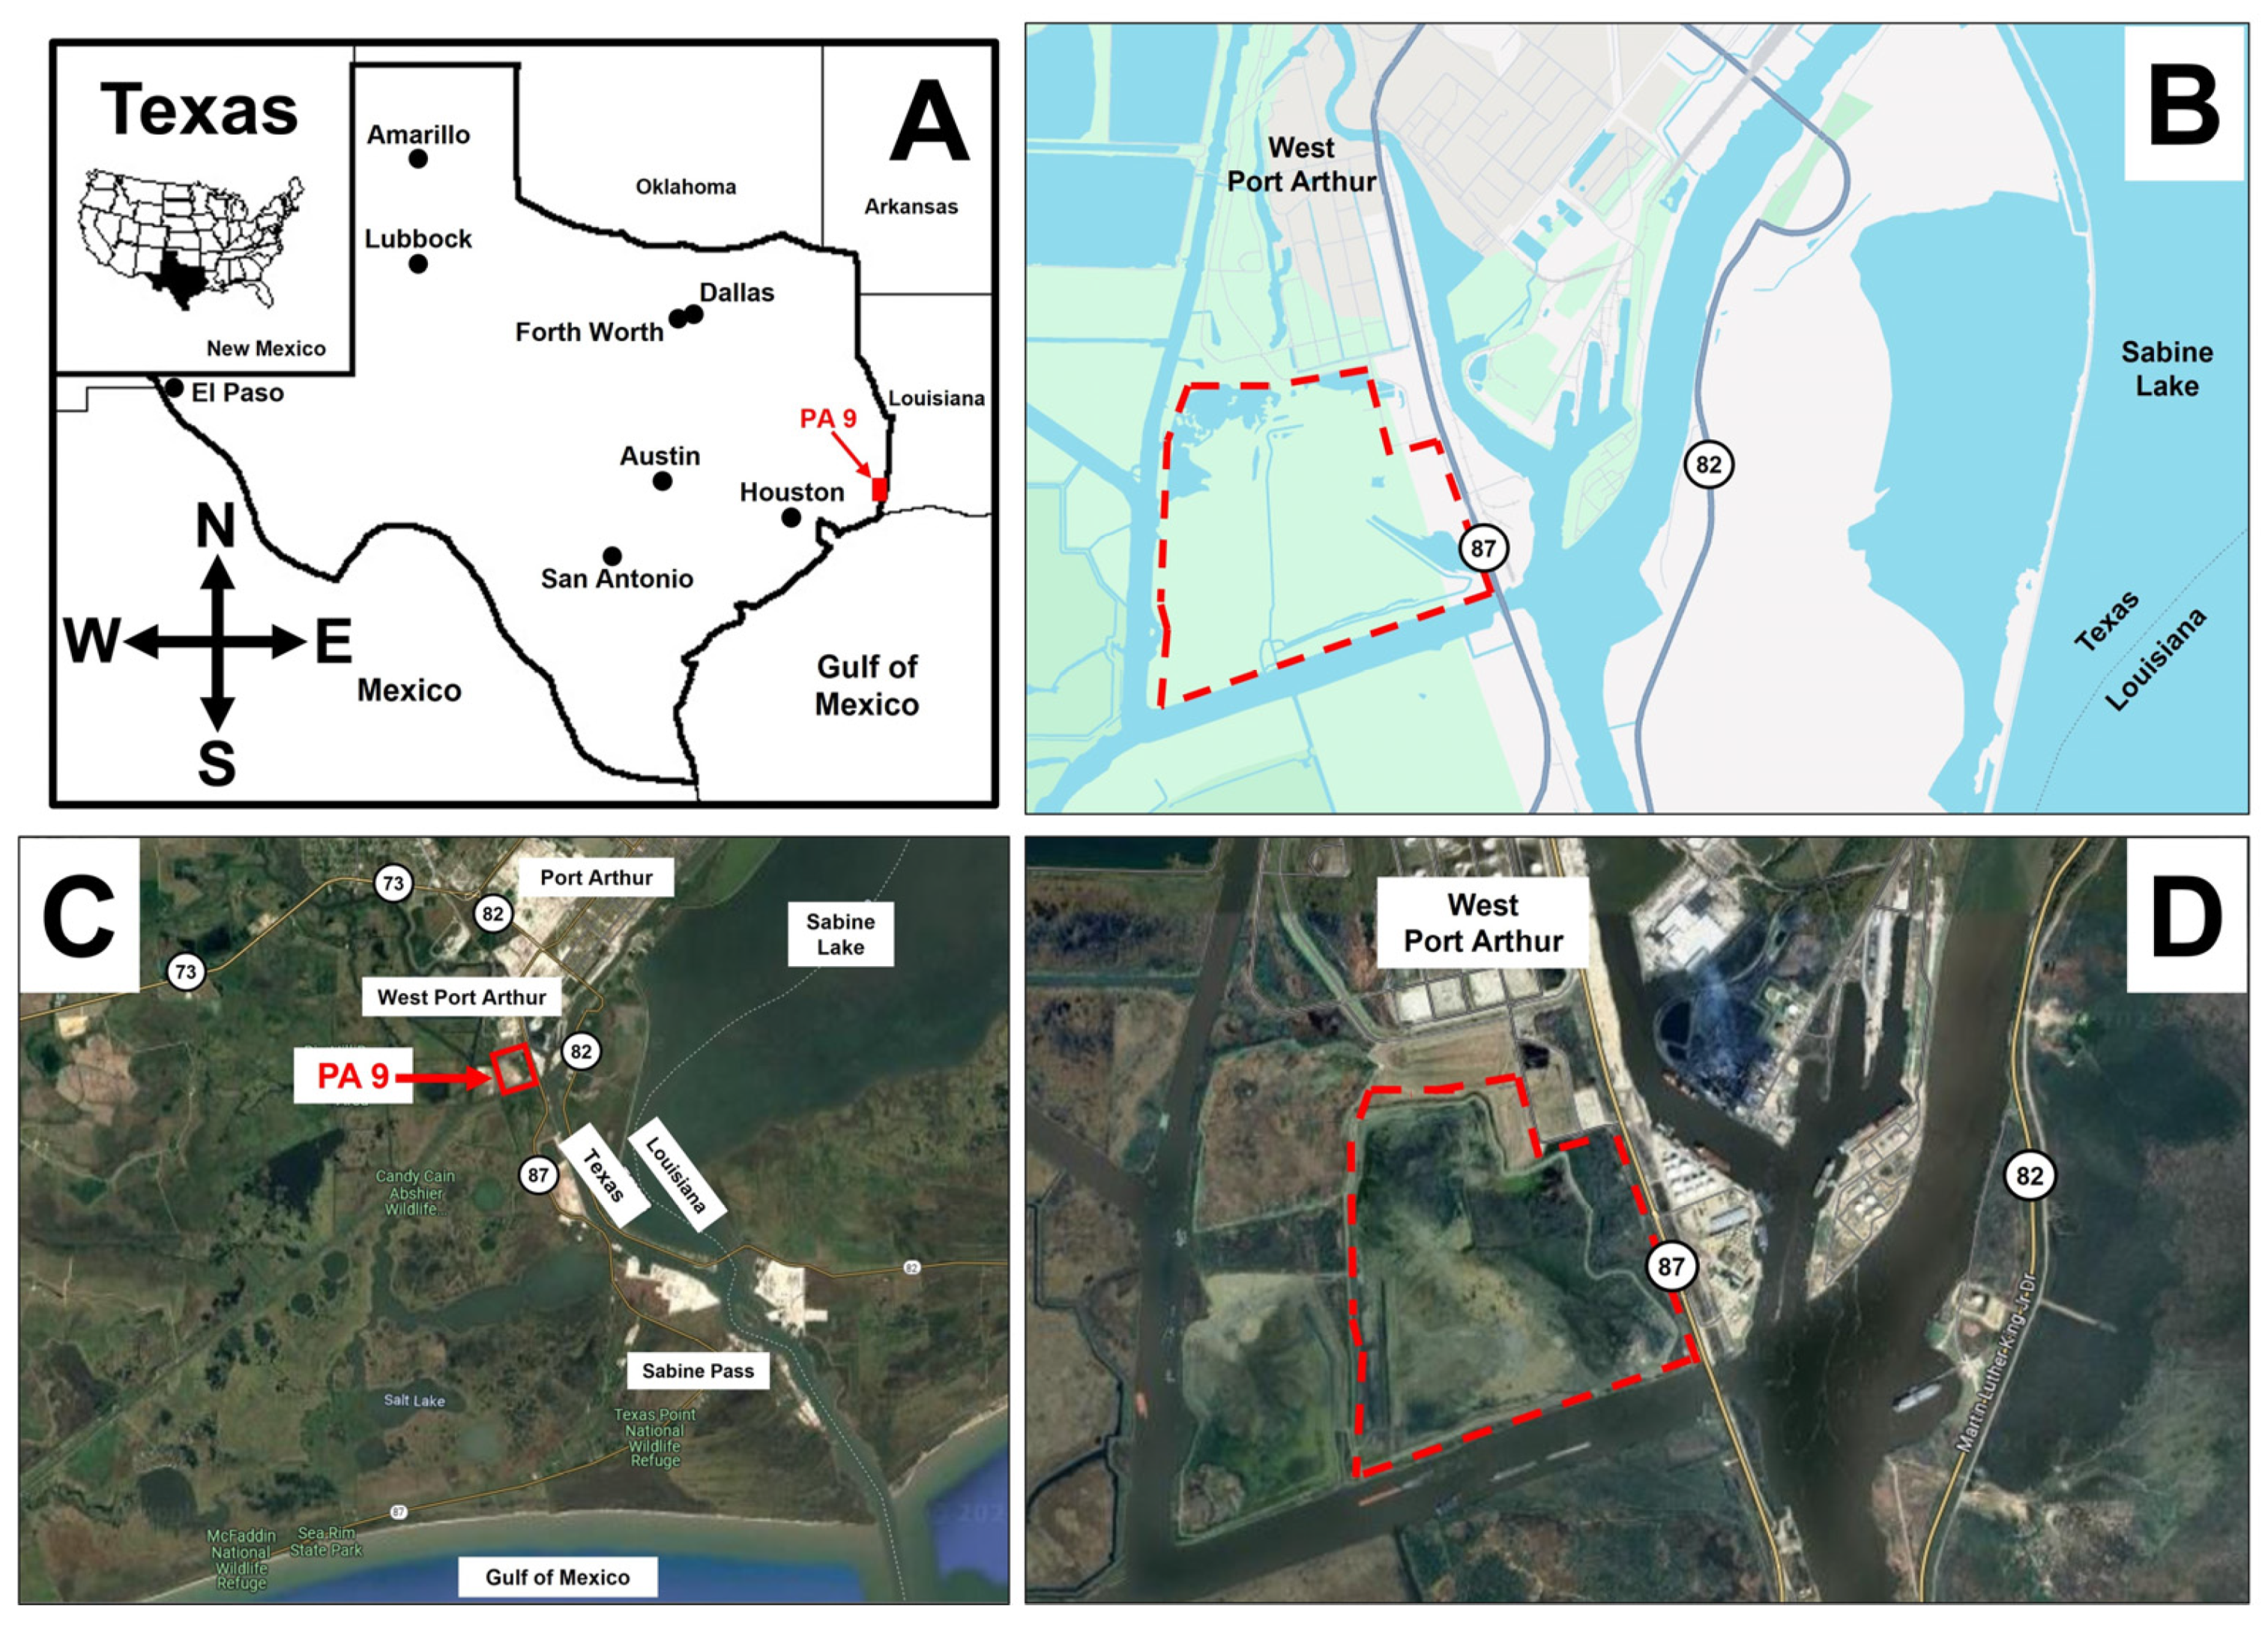
2. Dredging Location

DM were obtained from placement area 9, in the vicinity of the Texas–Louisiana border. On the western side, numerous industries and factories are situated along the waterways emanating from Sabine Lake. Placement Area 9 (PA 9) lies directly opposite KMTEX LLC, a Monument-owned petrochemical manufacturer, and nearby Martin Energy Services and GT Omniport infrastructure utilities. This industrial region and the dredged material (DM) landfill at PA 9 are bordered by South Gulfway Drive (Highway 87). Figure 1 presents a set of images of the dredge material disposal site Placement Area 9 (PA 9). Figure 1A,B are GIS maps providing scaled representations of the area, with Figure 1A pinpointing the location of PA 9 just inside the Stateline of Texas. Figure 1C,D are aerial photographs of the location, with the PA9 outlined in red. The dredged materials were transported from PA9 to the Geotechnical Laboratory at Lamar University for treatment, brick fabrication, and analysis.

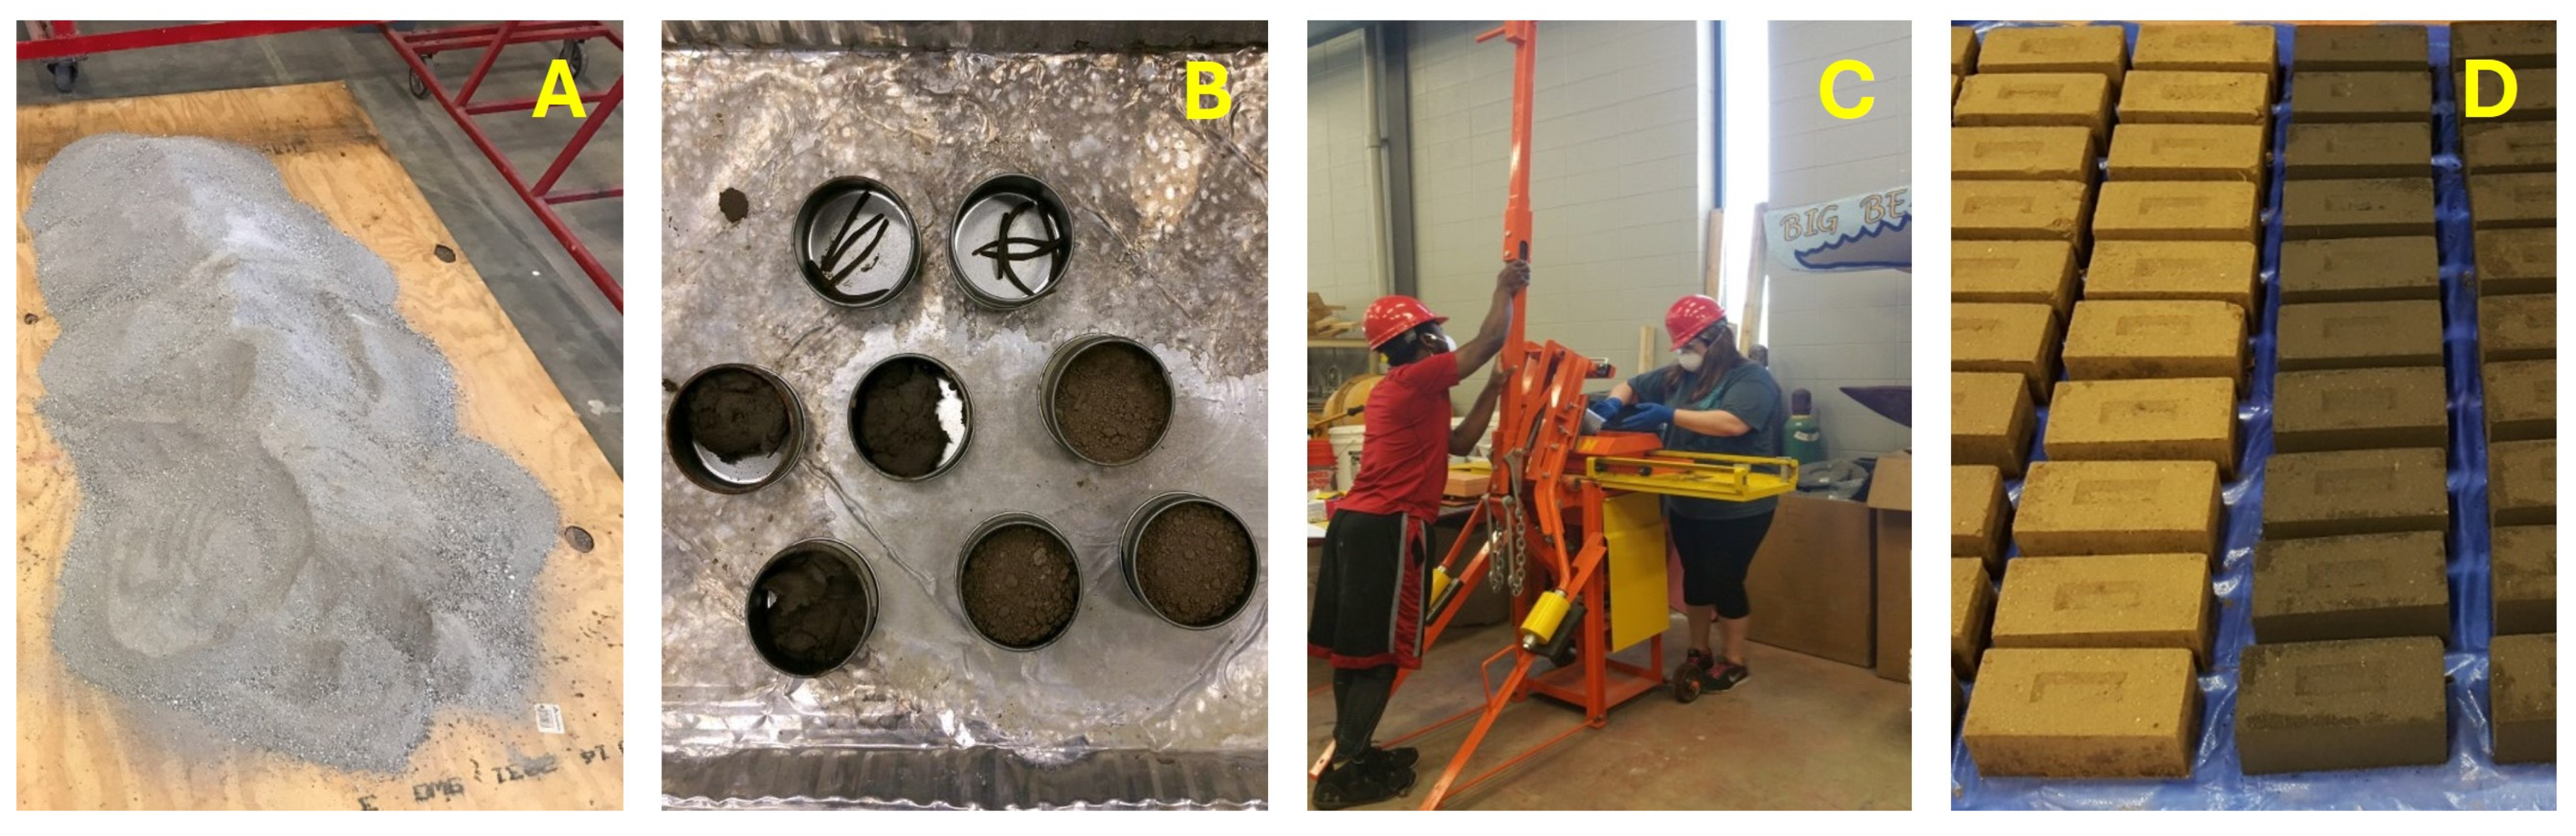
3. Materials and Methods

3.1. Mixes

The additives employed in this project include quicklime (QL), hydrated lime (HL), a blend of Portland cement (PC) Types I and II, and Class F fly ash (FA). QL and HL were sourced from Lhoist North America, located in Fort Worth, Texas. QL demonstrated a solubility of 0.8 g/L, whereas the HL exhibited a higher solubility of 1.6 g/L at 25 °C. PC, provided by Texas Industries Operation Limited Partnership (TXi Operations LP) in Dallas, had a specific gravity ranging from 3.05 g/cm3 to 3.20 g/cm3. Class F fly ash, generously supplied by Headwaters Resources based in Thompsons, Texas, displayed a specific gravity between 2.2 and 2.8 g/cm3 and was characterized by low water solubility. The detailed chemical composition of these additives is presented in Table 1.

3.2. Proposed Mix Designs and Laboratory Tests

The dredged material (DM) was initially dried in an oven at 120 °C for 24 h and subsequently pulverized prior to stabilization. The particle distribution of DM, fly ash (FA), and hydrated lime (HL) was investigated using complete grain size analysis, including a hydrometer test following the ASTM D422 protocol [37]. Additives, as outlined in Table 2, were added to the DM based on the percentage of dry weight (wt.%) of DM. For all samples, the FA/HL ratio was fixed at 2.3, as suggested by Nguyen [1], and modified for the current study. Eight mixes were prepared as detailed in Table 2, where the relative ratio of HL, FA, and PC are presented as well as the percent weight of cementitious material (HL, FA, PC) and DM. Note that “pwd” represents the powder content without considering the water content.
The process of preparing stabilized dredged material begins with the determination of the optimum moisture content (OMC) for each mix through standard compaction tests conducted according to ASTM D698 [37]. The formulation of stabilized mixes involved a meticulous three-step procedure: initially, dry solids comprising dredged material (DM), hydrated lime (HL), fly ash (FA), and Portland cement (PC) were blended for one minute, ensuring uniform distribution of the components; subsequently, water corresponding to the OMC for each mix was incrementally added over a period of 30 s; this addition was followed by an additional minute of mixing to integrate the moisture uniformly throughout the mixture, thereby reaching the desired consistency crucial for the pressing process.
Once the mixing achieved a homogeneous state and the specified moisture content, the mixture was ready to be molded into bricks. An Auram Press 3000, a specifically designed piece of equipment from Aureka in Auroville, India, was employed to compress the prepared material into bricks with dimensions of 9.5″ × 4.5″ × 3.8″ (24.1 cm × 11.4 cm × 9.7 cm). This process utilized a compression ratio of approximately 1:1.8, applying 15 tons of force (1436 kPa). During the pressing phase, the molds were first filled to half their capacity with the wet mixture, after which PVC inserts were strategically placed along the x and y axes to aid in the formation of the bricks. After filling the molds to their full capacity, the press lid was securely closed, and the lever arm was engaged to apply the necessary force. Once the pressing was complete, the press lid released, unveiling the formed bricks which were then set aside for the curing process. For practitioners and researchers without access to this specific equipment, it is advisable to employ a press that can achieve a compression ratio between 1:1.6 and 1:1.8, ensuring optimal formation and structural properties of the bricks. Figure 2 presents images of the different steps in the preparation of bricks. Panel A shows a typical dried mixture of DM and stabilizing agents. Panel B shows the samples in containers at a specific moisture content. Panel C presents the Auram Press 3000 in action, and panel D shows the resulting bricks. The different colored bricks are an indication of variations in the mixing content.
The bricks underwent a curing period at room temperature within the laboratory environment for 7 and 28 days to assess their mechanical properties over time. Figure 3 shows an image of a typical stabilized dredged material brick (SDMB) prepared using the Auram Press 3000 and cured for 28 days. Following the curing periods, unconfined compressive strength (UCS) tests were carried out in accordance with ASTM D2166 [37] to evaluate the structural integrity of the bricks. Furthermore, to assess the durability and suitability of the bricks for practical applications, submergence tests were conducted as delineated by the New Mexico Building Code. These tests provided crucial data on the material’s performance under conditions simulating real-world environmental exposure.

4. Results and Discussion

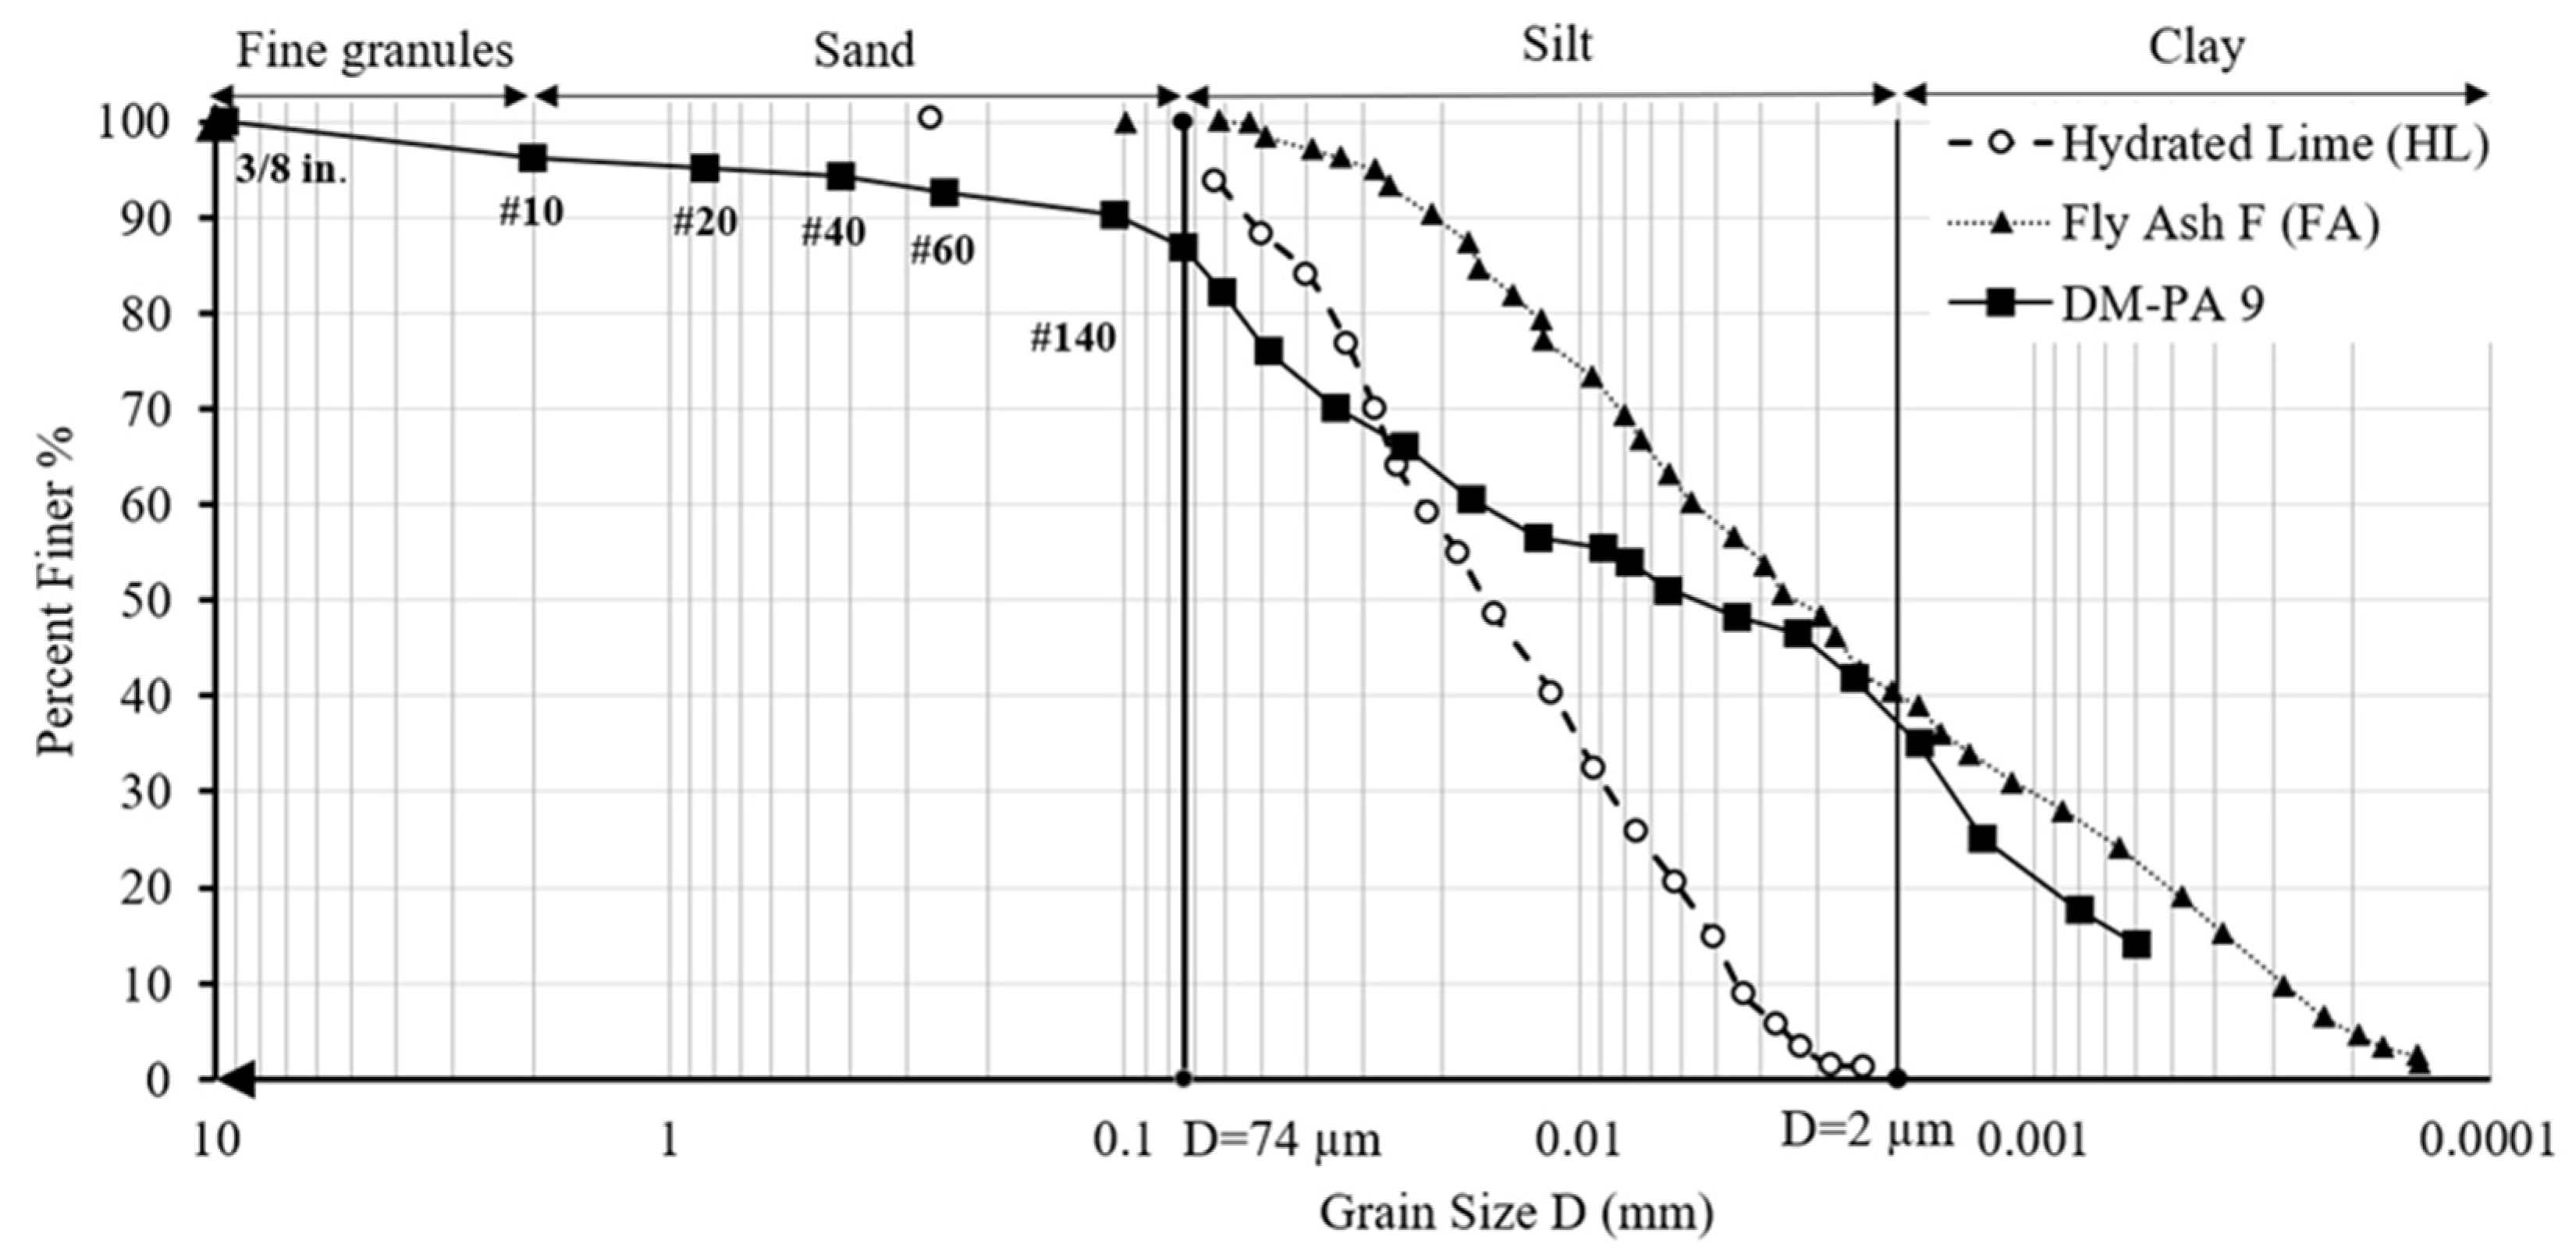
4.1. Particle Size Distribution

As previously mentioned, our working hypothesis is that stabilized dredged materials from the Southeast Texas waterways can be used to produce non-fired bricks for building construction, with the objective that these bricks can achieve a compressive strength of at least 1000 psi (6894 kPa), as recommended by different codes. To achieve this objective, several preliminary tests are required.
The particle size distribution of the dredged material (DM) and the additives is presented in Figure 4 for comparison purposes. The DM contains larger particles than both fly ash (FA) and hydrated lime (HL). In the size range smaller than 0.074 mm, referred to as the fine zone, HL displays larger particles than FA, which may be attributed to the clumping of smaller particles that predominates in HL. Throughout most of the fine region (smaller than 20 µm), DM contains particles that are larger than those of FA but smaller than those of HL.

4.2. Untreated Dredged Material

Upon arrival at the geotechnical laboratory, preliminary physical tests were performed on the dredged material. Table 3 summarizes the results of these tests, which will act as a baseline to which the treated DM mixtures are compared. The table includes values for the unconfined compressive strength (UCS) of DM compacted at its optimum moisture content (OMC). It should be noted that the compressive strength of freshly acquired DM is exceedingly low, typically ranging from 0 to 2 psi (0–14 kPa), which is attributable to its high moisture content.
Table 3 shows that the DM has a high organic content, as determined by ASTM D2974 [37]. Following Atterberg limits tests (ASTM D4318) [37], the DM was classified as OH—organic clay with medium to high plasticity, according to the Unified Soil Classification System (USCS). Stabilized samples were fabricated at the optimum moisture content and tested for UCS at 7 and 28 days of curing, before and after being submerged in water.

4.3. Stabilized Dredged Material

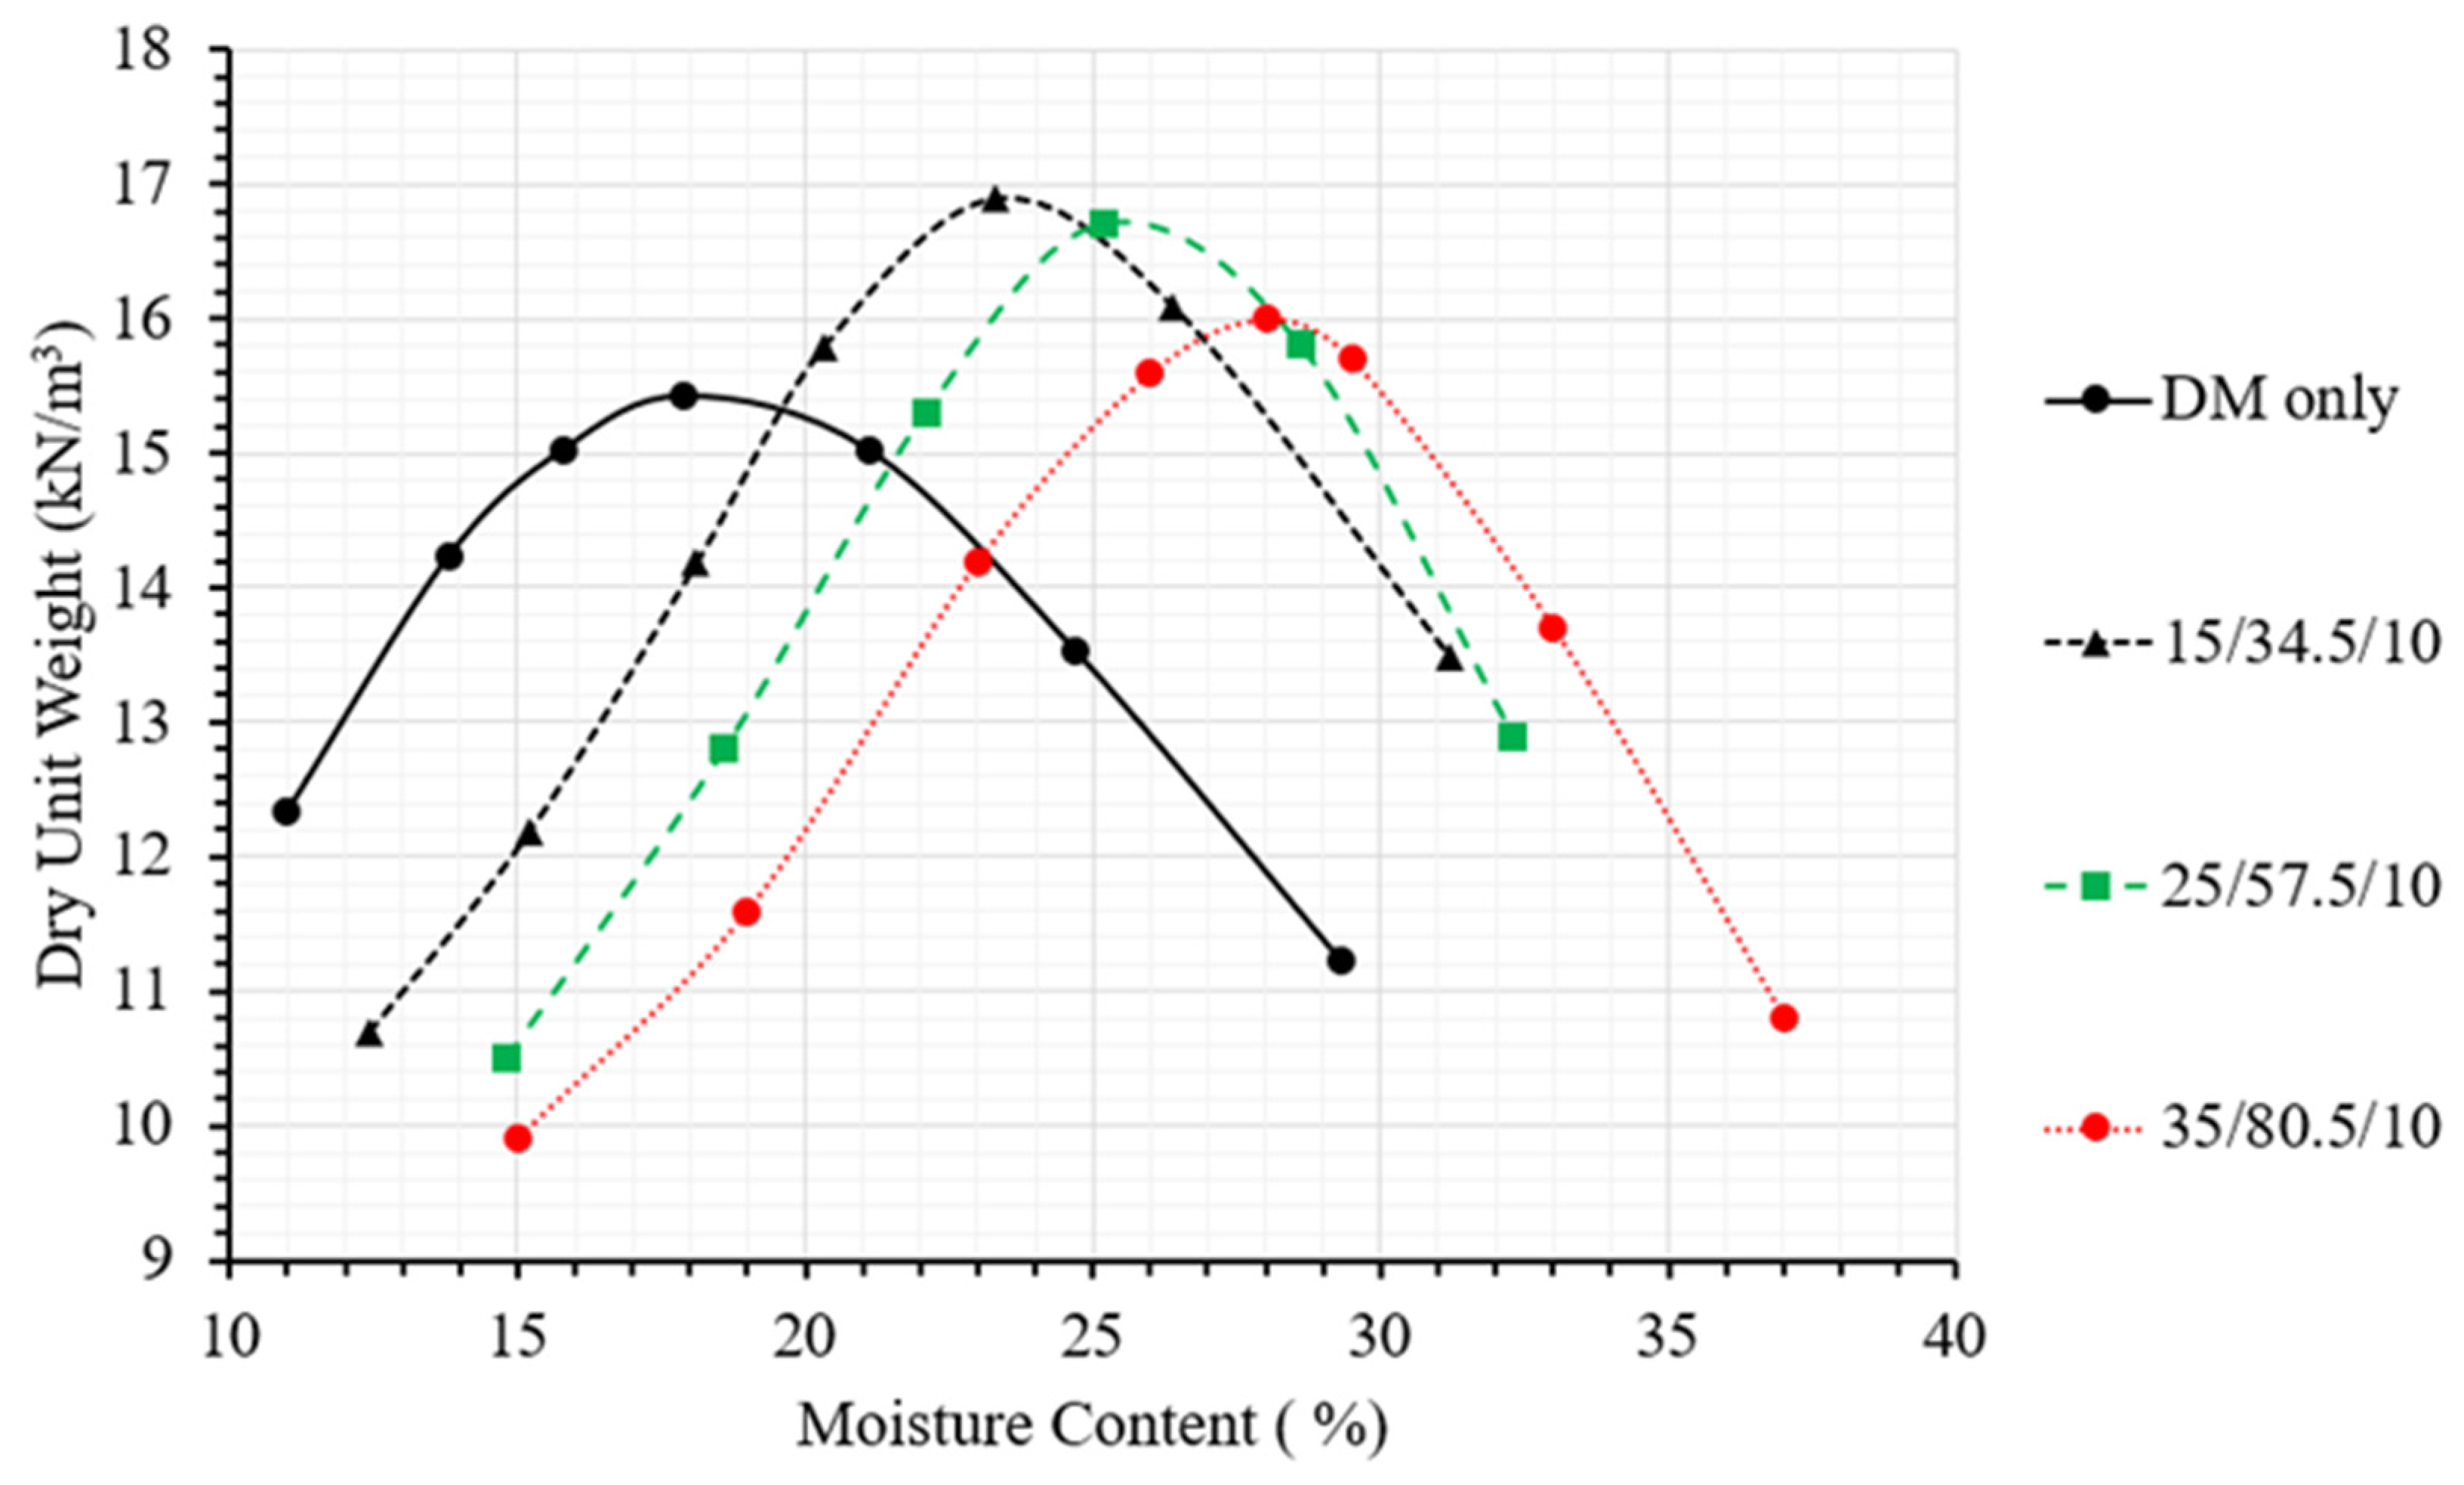
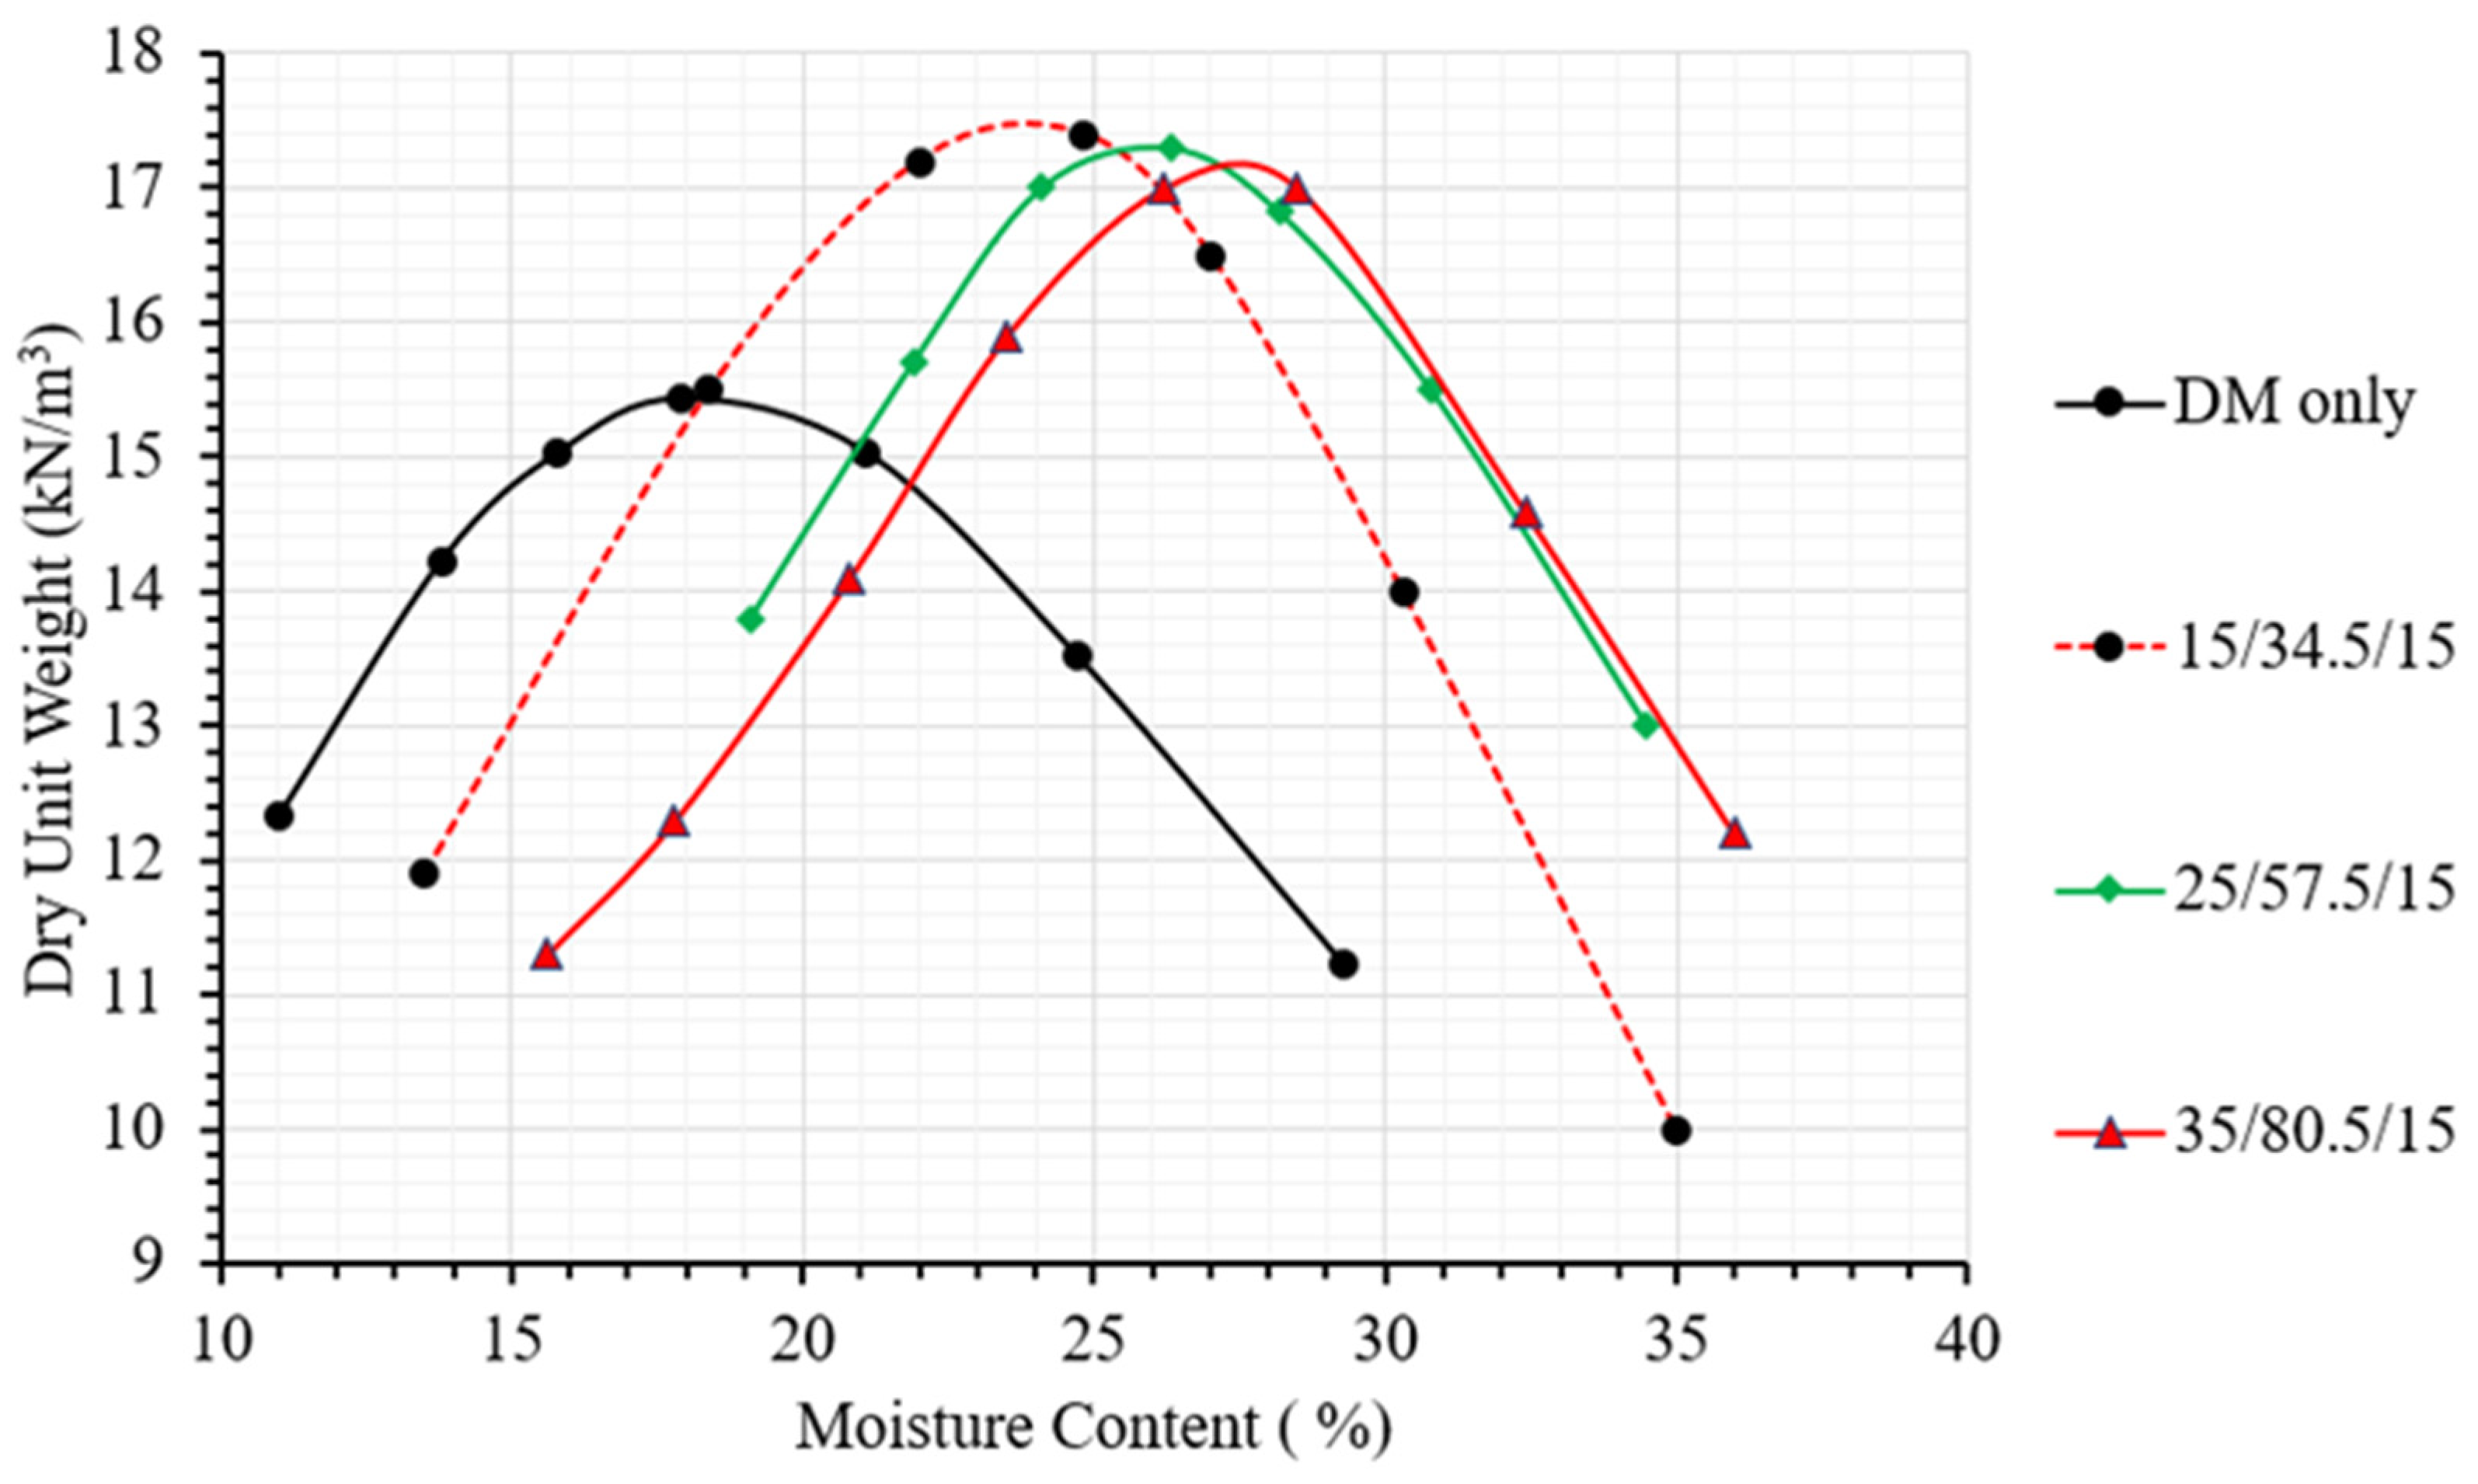
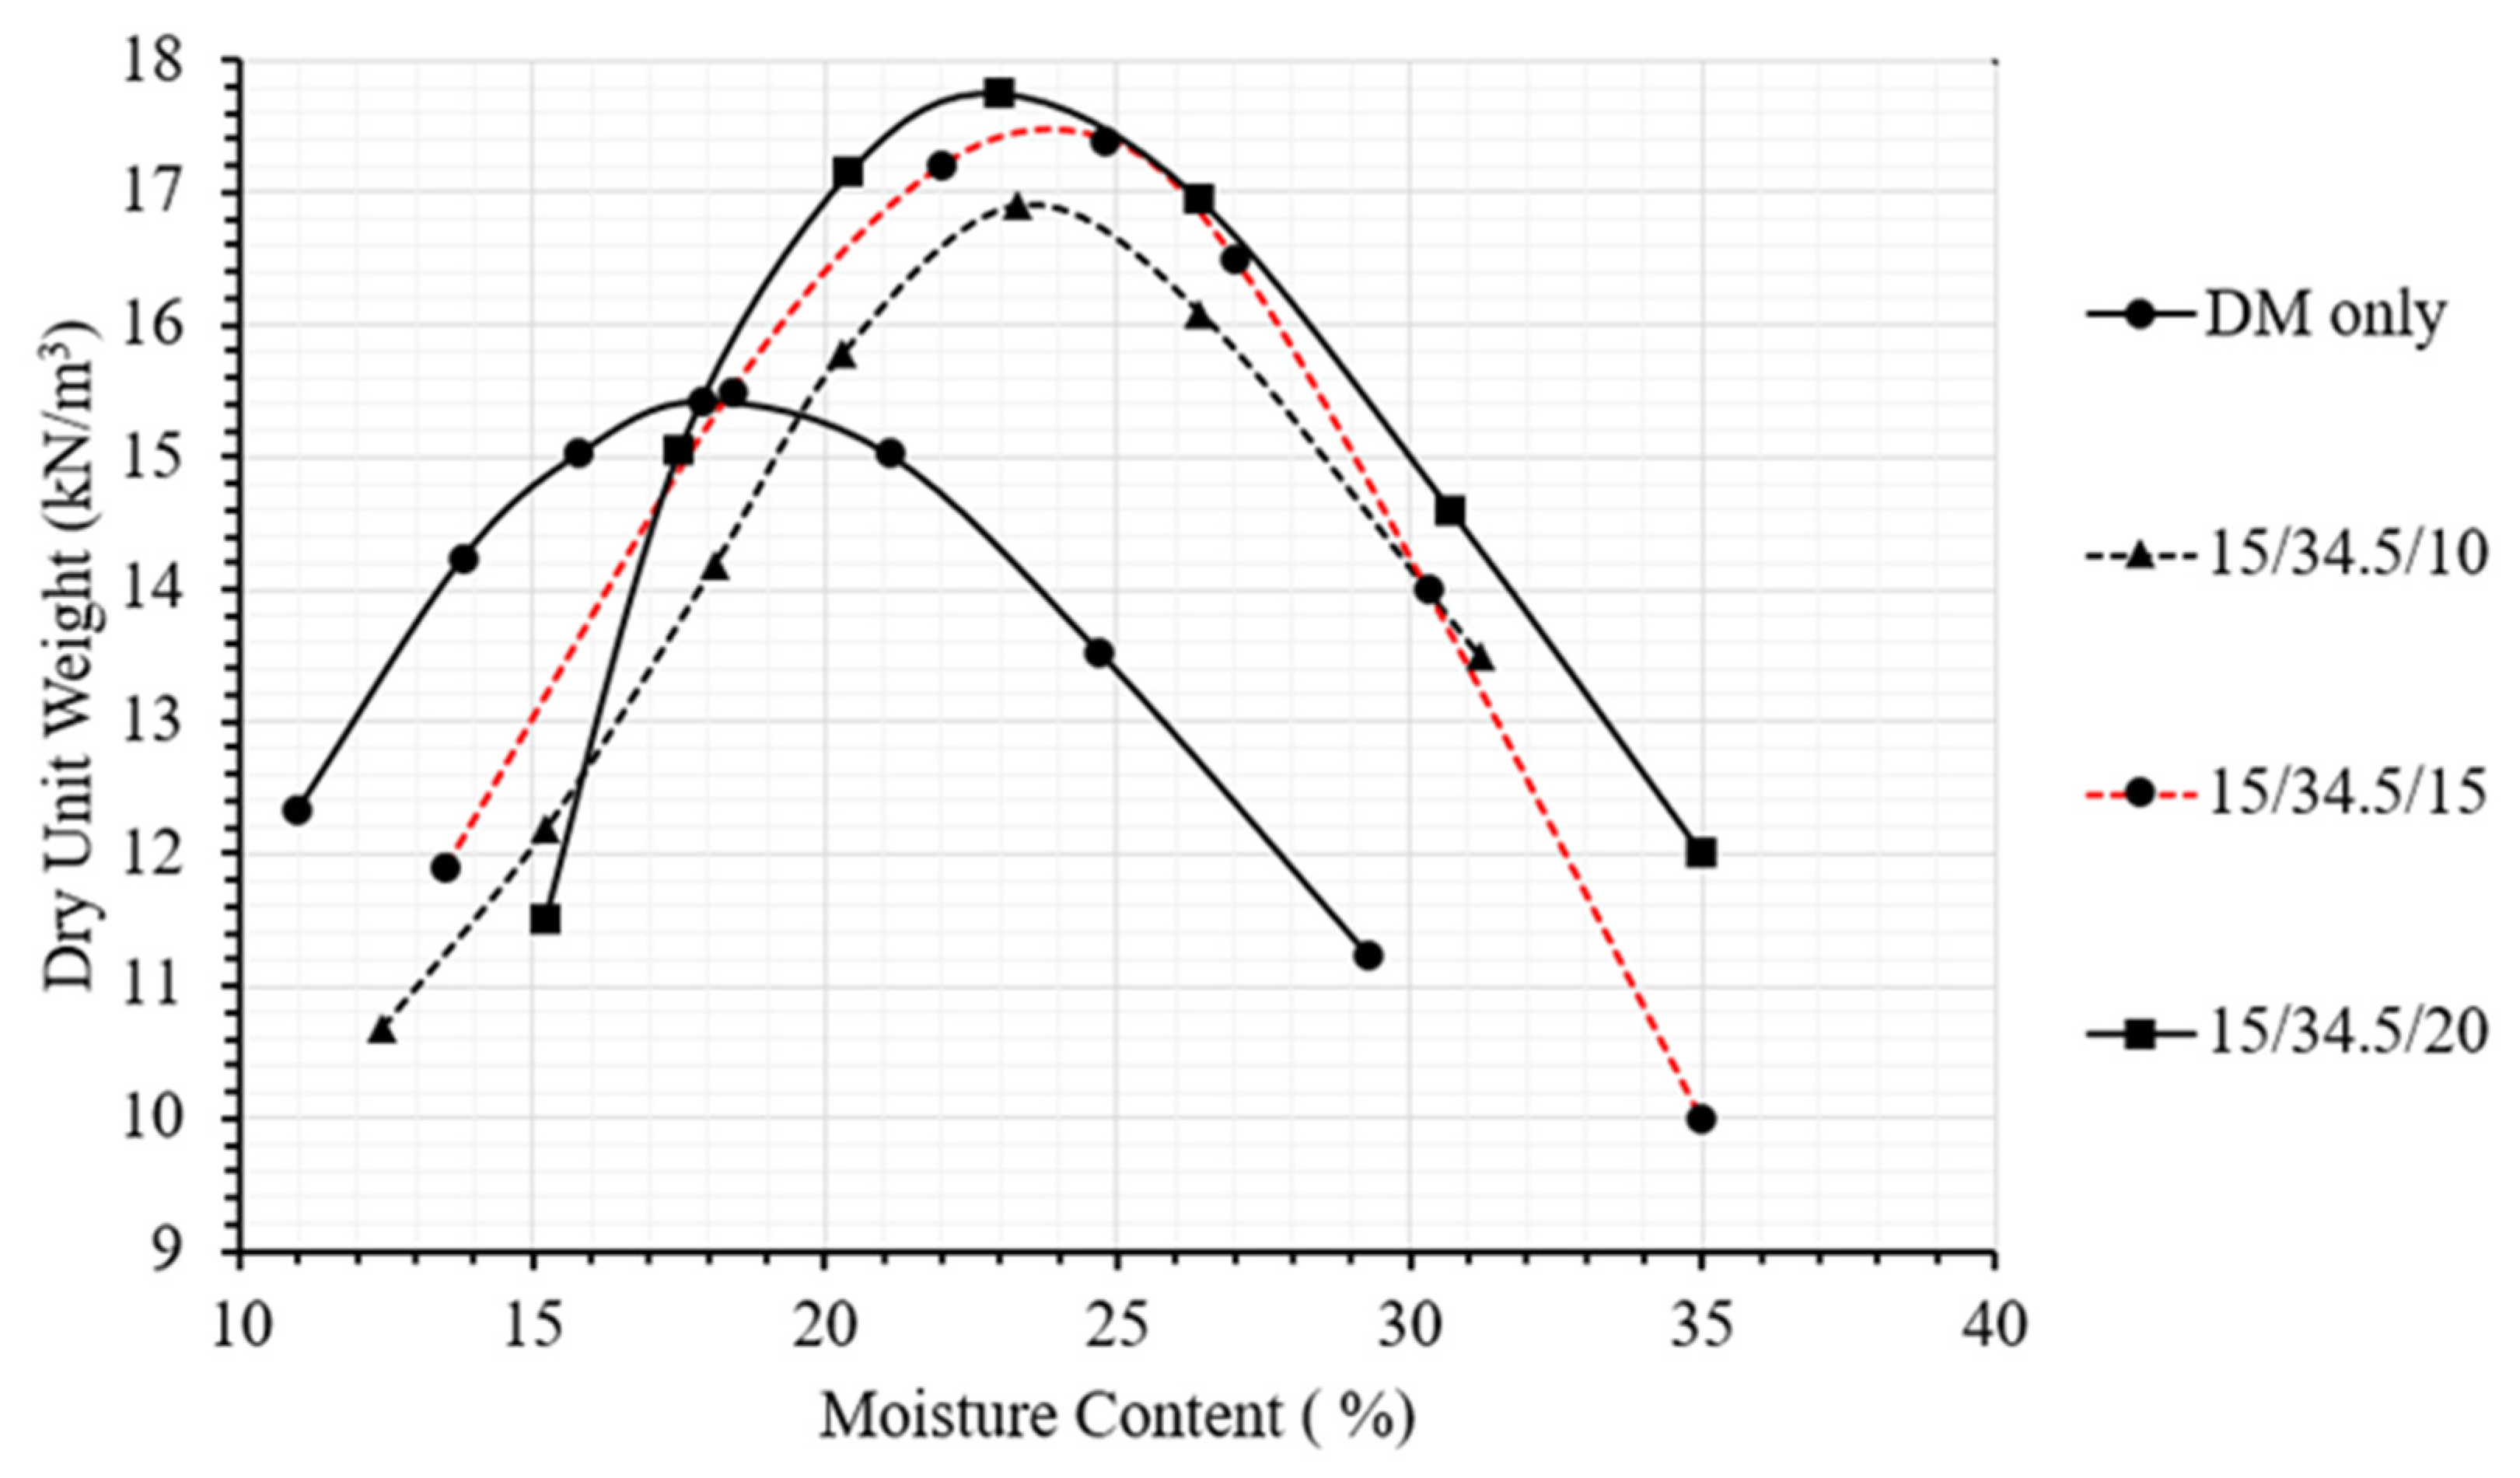
4.3.1. Compaction Behavior

Milburn and Parson [25] added lime, FA, and PC to several soil types and showed that additives could have different effects when added to different soils. Further addition of these additives did not significantly increase the MC but did increase the dry density. This effect can be partly attributed to the higher density of FA compared to HL and partly due to the spherical shape of FA particles, which enhances packing through its rolling effect. The addition of HL and FA at an FA/HL ratio of 2.3 increased the OMC, and inclusion of 15% PC slightly increased the γd(max) [23]. The increase in γd(max) can be partly due to the round particles of FA which facilitate particle packing and thus compaction, and partly due to the higher specific gravity of FA and PC compared to untreated DM.
All samples were tested for optimum moisture content (OMC) and maximum dry density γd(max) according to ASTM D698 [37] and using different amounts of FA, HL, and PC while keeping the FA/HL ratio at the optimum value of 2.3. To demonstrate the effect of stabilizers on the compaction characteristics of the stabilized dredged material (SDM), the moisture–density relations of the mixes were determined and are shown in Figure 4, Figure 5 and Figure 6. In these figures, the legend follows Table 2 and indicates the relative amount of HL/FA/PC, respectively.
Figure 5 presents the compaction variations at a Portland cement (PC) content of 10%. Increasing the amount of fly ash and hydrated lime slightly increased the moisture content (MC) from a maximum of 23% to 28%. It has been previously reported that Portland cement can slightly decrease OMC and increase γd(max) [1]. Saeed et al. [32], studying the effects of HL and FA on the same type of DM, reported that HL increased the OMC while lowering the γd(max), whereas FA decreased the OMC but increased the γd(max). The same trend was observed with a PC content of 15% and varying contents of FA and HL as depicted in Figure 6. Figure 7 compares mixes containing HL/FA of 15/34.5—which resulted in the highest γd(max)—with varying PC contents (10, 15, and 20). It was observed that increasing the PC content from 10% to 20% slightly increased the γd(max). Samples containing FA at 57.5%, HL at 25%, and 15% PC exhibited almost the same OMC as those with 10% PC but had a slightly larger γd(max). This effect may be due to the higher specific gravity of PC (3.15) compared to DM (2.69), FA (2.7), and HL (2.3).

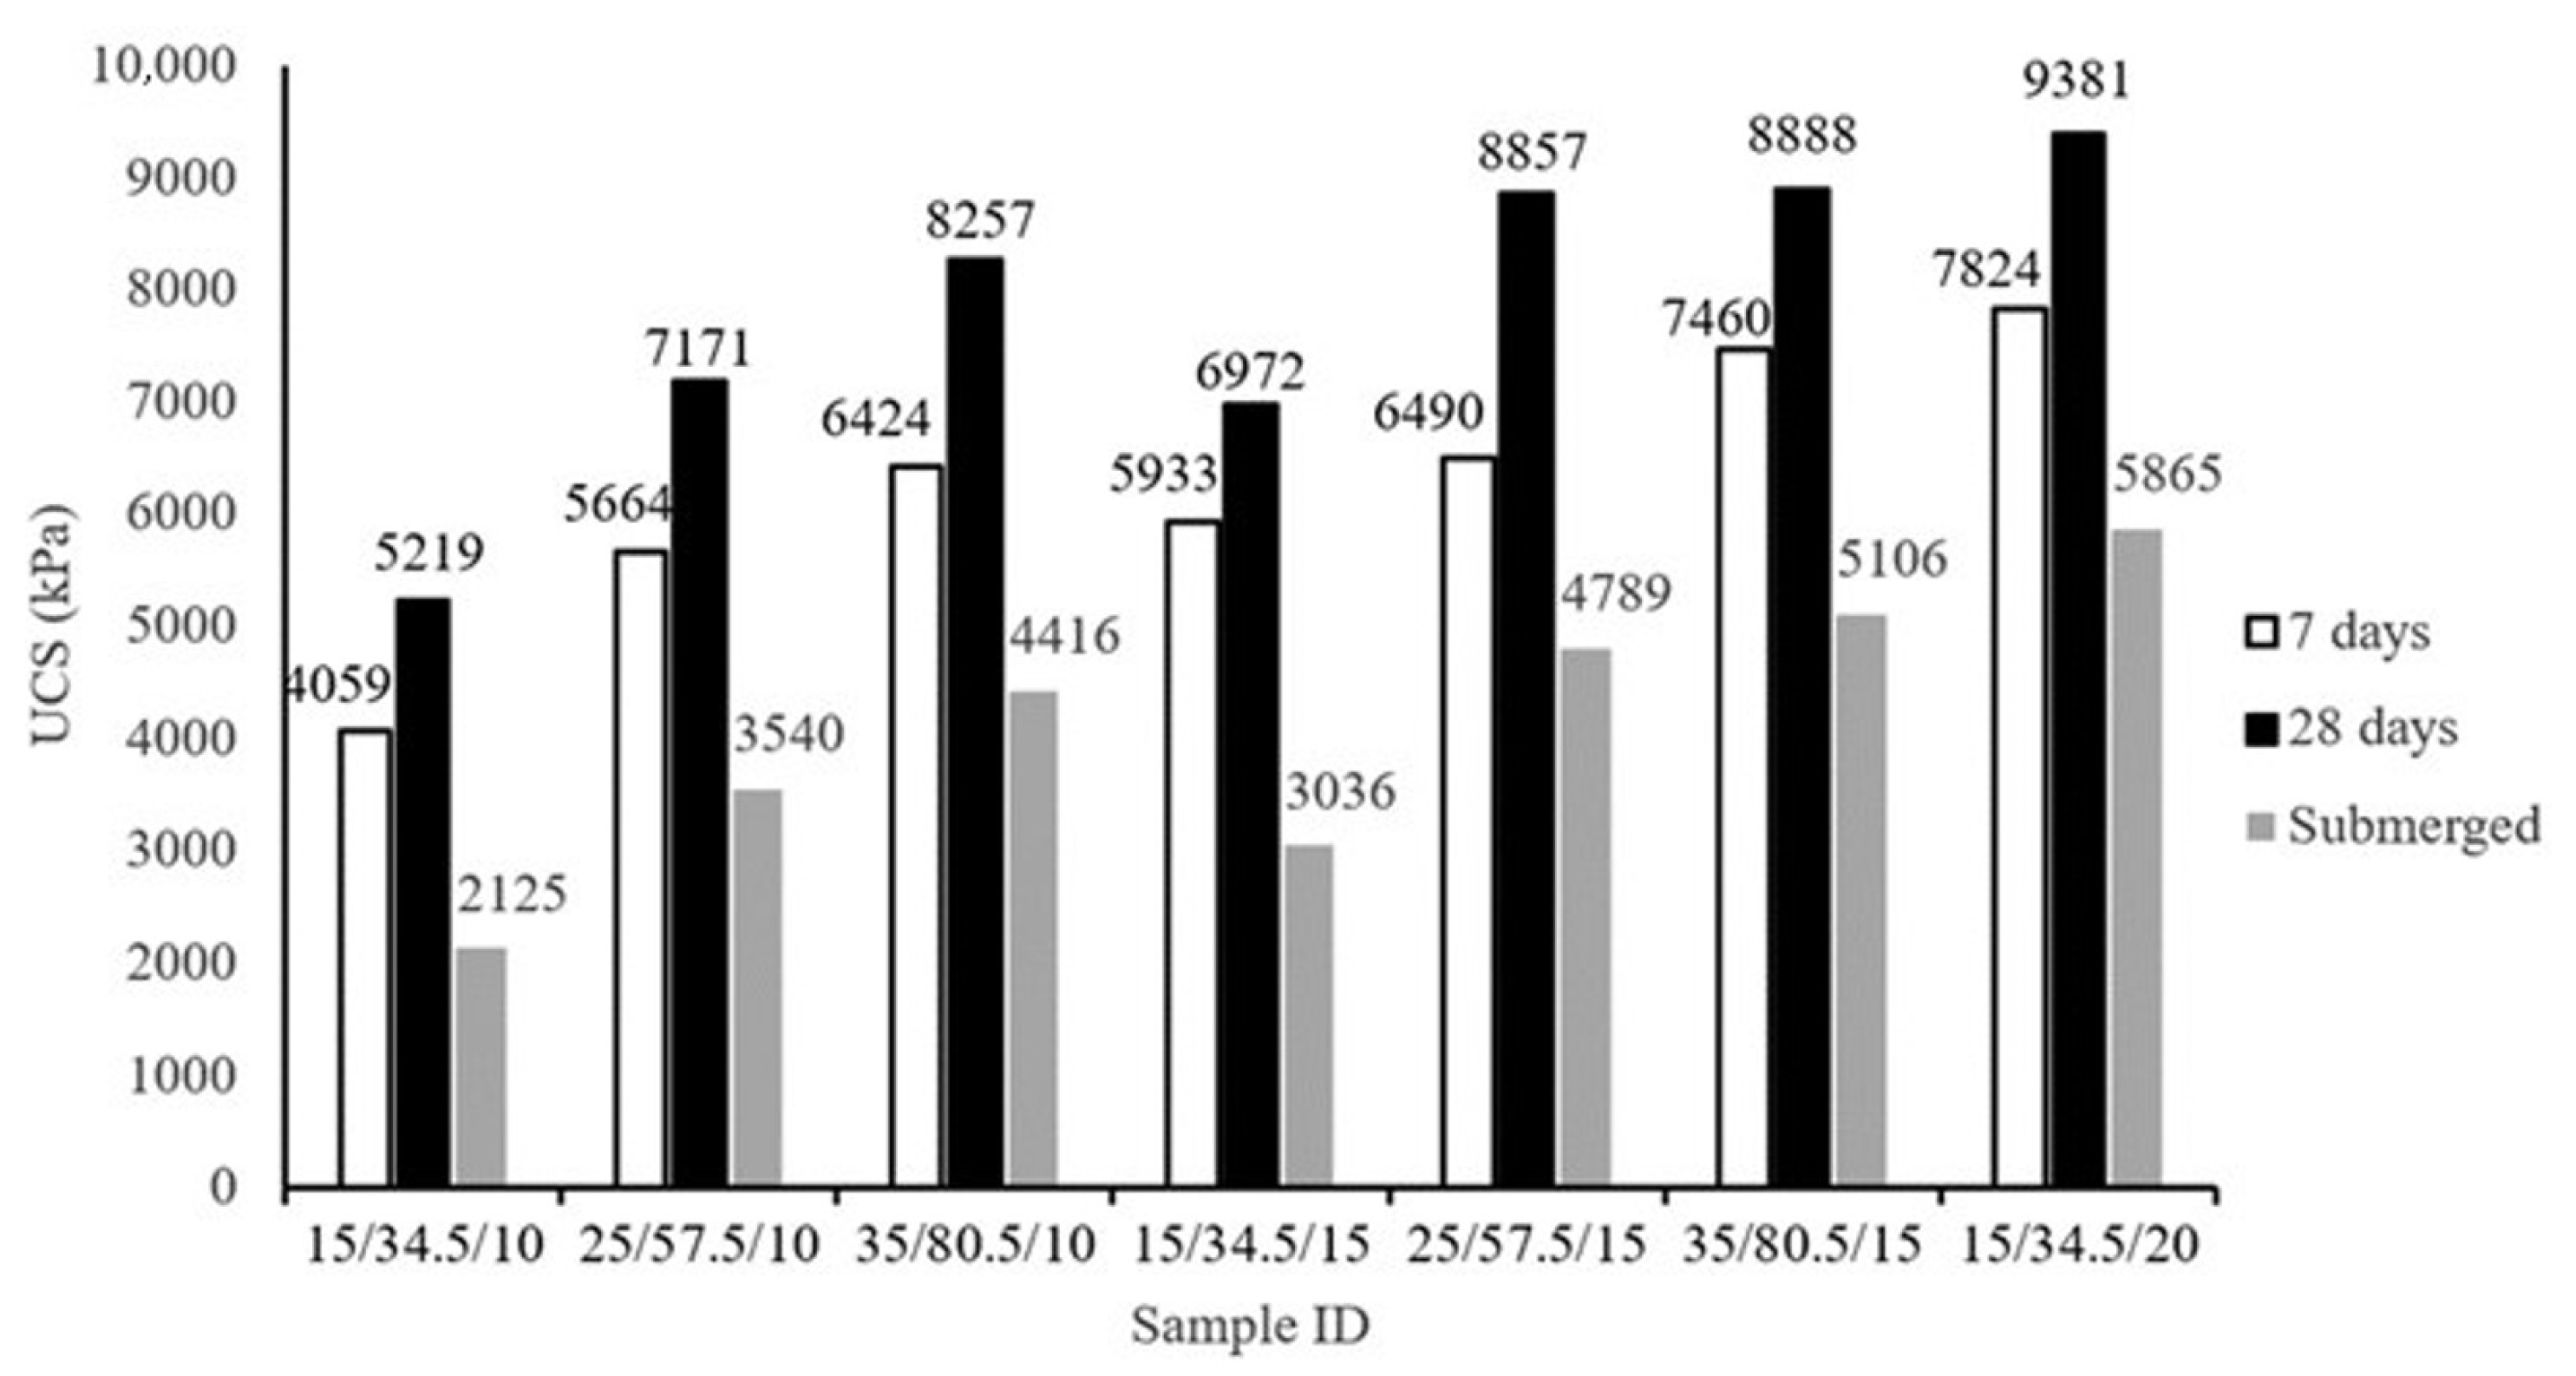
4.3.2. Compressive Strength

Following curing times of 7 and 28 days, the specimens were tested for compressive strength (CS) in accordance with the New Mexico Code. For each mix, three samples were tested, and the average value was determined. To assess the durability of the samples, they were submerged in water for four hours after 28 days of curing and then tested for their CS. The average data of all these tests are presented in Figure 8, and the values are provided in Table 4. The term “remaining CS” refers to the CS of the submerged brick divided by the naturally cured 28-day SC. The remaining UCS column shows that in the most critical condition, which occurred for the mix 15/34.5/10, above 40% of the strength was retained after submergence.
Figure 8 helps us to compare all samples and shows that a higher content of additives results in higher CS. Strength values varied between 4.1 to 7.8 MPa after 7 days of curing. All samples demonstrated higher CS after 28 days, which indicates the effect of time on strength gain. The CS after 28 days varied between 5.2 MPa to 9.4 MPa. We note that major strength improvement occurs during the first week of curing. According to the data, between 78 to 85% of the 28-day UCS is achieved in just 7 days. This is attributed to the presence of Portland cement (PC), which hardens faster than the combination of hydrated lime (HL) and fly ash (FA). Conversely, as reported by other researchers, the combination of HL and FA takes longer to harden, with the process continuing for 90 days or even longer [3,34,38]. Results from Grubb indicated that where an abundant content of HL and FA was available, a substantial increase in strength was recorded after 90 days.
Figure 8 also compares the UCS averages of brick cured for 28 days before and after being submerged. A major drop in UCS is observable for stabilized bricks after they were submerged in water for four hours. These results are indicative of the durability of the stabilized dredge material brick (SDMB). Comparing all three types of samples, Figure 8 reveals that the strength values of the bricks after submergence were lower than those of 7 days for all samples. The submerged strength of SDMB decreased to as low as half of their strength after 7 days, specifically for mixes 15/34.5/10 and 15/34.5/15. As expected for all samples, as the amount of addition is increased compared to DM, the UCS increased, with the effect being more pronounced as the ratio of PC increased.
Table 4 presents the remaining unconfined compressive strength (UCS) after submergence. Unsurprisingly, increasing the amount of stabilizing agent increases the remaining UCS. With a fixed amount of HL and FA, an increase in PC led to higher UCS retention. These observations are possibly explained by the fact that the presence of PC creates a denser matrix with fewer pores and lower water absorption. To evaluate the extent of these bonds, the microstructure of the samples was investigated using SEM.

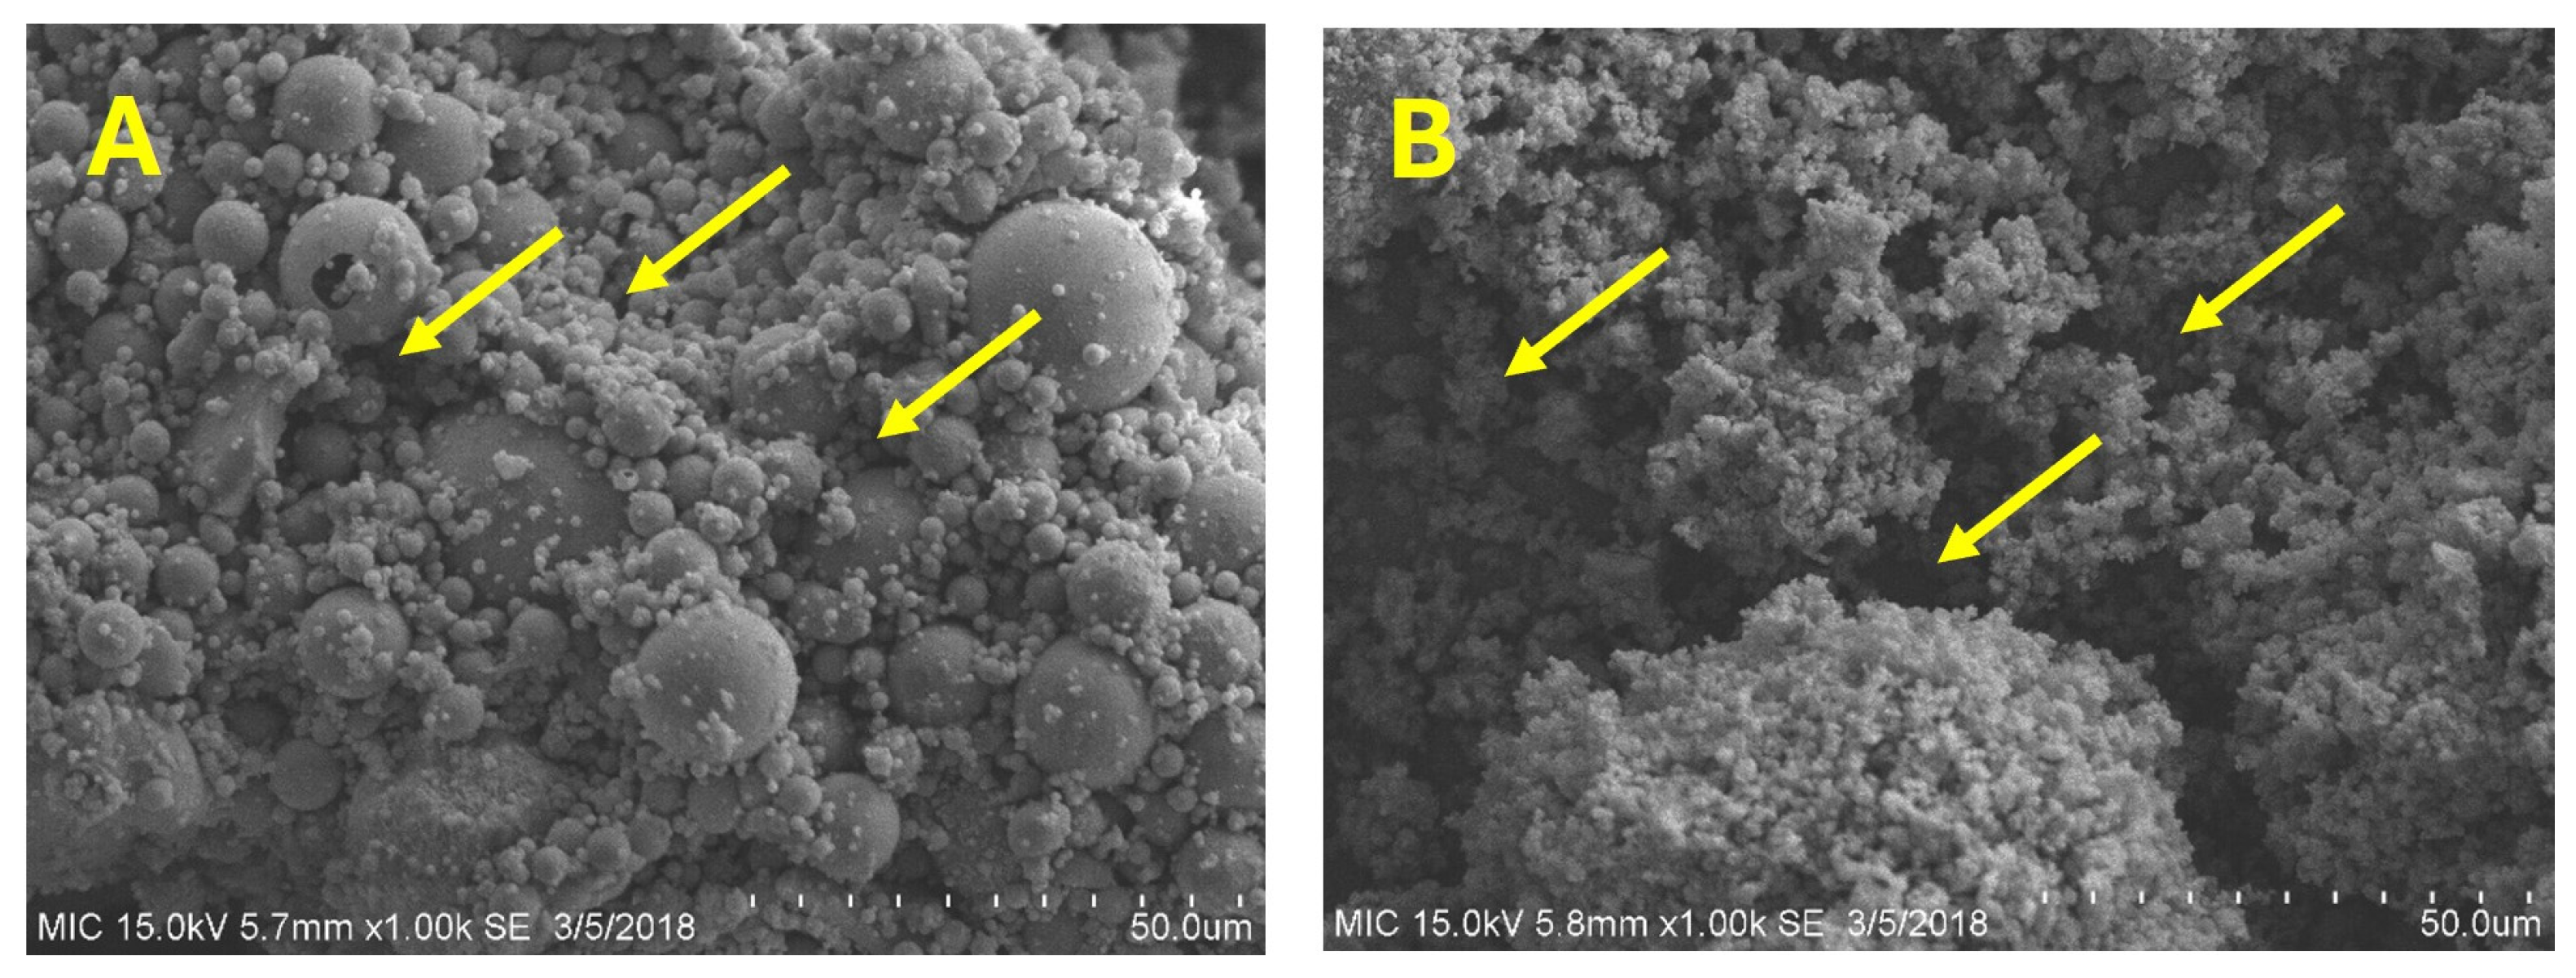
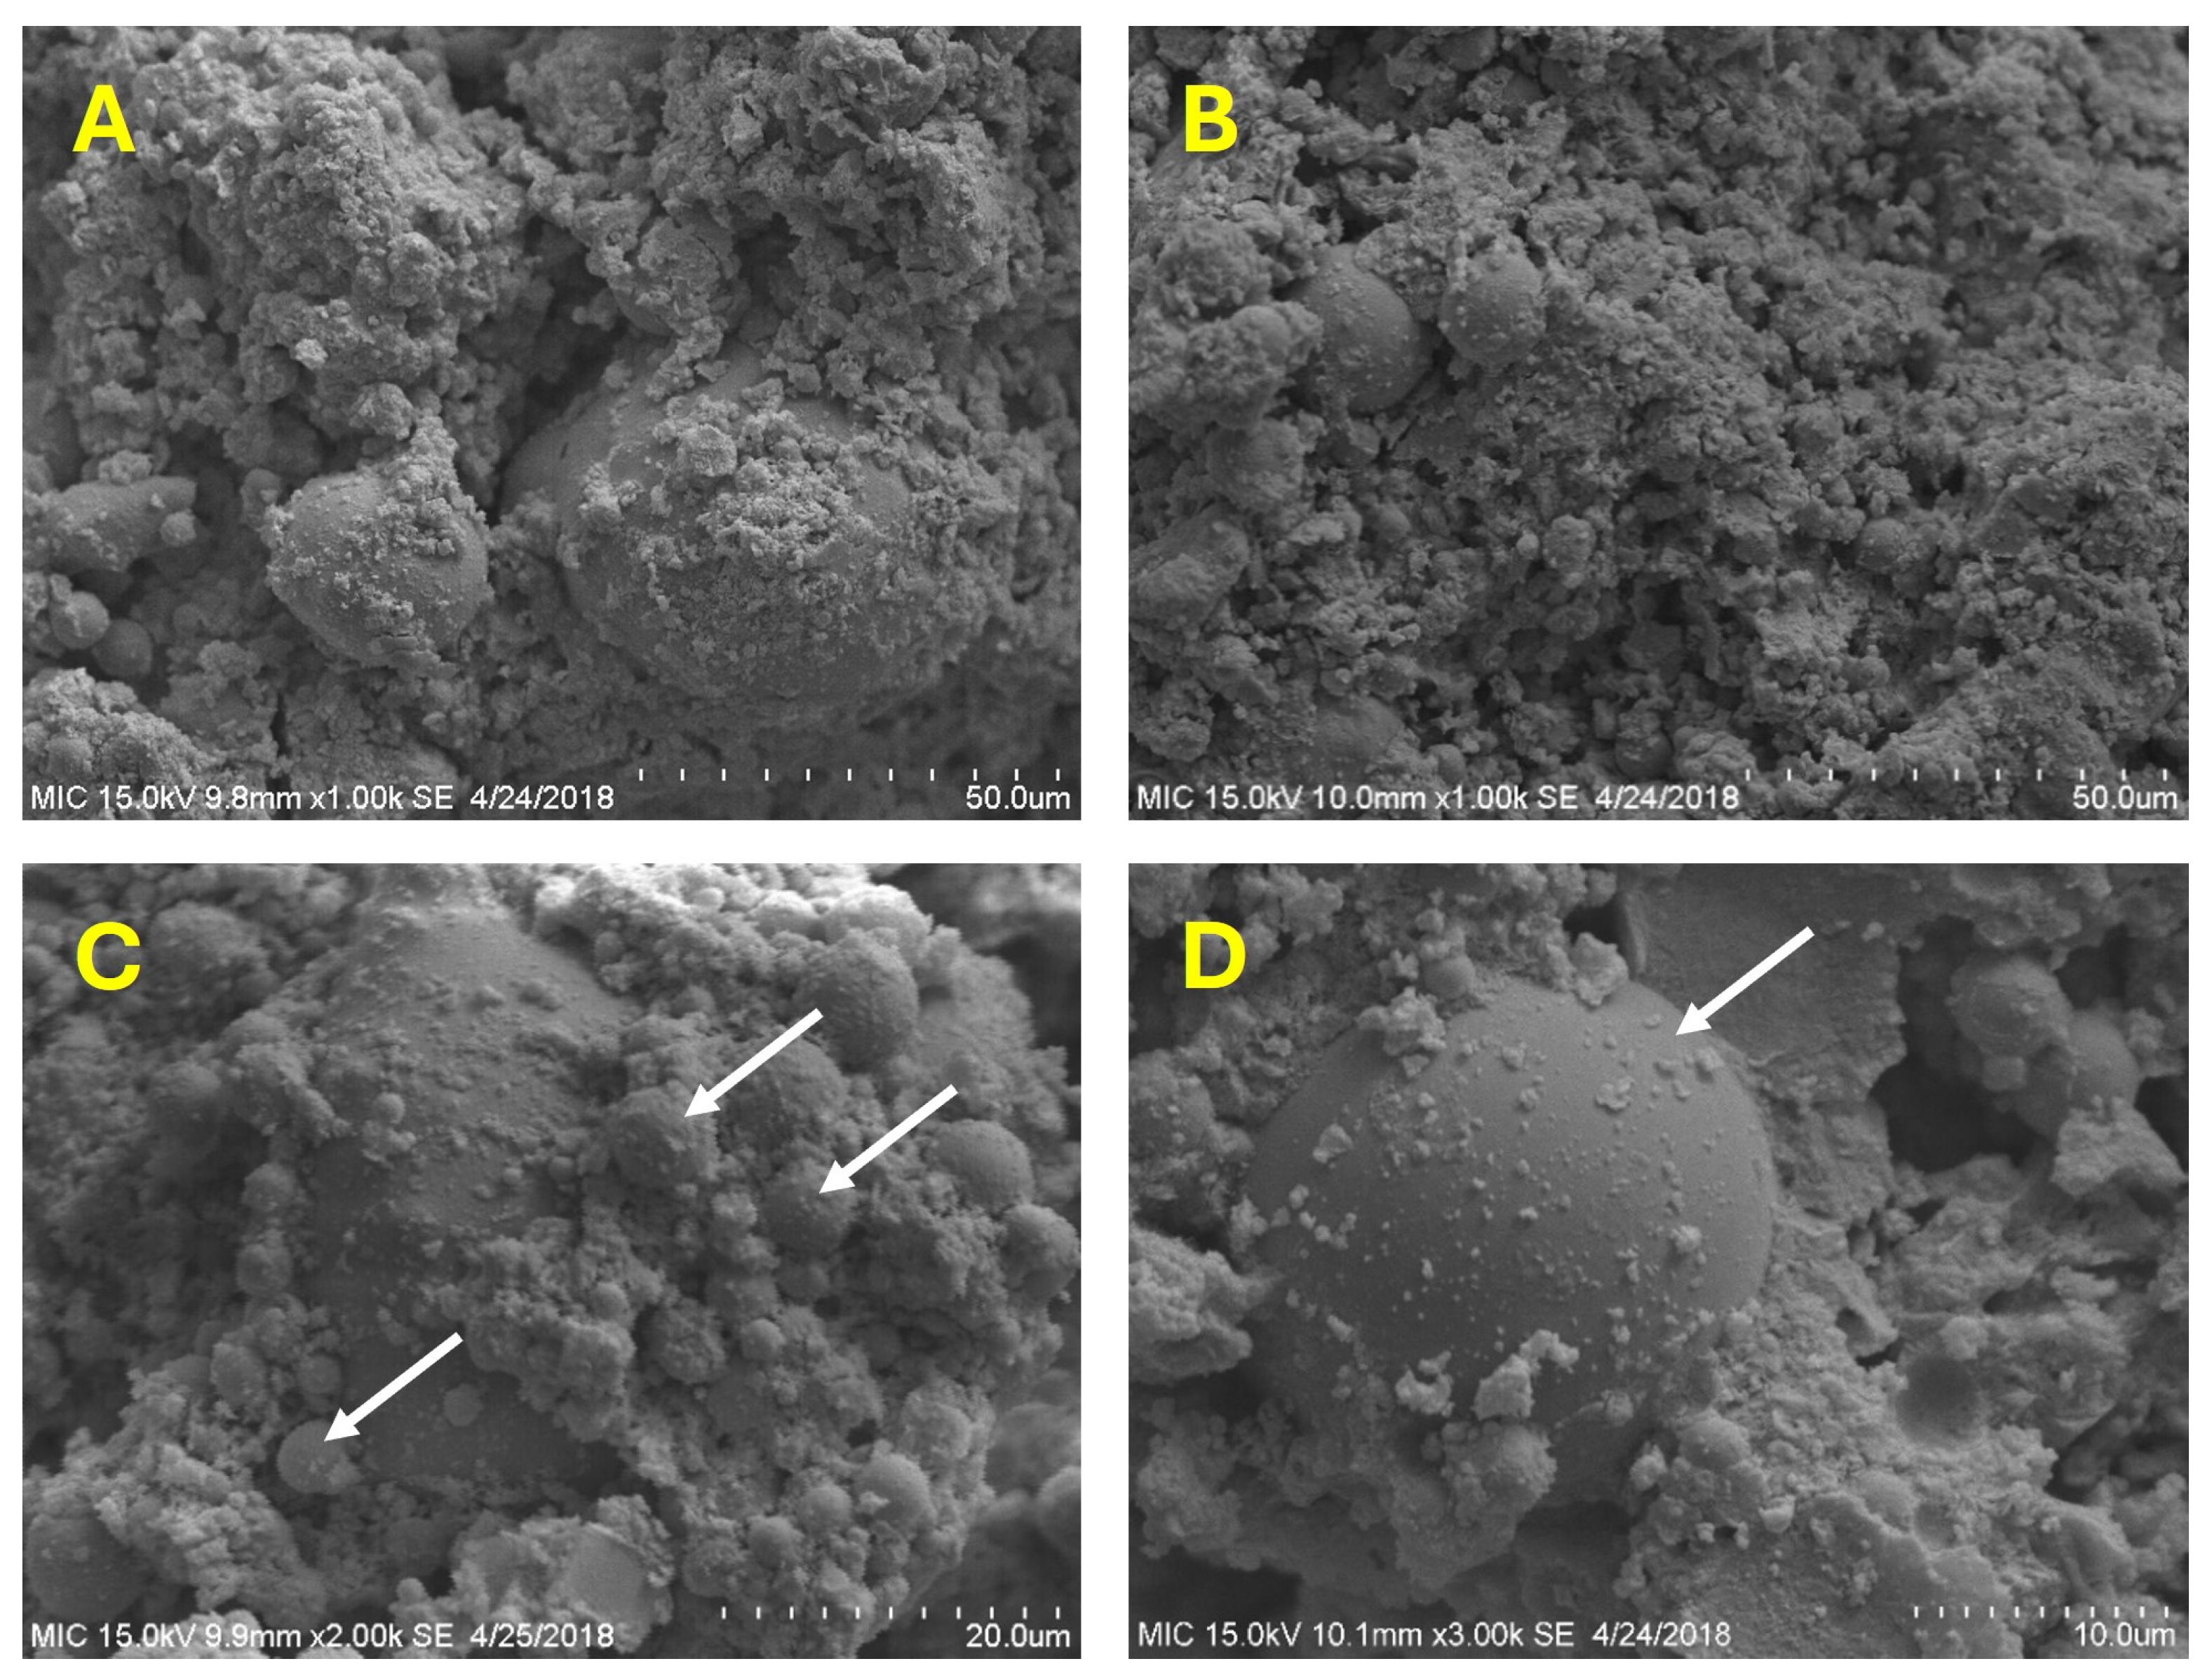
4.4. Scanning Electron Microscopy (SEM)

Scanning electron microscopy (SEM) images of fly ash (FA) and hydrated lime (HL) are presented, respectively, in Figure 9A,B for comparison purposes. The images taken with a magnification of 1000x show an abundance of small particles with large variation in the interparticle spaces indicating the lack of cohesion. Some of these voids are indicated using yellow arrows as examples.
Figure 10 presents a series of SEM images at different magnifications of a DM sample treated with the highest amount of stabilizing hydrated lime, fly ash, and Portland cement (35/84.5/20). Note that these figures are typical of all treated samples but only one sample is presented for clarity. Panels A and B present two different areas at a magnification of 1000x. These images, when compared to those in Figure 9, reveal that cementitious product envelope smaller particles and bond individual particles together; i.e., the number of voids, such as those indicated by yellow arrows in Figure 9, is significantly reduced. The interactions create a continuous texture, which is less porous and leads to higher strength. Panels C and D show SEM images at magnifications of 2000x and 3000x, respectively. These images reveal that an excess of fly ash material exists that does not participate in a reaction, as highlighted by white arrows. These larger magnification images also show that the cementitious reactions commence on the surface of fly ash particles forming a layer of hydration products on the surfaces, which leads to higher enhancement of the properties of stabilized DM.

5. Conclusions

Dredged material (DM) from disposal land adjacent to Sabine Lake in Texas, USA, was stabilized using a ternary combination of hydrated lime (HL), fly ash (FA), and Portland cement (PC) and was then used to fabricate compressed blocks, which were subsequently subjected to various tests.
Upon stabilization with various mixes, the unconfined compressive strength (UCS) values dramatically increased from 283 kPa to values ranging from 4059 kPa to 9381 kPa for the HL/FA/PC ratios 15/34.5/10 and 15/34.5/20, respectively. In addition, DM stabilization led to noticeable increases in both OMC and maximum dry density γd(max). All tested mixtures surpassed the minimum strength requirements for bricks as stipulated by both the International Building Code (IBC) and the New Mexico Code, which mandate an average strength greater than 300 psi (2068 kPa) and individual strengths above 250 psi (1724 kPa). Major strength improvement occurred over the first week, with 78 to 85% of the 28-day compressive strength (CS) achieved in just 7 days. Erosion tests were also performed by submerging the bricks in water for 4 h. Following submersion, the bricks’ CS experienced a significant decline, retaining between 41% to 63% of their initial 28-day strength.
Our results show that DM, when stabilized using a mixture of HL, FA, and PC, could be reused as unfired bricks for some applications. However, we found that optimizing the relative amount of stabilizing material is critical to maximizing the strength properties of DM based bricks.

Author Contributions

Conceptualization, T.T.M.N., M.J. and P.B.; methodology, T.T.M.N., M.J., C.-W.Y. and P.B.; software, T.T.M.N., S.R., P.B. and A.S.K.; validation, T.T.M.N., S.R. and A.S.K.; formal analysis, S.R. and A.S.K.; investigation, T.T.M.N., R.J., B.B., D.F., F.A., J.D. and X.L.; resources, T.T.M.N., M.J. and P.B.; data curation, T.T.M.N.; writing—original draft preparation, S.R.; writing—review and editing, A.S.K., T.T.M.N., M.J. and P.B.; visualization, S.R. and A.S.K.; supervision, T.T.M.N., M.J. and P.B.; project administration, T.T.M.N., M.J. and P.B.; funding acquisition, T.T.M.N., M.J. and P.B. All authors have read and agreed to the published version of the manuscript.

Funding

This research was partially supported by grants from the Welch Foundation (V-0004) and from the Center for Resiliency, Beaumont, Texas (2024).

Institutional Review Board Statement

Not applicable.

Data Availability Statement

The original contributions presented in the study are included in the article. Further inquiries can be directed to the corresponding author/s.

Conflicts of Interest

The authors declare no conflicts of interest. The funders had no role in the design of the study; in the collection, analyses, or interpretation of data; in the writing of the manuscript; or in the decision to publish the results.

References

  1. Nguyen, T.T.M.; Rabbanifar, S.; Brake, N.A.; Qian, Q.; Kibodeaux, K.; Crochet, H.E.; Oruji, S.; Whitt, R.; Farrow, J.; Belaire, B.; et al. Stabilization of Silty Clayey Dredged Material. J. Mater. Civ. Eng. 2018, 30, 04018199. [Google Scholar] [CrossRef]
  2. Berkowitz, J.F.; Green, L.; VanZomeren, C.M.; White, J.R. Evaluating Soil Properties and Potential Nitrate Removal in Wetlands Created Using an Engineering with Nature Based Dredged Material Placement Technique. Ecol. Eng. 2016, 97, 381–388. [Google Scholar] [CrossRef]
  3. Grubb, D.G.; Chrysochoou, M.; Smith, C.J.; Malasavage, N.E. Stabilized Dredged Material. I: Parametric Study. J. Geotech. Geoenvironmental Eng. 2010, 136, 1011–1024. [Google Scholar] [CrossRef]
  4. Bolam, S.G.; Rees, H.L. Minimizing Impacts of Maintenance Dredged Material Disposal in the Coastal Environment: A Habitat Approach. Environ. Manag. 2003, 32, 171–188. [Google Scholar] [CrossRef] [PubMed]
  5. Millrath, K.; Kozlova, S.; Shimanovich, S. Beneficial Use of Dredged Material 2; Columbia University: New York, NY, USA, 2001. [Google Scholar]
  6. Wang, M.; Hull, J.; Jao, M. Stabilization of Water Treatment Plant Sludge for Possible Use as Embankment Material. In Transportation Research Record; Transportation Research Board: Washington, DC, USA, 1992; p. 1345. [Google Scholar]
  7. Bell, F.G. Lime Stabilization of Clay Minerals and Soils. Eng. Geol. 1996, 42, 223–237. [Google Scholar] [CrossRef]
  8. Nalbantoglu, Z.; Tuncer, E.R. Compressibility and Hydraulic Conductivity of a Chemically Treated Expansive Clay. Can. Geotech. J. 2001, 38, 154–160. [Google Scholar] [CrossRef]
  9. Ghosh, A.; Subbarao, C. Tensile Strength Bearing Ratio and Slake Durability of Class F Fly Ash Stabilized with Lime and Gypsum. J. Mater. Civ. Eng. 2006, 18, 18–27. [Google Scholar] [CrossRef]
  10. Poh, H.Y.; Ghataora, G.S.; Ghazireh, N. Soil Stabilization Using Basic Oxygen Steel Slag Fines. J. Mater. Civ. Eng. 2006, 18, 229–240. [Google Scholar] [CrossRef]
  11. Sariosseiri, F.; Muhunthan, B. Effect of Cement Treatment on Geotechnical Properties of Some Washington State Soils. Eng. Geol. 2009, 104, 119–125. [Google Scholar] [CrossRef]
  12. Horpibulsuk, S.; Phojan, W.; Suddeepong, A.; Chinkulkijniwat, A.; Liu, M.D. Strength Development in Blended Cement Admixed Saline Clay. Appl. Clay Sci. 2012, 55, 44–52. [Google Scholar] [CrossRef]
  13. Shen, S.; Wang, Z.; Horpibulsuk, S.; Kim, Y.H. Jet Grouting with a Newly Developed Technology: The Twin-Jet Method. Eng. Geol. 2013, 152, 87–95. [Google Scholar] [CrossRef]
  14. Shen, S.-L.; Wang, Z.-F.; Sun, W.-J.; Wang, L.-B.; Horpibulsuk, S. A Field Trial of Horizontal Jet Grouting Using the Composite-Pipe Method in the Soft Deposits of Shanghai. Tunn. Undergr. Space Technol. 2013, 35, 142–151. [Google Scholar] [CrossRef]
  15. Shen, S.; Hou, D.; Zhao, J.; Horpibulsuk, S. Assessment of Internal Forces for Intermediate Anchorage Zone of Post-Tensioned Concrete Structure. Constr. Build. Mater. 2014, 64, 370–378. [Google Scholar] [CrossRef]
  16. Shen, S.; Wu, H.; Cui, Y.; Yin, Z.Y. Long-Term Settlement Behaviour of Metro Tunnels in the Soft Deposits of Shanghai. Tunn. Undergr. Space Technol. 2014, 40, 309–323. [Google Scholar] [CrossRef]
  17. Barciela-Rial, M.; Vardon, P.J.; Van Kessel, T.; Griffioen, J.; Winterwerp, J.C. Effect of Composition on the Compressibility and Shear Strength of Dredged Cohesive Sediment. Front. Earth Sci. 2022, 10, 786108. [Google Scholar] [CrossRef]
  18. Yu, C.; Cui, C.; Zhao, J.; Liu, F.; Fu, S.; Li, G. Enhancing mechanical properties of dredged sludge through carbonation stabilization employing steel slag: An eco-friendly and cost-effective approach. Constr. Build. Mater. 2024, 412, 134748. [Google Scholar] [CrossRef]
  19. Athira, S.; Subaida, E.A.; Vinod, P. A framework for geotechnical characterization of dredged reservoir sediments and its sustainable reuse after stabilization. Environ. Earth Sci. 2024, 83, 152. [Google Scholar] [CrossRef]
  20. Showkat, R.; Mir, B.A.; Wani, K.M.N.S. Experimental investigation on reuse of dredged soils improved using waste rubber tyre powder (WRTP) and cement as admixtures. Geomech. Geoengin. 2024, 1–15. [Google Scholar] [CrossRef]
  21. Kishore, M.S.; Gayathri, S.; Varma, D.A.; Tharayil, J.M. Revitalizing dredged soils through chemical-physical combined method: A feasibility study. Mar. Georesources Geotechnol. 2023, 1–16. [Google Scholar] [CrossRef]
  22. Nguyen, T.T.M.; Rabbanifar, S.; Luo, Z.; Huddleston, C.; O’Connor, T.; Richard, A.; Michel, M.; Moon, R.; Yao, C.W.; Jao, M.; et al. Development of Fiber Reinforced Sustainable Dredge Bricks. Appl. Sci. 2023, 13, 789. [Google Scholar] [CrossRef]
  23. Rabbanifar, S.; Nguyen, T.T.M.; Yao, C.W.; Qian, Q.; Bernazzani, P.; Jao, M. Adding Value to Dredged Material Using Lime and Ash Products. In Proceedings of the Recent Trends in Geotechnical Geo-Environmental Engineering and Education, RTG2EE International Conference, Online, Brisbane, Australia, 10–11 September 2020; pp. 94–98, ISBN-13: 978-0-6489449-0-4. [Google Scholar]
  24. Sadat Associates Inc. Use of Dredged Materials for the Construction of Roadway Embankments; OENJ Corporations Inc.: Princeton, NJ, USA, 2001. [Google Scholar]
  25. Milburn, J.; Parsons, R. Performance of Soil Stabilization Agents; Kansas Department of Transportation: Topeka, KS, USA, 2004. [Google Scholar]
  26. Riza, F.; Rahman, I.; Zaidi, A.M.A. Brief Review of Compressed Stabilized Earth Brick (CSEB). In Proceedings of the International Conference on Science and Social Research, Dubrovnik, Croatia, 5–7 December 2010; pp. 999–1004. [Google Scholar]
  27. Mackiewicz, S.; Ferguson, E.G. Stabilization of Soil with Self-Cementing Coal Ashes. In Proceedings of the 2005 World of Coal Ash (WOCA), Lexington, KC, USA, 11–15 April 2005; pp. 1–7. [Google Scholar]
  28. Kumar, S. A Perspective Study on Fly Ash–Lime–Gypsum Bricks and Hollow Blocks for Low Cost Housing Development. Constr. Build. Mater. 2002, 16, 519–525. [Google Scholar] [CrossRef]
  29. Cicek, T.; Tanrıverdi, M. Lime Based Steam Autoclaved Fly Ash Bricks. Constr. Build. Mater. 2007, 21, 1295–1300. [Google Scholar] [CrossRef]
  30. Turgut, P. Manufacturing of Building Bricks without Portland Cement. J. Clean Prod. 2012, 37, 361–367. [Google Scholar] [CrossRef]
  31. Vinai, R.; Lawane, A.; Minane, J.; Amadou, A. Coal Combustion Residues Valorisation: Research and Development on Compressed Brick Production. Constr. Build. Mater. 2013, 40, 1088–1096. [Google Scholar] [CrossRef]
  32. Hydraform. Hydraform Technical Specifications of Hydraform Bricks; Hydraform: Johannesburg, South Africa, 2017. [Google Scholar]
  33. Sitton, J.D.; Zeinali, Y.; Heidarian, W.H.; Story, B.A. Effect of Mix Design on Compressed Earth Block Strength. Constr. Build. Mater. 2018, 158, 124–131. [Google Scholar] [CrossRef]
  34. New Mexico Earthen Building Materials Code. Construction Industries Division of the Regulation and Licensing Department. Title 14: Housing and Construction Chapter 7: Building Codes General. 2009. Available online: http://www.udcinc.org/2009%20New%20Mexico%20Earthen%20Building%20Materials%20Code.pdf (accessed on 9 January 2024).
  35. International Building Code 2003. Chapter 21: Masonry. Available online: https://codes.iccsafe.org/content/IBC2003/cover (accessed on 9 January 2024).
  36. Rabbanifar, S.; Nguyen, T.T.M.; Qian, Q.; Brake, N.A.; Kibodeaux, K.; Crochet, H.E.; Oruji, S.; Whitt, R.L.; Farrow, J.S.; Belaire, B.G.; et al. Reusing Dredged Material through Stabilization with So-Called Bio-Enzyme Products. Buildings 2023, 13, 2618. [Google Scholar] [CrossRef]
  37. ASTM International. Available online: https://www.astm.org/ (accessed on 9 January 2024).
  38. Federico, A.; Vitone, C.; Murianni, A. On the Mechanical Behaviour of Dredged Submarine Clayey Sediments Stabilized with Lime or Cement. Can. Geotech. J. 2015, 52, 2030–2040. [Google Scholar] [CrossRef]
Figure 1. Location overview of Placement Area 9 (PA9): (A) a GIS map highlighting the location of PA9 within Texas; (B) a detailed GIS map showing the boundaries of PA9; (C) an aerial photograph depicting the surrounding area of PA9; (D) an aerial photograph providing a close-up view of PA9.
Applsci 14 08544 g001
Figure 2. The brick fabrication process involves the drying of DM and the mixing of additives (panel (A)), the ensuring of proper moisture content (panel (B)), and the use of the Auram Press 3000 to make the compressed bricks (panel (C)). The final results: a series of bricks (panel (D)).
Applsci 14 08544 g002
Figure 3. Image of a typical compressed block from stabilized dredged material using mix design 4 (HL/FA/PC ratio of 35/80.5/10).
Applsci 14 08544 g003
Figure 4. Particle size distribution of DM and additives.
Applsci 14 08544 g004
Figure 5. Compaction data for varying contents of HL and FA (for PC = 10%).
Applsci 14 08544 g005
Figure 6. Compaction data for varying contents of HL and FA (for PC = 15%).
Applsci 14 08544 g006
Figure 7. Stabilized mixed at a fixed dosage of HL and FA (for PC = 10, 15, and 20).
Applsci 14 08544 g007
Figure 8. UCS of all stabilized samples.
Applsci 14 08544 g008
Figure 9. Scanning electron microscopy (SEM) image 1000x magnification of (A) fly ash and (B) hydrated lime. The yellow arrows indicate the presence of voids.
Applsci 14 08544 g009
Figure 10. SEM images of the highest dosage (35/84.5/20) at different scales: (A) 1000x highlighting the enveloping of small particles; (B) 1000x highlighting the continuous smooth texture; (C) 2000x, and (D) 3000x. The white arrows highlight the presence of excess fly ash material.
Applsci 14 08544 g010
Table 1. Chemical composition of additives.
Chemical Analysis (wt.%)FAHLPC
CaO (% as Ca(OH)2)14.5>8562.88
Silicon Dioxide (SiO2)52.24<0.120.61
Aluminum Oxide (Al2O3)18.610.244.4
Iron Oxide (Fe2O3)4.820.493.32
Magnesium Oxide (MgO)3.850.222.20
Sulfur Trioxide (SO3)0.780.872.7
Sodium Oxide (Na2O)1.00-0.19
Potassium Oxide (K2O)1.28-0.50
Loss on ignition (LoI)0.3524.001.29
Specific Gravity2.50–2.802.20–2.403.15
pH (at 25 °C)7–1212.45
Table 2. Proposed mix designs and ratios of interest.
Mix No.HLFAPC% Cementitious
(pwd)
% DM
(pwd)
10.00.000.0100.0
215.034.51037.362.7
325.057.51048.152.0
435.080.51055.744.4
515.034.51539.260.8
625.057.51549.450.6
735.080.51556.643.4
815.034.52041.059.0
Table 3. Preliminary test results for DM.
Tests ConductedProperty DescriptionValue
Particle Size% Passing No. 20086.9
% Sand9.4
% Gravel3.7
Unconfined Compressive Strength (kPa) 283 (41 psi)
Dry Unit Weight (kN/m3) 15.9
Moisture Content (%) 68–82%
Specific Gravity 2.69
Organic Content 12–18%
Proctorγd,max (lb/ft3)101
ωopt (%)21
Atterberg Limits (%) Liquid Limit52
Plastic Limit24
Plasticity Index28
Classification (USCS)OH—Organic clay of medium to high plasticity organic silt
Table 4. Strength measurements for SDMB.
SNID
(HL/FA/PC)
Ave CS7
(kPa)
Ave CS28
(kPa)
Ave Submerged CS (kPa)Remaining CS
(Submerged/28)
115/34.5/1040595219212541
225/57.5/1056647171354049
335/80.5/1064248257441653
415/34.5/1559336972303644
525/57.5/1564908857478954
635/80.5/1574608888510657
715/34.5/2078249381586563
Disclaimer/Publisher’s Note: The statements, opinions and data contained in all publications are solely those of the individual author(s) and contributor(s) and not of MDPI and/or the editor(s). MDPI and/or the editor(s) disclaim responsibility for any injury to people or property resulting from any ideas, methods, instructions or products referred to in the content.

