Abstract
Rill swell (RS) events are outflows of dry, fine-grained material mainly observed at drawpoints in cave mining. These events can negatively affect production and have fatal consequences. Unfortunately, comprehensive studies analyzing these events are lacking. This paper uses the discrete element method to study RS events. With this method, a numerical model was constructed and calibrated based on an RS event recorded in Ridgeway Deeps Block Cave. Drawpoint geometries, material properties, and the initial mass of the fine material were then analyzed. The results show that both the brow beam height and drawpoint width had a noticeable influence on the RS magnitude, mainly on the tonnage of the flow and the distance reached by coarse particles dragged into the extraction drift. While the mass of fine material is crucial to the magnitude of RS events, results suggest that narrowing drawpoint width and/or increasing brow beam height can mitigate the impact of RS events.
1. Introduction
Rill swell (RS) of fine material events are uncontrolled outflows of dry, fine-grained materials from drawpoints in underground mining, which can also transport large rocks interspersed with the fine material. The first events registered in Palabora Block Cave Lift 1 were described as fine rushes with material flowing in the air [1]; typical fine rushes were observed to flow across the width of the production drift up to the opposite sidewall. From May 2006 to 2020, more than 300 fine rushes occurred in Palabora, and those drawpoints classified as having a high risk of this type of event have subsequently been sealed off [1,2].
Other operations have also experienced fine rushes. For example, the mine site at Ridgeway Deeps has experienced these events since September 2014, with analysis showing that the fine material came from the SLC mine above [3]. Also, in Australia, Cadia East PC1 has experienced inrushes since February 2016, mainly at the cave-back boundary projection in the Production Level [4]. On the other hand, Mt. Wright has experienced inrushes since May 2014, which have been ascribed to poor performance of ring charging, the formation and release of boulders, and hang-up release procedures [5].
According to the literature, RS events are mainly related to two different mechanisms: (1) removal of hang-ups and (2) slope failure of the fine material at drawpoint [2,4,5,6]. Removal of hang-up activity generates free space through which large masses of fine material can fall and flow, and this has occurred in Ridgeway Deeps, Palabora, Mt. Wright, and Cadia East PC1. On the other hand, a slope failure mechanism can occur during load haul dump (LHD) loading, when fine material located over the drawpoint is destabilized and flows out. This kind of event has been observed at Mt. Wright and Cadia East PC1, and recently, minor runoff of fines has also been observed in the Chuquicamata underground mine. Both mechanisms require a previous accumulation of fine material in the drawbell, while the presence of coarse fragments can also contribute to the occurrence of RS in either mechanism.
The presence of fine material is critical in caving mines with inrush risk potential. Fine materials can appear due to the mining process, or they can originate from previous adjacent mine sectors [7]. Four sources of fine material have been identified in RS events: secondary fragmentation, fine material migration, fine material from open pits, and fine material from previous mine sectors. These sources can be independent or occur in combination to influence the quantity of fine material found in underground mines.
Secondary fragmentation is the last fragmentation stage that ore undergoes in the broken column before being extracted from the drawpoints. Here, the rock is mainly fragmented by compression and abrasion [8,9,10]. Additionally, some authors [10,11,12] include fragmentation by impact, when a rock block falls from the cave-back. Several models have been used to estimate these fragmentations in block caving mines [9,12,13,14,15]; however, none has been specifically calibrated to estimate fine fragments.
The main mechanism of fine material generation during secondary fragmentation is by abrasion generated by shear strain during gravity flow [13,16,17]. The problem is that shear strain and overload are difficult to estimate. Moreover, both variables are influenced by ore extraction. The shear strain can be determined based on the shear band during ore flow [12,13]. This approach has been used in a secondary fragmentation model [18] based on fragmentation studies involving shear [19,20]. This approach has improved the accuracy of fine material fragmentation models. However, fine material can also be observed under uniform draw due to large travel distances [21,22], which the previous models have failed to consider.
Fines migration occurs when fine materials flow more rapidly than coarse materials inside the broken column and eventually arrive at the drawpoint [7,23]. In block caving, this process has been studied mainly through physical modeling [1,24,25] and also through numerical modeling [26,27,28]. In cave mining, fine migration is mainly governed by the ratio between coarse and fine fragment size, the particle size distribution of ore, rock density, and draw strategies. Authors [12,13] suggest that fine migration also occurs around the ellipsoid of movement induced by shearing. Fine material migration can accumulate fine material in drawbells, increasing the risk of RS events.
Additionally, cave mining methods are sometimes developed after open-pit mining has ceased [29,30]. Due to the caving process, material from the pit slope can fail and become part of the caving-induced subsidence. Material incorporated from the pit is softer and more fractured than the in situ mineralized rock. In many cases, that softer, finer material is more susceptible to secondary fragmentation mechanisms. For example, Palabora Block Cave Lift 1 identified their RS events as being related to fine material from the pit slopes [1]. Abandoned cave mines are also sources of fine material for future deeper projects. For instance, Ridgeway Deeps’ Block Cave suffered RS events related to fine material from the abandoned Ridgeway Gold Sublevel Cave from 2014 to 2016 [3].
The slope failure mechanics observed during the inrush of fine material may have certain similarities with rockslides that are well documented in the literature. At a large scale, rock avalanches can be found involving dry flows of fine granular material [31]. Rock avalanches are a type of landslide (large scale) in which a slope failure is produced [32]. This type of rock flow is affected by lithology [33,34], but its distance is commonly correlated with its debris mass [35]. Rockslides can occur in unconfined or confined conditions [32]. Additionally, particle sizes and shearing are key features in rockslides [31,36], along with a low friction coefficient [35]. Low mixing is commonly observed in landslides associated with laminar flow during slides. Commonly, in rock avalanches two motion mechanisms can be appreciated: sliding at the beginning, and then material flow [37]. Acoustic fluidization is one of the triggering mechanisms associated with the pseudo-viscous flow of dry rock debris moving long distances horizontally. In [38], a nonlinear model is proposed that considers the evolutionary characteristics of the slope failure. Large rock blocks can be also be associated with rockslides [33], similar to that observed in the inrush of fine reported in [3].
Studies focusing on understanding the key variables and mechanics in RS events are scarce, and although mine studies provide valuable information, the variables and mechanisms involved cannot be controlled for deeper analysis. This study focuses on the RS mechanism as it relates to hang-up removal, applying numerical modeling to analyze these events. The numerical model was calibrated based on available mine data, providing an opportunity to combine an in situ mine study with modeling to delve further into RS event occurrence and its mechanisms.
2. Methods
2.1. Granular Material
The definition of fine material in mining depends primarily on the operation or sector and the mine problem or phenomena being studied. For example, at Diablo Regimiento sector in El Teniente, fine materials are considered to be 7 cm in diameter or smaller [39], and mainly related to mud rush events. At Palabora Block Cave Lift 1, fine materials are considered to be 1 cm in diameter or smaller [2], and also related to mud rush problems. Some risk assessment studies have considered fine materials to be 25–30 cm in diameter or smaller [40]. Additionally, gravitational flow studies of dilution by fine migration have been used to define fine material size criteria [24,39,41,42]. Table 1 presents examples of fine material definitions in the cave mining industry and related studies.

Table 1.
Fine material in cave mining.
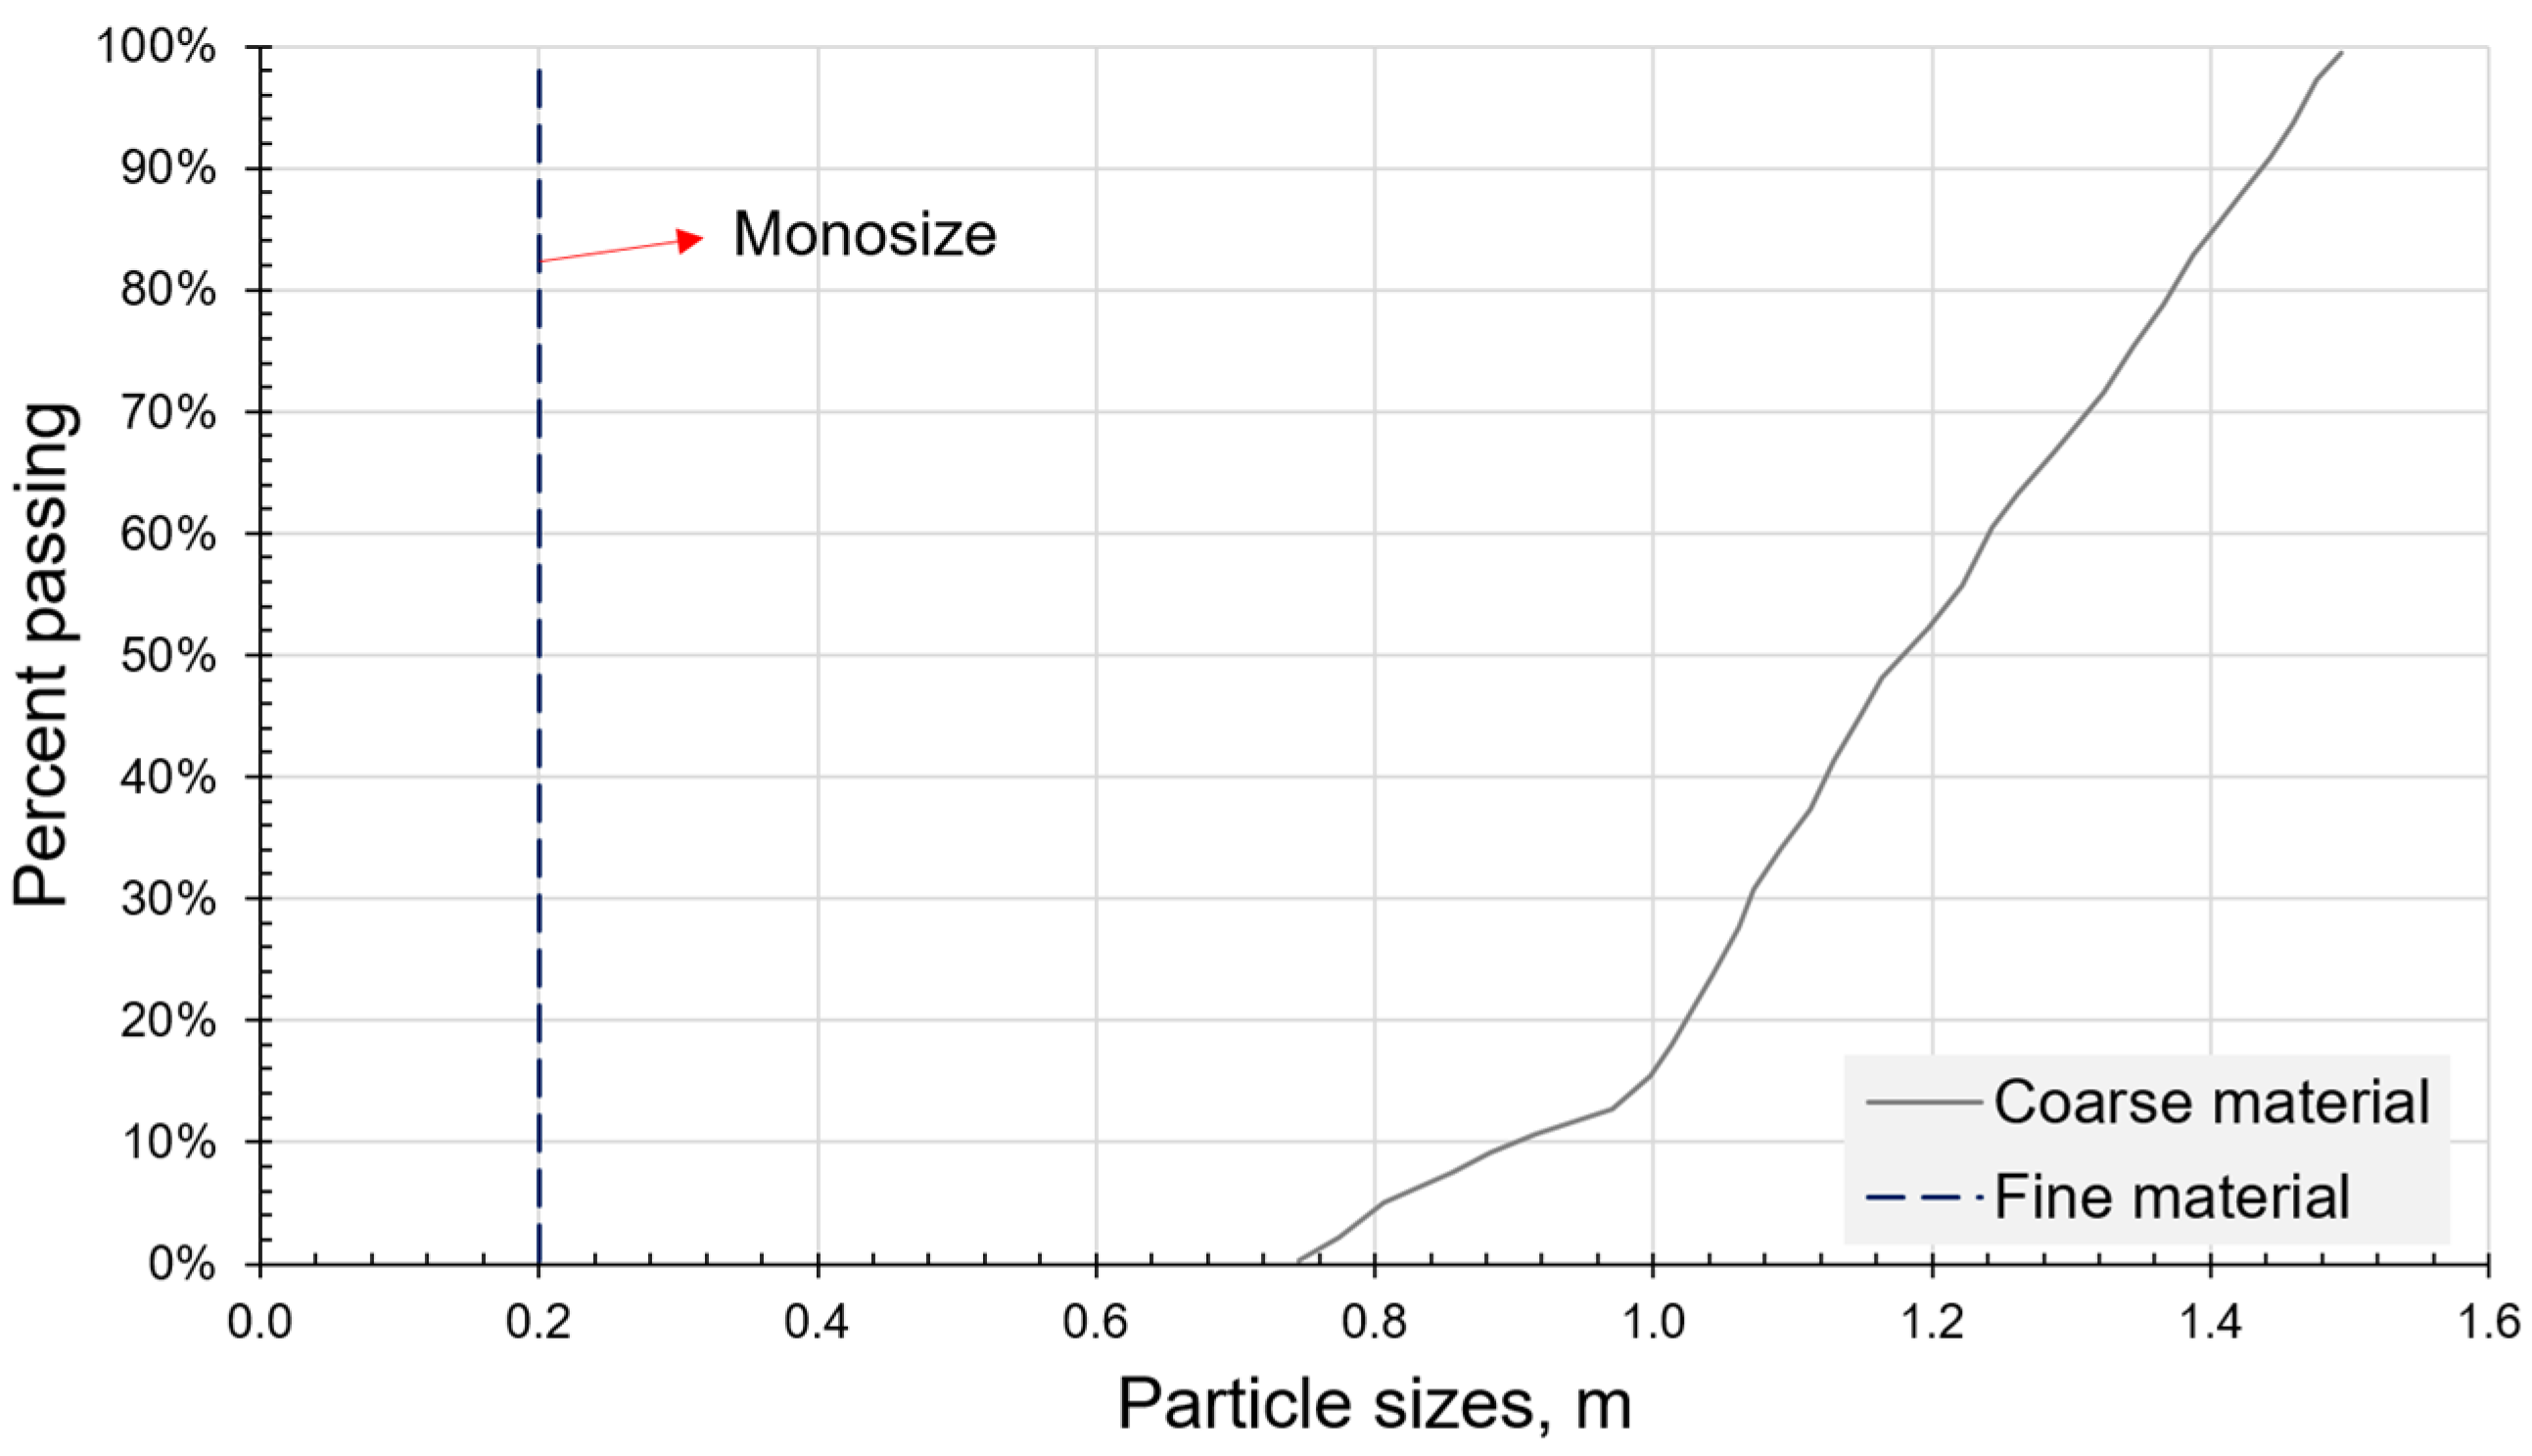
As illustrated in Table 1, different fragment sizes are defined as fine material across cave mining environments. Given this variation, the size was chosen from within this range: For the numerical model, the fine material was set to 0.2 [m] in diameter and the coarse material was set to 0.75–1.5 [m] in diameter (mean size, d50 = 1.18 m). Both fragment size distributions can be observed in Figure 1.
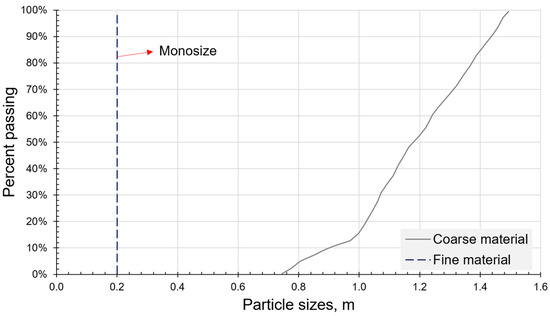
Figure 1.
Fragment size distribution of the Numerical model material.
The fine material (0.2 m) was selected as a mono-size mainly to achieve numerical stability and to reduce simulation times. Size distribution has been shown to influence the macro-mechanical properties of particulate material [44,45,46,47]; however, because this study focused on geometric parameters, only one material size was used, and this was calibrated with the case study. However, to evaluate the effect of the mechanical properties of the material, a friction sensitivity analysis was also performed to analyze its effect in this study.
2.2. Base Event
A large RS event at Ridgeway Deeps registered in September 2015 [3] was used for numerical model calibration. This event was identified as being caused by the outflow of dry fine material during removal of a hang-up (coarse arch). The event had a magnitude of 260 [t] of fine material flow through a drawpoint, and large rocks of 0.5–1.5 [m] diameter were dragged by the fines. The geometrical characteristics of this event are summarized in Table 2 and presented in Figure 2.
Table 2.
Some base event characteristic used in calibration.
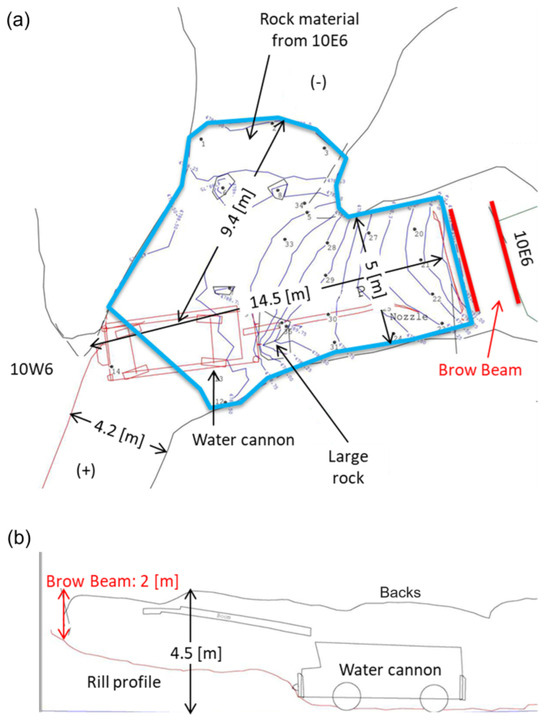
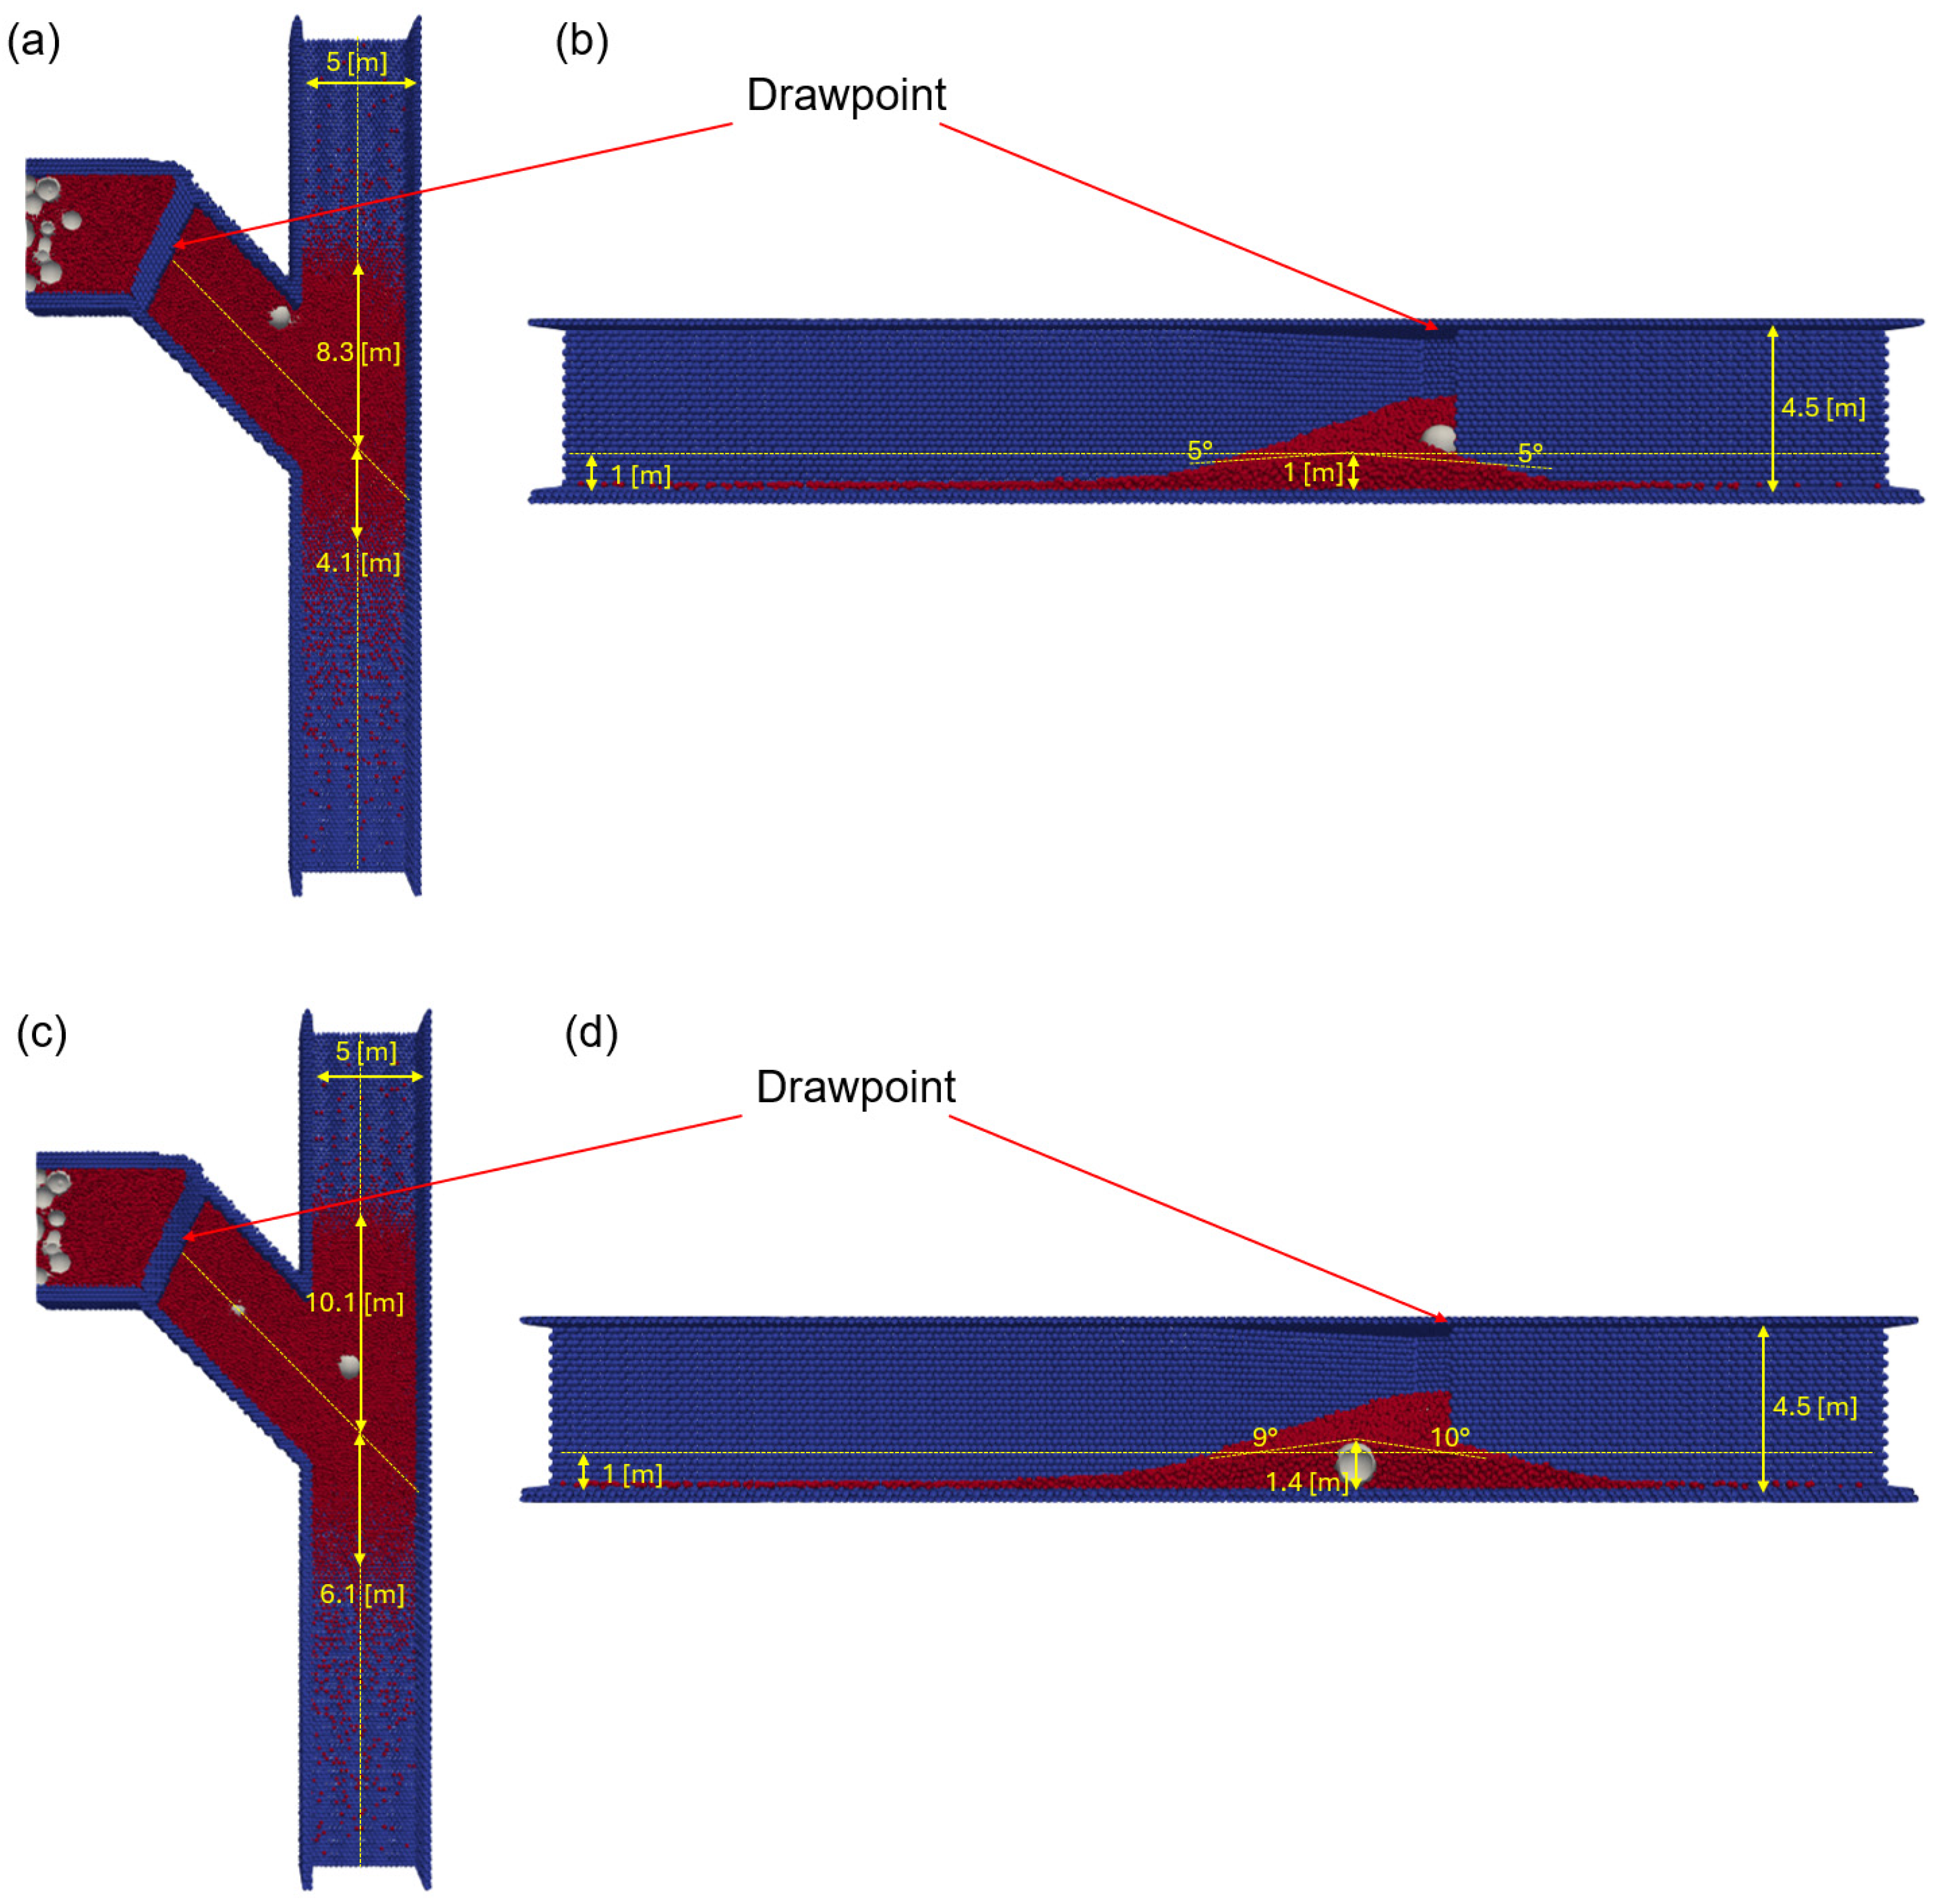
Figure 2.
Geometric characteristics of the drawpoint and the event studied. (a) Plan view of the deposition profile (b) Lateral view of the deposition profile (after [3]).
The flow was also described in terms of the distance reached and deposition angle in the production drift. Both of these were measured in the two senses of the production drift: towards the north, opposite to the direction of the extraction drift; and towards the south, in the same direction as the extraction drift (Figure 2). In Figure 2, the blue contour represents the fine material extension. The brow beam—in red—is located at the drawpoint where the RS event took place as the result of a hang-up removal. The hang-up was removed using a water cannon.
The run-out distance towards the south was not able to be determined because of the presence of the water cannon. Accordingly, the run-out distance towards the north was used in the calibration stage.
2.3. Drawbell and Pillar Geometries
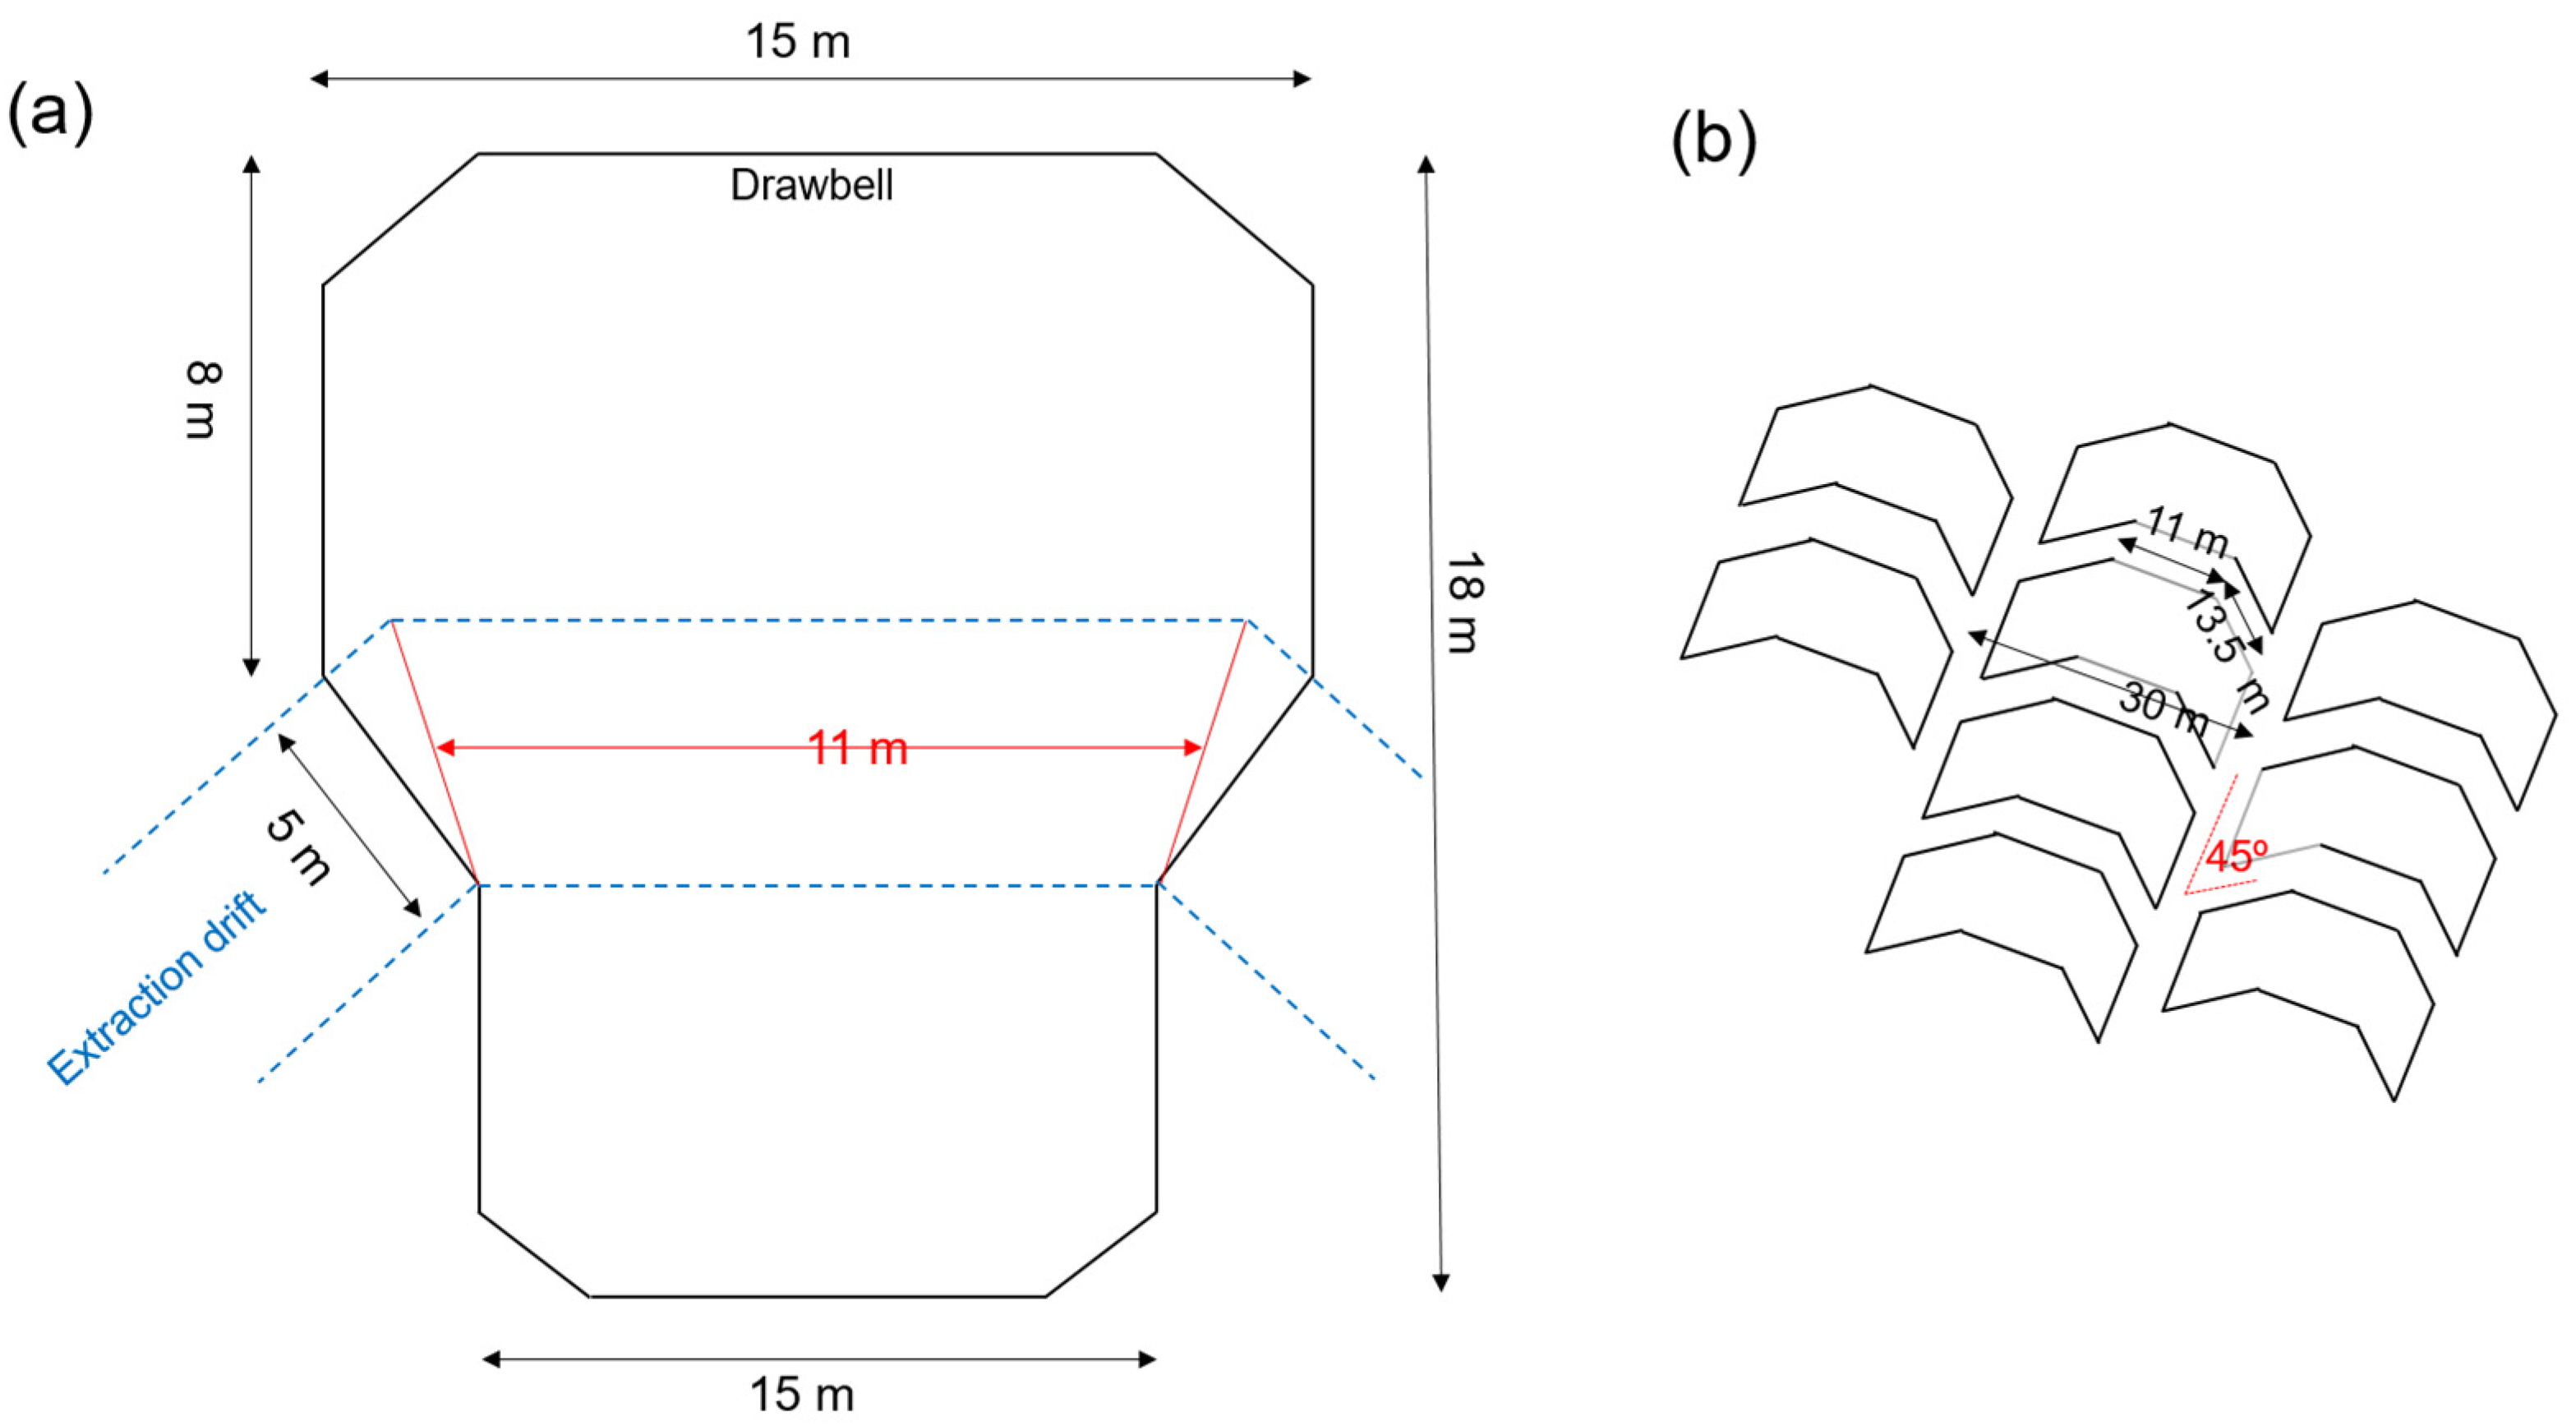
The production level of Ridgeway Deeps Block Cave is an offset herringbone layout, with 30 m between production drifts and 18 m between extraction drifts. Production and extraction drifts form 45-degree corners. The distance from one drawpoint to the next in the same drawbell is 11 m, and the drawbell height is 14 m from the drawpoint roof. Figure 3 presents detailed geometric characteristics of the drawbell and the pillar, respectively.
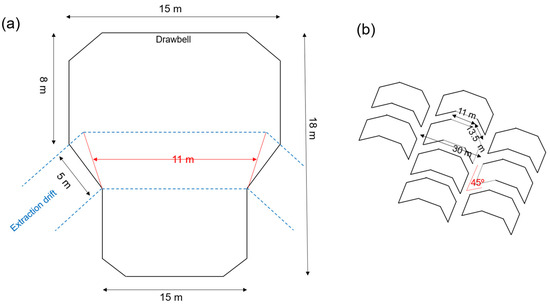
Figure 3.
(a) Plan view of drawbell geometry, with red lines representing both drawpoints (b) Plan view of the pillar geometry and extraction level layout.
2.4. Numerical Model
The discrete element method (DEM) [48] is a numerical tool widely used for solving problems involving the flow of granular assemblies, represented as individual elements or particles. These particles interact with one another and other objects via contact force laws [48,49]. The basis of the DEM software is particle–pairs contact. When contact occurs, particles experience elastic repulsion and frictional forces, which are transformed into translational and rotational moments. Through the application of Newton’s Second Law, the particle’s linear and angular accelerations are obtained. Then, through time integration of the acceleration, the particle’s new velocity and new position are derived. These mathematical steps are known as Δt, with the following held to be true: The smaller the value of Δt, the greater the accuracy of the solution, and the longer the required computation time will be [49].
For this study, free-access ESyS-Particle software (version 2.3.5) was employed to implement DEM written in C++ with a Python API [50]. Using this program, it is possible to create bonded and non-bonded granular assemblies of spheres, assign contact coefficients such as friction and repulsion, model rotational and translational particles, and incorporate rigid structures into the simulations.
The setup of the numerical model (Figure 4) considers two drawpoints, one drawbell, two production drifts, two extraction drifts, two brow beams, coarse particles, fine particles, a hang-up at one of the two drawpoints composed of large particles (white), and a mass of fines (red) over the hang-up. The walls of the mine geometries are modeled with particles (blue) to assign mechanical properties to them.
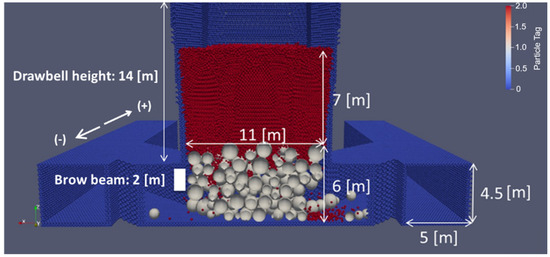
Figure 4.
Initial setup of the numerical model developed in ESyS Particle. The red material is composed of fine particles. The white material is composed of coarse particles.
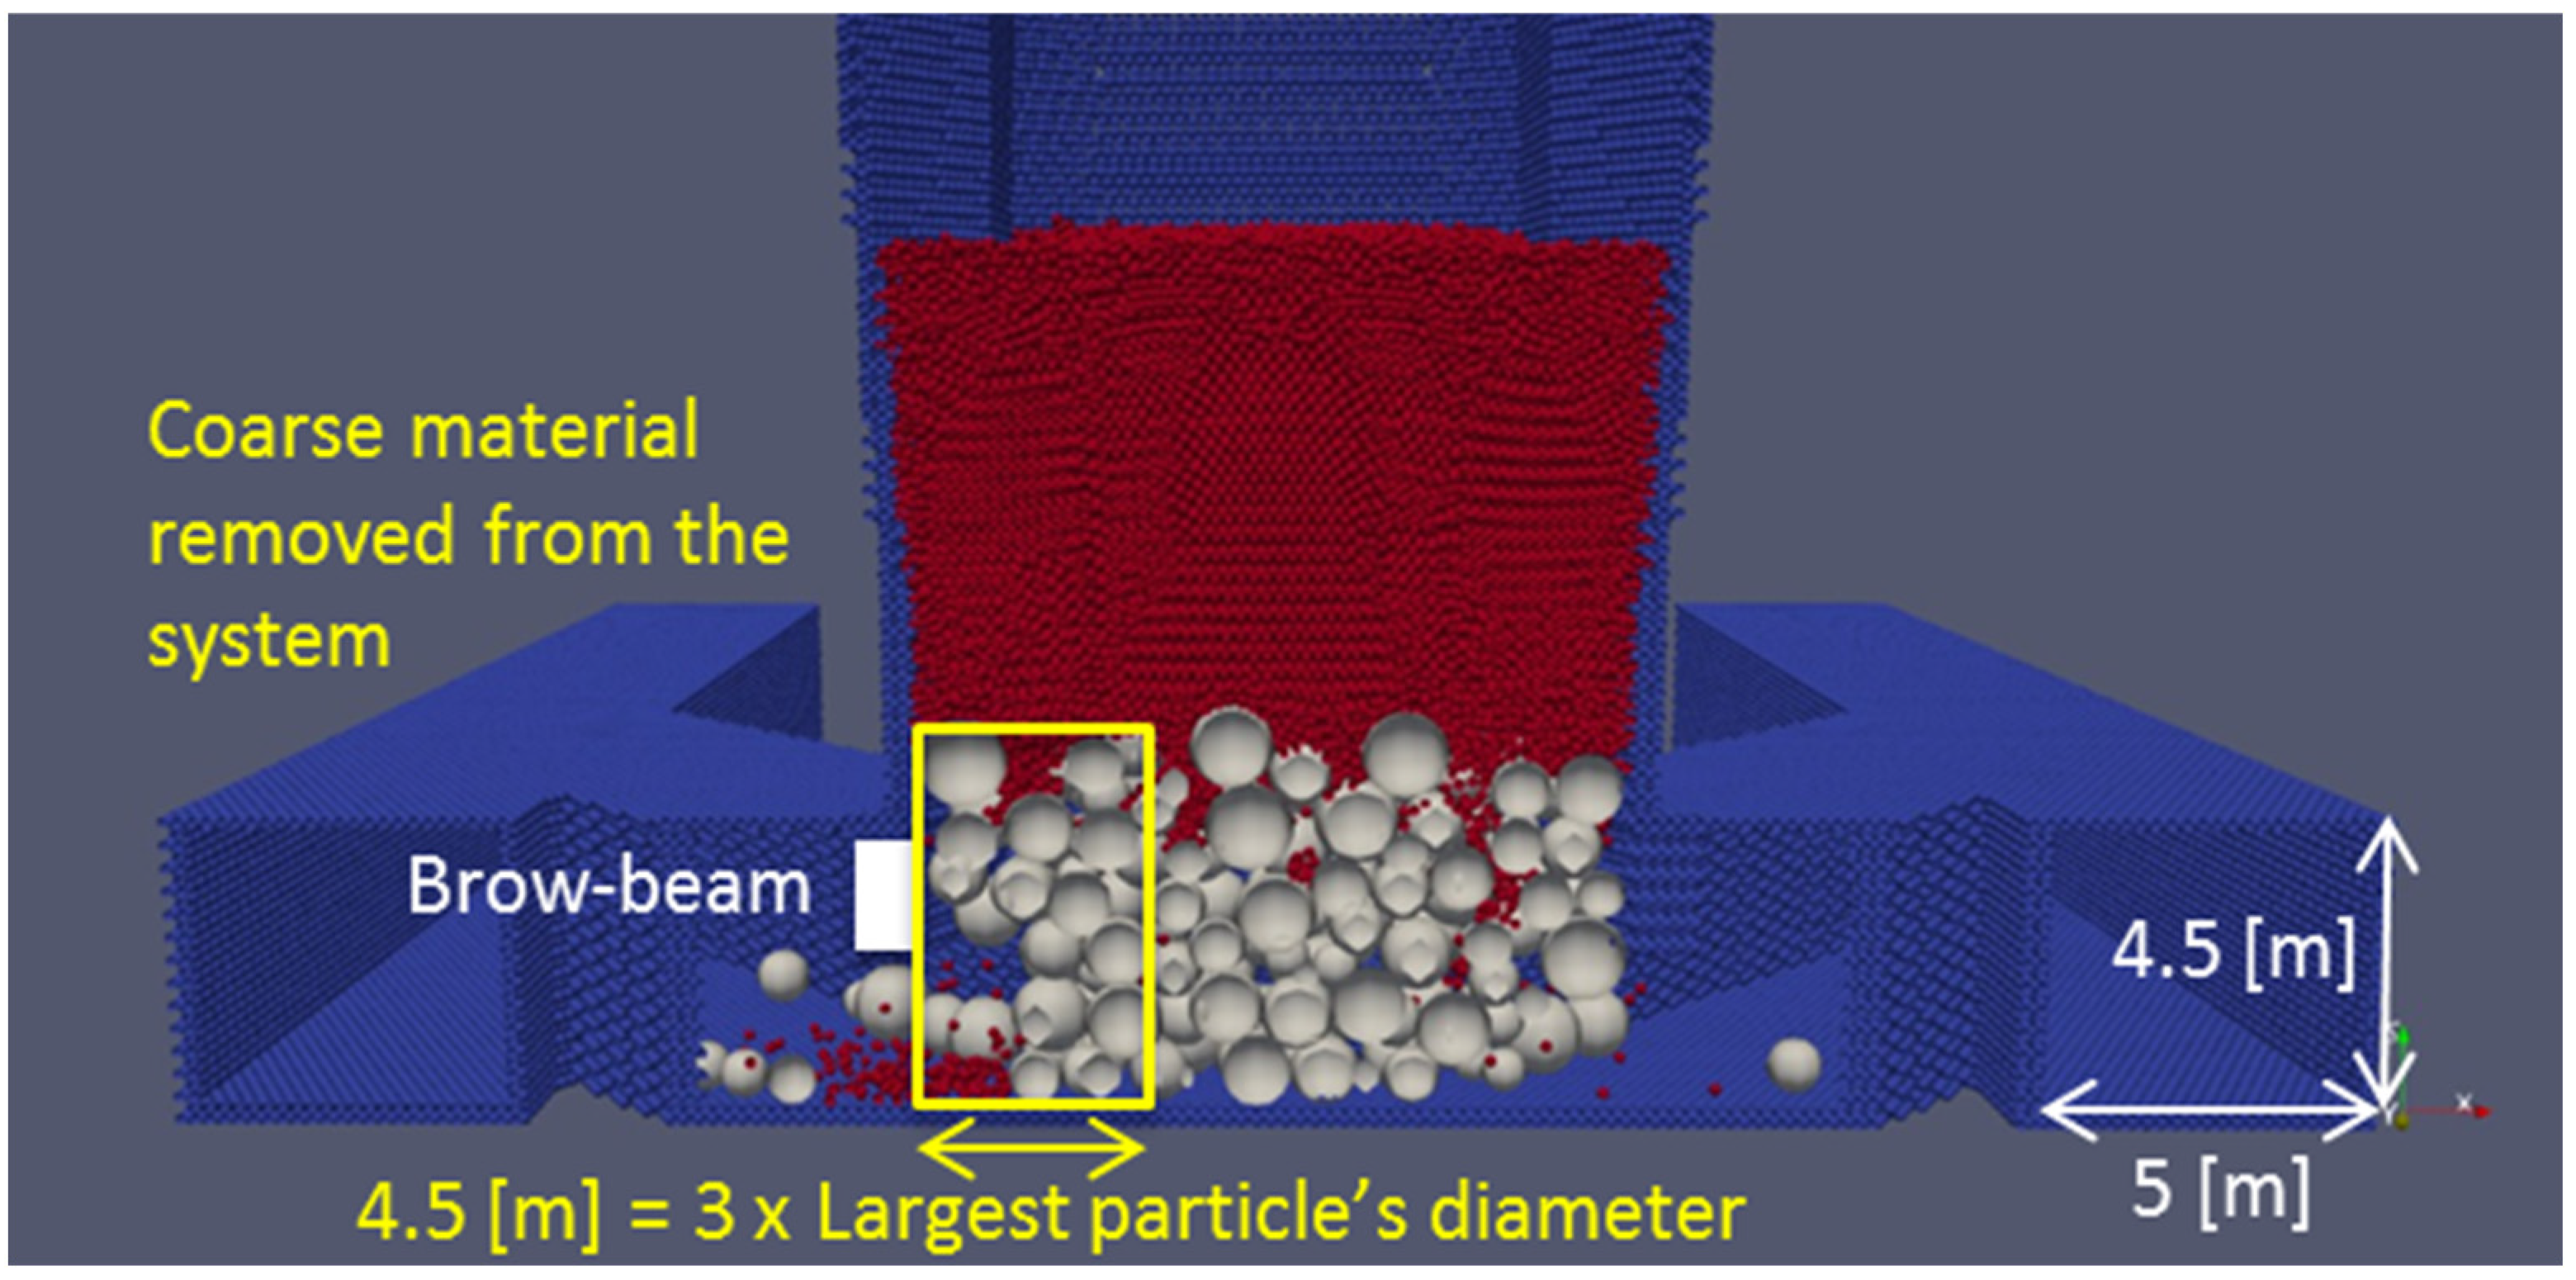
The hang-up was located at the drawpoint brow beam, and the experiments were focused on the behavior of the material flowing out from the drawpoint after part of the hang-up was removed. The coarse material was initially placed to create the hang-up, and then, the fine material was added. The hang-up volume removed was 4.5 m deep into the drawpoint (see yellow rectangle in Figure 5), a horizontal distance equivalent to 3 times the largest fragment size.
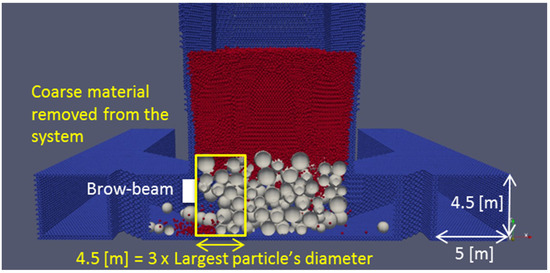
Figure 5.
Volume of large particles removed to trigger the inrush event.
The RS magnitude was quantified by measuring 7 parameters described below (output variables):
- Tonnage of the event, including fine and coarse fragments (t)
- Run-out distance towards the north and the south, measured from the intersection of the extraction drift axis and production drift axis (m)
- Presence of large particles (>0.75 m diameter) in the production drift
- Height of the material in the production drift (m)
- Deposition angle towards the north and the south. This indicator was measured 1 m from the floor of the production drift (°).
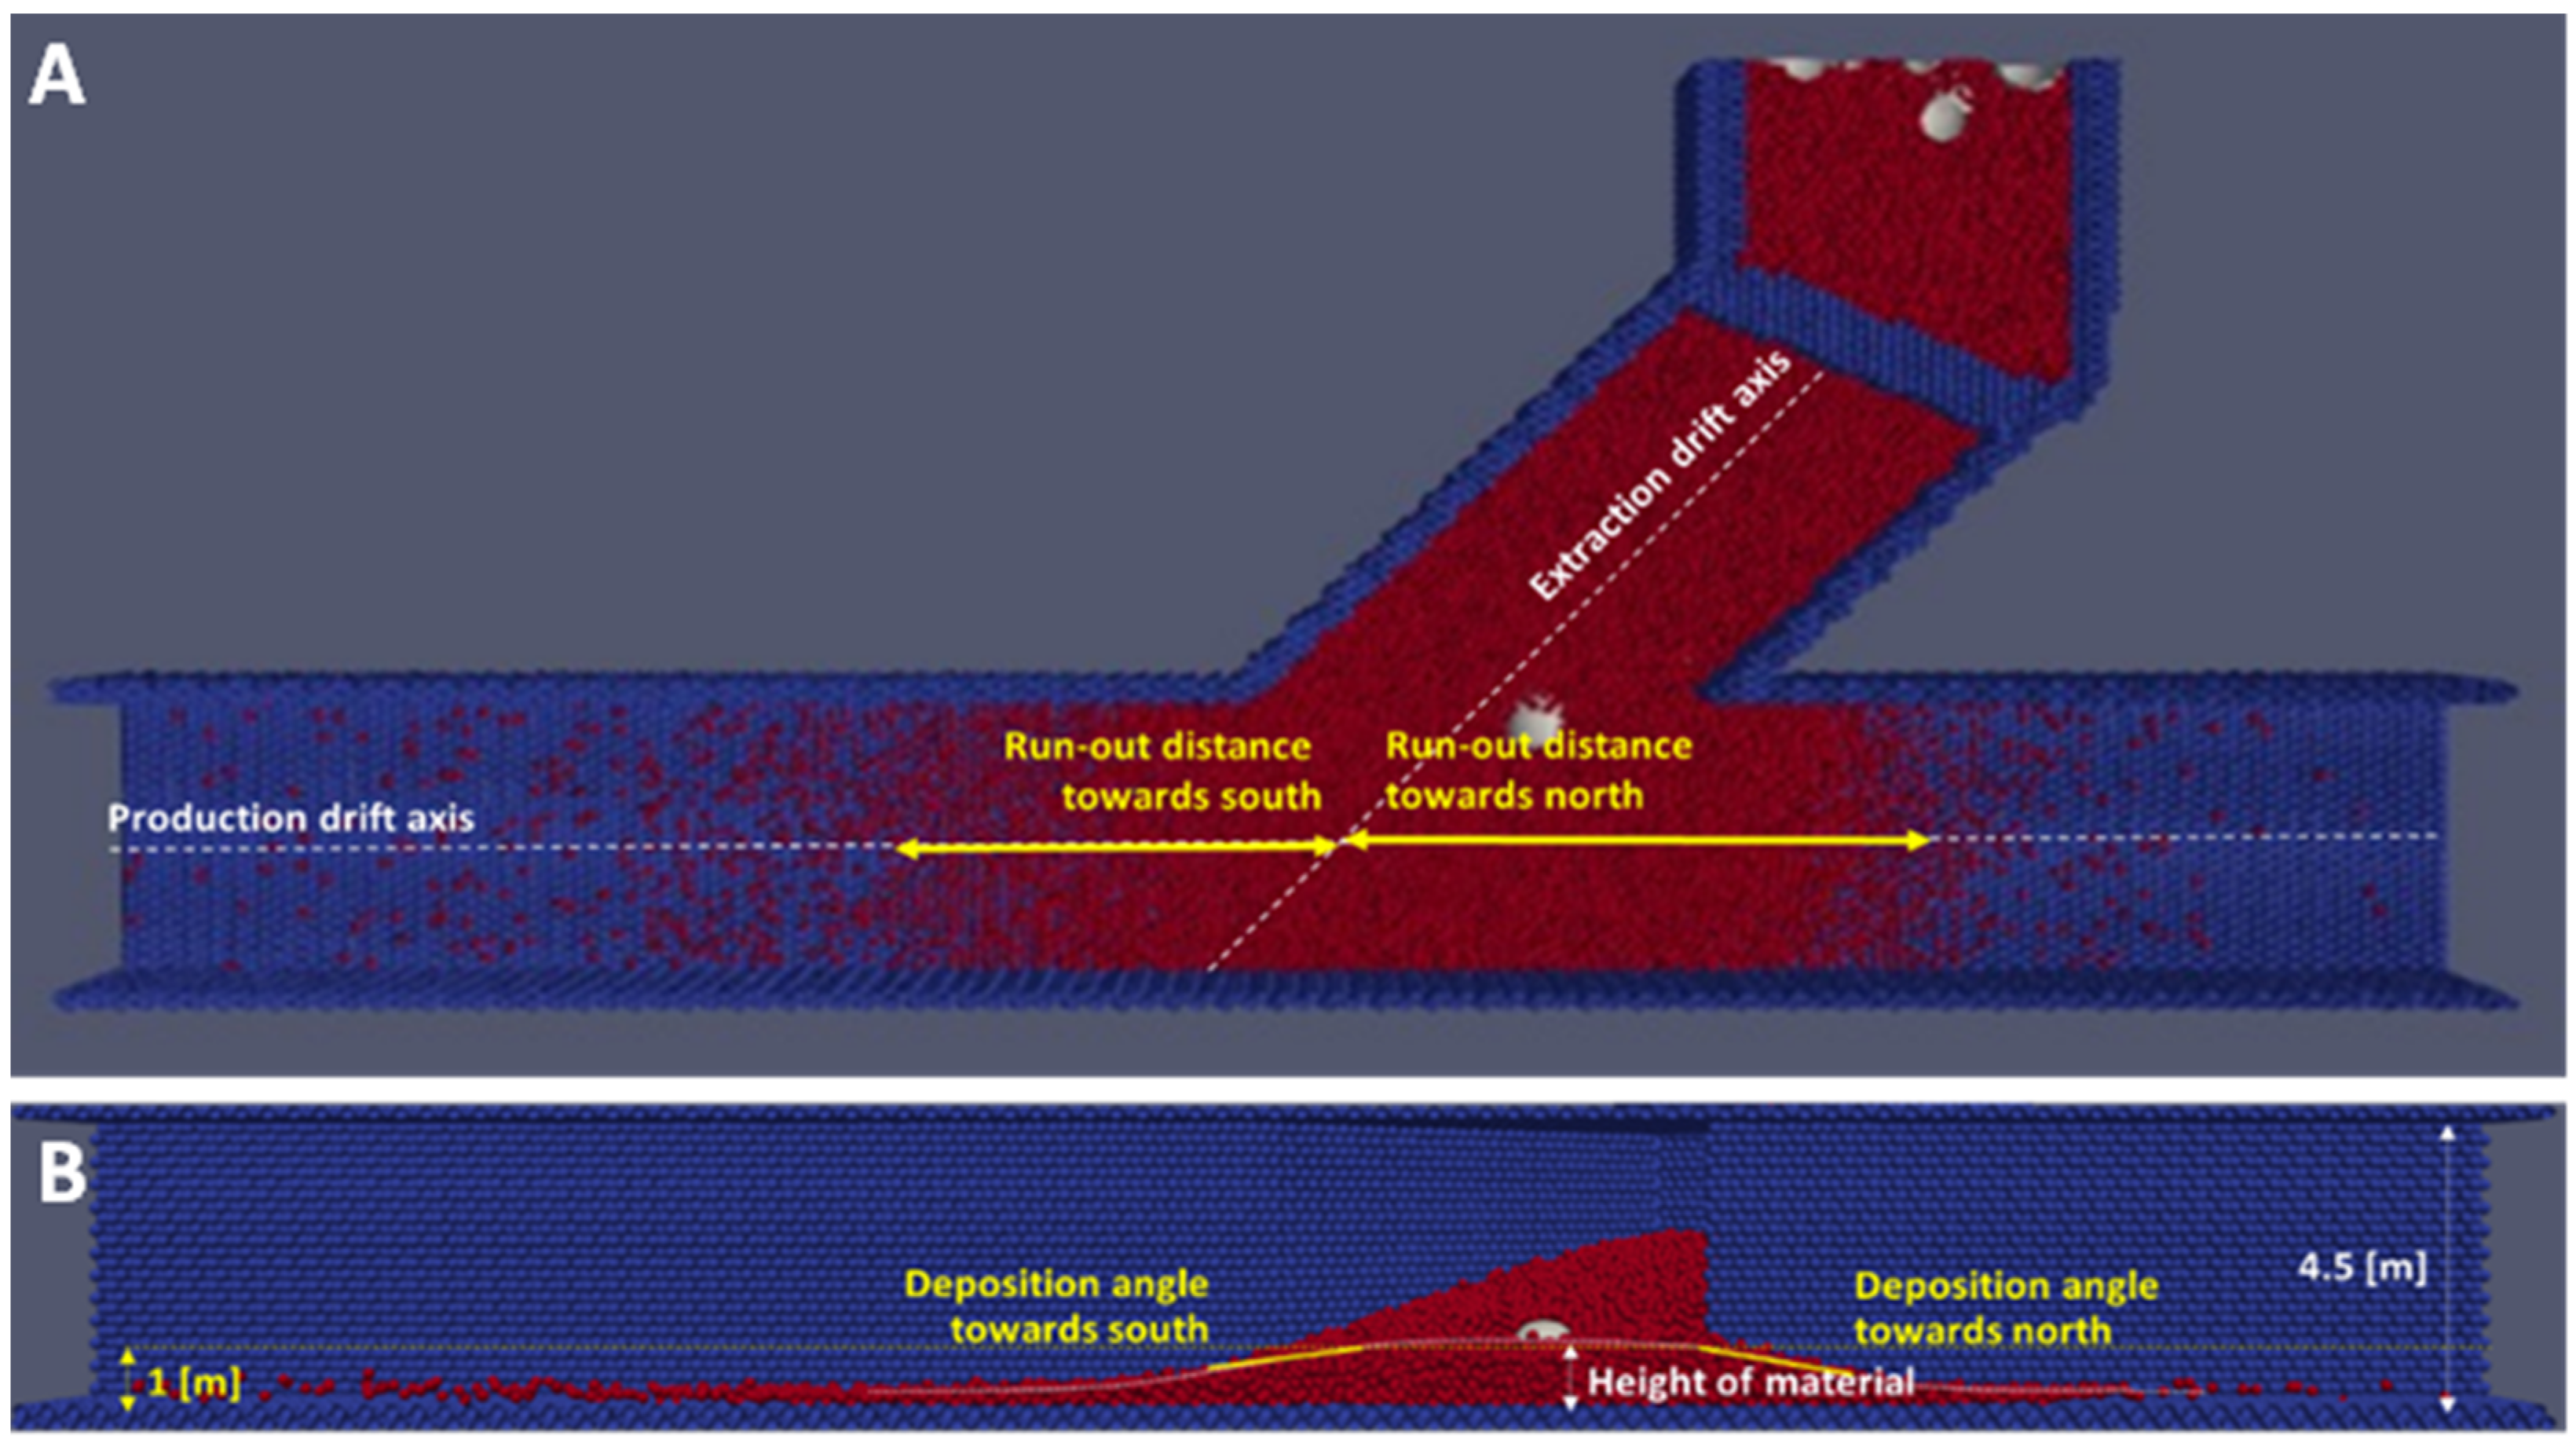
The measurement procedures for the run-out distance, height of material, and deposition angle are illustrated graphically in Figure 6.

Figure 6.
(A) Plan view of the measurement of run-out distance. (B) Profile view of the measurement of the height of flow and deposition angles.
The variables analyzed in this study were the following (control variables):
- The quantity of fine material over the hang-up. This variable was studied through its height, analyzing columns of 7 m, 15 m, and 30 m
- The effective height of the drawpoint. The effective drawpoint height is the nominal height of the drawpoint (4.5 m in this study) minus the brow-beam height. Brow beams are structures placed at the drawpoint brow to control RS or mud rush events
- The effective drawpoint width, which was measured wall-to-wall (3 and 5 m).
3. Numerical Calibration
The numerical model was calibrated according to the base event described in Section 2.2. Particle density was set to 2.7 t/m3 and the Poisson ratio was set to 0.3. Drawpoint geometry and quantity/height of the fine material over the hang-up were set to the following values:
- Drawpoint width: 5 m;
- Nominal drawpoint height: 4.5 m;
- Brow beam: 2 m (effective drawpoint height: 2.5 m).
The numerical and material parameters adjusted in the calibration phase were the elastic repulsion module, damping, and the static and dynamic coefficients of friction. Additionally, the height of fine material over the hang-up was calibrated. Regarding this last parameter, although the amount of fine material that came out of the drawpoint is known, the amount of initial fine material that was over the hang-up is unknown (part of this fine material may have remained in the drawbell).
Table 3 presents the results for the best adjustment achieved. The results of the calibration phase achieved a 1% deviation in terms of the tonnage and a 1° deviation in terms of the deposition angle. As in the base event for calibration, fine material fell, flowed, and dragged large particles up to the extraction drift bullnose, as can be seen in Figure 7.
Table 3.
Parameter results obtained during the calibration.
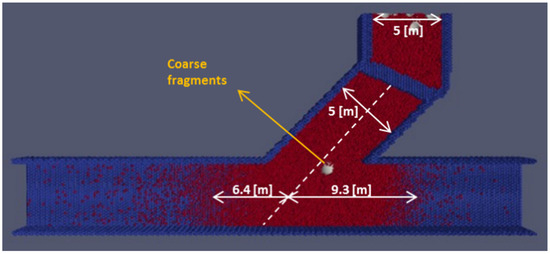
Figure 7.
Plan view of the event modeled during calibration phase.
Additionally, Table 4 compares results obtained with the calibrated numerical model and the base event used in this study. Figure 7 and Table 4 demonstrate that coarse particles under the initial fine material were also dragged in the numerical simulation. The tonnage, run-out distance and deposition angle obtained in the numerical model are similar to the base event. The run-out distance to the south and the deposition angle were not reported in the base event because the water cannon interrupted the material flow.
Table 4.
Results of main output variables calibrated with base event.
4. Results
This study focused on the relation between the drawpoint geometry and the quantity of fines over the hang-up with the magnitude of the RS event.
4.1. Drawpoint Geometry
Drawpoint height and drawpoint width were studied to analyze the magnitude of potential RS events. The quantity/height of fine material over the hang-up was adjusted at the calibration phase (7 m).
4.1.1. Drawpoint Height
Drawpoint height was analyzed in terms of the brow-beam height while the drawpoint width was fixed at 5 m and the amount of fine material over the hang-up was defined at a height of 7 m. Brow beams of 1 m, 2 m, and 3 m high were simulated. A brow beam of 2 m was the base case equivalent to the setup in the calibration phase. Table 5 presents the magnitude of the RS events simulated.
Table 5.
RS magnitude for different brow beam (BB) heights.
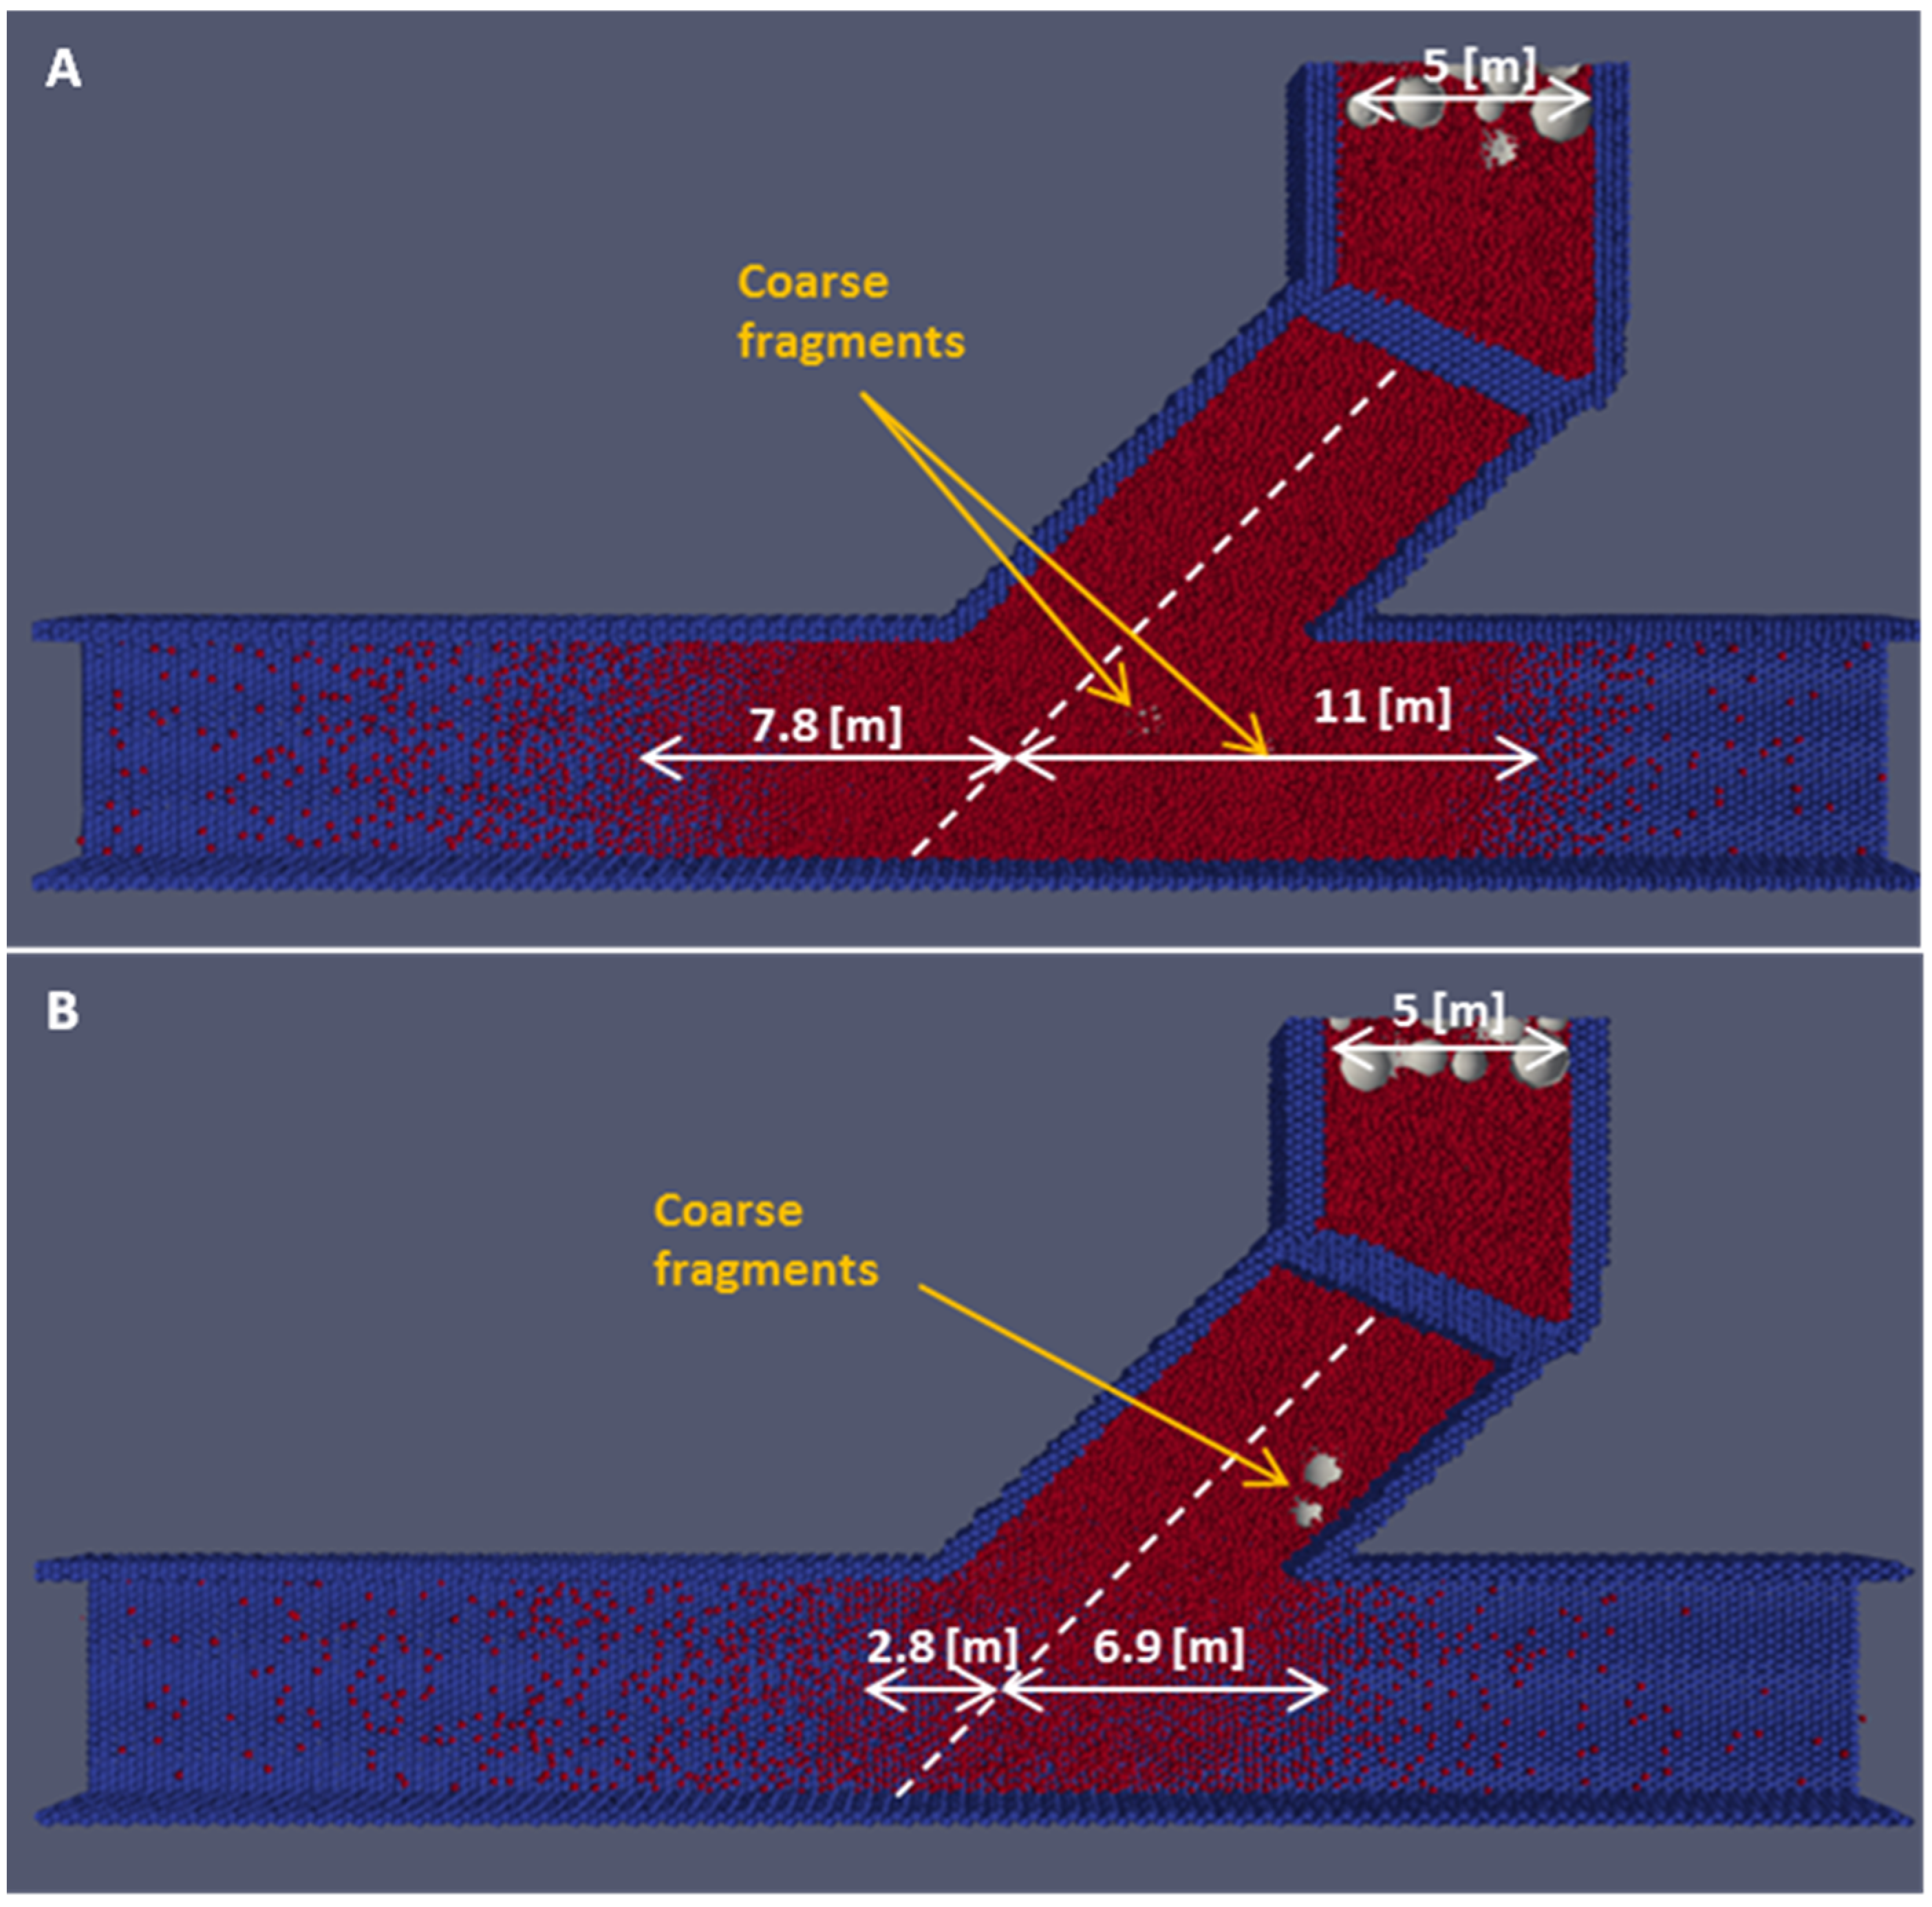
Results showed a clear relation between the BB height and the RS magnitude. A brow beam of 1 m in height implied an RS event of 374 t, 46% larger than the event associated with the brow beam of 2 m in height. On the other hand, the 3 m high brow beam implied an RS event of 125 t, 51% smaller than the base case. In addition, in the event associated with the 1 m high brow beam, large particles were dragged to the production drift axis. On the contrary, the event associated with the brow beam of 3 m in height did not drag large particles through the extraction drift. Plan views of the material deposited are presented in Figure 8.

Figure 8.
Plan views of the event modeled. (A) 1 m brow beam. (B) 3 m brow beam. Coarse fragments for the event associated with the brow beam of 1 m were of minor size.
4.1.2. Drawpoint Width
Two drawpoint widths were modeled. A small drawpoint width of 3 m was evaluated and compared with the large drawpoint width of 5 m used in Section 4.1.1. The effective drawpoint height was fixed at 2.5 m, the brow beam was fixed at 2 m, and the mass of fine material over the hang-ups at a height of 7 m.
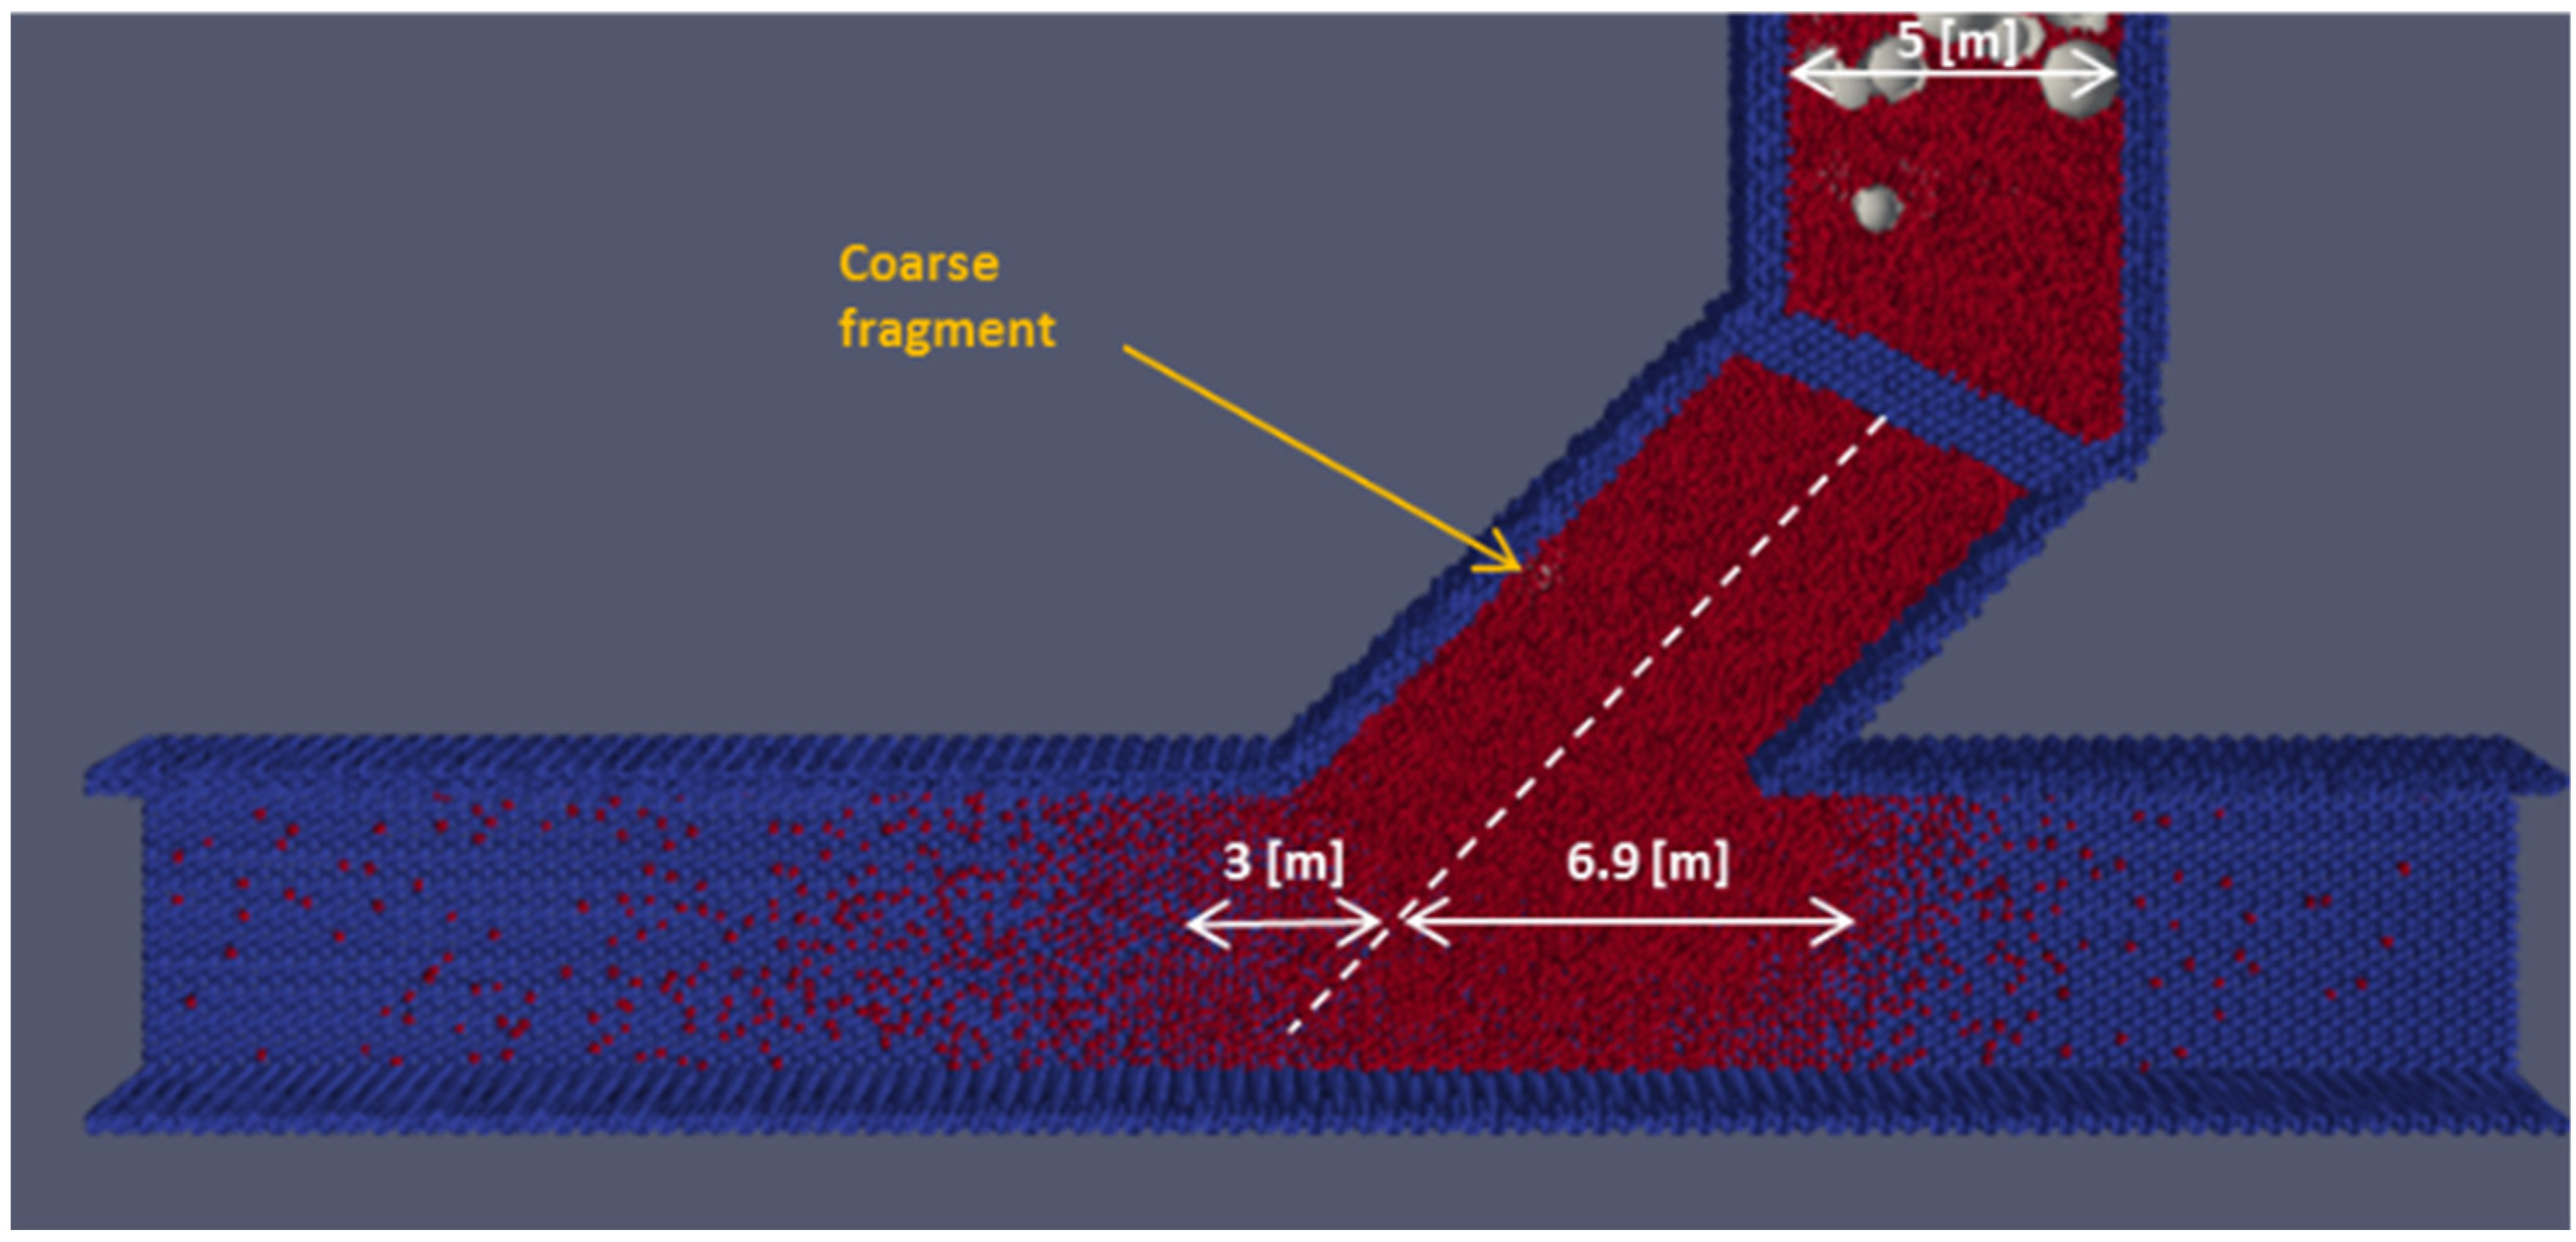
Table 6 presents the magnitude of the RS events modeled. According to the results, the new event modeled (DP of 3 m) achieved a magnitude of 193 t, 25% smaller than the base event. Also, large rocks were dragged by the fines, but they did not arrive at the production drift, as can be observed in Figure 9.
Table 6.
RS magnitude for different drawpoint widths.
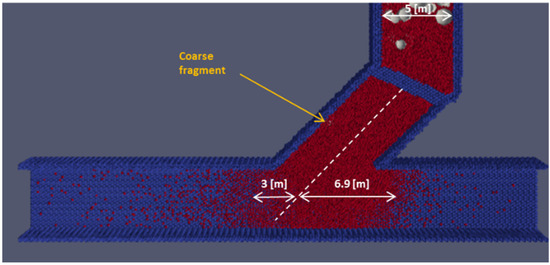
Figure 9.
Plan view of the event modeled, with a drawpoint of 3 m in width. Coarse fragments that were dragged were covered by the fine material.
4.2. Available Fine-Grained Material
The number of fines over the hang-up was analyzed by height: columns of fines of 6 m, 15 m, and 30 m in height were studied and compared with the 7 m high columns used in previous sections. Brow beam heights of 1 m, 2 m, and 3 m and drawpoint widths of 5 m and 3 m were considered.
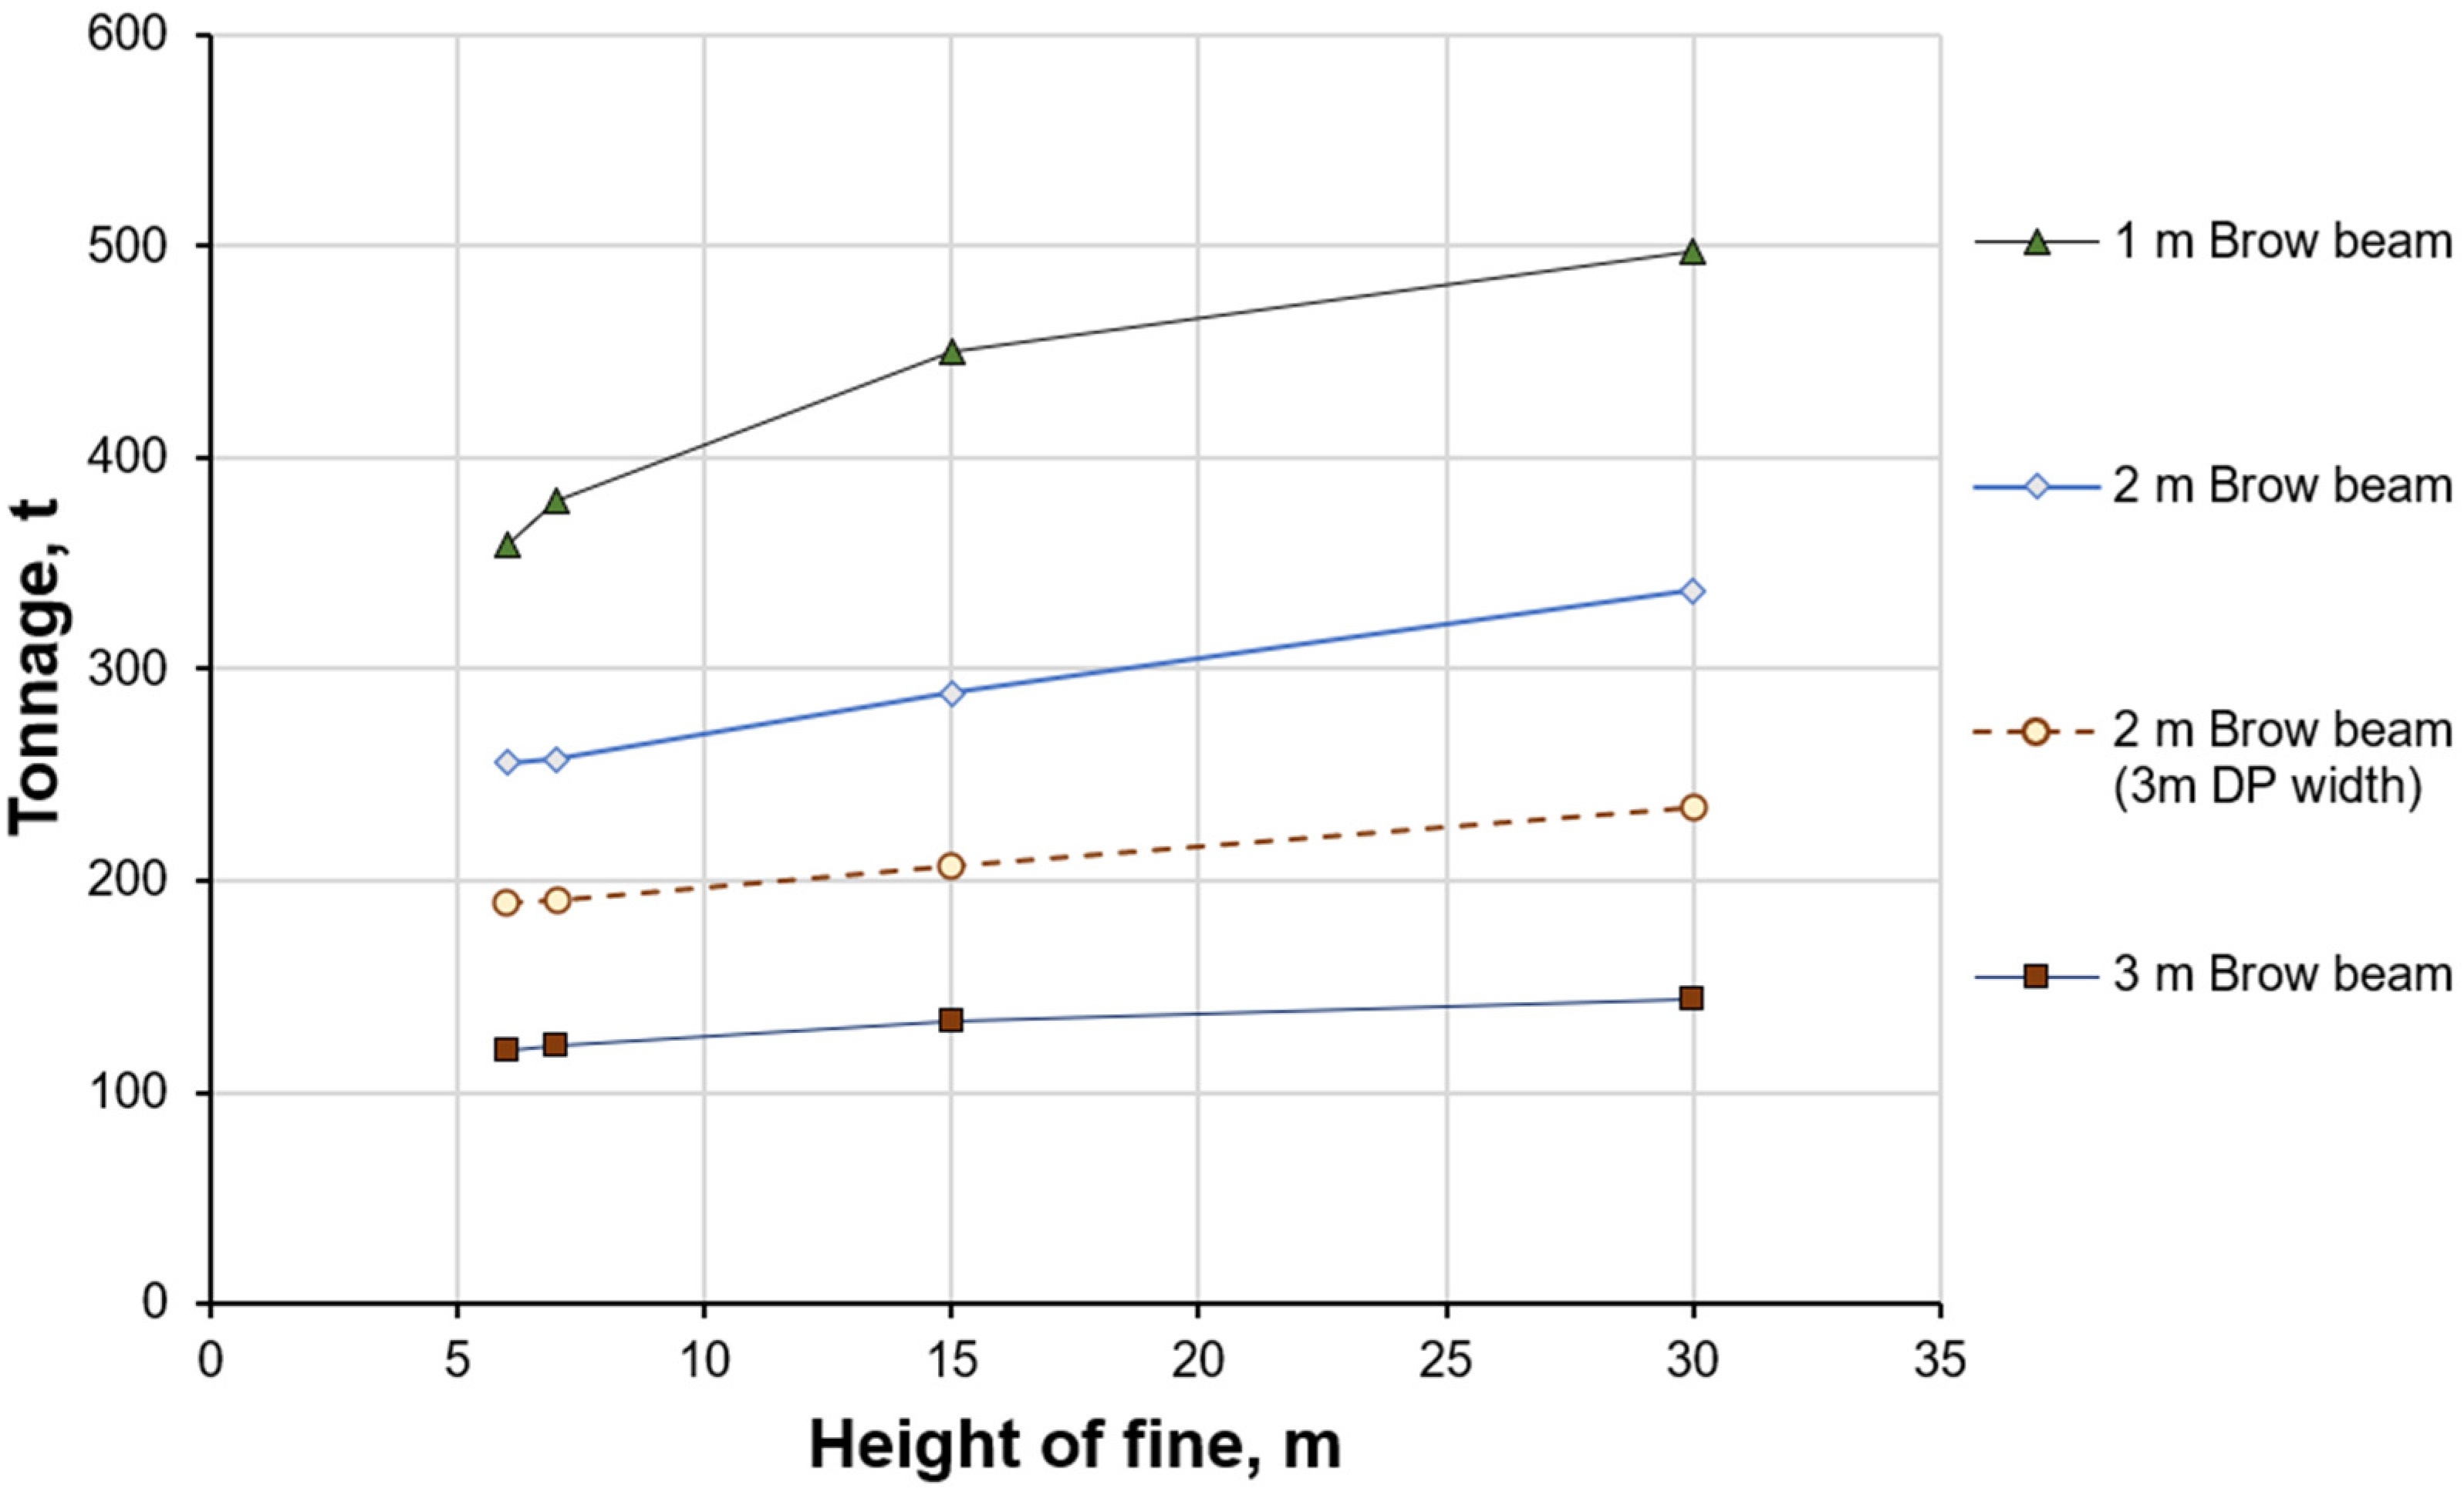
Table 7 presents the RS magnitude for events associated with columns of fines that were 6 m high, 15 m high, and 30 m high, respectively. According to the results, the RS magnitude expressed in tonnage was noticeably influenced by the drawpoint geometry, especially the brow beam height: For a brow beam of 1 m, the RS magnitude was 359–495 t depending on the available quantity of fines over the hang-up; for a brow beam of 2 m, the RS magnitude was 256–334 t; and for a brow beam of 3 m, the RS magnitude was 120–147 t. Thus, the smaller the brow beam, the larger the RS event.
Table 7.
RS magnitude for different heights of fine material tested.
The presence of large rocks in the production drift was observed for the brow beams of 2 m and 1 m, but not for the brow beam of 3 m, independently of the mass of fines over the hang-up. This phenomenon can be explained by the flowability of the fine material for different drawpoint opening widths.
5. Analysis
Figure 10 summarizes the magnitudes of all RS events modeled, including the drawpoint width of 3 m (dashed line). Here, the magnitudes increase according to the amount of fine material over the hang-up; hence, there was a maximum expected RS event for each drawpoint geometry. Considering drawpoints of 5 m in width, the maximum expected RS events would be 500 t, 350 t, and 150 t for brow beams of 1 m, 2 m, and 3 m high, respectively. Also, regarding drawpoints of 3 m in width and a brow beam of 2 m in height (effective drawpoint height of 2.5 m), the maximum expected RS event would be around 250 t.
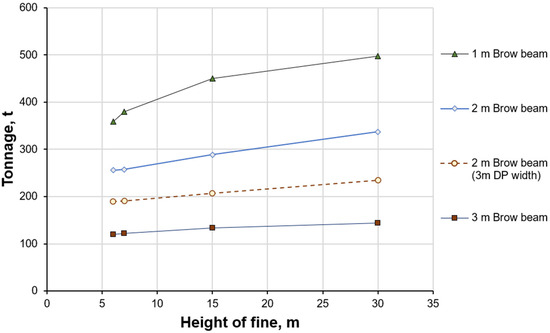
Figure 10.
RS magnitude for different heights of fines over the hang-up and different drawpoint geometries.
On the other hand, the presence of large rocks in the production drift was observed to increase with a smaller brow beam and/or a larger amount of fine material over the hang-up. The observations in this study suggest an opportunity to define operational guidelines for mining sectors that have been classified as at high risk for RS events. The geometric characteristics of the drawpoints allow the maximum expected events to be estimated. Additionally—as a mitigation measure—results suggest the brow beam could be modified as caving progresses and finer fragmentation arrives at drawpoints.
The effect of rock density was quantified, and a sensitivity analysis of the density was performed. The density varied by +/−25% in simulating the case of a 2 m brow beam, 7 m of fine material height, and a drawpoint width of 5 m. The density was evaluated because it is known to influence fine migration [7,19]. Figure 11 shows the simulations for different rock densities. The red particles are the fine material, while the white ones are the coarse material present in the hang-up. For the lowest density (Figure 11a), coarse particles were not dragged to the production drift.
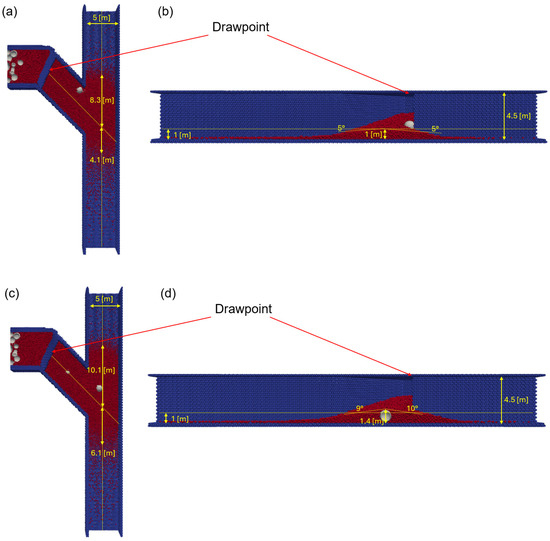
Figure 11.
RS event simulation with different rock densities (a) plan view of RS event for rock density of 2.0 t/m3, (b) profile view of RS event for rock density of 2.0 t/m3, (c) plan view of RS event for rock density of 3.4 t/m3, (d) profile view of RS event for rock density of 3.4 t/m3.
Table 8 shows the effect of particle density on RS events. It can be observed that at the lowest density the tonnage decreases by 28.5%, while at higher densities it increases by as much as 33%. It is possible that a lower density decreases the percolation and potential energy available to generate an RS event. Therefore, density is a variable that can have an important effect when this type of risk exists.
Table 8.
RS results simulating different rock densities.
Being able to model rill swell of fine material events in mining contributes to a better understanding these phenomena. Although there is still much work to be done to achieve a thorough understanding in this area, the variables and results presented here enhance the comprehension of these critical events. However, one of the main variables associated with these phenomena is the uncertainty of the fine material accumulated at the drawpoints. It is advisable to use techniques to quantify this uncertainty [51,52] and thus minimize the risk through better estimates of the fine material generation and gravity flow.
6. Conclusions
This numerical study analyzed the magnitude of RS events associated with a hang-up release mechanism, modeling different drawpoint geometries and amounts of fine material over the hang-up. The numerical method was useful to replicate the RS events studied. Here, it was observed that the effective drawpoint height and the amount of fine material over the hang-up influenced the material flow. Based on the tonnage of fine material available over the hang-up, each drawpoint geometry was associated with a maximum expected RS event. The drawpoint geometry in terms of height and width were found to highly influence RS event magnitude, almost independently of the amount of fine material over the drawpoint. In our model, when the height of the brow beam increased by 50%, the amount of fine material in the RS event decreased by 51.4%. Given these results, the design of drawpoints should be evaluated and adjusted accordingly if there is a risk of RS events. Narrower drawpoints with higher brow beams could significantly decrease the magnitude of an RS event. If there is a potential risk of an RS event due to dry and fine material, the methodology used here can be used to anticipate the magnitude of an RS event.
Author Contributions
Conceptualization, R.C. and C.V.; Methodology, R.C. and C.V.; Software, C.V. and R.G.; Calibration, C.V.; Formal analysis, R.C., C.V. and R.G.; Investigation, R.C. and C.V.; Resources, R.C. and K.S.; Writing—original draft preparation, C.V. and R.G.; Writing—review and editing, K.S. and K.Z.; Visualization, C.V.; Supervision, R.C.; Funding acquisition, R.C. and K.S. All authors have read and agreed to the published version of the manuscript.
Funding
This research was funded by CONICYT/PIA Project AFB230001. This research was partially funded by the FONDECYT Regular 1230749. The APC was funded by AGH University of Krakow, scientific subsidy under number: 16.16.100.215.
Institutional Review Board Statement
Not applicable.
Informed Consent Statement
Not applicable.
Data Availability Statement
The raw data supporting the conclusions of this article will be made available by the authors on request.
Conflicts of Interest
The authors declare no conflicts of interest.
References
- Pretorius, D.; Ngidi, S. Cave management ensuring optimal life of mine at Palabora. In Proceedings of the 5th Conference and Exhibition on Mass Mining, Lulea, Sweden, 9–11 June 2008; pp. 63–71. [Google Scholar]
- Paetzold, H.; Lourens, P.; Brazier, R. Reopening and closure of a block cave. In Proceedings of the Eighth International Conference & Exhibition on Mass Mining, Massmin 2020, Santiago, Chile, 9–11 December 2020; pp. 103–114. [Google Scholar]
- NSW Department of Industry, Skills and Regional Development. Report Into Death of Lee Peters at Ridgeway Mine; NSW Department of Industry, Skills and Regional Development: Queanbeyan, NSW, Australia, 2017.
- Lett, J.; Castro, R.; Pereira, M.; Osorio, A.; Alvarez, P. BCRisk applications for rill swell hazard analysis in PC1: Case study at Cadia East Operations. In Proceedings of the Caving 2022: Fifth International Conference on Block and Sublevel Caving, Adelaide, Australia, 30 August–1 September 2022; pp. 561–572. [Google Scholar] [CrossRef]
- Long, S.; Carnovale, D.; Louwrens, L. Mt Wright–managing unique risks. In Proceedings of the 13th AUSIMM Underground Operators’ Conference, Melbourne, Australia, 16–18 October 2017; pp. 295–304. [Google Scholar]
- Gómez, R.; Loyola, M.; Palma, S.; Valdés, C. Experimental study of inrush of fines events in underground mining. Int. J. Rock Mech. Min. Sci. 2023, 169, 105436. [Google Scholar] [CrossRef]
- Hashim, M.; Sharrock, G.; Saydam, S. A Review of Particle Percolation in Mining. In Proceedings of the SHIRMS: Southern Hemisphere International Rock Mechanics Symposium 2008, Perth, Australia, 16–19 September 2008; pp. 273–284. [Google Scholar] [CrossRef]
- Laubscher, D.H. Cave mining-the state of the art. J. South. Afr. Inst. Min. Metall. 1994, 94, 279–293. [Google Scholar]
- Eadie, B. A Framework for Modelling Fragmentation in Block Caving. Ph.D. Thesis, The University of Queensland, St Lucia, QLD, Australia, 2003. [Google Scholar]
- Brown, E. Fragmentation Assessment. In Block Caving Geomechanics; Julius Kruttschnitt Mineral Research Centre: Queensland, Australia, 2007; pp. 184–228. [Google Scholar]
- Laubscher, D.H. Secondary fragmentation. In Block Cave Manual; International Caving Study: Queensland, Australia, 2000. [Google Scholar]
- Pierce, M.E. A Model for Gravity Flow of Fragmented Rock in Block Caving Mines. Ph.D. Thesis, University of Queensland, St Lucia, QLD, Australia, 2009. [Google Scholar]
- Dorador, L. Experimental Investigation of the Effect of Broken Ore Properties on Secondary Fragmentation During Block Caving. Ph.D. Thesis, University of British Columbia, Vancouver, BC, Canada, 2016. [Google Scholar]
- Gómez, R.; Castro, R.; Betancourt, F.; Moncada, M. Comparison of normalized and non-normalized block caving comminution models. J. South Afr. Inst. Min. Metall. 2021, 121, 581–588. [Google Scholar] [CrossRef]
- Castro, R.; Gómez, R.; Castillo, J.J.; Jerez, O. Fragmentation model integrated in a gravity flow simulator for block caving planning. Granul. Matter 2024, 26, 20–22. [Google Scholar] [CrossRef]
- Gómez, R.; Castro, R.L.; Casali, A.; Palma, S.; Hekmat, A. A Comminution Model for Secondary Fragmentation Assessment for Block Caving. Rock Mech. Rock Eng. 2017, 50, 3073–3084. [Google Scholar] [CrossRef]
- Pierce, M.; Weatherley, D.; Kojovic, T. A hybrid methodology for secondary fragmentation prediction in cave mines. In Proceedings of the Second International Symposium on Block and Sublevel Caving, Perth, Australia, 20–22 April 2010; pp. 567–581. [Google Scholar] [CrossRef]
- Pierce, M.; Fuenzalida, M. Application of a methodology for secondary fragmentation prediction in cave mines. In Proceedings of the 3rd International Symposium on Block and Sublevel Caving, Santiago, Chile, 5–6 June 2014; pp. 318–327. [Google Scholar]
- Bridgwater, J.; Utsumi, R.; Zhang, Z.; Tuladhar, T. Particle attrition due to shearing-the effects of stress, strain and particle shape. Chem. Eng. Sci. 2003, 58, 4649–4665. [Google Scholar] [CrossRef]
- Neil, A.U.; Bridgwater, J. Attrition of particulate solids under shear. Powder Technol. 1994, 80, 207–219. [Google Scholar] [CrossRef]
- Gómez, R.; Castro, R. Experimental Quantification of Granular Material Fragmentation Due to Travel Distance. Min. Metall. Explor. 2022, 39, 615–623. [Google Scholar] [CrossRef]
- Locat, P.; Couture, R.; Locat, J.; Leroueil, S. Assessment of the fragmentation energy in rock avalanches. In Proceedings of the 3rd Canadian Conference on Geotechnique and Geohazards, Edmonton, AB, Canada, 9–10 June 2003; pp. 261–268. [Google Scholar]
- Laubscher, D. Dilution. In Block Cave Manual, International Caving Study (1997–2000); International Caving Study: Brisbane, QLD, Australia, 2000. [Google Scholar]
- Castro, R.; Arancibia, L.; Gómez, R. Quantifying fines migration in block caving through 3D experiments. Int. J. Rock Mech. Min. Sci. 2022, 151, 8–10. [Google Scholar] [CrossRef]
- Hashim, M.; Sharrock, G. Dimensionless percolation rate of particles in block caving mines. In Proceedings of the 6th International Conference & Exhibition on Mass Mining, Massmin 2012, Sudbury, ON, Canada, 10–14 June 2012. [Google Scholar]
- Leonardi, C.R.; Owen, D.R.J.; Feng, Y.; Ferguson, W.J. Computational modelling of fines migration in block caving operations. In Proceedings of the 5th Conference and Exhibition on Mass Mining, Lulea, Sweden, 9–11 June 2008; pp. 1063–1072. [Google Scholar]
- Reyes, B. Caracterización de Elipsoides de Extracción con Material Cohesivo en Block/Panel Caving Utilizando Rocky Dem. Bachelor’s Thesis, Universidad Técnica Federico Santa Maria, Santiago, Chile, 2021. [Google Scholar]
- Castro, R.; Gómez, R.; Arancibia, L. Fine material migration modelled by cellular automata. Granul. Matter 2022, 24, 14. [Google Scholar] [CrossRef]
- Flores, G. Rock Mass Response to the Transition from Open Pit to Underground Cave Mining. Ph.D. Thesis, University of Queensland, St Lucia, QLD, Australia, 2005. [Google Scholar]
- Flores, G.; Catalan, A. A transition from a large open pit into a novel “macroblock variant” block caving geometry at Chuquicamata mine, Codelco Chile. J. Rock Mech. Geotech. Eng. 2019, 11, 549–561. [Google Scholar] [CrossRef]
- Hungr, O.; Evans, S.G.; Bovis, M.J.; Hutchinson, J.N. Review of the classification of landslides of the flow type. Environ. Eng. Geosci. 2001, 7, 221–238. [Google Scholar] [CrossRef]
- Strom, A. Rock Avalanches: Basic Characteristics and Classification Criteria. In Understanding and Reducing Landslide Disaster Risk; Springer: Cham, Switzerland, 2021; pp. 3–23. [Google Scholar] [CrossRef]
- Strom, A.; Abdrakhmatov, K. Rockslides and Rock Avalanches of Central Asia: Distribution, Morphology, and Internal Structure; Elsevier: Amsterdam, The Netherlands, 2018. [Google Scholar]
- Strom, A.; Li, L.; Lan, H. Rock avalanche mobility: Optimal characterization and the effects of confinement. Landslides 2019, 16, 1437–1452. [Google Scholar] [CrossRef]
- Melosh, H.J. The mechanics of large rock avalanches. Rev. Eng. Geol. 1987, 7, 41–50. [Google Scholar]
- Dubovskoi, A.N.; Pernik, L.M.; Strom, A.L. Experimental simulation of rockslide fragmentation. J. Min. Sci. 2008, 44, 123–130. [Google Scholar] [CrossRef]
- Hungr, O.; Leroueil, S.; Picarelli, L. Varnes classification of landslide types, an update. Landslides 2012, 1, 47–58. [Google Scholar] [CrossRef]
- Qin, S.Q.; Jiao, J.J.; Li, Z.G. Nonlinear evolutionary mechanisms of instability of plane-shear slope: Catastrophe, bifurcation, chaos and physical prediction. Rock Mech. Rock Eng. 2006, 39, 59–76. [Google Scholar] [CrossRef]
- Sánchez, V.; Castro, R.L.; Palma, S. Gravity flow characterization of fine granular material for Block Caving. Int. J. Rock Mech. Min. Sci. 2019, 114, 24–32. [Google Scholar] [CrossRef]
- Castro, R.; Perez, A.; Gómez, R. Evaluating Wet Muck Risk in Block Caving Mines: A New Model. Int. J. Rock Mech. Min. Sci. 2023, 170, 105485. [Google Scholar] [CrossRef]
- Yu, K.; Zheng, C.; Ren, F. Numerical Experimental Study on Ore Dilution in Sublevel Caving Mining. Min. Metall. Explor. 2021, 38, 417–469. [Google Scholar] [CrossRef]
- Lapčević, V.; Torbica, S. Numerical investigation of caved rock mass friction and fragmentation change influence on gravity flow formation in sublevel caving. Minerals 2017, 7, 56. [Google Scholar] [CrossRef]
- Hidalgo, F.; Salina, I. Secondary rock ore reserve recovery using a primary rock layout: Extensión Hw Pipa Norte, a case study. In Proceedings of the Eighth International Conference & Exhibition on Mass Mining, Massmin 2020, Santiago, Chile, 9–11 December 2020; pp. 155–165. [Google Scholar]
- Shahri, A.A.; Kheiri, A.; Hamze, A. Subsurface Topographic Modeling Using Geospatial and Data Driven Algorithm. ISPRS Int. J. Geo-Inf. 2021, 10, 341. [Google Scholar] [CrossRef]
- Arrieta, M.; Zhang, Z.X. Particle size distribution (PSD) estimation using unmanned aerial vehicle (UAV) photogrammetry for rockfill shear strength characterization. Acta Geotech. 2024, 19, 6239–6258. [Google Scholar] [CrossRef]
- Zhang, J.; Zhang, J. Particle size spatial distribution in landslide dams. J. Mt. Sci. 2024, 21, 1886–1903. [Google Scholar] [CrossRef]
- Moncada, M.; Betancourt, F.; Rodríguez, C.G.; Toledo, P. Effect of Particle Shape on Parameter Calibration for a Discrete Element Model for Mining Applications. Minerals 2023, 13, 40. [Google Scholar] [CrossRef]
- Cundall, P.A.; Strack, O.D.L. A discrete numerical model for granular assemblies. Geotechnique 1979, 29, 47–65. [Google Scholar] [CrossRef]
- Hancock, W. Gravity Flow of Rock in Caving Mines: Numerical Modelling of Isolated, Interactive and Non-Ideal Draw. Ph.D. Thesis, University of Queensland, St Lucia, QLD, Australia, 2013. [Google Scholar]
- Weatherley, D.; Boros, V.; Hancock, W.; Abe, S. Scaling benchmark of ESyS-Particle for elastic wave propagation simulations. In Proceedings of the 6th IEEE International Conference on e-Science, Brisbane, OLQ, Australia, 7–10 December 2010; pp. 277–283. [Google Scholar]
- Emery, X.; Séguret, S.A. Geostatistics for the Mining Industry: Applications to Porphyry Copper Deposits, 1st ed.; CRC Press: London, UK, 2020. [Google Scholar] [CrossRef]
- Shahri, A.A.; Chunling, S.; Larsson, S. A hybrid ensemble-based automated deep learning approach to generate 3D geo-models and uncertainty analysis. Eng. Comput. 2024, 40, 1501–1516. [Google Scholar] [CrossRef]


Disclaimer/Publisher’s Note: The statements, opinions and data contained in all publications are solely those of the individual author(s) and contributor(s) and not of MDPI and/or the editor(s). MDPI and/or the editor(s) disclaim responsibility for any injury to people or property resulting from any ideas, methods, instructions or products referred to in the content. |
© 2024 by the authors. Licensee MDPI, Basel, Switzerland. This article is an open access article distributed under the terms and conditions of the Creative Commons Attribution (CC BY) license (https://creativecommons.org/licenses/by/4.0/).