Article

Markov-Modulated Poisson Process Modeling for Machine-to-Machine Heterogeneous Traffic

by
Ahmad Hani El Fawal
1,2,
Ali Mansour
1,* and
Abbass Nasser
1,3
1
Lab-STICC, UMR 6285—CNRS, ENSTA Bretagne, 29806 Brest, France
2
Computer Science Department, Modern University for Business & Science, Damour 5660, Lebanon
3
Business Computing Department, UBS, Holy Spirit University of Kaslik (USEK), Jounieh 1200, Lebanon
*
Author to whom correspondence should be addressed.
Appl. Sci. 2024, 14(18), 8561; https://doi.org/10.3390/app14188561
Submission received: 19 August 2024 / Revised: 18 September 2024 / Accepted: 20 September 2024 / Published: 23 September 2024

Abstract

:
Theoretical mathematics is a key evolution factor of artificial intelligence (AI). Nowadays, representing a smart system as a mathematical model helps to analyze any system under development and supports different case studies found in real life. Additionally, the Markov chain has shown itself to be an invaluable tool for decision-making systems, natural language processing, and predictive modeling. In an Internet of Things (IoT), Machine-to-Machine (M2M) traffic necessitates new traffic models due to its unique pattern and different goals. In this context, we have two types of modeling: (1) source traffic modeling, used to design stochastic processes so that they match the behavior of physical quantities of measured data traffic (e.g., video, data, voice), and (2) aggregated traffic modeling, which refers to the process of combining multiple small packets into a single packet in order to reduce the header overhead in the network. In IoT studies, balancing the accuracy of the model while managing a large number of M2M devices is a heavy challenge for academia. One the one hand, source traffic models are more competitive than aggregated traffic models because of their dependability. However, their complexity is expected to make managing the exponential growth of M2M devices difficult. In this paper, we propose to use a Markov-Modulated Poisson Process (MMPP) framework to explore Human-to-Human (H2H) traffic and M2M heterogeneous traffic effects. As a tool for stochastic processes, we employ Markov chains to characterize the coexistence of H2H and M2M traffic. Using the traditional evolved Node B (eNodeB), our simulation results show that the network’s service completion rate will suffer significantly. In the worst-case scenario, when an accumulative storm of M2M requests attempts to access the network simultaneously, the degradation reaches 8% as a completion task rate. However, using our “Coexistence of Heterogeneous traffic Analyzer and Network Architecture for Long term evolution” (CHANAL) solution, we can achieve a service completion rate of 96%.

1. Introduction

Beyond theoretical mathematics, Markov chains find extensive use in a variety of applied fields, including finance, physics, meteorology, chemistry, statistics, etc.
In statistics, Markov chains can be used to analyze states transition simply, rapidly, and accurately. Markov chains can therefore be used to mimic complex distributions and to forecast the likelihood of future events.
In health care, the amount of property damage and human casualties these disasters produce might be significantly decreased if they are effectively forecasted.
Additionally, there will be a significant rise in the simplicity of using Markov chains due to the transfer matrix’s calculation method being highly appropriate for artificial intelligence’s computing features.
Within the field of artificial intelligence (AI), a Markov chain can be a crucial probabilistic method utilized to comprehend and forecast sequential data. Its capacity to represent and analyze dynamic systems makes it relevant and essential for a wide range of AI applications and algorithms. AI techniques incorporate Markov chains to reflect the intrinsically probabilistic aspect of real-world occurrences, like natural language processing (NLP) and reinforcement learning (RL). Indeed, Markov chains are utilized in NLP for speech recognition and text generation. For example, a Markov chain can be used to simulate the prediction of the next word in a sentence, where each state is a word and transitions are the likelihood of one word coming after another [1]. Meanwhile, the environment in RL is frequently represented as a Markov Decision Process (MDP), a kind of Markov chain that consists of decisions and rewards. By forecasting future conditions and rewards, agents acquire decision-making skills [2].
In mathematics, Markov chains can be used to forecast future events. Some sophisticated formulas will be derived and applied. Its applications in other disciplines like engineering, physics, meteorology, and even medicine successfully lessen the harm that different disasters inflict on people’s lives and property [3]. People’s lives have already made extensive use of Markov chains. Road construction costs are influenced by a wide range of factors; thus, it can be quite helpful to utilize a Markov chain for estimation in order to weed out the less important ones. It can also swiftly obtain data that are relatively more accurate. Markov chains have applications beyond building roads, such as market share research and financial forecasts. In [4], Wu discovered that market share may be accurately predicted using the Markov chain’s transfer matrix computation. Markov chains are useful not just in finance and architecture but also in power impulse noise prediction. Markov chains are proven to be highly useful in preventing excessive noise because they may be employed well by artificial intelligence to calculate the probability of excessive power pulses [5]. Future business simulations based on Markov chains may provide a more realistic depiction of the company, lowering the possibility of modeling errors and aiding in the prediction of future events and more precise optimization [6]. In this paper, the main research gap is how to model the heterogeneous M2M traffic.
In telecommunication, Machine-to-Machine (M2M) and Human-to-Human (H2H) communications are considered to be game-changing elements [7]. Even though M2M and H2H communications can coexist in different domains (such as industrial automation, medical treatment, electrical power networks, and civil transportation), M2M communications are anticipated to play a vital role as a proxy to limit numerous human interventions through the use of long-term evolution advanced (LTE-A) intelligent systems. Because H2H and M2M patterns are incompatible, coexisting H2H and M2M traffic might present several difficulties for a shared network, decreasing its efficacy. M2M traffic is highly homogeneous in comparison to H2H traffic since it uses small data chunks and transfer rates, typically with predictable communication periods and durations [8]. However, accumulative traffic from various sources is expected to be received due to M2M synchronization behavior and a variety of applications with varying payloads, times, and data rates. This turns homogeneous M2M traffic into heterogeneous M2M traffic, which quickly saturates the network bandwidth. Saturation is an issue that inevitably affects traffic, services, and applications in both M2M and H2H contexts. Recently, the complexity of processing algorithms in cellular systems has pushed the boundaries of existing technologies to the limit.
According to Heavy Reading [9], mobile operators pay USD 20 billion annually to overcome service degradation and network breakdown. Therefore, the efficient radio communication strategy is one of the biggest issues faced by researchers, mobile operators, and the 3rd Generation Partnership Project (3GPP) community [10].
The main research gap is how to model heterogeneous M2M traffic. In this study, we bridge this gap by proposing a Continuous-Time Markov Chain (CTMC) model as a stochastic process tool to characterize the H2H/M2M coexistence while focusing on heterogeneous M2M traffic, not homogeneous M2M traffic.
The main contributions of this paper are as follows:
  • We propose a Markov-Modulated Poisson Process (MMPP) framework called Coexistence of Heterogeneous traffic Analyzer and Network Architecture for Long-term evolution (CHANAL) to characterize Human-to-Human traffic and M2M heterogeneous traffic mathematically
  • Using CHANAL, we mimic the real-time and synchronization behavior of M2M traffic.
  • We study the impact of heterogeneous M2M traffic over H2H traffic, especially during disaster scenarios.
  • To confirm our mathematical results, the CHANAL solution is illustrated using an extensive simulation for different scenarios.
The rest of the paper is organized as follows: In Section 2, we give an overview about source traffic modeling and aggregated traffic modeling. The third section introduces the MMPP model. In Section 4, our CHANAL model is presented. In Section 5, we discuss our mathematical results, while Section 6 analyzes our empirical results. Finally, the conclusion and future works are provided in the last section.
It is important to note that the performance of homogeneous M2M traffic and H2H traffic is characterized mathematically in our previous work [11]. In this work, we used a mathematical model called “Coexistence Analyzer and Network Architecture for Long term evolution” (CANAL) to characterize the key performance of homogeneous M2M traffic as well as H2H traffic. In this work, we are motivated to test the ability of CANAL to analyze heterogeneous M2M traffic. To answer this question, we consider traffic modeling in the following section.

2. Traffic Modeling

Stochastic processes that mimic the behavior of measured data traffic for physical quantities can be used to characterize traffic modeling [12]. There are two types of traffic models: aggregated traffic models (such as high-speed links, backbone networks, and the internet) and source traffic models (such as voice, video, and data traffic). Packets that replicate real traffic behavior at different sizes and intervals are generated by source traffic simulations, such as the SimuLTE simulator [13], OPNET [14], OMNeT [15], etc. Several common sources of traffic models, including as two-state MMPP, ON/OFF, and Interrupted Poisson Process (IPP) models, are analyzed in [16] using the OPNET modeler. An example of an ON-OFF model is an MMPP or IPP (Interrupted Poisson Process). The Poisson process is modulated by a Markov chain that contains two states: ON and OFF. These states correspond to two values of the Poisson process’s intensity; this model is called the ON-OFF model since the intensity is frequently 0 in the off state.
The article in [17] states that during a disaster, it is estimated that there would be more than 5 × 10⁴ devices per cell that may send their payloads simultaneously. We understand that in these situations, source traffic models become very difficult to execute, which makes the usage of aggregated traffic modeling necessary. Finding a fair approximation of the arrival process of several devices while maintaining a good balance between accuracy and simulation performance is the aim of aggregated traffic models, for example, the Simulink simulator [18,19]. For instance, in [11], we looked at how H2H and M2M traffic interact in crowded areas and during emergencies. Based on the suggested design in [20], we also performed several simulations in which a single LTE-A network with average arrival rates (λ1; λ2) and service rates (µ1; µ2) for M2M and H2H traffic is assumed. The simulation findings showed that a prioritized LTE-A system could handle more M2M and H2H traffic demands in less time. According to the simulation results, a prioritized LTE-A system for both M2M and H2H traffic may manage more requests in dense area scenarios by lowering the completion rate of lower-priority traffic and preserving higher-priority traffic without degradation.
In contrast, during an emergency, higher-priority traffic is prioritized over lower-priority traffic, leading to a higher completion rate and the total elimination of low-priority traffic. Because it allows H2H and M2M traffic to continue operating simultaneously and uninterrupted, the non-priority traffic approach offers an advantage over other options under these circumstances. In this paper, to simplify our work, we use equal priority for M2M and H2H traffic, while keeping the door opened to discuss applying various priorities over different traffic in our coming research.
As stated in [21], the 3GPP offers two models: Model 1 represents non-synchronized M2M communication, whereas Model 2 represents synchronized M2M traffic, as shown in Figure 1.
  • Model 1 of the 3GPP can be thought of as a regular scenario in which M2M devices access the network in a consistent manner over a period of time (i.e., a non-synchronized way).
  • Model 2 of the 3GPP can be viewed as a disaster scenario in which a large number of M2M devices connect to the network in a highly synchronized fashion (e.g., after a power outage).
In [20], the authors propose the Coupled Markov-Modulated Poisson Process (CMMPP) framework, which combines the benefits of both modeling paradigms (source traffic modeling and aggregated traffic modeling). It demonstrates the viability of M2M source traffic modeling with only linearly increasing complexity. CMMPPs improve the accuracy and flexibility of aggregated M2M traffic models at the cost of moderate computational complexity, as proposed by the aforementioned 3GPP model in [21].
To summarize, an important question meriting a detailed response from all previous works is whether it is feasible to model the traffic of a vast number of autonomous machines using source traffic modeling, which is, in general, more precise than aggregated traffic modeling (e.g., treating the accumulated data from all M2M devices as a single stream).
Practically, we are not in need to know about the actions of a single system to evaluate multiple access and tremendous capability. Thus, the overall behavior of M2M traffic is matched by the aggregated traffic models represented by a simple Poisson process.
Using a Poisson process, MMPP models can handle non-constant interval-based events. By employing one server, the capture of a single request at any given moment can constitute the event. This allows MMPP models to handle unstructured data. Furthermore, we spotted how MMPP models may be used for both structured and unstructured data, enabling the modeling of unstructured data utilizing several states like a multistate model. Additionally, we show that uncertainty can be represented as in a classical model. The terminology and mathematical notations required for the MMPP technique are first presented in Section 3. Next, the CHANAL model and its performance metrics are explained in Section 4. A use case and a numerical demonstration utilizing simulations are covered in the final part.
Finally, because M2M traffic exhibits synchronized behavior, it is anticipated that the average arrival rate (λ) would change with time [22,23]. Aggregated traffic models, such as heterogeneous models with time-varying arrival rates, are currently a hot topic that should be studied and compared with homogeneous traffic with a constant average arrival rate (λ), as explained in the following section.

3. M2M Heterogeneous Model

To recall, the conditions and thresholds were discussed in many previous papers that we published before such as [11,24,25], especially when we dealt with source traffic modeling that requires having thresholds since packets that replicate real traffic behavior (such as voice, video, and data traffic) at different sizes and intervals are generated. However, during a disaster, it is expected that there will be a huge number of M2M devices that may send their payloads simultaneously. We understand that in these situations, source traffic models become very difficult to execute, which makes the usage of aggregated traffic modeling necessary.
Therefore, in this paper, we used aggregated traffic modeling, in which we represent each traffic with an average arrival rate (λ) and completion rate (µ) for both traffic M2M and H2H. Then, we represent the whole system as a linear system and mathematical balance equations that overcome the limitation of the number of devices attempting to access the network simultaneously.
In our previous paper [24], we focused on a constant average arrival rate (λ), in which we strongly assume to have either one H2H arrival or one M2M arrival in the smallest discrete time period. However, in reality, M2M devices may send their payloads in a synchronization manner. The synchronization behavior of M2M devices leads to different M2M storms that form accumulative traffic over the time cycle, which requires deeper analysis and a more accurate representation of different M2M traffic. Our new contribution is based on the realistic behavior of M2M devices rather than ideal and theoretical behavior by turning the constant arrival rate (λ) into an average arrival rate, which varies over time. We are encouraged in this manuscript to consider a Poisson process modulated rate λ(m) for M2M traffic modulated with a β distribution over a time-space Δt and determined by a Markovian chain state s(m) (m indicates a Markov state index varying from 0 to M, with M being the total number of states), as shown in Figure 2.
In Figure 2, an MMPP model is used as a framework to accurately model M2M traffic sources by analyzing an event when a huge number of M2M devices behave in a synchronized manner [26,27]. For H2H traffic, our MMPP model has a constant average arrival rate λ(h). As for M2M traffic, it has a variable Poisson process-modulated rate λ(m); 0 ≤ mM.
The overall average rate λ(g) of the MMPP is given by:
λ ( g ) = m = 0 M λ ( m ) π ( m )
where π(m) is the probability for the system to be in a certain state (m) at a given time space ∆t, with the following constraint:
m = 0 M   π m = 1
(M + 1) states would be a simple example of M2M devices modeled using an MMPP model, where the first state, S(0), represents a “normal state”. The remaining states show a varying arrival rate over various “emergency states” over time λ(m) until they arrive at the “worst-scenario state” (where m = M).
A state space and a transition matrix define the process (i.e., a stochastic or probability matrix). As a result, the likelihood of changing states is contingent upon the rate at which each service is completed.
The notion is illustrated in Figure 3, where the transition probabilities between two connected states, say, S(m) to S(m+1), are represented by the variables p(m,m+1).
One of the three states listed below applies to the system:
  • The normal state S(0) possesses the following equilibrium relationship and incorporates the initial state:
p(0,1)π(0) − p(1,0)π(1) = 0
2.
Emergency states S(m) happen when m groups combine to produce an accumulative storm and send their data collectively:
λ ( m ) = j = 1 m λ ( j )
All emergency states S(m) follow the following equilibrium relationship:
p(m − 1, m)π(m − 1) − [p(m,m − 1) + p(m, m + 1)]π(m) + p(m + 1, m)π(m + 1) = 0
where π(m) is the probability to be in the state S(m), and m ∈ [1, 2, 3, …, M − 1].
3.
The worst-scenario state S(M) occurs when all groups dispatch their data simultaneously:
λ ( M ) = m = 1 M λ ( m )
The final state, which is included in S(M), has the following equilibrium relationship:
p(M − 1, M)π(M − 1) − p(M, M − 1)π(M) = 0
The general equation that follows can be used to summarize the three equations mentioned above:
αp(m − 1, m)π(m − 1) — [αp(m, m−1) + ξp(m, m + 1)]π(m) + ξp(m + 1, m)π(m + 1) = 0
where:
  • α = 0 in the “normal state”, otherwise α = 1;
  • ξ = 0 in the “worst-scenario state”, otherwise ξ = 1.
The state probability π(m) resides in the state probability vector Π according to the following:
Π = π ( 0 ) π ( 1 ) . . . π ( M ) T
However, a state transition matrix P can be created by condensing the transition probabilities:
= p ( 0 , 1 ) p ( 1 , 0 ) 0 . . . 0 p ( 0 , 1 ) [ p 1 , 0   + p 1 , 2 ]   p ( 2 , 1 ) . . . 0 0 p ( 1 , 2 ) [ p 2 , 1   + p 2 , 3 ] . . . p ( 3 , 2 ) . . . . . . . . . . . . . . . . . . 0 0 0 . . . p ( M , M 1 )
As a result, the equations the (M + 1) states can be represented as a linear system in the following form:
P Π = 0
The linear system in (7) should be solved while respecting the following two constraints:
m = 0 M   π ( m ) = 1
0 < π ( m ) < 1
  m { 0,1 , 2,3 , . . . , M }
Ultimately, we can compute π(0) to π(M) by resolving the linear system mentioned above in (7).
Also using the equation in (1), we can calculate λ(g).
On one hand, emergencies such as natural catastrophes, terrorist attacks, or various accidents are not predictable in real life. Based on that, in our earlier work [28], we created a case study based on a few use cases found in [29] and 3GPP technical reports [30]. This was necessary due to the imprecise scenarios, dearth of data, and behavior analysis for M2M devices in emergency situations.
By summarizing our previous case study, in Table 1, we can extend it to build a heterogeneous M2M case study represented with three accumulative storms (M = 3).
On the other hand, Markov chains can be used to simulate complex situations and to forecast the likelihood of future events. Markov chains were used to forecast some upcoming natural disasters in the real world, such as earthquakes, tsunamis, and even the spread of disease [30].
The state transition matrix becomes the following:
P = p ( 0,1 ) p ( 1,0 ) 0 0 p ( 0,1 ) [ p 1,0   + p 1,2 ]   p ( 2,1 ) 0 0 p ( 1,2 ) [ p 2,1   + p 2,3 ] p ( 3,2 ) 0 0 p ( 2,3 ) p ( 3,2 )
By solving the linear system in (7), we can characterize the behavior of the system mathematically.
Practically, we need to develop a model, which mimics the behavior of the system. Moreover, by comparing both mathematical and empirical results, we can validate our model as a preliminary step to apply some important metrics that measure the impact of M2M heterogeneous traffic on H2H traffic, as explained in the next section.

4. CHANAL Model and Performance Metrics

4.1. CHANAL Model

Remember from [11] that by enabling both M2M and H2H devices to access network resources efficiently, we aimed to maintain a sustainable level of services with minimal congestion during emergency events while measuring the mutual impact of M2M homogeneous traffic and H2H traffic in various scenarios. This use case is summarized in Table 1. In order to accomplish this, we use the assumption that the observation time intervals are so short that, at any given time, only one event may happen (either one M2M or one H2H request/completed service). Although this simplification used in our previous CANAL model helps in studying homogeneous M2M traffic, it may not be suitable to represent a real case with heterogeneous M2M traffic.
To this end, we extend our work to study the arrival of two requests per time slot. These two requests are attempting to access the network. In case of a system overload, some of the requests will be pushed to the queue and processed following a pre-defined priority.
In this publication, we have updated our earlier model, labeled “CANAL” [11], with a new architecture termed “CHANAL”, which detects the homogeneity of M2M traffic and automatically manages both H2H and M2M traffic. In order to achieve this, the model operates based on the load state of M2M requests in various scenarios.
A single uplink cell in an eNodeB with total network resource blocks (c) is represented by CHANAL. M2M and H2H traffic are examples of heterogeneous traffic types. According to Poisson’s distributions, both types of traffic are expected to have arrival rates of λ(m) and λ(h), respectively [20]. Consider that the exponential distributions for M2M and H2H service rates, respectively, are represented by μ(m) and μ(h). Resource Allocation Control (RAC) is another feature of CHANAL that is utilized to manage, control, and grant access to network requests in accordance with the resources that are available. In network congestions brought on by catastrophic occurrences, RAC is essential because it adaptively manages resources to manage the overwhelming demands of M2M devices while limiting H2H requests to reasonable levels.
An eNodeB bandwidth in the LTE-A specification varies as follows, according to the requirements of the operator: 1.4, 3, 5, 10, 15, and 20 MHz. Our CHANAL model subtracts an LTE-M bandwidth of 1.4 MHz (6 PRBs) from the overall bandwidth (e.g., 20 MHz) allowed for H2H traffic to reserve it for M2M traffic. It continues to reduce the H2H bandwidth and widen the M2M bandwidth until it absorbs all of the M2M accumulative storms. It resets the M2M and H2H bandwidths to their initial settings upon the retreat of all M2M storms.
For instance, rb(m) is set aside for LTE-M networks where rb(h) + rb(m) = c, while rb(h) is set aside for LTE-A networks for their maximum resource blocks. Both rb(h) and rb(m) typically hold onto the starting number of resources (e.g., for a bandwidth network, LTE-A = 10 MHz, rb(h) = 50, and for an LTE-M network, rb(m) = 6). The utilization of rb(m) peaks at the moment of a sudden event. Thus, in order to satisfy the temporary H2H requests, the RAC offers an extra six resources. As a result, with LTE-A bandwidth of 10 MHz, there are 6 more resources set aside for M2M (rb(m) = 12) and 6 fewer resources set aside for H2H (rb(h) = 44). Until the sudden event passes or all storms are absorbed, more resources will be repeatedly loaned.
Furthermore, CHANAL has a Queuing Control Unit (QCU) that consists of two independent queues with queue sizes of n and o for H2H and M2M, respectively (H2H-Q, M2M-Q).
When the number of reserved resource blocks in an LTE-A network peaks to rb(h) or, in an LTE-M network, peaks to rb(m), the system is said to be in the “full State”. Because of this, when a new M2M/H2H device request competes to enter the system and the system reaches its cut-off point (full state), the queuing process begins. When there is a conflict between the priorities of H2H and M2M traffic requests, the system employs the QCU technique that was previously described in [11].
Table 2 displays the distinctions and advances between the CHANAL and CANAL models:
To better understand how CHANAL works, a flowchart is presented in Figure 4.

4.2. Performance Metrics

We assess the influence of H2H and M2M traffic using two performance metrics:
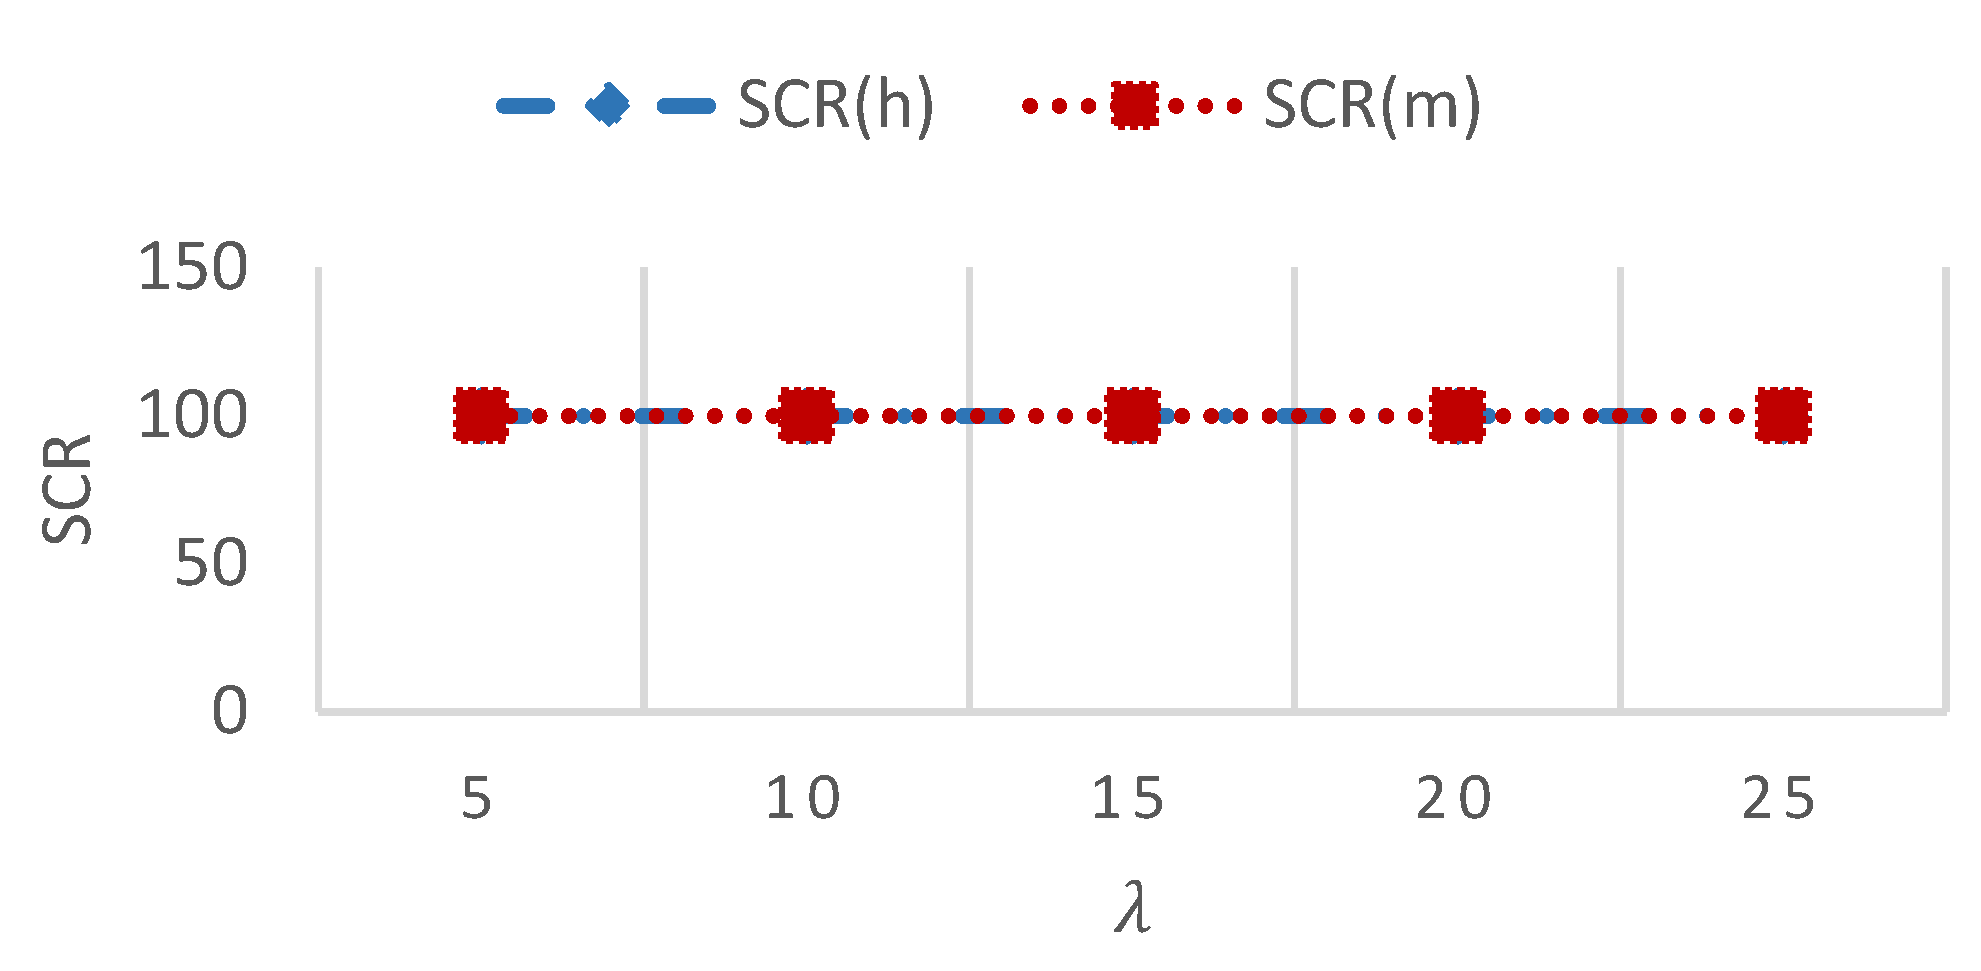
  • Service completion rate (scr): This measures how many requests are completed in a given amount of time and is derived from the average arrival requests and service rate for a certain type of traffic (for example, scr(h) and scr(m) indicate the service completion rate for H2H or M2M traffic, respectively [31]).
  • Resource utilization (ru(h)/ru(m)) for H2H and M2M: This statistic, which compares the total number of resource blocks used in the network (c) to the number of utilized rb(h)/rb(m) in each state, indicates the likelihood that the system will be busy serving H2H/M2M arrivals.

5. Modeling and Results Discussion

5.1. Modeling

In this section, we present our enhanced model that could generate both M2M and H2H traffic while adding priorities and queuing for both traffic.
Assume that our LTE-A network, which utilizes the FIFO (First In–First Out) queue in MATLAB, consists of a total number of resources c = 100. M2M requests are served by an LTE-M network with 6 resources (rb(m) = 6), while H2H requests will be handled by the remaining 94 resources (rb(h) = 94).
To investigate the mutual consequences of H2H and M2M in normal and/or emergency scenarios, we use the theory of queuing to produce exact theoretical results for some performance measures that facilitate a comparison of empirical outcomes with corresponding theoretical outcomes.
To fit our CHANAL design, we made numerous modifications to the model described in Section 4.1, including:
  • Poisson processes with the two parameters λ(h) and λ(m) correspondingly determine arrivals in the architecture, which consists of two servers with two traffic sources (H2H and M2M). With respect to the rate parameter μ, service times follow an exponential distribution, with the mean service time being 1.
  • Assuming a fixed arrival rate λ(h) for H2H traffic and a service rate μ(h) = 1.
  • Additionally, we assume that the five variable arrival rates for M2M heterogeneous traffic are λ(m) ∈ {5, 10, 15, 20, 25} and that the service rate is μ(m)= 1.
  • M2M and H2H traffic are prioritized equally.
  • We employ a FIFO queue type and take into account the following queue sizes: n = o = 0 for H2H traffic and M2M traffic, respectively.
  • The duration of the modulation is 1000 s.
Table 3 provides an overview of all the notations utilized in the simulations.

5.2. Generating the Equilibrium Equations

By taking into account new arrival events with an average arrival rate of λ and a completion rate of μ, we produce the equilibrium equations. There are four possible states for the system: empty state, occupied state, full state, and queue state.

5.3. Performance

To validate our model, we use the following performance metric:
The service completion rate, or scr, is a measure of how many completed requests there are per time interval based on the service rate μ and the total number of continuing requests for a particular traffic type (for example, scrHP and scrLP represent the service completion rate for HP/LP traffic).
s c r = i j i µ π ( i , j )
The equation can be expressed as follows since in our model, the completion rate (μ) is treated as a constant:
s c r = µ   i i j π ( i , j )
The above equations can be rewritten as follows since the marginal probability is the result of the sum of the conjoint probabilities:
s c r = µ i i π ( i ) = µ E ( i )
In order to investigate the mutual effects of H2H traffic on M2M traffic, we offer our built model in this part. It can produce both H2H and M2M traffic and has complete flexibility to add priority to any traffic. Furthermore, as indicated in Table 4, we assume that each state is represented by the constants S(i, j):

5.4. Scenarios

At first, we solely take into account a standard eNodeB that has the five previously described groups and varying average arrival rates.

5.4.1. Modeling a Normal Cycle Scenario

Since there are only 6 resources available to handle 15 instantaneous requests, a uniform average arrival rate (scr(m) = scr(h) = 100%) is expected under normal operating conditions. Figure 5 verifies that every M2M and H2H request is fulfilled.

5.4.2. Modeling a Dense Area Scenario

We solely take into account a standard eNodeB in this case, which has the five previously described groups and varying average arrival rates. In the meantime, H2H traffic has a steady average arrival rate.
Given that there are only six resources available to handle fifteen instantaneous requests, Figure 6’s results demonstrate that all H2H requests and 81% of M2M requests are fulfilled:
  • scr(m) = 81%
  • scr(h) = 100%

5.4.3. Modeling a Worst-Case Scenario

In the worst-case scenario, we assume that a catastrophic occurrence causes us to receive twice as much H2H traffic with a constant average arrival rate λ(h) = 50. The five groups are progressively synchronized in the meantime.
In Figure 7, the results show that almost all H2H requests are fully served with a 96% rate, and 52% of M2M requests are served as follows:
  • scr(m) = 52%
  • scr(h) = 96%

6. Simulations and Result Discussions

6.1. Simulator

In this section, we present our created simulation model. It has the ability to generate both M2M and H2H traffic, as well as add priority or queuing for any kind of traffic.
Let us assume that our LTE-A network has c = 100 resources in total. Six resources are used by the LTE-M network to process M2M requests (rb(m) = 6). Therefore, the remaining 94 resources (rb(h) = 94) will handle H2H traffic.
Based on the architecture suggested in [18], we run numerous simulations to examine the interactions between H2H and M2M traffic in either regular or emergency situations. It is simpler to compare empirical results with equivalent theoretical conclusions when the architecture uses queuing theory to provide accurate theoretical results for particular performance measurements. The model goes through multiple improvements to be consistent with our CHANAL architecture, as described in Section 4.
These improvements include the following:
  • The design has two servers and two traffic sources (H2H and M2M). Poisson processes determine arrivals using two parameters, λ(h) and λ(m), respectively.
  • The mean service time is represented by 1/µ, and the service times follow an exponential distribution with a rate parameter of µ.
  • We assume a fixed arrival rate λ(h) for H2H traffic and a service rate µ(h) = 1.
  • In addition, we assume that M2M heterogeneous traffic has a service rate of µ(m) = 1 and five distinct variable average arrival rates, denoted as λ(m) = {5; 10; 15; 20; 25}.
  • M2M and H2H traffic are prioritized equally.
  • For H2H and M2M traffic, respectively, queue sizes of n = o = 0 are taken into account when using a FIFO queue type.
  • The simulation lasts for 1000 s.

6.2. Regular eNodeB Scenarios, Results, and Discussions

6.2.1. Simulating a Normal Cycle Scenario

The ordinary eNodeB with the five previously described groups and various variable average arrival rates is the only one we take into consideration at first.
The uniform arrival rate during normal cases is considered as follows:
λ ( 0 ) = 5 + 10 + 15 + 20 + 25 5 = 15
Figure 8 illustrates how λ(h) = 25 is used to represent a constant average arrival rate for H2H traffic.
We observe the following in the results displayed in Figure 8:
  • Because there are only 6 resources available to handle 15 instantaneous requests, a uniform average arrival rate with λ(0) = 15 and a 40% completion rate (scr(m) = 40%) and ru(m) = 100% is expected under normal operation.
  • There is a noticeable decline in the service completion rate, from λ(1) = 5 with a 100% completion rate to λ(5) = 25 with a 24% completion rate, only when a single storm is received from a synchronized group (Group(1) to Group(5)). These findings are clear given that the network only has a set number of resources (rb(m) = 6) set aside for M2M traffic, despite the fact that demand for M2M services is rising (scr(m) = {100%; 60%; 40%; 30%; 24%}).
Additionally, the system utilization peaks to its cut-off point with a ru(m) = 100% due to the high load of arrivals compared to the available resources in the system except for Group (1).
Since the network allocates the majority of its resources to H2H traffic (rb(h) = 94), there are no restrictions on H2H traffic, knowing that the average number of requests per time interval is 25 (λ(h) = 25) with scr(h) = 100% and ru(h) = 26.5%.

6.2.2. Simulating a Disaster Scenario

In the event of a catastrophe, we assume twice as much H2H traffic is received at a constant average arrival rate of λ(h) = 50. The five groups are progressively synchronized in the meantime:
  • First emergency storm, when Group(1) submits its data as a result of a sudden event: λ ( E 1 ) = λ ( 1 ) = 5 ;
  • Second emergency storm, when Group(1) and Group(2) dispatch their payloads simultaneously: λ ( E 2 ) = λ ( 1 ) + λ ( 2 ) = 15 ;
  • Third emergency storm, when Group(1), Group(2) and Group(3) send their data at the same time: λ ( E 3 ) = λ ( 1 ) + λ ( 2 ) + λ ( 3 ) = 30 ;
  • Fourth emergency storm when Group(1), Group(2), Group(3), and Group(4) send their payloads all together: λ ( E 4 ) = λ ( 1 ) + λ ( 2 ) + λ ( 3 ) + λ ( 4 ) = 50 ;
  • Worst-case storm, which occurs when the five storms dispatch their data simultaneously: λ ( W ) = λ ( 1 ) + λ ( 2 ) + λ ( 3 ) + λ ( 4 ) + λ ( 5 ) = 75 .
Figure 9’s data reveal the following:
  • Receiving the five synchronized groups causes a significant decline in the service completion rate while moving from an Emergency(1) storm (λ(E1) = 5) with a 100% completion rate to an Emergency(5) storm (λ(W) = 75) with only an 8% completion rate.
These findings are clear because, despite increasing demand for M2M services (scr(m) = {100%, 40%, 20%, 12%, 8%}), the network only has a fixed number of resources (rb(m) = 6) set aside for M2M traffic. Additionally, system utilization peaks to its cut-off point with a ru(m) = 100% due to the high load of arrivals compared to the available resources in the system, except for Group(1), as mentioned previously.
  • There are no restrictions on H2H traffic because the network assigns the majority of its resources to it (rb(h) = 94), while only processing an average of 50 requests every time interval (λ(h) = 50), with scr(h) = 100% and ru(h) = 53%.

6.3. CHANAL Scenarios, Results, and Discussions

We will test our suggested solution “CHANAL”, which runs in different modes depending on M2M traffic intensity, to address the network limitation issue and address the service completion rate degradation depicted in Figure 8 and Figure 9.

6.3.1. CHANAL Normal Scenario

We consider the same distinct storms of λ(m) ∈ {5,10,15,20,25} and with a constant H2H average arrival rate λ(h) = 25 while enabling the flexibility of the bandwidth till it absorbs all previous storms in order to demonstrate the adaptability of our CHANAL under normal settings. Table 5 shows that we can eliminate all M2M storms with a 100% completion rate (scr(m) = 100%) by changing the number of resources from rb(m) = 6 used normally in a typical LTE-M network to rb(m) = 30 promoted in CHANAL. While this is going on, H2H traffic shows no signs of deterioration with a constant scr(h) = 100% since there are sufficient resources set aside for it.

6.3.2. CHANAL Disaster Scenario

In emergency situations, we assume receiving storms that are identical to past storms but gradually falling into the range of λ(m) ∈ {5,15,30,50,75}. We also estimate that we will receive a double constant H2H average arrival rate, λ(h) = 50, and we will keep the bandwidth flexible until it absorbs all prior storms.
The results shown in Table 6 reveal that by adapting the number of resources from rb(m) = 6, typically used in a regular LTE-M network, to rb(m) = 72) promoted in CHANAL, we can eliminate all M2M storms with a completion rate of 96–100%.
Meanwhile, H2H traffic does not reveal any degradation from E1-E4 with a constant (scr(h) = 100%) due to having enough resources reserved for H2H traffic.
For H2H traffic, there is just one issue in the “worst-case scenario” when the completion rate decreases to 56% (scr(h) = 56%), since the system reserves 72 resource blocks for M2M traffic, which satisfies 96% of M2M requests.
However, this flaw might be considered acceptable since the worst-case scenario with an accumulative storm happens rarely, and when it occurs, it lasts for a short period of time. Actually, if a disaster case lasts for a long period of time, many operators usually take the decision to ban some H2H traffic (e.g., watching a movie online) in order to allow emergency traffic to be exchanged easily. Therefore, in this case, our solution could be a good replacement for the total elimination of the H2H traffic strategy, as it keeps H2H traffic working with a 56% completion rate while supporting 96% of M2M requests. Additionally, M2M payloads are sent in the form of a small chunk of data in burst forms. Based on the emergency and traffic priority strategy, H2H traffic (e.g., video streaming, VoIP, etc.) is not as urgent as M2M traffic (e.g., health care, fire alarms, flooding sensors, etc.), which can be sent in a split second compared to the massive H2H traffic size.

7. Conclusions

A shared network may face several difficulties due to the presence of H2H and M2M traffic and their mutual effects, which lowers the network’s efficacy. The incompatibility patterns between H2H and M2M traffic are one of the main causes. In contrast to H2H traffic, M2M traffic is typically very homogeneous. However, heterogeneous traffic is likely to be received as accumulative traffic due to its synchronization behavior. Due to the exponential growth of M2M devices and the possibility of simultaneous payload transmission from all of these devices in an emergency, one of the primary problems facing mobile operators is the rapid saturation of the limited bandwidth for LTE-M networks, which will inevitably result in overload congestion issues.
We have modeled and simulated heterogeneous M2M and H2H traffic in this work, as well as the effects it has on both types of traffic. We have modeled the system behavior and examined the effects on H2H and M2M traffic using the Markov chain approach. Furthermore, as an expansion to the traditional CANAL, we have tried our new concept, named CHANAL. Until all M2M heterogeneous storms are absorbed, our CHANAL continuously increases the LTE-M bandwidth while decreasing the LTE-A bandwidth. Additionally, this technology offers a crucial means of resolving probable M2M storms, particularly in times of emergency and catastrophe.
Our simulation results show that using the classical eNodeB, the network will face a huge degradation in the service completion rate for M2M and H2H by reaching 8% in the worst-scenario case (λ(w) = 75). But using our CHANAL solution and leasing a maximum of 72 resources reserved for M2M traffic from the total network resources can result in a completion rate of 96% throughout the worst-case scenario.
In this paper, to clarify the main idea of our model, we have put aside the queuing phase. Discussing the potential latency caused by the limitation of the queue and the excessive number of requests will be the most crucial challenge that we will tackle in our future work.

Author Contributions

Conceptualization, A.H.E.F. and A.M.; methodology, A.H.E.F. and A.M.; software, A.H.E.F. and A.M.; validation, A.H.E.F., A.M. and A.N.; formal analysis, A.H.E.F. and A.M.; investigation, A.H.E.F., A.M. and A.N.; resources, A.H.E.F., A.M. and A.N.; data curation, A.H.E.F. and A.M.; writing—original draft preparation, A.H.E.F.; writing—review and editing, A.H.E.F., A.M. and A.N.; visualization, A.H.E.F. and A.M.; supervision, A.M.; project administration, A.M.; funding acquisition, A.M. All authors have read and agreed to the published version of the manuscript.

Funding

This research received no external funding.

Institutional Review Board Statement

Not applicable.

Informed Consent Statement

Not applicable.

Data Availability Statement

Data are contained within the article.

Conflicts of Interest

The authors declare no conflicts of interest.

References

  1. Almutiri, T.; Farrukh, N. Markov Models Applications in Natural Language Processing: A Survey. Int. J. Inf. Technol. Comput. Sci. 2022, 14, 1–16. [Google Scholar] [CrossRef]
  2. van Otterlo, M.; Wiering, M. Reinforcement Learning and Markov Decision Processes. In Reinforcement Learning Adaptation, Learning, and Optimization; Springer: Berlin/Heidelberg, Germany, 2012; Volume 12. [Google Scholar] [CrossRef]
  3. Hongman, L. Research on Construction Cost Estimation of Highway Engineering Based on Markov Chain. J. Liaoning Univ. Technol. (Nat. Sci. Ed.) 2023, 43, 201–205. [Google Scholar]
  4. Wu, J. Post-epidemic market share forecast analysis of Chinese e-commerce giants based on Markov chain. J. Taiyuan Urban Vocat. Coll. 2023, 680, 26–28. [Google Scholar]
  5. Guo, H. Predictive Research of Power Impulse Noise Based on Markov Chain. Ind. Control Comput. 2022, 36, 140–141. [Google Scholar]
  6. Leigh, J.; Jackson, L.; Dunnett, S.; Lugo, H.; Sharpe, R.; Neal, A.; West, A. Modelling manufacturing processes using Markov chains. In Proceedings of the 27th European Safety and Reliability Conference ESREL, Portoroz, Slovenia, 18–22 June 2017; pp. 2497–2502. [Google Scholar]
  7. Shi, J.; Liu, C.; Hong, X.; Wang, C.-X. Coexistence of delay-sensitive MTC/HTC traffic in large scale networks. Sci. China Inf. Sci. 2017, 60, 100302. [Google Scholar] [CrossRef]
  8. Elmangoush, A.; Corici, A.A.; Steinke, R.; Corici, M.; Magedanz, T. Magedanz. A Framework for Handling Heterogeneous M2M Traffic. Procedia Comput. Sci. 2015, 63, 112–119. [Google Scholar] [CrossRef]
  9. Heavy Reading. Mobile Network Outages Service Degradations, Survey Analysis. 2016. Available online: https://www.spirent.com/newsroom/press-releases/02-22-16_heavy-reading-report-mobile-network-outages (accessed on 25 July 2024).
  10. Gudkova, I.; Samouylov, K.; Buturlin, I.; Borodakiy, V.; Gerasimenko, M.; Galinina, O.; Andreev, S. Analyzing impacts of coexistence between M2M and H2H communication on 3GPP LTE system. In Proceedings of the International Conference on Wired/Wireless Internet Communications, Paris, France, 27 May 2014; pp. 162–174. [Google Scholar]
  11. El Fawal, A.H.; Najem, M.; Mansour, A.; Le Roy, F.; Le Jeune, D. CTMC modeling for M2M/H2H coexistence in LTE-A/LTE-M networks. J. Eng. (JoE) 2018, 2018, 1954–1962. [Google Scholar]
  12. Adas, A. Traffic models in broadband networks. IEEE Commun. Mag. 1997, 35, 82–89. [Google Scholar] [CrossRef]
  13. SimuLTE Modeler Version (0.9.1). Available online: https://omnetpp.org/download-items/SimuLTE.html (accessed on 25 July 2024).
  14. OPNET Modeler. Available online: https://www.riverbed.com/sg/products/steelcentral/opnet.html (accessed on 25 July 2024).
  15. The OMNeT++ Community. OMNeT++: Discrete Event Simulation in C++, GitHub. Available online: https://github.com/omnetpp/omnetpp (accessed on 25 July 2024).
  16. Xinjie, C.; Tan, T.; Subramanian, K. Source traffic modeling in OPNET. In Proceedings of the OPNETWORK, Washington, DC, USA, 30 August–3 September 1999. [Google Scholar]
  17. Wang, Y.P.E.; Lin, X.; Adhikary, A.; Grovlen, A.; Sui, Y.; Blankenship, Y.; Bergman, J.; Razaghi, H.S. A Primer on 3GPP Narrowband Internet of Things. IEEE Commun. Mag. 2017, 55, 117–123. [Google Scholar] [CrossRef]
  18. Mathworks Website, M/M/1 Queuing System. Available online: https://www.mathworks.com/help/simevents/examples/m-m-1-queuing-system.html (accessed on 25 July 2024).
  19. Hassan, H.; Garcia, J.; Bockstal, C. Aggregate traffic models for VoIP applications. In Proceedings of the IEEE International Conference on Digital Telecommunications (ICDT’06), Côte d’Azur, France, 30 August 2006; p. 70. [Google Scholar]
  20. Laner, M.; Nikaein, N.; Drajic, D.; Svoboda, P.; Popovic, M.; Krco, S. Traffic models for machine-to-machine M2M communications: Types and applications. In Machine-to-Machine Communications, Architecture, Performance and Applications? Dolher, M., Anton, C., Eds.; Woodhead Publishing: Sawston, UK, 2014; Available online: https://www.eurecom.fr/publication/4265 (accessed on 25 July 2024).
  21. 3GPP. Study on RAN Improvements for Machine-Type Communications, Technical Report, TR 37.868. 2012. Available online: https://portal.3gpp.org/desktopmodules/Specifications/SpecificationDetails.aspx?specificationId=2630 (accessed on 25 July 2024).
  22. Heffes, H.; Lucantoni, D. A Markov modulated characterization of packetized voice and data traffic and related statistical multiplexer performance. IEEE J. Sel. Areas Commun. 1986, 4, 856–868. [Google Scholar] [CrossRef]
  23. Paiva, R.C.; Vieira, R.D.; Saily, M. Random access capacity evaluation with synchronized MTC users over wireless networks. In Proceedings of the IEEE 73rd Vehicular Technology Conference (VTC2011-Spring), Budapest, Hungary, 16 May 2011; pp. 1–5. [Google Scholar]
  24. El Fawal, A.H.; Mansour, A.; Najem, M.; Le Roy, F.; Le Jeune, D. CTMC modeling for M2M/H2H coexistence in a NB-IoT Adaptive eNodeB. In Proceedings of the 11th IEEE International Conference on Internet of Things (iThings 2018), Halifax, Canada, 1 August 2018. [Google Scholar]
  25. El Fawal, A.H.; Mansour, A.; Najem, M.; Le Roy, F.; Le Jeune, D. Adaptive LTE-M eNodeB for Emergency Scenarios. In Proceedings of the 8th International Conference on Information and Communication Technologies Convergence ICTC, Jeju Island, Republic of Korea, 18–20 October 2017. [Google Scholar]
  26. Le-Ngoc, T.; Shah-Heydari, S. MMPP Modeling of Aggregated ATM Traffic. In Proceedings of the IEEE Canadian Conference on Electrical and Computer Engineering, Waterloo, ON, Canada, 27 May 1998; pp. 129–132. [Google Scholar]
  27. MLaner; Svoboda, P.; Nikaein, N.; Rupp, M. Traffic models for machine type communications. In Proceedings of the Tenth International Symposium on Wireless Communication Systems (ISWCS), Ilmenau, Germany, 28 August 2013. [Google Scholar]
  28. Lauridsen, M.; Kovacs, I.Z.; Mogensen, P.; Sorensen, M.; Holst, S. Coverage and Capacity Analysis of LTE-M and NB-IoT in a Rural Area. In Proceedings of the 2016 IEEE 84th Vehicular Technology Conference (VTC-Fall), Montreal, ON, Canada, 18–21 September 2016. [Google Scholar]
  29. G. T. 45.820. (2015, November) Cellular System Support for Ultra Low Complexity and Low Throughput Internet of Things, v.13.1.0. Available online: https://www.etsi.org/deliver/etsi_tr/145000_145099/145050/13.01.00_60/tr_145050v130100p.pdf (accessed on 25 July 2024).
  30. Shao, H. Theory of Markov chain and its application in several representative examples. Theor. Nat. Sci. 2024, 38, 184–189. [Google Scholar] [CrossRef]
  31. Alqahtani, S. Performance analysis of cognitive-based radio resource allocation in multi-channel LTE-A networks with M2M/H2H coexistence. IET Commun. 2017, 11, 655–663. [Google Scholar] [CrossRef]
Figure 1. The predicted arrival rate utilizing 3GPP Models 1 and 2 over time for both synchronized and non-synchronized M2M traffic.
Applsci 14 08561 g001
Figure 2. An interpretation of MMPP for M2M traffic, where λ(m) is the mean arrival rate of a Poisson process.
Applsci 14 08561 g002
Figure 3. MMPP model where each state S(m) in the Markov chain represents a mean arrival rate λ(m), and m is the total number of states. The transition probabilities between states of the chain, from S(m) to S(m+1), are represented by the variables p(m,m−1).
Applsci 14 08561 g003
Figure 4. Flow chart for CHANAL model.
Applsci 14 08561 g004
Figure 5. Regular eNodeB in a normal scenario, where the variation in the scr value is based on the values of both λ(m) and λ(h).
Applsci 14 08561 g005
Figure 6. Regular eNodeB in a dense scenario, where the variation in the scr value is based on the values of both λ(m) and λ(h).
Applsci 14 08561 g006
Figure 7. In the worst-case scenario, the values of both λ(m) and λ(h) determine how the scr value varies for a regular eNodeB.
Applsci 14 08561 g007
Figure 8. In a normal cycle scenario, the regular eNodeB is represented by scr, the service completion rate, and λ(m), the average arrival rate for M2M traffic.
Applsci 14 08561 g008
Figure 9. Regular eNodeB in an emergency situation, where scr is the service completion rate and λ(m) is the average arrival rate for M2M traffic.
Applsci 14 08561 g009
Table 1. Example of M2M storms when M = 3.
Group #M2M Device TypeMessage Size
(Bytes)
Rate
(msg/Day)
Number of Devices
(Kilo)
Storm Rate
(Kbps)
Number of Storms
(Storm/Day)
1Asset tracking50100201600500
2Assisted
medical
100820320040
3Environment
monitoring
20024206400120
Table 2. Comparison between CHANAL and CANAL models.
Model CharacteristicsCHANALCANAL
Heterogeneity trafficEnabledDisabled
Homogeneity trafficDisabledEnabled
Synchronization behaviorEnabledDisabled
Real-time behaviorDisabledEnabled
FIFO queuingEnabledDisabled
Random/standard queueDisabledEnabled
Table 3. Description of notations and parameters used in simulations.
NotationValueDescription
rb(m)6Resource blocks reserved for M2M
rb(h)94Resource blocks reserved for H2H
λ(m){5, 10, 15, 20, 25}Average arrival rate for M2M
λ(h)constantAverage arrival rate for H2H
μ(m)1Completion rate for M2M
μ(h)1Completion rate for H2H
n0Queue size for H2H
o0Queue size for M2M
t1000 Simulation time (seconds)
Table 4. State representations.
NotationValueState
p1P0c0S(0,0)
p2P1c0S(1,0)
p3P2c0S(2,0)
p4P3c0S(3,0)
p5P0c1S(0,1)
p6P0c2S(0,2)
p7P0c3S(0,3)
p8P1c1S(1,1)
p9P1c2S(1,2)
p10P2c1S(2,1)
Table 5. The adaptivity of CHANAL in normal cases.
Group No.λ(m)rb(m)rb(h)scr(h)scr(m)
15694100100
2101288100100
3151882100100
4202476100100
5253070100100
Table 6. The adaptivity of CHANAL in emergency cases.
Group #λ(m)rb(m)rb(h)scr(h)scr(m)
emergency 15694100100
emergency 2151882100100
emergency 3303070100100
emergency 450485210096
worst-case7572285696
Disclaimer/Publisher’s Note: The statements, opinions and data contained in all publications are solely those of the individual author(s) and contributor(s) and not of MDPI and/or the editor(s). MDPI and/or the editor(s) disclaim responsibility for any injury to people or property resulting from any ideas, methods, instructions or products referred to in the content.

