Article

Comprehensive Characterization and Metamorphic Control Analysis of Full Apertures in Different Coal Ranks within Deep Coal Seams

1
College of Environment and Civil Engineering, Chengdu University of Technology, Chengdu 610059, China
2
School of Intelligent Manufacturing and Electronic Engineering, Wenzhou University of Technology, Wenzhou 325006, China
3
Key Laboratory of Rock Mechanics and Geohazards of Zhejiang Province, Shaoxing 312000, China
*
Author to whom correspondence should be addressed.
Appl. Sci. 2024, 14(18), 8566; https://doi.org/10.3390/app14188566
Submission received: 8 August 2024 / Revised: 18 September 2024 / Accepted: 19 September 2024 / Published: 23 September 2024

Abstract

:
The pore fracture structure of deep coal reservoirs is crucial for evaluating the potential of deep coalbed methane resources, conducting exploration and development, and controlling coal mine gas disasters. Mercury intrusion porosimetry, the liquid nitrogen method, and the low-temperature carbon dioxide adsorption method were used to study the full pore size structure and pore fractal characteristics of different coal grades in deep coal and comprehensively characterize the pore structure of kilometer-level coal mining. The sponge, Frenkel–Halsey–Hill (FHH), and density function models were applied to comprehensively analyze the pore complexity of coal, and the influence of metamorphic degree on pore size structure was evaluated. The distribution relationship of pore volume in different stages of coal samples was macropore→mesopore→micropore, and macropores had the best connectivity. Micropores and mesopores had the largest specific surface area, and the development of micropores and microcracks controlled the deep gas adsorption performance. The micropore volume and specific surface area both revealed a nonlinear decreasing trend with the increase in volatile matter, and coal metamorphism promoted the development of micropores. The pore volume and specific surface area of mesopores and macropores decreased first and then increased in a “U” shape with increasing volatile matter. In contrast, the fractal dimension D1 revealed an inverted U shape with increasing volatile matter, followed by a decrease. The D2 value decreased nonlinearly with increasing volatile matter, whereas the D3 value increased nonlinearly with increasing volatile matter. The degree of metamorphism increased, and the microporous structure became more regular.

1. Introduction

Coal is highly heterogeneous and porous [1,2,3,4], and gas adsorption and desorption primarily occur on its surface. Studying the pore size, pore structure, and pore fractal of coal is key to predicting, evaluating, and developing coalbed methane, as well as controlling coal mine gas disasters. At present, two main research methods are applied to the pore structure of coal, destructive and nondestructive testing. The destructive testing method involves injecting a fluid medium at high pressure or adsorbing it at a low temperature into the pores of coal and determining the pore volume of coal by calculating the volume of the fluid medium; examples include the widely used mercury intrusion method, liquid nitrogen adsorption method, and low-temperature carbon dioxide adsorption method. However, after the high-pressure or low-temperature fluid medium enters the sample, some of the original pores are destroyed. Nondestructive testing involves techniques such as microscope observation and X-ray detection to study the pores inside the coal body without intervening, such as optical microscopy, atomic force microscopy, field emission electron microscopy, environmental scanning electron microscopy, X-ray computed tomography, nuclear magnetic resonance, and small-angle X-ray scattering. However, this method suffers from low accuracy, large errors, and poor adaptability and needs to be combined with traditional methods. Traditional Euclidean geometry can describe objects with smooth and homogeneous surfaces, but accurately characterizing the degree of roughness is difficult [5]. It was not until 1975 that Mandelbrot established fractal geometry theory [6,7], which accurately characterized rough-shaped objects and became an important method for describing the complexity of the coal pore structure. Chen X. et al. [8] used sponge models to analyze the fractal characteristics of the coal pore structure at different degrees of metamorphism. Wang X.J. et al. [9] used a thermodynamic fractal model to obtain the fractal dimension of coal seepage pores. Yang S.Y. et al. [10] quantitatively explored the pore structure characteristics and influencing factors of permeable pores in coal reservoirs using the Scherpinski model. Liu H.Q. et al. [11] used capillary models to analyze the complexity of pore structures in the 5-2 coal seam of the Haiwan Coal Mine and the 1 central coal seam of the Gubei Coal Mine. Xue H.T. et al. [12] used the Frenkel–Halsey–Hill (FHH) model to study the relationship between the micropore fractal characteristics of prominent coal in western Guizhou and its adsorption performance and permeability. Zhou S.D. et al. [13] analyzed the adsorption pore characteristics of low-rank coal through fractal analysis using the Brunauer–Emmett–Teller (BET) model. Xiong Y.H. et al. [14] compared and analyzed the fractal characteristics of coal and shale microporous structures based on the pore size distribution density function model.
Progress has been made in the research on the pore structure of coal, but some shortcomings persist. (1) Existing research results focus on shallow coal seams that are currently being mined, but the pore structure of deep coal bodies, especially those buried at a depth of thousands of meters, has received little attention, and achievements are few. (2) The current pore size structure testing methods have certain limitations and applicability, and the ability of a single pore size characterization method to accurately determine the pore size structure parameters of coal is limited. Meanwhile, the pore system inside the coal body is very complex, with significant differences in pore width, making it easier to characterize macropores and mesopores. However, research on the characterization of the full pore-size structure of coal, including micropores, mesopores, and macropores, remains scarce. (3) The current research on the fractal law of pores often adopts one or two fractal methods for analysis. Comprehensively and effectively evaluating the complexity of coal pores is difficult, and research on the fractal characteristics of full aperture structures is scarce.
To fill this gap and provide a necessary reference for deep mining, testing methods, such as mercury intrusion porosimetry, liquid nitrogen adsorption, and low-temperature carbon dioxide adsorption, are performed in this study to characterize the pore structure of deep coal, analyze and study the full pore size distribution characteristics and pore fractal characteristics of different coal rank coals, and further analyze the influence of metamorphic degree on the pore structure of deep coal.

2. Methods and Models

2.1. Sample Source and Basic Parameters

The test coal sample was taken from the main coal seam of a kilometer-level mine and tested based on the industrial analysis indicators of coal in GB/T212-2008, “Industrial Analysis Methods for Coal” [15]. The coal types were classified according to GB 5751-2009, “China Coal Classification” [16], and the test results are listed in Table 1.
The XJE sample was collected from the 210,913 coal face of the 9 # coal seam in Xinjier Mine, which has a coal seam thickness of 0–2.59 m, with an average of 0.92 m, and a coal seam dip angle of 5–41°, with an average of 20°. The structure of coal seam 9 is relatively simple and is shared by the majority of unstable but productive coal seams. Its roof and floor are composed of mudstone or sandy mudstone.
The PML sample was collected from the 22,310 coal face of the Wu8 # coal seam in Pingmeiliu Mine, which has a coal seam thickness of 0–3.72 m (1.86 m on average) and an inclination angle of 6–8°. The coal seam is stable and comprises a relatively large part of the mineable coal seam. The top of the Wu8 coal seam is gray black–dark gray sandy mudstone with star-shaped mica flakes, and the bottom has a light shade of sandy mudstone interbedded with thin layers of fine sandstone.
The HYS sample was collected from the 705 coal face of the 7th coal seam in Hongyangsan Mine, which has a dip angle of 5–10°. The 7 # coal seam is located above the sandstone at the bottom of the Shanxi Formation and has a mudstone roof and a siltstone or sandstone floor.
The LXK sample was collected from the 1021-2 coal face of the 12th coal seam in Linxi Mine. This seam is stable, with an average thickness of 2.5 m and an average dip angle of 16–30°. The overlying rock layers consist of fine sandstone, medium fine sandstone, and mudstone.

2.2. Methods and Plans

2.2.1. Mercury Intrusion Method

The mercury intrusion method is often utilized to test the pore size distribution of mesopores and macropores larger than 3 nm. Its mechanism involves the capillary force between liquid mercury and coal in the coal capillary pores, and high pressure is used to overcome resistance and inject liquid mercury into the pores. The pore volume related to the pore width is calculated based on the amount of mercury injected [17]. The relationship between pore size and mercury pressure is as follows:
r = 2 σ cos θ p × 10 14
where r is the pore radius, Å; σ is the surface tension of mercury, N/Å; θ is the wetting edge angle; and p is the mercury pressure, MPa.
Before the experiment, the test sample was dried at 378.15 K for 10 h, and the system was vacuum-degassed for 12 h to eliminate gas interference. In accordance with GB T 21650.1-2008, “Pore Size Distribution and Porosity of Solid Materials by Mercury Porosimetry and Gas Adsorption.Part 1: Mercury Porosimetry” [18], the test was completed using the AutoPore IV 9500 V1.09 mercury intrusion porosimeter.

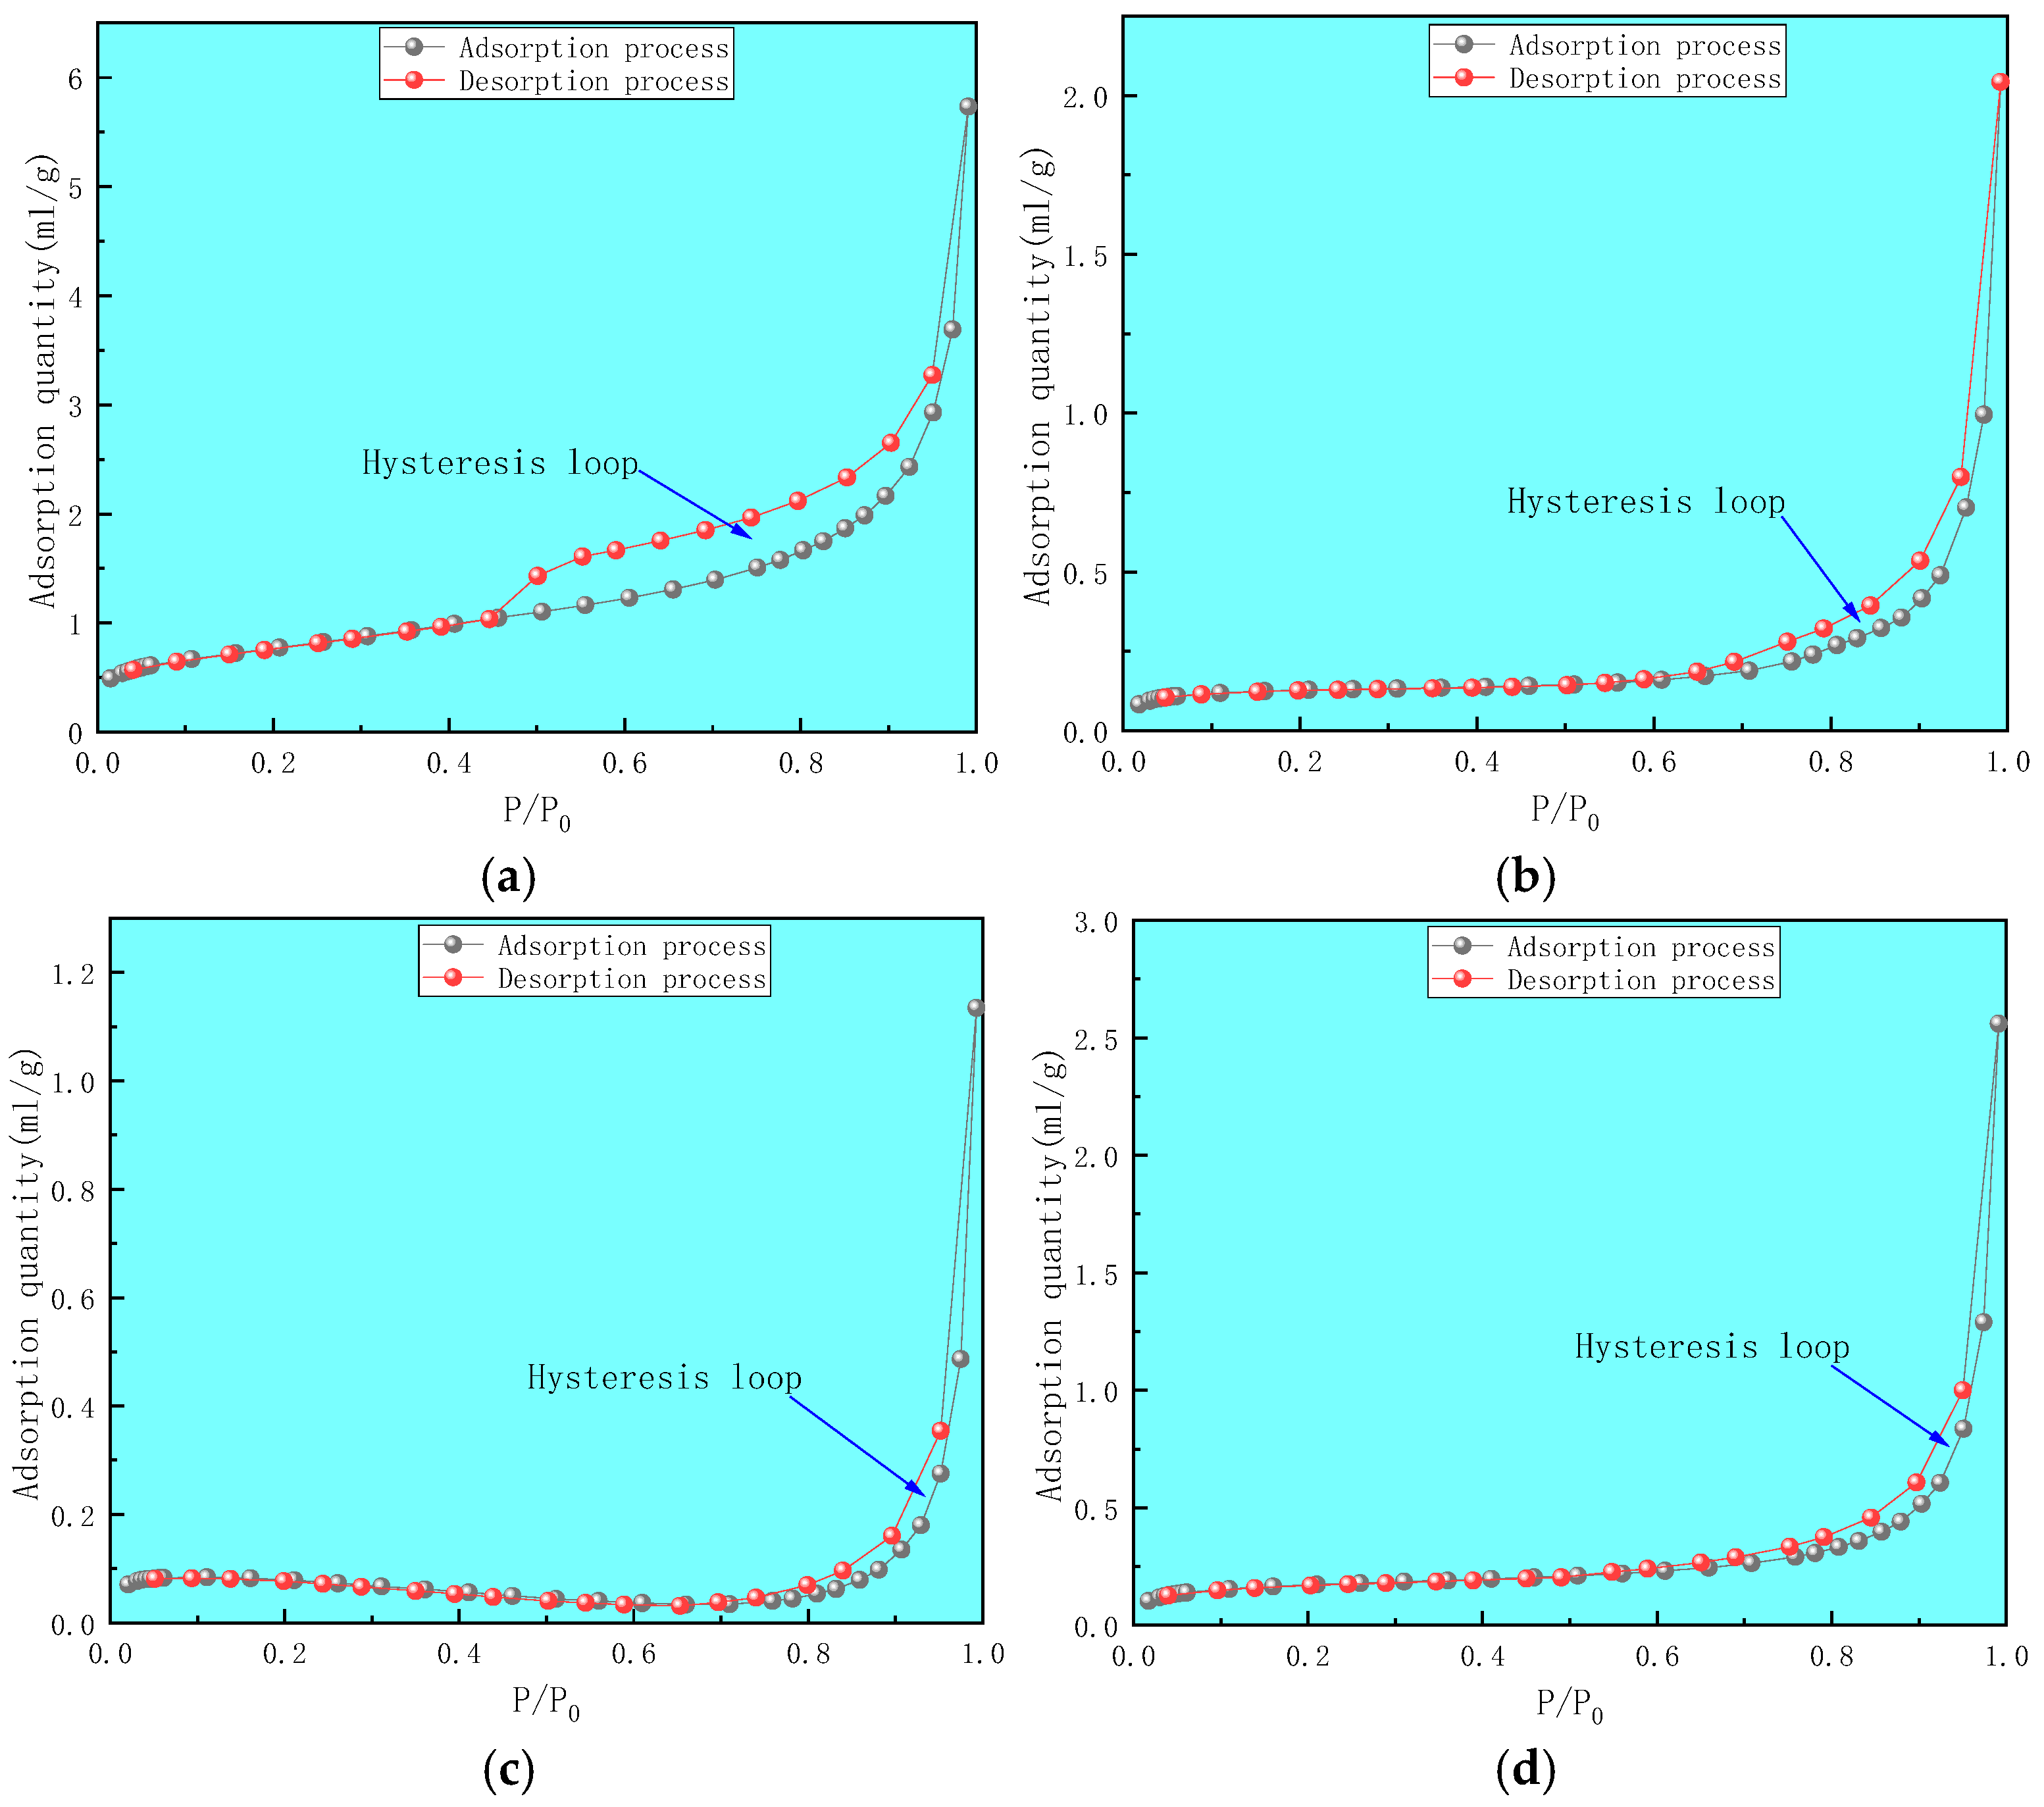
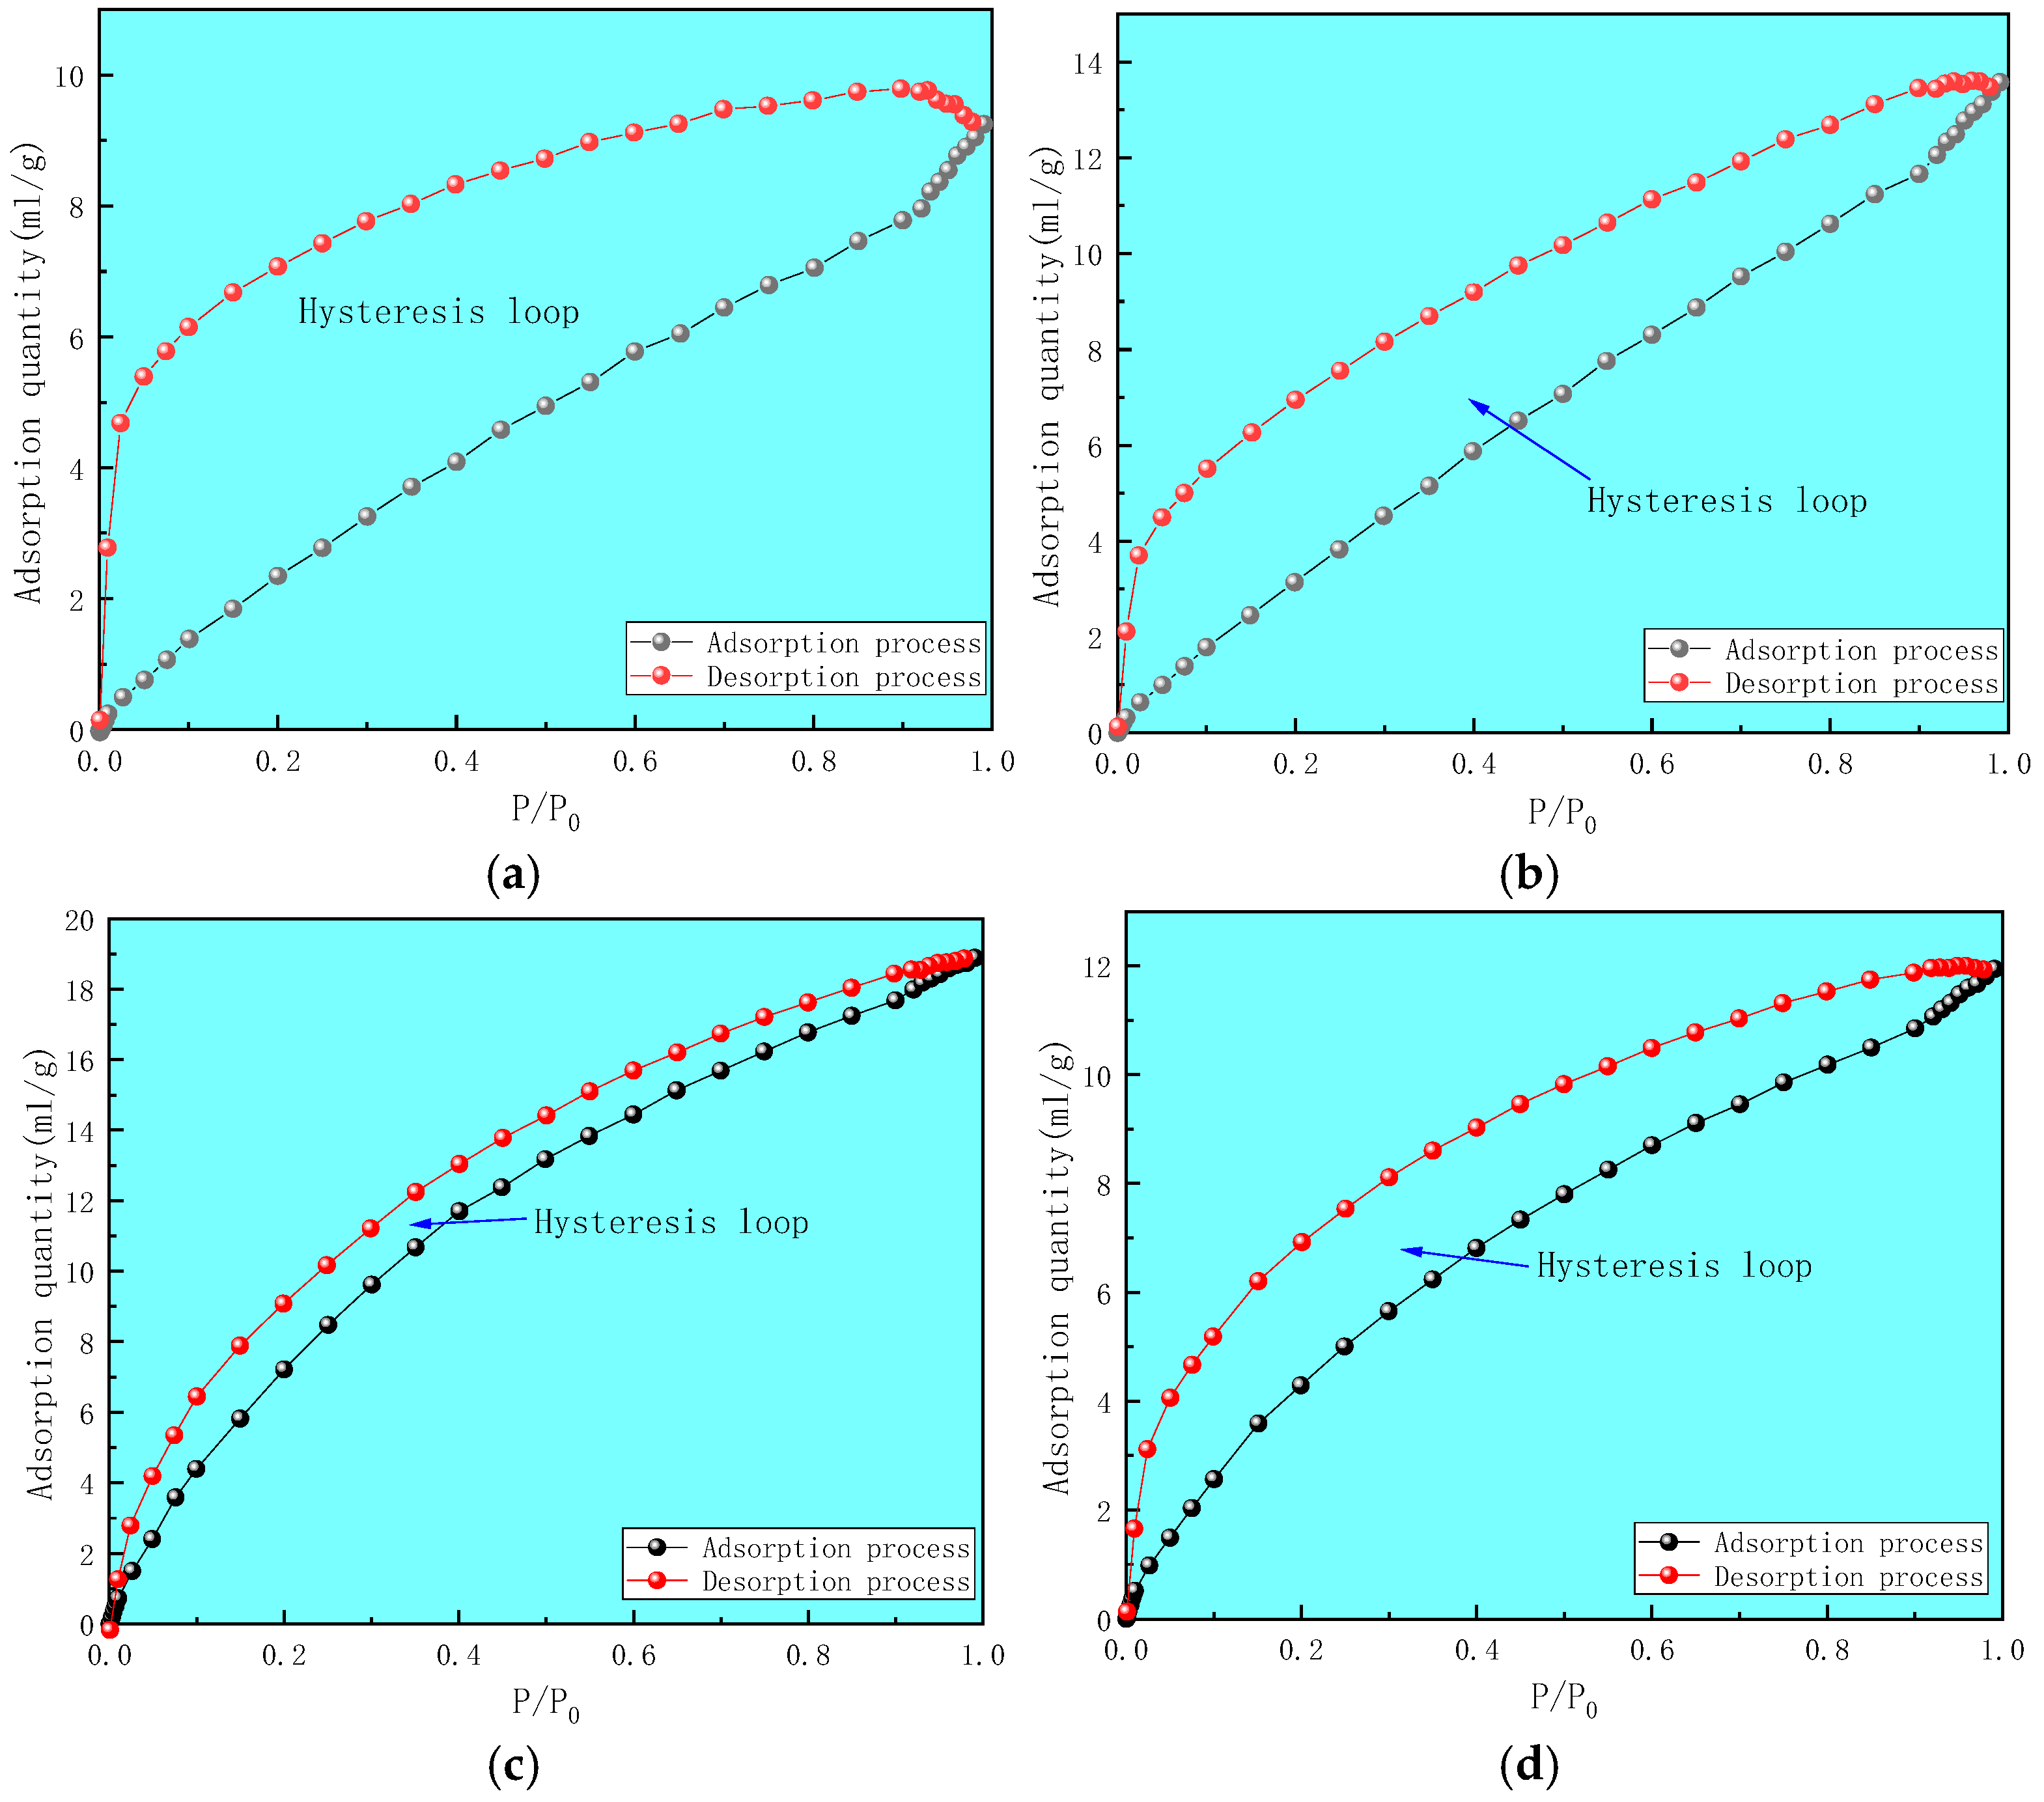
2.2.2. Liquid Nitrogen Adsorption Method

The liquid nitrogen adsorption method is mainly used to analyze the pore size structure of mesoporous samples. The BET and Barret–Joyner–Halenda models were used to calculate the specific surface area and pore volume distribution of coal samples by measuring the variation in nitrogen adsorption capacity with relative stress at 77.35 K [19].
The purity of nitrogen was 99.99%, the test temperature was 77.35 K, and the relative pressure (gas pressure/saturated vapor pressure) was 0.010–0.995. The test process followed the GB T 21650.2-2008, “Pore Size Distribution and Porosity of Solid Materials by Mercury Porosimetry and Gas Adsorption. Part 2: Analysis of Mesopores and Macropores by Gas Adsorption” [20], and the measurement was performed using an Autosorb iQ fully automatic physical adsorption instrument.

2.2.3. Low-Temperature Carbon Dioxide Adsorption Method

The micropores of carbon molecules with diameters ranging from 0.5 nm to 1 nm need to be filled at a relative pressure ranging between 10−7 and 10−5. However, this corresponds to a slow diffusion rate and adsorption equilibrium, whereas the CO2 adsorbate can be quickly filled and reaches adsorption equilibrium at 273.15 K and 3.48 MPa of saturated vapor pressure. Therefore, the low-temperature carbon dioxide adsorption method is typically used to test the pore size structure of micropores with a width of less than 2 nm [21].
The Autosorb iQ fully automatic physical adsorption instrument was utilized, with reference to the standard GB/T 21650.3-2011, “Pore size distribution and porosity of solid materials by mercury porosimetry and gas adsorption. Part 3: Analysis of micropores by gas adsorption” [22], for the purpose of testing. Approximately 2 g of the sample was initially weighed and loaded into a sample tube.
Vacuum degassing was conducted for 12 h, and 99.99% high-purity CO2 was used as the adsorbent for adsorption experiments at a temperature of 273.15 K.

2.3. Pore Fractal Model

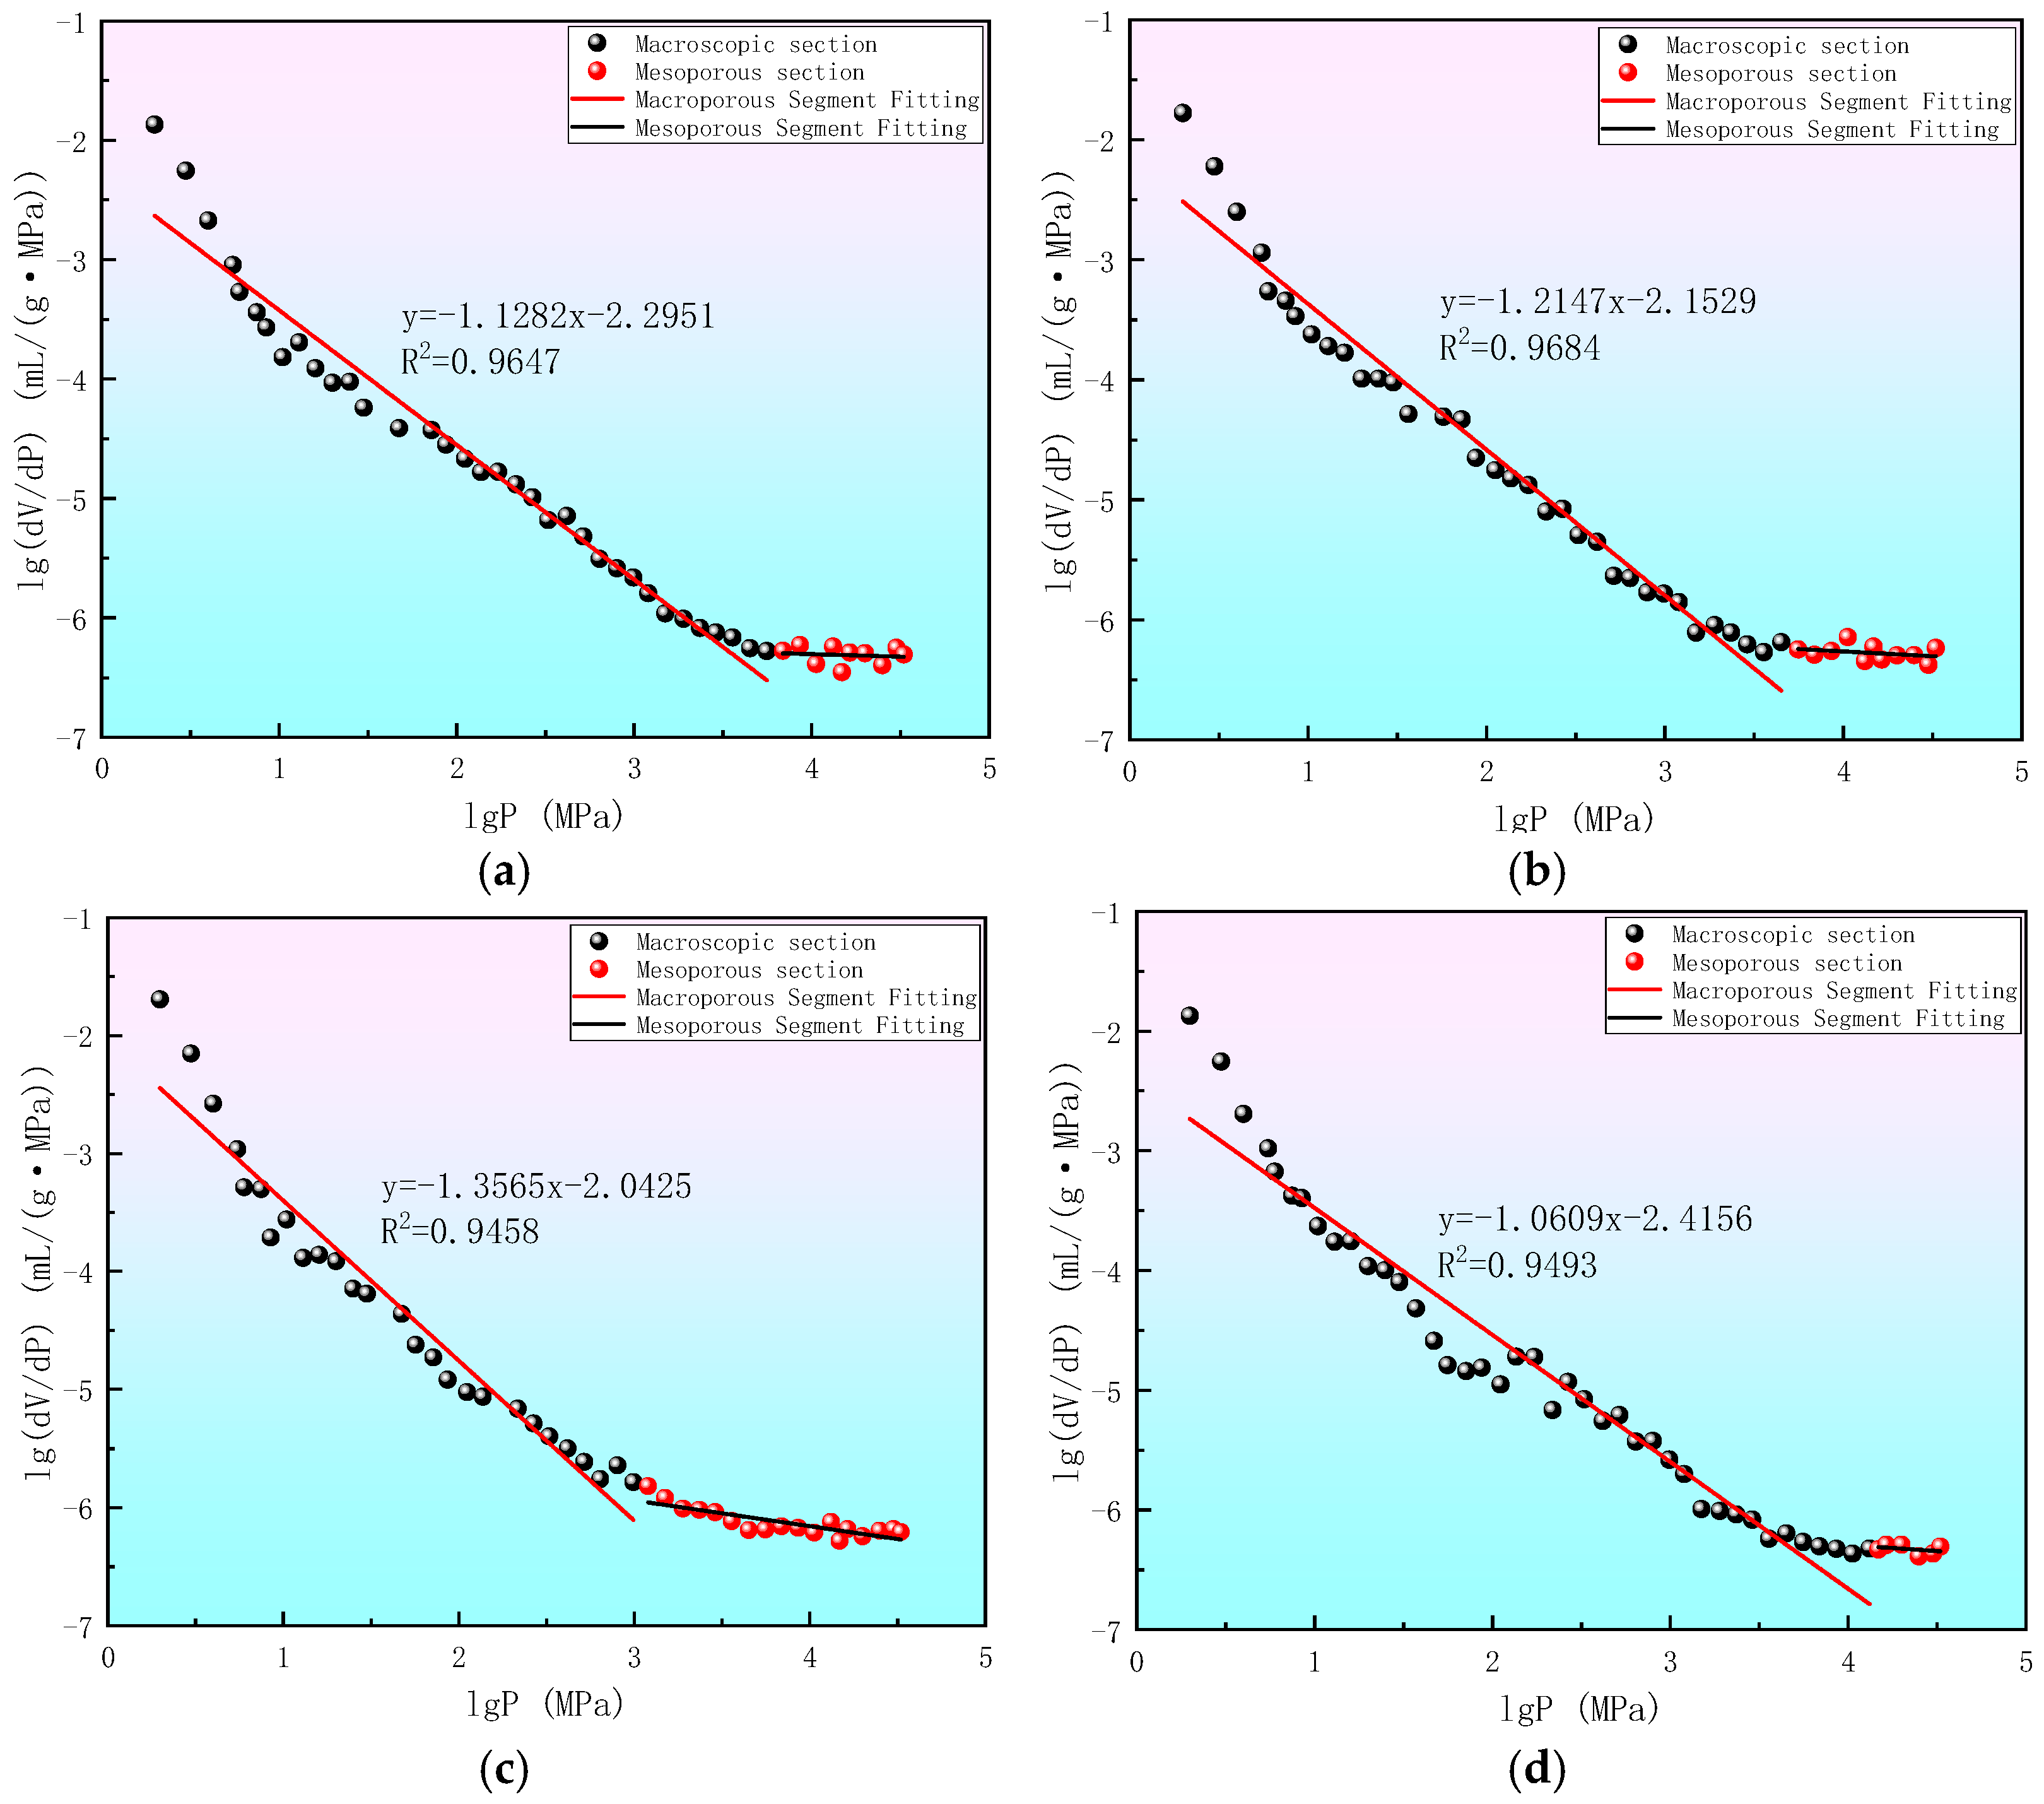
2.3.1. Sponge Model Based on the Mercury Intrusion Method

The sponge model [23] assumes that the initial element is a cube with a length of R on one side, and it evenly distributes m3-generating elements. Discarding n, the remaining number of generating elements is as follows:
N b 1 = m 3 n
After k repeated calculations, the remaining number of generated elements is as follows:
N b k = m 3 n k
The side length is as follows:
r k = R / m k
The number of generated elements is represented as follows:
N b k = r k R D
where D is the fractal dimension of the porous medium, which ranges from 2 to 3. The formula is expressed as follows:
D = l g N b 1 / l g m
The larger the value, the rougher the surface of the porous medium, and vice versa.
The total volume of the cube is as follows:
V k = r k 3 N b k = r k 3 D R D
If k is satisfied, then V k V r is satisfied, where V r is the skeleton volume of the porous medium.
Then, taking the derivative of Equation (7) yields the following:
d V / d r r 2 D
According to Equation (1), as follows:
P = 0.7354 / r
After differentiation, as follows:
P d r + r d P = 0
Substituting into Equation (4) yields the following:
d V / d P r 2 × r 2 D r 4 D
Taking the logarithm on both sides yields the following:
l o g ( d V / d P ) ( 4 D ) l o g r ( D 4 ) l o g P
From this, scatter plots can be drawn using l o g ( d V / d P ) and l o g P , and the fractal dimension D can be calculated using the slope.

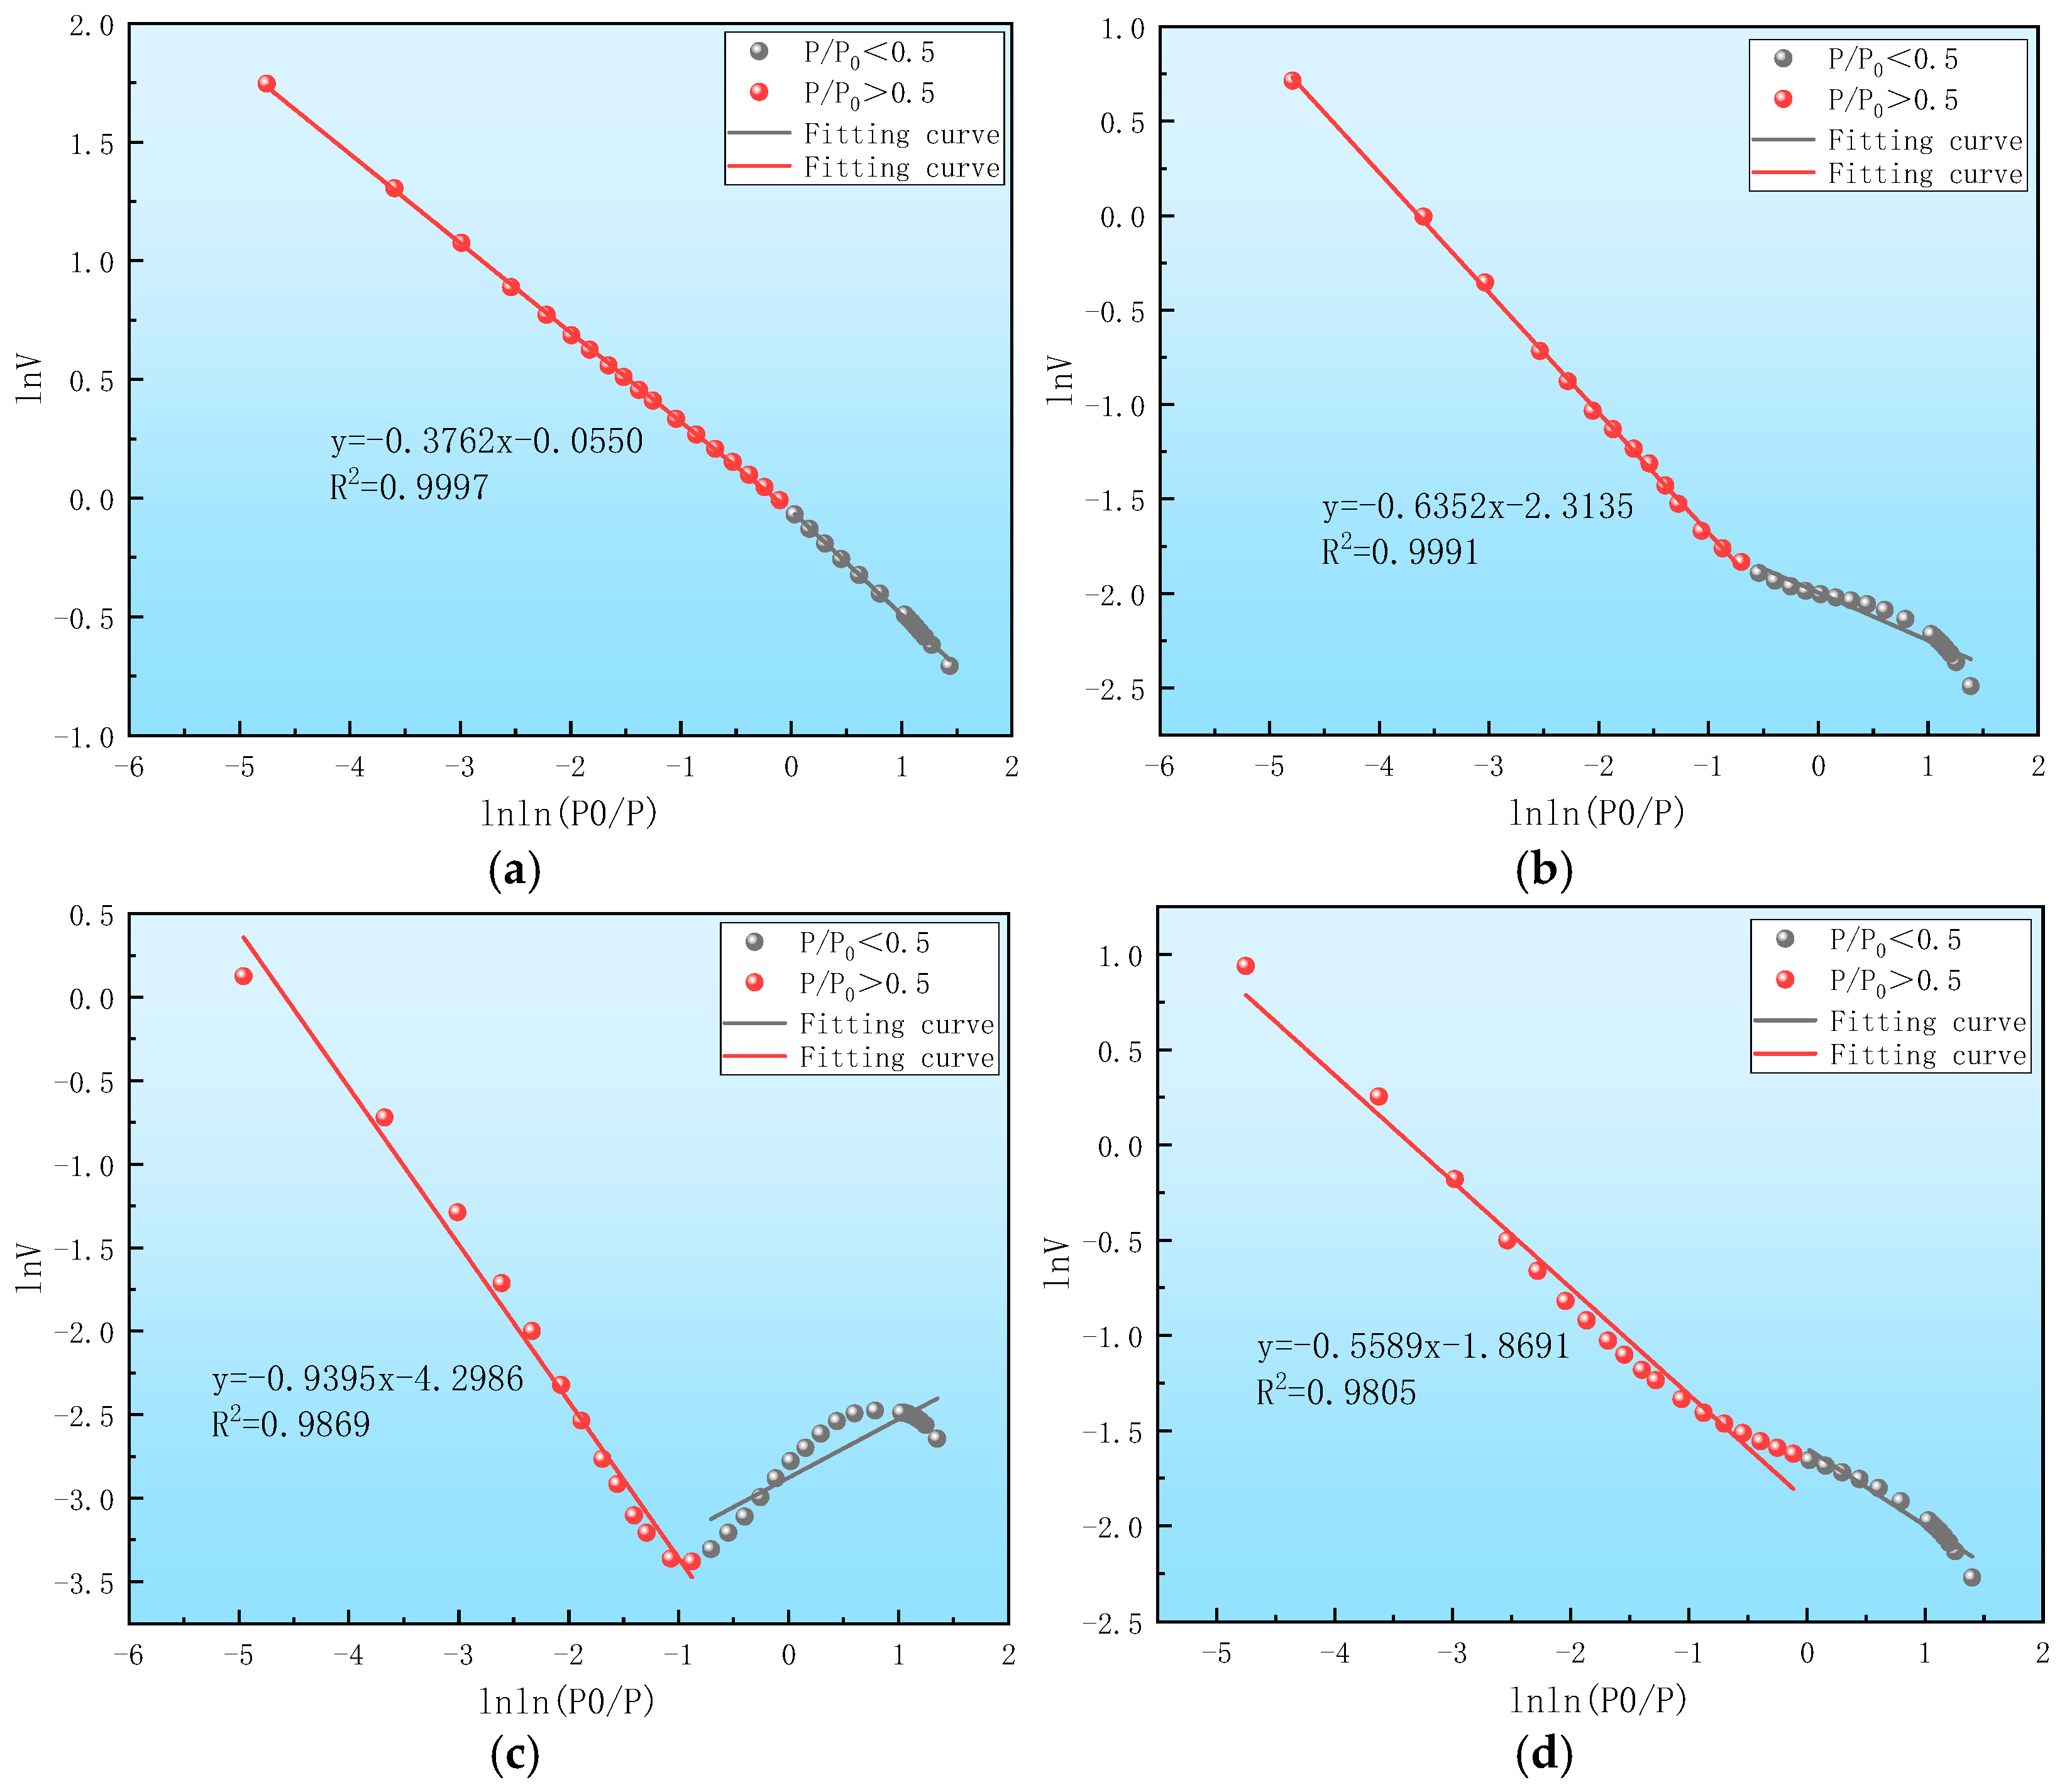
2.3.2. FHH Model Based on Liquid Nitrogen Method

PFEIFER et al. [24] first proposed the FHH model, whereas Avnir et al. [25] combined the adsorption potential theory to construct a gas adsorption model on fractal surfaces within capillary condensation regions for studying gas molecule adsorption in heterogeneous porous media [26]. This model has since been widely used for fractal dimension calculation in porous media.
ln V = K ln [ ln ( P 0 P ) ] + C
D = K + 3
where V is the adsorption capacity of liquid nitrogen, m L / g ; P 0 is the saturated vapor pressure of gas adsorption, M P a ; C is the equilibrium pressure for liquid nitrogen adsorption; D is a constant; E is the slope of curve F; G is the fractal dimension, ranging from 2 to 3. The larger the value, the rougher the surface of the porous medium, and vice versa.

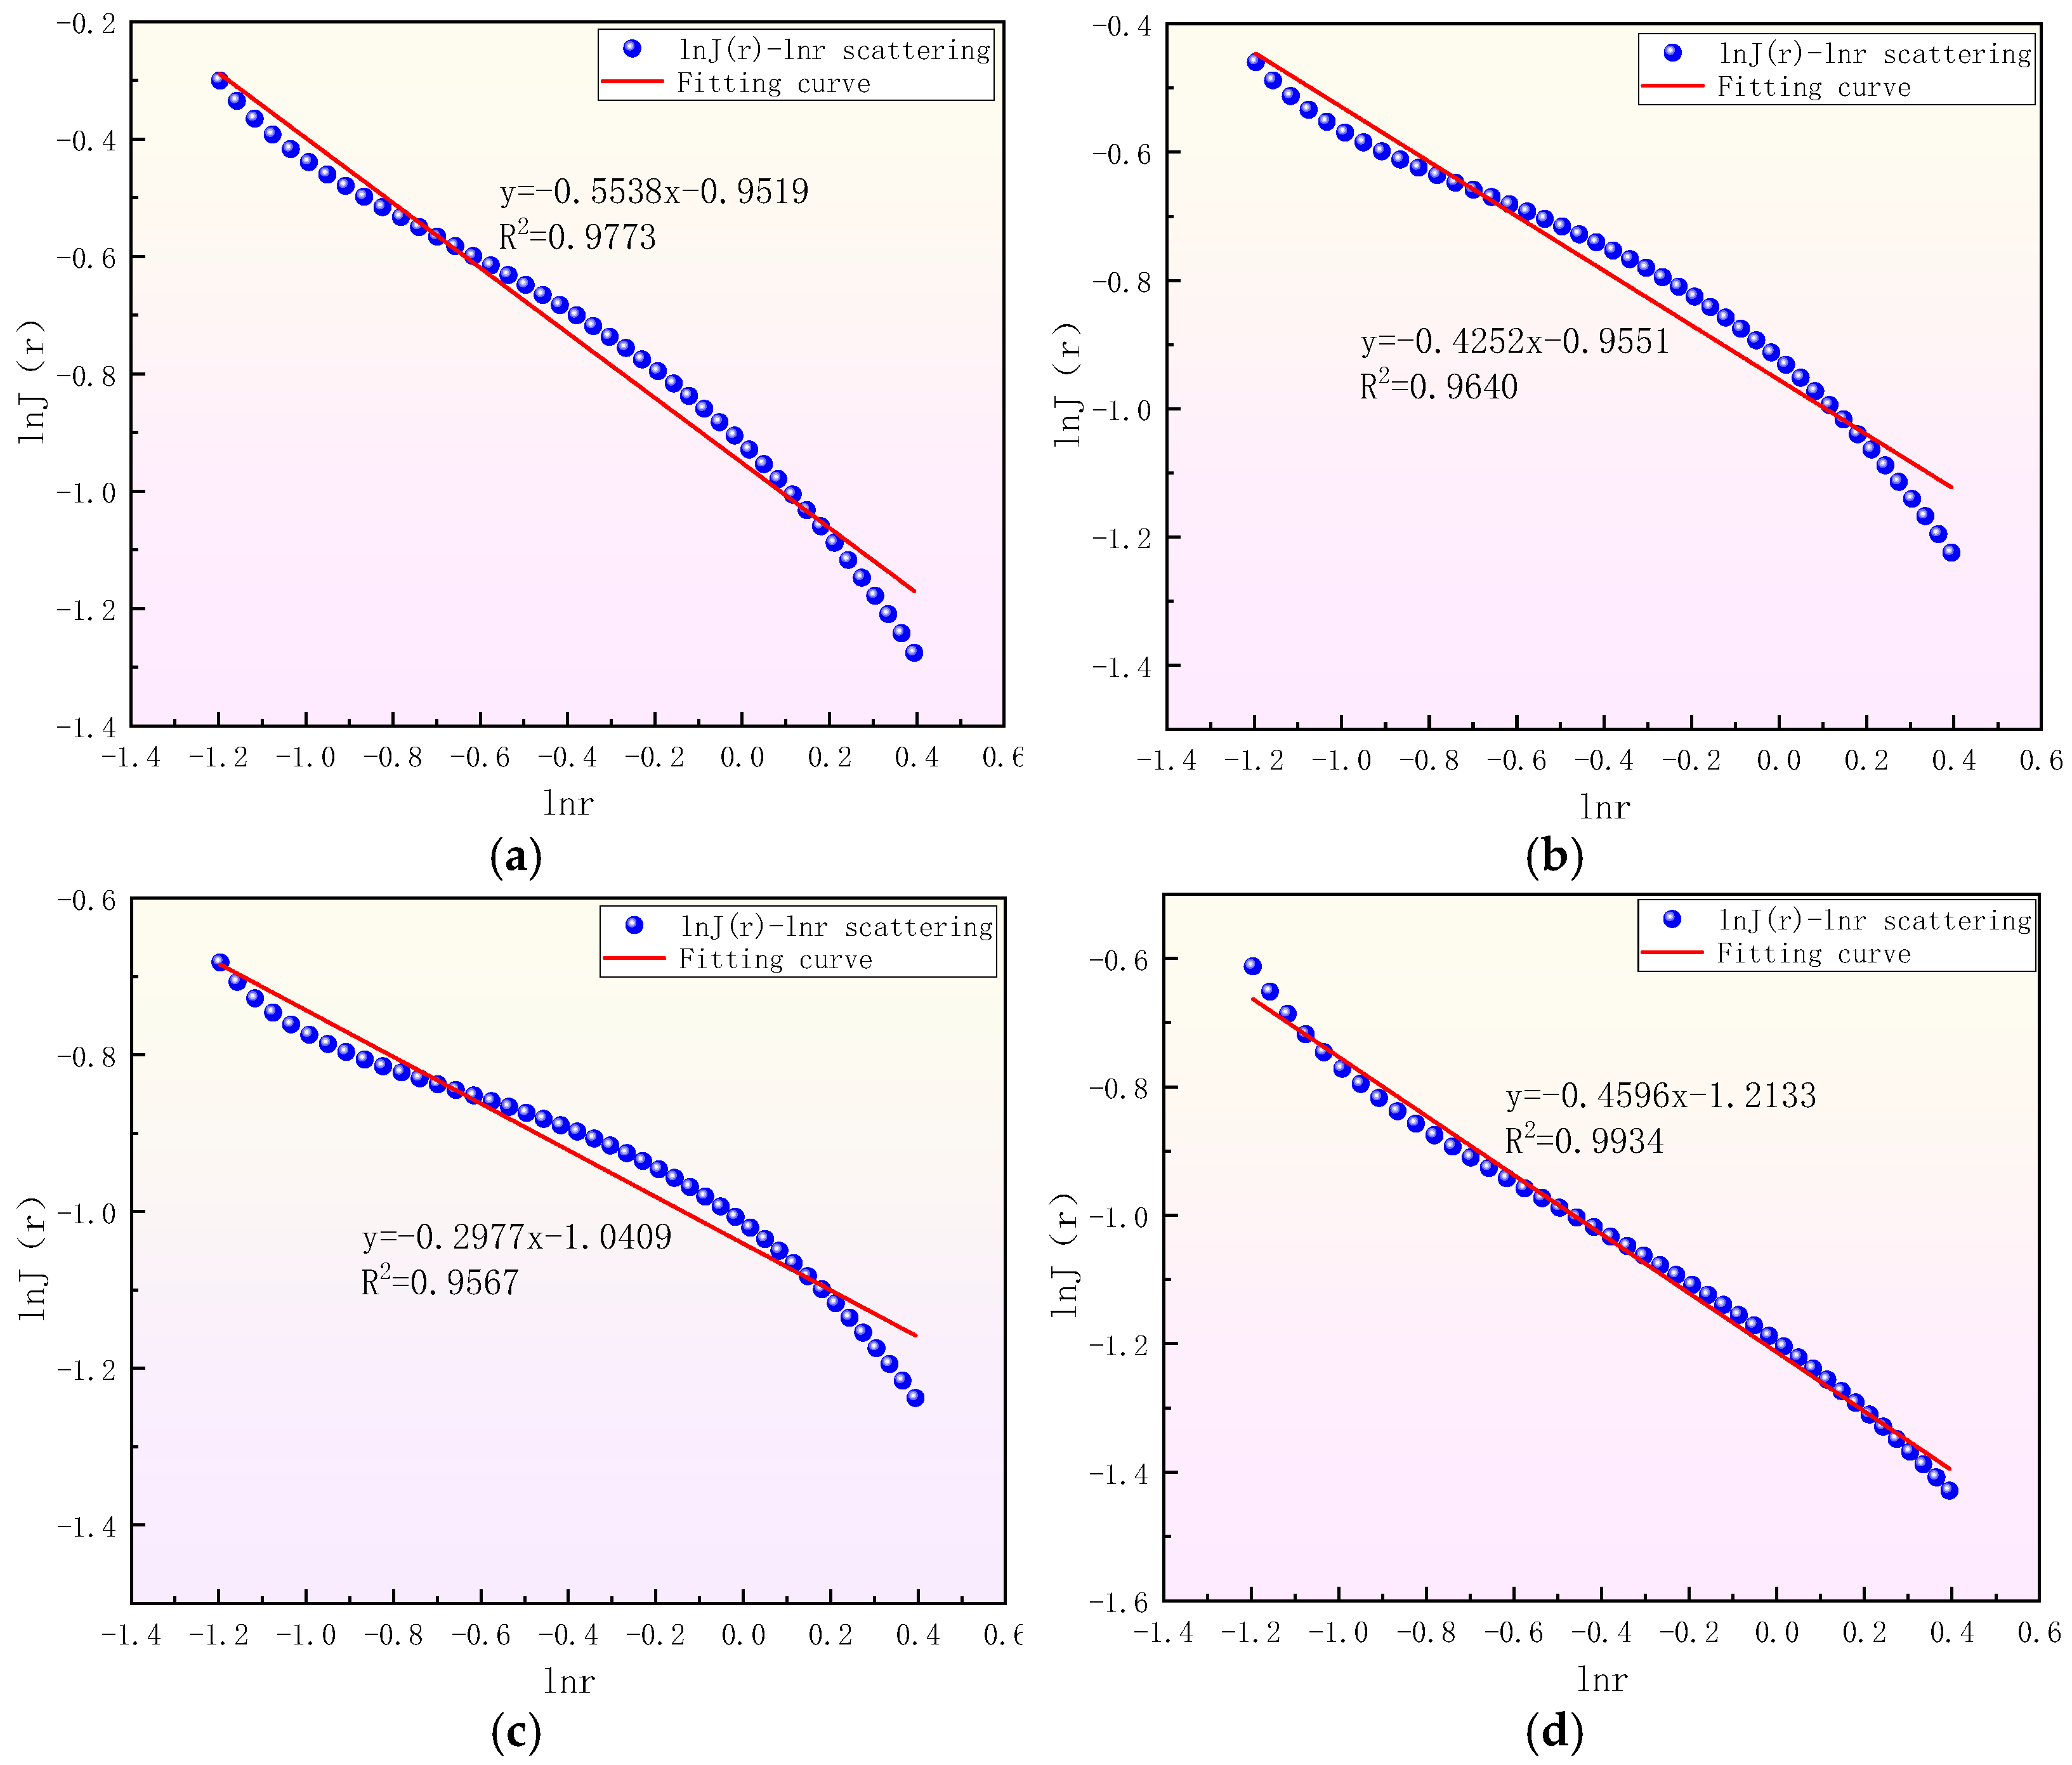
2.3.3. Density Function Model Based on the Carbon Dioxide Adsorption Method

Assuming that the aperture is a monotonically increasing function expressed as follows:
r = r x
The aperture distribution density function [27,28] can be expressed as follows:
J ( r ) = F ( x ) d x d r
x = 1 / E
In the formula, E is the adsorption characteristic energy, kJ/mol and F ( x ) is the normalized distribution function of x .
Jaroniec M [29] represented the heterogeneity distribution function of microporous structures based on the gamma distribution function as follows [14,30]:
F ( x ) = 3 ρ υ Γ ( υ 3 ) x υ 1 e ( ρ x ) 3
where ρ is the scale parameter of the distribution function, kJ/mol; υ is the shape parameter of the distribution function, dimensionless; and Γ x is the gamma function, and the equation is as follows:
Γ x = 0 + t x 1 e t d t
Stoeckli et al. [31] established a functional relationship between the pore size and adsorption characteristic energy of micropores, with a pore width of 0.44 nm or more. The empirical formula is as follows:
r = 2852.5 E 3 + 15 E 1 + 0.014 E 0.75
Or
r = 2852.5 x 3 + 15 x + 0.014 x 1 0.75
By combining Equations (16)–(19) and (21), the expression for the density function of pore size distribution in heterogeneous solid materials can be obtained as follows [28,29]:
J ( r ) = 3 ρ υ x υ 1 e ρ x 3 Γ υ 3 ( 8557.5 x 2 0.014 x 2 + 15 )
The relevant parameters ρ and υ in Equation (22) can be obtained from the D-R equation. Dubinin et al. [32] believed that the adsorption process of micropores is the filling of their internal volume, which is different from the single-layer adsorption on the pore wall surface. The pore-filling degree can be used to characterize the size of the adsorption capacity, as follows:
V V 0 = e x p ( A β E ) 2
In the formula, V is the adsorption capacity of the adsorbate at relative pressure P P 0 , cm3/g; V 0 is the maximum adsorption capacity of the adsorbate, cm3/g; β is the affinity coefficient, with carbon dioxide taken as 0.38; and A is the adsorption potential, kJ/mol, expressed as follows:
A = R T l n P 0 P
In the formula, R is the gas constant, taken as 8.314 J/(mol·K); T is the thermodynamic temperature, K; P is the adsorption equilibrium pressure, MPa; and P 0 is the saturated vapor pressure, MPa.
Substituting Equation (24) into Equation (23) yields the DR equation, as follows:
V = V 0 e x p ( R T β E ) 2 ( l n P 0 P ) 2
Jaroniec et al. [14,29,33] proposed, according to the DR equation, that the adsorption characteristics of micropores in heterogeneous solids satisfy the following integral form:
V V 0 = 0 e ( A x β ) 3 F ( x ) d x
Combining Equation (12) with Equation (26) yields the following [28]:
V V 0 = 1 + ( A β ρ ) 3 υ 3
Parameters ρ and υ can be obtained according to Equation (27).
JARONIE et al. [28] found that there is a good linear relationship between the pore size distribution function and pore size of nanoscale micropores, as follows:
ln J r = 2 D ln r + C
In the formula, D represents the fractal dimension and C is a constant.
From this, the fractal dimension D of micropores can be calculated using the linear relationship between ln J r and ln r .

3. Results

The pore structure of each group of coal samples was tested using mercury intrusion porosimetry, liquid nitrogen adsorption, and low-temperature carbon dioxide adsorption methods according to the aforementioned methods. The test results are shown in Figure 1, Figure 2 and Figure 3.
According to Figure 1, the mercury injection curves of the four coal samples have similar shapes, and the changes in the mercury injection curves exhibit three distinct conditions. When the mercury injection pressure reaches approximately 0.06 MPa, the amount of mercury injection increases sharply, and it first enters the macropores. When the pressure increases from 0.06 Mpa to approximately 34.50 Mpa, the curve changes relatively smoothly, and the coal continuously absorbs the kinetic energy of the injected mercury, whereas the liquid mercury further occupies relatively small pores. When the pressure exceeds 34.50 Mpa, the curve changes significantly again, the pore volume is further compressed, and liquid mercury enters smaller capillary pores. The mercury injection and removal curves do not overlap, and hysteresis is prominent due to the large and complex pore volume in coal. During the mercury injection stage, high-pressure liquid mercury can enter the open, semi-open, and partially closed pores, whereas, during the mercury removal stage, the liquid mercury enters the open and semi-open pores, with partially closed pores retaining some mercury. Figure 1a shows the mercury injection curve with a larger opening, faster changes in the mercury removal stage, better pore development, and the best connectivity.
There are certain differences in the morphology of the adsorption and desorption curves among the groups in Figure 2, but all exhibit hysteresis. According to the IUPAC classification of adsorption hysteresis loop standard types [34], (a) the figure belongs to the H3 type, resembling sheet-like stacked narrow slit pores; (b), (c), and (d) belong to the H4 type; and the hysteresis loop exhibits no adsorption limitation in the region, with narrow slit-like pores and high relative pressure. From the analysis of maximum adsorption capacity, the relationship of the strength of the liquid nitrogen adsorption capacity of each sample is XJE→LXK→PML→HYS. HYS (lean coal) with the highest degree of metamorphism has the weakest liquid nitrogen adsorption capacity, whereas XJE (gas coal) with the lowest degree of metamorphism has the strongest.
The relationship of the low-temperature carbon dioxide adsorption capacity of each sample in Figure 3 is XJE←LXK←PML←HYS, which is diametrically opposite to that in Figure 2. HYS, with the highest degree of metamorphism, has the strongest low-temperature carbon dioxide adsorption capacity, whereas XJE, with the lowest degree of metamorphism, has the weakest.
To facilitate quantitative analysis of pore size distribution, according to the classification standards of the International Union of Pure and Applied Chemistry [35], pores smaller than 2 nm are classified as micropores, pores between 2 nm and 50 nm are classified as mesopores, and pores larger than 50 nm are classified as macropores. The pore size distribution of the full pore volume and specific surface area measured using the three methods were calculated, and the results are presented in Table 2 and Figure 4 and Figure 5.
Table 2 and Figure 4 reflect the distribution of full aperture pore volume. Table 2 reveals that the pore volume of each sample stage is mainly distributed in the macroporous segment (accounting for 62.4060–67.9862%), followed by the mesoporous segment (27.4864–31.7487%), and the microporous segment is the least (3.2258–7.8195%). The pore volume curve distribution during the micropore (d ≤ 2 nm) stage, as shown in Figure 4a, is relatively flat, with only two peaks appearing, with the maximum peak being 8.845 × 10⁻⁴ mL/g. The pore volume distribution during the mesoporous stage (2 < d ≤ 50 nm) is relatively large, and multiple peaks appear during the stage, with the maximum peak being 3.287 × 10⁻³ mL/g. The pore volume distribution is most extensive in the macroporous stage (d > 50 nm), with a maximum value of 2.0 × 10⁻² mL/g for the full aperture of approximately 91,200 nm. Figure 4b shows the cumulative pore volume curve. During the micropore stage, the curve changes relatively smoothly, whereas in the mesopore stage, the curve slopes more sharply. In the macropore stage, the curve becomes steeper with increasing pore size, indicating a larger distribution of pore volume during this stage.
Table 2 and Figure 5 present the distribution of the specific surface area of the full pore size. As listed in Table 2, the specific surface area of each sample stage is mainly distributed in the microporous and mesoporous segments, with microporous segments accounting for 41.4061–66.8428%, mesoporous segments accounting for 32.4920–56.2841%, and microporous segments accounting for the lowest proportion of 0.6652–2.3098%. As shown in Figure 5a, the specific surface area curve of the micropores (d ≤ 2 nm) stage is widely distributed, and the peak frequency is high, with a maximum peak of 3.1336 m2/g. The specific surface area distribution during the mesoporous stage (2 < d ≤ 50 nm) is also relatively wide, with a maximum peak of 1.9819 m2/g. The distribution of specific surface area during the macroporous stage (d > 50 nm) is very small, with only two peaks, and the maximum peak is 0.0912 m2/g. Figure 5b shows that the curve within the microporous segment is the steepest, whereas the curves in the mesopore and macropore segments gradually become smoother as the pore size increases.

4. Discussion

4.1. The Influence of the Degree of Deterioration on Pore Volume and Specific Surface Area

Volatile matter reflects the degree of coal metamorphism, and the smaller the volatile matter, the higher the degree of coal metamorphism. To analyze the influence of metamorphic degree on the pore structure of coal, scatter plots of volatile matter and pore volume and specific surface area at various stages such as micropores, mesopores, and macropores were plotted, and the curves were fitted (as shown in Figure 6).
Figure 6 shows that both the micropore volume and specific surface area decrease with the increase in volatile matter, showing a nonlinear decreasing trend. Due to the metamorphism of coal, coal molecules undergo condensation and polymerization reactions, thus generating high polymers. The microstructure of the coal surface changes markedly, and the micropore volume and specific surface area increase with the degree of metamorphism. Moreover, the metamorphism of coal promotes the development of micropores. The pore volume and specific surface area of mesopores and macropores decrease first and then increase with the increase in volatile matter, and the curve is U-shaped, with the minimum value occurring at approximately 23% of volatile matter. Noticeably, the microporous, mesoporous, and macroporous structures of coal differ markedly with the degree of metamorphism.

4.2. Influence of Metamorphic Degree on Fractal Characteristics

When coal is heated to a specific temperature, some organic and mineral substances in the coal decompose, and the volatile components of coal, namely, the combustible gases, are released. Volatile matter is an important indicator of the degree of coal metamorphism. The smaller the amount of volatile matter, the higher the degree of coal metamorphism and the stronger the ability of the coal to adsorb gas [36]. Studying the relationship between the volatile matter and fractal dimension is crucial for understanding the influence of metamorphic degree on coal structure.
The fractal dimension of the test data of each group of samples was calculated using common fractal models, and the calculation results are presented in Figure 7, Figure 8 and Figure 9 and Table 3.
The full aperture fractal results reveal that the HYS sample (lean coal) with the highest degree of metamorphism had the smallest fractal dimension D1 (sponge model), the largest D2 (FHH model), and the smallest D3 (density function model), among which the complexity of pores was the highest. The XJE sample (gas coal) with the lowest degree of metamorphism had the highest fractal dimension D1, the lowest D2, and the highest D3. Moreover, the distribution of mesopores and throats was relatively regular. The relationship between volatile matter and fractal dimension (Figure 10) reveals that the fractal dimension D1 value based on the sponge model exhibits an inverted U-shaped trend with the increase in volatile matter, first increasing and then decreasing. The fractal dimension D2 value based on the FHH model decreased nonlinearly with the increase in volatile matter, and the higher the degree of metamorphism, the more complex the mesoporous structure becomes and the larger the fractal dimension. The fractal dimension D3 value based on the density function model increased nonlinearly with the increase in volatile matter, and the degree of metamorphism intensified, resulting in the development of a more regular microporous structure. Although the degree of metamorphism has different effects on fractal dimension, certain regular changes were consistently observed, indicating that the degree of metamorphism has a controlling effect on the evolution of pore fractal dimension.
This study observed a certain correlation between the metamorphic degree (or volatile matter) and pore volume, specific surface area, and fractal dimension. The different stages of the metamorphic evolution of coal seams at different depths inevitably cause marked changes in the pore structure of coal bodies. Research [5,37] has demonstrated that fractal dimension is related to the adsorption properties of coal. Therefore, fractal dimension can be used as an evaluation index for coal gas content and applied to hot topics, such as deep gas content prediction and gas prevention and control.

5. Conclusions

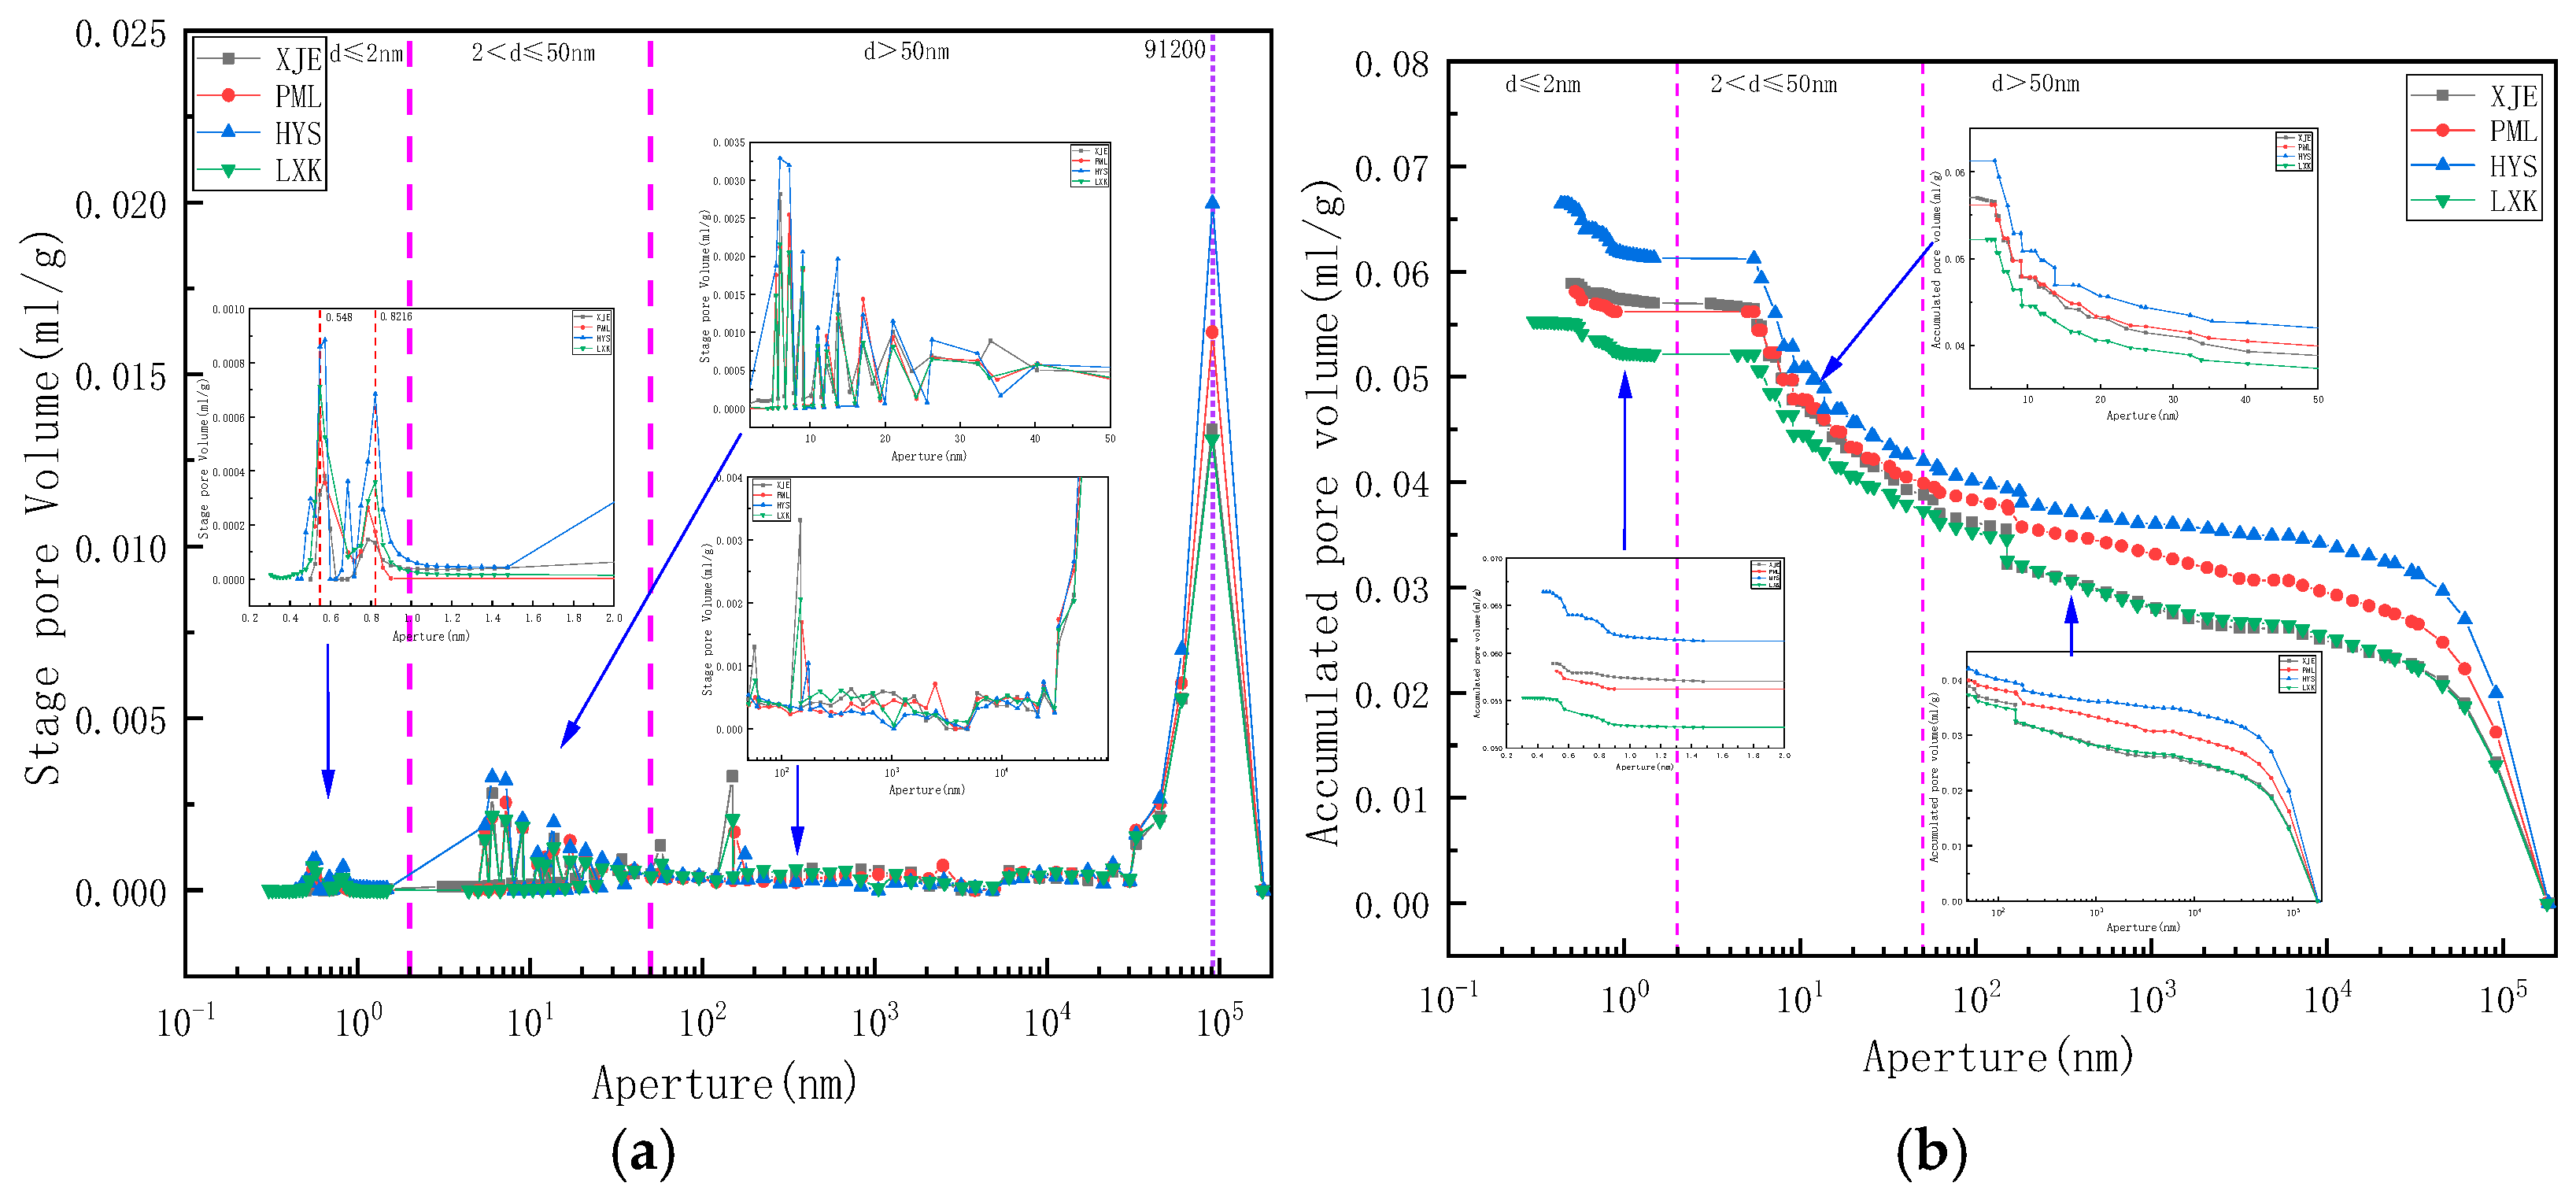
  • Using mercury intrusion porosimetry, liquid nitrogen adsorption, and low-temperature carbon dioxide adsorption methods to comprehensively characterize the full pore size of deep coal samples of different coal grades, the pore volume distribution relationship of each coal sample was found to be macropore→mesopore→micropore, indicating that the connectivity of macropores is relatively good. The specific surface area of micropores and mesopores is the main component, whereas the specific surface area of macropores is relatively small. The development characteristics of micropores and microcracks control the adsorption performance and development potential of deep gas.
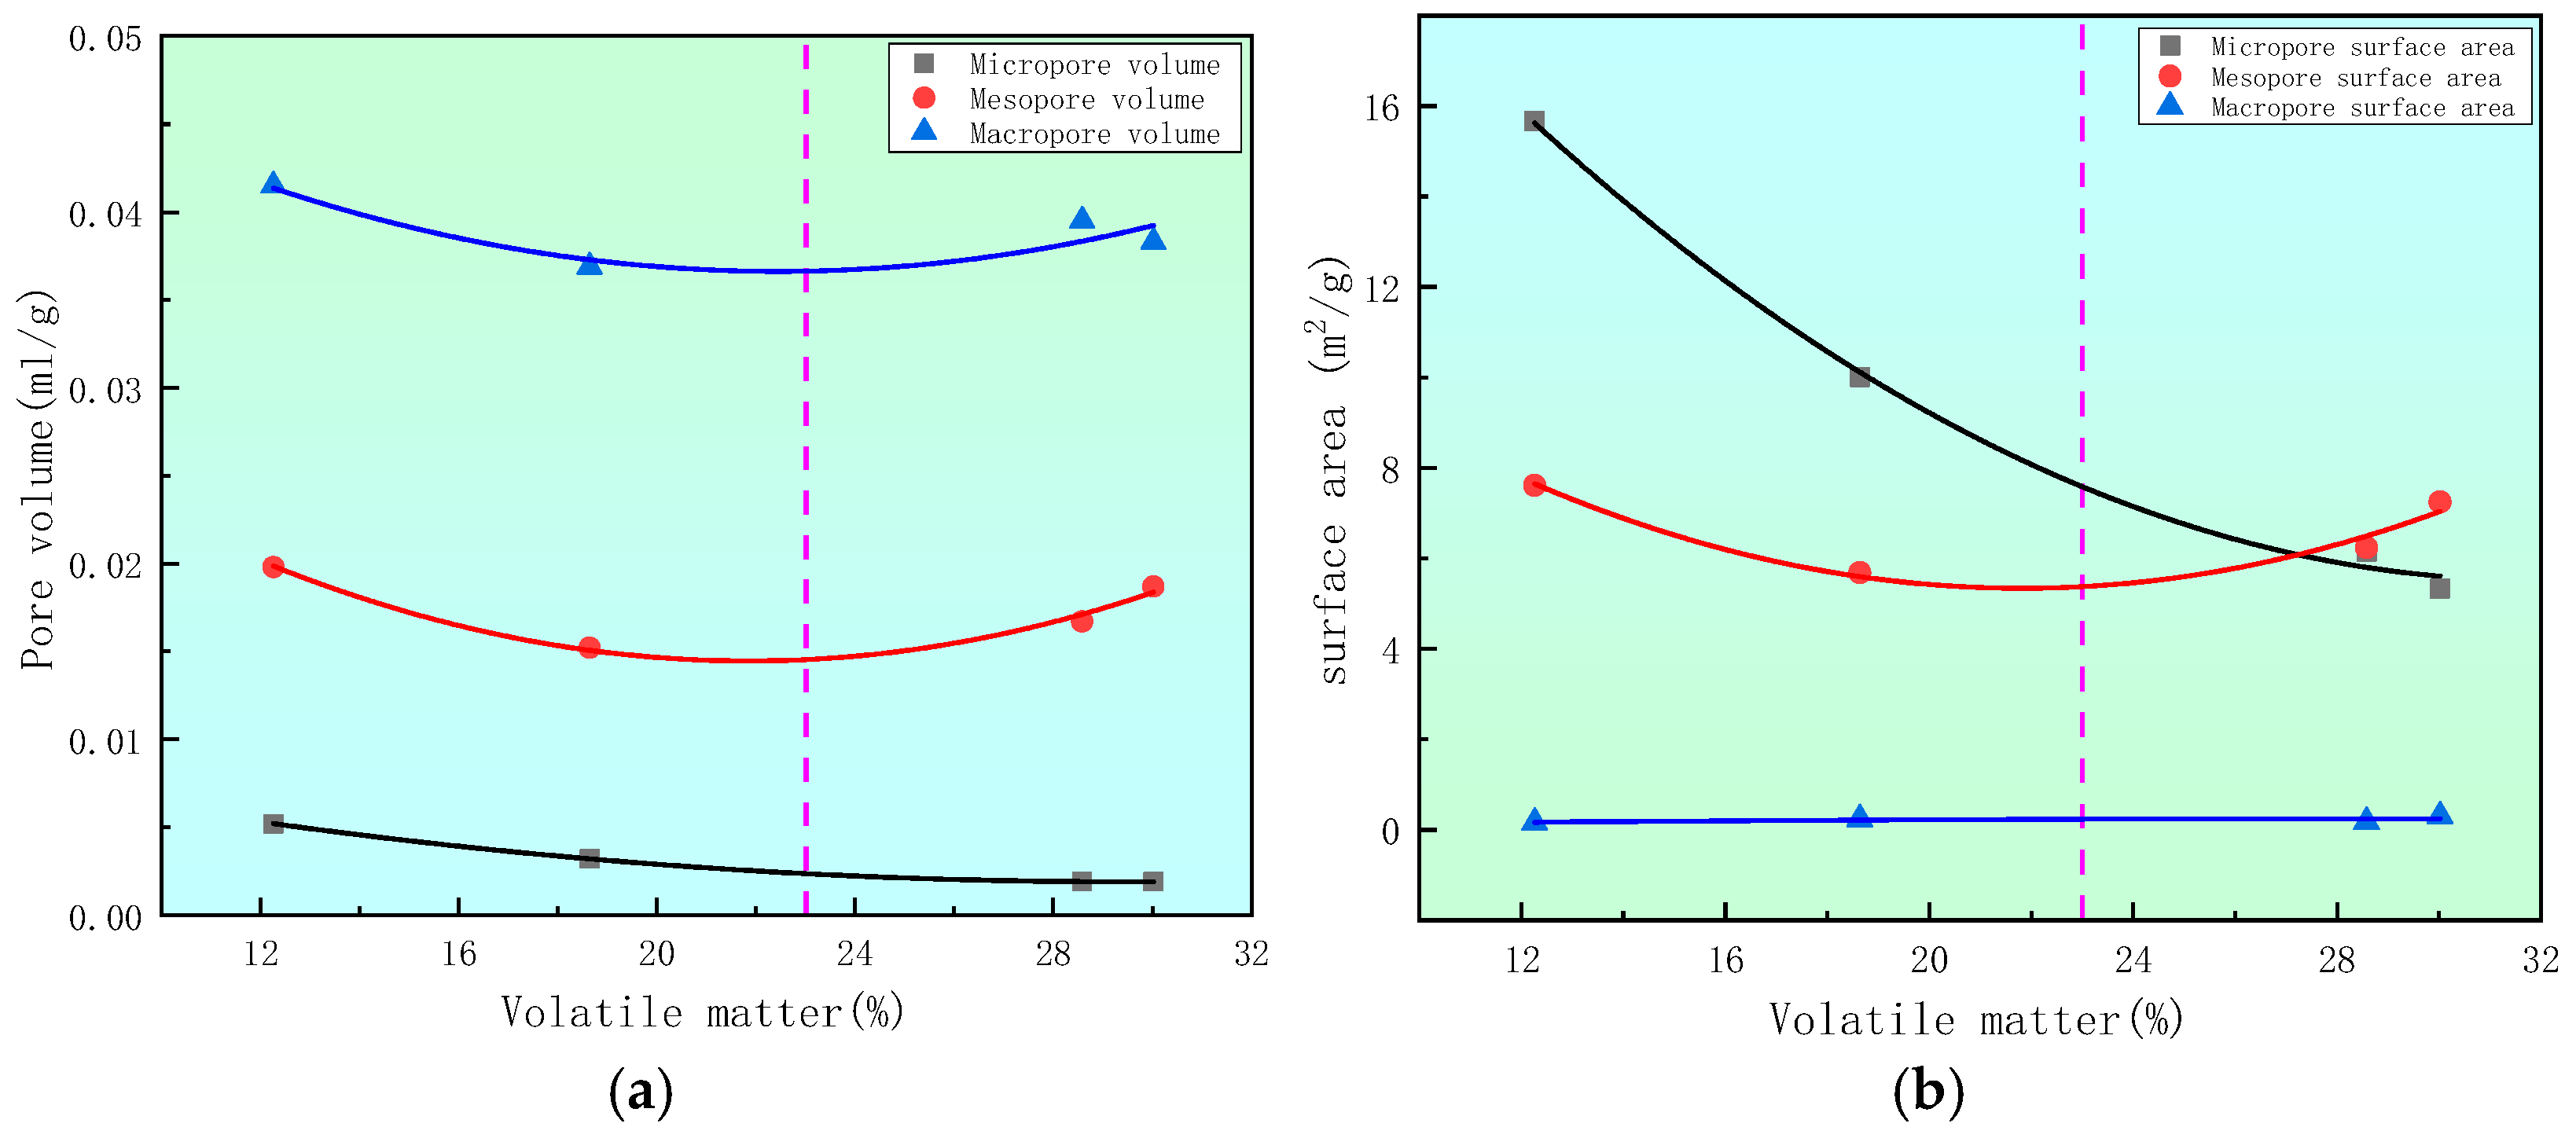
  • The influence of metamorphic degree on the pore structure of deep coal was analyzed. The micropore volume and specific surface area both decreased with the increase in volatile matter, highlighting a nonlinear decreasing trend. The metamorphic process of coal promoted the development of micropores. The pore volume and specific surface area of mesopores and macropores first decreased and then increased with the increase in volatile matter, and the curve exhibited a U-shaped change, with the lowest values appearing at approximately 23% of volatile matter. Marked differences in the micropore, mesopore, and macropore structures of coal were observed with different degrees of metamorphism, which are controlled by the degree of metamorphism.
  • The fractal dimensions of the pores in each sample were calculated based on the sponge, FHH, and density function models. The HYS sample (lean coal) with the highest degree of metamorphism exhibited the smallest fractal dimension D1, the largest D2, and the smallest D3, among which the pore complexity was the highest. The XJE sample (gas coal) with the lowest degree of metamorphism had the highest fractal dimension D1, the lowest D2, and the highest D3, and the distribution of mesopores and throats was relatively regular. The fractal dimension D1 value based on the sponge model exhibited an inverted U-shaped change with the increase in volatile matter, first increasing and then decreasing. The fractal dimension D2 value based on the FHH model decreased nonlinearly with the increase in volatile matter, and the higher the degree of metamorphism, the more complex the mesoporous structure and the larger the fractal dimension. The fractal dimension D3 value based on the density function model increased nonlinearly with the increase in volatile matter, and the degree of metamorphism intensified, resulting in the development of a more regular microporous structure. Although the degree of metamorphism had different effects on the fractal dimension, they all exhibited certain regular changes, indicating that the degree of metamorphism has a controlling effect on the evolution of the pore fractal dimension. Therefore, further research on the pore structure and fractal characteristics of all coal types is needed to comprehensively and accurately determine the controlling effect of metamorphic degree on pore size distribution.
  • China’s fv deep coal seams. The findings can contribute to the future of deep coal and gas coal mining technology, as well as coal and gas outburst prevention and control engineering.

Author Contributions

Conceptualization, Q.L. and Y.W.; methodology, Q.L.; hsoftware, L.Q.; validation, Q.L. and Y.W.; formal analysis, Q.L. and Y.W.; investigation, L.Q.; writing—original draft preparation, Q.L.; writing—review and editing, Y.W.; funding acquisition, Q.L. All authors have read and agreed to the published version of the manuscript.

Funding

This research was supported by the Key Laboratory of Rock Mechanics and Geohazards of Zhejiang Province (grant No. ZJRMG-2023-01).

Institutional Review Board Statement

Not applicable.

Informed Consent Statement

Not applicable.

Data Availability Statement

The original contributions presented in the study are included in the article, further inquiries can be directed to the corresponding author.

Acknowledgments

The authors would like to express gratitude to the Key Laboratory of Rock Mechanics and Geohazards of Zhejiang Province for the facilities and resources invested in the project, as well as the strong support and assistance provided by the laboratory staff. The authors of the article have used ChatGPT-4 for grammar review and to ensure proper English in the scientific paper.

Conflicts of Interest

The authors declare no conflicts of interest.

References

  1. Song, J.; Yue, Y.; Liu, Y. Analysis and Characterization of Micro–Nano Pores in Coal Reservoirs of Different Coal Ranks. Appl. Sci. 2024, 14, 5198. [Google Scholar] [CrossRef]
  2. Yao, Y.D.; Liu, D.M.; Che, Y.; Tang, D.; Tang, S.; Huang, W. Non-destructive characterization of coal samples from China using microfocus X-ray computed tomography. Int. J. Coal Geol. 2009, 80, 113–123. [Google Scholar] [CrossRef]
  3. Gilman, A.; Beckie, R. Flow of coal-bed methane to a gallery. Transp. Porous Media 2000, 1, 1–16. [Google Scholar] [CrossRef]
  4. Rodrigues, C.F.; Lenos, M.J. The measurement of coal porosity with different gases. Int. J. Coal Geol. 2002, 3, 245–281. [Google Scholar] [CrossRef]
  5. Zhang, C.; Guan, P.; Zhang, J.H.; Liang, X.; Ding, X.; You, Y. Progress in fractal theory characterization of unconventional oil and gas reservoir pore structure characteristics. J. Peking Univ. 2023, 5, 897–908. [Google Scholar] [CrossRef]
  6. Mandelbrot, B.B. How long is the coast of Britain statistical selfsimilarity and fractional dimension. Science 1967, 3775, 636–638. [Google Scholar] [CrossRef] [PubMed]
  7. Mandelbrot, B.B. On the geometry of homogeneous turbulence, with stress on the fractal dimension of the iso-surfaces of scalars. J. Fluid. Mech. 2006, 3, 401–416. [Google Scholar] [CrossRef]
  8. Chen, X.J.; Zhao, S.; Si, C.X.; Qi, L.; Kang, N. The fractal characteristics of coal pore structure with different degrees of metamorphism and their impact on gas adsorption. Coal Sci. Technol. 2020, 48, 118–124. [Google Scholar] [CrossRef]
  9. Wang, X.J.; Yao, H.F.; Li, W.; Zhang, X.; Yan, J. Fractal characterization of coal pore structure based on thermodynamic models. Coal. Geol. Explor. 2014, 6, 20–23. [Google Scholar] [CrossRef]
  10. Yang, S.Y.; Yao, Y.B.; Wei, R.; Zhang, J. Study on fractal characteristics of seepage pores and pores in coal reservoirs in the Hedong mining area of Urumqi. Coal Sci. Technol. 2020, 8, 175–183. [Google Scholar] [CrossRef]
  11. Liu, H.Q.; Wang, L.; Xie, G.X.; Yuan, Q.; Zhu, C.; Jiao, Z. Comprehensive characterization of coal pore structure and full aperture fractal characteristics. J. Min. Saf. Eng. 2022, 3, 458–469+479. [Google Scholar] [CrossRef]
  12. Xue, H.T.; Li, X.J.; Chen, L.Y.; IU, Y. Microscopic pore fractal characteristics of Qianxi outburst coal and their impact on permeability. Coal Sci. Technol. 2021, 49, 118–122. [Google Scholar] [CrossRef]
  13. Zhou, S.D.; Liu, D.M.; Cai, Y.D.; Yao, Y.; Jiao, Y.; Ren, S. Characteristics and fractal characterization of adsorption pores in low rank coal. Geol. Oil Gas 2018, 2, 373–383. [Google Scholar] [CrossRef]
  14. Xiong, Y.H.; Zhou, S.W.; Jiao, P.F.; Yang, M.W.; Zhou, J.P.; Wei, W.E.I.; Cai, J.C. Fractal analysis of coal and shale microporous structures based on low-temperature CO2 adsorption. Nat. Gas Geosci. 2020, 7, 1028–1040. [Google Scholar] [CrossRef]
  15. GB/T 212-2008; Industrial Analysis Methods for Coal. National Coal Standardisation Technical Committee: Beijing, China, 2008.
  16. GB/T 5751-2009; China Coal Classification. National Coal Standardisation Technical Committee: Beijing, China, 2009.
  17. Chu, Y.P.; Zhang, D.M.; Wang, M.; Liu, H.; Wu, X.; Zhai, P.; Shen, T. Experimental study on the damage evolution law of pore structure in liquid nitrogen freeze-thaw coal based on nuclear magnetic resonance technology and mercury intrusion method. J. Rock Mech. Eng. 2022, 9, 1820–1831. [Google Scholar] [CrossRef]
  18. GB T 21650.1-2008; Pore Size Distribution and Porosity of Solid Materials by Mercury Porosimetry and Gas Adsorption. Part 1: Mercury Porosimetry. National Technical Committee for the Standardisation of Sieve Mesh Sieving and Particle Sorting Methods (SAC/TC 168): Beijing, China, 2008.
  19. Yang, M.; Liu, L.; Liu, J.J.; Mao, J.; Chai, P. Joint characterization of nitrogen adsorption mercury intrusion nuclear magnetic resonance in the pore structure of intermediate rank coal. Coal Sci. Technol. 2021, 5, 67–74. [Google Scholar] [CrossRef]
  20. GB T 21650.2-2008; Pore Size Distribution and Porosity of Solid Materials by Mercury Porosimetry and Gas Adsorption. Part 2: Analysis of Mesopores and Macropores by Gas Adsorption. National Technical Committee for the Standardisation of Sieve Mesh Sieving and Particle Sorting Methods (SAC/TC 168): Beijing, China, 2008.
  21. Nie, B.S.; Ma, Y.K.; He, X.Q.; Zhao, D.; Liu, X.; Deng, B.; Li, X.; Meng, Y.; Song, D. Exploring the Micro Mechanism of Coal and Gas Outburst. J. China Univ. Min. Technol. 2022, 2, 207–2020. [Google Scholar] [CrossRef]
  22. GB T 21650.3-2011; Pore Size Distribution and Porosity of Solid Materials by Mercury Porosimetry and Gas Adsorption. Part 3: Analysis of Micropores by Gas Adsorption. National Technical Committee for the Standardisation of Sieve Mesh Sieving and Particle Sorting Methods (SAC/TC 168): Beijing, China, 2011.
  23. Song, Y.; Jiang, B.; Li, F.L.; Yan, G.Y.; Yao, Y.P. Applicability and fractal characteristics of low-middling coal level structural coal nano pore fractal model. Earth Sci. 2018, 5, 1611–1622. [Google Scholar] [CrossRef]
  24. Pfeifer, P.; Avnir, D. Chemistry in noninteger dimensions between two and three. I Fractal theory of heterogeneous surfaces. J. Chem. Phys. 1983, 7, 3558–3565. [Google Scholar] [CrossRef]
  25. Avnir, D.; Jaroniec, M. An isotherm equation for adsorption on fractal surfaces of heterogeneous porous materials. Langmuir 1989, 6, 1431–1433. [Google Scholar] [CrossRef]
  26. Jaroniec, M. Evaluation of the fractal dimension from a single adsorption isotherm. Langmuir 1995, 6, 2316–2317. [Google Scholar] [CrossRef]
  27. Avnir, D.; Pfeifer, P. Fractal Dimension in Chemistry, An intensive characterization of surface irregularity. Nouv. J. Chim. New J. Chem. 1983, 2, 71–72. [Google Scholar]
  28. Jaroniec, M.; Gilpin, R.K.; Choma, J. Correlation between microporosity and fractal dimension of active carbons. Carbon 1993, 2, 325–331. [Google Scholar] [CrossRef]
  29. Jaroniec, M.; Lu, X.; Madey, R.; Choma, J. Evaluation of structural heterogeneities and surface irregularities of microporous solids. Mater. Chem. Phys. 1990, 1, 87–97. [Google Scholar] [CrossRef]
  30. Dai, F.Y.; Hu, H.Y.; Zhang, A.H. Applicability of fractal models for organic shale pores. Coal Sci. Technol. 2019, 2, 168–175. [Google Scholar] [CrossRef]
  31. Stoeckli, F.; Ballerini, L.; Sbernardini, D. On the evolution of micropore widths and areas in the course of activation. Carbon 1989, 3, 501–502. [Google Scholar] [CrossRef]
  32. Dubinin, M.M. The potential theory of adsorption of gases and vapors for adsorbents with energetically nonuniform surfaces. Chem. Rev. 1960, 2, 235–241. [Google Scholar] [CrossRef]
  33. Choma, J.; Jaroniec, M.; Piotrowska, J. On the mesopore correction of adsorption data used for characterizing microporous structure of activated carbons. Mater. Chem. Phys. 1987, 4, 409–421. [Google Scholar] [CrossRef]
  34. Sing, K.S.W. Reporting physisorption data for gas/solid systems with special reference to the determination of surface area and po rosity (Recommendations 1984). Pure Appl. Chem. 1985, 4, 603–619. [Google Scholar] [CrossRef]
  35. International Union of Pure and Applied Chemistry. Physical chemistry division commission on colloid and surface chemistry, subcommittee on characterization of porous solids: Recommendations for the characterization of porous solids (Technical report). Pure Appl. Chem. 1994, 8, 1739–1758. [Google Scholar]
  36. Li, Y.H.; Zhao, J.G.; Li, W.S. Prediction of the Location of Concealed Pluton on the Spatial Variation Characteristics of Volatile Matter in Coal Seams. Geofluids 2024, 2024, 9455853. [Google Scholar] [CrossRef]
  37. Zheng, C.S.; Han, F.L.; Jiang, B.Y.; Xue, S.; Li, G.; Liu, S. Coal multi-scale pore fracture variations and permeability sharp increase characteristics induced by in-situ hydraulic injection. J. China Univ. Min. Technol. 2024, 4, 710–725. [Google Scholar]
Figure 1. Mercury intrusion curves of samples from different coal ranks. (a) XJE, (b) PML, (c) HYS, (d) LXK.
Applsci 14 08566 g001
Figure 2. Adsorption–desorption curve of liquid nitrogen method. (a) XJE, (b) PML, (c) HYS, (d) LXK.
Applsci 14 08566 g002
Figure 3. Low-temperature carbon dioxide adsorption–desorption curve. (a) XJE, (b) PML, (c) HYS, (d) LXK.
Applsci 14 08566 g003
Figure 4. Distribution of full aperture pore volume. (a) Stage pore volume, (b) accumulated pore volume.
Applsci 14 08566 g004
Figure 5. Distribution of full aperture-specific surface area. (a) Stage surface area, (b) accumulated surface area.
Applsci 14 08566 g005
Figure 6. Relationship between volatile matter, pore volume, and specific surface area. (a) Pore volume, (b) surface area.
Applsci 14 08566 g006
Figure 7. Fractal calculation of sponge models with different coal ranks. (a) XJE, (b) PML, (c) HYS, and (d) LXK.
Applsci 14 08566 g007
Figure 8. Fractal calculation of FHH models for different coal ranks. (a) XJE, (b) PML, (c) HYS, and (d) LXK.
Applsci 14 08566 g008
Figure 9. Fractal calculation of density function models for different coal ranks. (a) XJE, (b) PML, (c) HYS, and (d) LXK.
Applsci 14 08566 g009
Figure 10. Relationship between volatile matter and fractal dimension.
Applsci 14 08566 g010
Table 1. Basic sample parameters.
Sample NumberSample SourceSampling Coal SeamsDepth/mIndustrial Analysis IndicatorsCoal Type
Mad
/%
Aad
/%
Vad
/%
FCad
/%
XJEXinjier mine9 Coal8002.2525.7830.0241.95Gas coal
PMLPingmeiliu mineWu-8 Coal9401.6513.3628.5856.411/3 Coking coal
HYSHongyangsan mine7 Coal11000.769.8112.2677.17Thin Coal
LXKLinxi mine12 Coal9500.8311.2918.6469.24Coking coal
Table 2. Calculation table for full pore volume and specific surface area distribution of different coal ranks.
Sample NumberFull Aperture Pore Volume (mL/g)Full Aperture Specific Surface Area (m2/g)
Total Pore VolumeMicroporeMesoporeMacroporeTotal
Surface Area
MicroporeMesoporeMacropore
XJE0.0589 0.0019 0.0187 0.0383 12.8713 5.3295 7.2445 0.2973
PML0.0581 0.0019 0.0167 0.0395 12.5549 6.1451 6.2348 0.1750
HYS0.0665 0.0052 0.0198 0.0415 23.4356 15.6650 7.6147 0.1559
LXK0.0553 0.0032 0.0152 0.0369 15.9192 10.0040 5.6801 0.2351
Table 3. Summary of calculation results of full aperture fractal dimension.
Sample NumberFitting EquationFitting Degree
R2
Equation Slope
K
Fractal Dimension
Di (i = 1,2,3)
Fractal Model
XJEy = −1.1282x − 2.29510.9647−1.12822.8718Sponge
y = −0.9395x − 4.29860.9869−0.93952.0605FHH
y = −0.5538x − 0.95190.9773−0.55382.5538Density function
PMLy = −1.2147x − 2.15290.9684−1.21472.7853Sponge
y = −0.6352x − 2.31350.9991−0.63522.3648FHH
y = −0.4252x − 0.95510.9640−0.42522.4252Density function
HYSy = −1.3565x − 2.04250.9458−1.35652.6435Sponge
y = −0.3762x − 0.05500.9997−0.37622.6238FHH
y = −0.2977x − 1.04090.9567−0.29772.2977Density function
LXKy = −1.0609x − 2.41560.9493−1.06092.9391Sponge
y = −0.5589x − 1.86910.9805−0.55892.4411FHH
y = −0.4596x − 1.21330.9934−0.45962.4596Density function
Disclaimer/Publisher’s Note: The statements, opinions and data contained in all publications are solely those of the individual author(s) and contributor(s) and not of MDPI and/or the editor(s). MDPI and/or the editor(s) disclaim responsibility for any injury to people or property resulting from any ideas, methods, instructions or products referred to in the content.

