Article

Promotion Effects of High-Speed Rail on Urban Development: Evidence from Three Lines in China

Institute of Urban and Demographic Studies, Shanghai Academy of Social Sciences, Shanghai 200020, China
Appl. Sci. 2024, 14(18), 8571; https://doi.org/10.3390/app14188571
Submission received: 5 August 2024 / Revised: 18 September 2024 / Accepted: 21 September 2024 / Published: 23 September 2024
(This article belongs to the Special Issue Sustainable Urban Mobility)

Abstract

:
Amid the vigorous development of the high-speed rail (HSR) network, local governments in China generally consider the construction of HSR as a crucial task in their regional development strategies. Currently, most provincial capitals and prefecture-level cities in the eastern and central regions of China already have operational HSR services. This study aims to examine a key question: has the objective of local governments to promote urban development through the construction of HSR been effective? The research selects cities along the Beijing–Shanghai, Beijing–Guangzhou, and Harbin–Dalian HSR lines as the study subjects. Based on the principles of proximity and similarity, cities with operational HSR and those without are chosen as the experimental group and the control group, respectively. Following the double difference (difference-in-differences) approach, an advantage index is proposed to systematically evaluate the impact of HSR operation on urban development from three dimensions: population aggregation, economic development, and expansion of construction land. Furthermore, the evaluation results are systematically clustered to identify city types that exhibit different promotional effects in various dimensions. The research findings indicate the following: (1) The promotion effect of HSR on the development of small to medium-sized cities is more reflected in economic growth and construction land growth. (2) The promotion effect of HSR on the development of large cities is more reflected in the growth of the employment population. (3) For smaller or economically less-developed cities, HSR may be detrimental to the aggregation of resident and employment populations. (4) Cities with moderate size and good economic development have the opportunity to use HSR to promote population aggregation. On this basis, combined with the findings above, strategies to promote the coordinated development of high-speed rail construction and urban systems are discussed.

1. Introduction

Since the world’s first high-speed rail (HSR) line began operations in Japan in 1964, the convenience brought by HSR has gained widespread popularity worldwide. According to the “High Speed Lines in the World 2022” report by the International Union of Railways (UIC), the total operational mileage of HSR globally has reached 59,498 km. China’s HSR operations began with the opening of the Qinhuangdao–Shenyang Passenger Line in 2003. After 20 years of rapid development, the operational mileage has reached 40,493 km, accounting for 68% of the global total. This shows that China has now become a major region for the operation of HSR systems worldwide. At the national level, China has formulated a grand framework plan aiming to integrate major and medium-sized cities into the HSR network. During the planning and siting phase of specific HSR routes, cities along the route aspire to have the line and stations located within their jurisdictions, often leading to competition among cities [1]. For instance, the alignment of the North Yangtze River HSR in Jiangsu Province saw proposals for northern, central, and southern routes due to competition among various cities, with each route passing through different cities. This demonstrates that local governments generally regard the construction of HSR as a crucial task within their regional development strategies.
As of now, most provincial capitals and prefecture-level cities in eastern and central China have already achieved HSR operation. For cities along some early lines such as Beijing–Shanghai, Beijing–Guangzhou, and Harbin–Dalian, HSR has been in operation for more than a decade. At the same time, for any local government, the construction of HSR and its supporting projects is a massive undertaking, and its actual impact and benefits after completion cannot be ignored [2]. Therefore, in the current context, it is both necessary and feasible to examine a critical issue: has the initial objective of local governments to promote urban and socio-economic development through the construction of HSR been effective? The study of this issue is not only crucial for China but also holds universal significance for other regions around the world. According to UIC data, an increasing number of countries are committed to making HSR construction a key part of their future plans. Although currently, the operational HSR mileage outside of China accounts for only 32%, the mileage under construction, planned, and in long-term planning, respectively, accounts for 34%, 76%, and 79%. As HSR construction expands in regions such as southeast Asia, south Asia, the Middle East, Africa, and Europe, the benefits of these projects will become a key focus of attention in those areas.
Undoubtedly, due to its fast, convenient, and efficient transportation characteristics, HSR significantly promotes the flow of elements such as population and industry. From the perspective of regional coordinated development, the smooth flow of these elements helps to narrow the development gap between developed and underdeveloped regions [3]. For example, Wang Huaxing et al. (2019) confirmed that the opening of HSR can promote the diffusion of production elements such as capital and technology to surrounding cities, thereby reducing regional development disparities [4]. However, we must clearly recognize that urban development is a complex system evolution process with multiple dimensions, reflected in population agglomeration growth, economic scale expansion, and urban land scale expansion, among other aspects. Additionally, from a physical perspective, the impact of element flows in a region will not be homogeneous; some areas may experience element aggregation, while others may experience element outflow. Therefore, it is necessary to examine the positive or negative impacts of the opening of HSR from multiple perspectives.
The most direct impact of the HSR opening is the promotion of population mobility, which subsequently leads to changes in urban residential and employment populations. Based on nighttime light data, Chen Meizhao et al. (2021) took the Shanghai–Kunming HSR as an empirical research object to explore the impact of HSR opening and operation on the economic activities of surrounding towns. They found that the opening and operation of the HSR generally have a positive effect on the population density indicators of towns along the line [5,6]. However, upon closer observation, the performance varies across different regions and cities [7,8]. For most cities, the HSR may promote population agglomeration, but for some cities, the HSR may cause a ‘siphon effect’ in a certain period, leading to population loss [9]. Li Yan et al. (2021) found that during the four to five years following the opening of China’s HSR, it promoted population return to shrinking cities to some extent but did not have sustained stability. It did not effectively drive labor force agglomeration in shrinking cities but instead caused the diffusion of capital elements to some extent [10]. He Lin (2021) also found that for small and medium-sized cities, the HSR opening somewhat suppressed the speed of population outflow but did not change the tendency of population agglomeration towards central cities [11]. Research on Japan’s HSR has reached similar conclusions. Yoo et al. (2024) found that the HSR promoted population growth in urban areas while causing population decline in rural areas, and this imbalance continues to have an impact [12]. Some scholars have conducted empirical research from the perspective of entrepreneurship and found that the opening of a HSR has a significant promoting effect on entrepreneurial activities, with the effect being more pronounced in relatively developed cities [13].
HSR also has a significant promoting effect on urban economic development. Research by Cen Cong et al. (2020) on Guangdong Province [14] and You Shibing et al. (2018) on Hunan Province [15] both confirm that HSR can generally play a significant positive role in promoting urban economic growth, facilitating the integration and coordinated development of urban economies, and optimizing the spatial layout of the economy. The opening of HSR can also significantly promote the transformation and upgrading of urban industrial structures, particularly enhancing the coordinated development of the tertiary sector [16]. Research by Sun Fang et al. (2019) on cities along the Beijing–Shanghai HSR line indicates that industries significantly affected by HSR are mainly concentrated in the tertiary sector [17]. Tang Keyue (2020) found from the study of the Harbin–Dalian HSR and the Zhengzhou–Xi’an HSR that the Zhengzhou–Xi’an HSR significantly promoted economic growth and industrial structure changes in the cities with stations, while the Harbin–Dalian HSR had a less noticeable effect on economic growth but did promote the development of tourism, potentially increasing the proportion of the tertiary sector [18]. For general cities, since HSR significantly enhances the accessibility of cities, the tourism industry is the most likely to benefit in the short term [19,20,21]. For industries related to technological innovation, the promoting effect of HSR mainly appears in cities with relatively larger scales and better-developed industrial foundations [22]. The “heterogeneity” in the promoting effect has also been confirmed by other scholars [23]. Xu Haidong (2019) found in research on China’s prefecture-level cities that the effect of HSR opening on the industrial structure transformation and upgrading of central cities, as well as the coupling coordination between employment and output, is significantly higher than that of peripheral cities [16]. The opening of HSR is conducive to promoting the transformation of urban economic structure from production-oriented to consumption-oriented [24]. Additionally, some scholars have confirmed that HSR can improve the economic risk resistance capacity of cities along the rail line [25]. Viewed from the spatial perspective of urban agglomerations, HSR helps promote the formation of multi-center structures, narrowing the development level gaps within urban agglomerations [26], and supports the high-quality economic development of urban agglomerations [27]. Similar to cities, the promoting effect of HSR on the economic development of urban agglomerations also shows “heterogeneity.” Qi Xin et al. (2021), through a comparison of the Yangtze River Delta, Pearl River Delta, and Central Liaoning urban agglomerations, found that HSR has a more significant positive effect on urban agglomerations with higher levels of economic development and spatial correlation [28].
HSR has a significant promoting effect on urban construction land development and land value enhancement. From a spatial perspective, the impact range can include the entire city and the areas surrounding the stations [29]. Chen et al. (2021) used a spatial panel regression analysis method to evaluate micro-level land use data for 285 cities in China, finding that HSR plays an important role in promoting changes in urban land use structure in China, with a more significant impact on second and third tier cities [30]. Some scholars have confirmed the positive influence of HSR on urban land expansion in China and have further discovered that cities in the central and western regions and those with lower development levels exhibit a more pronounced expansion trend [31,32]. In general, the opening of HSR stations, the increase in HSR lines, and the number of HSR stations all significantly promote the growth of urban construction land area, facilitating the conversion of agricultural land to construction land [33,34,35,36]. From the perspective of land use efficiency, some scholars have assessed the impact brought by HSR and found a significant improvement, with varying enhancement effects across different types of cities [37]. From the land value perspective, HSR can bring a noticeable uplift [38,39,40]. Zhou Yulong et al. (2018) found that cities with HSR stations had an average land price increase of about 7.0% compared to those without stations, with residential land and commercial service facilities land prices rising by 22% and 11%, respectively, while industrial land prices decreased by about 17% [41]. Okamoto et al. (2021), based on research on Japan’s HSR, found that metropolitan areas experienced land price increases due to the opening of a HSR, while smaller urban areas might suffer losses due to land price declines [42]. In recent years, many newly built HSR stations in China are located far from central urban areas, in suburban or even exurban areas [43]. Many local governments attempt to utilize HSR stations to promote the development of new towns. Consequently, some scholars have specifically studied the impact of HSR on land use around stations. Zhao Qian et al. (2015), using 38 stations along the Beijing–Shanghai and Wuhan–Guangzhou HSR lines as cases, found that the development scale around the Beijing–Shanghai HSR stations was much larger than that around the Wuhan-Guangzhou HSR stations, with a higher proportion of commercial land, which is related to the scale and economic development level of the cities along the two lines [44]. Xiong Changsheng et al. (2022) evaluated the net effect of the Hainan East Ring HSR stations on the expansion of surrounding construction land, finding that construction land around all stations showed an expansion trend, with the two most important stations, Haikou East and Sanya, having the largest expansion scale [45]. In relatively underdeveloped regions and small to medium-sized cities, HSR new town construction is more government-led, with the lack of market forces leading to slow development of HSR new towns, making it challenging to effectively drive economic development [46,47,48].
Some scholars have focused on the impact of HSR on urban carbon emissions and the environment. In the field of carbon emissions, some studies have empirically demonstrated the role of HSR construction in reducing urban carbon emissions [49], with the effect being more significant in large cities [50] and in cities in regions such as the eastern coast [51]. In the environmental field, some studies have confirmed the positive effects of HSR opening on improving air quality [52,53], reducing industrial pollutant emissions [54], and promoting green production [55].
Building on existing research, this study attempts to comprehensively analyze the impact of HSR on urban population, economy, and construction land, systematically examining a key question: was the local government’s initial goal of promoting urban development through HSR construction effective? Based on the analysis conclusions, the study proposes strategies to optimize resource allocation and enhance the coupling relationship between HSR construction and urban development. This study intends to select cities along relatively mature HSR lines in China that have been in operation for a certain period (i.e., experimental group) and nearby cities without HSR as the control group. Using the difference-in-differences (DID) approach, the study proposes an index to systematically evaluate the promoting effect of HSR on urban development. Compared to existing research, this study has several distinctive features: precise selection of experimental and control group samples, based on proximity and similarity in type, minimizing the interference of differences in macro-location, city level, and city size on the results; a systematic perspective to examine the promoting effect of HSR construction on urban population aggregation, economic development, and construction land expansion; and combining systematic cluster analysis to explore the differences in the impact of HSR on different types of cities from various dimensions, such as region, city size, and economic development level.

2. Materials and Methods

2.1. Research Subject

HSR operations in China began in 2003, marking the start of a long-term, systematic project. Some lines have been in operation for over a decade, having long-term impacts on urban development; other lines have only been operational for a few years, and their effects may not yet be significant. In terms of length, some lines are short, connecting only two cities or operating within a single province; others are longer, spanning multiple provinces and serving as important national HSR trunk lines. Therefore, determining the appropriate lines to study is a key initial task.
This study screens research subjects based on two main principles: first, the operation time of the lines should be close to or exceed ten years; second, the lines should be national trunk lines, passing through at least three provinces. Therefore, this study first reviewed the early history of HSR construction in China and mapped the layout of HSR lines that were operational by the end of each year from 2003 to 2014 (Figure 1). As shown in the figure, the earliest long-distance HSR trunk line in China that passes through more than three provinces is the Beijing–Shanghai HSR, which fully opened in 2011. In 2012, the Beijing–Guangzhou HSR and Harbin–Dalian HSR were fully operational. These three HSR lines meet the study’s selection criteria and are therefore identified as the research subjects.
The three HSR lines selected for this study hold significant positions in China’s HSR network (Figure 2). The Beijing–Shanghai HSR connects the capital of China with its largest city, passing through Beijing, Tianjin, Hebei Province, Shandong Province, Jiangsu Province, Anhui Province, and Shanghai, with a total length of 1318 km and a designed maximum speed of 380 km/h. The Beijing–Guangzhou HSR connects the capital of China with the southern economic center, the Pearl River Delta region, passing through Beijing, Hebei Province, Henan Province, Hubei Province, Hunan Province, and Guangdong Province, with a total length of 2291 km and a designed maximum speed of 350 km/h. The Harbin–Dalian HSR is a trunk line in northeast China, passing through Heilongjiang Province, Jilin Province, and Liaoning Province, with a total length of 921 km and a designed maximum speed of 350 km/h.

2.2. Methods

This study proposes a systematic approach for evaluating the promotion effects of HSR on promoting urban development. The research methodology framework is shown in Figure 3.
First, it is necessary to determine the experimental and control group cities. The cities with stations on the Beijing–Shanghai, Beijing–Guangzhou, and Harbin–Dalian HSR lines are designated as the experimental group cities in this study. Nearby cities that do not have HSR (or only recently gained HSR access) are selected as the control group cities. Each experimental group city is matched with a unique control group city. The basic principles for selecting control group cities are as follows: (1) A pair of control and experimental group cities should be as spatially close as possible, with a maximum distance of 200 km. (2) Given the crucial importance of administrative levels in the Chinese urban system, the control group city must have the same administrative level as the experimental group city. (3) The control group city should be as similar in size to the experimental group city as possible, given the first two principles. Since the number of municipalities, provincial capitals, and sub-provincial cities in the Chinese urban system is limited, it is not feasible to select control cities for these types of cities based on the aforementioned principles. Therefore, this study excludes municipalities, provincial capitals, and sub-provincial cities (a total of 14 cities) and focuses only on prefecture-level cities, county-level cities, and counties. As a result, this study ultimately identifies 60 pairs of experimental and control cities (Figure 4). Due to the rapid construction of HSR in China, some regions have now achieved city-to-city and even county-to-county HSR connectivity. Therefore, it is impossible to require that all control cities have no HSR access to date. This study compares data from 2010 and 2020; so, within the screening criteria, it is necessary to choose cities that still did not have HSR access by 2020 as control cities whenever possible. If no such cities are available, cities with later HSR access should be selected. According to statistics, among the 60 control cities selected for this study, 41 did not have HSR by 2020, 7 had HSR access in 2020, 8 had it in 2019, 3 had it in 2018, and 1 had it in 2017. Additionally, the average distance between the experimental and control cities is 95 km, with a maximum of 199 km (Wuxi and Yancheng) and a minimum of 14 km (Gaoyi and Baixiang).
Next, it is necessary to determine two key time points along the time dimension. One time point is before or shortly after the HSR starts operating; the other time point is after the HSR has been in operation for a period of time. The two time points should be spaced apart to more clearly identify the differences and similarities in the development of the two groups of cities. Considering the opening dates of the three HSR lines selected for this study and the availability of data such as population censuses, 2010 and 2020 are chosen as the two time points.
In the third step, it is necessary to determine the specific dimensions of urban development that the study will focus on. For this study, urban development will be measured by the growth in resident population, employment population, economic scale, and construction land area. Appropriate data sources for each of these dimensions need to be selected. For population data, priority is given to the census data conducted every ten years in China. This study selects the resident population and employment population data from county-level statistics for the years 2010 and 2020 [56,57]. For economic data, this study chooses GDP data. For construction land data, this study uses the widely-used LUCC data [58,59]. It should be noted that in determining the statistical spatial scope, county-level cities and counties are defined by their administrative divisions, while prefecture-level cities only include the area of their municipal districts. This is because the number of county-level units administered by different prefecture-level cities varies, resulting in significant differences in city area sizes that cannot accurately reflect the true scale of the cities. Additionally, in some cases, both municipal districts and subordinate county-level cities or counties have HSR stations. By only including municipal district data, spatial overlap in statistical scope can be avoided. Furthermore, considering that the boundaries of some municipal districts in prefecture-level cities have changed due to the merging of surrounding counties and cities, the 2020 boundaries are uniformly used as the basis for statistics. This precise consideration of the statistical scope for prefecture-level cities is also a key feature of this study.
Furthermore, it is necessary to design appropriate methods to compare the development performance differences between the two groups of cities across different dimensions. Using the difference-in-differences (DID) method and its derived methods to conduct comparative studies between experimental and control groups is a common practice in the existing literature [33,53,60]. This study, based on the basic idea of the DID method, proposes the advantage index D a to measure the impact of HSR opening on cities. The calculation method is shown in the following formula.
D a = Y t 1 Y t 0 Y c 1 Y c 0
where D a is the advantage index for a specific dimension; Y t 1 is the indicator value for the experimental group city in 2020; Y t 0 is the indicator value for the experimental group city in 2010; Y c 1 is the indicator value for the control group city in 2020; Y c 0 is the indicator value for the control group city in 2010.
This study involves comparisons of four indicators, which fall into three dimensions. The advantage index for the resident population is denoted as D a R ; for the employment population, it is denoted as D a E ; for the total economic output, it is denoted as D a G ; and for construction land, it is denoted as D a L . According to the calculation principle of the formula, if the value of D a is greater than 0, it indicates that the opening and operation of HSR have a positive promoting effect on the development of the experimental group city; if the value of D a is less than 0, it indicates a negative inhibiting effect on the development of the experimental group city.
Based on the results of the advantage index calculations, further analysis will be conducted from three perspectives to examine the impact of HSR on urban development from multiple angles. First, a general comparison of the performance of the two groups of cities will be conducted to roughly assess the overall impact of HSR on different dimensions of urban development. Second, considering differences in city location, administrative level, urban scale, and economic development level, relevant influencing factors will be included, and further analysis will be conducted using regression analysis and grouped statistics to more precisely assess the impact of HSR. Third, systematic cluster analysis will be employed to summarize several typical patterns of how HSR affects urban development based on city performance in various dimensions.

3. Results

3.1. Overall Performance of the Advantage Index

Firstly, a statistical summary of the indicator changes over the ten-year period from 2010 to 2020 for the 60 pairs of cities is provided. Regarding the resident population indicator, the 60 experimental group cities had an average increase of 8.11%, while the 60 control group cities had an average increase of 4.38%, showing a clear growth advantage for the experimental group cities. Concerning the employment population indicator, the 60 experimental group cities experienced an average decrease of 6.72%, whereas the 60 control group cities had an average decrease of 11.38%, with a more pronounced reduction in the control group cities. For the economic output indicator, the 60 experimental group cities had an average increase of 102.83%, while the 60 control group cities had an average increase of 106.11%, showing more significant growth in the control group cities. Regarding the construction land area indicator, the 60 experimental group cities saw an average increase of 28.12%, while the 60 control group cities had an average increase of 26.63%, with a slight advantage for the experimental group cities.
From the overall situation, it can be observed that HSR has the most significant positive impact on population aggregation, with a more pronounced advantage in aggregating employment population compared to resident population. For construction land area, HSR has a certain promoting effect on growth. In terms of economic growth, the experimental group cities with HSR do not even show an advantage. It is initially judged that, due to the different distributions of the 60 pairs of cities across various lines and significant differences in city size and economic development levels, some cities without HSR might show advantages in economic growth due to “latecomer advantages”. Therefore, it is necessary to conduct further in-depth analysis of the advantage index performance of individual cities across different dimensions.

3.2. Analysis Considering Relevant Influencing Factors

3.2.1. Different Performances of the Three Lines

The locations of the Beijing–Shanghai, Beijing–Guangzhou, and Harbin–Dalian HSR lines within China are significantly different. The Beijing–Shanghai line passes through the eastern coastal region, which has many large cities and relatively advanced economies. The Beijing–Guangzhou line traverses several central provinces, with its stations primarily in small to medium-sized cities, aside from provincial capitals, and has a relatively moderate level of economic development. The Harbin–Dalian line is situated in the northeastern region, where population outflow has been notable In recent years, and the economic growth rate is relatively slow.
Given the significant differences in the locations of the three lines, it is necessary to compare the average performance of cities along these lines in terms of D a R , D a E , D a G , and D a L . The calculation results are shown in Table 1.
It can be seen that the performance of cities along different lines in terms of population agglomeration varies significantly. The Beijing–Shanghai HSR has the most significant effect on promoting the agglomeration of resident and employment populations, with D a R and D a E values reaching 0.0626 and 0.0857, respectively. The Beijing–Guangzhou HSR’s effect on population agglomeration is not very pronounced, with D a R and D a E values at only 0.0157 and 0.0328, respectively. The Harbin–Dalian HSR shows a relatively significant effect on resident population agglomeration, second only to the Beijing–Shanghai line, with a D a R value of 0.0505, but has a negligible effect on employment population agglomeration, with a D a E value of only 0.0236. Comparing the D a values for resident and employment populations, it can be observed that both the Beijing–Shanghai HSR and Beijing–Guangzhou HSR have a more pronounced effect on the agglomeration of employment populations, whereas the Harbin–Dalian HSR has a more significant effect on the agglomeration of the resident population.
The impact of the three lines on the economic growth of cities also shows significant differences. The Beijing–Guangzhou HSR demonstrates a positive effect, with a D a G value of 0.0296. In contrast, both the Beijing–Shanghai HSR and Harbin–Dalian HSR exhibit negative impacts, with D a G values of −0.1009 and −0.0773, respectively. The Beijing–Shanghai HSR passes through relatively developed areas where cities face numerous economic development opportunities. Both the experimental and control group cities in this region experienced high GDP growth over the ten years, increasing by 142.60% and 152.68%, respectively. The HSR factor is just one of the many conditions promoting the economic development of cities in this region. Among the control group cities in this area, some have large ports (e.g., Taizhou), and some are close to metropolitan areas (e.g., Taicang). Additionally, this region generally emphasizes balanced regional development. For example, Jiangsu Province has been actively promoting coordinated development between the southern, central, and northern areas in recent years, leading to higher economic growth rates in some cities that received HSR later. The Beijing–Guangzhou HSR primarily passes through central inland regions, where cities lack the transportation advantages of large coastal and riverside ports, making HSR more crucial for economic growth in these cities. As a result, the average D a G value in this area is positive. For the Harbin–Dalian HSR passing through the northeastern region, the situation is noticeably different. Cities in this area have generally faced significant economic growth pressures in recent years, with the GDP of both experimental and control group cities declining by 11.37% and 3.64% on average over the ten-year period.
If we look at the changes in construction land area, the experimental group cities along all three lines show advantages. The cities along the Beijing–Shanghai HSR exhibit the most significant advantage, with a D a L value as high as 0.0368. Many cities have planned and built large-scale HSR new towns around HSR stations, reflecting the relatively high economic development level of these cities and their ample financial resources for urban construction. The Beijing–Guangzhou HSR and Harbin–Dalian HSR have relatively lower impacts on the growth of construction land, with D a L values of 0.0060 and 0.0044, respectively. One reason is that the cities in these regions have relatively average economic strength, limiting their financial resources to support the construction of HSR new towns, leading to a less significant impact on the growth of construction land. Another reason is that some cities face significant population outflow pressures, reducing the motivation to expand urban construction land.
As previously mentioned, the characteristics of cities along different lines vary. Some lines have more large cities, while others have more small and medium-sized cities, and there are also significant differences in economic development levels. Therefore, it is necessary to further refine the discussion on the impact of HSR on the advantage index.

3.2.2. Different Performances of Cities with Varying Administrative Levels

For Chinese cities, the administrative division level has a crucial impact on urban development. This is because the administrative level significantly influences the allocation of resources within a city. For example, the number, scale, and construction standards of public service facilities are all related to the city’s administrative level. Therefore, it is necessary to compare the average performance of D a R , D a E , D a G , and D a L in cities of different administrative levels. The results are shown in Table 2.
Since municipalities, provincial capitals, and sub-provincial cities were excluded, the 60 pairs of experimental and control cities are mainly divided into two administrative levels: one is the prefectural level, namely prefecture-level cities, and the other is the county level, including county-level cities and counties. Prefecture-level cities have a significant advantage in the D a R and D a E indicators compared to county-level cities, whereas the D a G and D a L indicators show the opposite, with county-level cities having a better performance.
The above results indicate that HSR has further enhanced prefecture-level cities’ ability to attract populations. This may be due to the significant advantages that prefecture-level cities have over county-level cities in terms of employment opportunities, public services, quality of life, and cultural diversity. The convenient HSR transportation reduces the cost of time and distance. HSR has a more pronounced effect on economic growth in county-level cities, highlighting the importance of HSR construction for the development strategies of these cities. Additionally, HSR has a noticeable impact on the growth of construction land in county-level cities, suggesting that county-level governments may be more focused on urban development around HSR stations, hoping that HSR can fully drive urban expansion and functional enhancement.

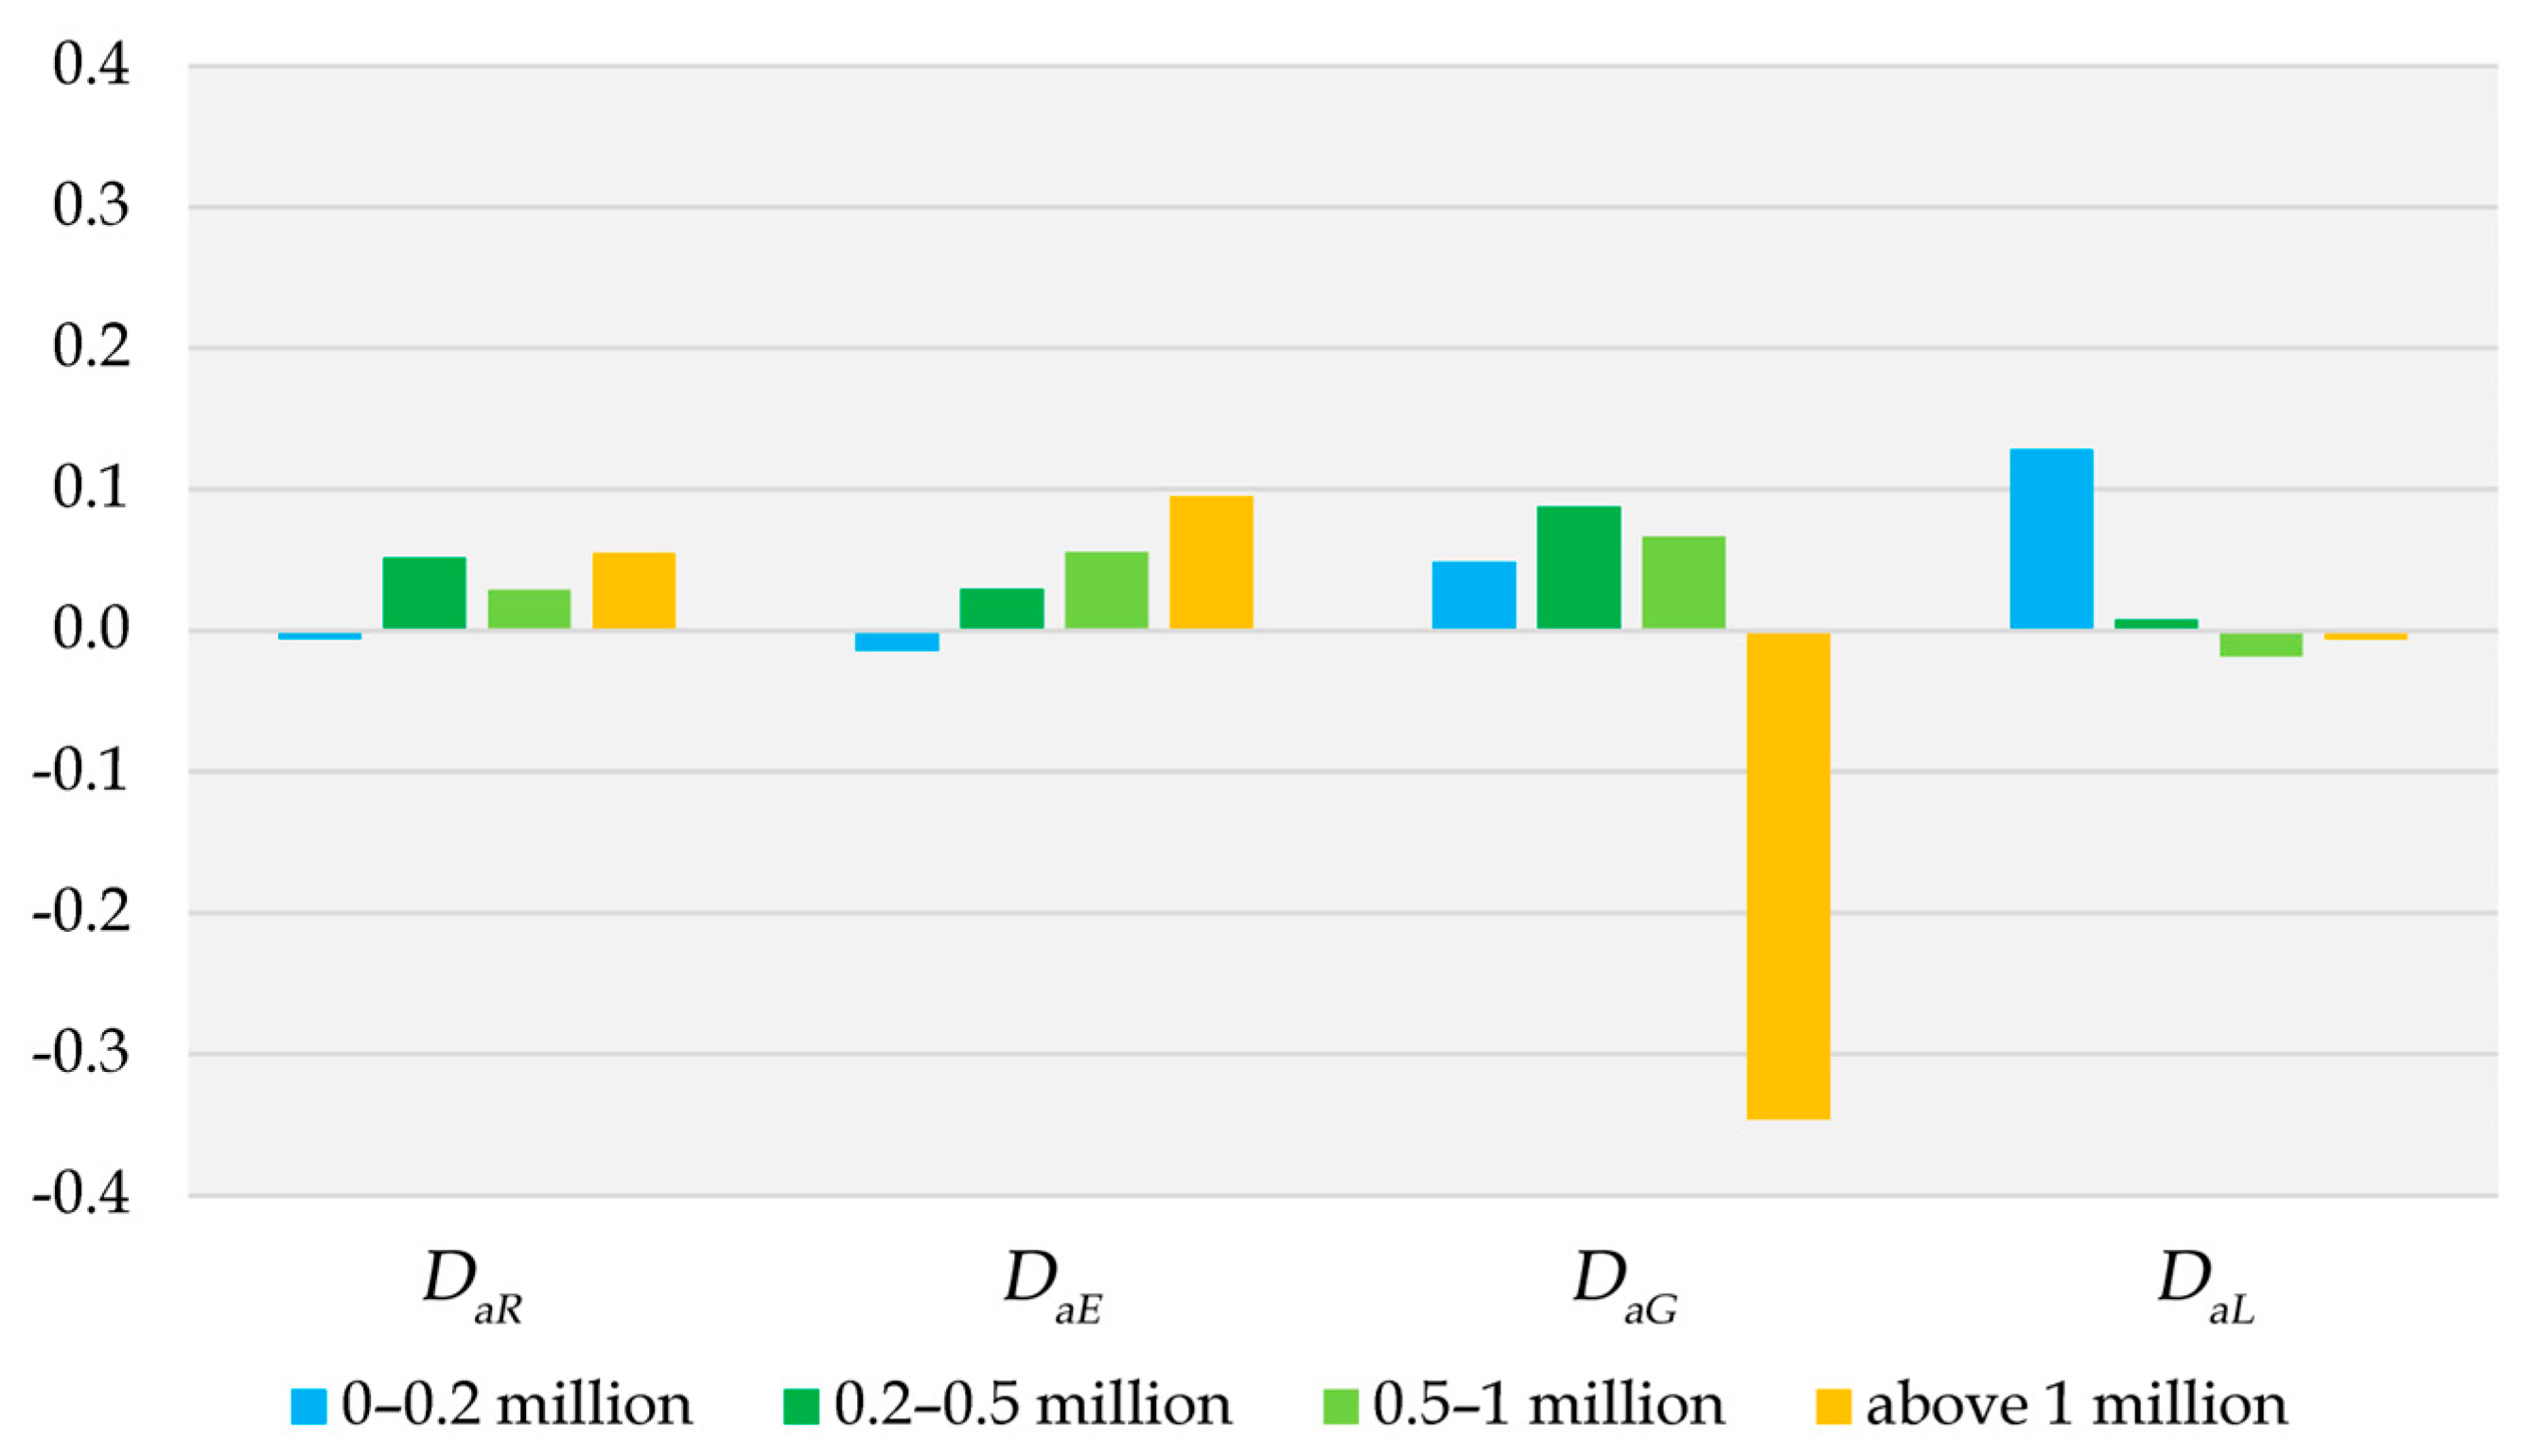
3.2.3. Different Performances of Cities of Varying Urban Scales

City size is also an important factor affecting the impact of HSR. Since city size is a continuous variable, we can plot a two-dimensional scatter plot for all city samples and attempt linear regression to reveal the patterns in the D a R , D a E , D a G , and D a L indicator values for cities of different sizes. The analysis results are shown in Figure 5.
It can be seen that the impact of HSR on different dimensions varies across cities of different sizes. The promotion of population aggregation by HSR is more significant in larger cities. In terms of slope, the promotion effect on employment population aggregation is even more pronounced. Conversely, the promotion of economic growth and construction land expansion by HSR is more significant in smaller cities.
The goodness-of-fit values range from 0.0125 to 0.1487, indicating that the fit of the linear regression model is not ideal. Therefore, it is necessary to further group and verify the data by city scale, as the relationship between the D a value and city scale may not exhibit a simple linear pattern. According to China’s classification standards for city sizes, the 60 experimental group cities are divided into four categories based on urban population size: 0–0.2, 0.2–0.5, 0.5–1, and over 1 million. The average D a values for each group of cities were calculated separately, as shown in Table 3 and Figure 6.
The results show that HSR is detrimental to population aggregation in small cities with fewer than 200,000 people, affecting both resident and employment populations. For cities with populations over 200,000, the effects differ. For resident population, HSR most effectively promotes population aggregation in cities with populations between 200,000 and 500,000, followed by those with populations over 1 million. In contrast, for employment population, the larger the city, the more pronounced the positive effect of HSR. This suggests that under the influence of HSR, medium-sized cities have the opportunity to gain an advantage in resident population aggregation, while larger cities are better positioned to benefit from employment population aggregation.
Regarding economic growth, HSR has a significant positive effect on medium and small cities with populations under 1 million, but the effect is reversed for larger cities with populations over 1 million. This may be because large cities along the three lines are generally more developed and have entered a stage of high-quality development, focusing less on rapid economic growth. In contrast, nearby control cities are still in the “catch-up” phase, pursuing faster economic growth. Regarding construction land growth, HSR has a very significant positive effect on small cities with populations under 200,000, highlighting the crucial role of HSR projects in the urban development process of these small cities.

3.2.4. Different Performances of Cities with Varying Economic Development Levels

The level of economic development in cities is also an important factor affecting the impact of HSR. Using per capita GDP to measure the level of economic development, which is a continuous variable, a two-dimensional scatter plot can be created for all city samples, and linear regression can be performed to reveal the patterns reflected in the D a R , D a E , D a G , and D a L indicator values across different scales of cities. The analysis results are shown in Figure 7.
The performance of the slope indicates that the impact of HSR on various dimensions of urban development differs across cities with different levels of economic development. The promotion of population aggregation by HSR is more pronounced in cities with higher levels of economic development. When considering the slope, the promotion effect on employment population aggregation is even more significant. The pattern of HSR’s impact on economic growth is not as clear. For the growth of construction land, the effect of HSR is more pronounced in cities with higher economic development levels, indicating that urban financial resources play a crucial supporting role in development and construction.
The goodness-of-fit values range from 0.0007 to 0.0654, indicating that there is not a significant linear relationship between the D a value and the level of urban economic development. It is necessary to further group and verify the data according to the level of urban economic development. According to per capita GDP values, the 60 experimental group cities were classified into three groups: High group (above 100,000 RMB), Medium group (50,000 to 100,000 RMB), and Low group (below 50,000 RMB). The average D a values for each group of cities were calculated, with the results shown in Table 4 and Figure 8.
From the results above, it can be seen that for cities with lower levels of economic development, HSR is not conducive to the aggregation of both resident and employment populations. Compared to resident populations, the effect of HSR on employment population aggregation is more significant in economically developed cities. In terms of economic growth, HSR has a significant positive effect on cities with moderate levels of economic development, but has the opposite effect on cities with either low or high levels of economic development. For cities with lower levels of economic development, HSR may lead to a relative “siphoning effect”. For cities with higher levels of economic development, their economies have already entered a stage of high-quality development, and they no longer pursue rapid growth. Regarding construction land growth, HSR has a noticeable positive effect on cities with moderate and higher levels of economic development, but the opposite effect on cities with lower levels of economic development, further confirming the critical role of financial resources in supporting urban construction.

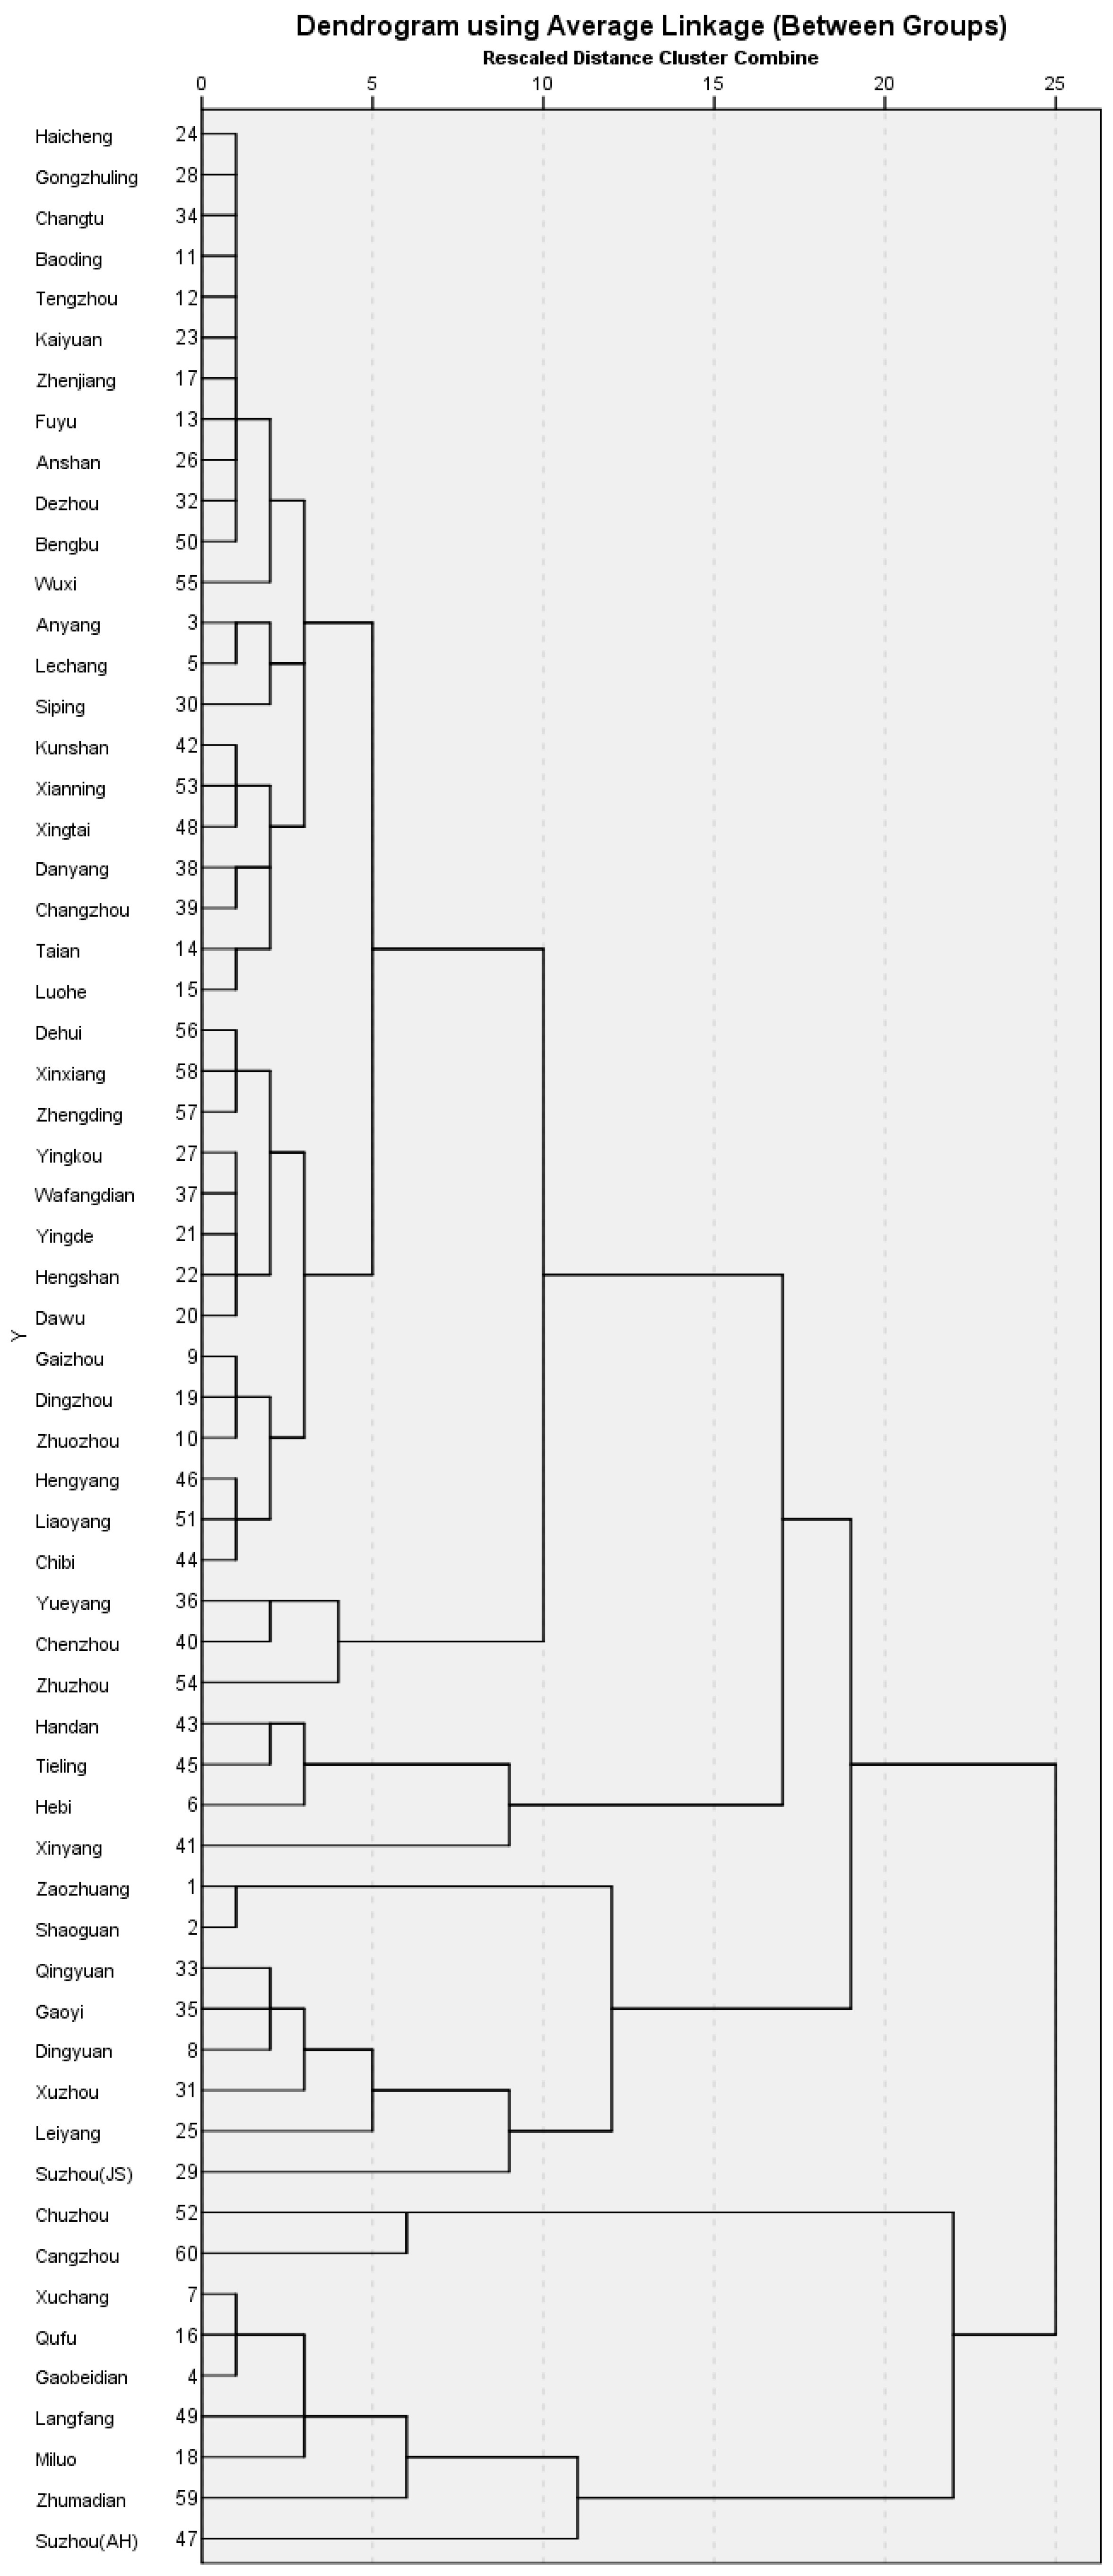
3.3. Systematic Cluster Analysis Based on Multidimensional Performance of the Advantage Index

A cluster analysis was conducted on the advantage index performance characteristics of the 60 experimental group cities. Using the systematic clustering method in SPSS, the cities were classified and discussed based on their comprehensive performance in population aggregation, economic growth, and construction land growth. The clustering method used was between-groups linkage, with D a R , D a E , D a G , and D a L indicator values chosen as variables for analysis. This resulted in a dendrogram (Figure 9) used to identify the classification and branching relationships of the 60 cities.
Furthermore, based on the dendrogram, the 60 experimental group cities were divided into 7 categories (Table 5). Category A1 includes seven cities, mainly small to medium-sized inland cities, primarily along the Beijing–Shanghai and Beijing–Guangzhou HSR lines. HSR significantly promotes economic growth and construction land growth in these cities but has little effect on population aggregation. Category A2 includes two cities, Chuzhou and Cangzhou, where HSR significantly promotes population aggregation, economic growth, and construction land growth. Category B1 includes eight cities, primarily prefecture-level cities along the Beijing–Shanghai and Beijing–Guangzhou HSR lines, where HSR does not promote economic growth. Category B21 includes four cities, mainly medium-sized prefecture-level cities along the Harbin–Dalian and Beijing–Guangzhou HSR lines, most of which are resource-based cities. HSR promotes the growth of the resident population in these cities but has little impact on the employment population and significantly negatively impacts economic and construction land growth. Category B221 includes three cities, all prefecture-level cities in Hunan Province along the Beijing–Guangzhou HSR line, where HSR significantly promotes construction land growth and population aggregation (both resident and employment) but negatively impacts economic growth. Category B2221 includes 14 cities, mainly small to medium-sized inland cities along the Beijing–Guangzhou and Harbin–Dalian HSR lines. HSR significantly promotes economic growth in these cities and also promotes construction land and employment population growth. Category B2222 includes 22 cities distributed along all three HSR lines, where HSR somewhat promotes resident population aggregation.

4. Discussion

4.1. HSR Has Significantly Different Impacts on Cities of Varying Sizes

The analysis results of this study indicate that HSR has significantly different effects on the development of cities of varying sizes. For larger cities, the development-promoting effects of HSR are more reflected in the growth of the employment population, followed by the growth of the resident population. In medium-sized cities, the development-promoting effects are more pronounced in terms of economic growth. For smaller cities, HSR often hinders the concentration of the resident and employment populations but facilitates the growth of land for construction use. Many of these findings can be corroborated by existing research when examined from specific perspectives. For instance, HSR does not reverse the trend of population concentration in central cities [11], and it may lead to population loss in some cities [9]. However, existing studies often focus on single dimensions, making it difficult to systematically analyze the effects of HSR on various aspects of urban development. As a result, some inconsistencies or ambiguities may exist between the conclusions of previous studies. The method proposed in this study allows for a more precise identification of the specific impacts of HSR on different types of cities across various dimensions.

4.2. HSR Has Intensified the Spatial Differentiation of Residence and Employment

The results of this study indicate that the impact of HSR on the resident population and the employment population is distinctly different. In smaller cities or those with lower levels of economic development, HSR tends to lead to a loss of the employment population and may also result in a decline in the resident population, though the reduction in the resident population is significantly smaller than that of the employment population. In contrast, for larger cities or those with higher levels of economic development, HSR promotes the growth of both the resident and employment populations, with the employment population growing at a much higher rate than the resident population. This finding suggests that HSR intensifies the spatial differentiation of employment and residence. HSR greatly enhances the efficiency of connections between people and strengthens the ties between cities. A business activity can now be completed within a single day between a large city and a small city, where the employment position may be counted in the large city, but the economic benefits are generated in both. Moreover, HSR makes cross-city commuting more feasible, with some people choosing to work in large cities during the day and reside in surrounding small or medium-sized cities at night. The study’s conclusion that medium-sized cities may see greater benefits in resident population concentration due to the opening of HSR further supports this view. Therefore, it is necessary to move beyond the traditional mindset of viewing cities as independent entities and instead adopt a metropolitan area or urban cluster approach when planning future regional coordinated development strategies.

4.3. Medium-Sized Cities with Better Levels of Economic Development Are More Likely to Benefit from HSR

HSR is considered one of the key solutions for reducing regional development disparities [61]. From the perspective of economic growth, this study can confirm this viewpoint. HSR helps promote the economic growth of medium-sized cities with moderate levels of economic development. This finding can provide a reference for the spatial and temporal allocation strategy of future HSR construction funding. At present, the backbone framework of China’s HSR network has basically been formed, with HSR covering most of the mega and super-large cities. HSR construction has transitioned from building the framework to improving the structure. For both central and local governments, HSR construction represents a significant investment. Therefore, it is crucial to strategically consider how to use future funds rationally and orderly to enhance the HSR network [62]. Therefore, in future HSR network construction, priority should be given to covering medium-sized prefecture-level and county-level cities. Economically developed medium-sized cities should receive more attention, such as Taizhou in Jiangsu Province, which has not yet been connected to HSR. For smaller cities or cities with lower economic development levels, the immediate benefits from HSR are limited, and there might even be a “siphon effect” that could hinder their development. Therefore, in the case of limited funds, HSR construction for such cities should be carefully considered, and these cities can be included in the long-term planning of the HSR network.

4.4. Attention Should Be Paid to the Coordination between HSR Network and Urban System

Including HSR, regional transportation infrastructure has reshaped the urban network pattern [63]. The importance of the coordinated development of HSR networks and urban clusters needs to be emphasized [64]. Therefore, when conducting spatial planning and functional layout of urban agglomerations and metropolitan areas, the comprehensive impact of the HSR network must be fully considered to enhance the coordination of planning strategies. For small cities or those with lower economic development levels, it is crucial to strictly control the scale of HSR new town construction to avoid unnecessary financial waste. For medium-sized cities, there should be more focus on improving the quality of residential life, constructing high-quality residential areas, and providing medical, educational, and other public service facilities. For large and medium-sized cities with a strong industrial base, it is important to promote industrial restructuring, to provide a more diverse range of employment opportunities. Small cities near large cities do not necessarily need to be included in the HSR network; instead, consideration can be given to constructing intercity railways, metropolitan railways, and other transportation infrastructure to enhance cross-city transportation convenience and support cross-city commuting.

4.5. The General Applicability of the Analytical Methods Proposed in This Study

This study presents an evaluation method model suitable for assessing the actual promotional effects of HSR construction on urban development and has validated it using three lines in China. The analysis confirms the practicality of this method. As mentioned in the introduction, HSR construction will increasingly occur in countries outside China in the future. Therefore, if this research method can be applied globally in the future, it will hold significant academic value. To achieve this goal, it is essential to further examine the “rigid” aspects of the method model that must be adhered to in general application scenarios and the “flexible” aspects that can be adjusted according to specific case conditions. As shown in Figure 3, the evaluation process must include three “determinations”: determining the experimental and control group cities, determining two time points, and determining multiple dimensions for measuring urban development. The core of the evaluation model lies in the advantage index calculation based on the DID model. These are the “rigid” aspects that must be adhered to in any case application. Regarding “flexibility”, it is reflected in aspects such as the criteria for grouping experimental and control cities, the selection of key time points, the choice of different dimension indicators reflecting urban development, and further evaluation based on advantage index calculation results, which can be localized according to the specific situation of the case.

5. Conclusions

This study selects cities along the Beijing–Shanghai, Beijing–Guangzhou, and Harbin–Dalian HSR lines as research subjects. Based on the principles of proximity and similarity, cities with and without a HSR service were chosen as the experimental group and control group, respectively. Using the difference-in-differences (DID) method, the study introduces the concept of the outperformance index to systematically evaluate the impact of HSR on urban development from three dimensions: population aggregation, economic development, and land use expansion.
The conclusions of this study directly address the initial question: whether local governments’ efforts to promote urban development through the construction of HSR have been effective. The main findings of this study are as follows: (1) The promotion effect of HSR on the development of small to medium-sized cities is more reflected in economic growth and construction land growth. (2) The promotion effect of HSR on the development of large cities is more reflected in the growth of the employment population. (3) For smaller or economically less developed cities, HSR may be detrimental to the aggregation of resident and employment populations. (4) Cities with moderate size and good economic development have the opportunity to use HSR to promote population aggregation. Based on the analysis, this study also provides several policy recommendations for optimizing HSR construction strategies to promote coordinated development among large, medium, and small cities.
This study still has several limitations. For example, it cannot assess the structural changes in factors such as population due to HSR, it does not consider the impact of HSR station service capacity, and the implications of the analysis conclusions for future scenarios are limited. Therefore, there are several directions for further deepening this study in the future. First, refine the study of the impacts of different industrial categories. Currently, the indicators for economic growth and employment population aggregation use overall data. Different cities have varying industrial structures, and conducting correlation studies for different industry categories is expected to yield more findings. Second, incorporate the impact of urban HSR station levels and line accessibility. This study only considers the impact of changes from having no HSR to having it, without considering the level of HSR stations and the connectivity of the routes where the stations are located. These factors could be included in future research. Third, enhance research on future trend predictions by incorporating variables such as population development, changes in population structure, economic growth, and trends in urbanization, to increase the value of this research for decision-making references.

Funding

This research was funded by the National Natural Science Foundation of China (grant number 51908354).

Institutional Review Board Statement

Not applicable.

Informed Consent Statement

Not applicable.

Data Availability Statement

The population data used in this study can be found in the census publications which have already been cited in this paper. The economic data can be found in the China City Statistical Yearbook and the China County Statistical Yearbook. The CNLUCC data used in this study can be found in the website https://www.resdc.cn/DOI (accessed on 31 July 2024). The map data required for the study can be found in the atlases of the relevant years.

Conflicts of Interest

The author declares no conflicts of interest. The funders had no role in the design of the study; in the collection, analyses, or interpretation of data; in the writing of the manuscript; or in the decision to publish the results.

References

  1. Wang, Y.; Xiang, P. Evolutionary game and system dynamics for analysis on stakeholder strategies of regional high-speed rail project in investment decision stage. Technol. Soc. 2024, 77, 102575. [Google Scholar] [CrossRef]
  2. Li, Z.; Chen, Z. Predicting the future development scale of high-speed rail through the urban scaling law. Transp. Res. Part A Policy Pract. 2023, 174, 103755. [Google Scholar] [CrossRef]
  3. Zhang, H.L.; Chen, F.Y. The Impact of High-speed Railway on Regional Coordinated Development: An Empirical Analysis of Xuzhou-Lanzhou High-speed Railway. J. Shanghai Univ. (Soc. Sci. Ed.) 2018, 35, 91–106. [Google Scholar]
  4. Wang, H.X.; Shi, D.Q.; Yu, H.W. Will High-Speed Rail Promote Regional Economic Coordinated Development? Shanghai J. Econ. 2019, 59–69. [Google Scholar] [CrossRef]
  5. Chen, M.Z.; Zhang, W.K.; Zheng, R.B. Does High Speed Railway Promote the Economic Activities of Cities and Towns along the Line—Evidence from Dual Source Night Lighting. J. China Univ. Geosci. (Soc. Sci. Ed.) 2021, 21, 119–133. [Google Scholar]
  6. Lin, S.L.; Meng, X.C.; Zhu, X.C. Research on the Mechanism and Heterogeneity Effect of the High Speed Rail and Their Neighboring Effect. Soft Sci. 2020, 34, 66–71. [Google Scholar]
  7. Xia, X.; Li, H.; Wang, K.; Liu, Y. Analysis of the impact of high-speed rail on the spatio-temporal distribution of residential population and industrial structure. Heliyon 2023, 9, e21088. [Google Scholar] [CrossRef]
  8. Fang, J.; Fu, F.; Zhang, X.; Yao, S.; Ou, J. Impact of high-speed rail on the mismatch of labor and industry allocations: Evidence from Chinese cities in 2000–2019. J. Asian Econ. 2024, 92, 101744. [Google Scholar] [CrossRef]
  9. Yao, Z.Y.; Zhang, S.L.; Chen, X.L. Impact of the Opening of High-Speed Rail on Urban Population Change and Flow Economic Agglomeration. J. Hohai Univ. (Philos. Soc. Sci.) 2021, 23, 70–76. [Google Scholar]
  10. Li, Y.; Hu, Y.; Yang, J. The Impact of High-Speed Rail on the Transformation and Development of Shrinking Cities—A Research based on the Aggregation of the Three Elements. J. Beijing Univ. Technol. (Soc. Sci. Ed.) 2021, 21, 40–54. [Google Scholar]
  11. He, L. The Opening of High Speed Railway and Intergenerational Equity of City Development. J. Beijing Jiaotong Univ. (Soc. Sci. Ed.) 2021, 20, 64–77. [Google Scholar]
  12. Yoo, S.; Kumagai, J.; Managi, S. Urban-rural gap induced by high-speed rail: 35 years of evidence from Japan. Res. Transp. Bus. Manag. 2024, 55, 101131. [Google Scholar] [CrossRef]
  13. Lan, X.; Hu, Z.; Wen, C. Does the opening of high-speed rail enhance urban entrepreneurial activity? Evidence from China. Socio-Econ. Plan. Sci. 2023, 88, 101604. [Google Scholar] [CrossRef]
  14. Cen, C.; Jiang, W. The Opening of High-speed Rail, Spatial Spillover and Regional Economic Growth: Evidence from 21 Cities in Guangdong Province. Areal Res. Dev. 2020, 39, 24–27. [Google Scholar]
  15. You, S.B.; Zheng, L.C. Evaluation of the Pulling Effect of High-Speed Railway on the Economy of Medium-sized Cities along the Line. Reform 2018, 150–159. [Google Scholar]
  16. Xu, H.D. The Impact of Urban High-speed Rail on Industrial Upgrade and Industrial Coupling Coordination Degree. J. Cap. Univ. Econ. Bus. 2019, 21, 57–66. [Google Scholar]
  17. Sun, F.; Wang, Y.; Zhang, W.X. Impact of HSR on Industrial Sectors: A Case Study of Municipal Station Cities along Beijing-Shanghai High-Speed Rail, China. Mod. Urban Res. 2019, 103–110. [Google Scholar]
  18. Tang, K. The Influence of High-speed Railway on the Economic Development of Sation Cities Along the Line—A Case Study of Harbin-Dalian High Seed Railway and Zhengzhou-Xi’an High Speed Railway. J. Beijing Jiaotong Univ. (Soc. Sci. Ed.) 2020, 19, 45–61. [Google Scholar]
  19. Wu, G.H.; Zhang, X.J.; Li, Y.Q. The Influence of High-speed Railway on the Development of Urban Tourism Economy Based on the PSM-DID Model. J. Huaqiao Univ. (Philos. Soc. Sci.) 2020, 53–64. [Google Scholar] [CrossRef]
  20. Wu, H.; Zhang, X.Y. Research on the Influence of High Speed Rail on Tourism Development of Cities along the Line: Take Beijing-Guangzhou High Speed Railway as an Example. Econ. Probl. 2020, 85–94. [Google Scholar] [CrossRef]
  21. Wang, S.; Zhou, Y.; Guo, J.; Mao, J. Did high speed rail accelerate the development of tourism economy?—Empirical analysis from Northeast China. Transp. Policy 2023, 143, 25–35. [Google Scholar] [CrossRef]
  22. Hou, Y. Agglomeration spillover, accessibility by high-speed rail, and urban innovation in China: A focus on the electronic information industry. Habitat Int. 2022, 126, 102618. [Google Scholar] [CrossRef]
  23. Lu, W.B.; Jia, J. High-Speed Railway, Urban Development and Unbalanced Regional Economic Development. East China Econ. Manag. 2018, 32, 5–14. [Google Scholar]
  24. Zheng, L.; Chang, Z.; Martinez, A.G. High-speed rail, market access, and the rise of consumer cities: Evidence from China. Transp. Res. Part A Policy Pract. 2022, 165, 454–470. [Google Scholar] [CrossRef]
  25. Li, R.; Xu, M.; Zhou, H. Impact of high-speed rail operation on urban economic resilience: Evidence from local and spillover perspectives in China. Cities 2023, 141, 104498. [Google Scholar] [CrossRef]
  26. Li, Y.; Fu, W.Y.; Wang, P. The Impact of High-speed Railway Service Supply on the High-quality Development of Urban Agglomeration Economy-Based on the Test of Multiple Mediation Effect. Res. Econ. Manag. 2020, 41, 62–77. [Google Scholar]
  27. Lan, X.J. Does High-speed Rail Network Promote High-quality Economic Development of Urban Agglomeration? Res. Econ. Manag. 2022, 43, 106–128. [Google Scholar]
  28. Qi, X.; Wang, L.J.; Zhang, J.X.; Wang, F.Y. Spatial Association of Urban Agglomeration and Its Economic Growth Effect Under the Influence of High-speed Railway. Sci. Geogr. Sin. 2021, 41, 416–427. [Google Scholar]
  29. Wang, L.; Cao, Y.H.; Yao, S.M. Review and Evaluation of High-Speed Railways Impact on Urban Space. Resour. Environ. Yangtze Basin 2012, 21, 1073–1079. [Google Scholar]
  30. Chen, Z.; Zhou, Y.; Haynes, K.E. Change in land use structure in urban China: Does the development of high-speed rail make a difference. Land Use Policy 2021, 111, 104962. [Google Scholar] [CrossRef]
  31. Wu, R.; Li, Y.; Wang, S. Will the construction of high-speed rail accelerate urban land expansion? Evidences from Chinese cities. Land Use Policy 2022, 114, 105920. [Google Scholar] [CrossRef]
  32. Yu, M.; Chen, Z.; Long, Y.; Mansury, Y. Urbanization, land conversion, and arable land in Chinese cities: The ripple effects of high-speed rail. Appl. Geogr. 2022, 146, 102756. [Google Scholar] [CrossRef]
  33. Tan, R.H.; Zhang, T.Q. Evaluating the Impact of High-speed Railway on Urban Land Expansion Based on Multi-period Difference-in-Difference Model. China Land Sci. 2019, 33, 39–50. [Google Scholar]
  34. Wang, D.; Wei, Y.D.; Deng, T. Transportation Development, Spatiotemporal Convergence, and Urban Land Use: Study of the Opening of High-Speed Rails in the Yangtze River Delta, China. J. Urban Plan. Dev. 2021, 147, 5021023. [Google Scholar] [CrossRef]
  35. Zheng, L.C.; Shikha, T.M. Whether China’s High Speed Railway Significantly Affects Urban Land Use—Answers from Stations, Routes and Typical Urban Land Use Changes. J. Hebei Univ. (Philos. Soc. Sci.) 2022, 47, 62–75. [Google Scholar]
  36. Zhu, P. Does high-speed rail stimulate urban land growth? Experience from China. Transp. Res. Part D: Transp. Environ. 2021, 98, 102974. [Google Scholar] [CrossRef]
  37. Lu, X.; Tang, Y.; Ke, S. Does the Construction and Operation of High-Speed Rail Improve Urban Land Use Efficiency? Evidence from China. Land 2021, 10, 303. [Google Scholar] [CrossRef]
  38. Huang, Z.; Du, X. How does high-speed rail affect land value? Evidence from China. Land Use Policy 2021, 101, 105068. [Google Scholar] [CrossRef]
  39. Wang, Y.; Ruan, H.; Tian, C. Access to high-speed rail and land prices in China’s peripheral regions. Cities 2022, 130, 103877. [Google Scholar] [CrossRef]
  40. Chang, Z.; Zheng, L.; Yang, T.; Long, F. High-speed rail, new town development, and the spatial mismatch of land leases in China. Land Use Policy 2022, 115, 106014. [Google Scholar] [CrossRef]
  41. Zhou, Y.L.; Yang, J.D.; Huang, Y.H.; Geoffrey, J.D.H. Study on the Impact of High Speed Rail on Land Price and Its Mechanism: Evidence from Micro Land Transactions. China Ind. Econ. 2018, 118–136. [Google Scholar]
  42. Okamoto, C.; Sato, Y. Impacts of high-speed rail construction on land prices in urban agglomerations: Evidence from Kyushu in Japan. J. Asian Econ. 2021, 76, 101364. [Google Scholar] [CrossRef]
  43. Xiao, C.W.; Liu, Y.; Li, P.; Jiang, L.G. Evaluation of the High-speed Rail New Town Based on Coordination of Urban Spatial Expansion and Population Growth. J. Nat. Resour. 2016, 31, 1440–1451. [Google Scholar]
  44. Zhao, Q.; Chen, G. Influence of HSR Station Location on the Development of Surrounding Areas: A Case Study of Beijing-Shanghai HSR and Wuhan-Guangzhou HSR. City Plan. Rev. 2015, 39, 50–55. [Google Scholar]
  45. Xiong, C.S.; Hu, Y.Y.; Gao, H.X. Net Effect of Hainan East Ring High-Speed Railway Stations on the Surrounding Construction Land Expansion under the Counterfactual Analysis Framework. China Land Sci. 2022, 36, 91–102. [Google Scholar]
  46. Li, Z.; Yu, T. Research on the Development Mechanism of High-Speed Rail New City in Small Cities Based on the Theory of Urban Government: A Case Study of Tengzhou, Shandong Province. Mod. Urban Res. 2020, 18–24. [Google Scholar]
  47. Wang, Y.; Zhang, F. High-speed rail and distribution of economic activities: Evidence from prefecture-level cities in China. Res. Transp. Bus. Manag. 2023, 51, 101065. [Google Scholar] [CrossRef]
  48. Wang, L.; Yuan, F.; Duan, X. How high-speed rail service development influenced commercial land market dynamics: A case study of Jiangsu province, China. J. Transp. Geogr. 2018, 72, 248–257. [Google Scholar] [CrossRef]
  49. Tang, Z.; Wang, L.; Wu, W. The impact of high-speed rail on urban carbon emissions: Evidence from the Yangtze River Delta. J. Transp. Geogr. 2023, 110, 103641. [Google Scholar] [CrossRef]
  50. Li, X.; Cheng, Z. Does high-speed rail improve urban carbon emission efficiency in China? Socio-Econ. Plan. Sci. 2022, 84, 101308. [Google Scholar] [CrossRef]
  51. Sun, L.; Li, W. Has the opening of high-speed rail reduced urban carbon emissions? Empirical analysis based on panel data of cities in China. J. Clean. Prod. 2021, 321, 128958. [Google Scholar] [CrossRef]
  52. Su, W.; Xie, C. High-speed rail, technological improvement, and PM2.5: Evidence from China. Econ. Anal. Policy 2023, 80, 1349–1362. [Google Scholar] [CrossRef]
  53. Fang, J. Impacts of high-speed rail on urban smog pollution in China: A spatial difference-in-difference approach. Sci. Total Environ. 2021, 777, 146153. [Google Scholar] [CrossRef] [PubMed]
  54. Wang, F.; Shan, J.; Liu, J.; Fan, W.; Yan, B.; Zhao, H.; Luo, S. How does high-speed rail construction affect air pollutant emissions? Evidence from the Yangtze River Delta Urban Agglomeration in China. J. Clean. Prod. 2022, 350, 131471. [Google Scholar] [CrossRef]
  55. Sun, Y.; Razzaq, A.; Kizys, R.; Bao, Q. High-speed rail and urban green productivity: The mediating role of climatic conditions in China. Technol. Forecast. Soc. Chang. 2022, 185, 122055. [Google Scholar] [CrossRef]
  56. Population Census Office under the State Council; Department of Populationand Employment Statistics, National Bureau of Statistics. Tabulation on the 2010 Population Census of the People’s Republic of China by County; China Statistics Press: Beijing, China, 2012.
  57. Office of the Leading Group of the State Council for the Seventh National Population Census. Tabulation on 2020 China Population Census by County; China Statistics Press: Beijing, China, 2022.
  58. Xiong, C.S.; Tian, Y.; Luan, Q.L. Causes and Temporal Heterogeneity of Land Use/Land Cover Changes Around High-speed Railway Stations: A Case Study of Hainan Roundabout Railway. China Land Sci. 2023, 37, 124–134. [Google Scholar]
  59. Xu, X.; Liu, J.; Zhang, S.; Li, R.; Yan, C.; Wu, S. China’s Multi-Period Land Use Land Cover Remote Sensing Monitoring Data Set (CNLUCC). Beijing: Data Registration and Publication System of Resource and Environmental Science Data Center, Chinese Academy of Sciences. 2018. Available online: https://www.resdc.cn/DOI (accessed on 31 July 2024).
  60. Li, X.G.; Huang, A.M.; Zhang, Y.Q. An Impact Assessment of High-Speed Railway on Regional Economic Development: An Empirical Analysis of Fujian Province Based on DID Model. Mod. Urban Res. 2017, 4, 125–132. [Google Scholar]
  61. Gong, W.; Li, V.J. The territorial impact of high-speed rail on urban land development. Cities 2022, 125, 103581. [Google Scholar] [CrossRef]
  62. Xu, W.A.; Long, Y.; Zhang, W. Prioritizing future funding and construction of the planned high-speed rail corridors of China—According to regional structure and urban land development potential indices. Transp. Policy 2019, 81, 381–395. [Google Scholar] [CrossRef]
  63. Yang, H.; Du, D.; Wang, J.; Wang, X.; Zhang, F. Reshaping China’s urban networks and their determinants: High-speed rail vs. air networks. Transp. Policy 2023, 143, 83–92. [Google Scholar] [CrossRef]
  64. Sun, X.; Yan, S.; Liu, T.; Wang, J. The impact of high-speed rail on urban economy: Synergy with urban agglomeration policy. Transp. Policy 2023, 130, 141–154. [Google Scholar] [CrossRef]
Figure 1. Spatial distribution of HSR operations in China (2003–2014). (Note: the base map of China uses data from the Standard Map Service Website of the Ministry of Natural Resources of China, with the number GS(2019)1651).
Applsci 14 08571 g001
Figure 2. Spatial distribution of the three HSR lines selected in this study. (Note: the base map of China uses data from the Standard Map Service Website of the Ministry of Natural Resources of China, with the number GS(2019)1651).
Applsci 14 08571 g002
Figure 3. Framework Diagram of the Research Methodology.
Applsci 14 08571 g003
Figure 4. Spatial distribution of experimental group cities on the three HSR lines and nearby control group cities.
Applsci 14 08571 g004
Figure 5. Scatter plot and linear regression equation of city size and D a indicators.
Applsci 14 08571 g005
Figure 6. The average performance of D a values for different indicators in cities of varying sizes.
Applsci 14 08571 g006
Figure 7. Scatter plot and linear regression equation of economic development levels and D a indicators.
Applsci 14 08571 g007
Figure 8. The average performance of D a values for different indicators in cities of varying economic development levels.
Applsci 14 08571 g008
Figure 9. Dendrogram using average linkage of cluster by advantage index of 60 cities.
Applsci 14 08571 g009
Table 1. The average performance of D a values for different indicators in cities along the three lines.
Line Average   Value   of   D a R Average   Value   of   D a E Average   Value   of   D a G Average   Value   of   D a L
Beijing–Shanghai HSR0.06260.0857−0.10090.0368
Beijing–Guangzhou HSR0.01570.03280.02960.0060
Harbin–Dalian HSR0.05050.0236−0.07730.0044
Table 2. The average performance of D a values for different indicators in cities of varying administrative levels.
Administrative Level Average   Value   of   D a R Average   Value   of   D a E Average   Value   of   D a G Average   Value   of   D a L
Prefecture-level cities0.06060.0777−0.0839−0.0014
County-level cities and counties0.00470.00330.03890.0378
Table 3. The average performance of D a values for different indicators in cities of varying sizes.
City Size
(Unit: Million)
Average   Value   of   D a R Average   Value   of   D a E Average   Value   of   D a G Average   Value   of   D a L
0–0.2−0.0542−0.13110.43631.1551
0.2–0.50.97940.56021.66180.1472
0.5–10.48940.94201.1322−0.3139
above 10.82361.4297−5.1937−0.0929
Table 4. The average performance of D a values for different indicators in cities of varying economic development levels.
Economic Development Levels Average   Value   of   D a R Average   Value   of   D a E Average   Value   of   D a G Average   Value   of   D a L
Low−0.0107−0.0428−0.1075−0.1477
Middle0.03790.06260.11980.1056
High0.14600.2094−0.27280.1441
Table 5. Seven types of experimental group cities based on systematic cluster analysis.
ClassificationCountList of Cities
A17Langfang, Qufu, Suzhou(AH), Gaobeidian, Xuchang, Zhumadian, Miluo
A22Cangzhou, Chuzhou
B18Zaozhuang, Xuzhou, Dingyuan, Suzhou(JS), Gaoyi, Leiyang, Shaoguan, Qingyuan
B214Tieling, Handan, Hebi, Xinyang
B2213Yueyang, Zhuzhou, Chenzhou
B222114Dehui, Liaoyang, Yingkou, Gaizhou, Wafangdian, Zhuozhou, Dingzhou, Zhengding, Xinxiang, Dawu, Chibi, Hengshan, Hengyang, Yingde
B222222Fuyu, Gongzhuling, Siping, Changtu, Kaiyuan, Anshan, Haicheng, Dezhou, Taian, Tengzhou, Bengbu, Zhenjiang, Danyang, Changzhou, Wuxi, Kunshan, Baoding, Xingtai, Anyang, Luohe, Xianning, Lechang
Disclaimer/Publisher’s Note: The statements, opinions and data contained in all publications are solely those of the individual author(s) and contributor(s) and not of MDPI and/or the editor(s). MDPI and/or the editor(s) disclaim responsibility for any injury to people or property resulting from any ideas, methods, instructions or products referred to in the content.

