
Fatigue Characteristics Analysis of Carbon Fiber Laminates with Multiple Initial Cracks


Abstract
:1. Introduction
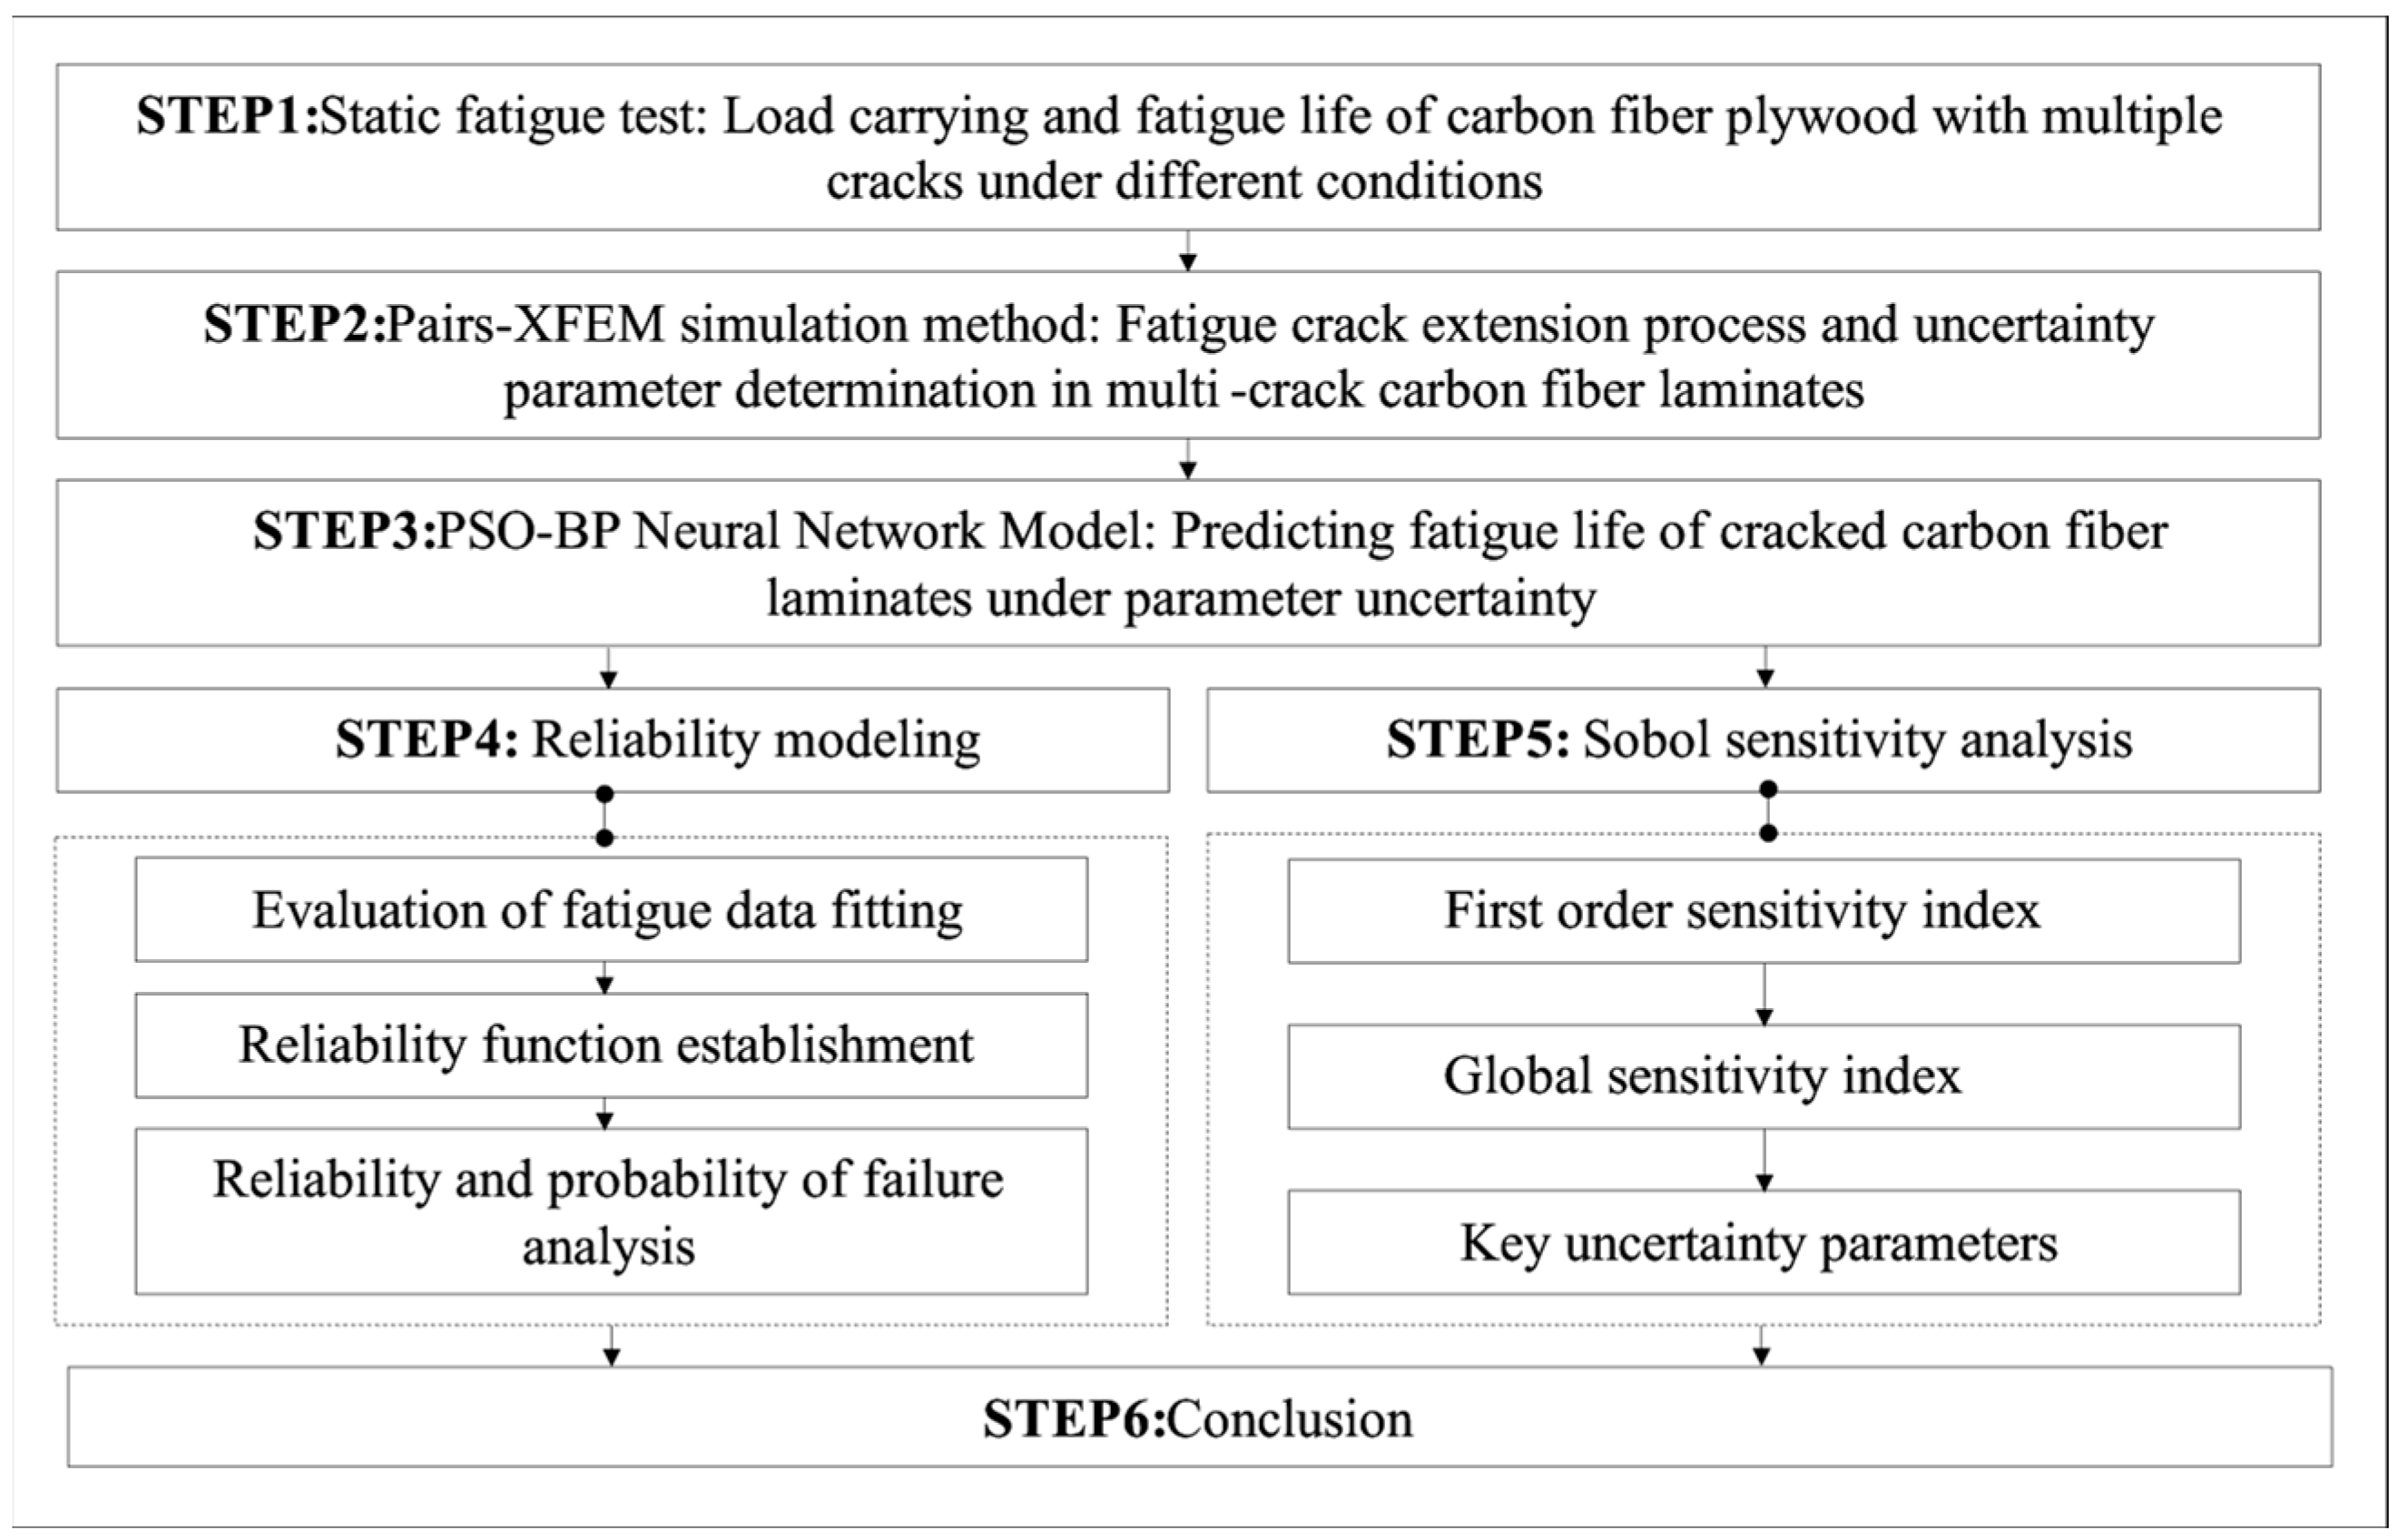
2. Methods
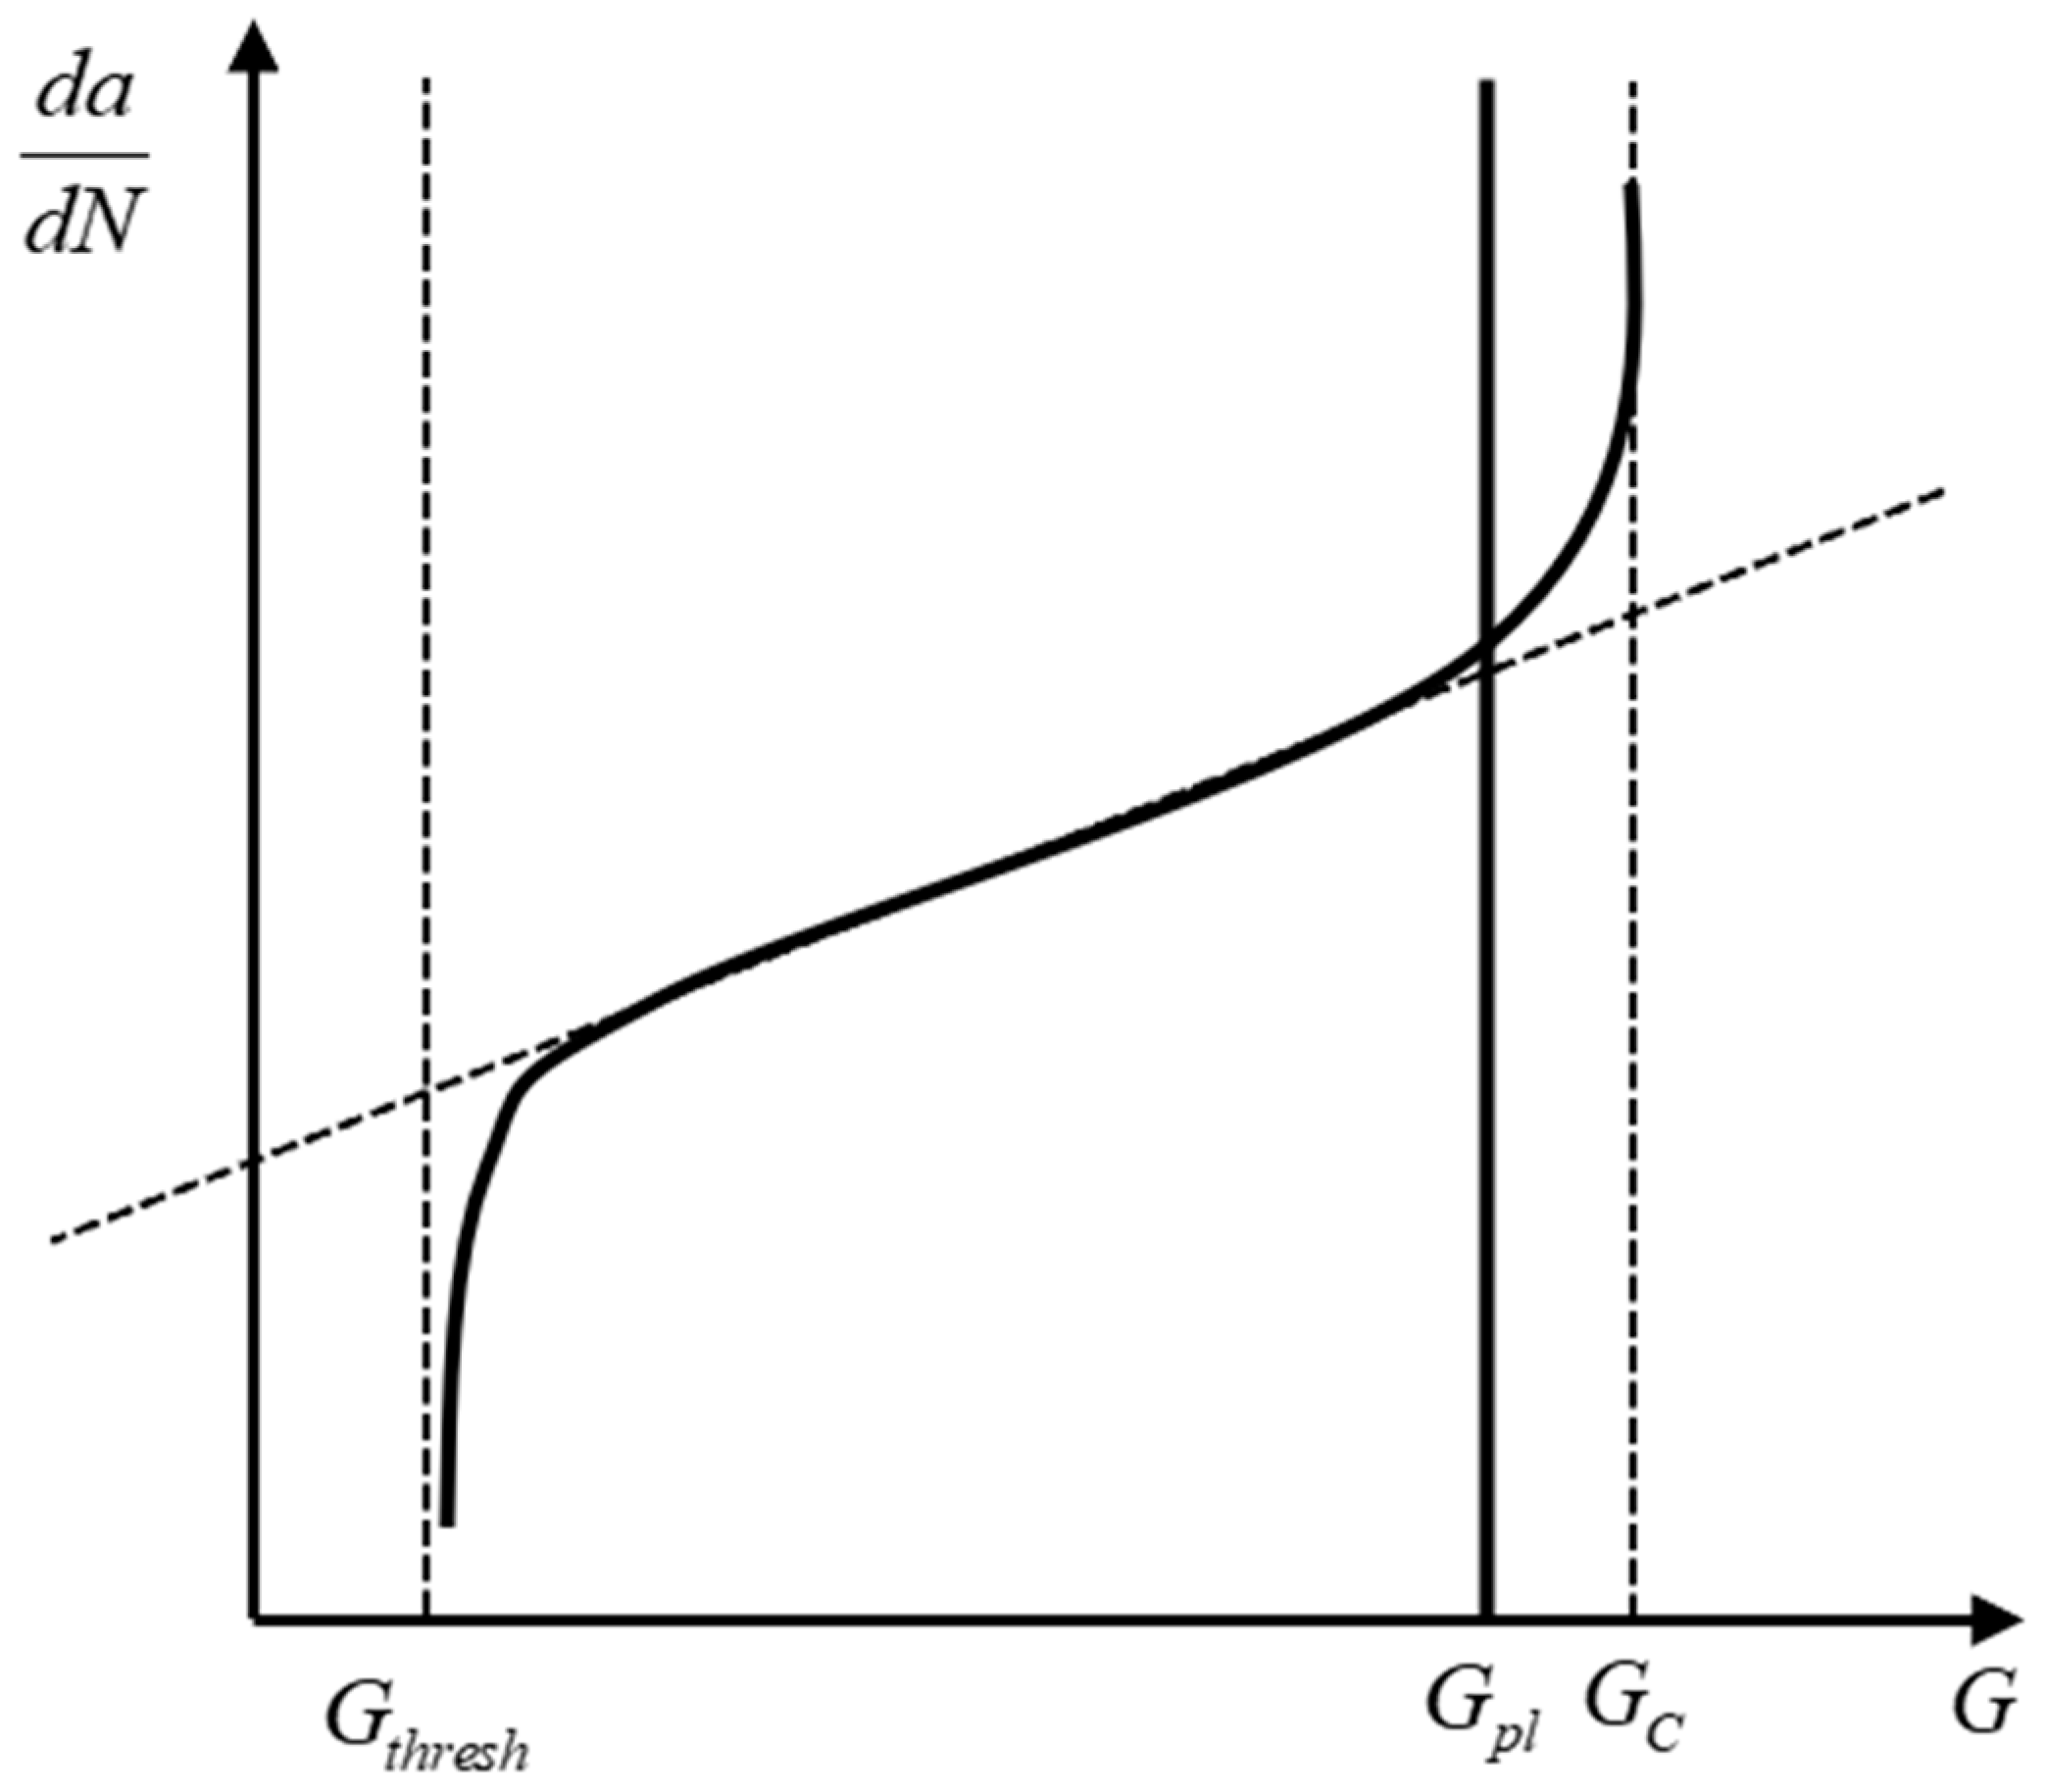
2.1. Paris-XFEM Method
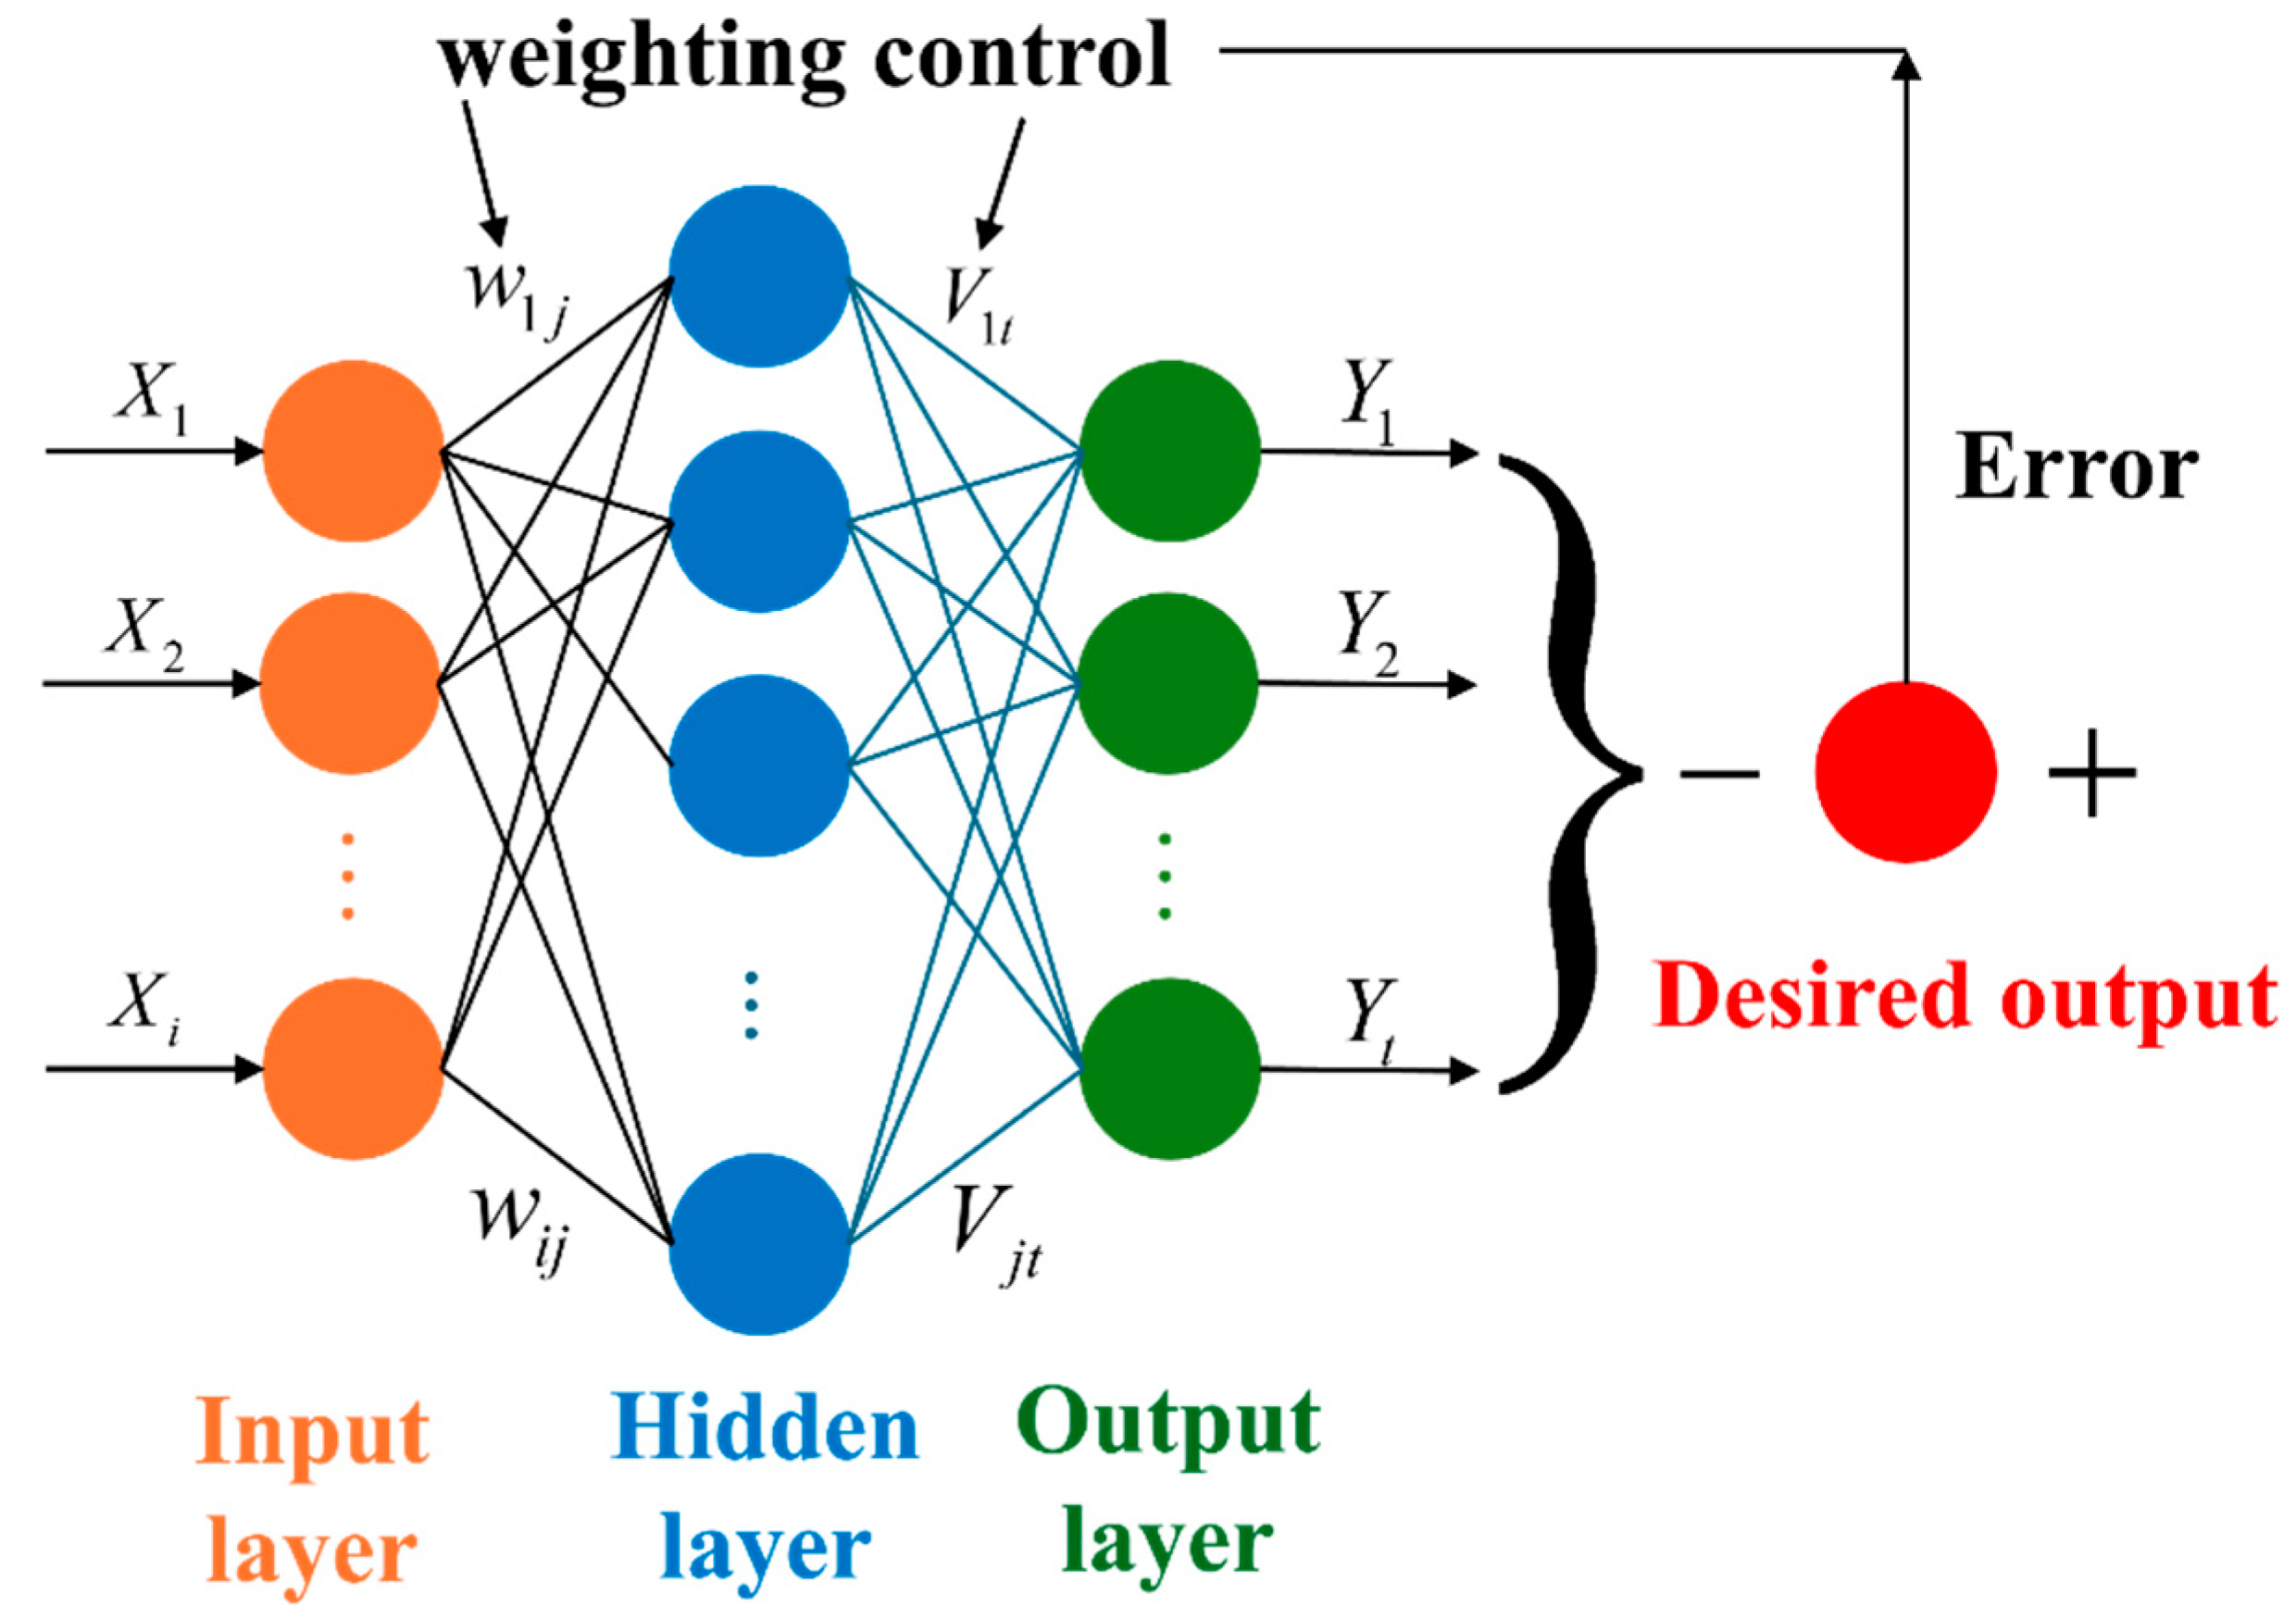
2.2. An PSO–BP Life Prediction Model
2.2.1. BP Neural Network
2.2.2. PSO–BP Neural Network
2.3. Sobol Sensitivity Analysis
3. Experimental Tests
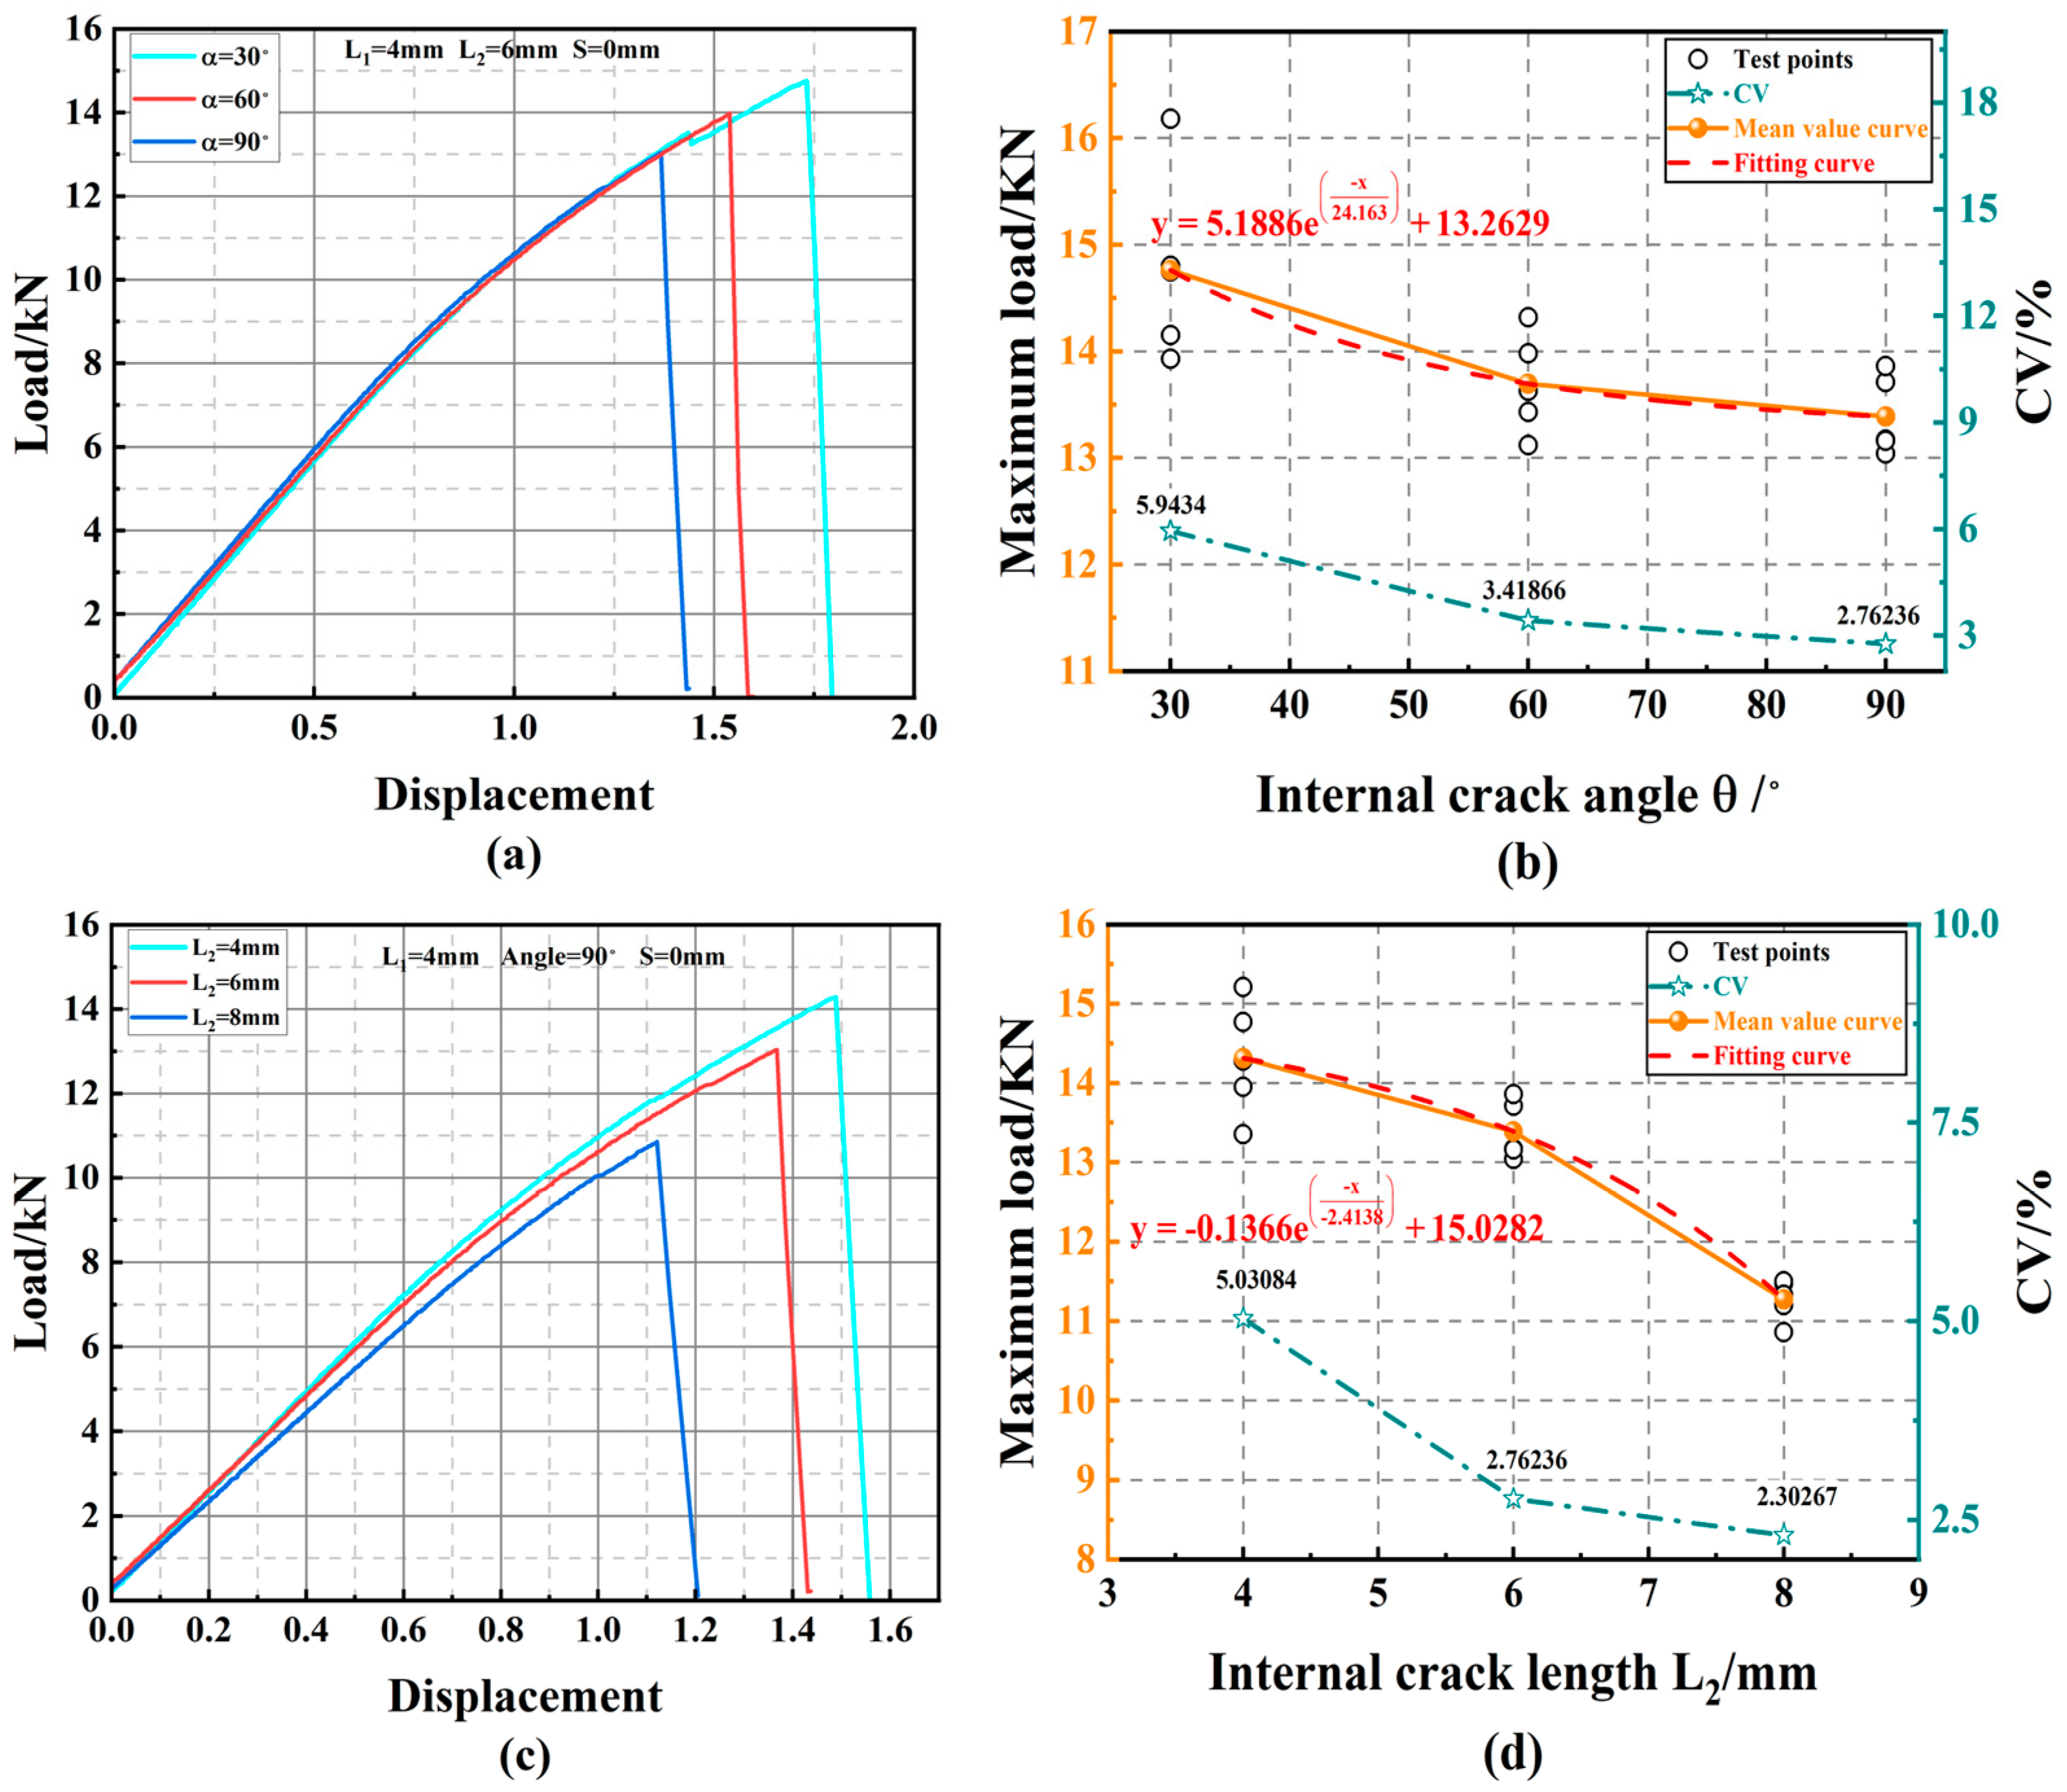
3.1. Static Test
3.2. Fatigue Test
4. Fatigue Simulation Analysis
5. Fatigue Reliability Modeling of Multi-Cracked Laminates
5.1. Uncertainty Analysis
5.2. Fatigue Life and Reliability Modeling
5.2.1. Fatigue Life Prediction Method Based on Surrogate Model
5.2.2. Fatigue Reliability Modeling
5.3. Sensitivity Analysis
6. Conclusions
- The results of static fatigue tests on carbon fiber laminates, which exhibit multiple cracks of varying configurations, reveal that variations in crack length are the predominant factor influencing the service life of carbon fiber laminates under fatigue conditions. Additionally, the dispersion of static fatigue data diminishes as the variables increase within the same level, whereas the dispersion in fatigue life data is significant and exhibits no clear pattern. At the specific condition where internal cracks measured L1 = L2 = 4 mm and the angle θ was 90°, the coefficient of variation peaked at 16.33%. This significant alteration highlights the considerable influence that uncertainties in physical parameters have on the service life of carbon fiber laminates when subjected to fatigue;
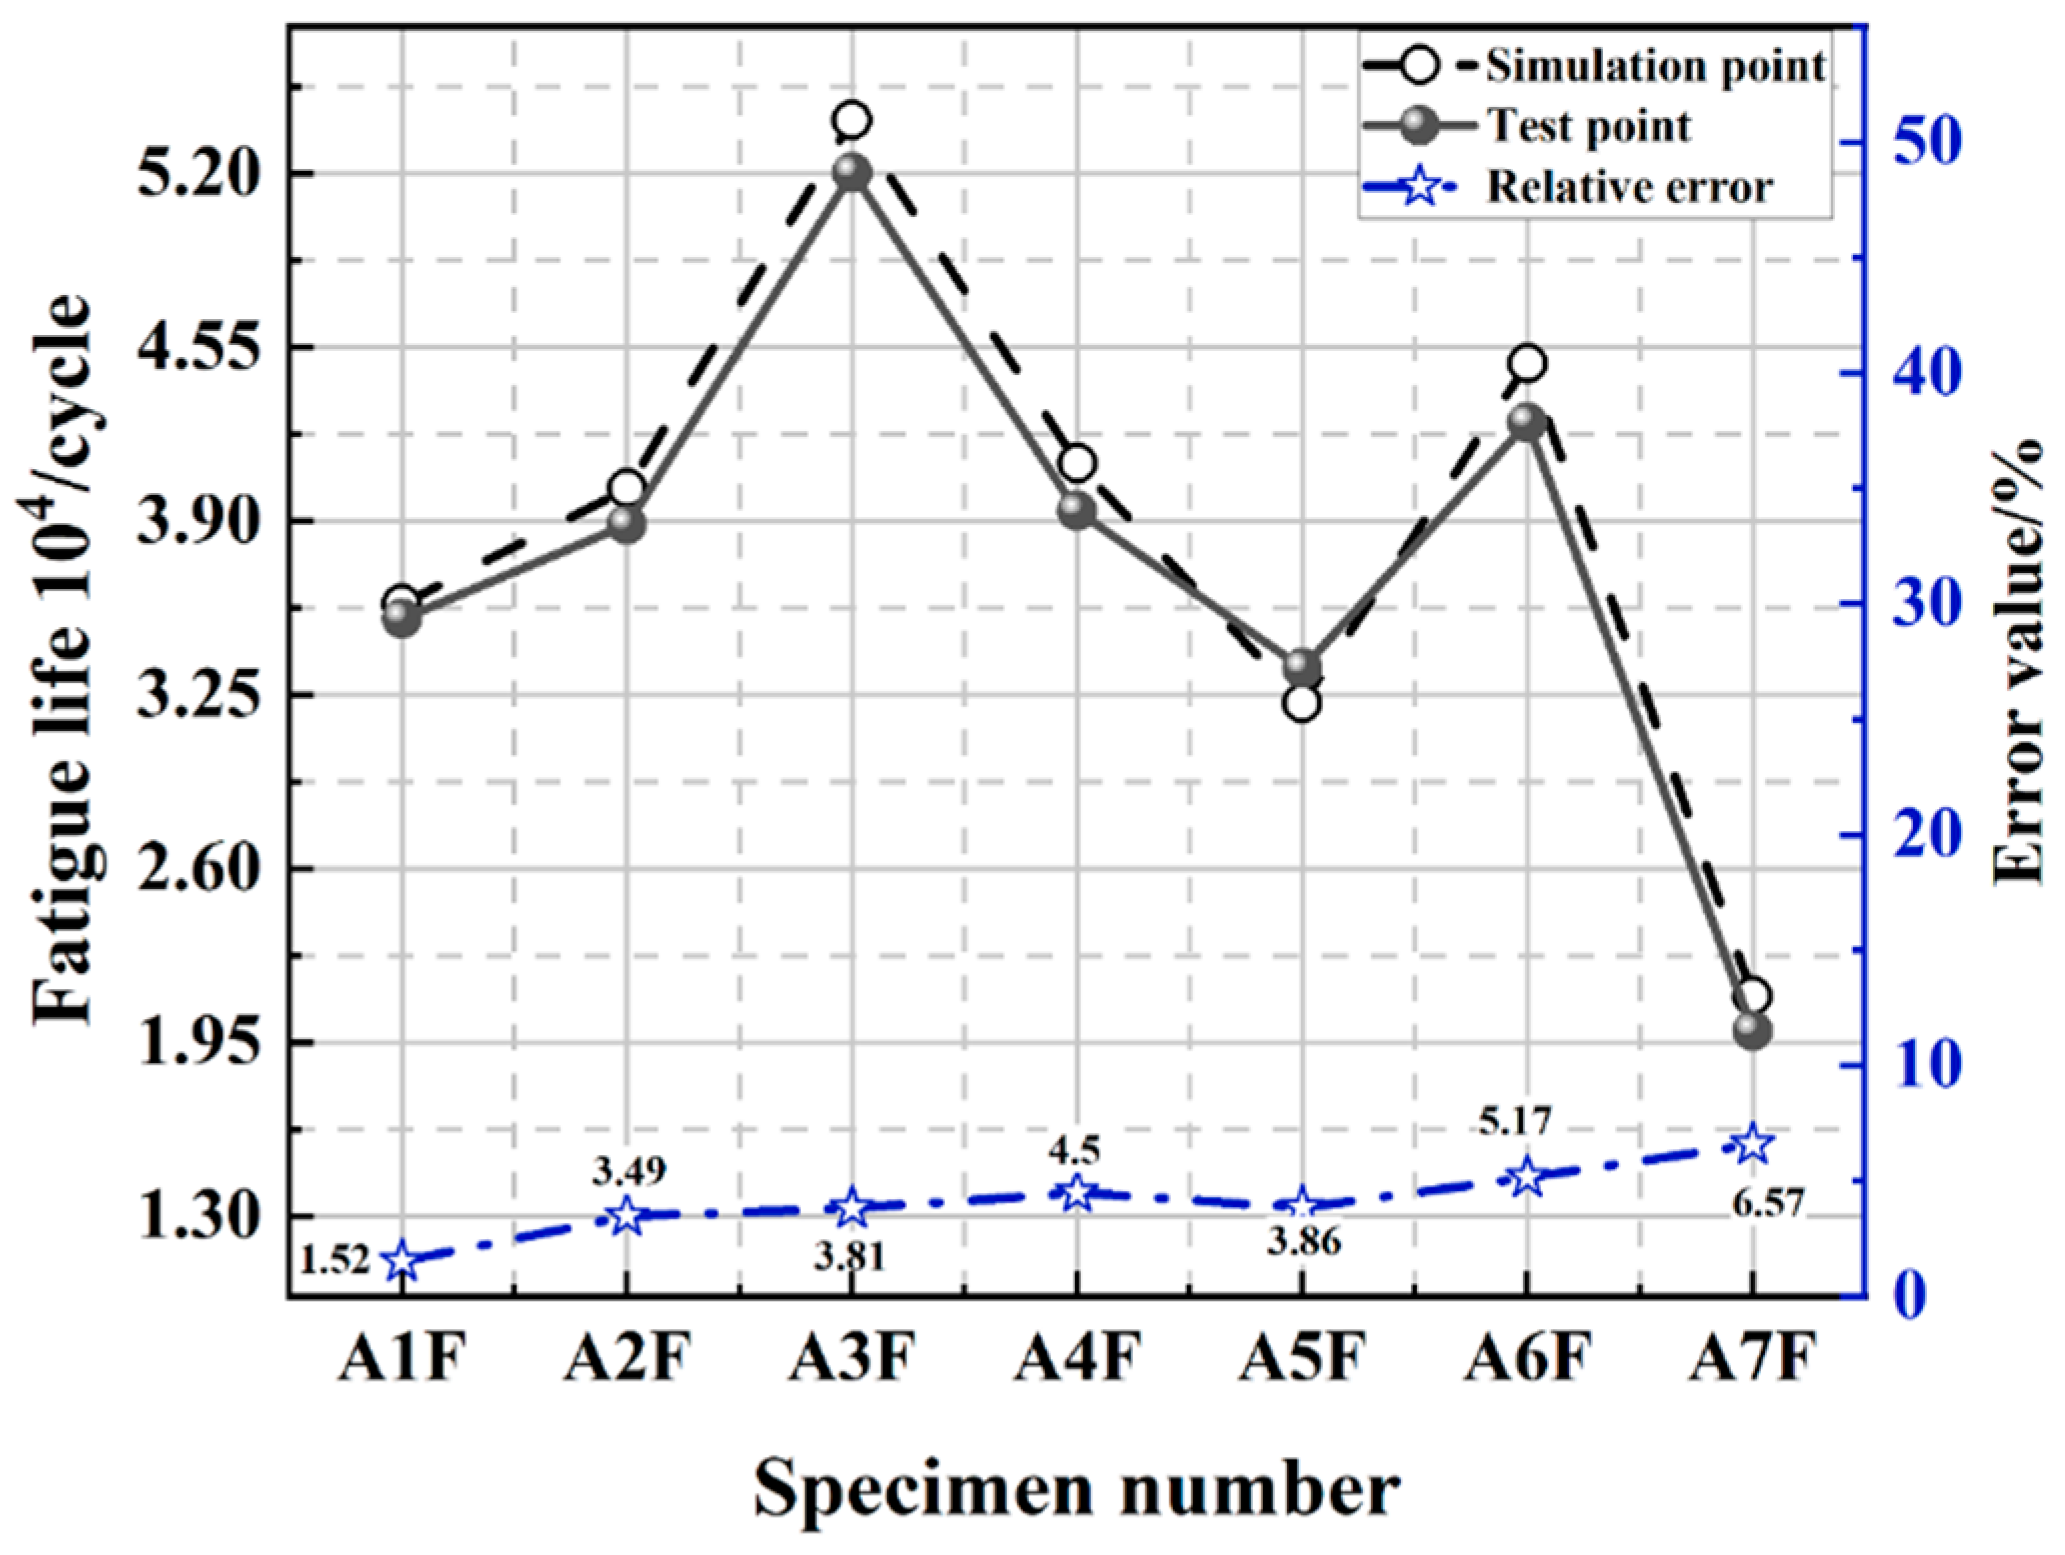
- To efficiently overcome the challenges of high costs, extended timelines, and data limitations in fatigue testing, the XFEM method is employed for simulating the fatigue behavior of carbon fiber laminates containing multiple cracks. The comparison with experimental data shows a relative error within an acceptable 10% margin, satisfying practical engineering standards. The simulation captures the progression of fatigue crack growth at various stages of the material’s lifespan, providing a means of ascertaining the physical parameters subject to uncertainty;
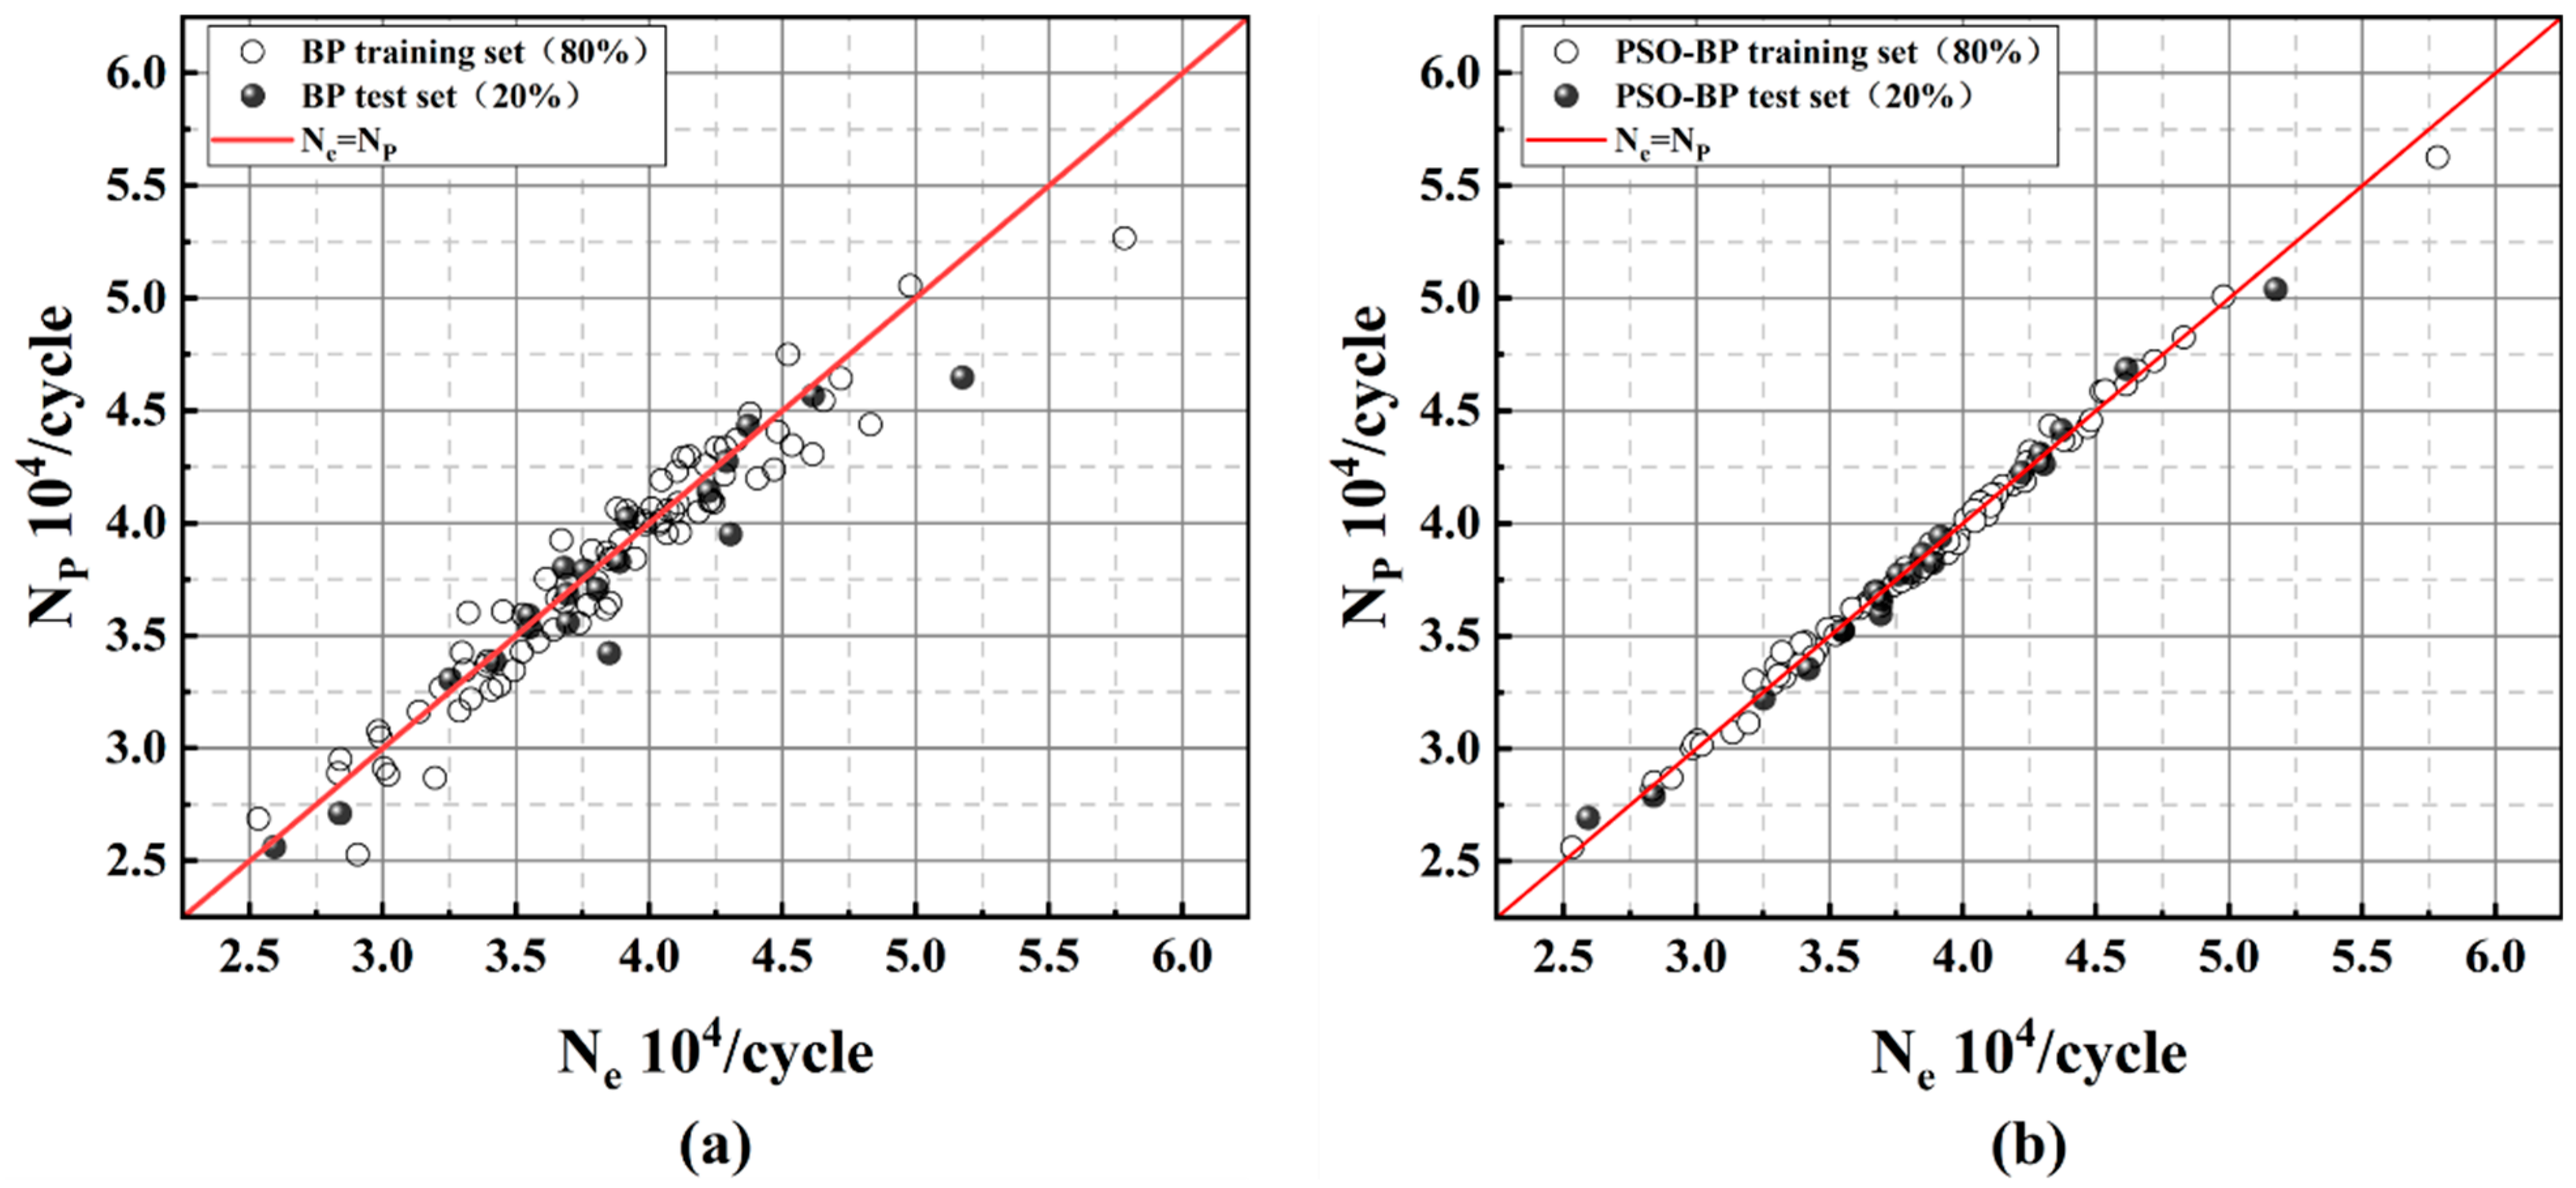
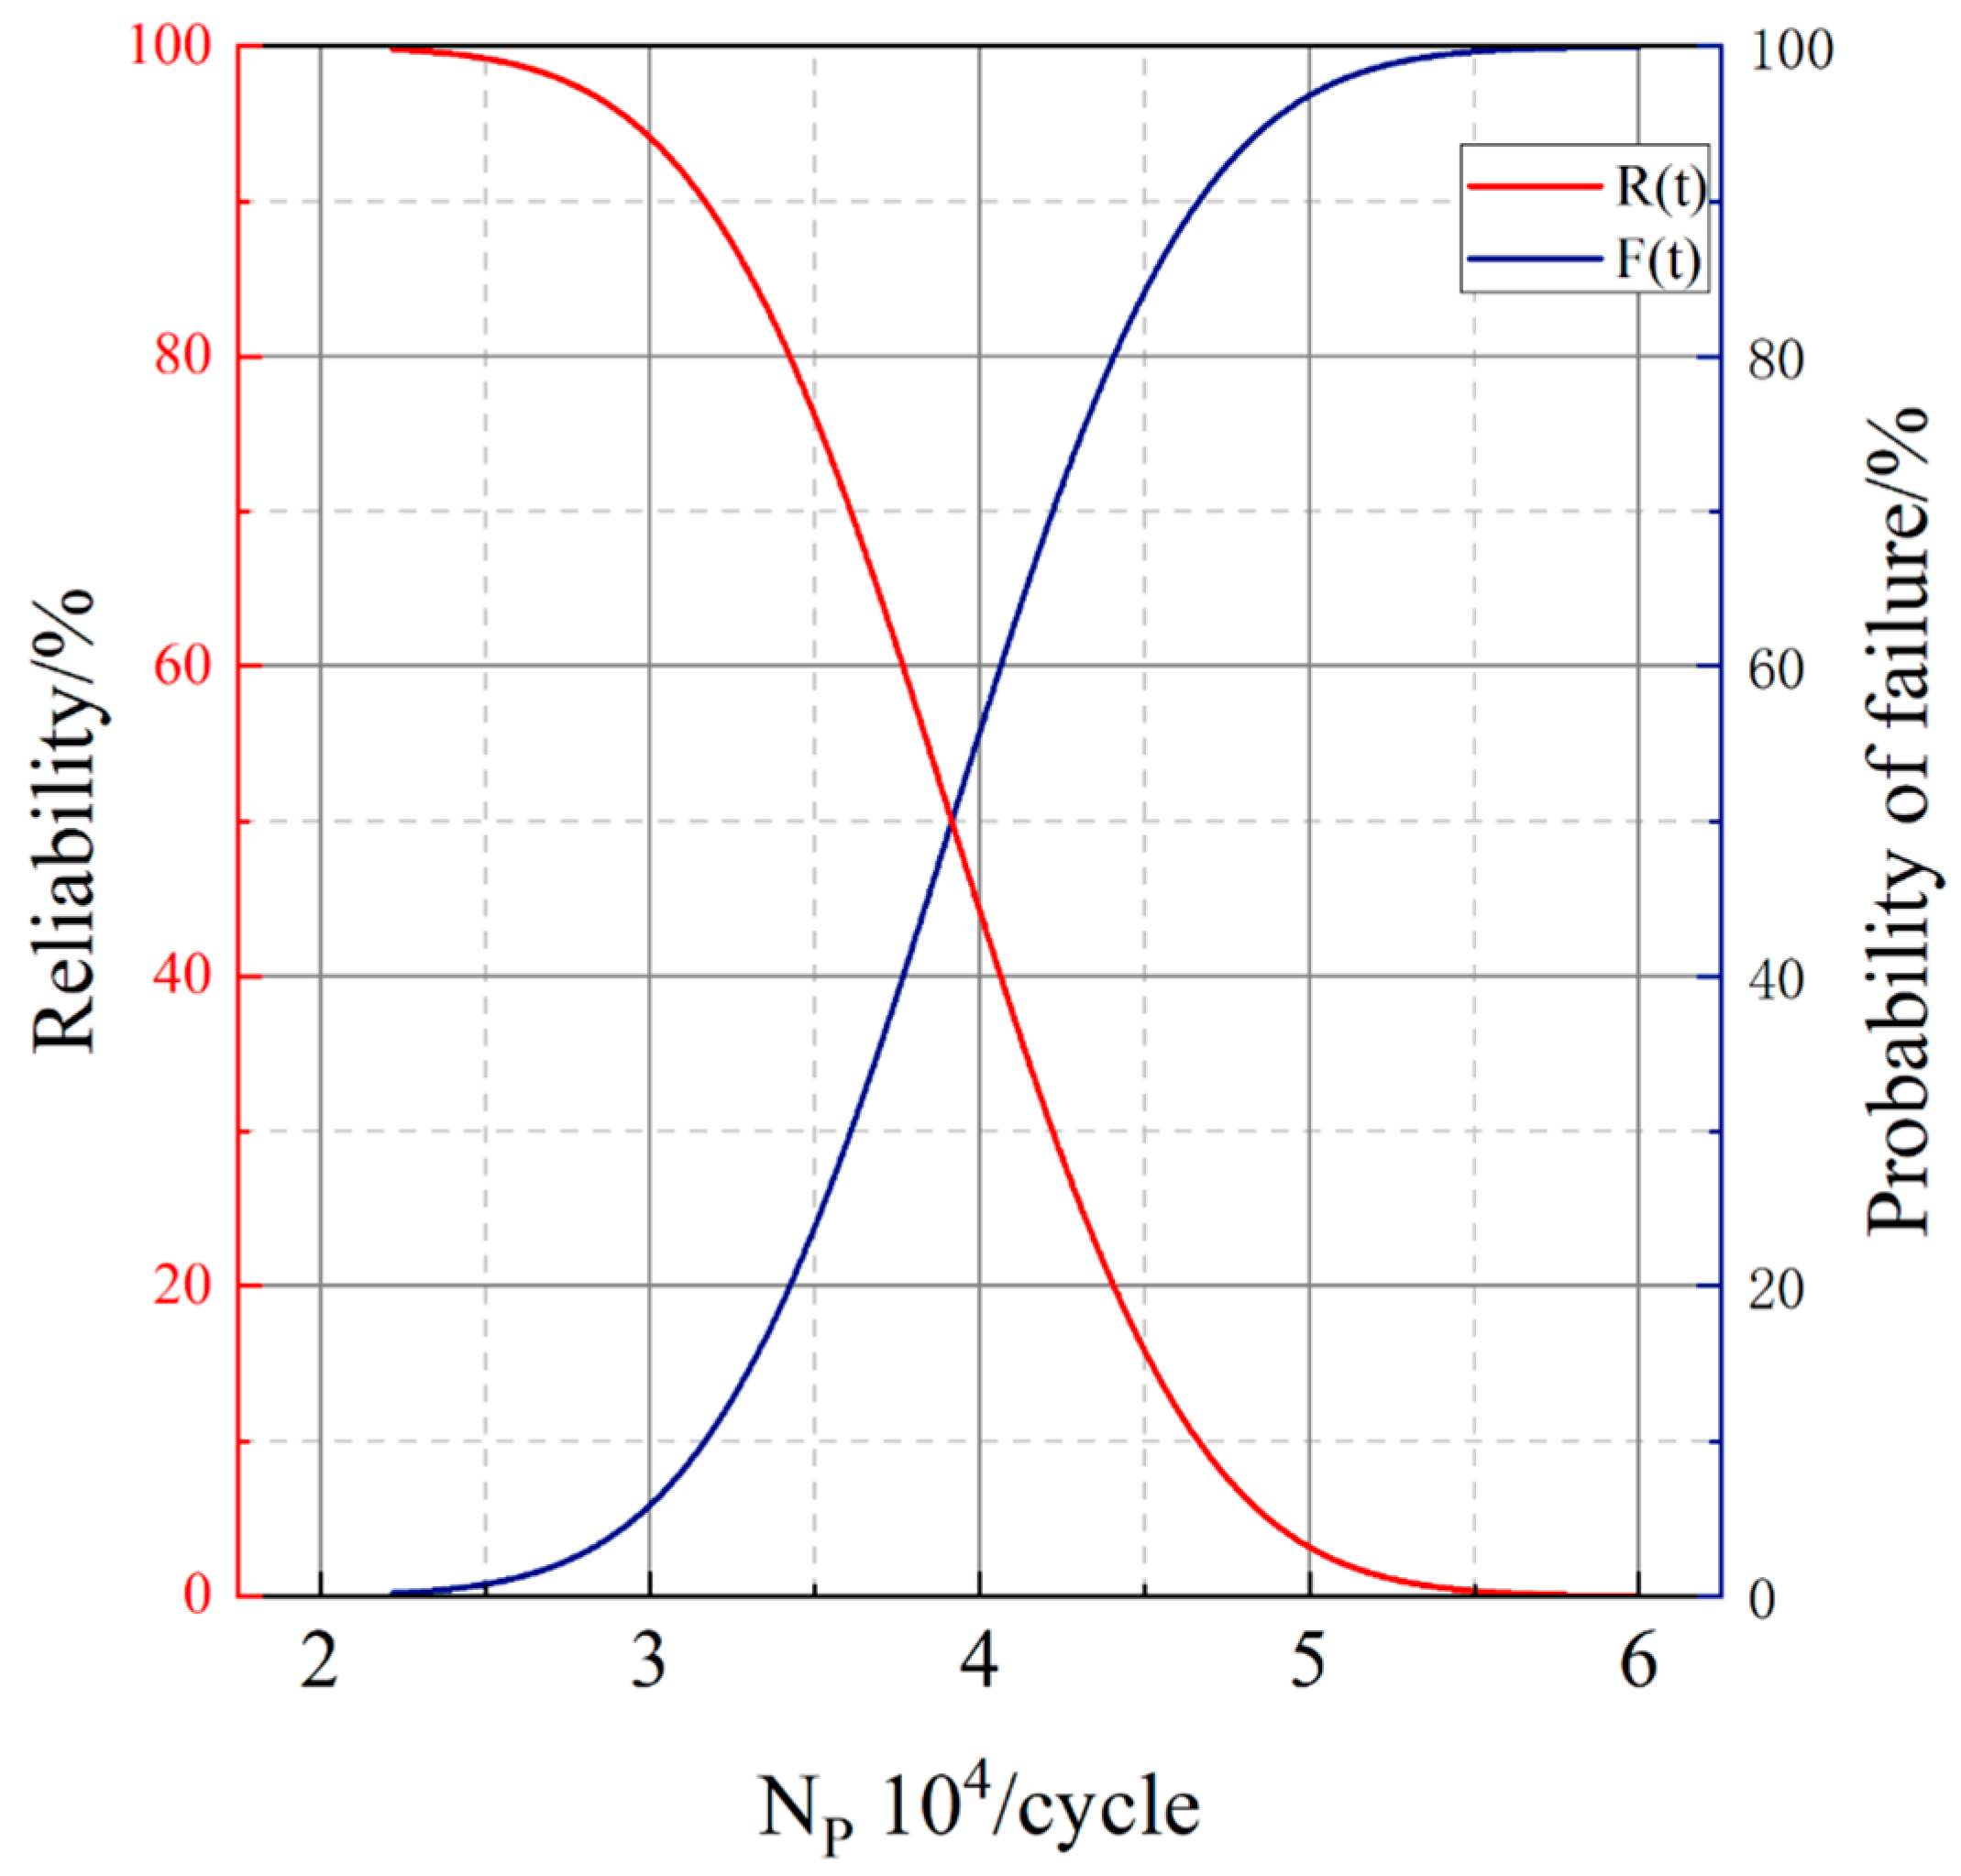
- Utilizing the PSO–BP neural network, a fatigue life prediction model for carbon fiber laminates with multiple cracks is established, and based on this, a reliability function is constructed to assess its fatigue reliability. The Sobol method is then applied for sensitivity analysis on the 13 parameters that influence fatigue life, as identified through simulation. The analysis concludes that the most significant parameters affecting the fatigue life of the carbon fiber plate are the lengths of the edge and internal cracks and the angle between them, with the length of the edge crack having the greatest impact.
Author Contributions
Funding
Institutional Review Board Statement
Informed Consent Statement
Data Availability Statement
Conflicts of Interest
References
- Bošnjaković, M.; Katinić, M.; Santa, R.; Marić, D. Wind Turbine Technology Trends. Appl. Sci. 2022, 12, 8653. [Google Scholar] [CrossRef]
- Teng, H.; Li, S.; Cao, Z.; Li, S.; Li, C.; Ko, T.J. Carbon Fiber Composites for Large-Scale Wind Turbine Blades: Applicability Study and Comprehensive Evaluation in China. Mar. Sci. Eng. 2023, 11, 624. [Google Scholar] [CrossRef]
- Huang, H.Z.; Liu, Z.J.; Murthy, D.N.P. Optimal reliability, warranty and price for new products. IIE Trans. 2007, 39, 819–827. [Google Scholar] [CrossRef]
- Lee, H.; Cho, Y.; Park, H. Study on the Properties and Fatigue Characteristics of Glass Fiber Composites Due to Porosity. Appl. Sci. 2024, 14, 6234. [Google Scholar] [CrossRef]
- Zeng, Y.; Huang, T.; Zhang, T.; Huang, H.Z. System-level performance degradation prediction for power converters based on SSA-Elman NN and empirical knowledge. IEEE Trans. Ind. Inf. 2024, 20, 1240–1250. [Google Scholar] [CrossRef]
- Gholami, P.; Kouchakzadeh, M.A.; Farsi, M.A. A continuum damage mechanics-based piecewise fatigue damage model for fatigue life prediction of fiber-reinforced laminated composites. Int. J. Eng. 2021, 34, 1512–1522. [Google Scholar]
- Maio, U.D.; Greco, F.; Lonetti, P. A combined ALE-cohesive fracture approach for the arbitrary crack growth analysis. Eng. Fract. Mech. 2024, 301, 109996. [Google Scholar] [CrossRef]
- Liu, Z.; Liu, H.; Shao, Z. CCZM-based fatigue analysis and reliability assessment for wind turbine blade adhesive joints considering parameter uncertainties. Qual. Reliab. Eng. Int. 2024, 40, 3037–3054. [Google Scholar] [CrossRef]
- Qian, H.M.; Wei, J.; Huang, H.Z. Structural fatigue reliability analysis based on active learning Kriging model. Int. J. Fatigue 2023, 172, 107639. [Google Scholar] [CrossRef]
- Ziane, K.; Zebirate, S.; Zaitri, A. Particle swarm optimization-based neural network for predicting fatigue strength in composite laminates of wind turbine blades. Compos. Mech. Comput. Appl. Int. J. 2015, 6, 321–338. [Google Scholar] [CrossRef]
- Li, Y.F.; Huang, H.Z.; Mi, J.; Peng, W.; Han, X. Reliability analysis of multi-state systems with common cause failures based on Bayesian network and fuzzy probability. Ann. Oper. Res. 2022, 311, 195–209. [Google Scholar] [CrossRef]
- Qian, H.M.; Huang, T.; Huang, H.Z. A single-loop strategy for time-variant system reliability analysis under multiple failure modes. Mech. Syst. Signal Process. 2021, 148, 107159. [Google Scholar] [CrossRef]
- Qian, H.M.; Li, Y.F.; Huang, H.Z. Time-variant system reliability analysis method for a small failure probability problem. Reliab. Eng. Syst. Saf. 2021, 205, 107261. [Google Scholar] [CrossRef]
- Zhang, X.; Zhang, K.; Yang, X.; Fazeres-Ferradosa, T.; Zhu, S.P. Transfer learning and direct probability integral method based reliability analysis for offshore wind turbine blades under multi-physics coupling. Renew. Energy 2023, 206, 552–565. [Google Scholar] [CrossRef]
- Wang, X.; Meng, Z.; Yang, B. Reliability-based design optimization of material orientation and structural topology of fiber-reinforced composite structures under load uncertainty. Compos. Struct. 2022, 291, 115537. [Google Scholar] [CrossRef]
- Balokas, G.; Kriegesmann, B.; Rolfes, R. Data-driven inverse uncertainty quantification in the transverse tensile response of carbon fiber reinforced composites. Compos. Sci. Technol. 2021, 211, 108845. [Google Scholar] [CrossRef]
- Joannès, S.; Islam, F.; Laiarinandrasana, L. Uncertainty in fiber strength characterization due to uncertainty in measurement and sampling randomness. Appl. Compos. Mater. 2020, 27, 165–184. [Google Scholar] [CrossRef]
- Chen, Z.; Bao, H.; Dai, Y.; Liu, Y. Numerical prediction based on XFEM for mixed-mode crack growth path and fatigue life under cyclic overload. Int. J. Fatigue 2022, 162, 106943. [Google Scholar] [CrossRef]
- Dávila, C.G.; Joosten, M.W. A cohesive fatigue model for composite delamination based on a new material characterization procedure for the Paris law. Eng. Fract. Mech. 2023, 284, 109232. [Google Scholar] [CrossRef]
- Xing, C.; Zhou, C.; Sun, Y. A singular crack tip element based on sub-partition and XFEM for modeling crack growth in plates and shells. Finite Elem. Anal. Des. 2023, 215, 103–890. [Google Scholar] [CrossRef]
- Tien, J.K.; Purushothaman, S. Generalized theory of fatigue crack propagation: Part II—Derivation of threshold and Paris regime crack growth rates. Mater. Sci. Eng. 1978, 34, 247–262. [Google Scholar] [CrossRef]
- Chen, Y.; Sang, Y.; Wang, X.; Ye, X.; Shi, H.; Wu, P.; Li, X.; Xiong, C. Study on Evaluation and Prediction for Shale Gas PDC Bit in Luzhou Block Sichuan Based on BP Neural Network and Bit Structure. Appl. Sci. 2024, 14, 4370. [Google Scholar] [CrossRef]
- Mulumba, D.M.; Liu, J.; Hao, J.; Zheng, Y.; Liu, H. Application of an Optimized PSO-BP Neural Network to the Assessment and Prediction of Underground Coal Mine Safety Risk Factors. Appl. Sci. 2023, 13, 5317. [Google Scholar] [CrossRef]
- Guo, F.; Li, C.; Su, J.; Liu, C. Study on Dynamic Uncertainty and Sensitivity of Gear System Considering the Influence of Machining Accuracy. Appl. Sci. 2023, 13, 8011. [Google Scholar] [CrossRef]
- Zouhri, W.; Homri, L.; Dantan, J.Y. Handling the impact of feature uncertainties on SVM: A robust approach based on Sobol sensitivity analysis. Expert Syst. Appl. 2022, 189, 115691. [Google Scholar] [CrossRef]
- Zienkiewicz, O.C.; Zhu, J.Z. A simple error estimator and adaptive procedure for practical engineering analysis. Int. J. Numer. Methods Eng. 1987, 24, 337–357. [Google Scholar] [CrossRef]
- Trinh, M.C.; Jun, H. Stochastic bending and buckling analysis of laminated composite plates using Latin hypercube sampling. Eng. Comput. 2023, 39, 1459–1497. [Google Scholar] [CrossRef]


| Category | Typical Value or Range |
|---|---|
| Resin type | Epoxy resin |
| Enhancer type | T700 Carbon fiber |
| Type of knitting | 3K Twill preparation |
| Carbon fiber volume ratio | 60% |
| Prepreg preparation conditions | Indoor temperature |
| Resin content | 35–40% |
| Curing temperature | 120 °C–150 °C |
| Curing pressure/MPa | 0.5–1.0 |
| Curing time/hours | 2–4 |
| Lamination direction | [0°/90°] |
| Serial Number | S Inter-Crack Distance (mm) | θ Crack Angle (°) | Crack Length (mm) | Crack Length (mm) | Maximum Load (KN) | Average Value (KN) | CV (%) |
|---|---|---|---|---|---|---|---|
| A1-1-1 | 0 | 30 | 4 | 6 | 14.8, 13.93, 16.18, 14.75, 14.15 | 14.762 | 5.94 |
| A1-2-1 | 0 | 60 | 4 | 6 | 13.63, 13.12, 13.98, 13.43, 14.32 | 13.696 | 3.42 |
| A1-3-1 | 0 | 90 | 4 | 6 | 13.17, 13.04, 13.16, 13.71, 13.86 | 13.388 | 2.76 |
| B1-1-1 | 0 | 90 | 4 | 4 | 14.28, 13.35, 14.77, 13.95, 15.21 | 14.312 | 5.03 |
| B1-2-1 | 0 | 90 | 4 | 8 | 11.47, 11.5, 10.86, 11.33, 11.2 | 11.272 | 2.30 |
| Category | Fatigue Test Parameters |
|---|---|
| Stress amplitude | |
| Loading frequency | 30 HZ |
| Loading wave form | Sine wave |
| Stress ratios | 0.1 |
| Test environment | Temperature: 25 °C |
| humidity level: 60% | |
| Test equipment | Electro-hydraulic servo fatigue testing machine |
| Serial Number | S Inter-Crack Distance (mm) | θ Crack Angle (°) | Crack Length (mm) | Crack Length (mm) | Fatigue Life (Cycle) | Average Value (Cycle) | CV (%) |
|---|---|---|---|---|---|---|---|
| B2-3-1 (F) | 1 | 90 | 4 | 6 | 33,404, 36,683, 35,673, 35,021, 36,041 | 35,359 | 3.53 |
| C2-3-1 (F) | 2 | 90 | 4 | 6 | 37,833, 37,586, 41,374, 39,241, 38,254 | 38,856 | 3.97 |
| A2-1-1 (F) | 0 | 30 | 4 | 6 | 54,505, 54,769, 50,922, 51,203, 48,759 | 52,032 | 4.92 |
| A2-2-1 (F) | 0 | 60 | 4 | 6 | 40,636, 37,579, 41,193, 38,542, 38,967 | 39,383 | 3.80 |
| A2-3-1 (F) | 0 | 90 | 4 | 6 | 32,754, 32,993, 31,993, 35,980, 33,691 | 33,482 | 4.55 |
| A1-3-1 (F) | 0 | 90 | 4 | 4 | 327,46, 49,530, 38,415, 45,107, 47,651 | 42,690 | 16.33 |
| A3-3-1 (F) | 0 | 90 | 4 | 8 | 21,464, 21,637, 18,470, 18,565, 19,547 | 19,937 | 7.69 |
| Elastic Modulus E1/GPa | Elastic Modulus E2/GPa | Elastic Modulus E3/GPa | Poisson’s Ratio ν1 | Poisson’s Ratio ν2 | Poisson’s Ratio ν3 | Shear Modulus G1/MPa | Shear Modulus G2/MPa | Shear Modulus G3/MPa |
|---|---|---|---|---|---|---|---|---|
| 105.5 | 7.2 | 7.2 | 0.34 | 0.34 | 0.378 | 3400 | 3400 | 2520 |
| Specimen Number | Simulation Results | Experimental Mean | Relative Error |
|---|---|---|---|
| A1F | 35,895 | 35,359 | 1.52% |
| A2F | 40,214 | 38,856 | 3.49% |
| A3F | 54,015 | 52,032 | 3.81% |
| A4F | 41,156 | 39,383 | 4.5% |
| A5F | 32,187 | 33,482 | 3.86% |
| A6F | 44,895 | 42,690 | 5.17% |
| A7F | 21,247 | 19,937 | 6.57% |
| Variable | Parameters | Average Value | CV | Distribution Type |
|---|---|---|---|---|
| Material properties | E1/Mpa | 105,500 | 0.05 | Normal distribution |
| E2/Mpa | 7200 | 0.05 | Normal distribution | |
| E3/Mpa | 7200 | 0.05 | Normal distribution | |
| G1/Mpa | 3400 | 0.05 | Normal distribution | |
| G2/Mpa | 3400 | 0.05 | Normal distribution | |
| G3/Mpa | 2520 | 0.05 | Normal distribution | |
| ν1 | 0.34 | 0.05 | Normal distribution | |
| ν2 | 0.34 | 0.05 | Normal distribution | |
| ν3 | 0.378 | 0.05 | Normal distribution | |
| multi-cracked | L2/mm | 6 | 0.05 | Normal distribution |
| θ/rad | 60 | 0.05 | Normal distribution | |
| L1/mm | 4 | 0.05 | Normal distribution | |
| S/mm | 2 | 0.05 | Normal distribution |
| E1 | E2 | E3 | G1 | G2 | G3 | ν1 | ν2 | ν3 | L2 | L1 | θ | S | Life | |
|---|---|---|---|---|---|---|---|---|---|---|---|---|---|---|
| 1 | 104,518.7 | 7001.72 | 7147.51 | 3098.22 | 3641.4 | 2260.58 | 0.33 | 0.34 | 0.38 | 5.49 | 4.19 | 90.85 | 1.98 | 37,380 |
| 2 | 103,392.4 | 7898.51 | 7288.83 | 3197.77 | 3130.45 | 2484.26 | 0.33 | 0.35 | 0.36 | 6.17 | 3.97 | 96.52 | 2 | 43,279 |
| 3 | 109,041 | 7241.36 | 6771.37 | 2928.85 | 3427.39 | 2685.95 | 0.33 | 0.32 | 0.39 | 5.94 | 4.16 | 81.32 | 1.88 | 35,264 |
| 4 | 103,013 | 7953.58 | 6994.15 | 3420.81 | 3280.89 | 2481.47 | 0.35 | 0.37 | 0.36 | 6.54 | 4.35 | 92.58 | 1.9 | 57,838 |
| 5 | 97,655.8 | 7264.51 | 6956.73 | 3347.17 | 3558.34 | 2640.01 | 0.35 | 0.35 | 0.38 | 5.99 | 3.7 | 89.75 | 1.99 | 31,361 |
| 6 | 106,243.1 | 7094.28 | 6848.09 | 3428.85 | 3481.3 | 2327.47 | 0.34 | 0.34 | 0.37 | 5.96 | 3.92 | 83.97 | 2 | 32,178 |
| 7 | 111,959.7 | 6824.78 | 7487.61 | 3378.8 | 3386.27 | 2634.78 | 0.37 | 0.32 | 0.36 | 5.25 | 3.93 | 86.83 | 1.97 | 30,045 |
| 8 | 104,983.1 | 7407.57 | 7222.26 | 3409.76 | 3490.12 | 2598.12 | 0.34 | 0.32 | 0.4 | 5.77 | 3.78 | 90.37 | 2.17 | 34,507 |
| 9 | 101,734 | 6981.44 | 7531.15 | 3311.62 | 3347.82 | 2661.69 | 0.35 | 0.33 | 0.39 | 6.09 | 3.95 | 100.2 | 2.08 | 44,050 |
| 10 | 88,483.18 | 6724.5 | 7188.01 | 3655.39 | 3254.09 | 2566.33 | 0.35 | 0.3 | 0.41 | 5.7 | 3.98 | 97.65 | 2.06 | 36,414 |
| … | … | … | … | … | … | … | … | … | … | … | … | … | … | … |
| 91 | 116,656.9 | 7286.38 | 7776.24 | 3383.33 | 3499.64 | 2668.98 | 0.33 | 0.34 | 0.38 | 6.1 | 4.02 | 83.19 | 2.04 | 41,155 |
| 92 | 116,213.5 | 7794.53 | 7026.55 | 3546.34 | 3323.9 | 2442.49 | 0.32 | 0.33 | 0.4 | 6.19 | 4.07 | 98.81 | 1.83 | 47,191 |
| 93 | 109,641.3 | 7171.53 | 7327.19 | 3255.83 | 3421.28 | 2351.54 | 0.37 | 0.36 | 0.38 | 5.83 | 4.47 | 91.98 | 2.11 | 49,794 |
| 94 | 110,219.3 | 7034.56 | 7716.96 | 3578.2 | 3455.32 | 2621.51 | 0.34 | 0.37 | 0.37 | 6.21 | 4.26 | 88.7 | 1.89 | 46,544 |
| 95 | 98,728.87 | 7477.29 | 6499.64 | 3353.18 | 3208.56 | 2742.31 | 0.35 | 0.33 | 0.36 | 6.47 | 4.04 | 91.4 | 1.98 | 42,851 |
| 96 | 105,406.3 | 6496.36 | 7856.82 | 3698.18 | 3606.51 | 2404.01 | 0.36 | 0.35 | 0.38 | 6.12 | 3.97 | 87.65 | 1.95 | 38,059 |
| 97 | 103,990.1 | 6916.35 | 7404.98 | 3271.24 | 3299.79 | 2452.75 | 0.32 | 0.34 | 0.39 | 5.92 | 4.17 | 88.25 | 1.82 | 37,859 |
| 98 | 110,591.1 | 6587.3 | 6576.46 | 3118.53 | 3196.18 | 2374.76 | 0.33 | 0.32 | 0.39 | 5.7 | 3.68 | 95.7 | 1.87 | 29,835 |
| 99 | 102,263.2 | 6304.57 | 7574.11 | 3283.91 | 3442.92 | 2496.36 | 0.35 | 0.35 | 0.35 | 6.29 | 3.81 | 94.42 | 2.01 | 38,366 |
| 100 | 116,656.9 | 7286.38 | 7776.24 | 3383.33 | 3499.64 | 2668.98 | 0.33 | 0.34 | 0.38 | 6.1 | 4.02 | 83.19 | 2.04 | 41,155 |
| Evaluation Indicators | BP Training Set | BP Test Set | PSO–BP Training Set | PSO–BP Test Set |
|---|---|---|---|---|
| MAE (cycle) | 915 | 1298 | 321 | 449 |
| MAPE (%) | 2.4081 | 3.2212 | 0.844 | 1.206 |
| RMSE (cycle) | 1115 | 1943 | 428 | 558 |
| R2 | 0.95786 | 0.87818 | 0.99397 | 0.99051 |
| Distribution Type | Normal Distribution | Gamma Distribution | Weibull Distribution |
|---|---|---|---|
| R2 | 0.99986 | 0.99794 | 0.99977 |
| Uncertainty Parameter | Si | STi |
|---|---|---|
| Edge crack length L1 | 0.44073 | 0.46249 |
| Internal crack length L2 | 0.20386 | 0.23427 |
| Internal crack angle θ | 0.18209 | 0.18644 |
| Distance between cracks | 0.03724 | 0.04179 |
| Elastic modulus E1 | 0.03387 | 0.03984 |
| Elastic modulus E2 | 0.01586 | 0.01429 |
| Elastic modulus E3 | 0.01064 | 0.0024 |
| Shear modulus G1 | 0.01376 | 0.00941 |
| Shear modulus G2 | 0.01127 | 0.00197 |
| Shear modulus G3 | 0.01121 | 0.00227 |
| Poisson’s ratio ν1 | 0.01454 | 0.00368 |
| Poisson’s ratio ν2 | 0.01379 | 5.20072 × 10⁻⁴ |
| Poisson’s ratio ν3 | 0.01113 | 6.22547 × 10⁻⁴ |
Disclaimer/Publisher’s Note: The statements, opinions and data contained in all publications are solely those of the individual author(s) and contributor(s) and not of MDPI and/or the editor(s). MDPI and/or the editor(s) disclaim responsibility for any injury to people or property resulting from any ideas, methods, instructions or products referred to in the content. |
© 2024 by the authors. Licensee MDPI, Basel, Switzerland. This article is an open access article distributed under the terms and conditions of the Creative Commons Attribution (CC BY) license (https://creativecommons.org/licenses/by/4.0/).
Share and Cite
Liu, Z.; Zhang, Y.; Liu, H.; Liu, X.; Liang, J.; Shao, Z. Fatigue Characteristics Analysis of Carbon Fiber Laminates with Multiple Initial Cracks. Appl. Sci. 2024, 14, 8572. https://doi.org/10.3390/app14188572
Liu Z, Zhang Y, Liu H, Liu X, Liang J, Shao Z. Fatigue Characteristics Analysis of Carbon Fiber Laminates with Multiple Initial Cracks. Applied Sciences. 2024; 14(18):8572. https://doi.org/10.3390/app14188572
Chicago/Turabian StyleLiu, Zheng, Yuhao Zhang, Haodong Liu, Xin Liu, Jinlong Liang, and Zhenjiang Shao. 2024. "Fatigue Characteristics Analysis of Carbon Fiber Laminates with Multiple Initial Cracks" Applied Sciences 14, no. 18: 8572. https://doi.org/10.3390/app14188572