Article

Predicting the Influence of Vibration from Trains in the Throat Area of a Metro Depot on Over-Track Buildings

1
College of Environmental and Resource Sciences, Zhejiang University, Hangzhou 310058, China
2
Innovation Center of Yangtze River Delta, Zhejiang University, Jiaxing 314102, China
*
Author to whom correspondence should be addressed.
Appl. Sci. 2024, 14(19), 8598; https://doi.org/10.3390/app14198598
Submission received: 25 June 2024 / Revised: 13 September 2024 / Accepted: 20 September 2024 / Published: 24 September 2024

Abstract

:
Urban land resources are scarce in China. To utilize land effectively and economically, many cities are developing over-track buildings above metro depots. The vibration from the entrance and exit lines of metro depots under an over-track platform would significantly impact over-track buildings. To study the influence of train vibration in the throat area of a metro depot on over-track buildings, a simulation model was established using a finite element method. The reasonability of the simulation method and parameter settings was verified through comparing the vibration simulation results with vibration test results in the throat area of a metro depot. Furthermore, the impact of parameters of over-track platform and building on indoor vibration induced by a train was quantitatively studied. According to simulation results, a prediction model was developed to predict the impact of train vibration on over-track buildings in metro depots. From the perspective of architectural planning and design, this study provides a theoretical and technical basis for the prevention and control of indoor vibrations in over-track buildings of urban metro depots.

1. Introduction

As of 2023, the total operation mileage of rail transit in China has reached 10,165 km [1]. As a site for train parking, repair, maintenance, and operational management, the number of metro depots has rapidly increased with the rapid growth of rail transits. Developing over-track buildings above metro depots can fully utilize the land of metro depot effectively and economically, improve social and economy benefits, and promote the sustainable development of cities. However, the indoor vibration pollution caused by train operation restricts the exploitation of over-track buildings above metro depots [2,3]. The vibration from trains in metro depots propagates to over-track buildings with little soil attenuation. Consequently, the intensity of indoor vibration in over-track buildings is strong, the frequency band is wide, and the vibration frequency is concentrated at 10–80 Hz [4]. Due to the difference in the velocity of trains, track conditions, and so on, indoor vibration response in over-track buildings caused by trains is varying. The higher the train velocity is, the higher the main vibration frequency in over-track buildings is and the larger the vibration level is. Vibration characteristics of over-track buildings are also closely related to the characteristics of building structure and building components, the cross-sectional dimension of building columns, the thickness and strength of floors, and other factors [5,6,7].
In order to evaluate and control the influence of indoor vibration caused by a train, many standards have been issued at home and abroad. ISO 2631-1 [8] provides a method for evaluating the effects of vibration on humans. The range of vibration frequencies perceived by the human body is from 1 Hz to 80 Hz, and the sensitivity of the human body to vibrations of different frequencies is different, so the vertical Z-weighted vibration acceleration level is used as the evaluation indicator in this method. The Traffic Noise and Vibration Impact Assessment Manual issued by the Federal Railway Administration of America takes the vertical vibration velocity level as the evaluation index and stipulates the vibration velocity level limits of various urban areas [9].
Up to now, several studies on the influence of metro trains on indoor vibrations in adjacent buildings have been reported. Kouroussis [10] used the finite element method to establish a train-track model to calculate train vibration and applied it to a foundation soil model to calculate the ground vibration response caused by a train. The measured results verified that the calculation results of the model were accurate. Francois [11] used the finite element method to simplify the interaction between foundation soil and structures with fixed longitudinal geometric shapes and established a three-dimensional building model to predict the vibration effect of a train. Wang [12] established a three-dimensional finite element model of a track–soil–depot structure system to predict and control train vibration on over-track buildings, and an in situ vibration measurement was conducted. The particle swarm optimization and genetic algorithm were used by Kedia [13] to develop an optimized artificial neural network model for predicting the ground vibration induced by metro trains. To predict the vibration impact of train vibration on different storeys of adjacent buildings, Melke [14] proposed a prediction model (see Equation (1)).
L B = L r + R t r + R t u + R g + R b
where L B is the vibration acceleration level in buildings; L r is the track vibration acceleration level; R t r , R t u ,   R g ,   a n d   R b are the transmission losses of vibration in the track, tunnel, ground, and building, respectively. These attenuation items, R t r , R t u ,   R g , a n d   R b , can be calculated on the basis of the impedance theory or obtained through actual measurements.
A propagation model of vertical vibration in buildings which can predict the vibration response of building structures in a frequency domain was established by Sanayei [7] according to the impedance theory. However, this model did not consider the effect of frame beams, infill walls, etc. Paneiro [15] used field measurement vibration data to train a neural network and built an artificial neural network model to predict the vibration response of buildings. Its limitation is that the effect of soil parameters was not considered.
In summary, existing models are mainly suitable for predicting the impact of train vibrations on adjacent buildings along metros and they can only predict the vibration on the ground floor of adjacent buildings. Previous studies on the impact of train vibrations on over-track buildings on the throat area of metro depots are insufficient. The issue of how to reduce the impact of vibration through architectural design is an area of interest for engineering and technical personnel from the fields of rail transit and civil construction. At present, there is no effective model that is convenient for engineering and technical personnel to analyse and evaluate the impact of metro depots on over-track buildings. Previous models cannot be used to directly analyse the impact of changes of main building structural parameters on vibration transmission. Therefore, it is imperative to further investigate the impact of train vibration on over-track buildings and develop a model which can easily and quickly predict the impact of train vibration on over-track buildings in the throat area of metro depots, so as to provide a theoretical and technological foundation for the prevention and control of indoor vibration of over-track buildings.

2. Determination of Vertical Vibration Load from a Train

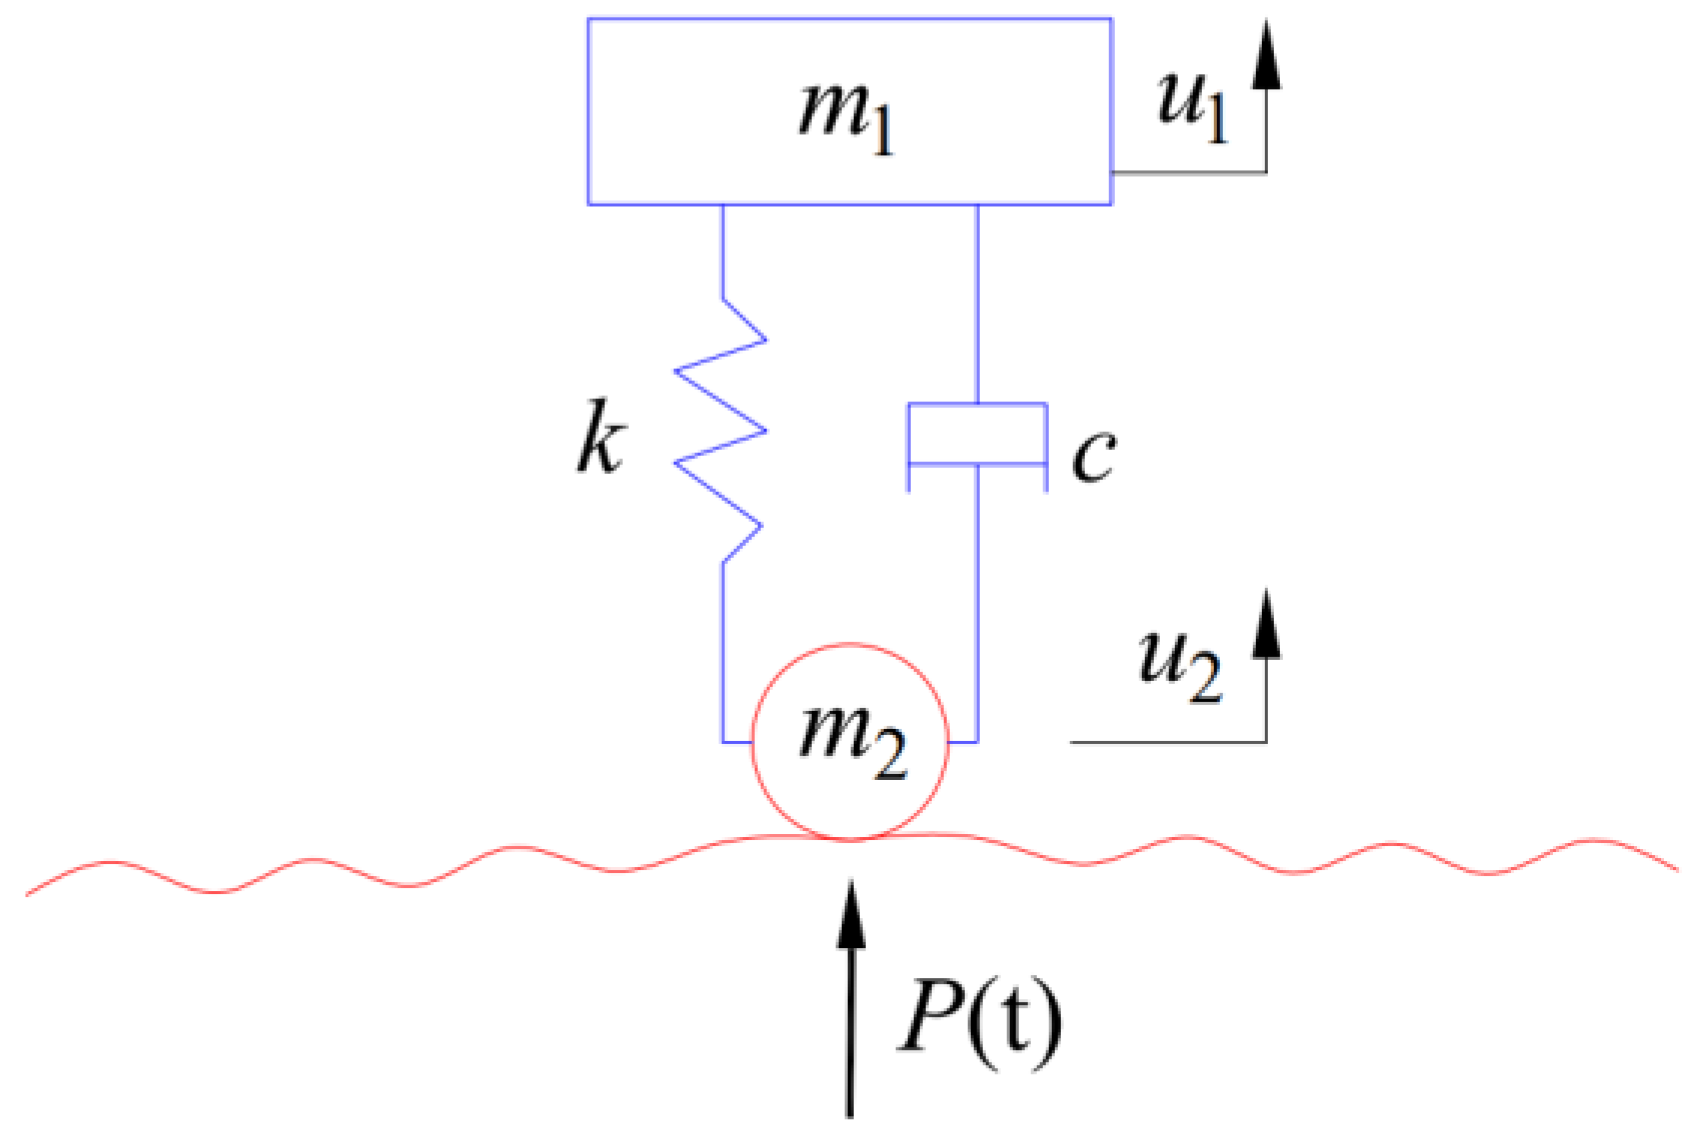
2.1. Expressions of Vertical Vibration Acceleration Caused by a Train

The load from a train can be simulated by applying interaction forces between the wheel and rail of a train to the rail structure. The main methods for determining train loads include the field measurement method, equivalent load method, numerical simulation method [16], and empirical simulation method [17]. In this study, the equivalent load method was used to determine the vertical vibration load from a train. Based on the time domain signal of the measured vertical vibration acceleration of the rails and the simplified model of the vertical vibration of a train (see Figure 1), this method was used to calculate the vertical interaction force between the wheel and rail of a train. The specific calculation procedure is as follows.
The rail vibration excited by a train can be regarded as a stationary random Gaussian process whose mean is zero [18]. The vertical vibration acceleration a t can be expressed as Equations (2)–(4) [19].
a t = n = 0 P 2 1 C n c o s n w t + D n s i n n w t
C n = 2 P θ = 0 P 1 a t θ c o s 2 π n θ P   n = 0,1 , 2 , P 2 1
D n = 2 P θ = 0 N 1 a t θ s i n 2 π n θ P   n = 0,1 , 2 , P 2 1
where P is the amount of interaction points between wheels and rails, w is the fundamental frequency ( w = 2 π P Δ t , Δt is the sampling interval), and t θ is the time corresponding to the θ th interaction point between the wheels and rails.
Figure 1. A simplified model of the vertical vibration of a train [19].
Applsci 14 08598 g001

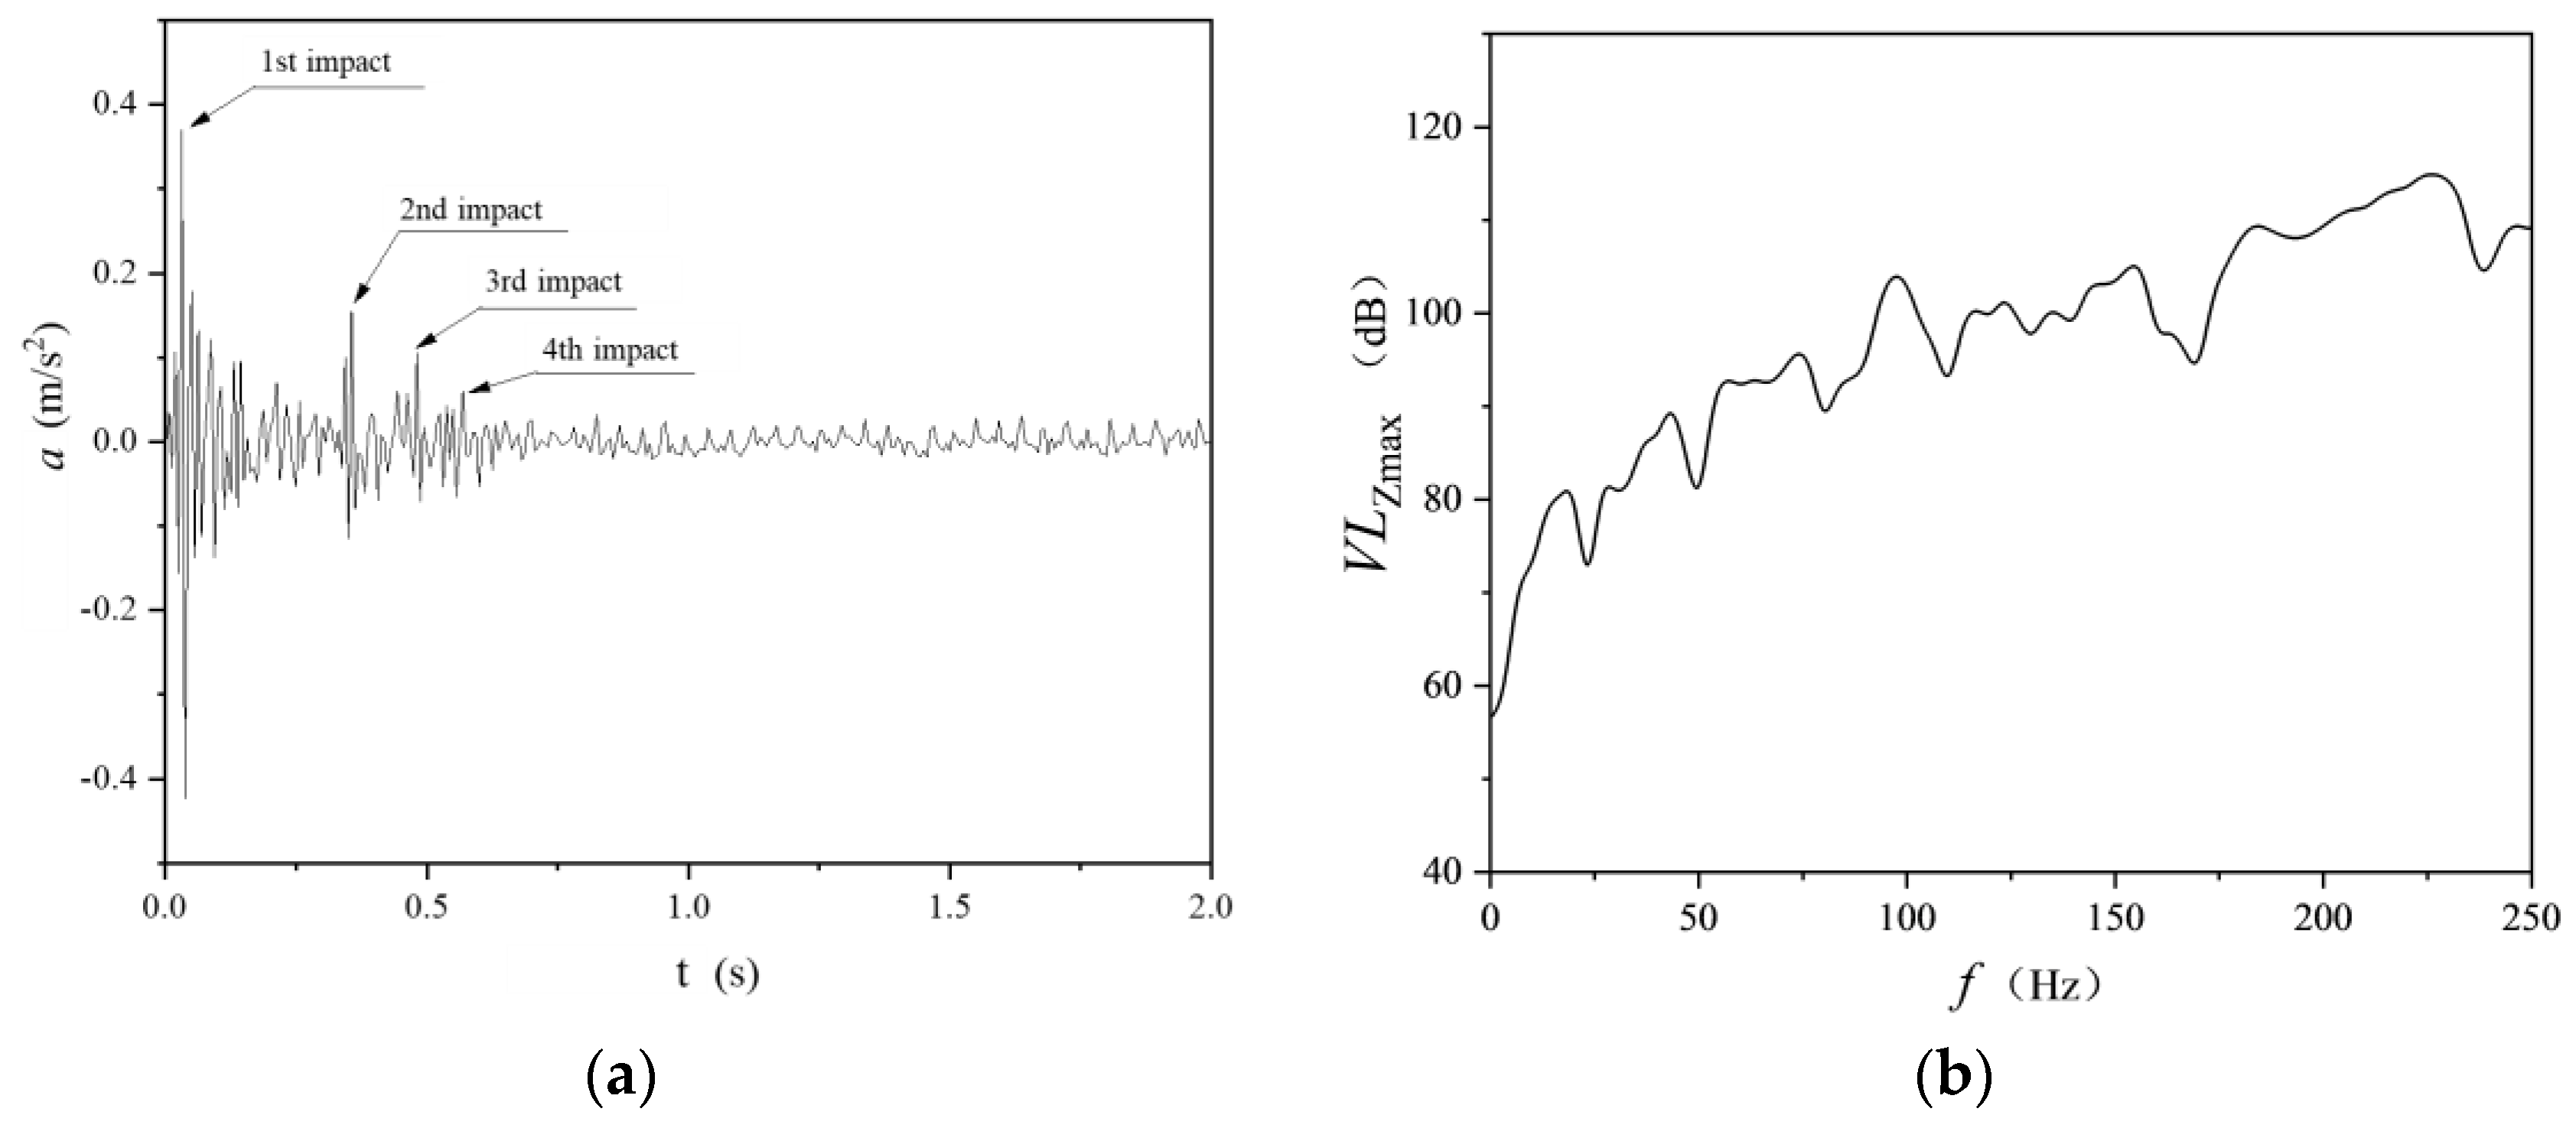
2.2. Simulation of Vertical Vibration Load from a Train

A single carriage of a train is equipped with two bogies and four wheelsets [19]. The mass of a train body is distributed symmetrically from front to back and from left to right, so a side of a single bogie can be selected for analysis. As shown in Figure 1, a train was simplified as a model with a single degree of freedom composed of mass, spring, and damping elements. In Figure 1, m1 is 1/4 of the total mass of a carriage and its accessory, m2 is the mass of a wheelset, u1 and u2 are the vertical vibration displacements of the carriage and the wheelset, respectively, k and c are the suspension stiffness and suspension damping, respectively, and P(t) is the interaction force between wheel and rail. m1 and m2 take values of 6755 kg and 1420 kg, respectively.
As shown in Equation (5), an equation of motion balance of vertical wheelset was established according to Figure 1.
k u 1 u 2 + c u ˙ 1 u ˙ 2 + m 1 u ¨ 1 = 0
Let the relative displacement of a carriage and a wheelset be u r which is equal to u 1 u 2 . Equation (5) can be rewritten as Equation (6).
k u r + c u ˙ r + m 1 u ¨ r = m 1 u ¨ 2
Neglecting the vertical bounce between wheel and rail, the vertical vibration acceleration of the wheelset, u ¨ 2 , and the vertical vibration acceleration of rail, a t , can be regarded as equal. Thus, Equation (6) can be rewritten as Equation (7).
k u r + c u ˙ r + m 1 u ¨ r = m 1 [ n = 0 N 2 1 ( C n c o s   n w t + D n s i n   n w t ) ]
On the basis of Equation (7), u ¨ r can be solved.
According to D’Alembert’s principle, the interaction force P t between the wheels and rails of a train can be calculated according to Equation (8).
P t = m 1 g + m 2 g + m 2 u ¨ 2 + m 1 u ¨ 2 + u ¨ r
In the straight section of the entrance and exit lines in the throat area of a metro depot, the load of vertical vibration from a train can be calculated according to the method above, and calculation results are shown in Figure 2.

3. A Simulation Model and Verification of Its Rationality

Due to the fact that there are not enough over-track buildings on metro depots in operation in China and that vibration sources such as the operation of fixed equipment and the movement of people inside over-track buildings cause significant interference with train vibration tests, it is impossible to obtain actual measurement data from over-track buildings of metro depots in order to verify the rationality of the simulation model. However, measured data from a metro depot with an over-track platform and without over-track buildings can be obtained under the condition of no interference from other vibration sources, such as fixed equipment and personnel movements. To this end, a three-dimensional finite element model, described in Section 3.1, is established on the basis of the actual geological conditions of a metro depot located at Tianjin city in China. This model includes a metro depot and over-track platform and does not include over-track buildings. The rationality of the simulation method and its parameter settings was verified by comparing the measured results and simulated results at each verification point.
Furthermore, to verify the rationality of the parameter settings of the over-track building model, a model of a vacant high-rise building with a basement, described in Section 3.2, was established. In this vacant civil building, a vibration transmission test was conducted via the hammering method. The rationality of the parameter settings of the over-track building model was verified by comparing the measured results and simulated results.

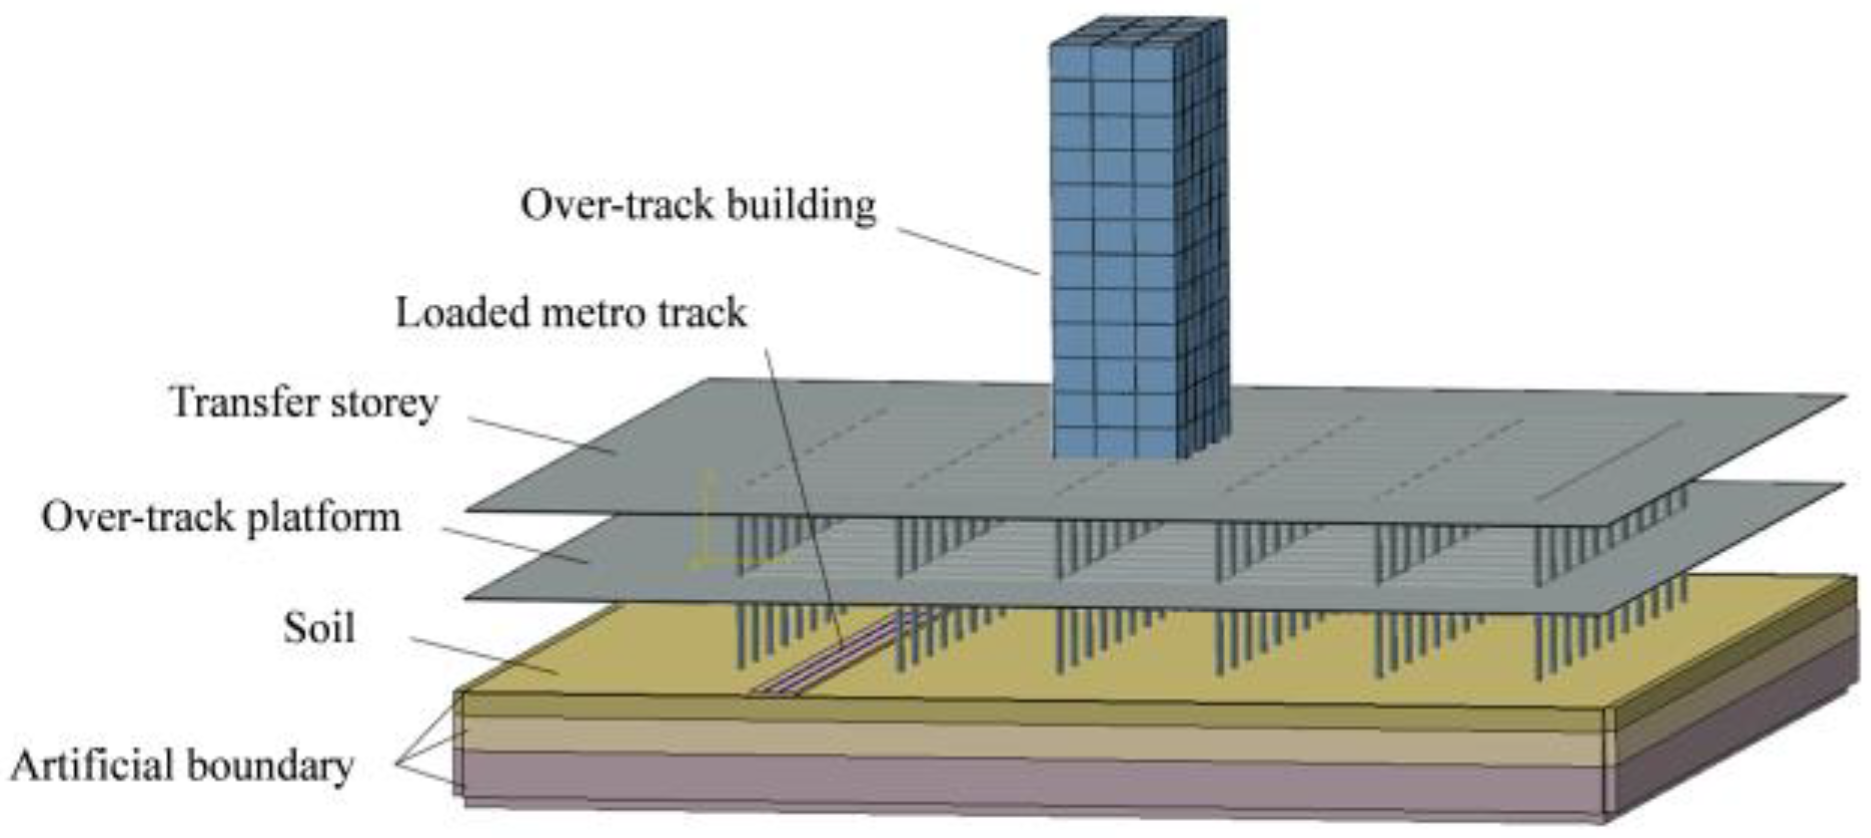
3.1. A Simulation Model of the Over-Track Platform of a Metro Depot

A three-dimensional finite element model composed of the track, soil, and over-track platform is shown in Figure 3 (excluding over-track buildings). The size of the soil model was 140 m × 140 m × 45 m. It was simplified from top to bottom as an artificial fill layer (5 m thick), a pulverized clay layer (25 m thick), and a fine sand layer (15 m thick). The viscoelastic artificial boundary was set at the bottom and around the soil, with a thickness of 1 m. The distance between two rails of a metro line is 1.435 m, while the sleeper spacing was 0.6 m. The thickness of the track-bed and the width at the bottom of the track-bed were 0.35 m and 4 m, respectively. The height of the over-track platform was 7.5 m, the platform thickness was 0.25 m, and the cross-sectional dimensions of columns under platform were 1.0 m × 1.0 m. If the side length of mesh size takes a value of 1/12 λmin in the model, the total number of grid elements in the simulation model and the calculation cost will be too large. Therefore, the mesh size in the area near the rail takes a value of 1/12 λmin and the mesh size in the area far away from the rail is enlarged appropriately. The material parameters for each component of over-track platform were listed in Table 1 [19]. The mesh size of the simulation model was taken as 0.2–2 m. The integration step in time domain was taken as 0.002 s in the simulating calculation.
The range of vibration frequencies perceived by human bodies is 0 Hz–80 Hz. The vertical Z-weighted vibration acceleration level, VLZ, is the indicator evaluating the influence of vibration on humans. As shown in Figure 4, verification points Z1 and Z2 were set on the ground floor and the sides of columns on the over-track platform on the throat area, respectively. The field vibration test photos are shown in Figure 5. The maximal vertical Z-weighted vibration acceleration level, VLZmax, from the measured results and simulated results at each verification point are shown in Table 2. The comparison of the measured and simulated 1/3 octave spectrum of the vertical vibration acceleration level, VAL, is shown in Figure 6. The error between the simulated value and measured value at each verification point given in Table 2 is 2.2–2.6 dB, and the relative error was less than 4.00%. In summary, the simulated results for the over-track platform of metro depots were close to the measured results, which indicated that the simulation method and parameter settings were reasonable.

3.2. A Simulation Model of Civil Buildings

The selected vacant civil building in Hangzhou City, China, is rectangular (32.8 m × 27.8 m × 57.2 m), and the horizontal and vertical layouts of the building are shown in Figure 7, in which the cross-section dimensions of frame columns of the 1st–2nd floors, the 3rd–6th floors, the 7th–9th floors, and the 10th–15th floors are 0.75 m × 0.75 m, 0.7 m × 0.7 m, 0.65 m × 0.65 m, and 0.6 m × 0.6 m, respectively. The cross-section dimensions of the girders and beams are 0.35 m × 0.7 m and 0.25 m × 0.6 m, respectively. The thickness of the floor is 0.12 m.
In the vibration measurement using the hammering method, a metallic sphere (0.15 m in diameter and 13.77 kg in weight), which can produce a large excitation force and excite various vibration modes of the structure, was chosen as the impact source. It was dropped freely from a height of 0.6 m above the first floor and hit the floor. As shown in Figure 7a, the impact point (C1) was located at the central point of an area enclosed by a red dashed line. The vibration measurement points C2–C8 were set on the second, fourth, sixth, eighth, tenth, twelfth, and fourteenth floors directly above the impact point (see Figure 7b). An acceleration sensor (PCB 356B07) with a sampling frequency of 24 kHz was used to collect the vibration acceleration data at each measurement point.
A finite element model was established according to the actual structure and dimensions of the vacant civil building. All nodes at the bottom of building were completely fixed in the model. The beams, columns, and floors in the building were made of C40 concrete, while the infill walls were made of standard brick [20]. The parameters of each material are shown in Table 1. An impulsive vibration whose vertical vibration acceleration values were taken from the sampled data at C1 under the impact of the metal ball was loaded at C1 in the simulation model. The results of the vibration measurement at point C1 are shown in Figure 8. The grid size of building in the simulation model was set to 0.5 m. The step size of time integration in the simulation calculation was taken as 0.002 s.
A comparison of the measured results and simulated results of VLZmax and 0–250 Hz vertical vibration acceleration level, VAL, at each measurement point of the vacant civil building is shown in Table 3. Table 3 indicates that the error between the simulated values and measured values of VLZmax at each measurement point was −1.5–1.2 dB, and the relative error was less than 2.0%. Similarly, the error between simulated values and measured values of VAL at each measurement point was −0.9–1.6 dB, and the relative error was less than 2.0%.
Overall, the simulated results of measured points on the over-track platform of a metro depot and on different floors in a civil building were close to the measured results, which could indicate that the simulation method and parameter settings were reasonable.

4. The Influence of the Over-Track Platform and Over-Track Building Parameters on Indoor Vibration Caused by a Train

4.1. A Typical Over-Track Building Model and Its Parameter Setting

To investigate the influence of train vibration on over-track buildings in the throat area of metro depot under different building parameters, an over-track building was set up based on the model of an over-track platform of a metro depot, as shown in Figure 3. The parameters of the over-track platform and the over-track building are shown in Table 4 and Table 5, respectively. The height of each storey is 3.0 m, and the thickness of each floor is 0.12 m. The cross-sectional dimensions of columns and beams in the frame structure building are 0.5 m × 0.5 m and 0.3 m × 0.6 m, respectively. The thickness of an infill wall is 0.2 m, and the thickness of a load-bearing wall in a shear-wall building is 0.2 m. The effects of a single factor change on indoor vibration in over-track buildings were analysed, and corresponding results are shown in Table 4 and Table 5.

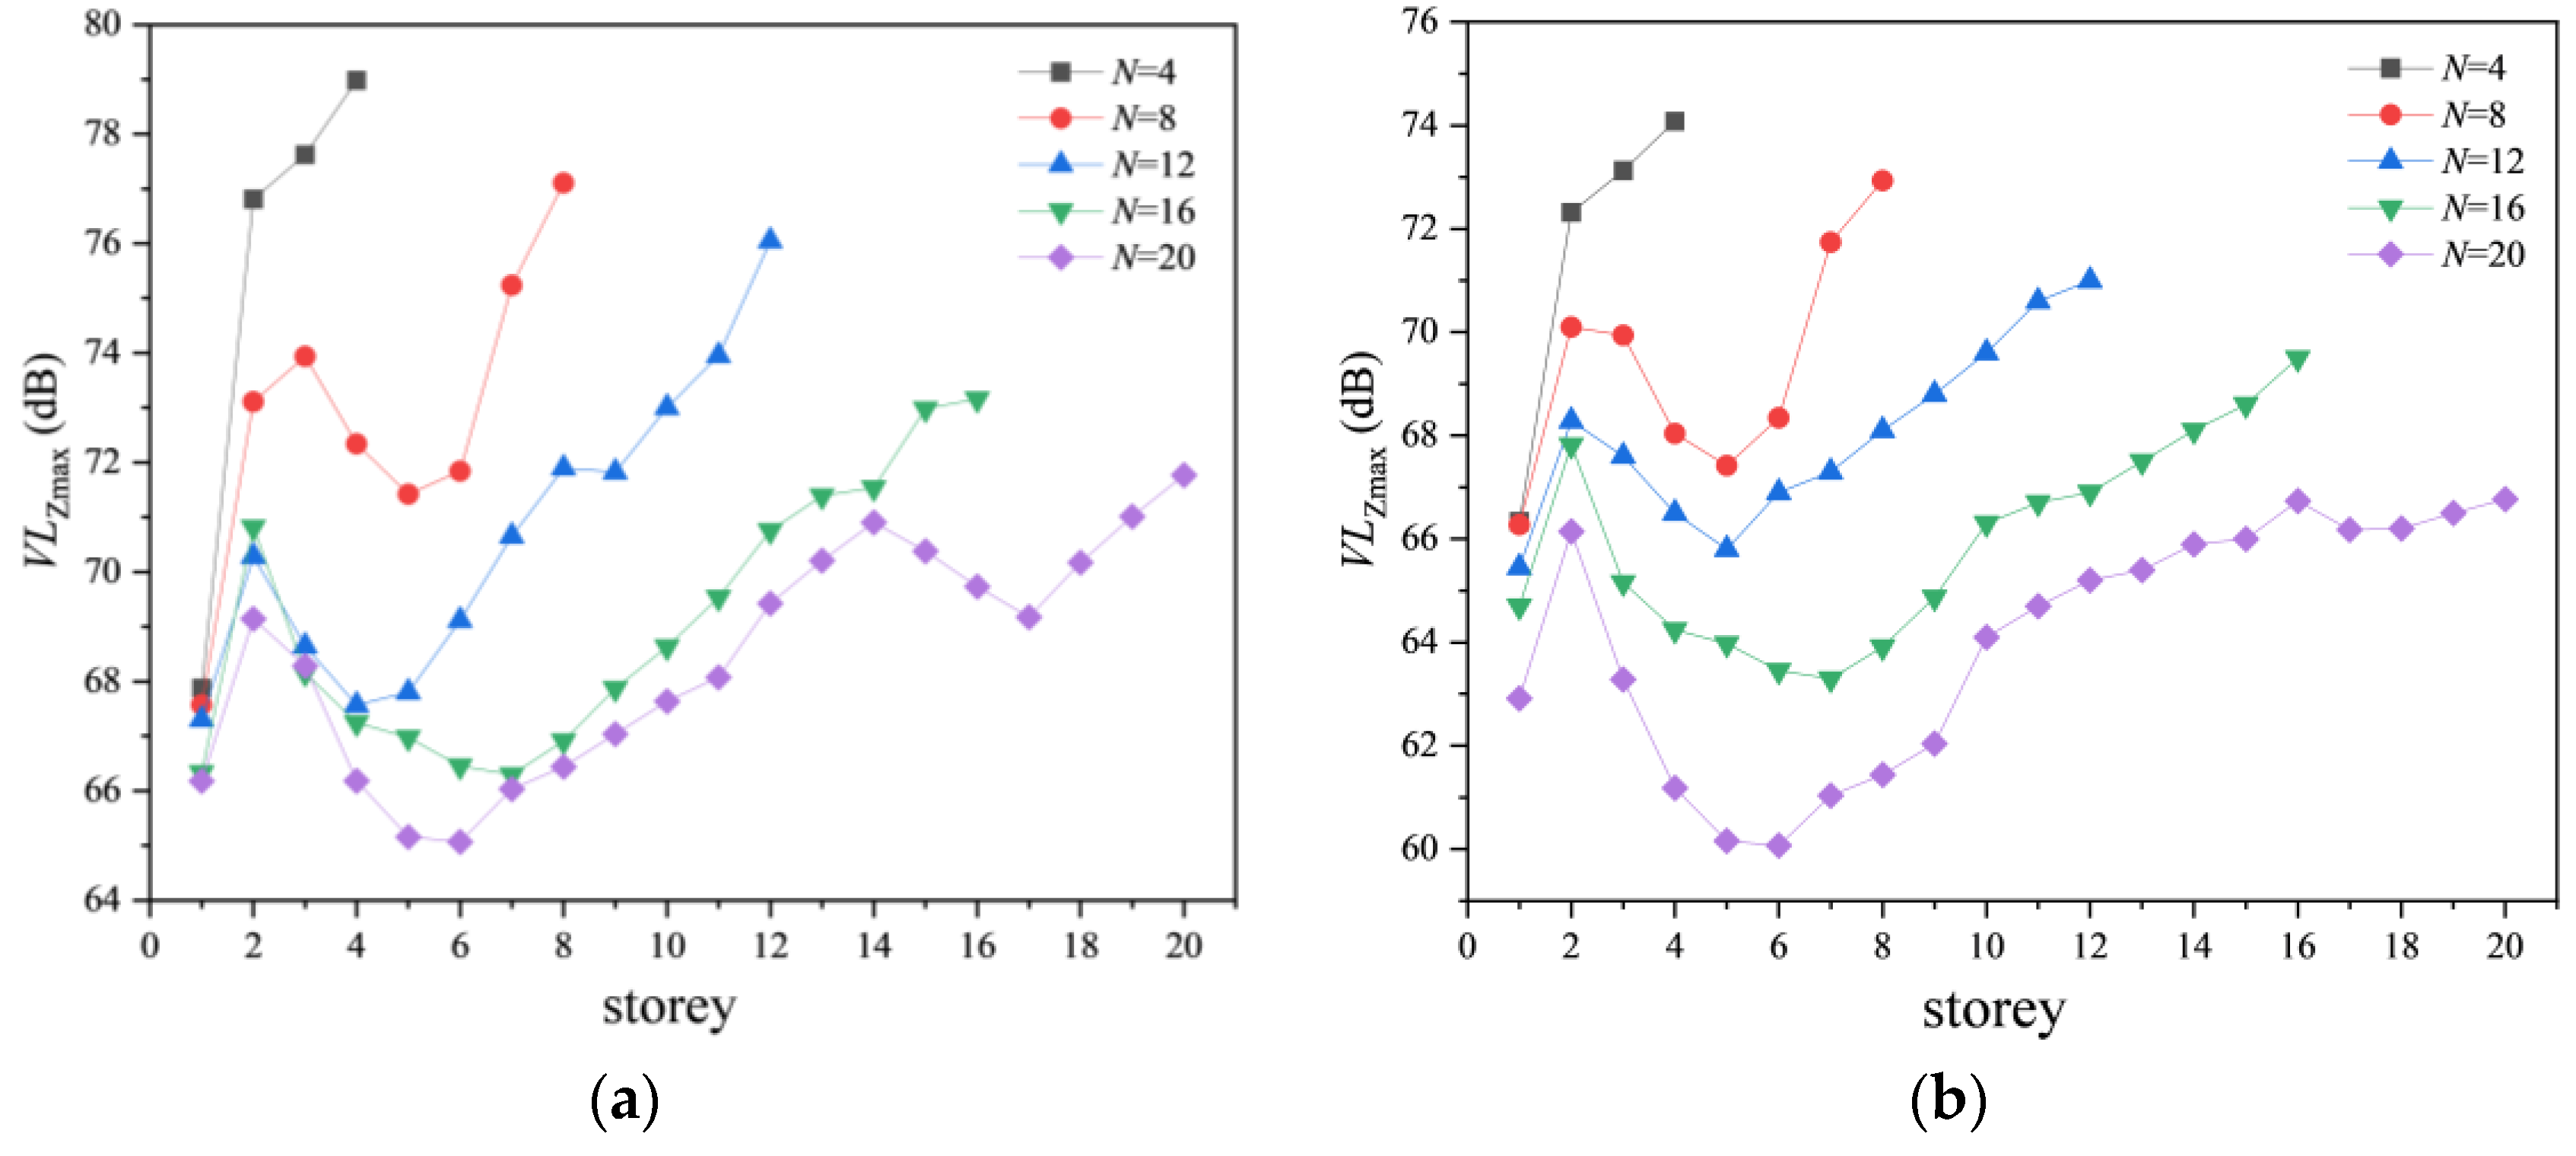
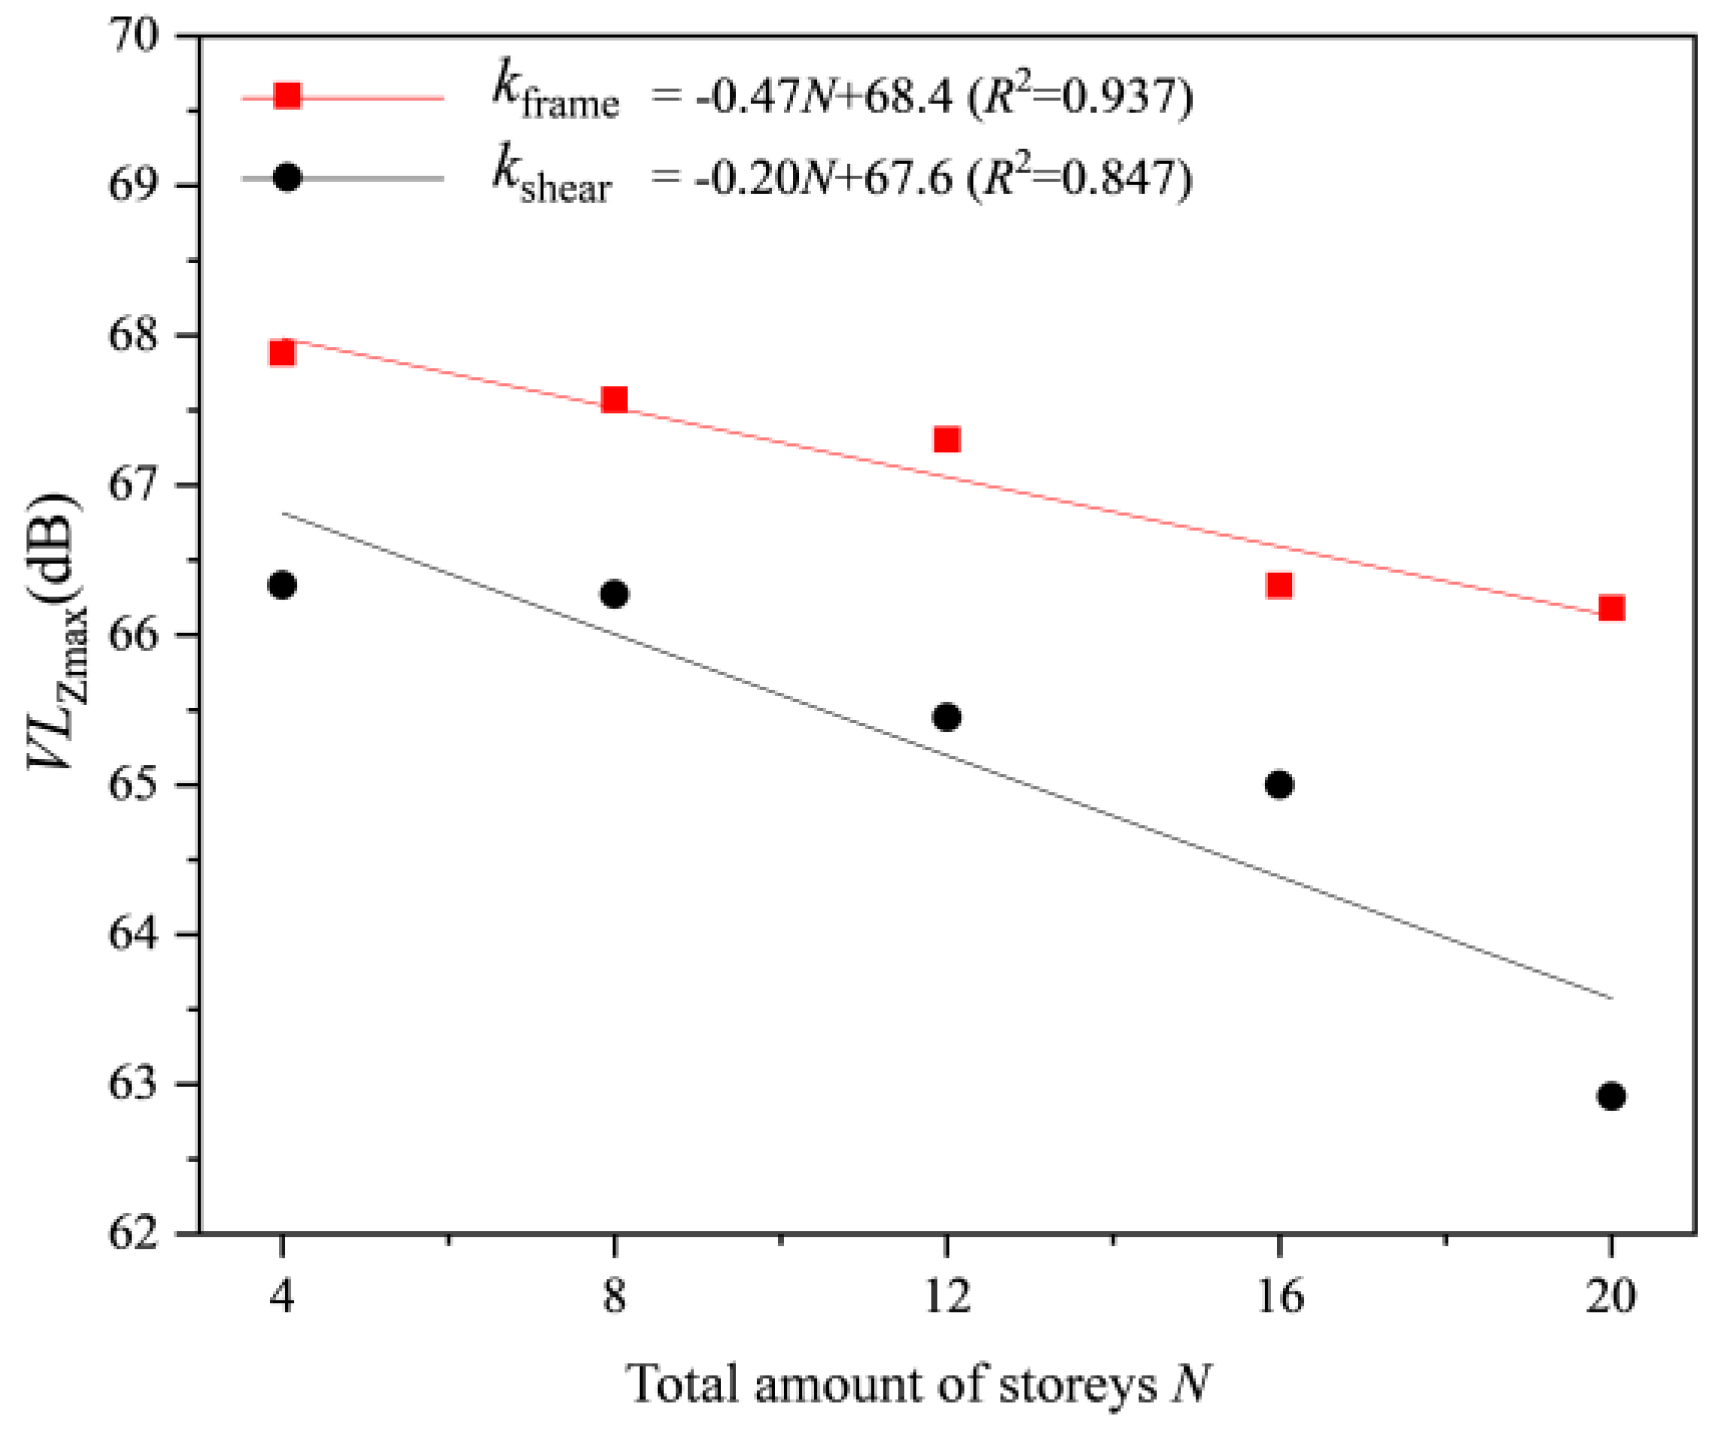
4.2. The Influence of the Total Amount of Storeys and Type of Building Structure on Indoor Vibration Caused by a Train

The VLZmax of each storey in frame and shear wall structure buildings was shown in Figure 9. When the total amount of storeys (N) in buildings was the same, the VLZmax in frame buildings would be approximately 1.4–6.0 dB higher than that in shear wall structures. The VLZmax fluctuated, approximately rose with the increase in N, and reached the maximal value at the top storey. Compared with that of the first storey, the VLZmax of the top storey was amplified by approximately 3.8–11.1 dB.
Similarly, Xie [21] carried out a vibration simulation and found that the floor vibration in buildings decreased initially and then increased with the increase in storeys. Wu [22] measured the vibration of over-track buildings of metro depots, which indicated that the floor vibration oscillated with the increase in storeys. Vibrations on upper storeys in building were slightly amplified. The floor vibration of the second storey was significantly higher than that of the first storey. The main reason is that the first floor of the building is connected to the over-track platform and as such the vibration of the first floor is limited.
The linear fitting results between N and the VLZmax of the first floor in frame and shear wall structures are shown in Figure 10. They show that the VLZmax of the first floor would decrease by approximately 0.20–0.47 dB when N increases by 1. Furthermore, a fitting analysis was performed to examine the relationship between N and the increment of VLZmax at the top storey relative to that at the first storey (ΔVLZmax). Figure 11 shows that the ΔVLZmax would decrease by approximately 0.10–0.34 dB when N increases by 1.

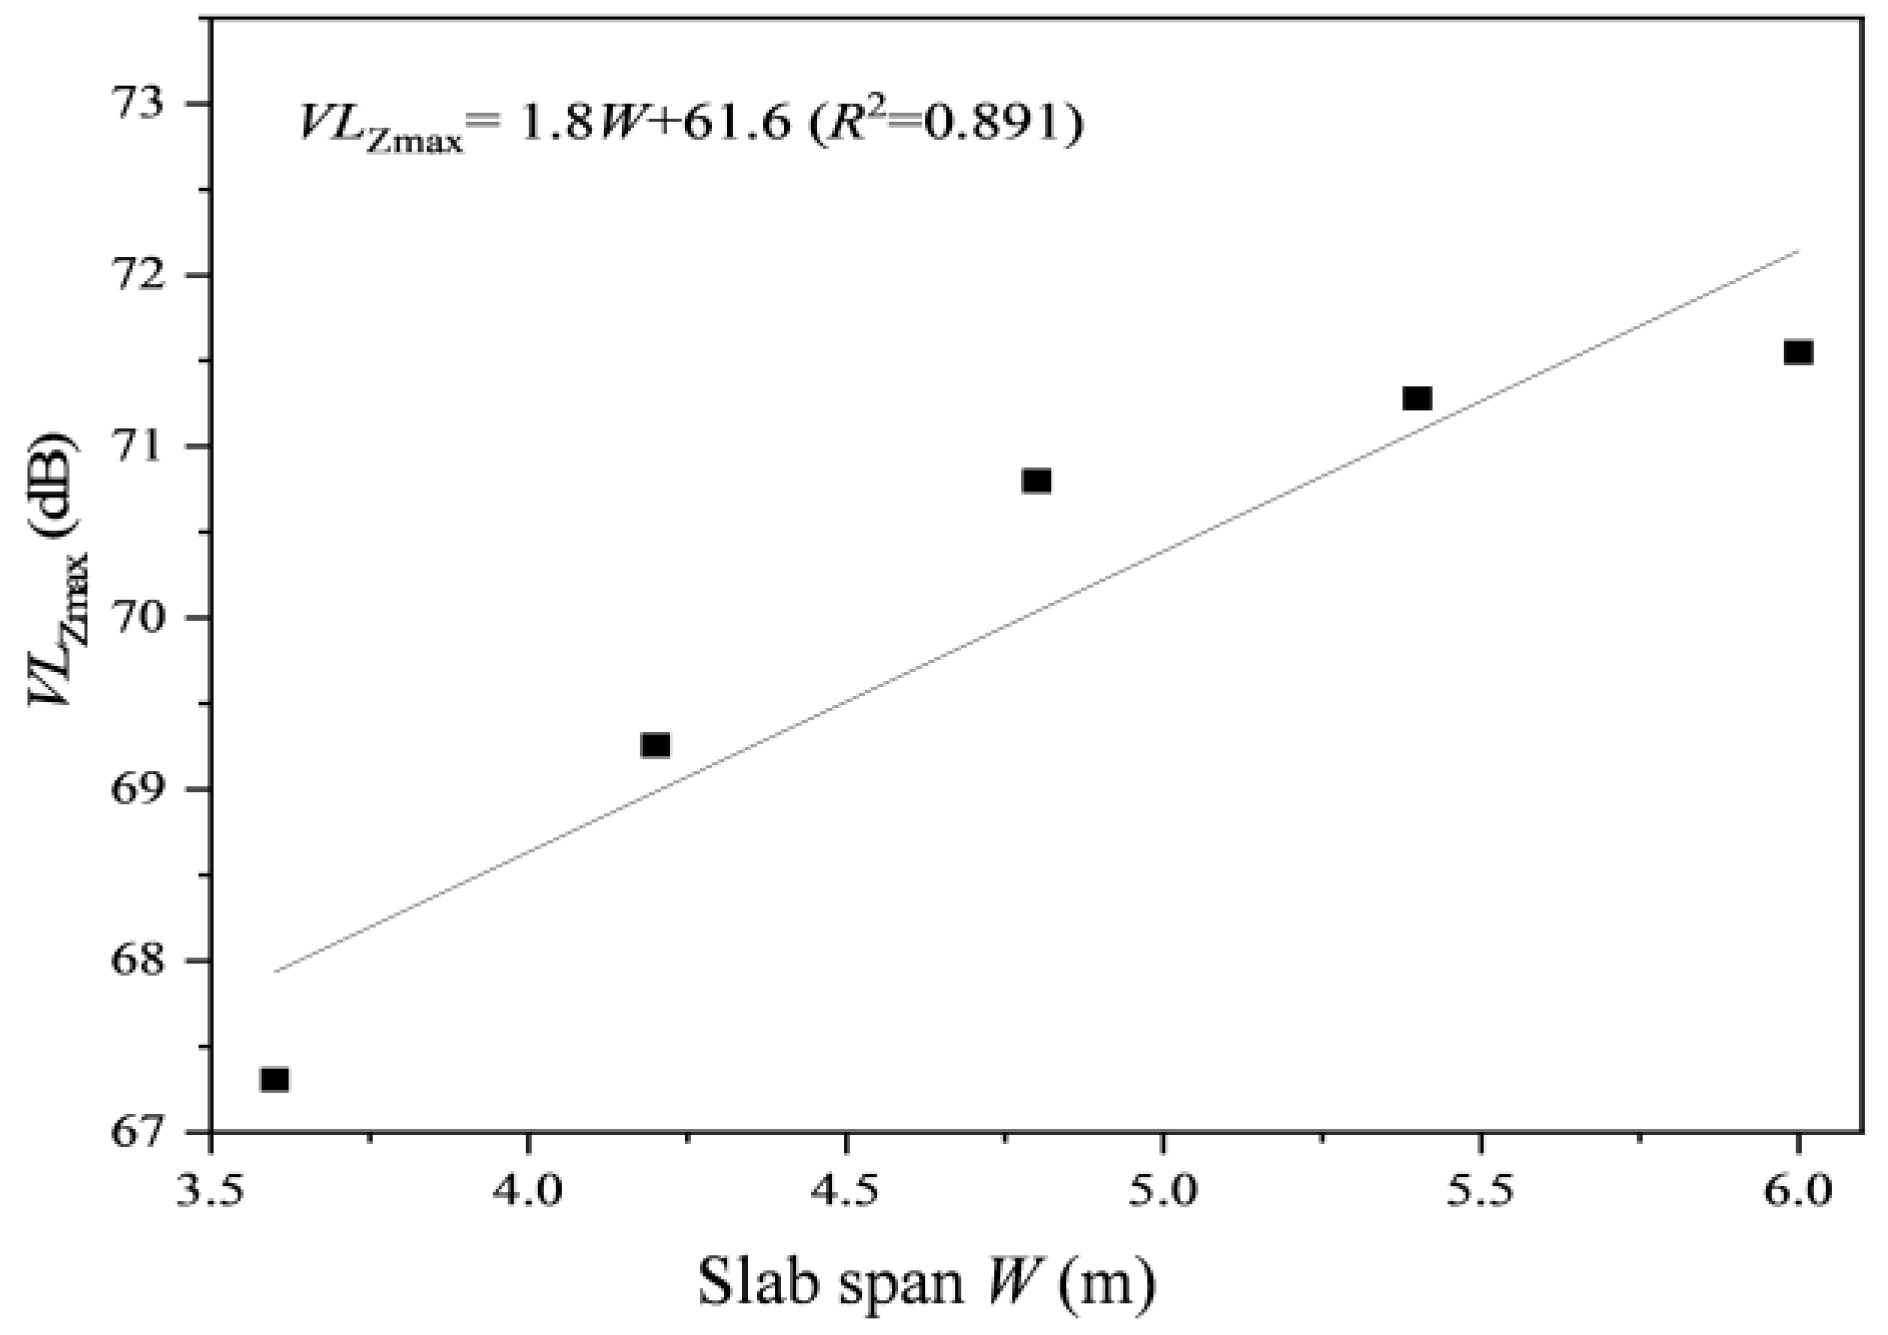
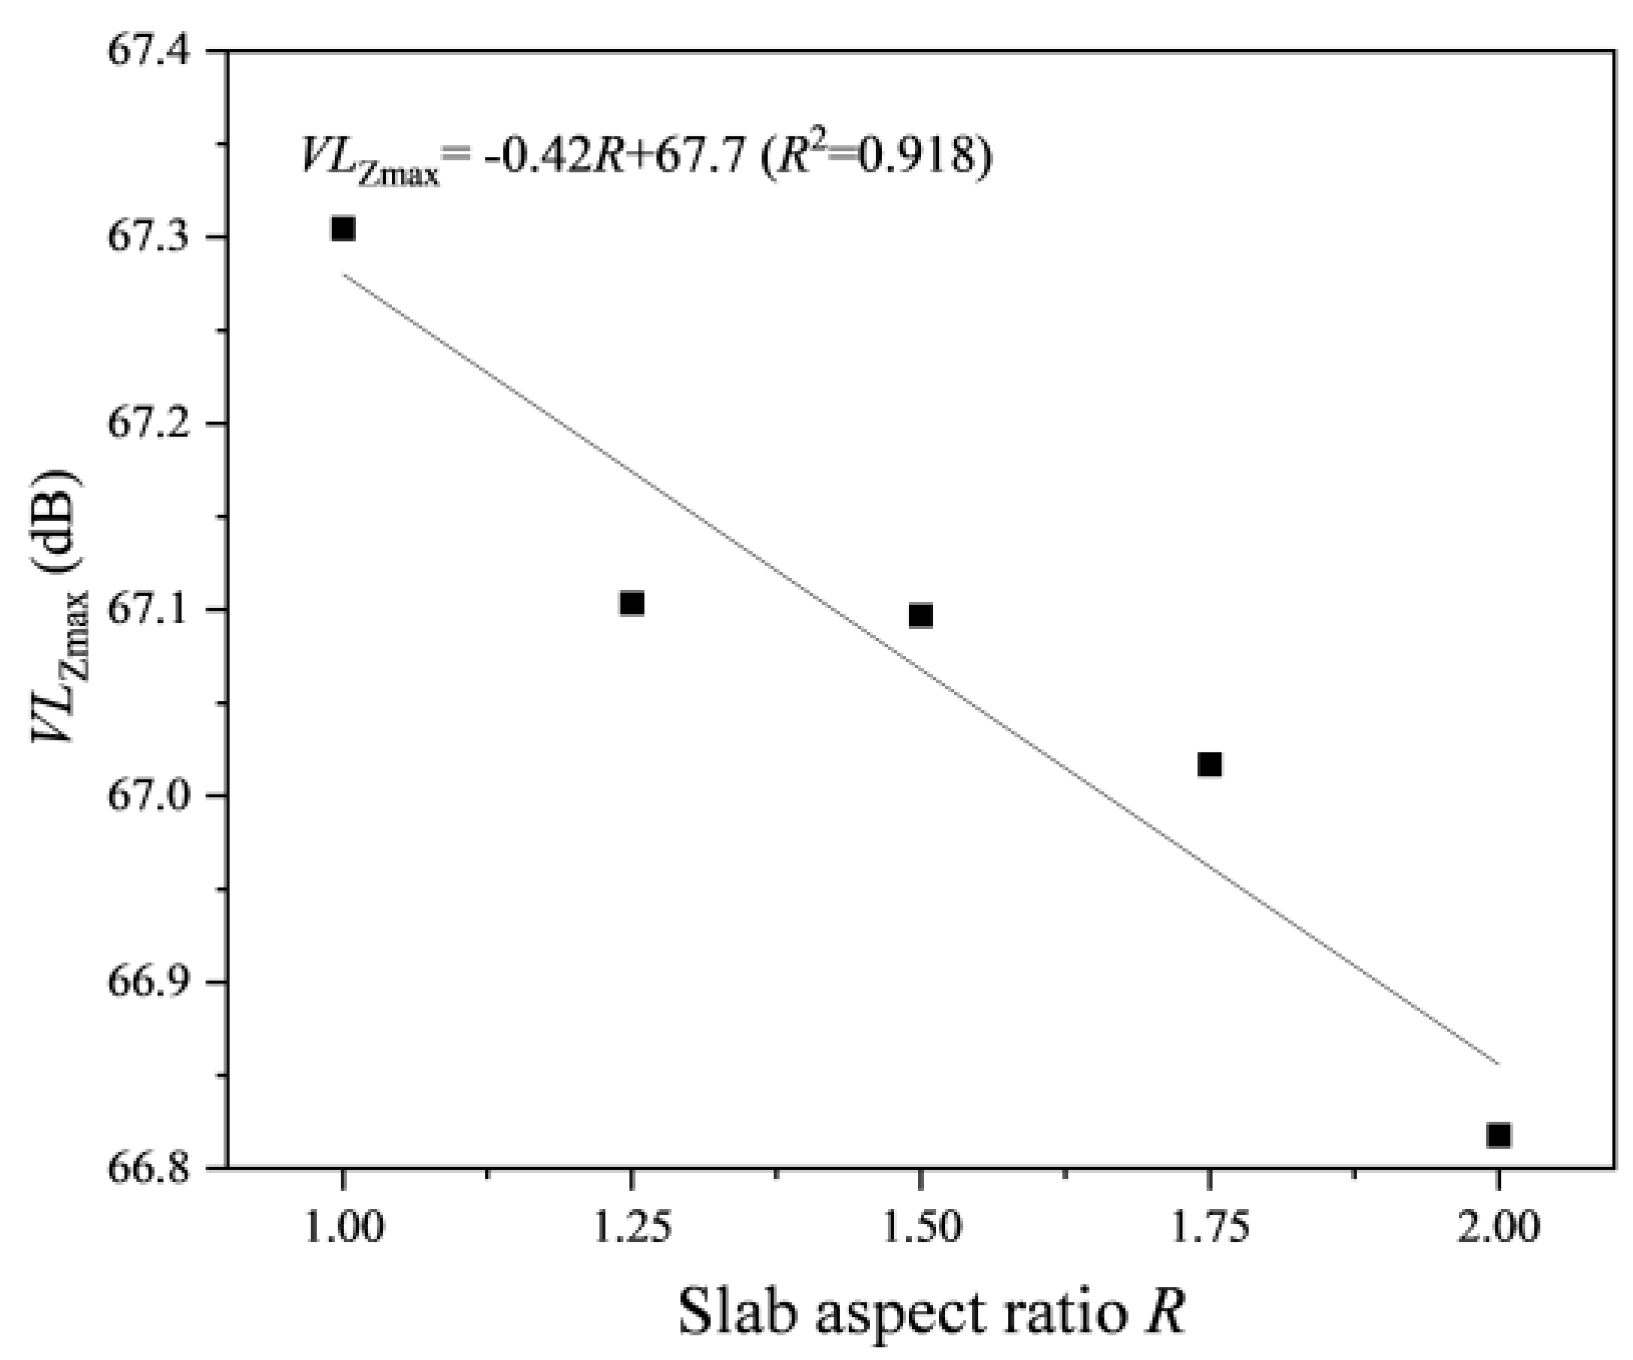
4.3. The Influence of Building Floor Dimensions on Indoor Vibration Caused by a Train

A linear fitting between the VLZmax of the first floor and the span of floor (W) or the ratio of length and width of floor (R) was performed, and the results are shown in Figure 12 and Figure 13. It showed that the VLZmax of the first floor increased linearly with the increase in W and decreased linearly with the increase in R. Figure 14 shows the linear fitting result between ΔVLZmax and W. Figure 15 shows the linear fitting result between ΔVLZmax and R. I would suggest no changes here. They indicate that the ΔVLZmax decreased linearly with the increasing logarithmic value of W or R. Similar to this study, previous study also showed that the vibration amplitude of large span floors was lower than that of small span floors in over-track buildings of metro depots [23].

4.4. The Influence of Horizontal Distance between the Centre of the Over-Track Building and the Central Line of Track on Indoor Vibration Caused by a Train

A linear fitting result between the VLZmax of the first floor of an over-track building and the horizontal distance (D) from the centre of the over-track building to the central line of track is shown in Figure 16. The VLZmax of the first floor linearly decreased with the increase in D, and the decay rate of VLZmax was 0.22 dB/m. Measurement results from Zou [24] showed that the vibration of the over-track platform in the throat area of a metro depot decayed at a rate of 0.6 dB/m with the increase in D, which is similar to this study’s results. Of course, the decay rate of vibration had a little difference between the simulation results from this study and the measurements from Zou [24], which was induced by different parameters, such as the speed and length of train.

4.5. The Influence of the Height of the Transfer Storey on Indoor Vibration Caused by a Train

A linear fitting result between the VLZmax of the first floor of an over-track building and the height of the transfer storey (H) is shown in Figure 17. As shown in Figure 17, the coefficient of determination (R2) of the fitted function was 0.987 and the VLZmax of the first floor of an over-track building decreased linearly with the increase in H. When H increased, the transmission distance of train vibration would increase in the transfer storey, which led to the increase in the vibration energy dissipation. Accordingly, the effect of train vibration on over-track buildings decreased.

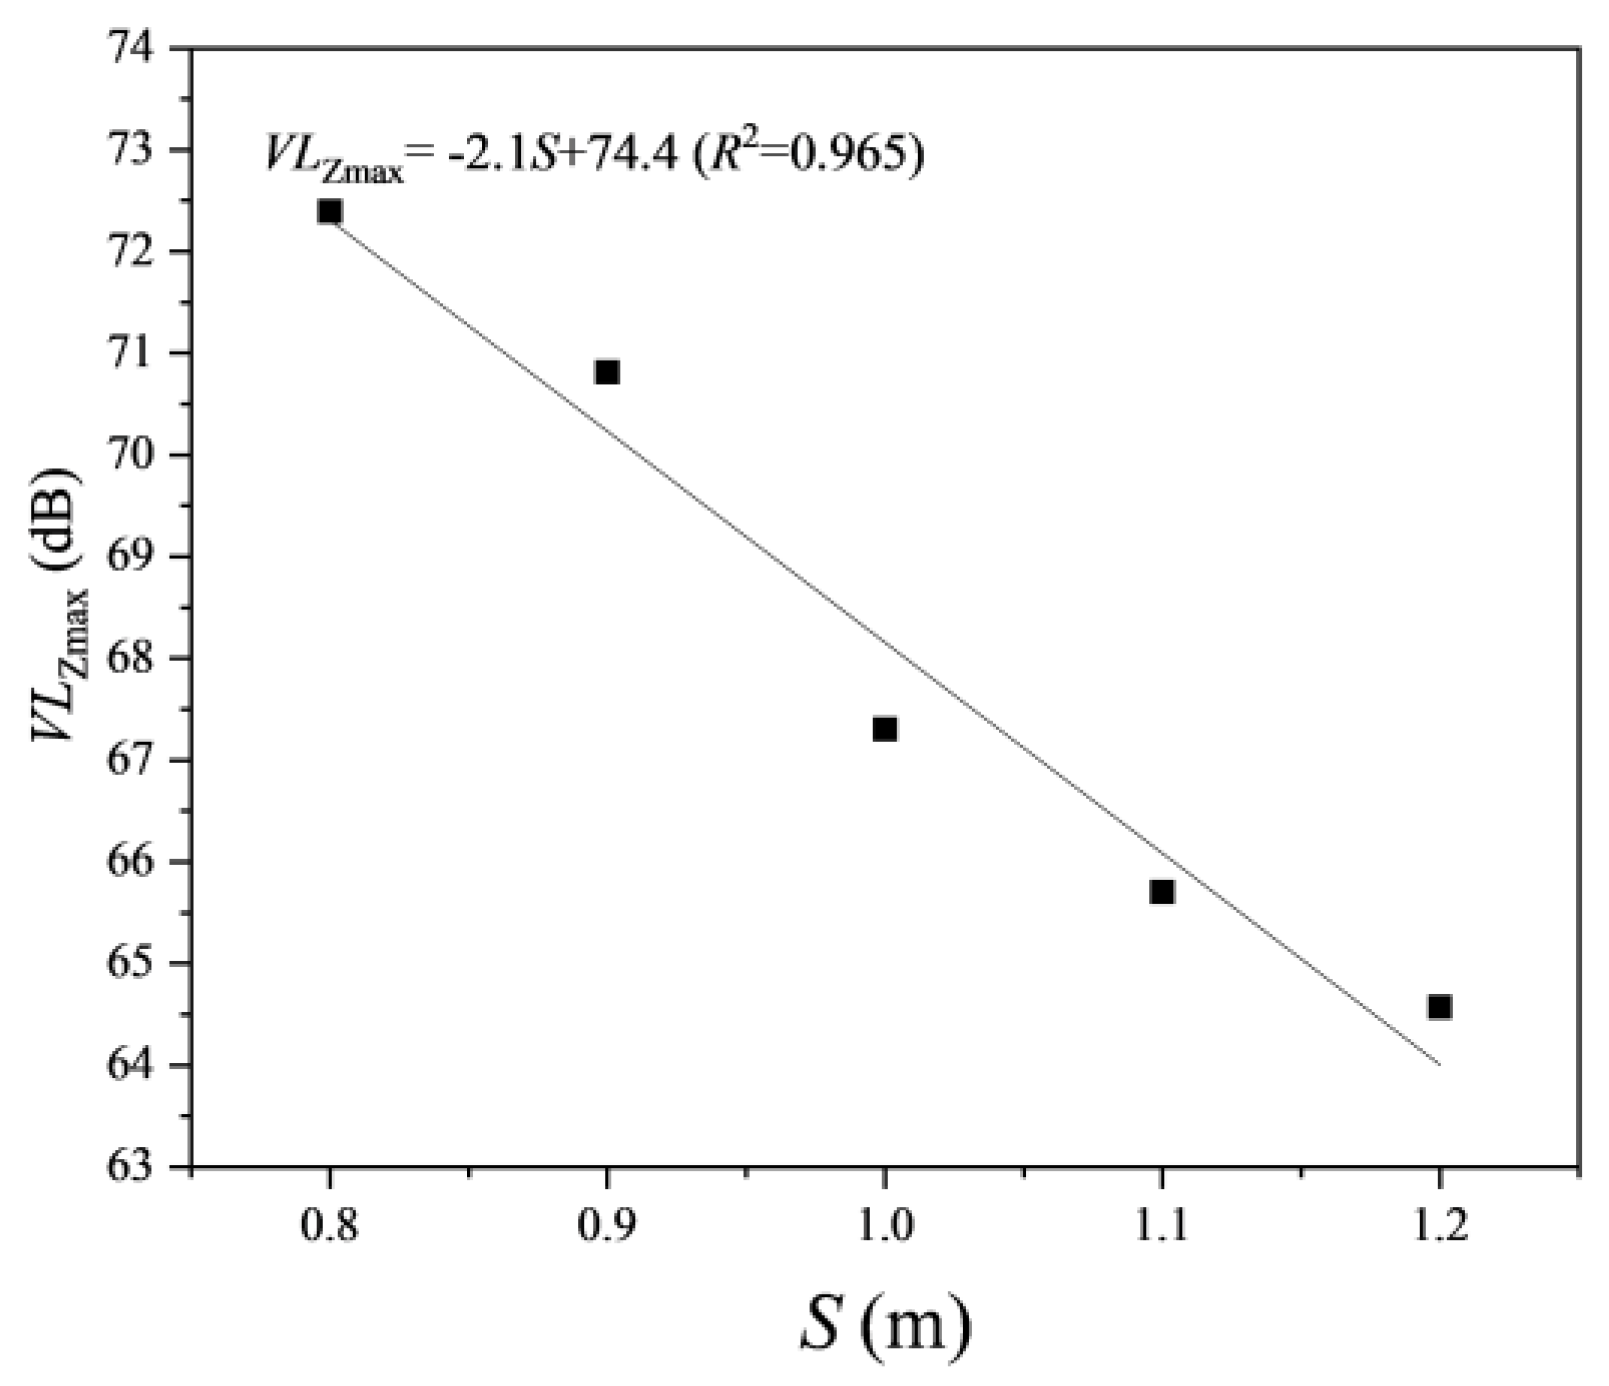
4.6. The Influence of the Thickness and the Cross-Section Dimensions of Columns in the Over-Track Platform on Indoor Vibration Caused by a Train

As shown in Figure 18 and Figure 19, linear fittings were performed between the VLZmax of the first floor and the thickness (T) of the over-track platform and between the side length of cross-section of columns in over-track platforms (S) and the VLZmax of the first floor, respectively. As shown in Figure 18 and Figure 19, the VLZmax of the first floor of over-track building decreased linearly with the increase in T and S. This phenomenon can be attributed to the increase in the impedance of the floor and columns of the over-track platform [23].

5. A Model Predicting the Impact of Vibration from Trains on Over-Track Buildings

On the basis of the simulation results above, a model predicting the impact of train vibration on over-track buildings in the throat area of a metro depot could be developed (see Equation (9)).
V L Z m a x , O B = V L Z m a x , F L + C P + C D + C F + C M + C S
where V L Z m a x , O B is the maximal value among V L Z m a x s at the centre on all floors of an over-track building, V L Z m a x , F L is the V L Z m a x on the ground right under the over-track building, C P is the correction item of the over-track platform, C D is the correction item of the horizontal distance between the center of the over-track building and the central line of track, C F is the correction item of the total amount of storeys of the over-track building, C M is the correction item of the dimensions of the floor of the over-track building, and C S is the correction item of the structure type of the over-track building. V L Z m a x , F L can be calculated according to Equations (10) and (11), which were given in HJ 453-2018, the standard issued by the Ministry of Ecology and Environment of the People’s Republic of China and titled Technical Guidelines for Environmental Impact Assessment-Urban Rail Transit [25].
V L Z m a x , F L = V L Z 0 m a x + C V B
C V B = C V + C W + C R + C T + C D + C B + C T D
where VLZ0max is the vibration source strength of the reference train, CVB is the vibration correction, C V is the correction item of the speed of the train, C W is the correction item of axle weight and unsprung mass, C R is the correction item of wheel-rail condition, C T is the correction item of tunnel type, C D is the correction item of distance attenuation, C B is the correction item of building type, and C T D is the correction item of traffic density [25].

5.1. The Correction Item of the VLZmax Caused by the Over-Track Platform, C P

To predict the influence of train vibration on over-track buildings in the throat area of a metro depot, C P was introduced. According to fitting results given in Figure 17, Figure 18 and Figure 19, C P can be calculated by Equation (12).
C P = a + k T T 0.25 + k S S 1.0 + k H H 7.5 = 11.5 22.1 T 0.25 2.1 S 1.0 0.86 H 7.5
where the constant term, a, is the difference between the VLZmax of the first floor of a 12-storey frame building and the V L Z m a x , F L of the ground right under it. kH, kT, and kS are the variations of VLZmax at the first floor of the over-track building when the height of the transfer storey, the thickness of the over-track platform, and the side length of the cross-section of the over-track platform column increase by one unit, respectively. According to Equations (10) and (11), the V L Z m a x , F L can be calculated and is 78.8 dB. The VLZmax of the first floor of a 12-storey frame building given in Figure 9 is 67.3 dB. Consequently, the calculated constant term, a, is −11.5 dB. By introducing C P , the VLZmax of the first floor of an over-track building can be predicted.

5.2. The Correction Item of Horizontal Distance between the Centre of the Over-Track Building and the Central Line of Track, C D

To predict the influence of train vibration on over-track buildings at different D, C D was introduced. C D represents the difference between the VLZmax at the first floor of a 12-storey frame building when the horizontal distance between the centre of the over-track building and the central line of track is D and that when D takes the reference value, D0, 20 m. According to fitting results given in Figure 16, C D can be calculated by Equation (13).
C D = k D D D 0 = 0.22 D 20
where kD is the variation of VLZmax of the first floor of an over-track building when D increases one unit.

5.3. The Correction Item of Total Amount of Storeys, C F

To predict the maximal impact of train vibration on over-track buildings, C F was introduced. According to fitting results given in Figure 10 and Figure 11, C F can be calculated by Equation (14).
C F = m + k N 1 + k N 2 N 12 = 8.74 0.81 N 12
where m is a constant item and represents the increment (ΔVLZmax) of the VLZmax of the top floor relative to the VLZmax of the first floor in a 12-storey frame building. According to simulation results given in Figure 9, m takes a value of 8.74. kN1 is the variation of the VLZmax of the first floor of a frame building when N increases by 1 and kN2 is the variation of the ΔVLZmax of a frame building when N increases by 1.

5.4. The Correction Item of the Cross-Section Dimensions of Columns, C M

Considering the influence of the cross-section dimensions of columns on the vibration transfer in over-track buildings, C M was introduced. C M is the difference between the VLZmax of a frame building when the slab span is W and the aspect ratio is R and that when the slab span is W0, 3.6 m, and aspect ratio is R0, 1.0. According to fitting results given in Figure 12, Figure 13, Figure 14 and Figure 15, C M can be calculated by Equation (15).
C M = k W 1 W W 0 + k W 2 l g W l g W 0 + k R 1 R R 0 + k R 2 l g R l g R 0 = 1.8 W 3.6 0.42 R 1.0 39.8 l g W 3.6 13.3 l g R
where kW1 is the variation of the VLZmax of the first floor of an over-track building when W increases by one unit, kR1 is the variation of the VLZmax of the first floor of an over-track building when R increases by one unit, kW2 is the variation of the ΔVLZmax of an over-track building when the logarithmic value of W increases by one unit, and kR2 is the variation of the ΔVLZmax of an over-track building when the logarithmic value of R increases by one unit.

5.5. The Correction Item of the Type of Building Structure, C S

To predict the influence of train vibration on shear wall buildings, C S was introduced. C S represents the difference between the VLZmax on each floor in shear wall buildings and that in frame buildings. According to the fitting results given in Figure 10 and Figure 11, the difference between the VLZmax on the first floor in shear wall buildings and that in frame buildings can be expressed as k S 1 N + b S 1 k N 1 N + b N 1 . Similarly, the difference between the ΔVLZmax in shear wall buildings and frame buildings can be expressed as k S 2 N + b S 2 k N 2 N + b N 2 . Therefore, C S can be calculated by Equation (16).
C S = k S 1 N + b S 1 k N 1 N + b N 1 + k S 2 N + b S 2 k N 2 N + b N 2 = 0.2 N + 67.6 0.47 N + 68.4 + 0.1 N + 8.6 0.34 N + 12.8 = 0.51 N 5.0
According to the model developed in this study, the maximal impact of train vibration on an over-track building can be predicted on the basis of the VLZmax on the ground right under the over-track building of a metro depot.
Lopes [26] presented a comprehensive approach for the simulation of train vibration in tunnels. However, the influence of building structure parameters was not considered. Aires [27] presented an integrated methodology to determine the ground vibration induced by railway traffic, and a case study was carried out. However, the two models above are not suitable for directly predicting the influence of train vibrations on over-track buildings.
Since existing models are not suitable for predicting the effect of train vibration on each floor of over-track buildings of metro depots, this model cannot be compared with previous similar research.

6. Conclusions

To investigate the influence of train vibration on over-track buildings in the throat area of metro depots, a simulation model of over-track buildings in the throat area of metro depots was established using a finite element method. The influence of train vibration on over-track buildings in the throat area of metro depots under different parameters was quantitatively studied, and the main conclusions are as follows:
(1)
The VLZmax at the centre of each floor of an over-track building periodically increases with the rise of storey, and the maximal value appears on the top floor. The VLZmax of the top floor is 3.8–11.1 dB higher than that of the first floor in over-track buildings with 4–20 storeys. The VLZmax of each floor of a frame building is 1.4–6.0 dB higher than that of a shear wall building.
(2)
When D increases by 10 m, the VLZmax of each floor will decrease by 0.5–4.6 dB. When H increases by 1 m, the VLZmax of each floor will decrease by 0.7–2.3 dB.
(3)
When T increases by 0.05 m, the VLZmax of each floor will decrease by 0.5–3.5 dB. When S increases by 0.1 m, the VLZmax of each floor will decrease by 0.4–4.5 dB.
(4)
According to results of the quantitative simulation, a prediction model was developed to analyse the vibration impact of train vibration on over-track buildings in the throat area of metro depots. The maximal impact of train vibration on over-track buildings of metro depots can be predicted on the basis of this model.
In this study, under the condition that the ground projected areas of the over-track platform and over-track building are fixed, the single factor method is used to quantitatively study the influence of changing the main parameters of the over-track platform and over-track building on vibration transmission through simulation. If the ground projected area of the over-track platform and over-track building changes, the absolute value of simulation results will also change but the relative value will basically remain unchanged. Therefore, the model established based on the relative values of simulation results has certain universality.
Due to the fact that there are not enough over-track buildings of metro depots in operation in China and that vibration sources such as the operation of fixed equipment and the movement of people inside over-track buildings cause significant interference with train vibration tests, this study did not obtain actual measurement data to directly verify the rationality of the model. The effectiveness and generalization of this model deserves further verification.

Author Contributions

Conceptualization and methodology, G.D.; data curation and software, J.G.; writing—original draft preparation, H.L.; All authors have read and agreed to the published version of the manuscript.

Funding

This research received no external funding.

Institutional Review Board Statement

Not applicable.

Informed Consent Statement

Not applicable.

Data Availability Statement

The raw data supporting the conclusions of this article will be made available by the authors on request.

Conflicts of Interest

The authors declare no conflicts of interest.

References

  1. Ministry of Transport. A Snapshot of Urban Rail Transport Operational Data in 2023. Available online: http://www.gov.cn (accessed on 15 January 2024). (In Chinese)
  2. Cik, M.; Lienhart, M.; Lercher, P. Analysis of Psychoacoustic and Vibration-Related Parameters to Track the Reasons for Health Complaints after the Introduction of New Tramways. Appl. Sci. 2016, 6, 398. [Google Scholar] [CrossRef]
  3. Kowalska-Koczwara, A.; Pachla, F.; Tatara, T. Measurements of Human Perception of Train Vibration. Appl. Sci. 2024, 14, 3404. [Google Scholar] [CrossRef]
  4. Zou, C.; Wang, Y.; Wang, P.; Guo, J. Measurement of ground and nearby building vibration and noise induced by trains in a metro depot. Sci. Total Environ. 2015, 536, 761–773. [Google Scholar] [CrossRef] [PubMed]
  5. Wu, Y.; Zhang, B.; Liu, Y.; Li, X. Field measurement and numerical simulation of vibration effect on metro depot over-track building caused by passing trains. In Proceedings of the International Conference on Sensors, Measurement and Intelligent Materials, Guilin, China, 26–27 December 2012. [Google Scholar]
  6. Cao, Z.; Guo, T.; Zhang, Z.; Li, A. Measurement and analysis of vibrations in a residential building constructed on an elevated metro depot. Measurement 2018, 125, 394–405. [Google Scholar] [CrossRef]
  7. Sanayei, M.; Kayiparambil, P.; Moore, J.; Brett, C. Measurement and prediction of train vibrations in a full-scale building. Eng. Struct. 2014, 77, 119–128. [Google Scholar] [CrossRef]
  8. ISO 2631-1:1985; Evaluation of Human Exposure to Whole-Body Vibration. Part 1: General Requirements. International Organization for Standardization: Geneva, Switzerland, 1985.
  9. Quagliata, A.; Ahearn, M.; Boeker, E.; Roof, C.; Meister, L.; Singleton, H. Transit Noise and Vibration Impact Assessment Manual; Department of Transportation: Washington, DC, USA, 2018. [Google Scholar]
  10. Kouroussis, G.; Pauwels, N.; Brux, P.; Couti, C.; Verlinden, O. A numerical analysis of the influence of tram characteristics and rail profile on railway traffic ground-borne noise and vibration in the Brussels Region. Sci. Total Environ. 2014, 482, 452–460. [Google Scholar] [CrossRef] [PubMed]
  11. Franois, S.; Schevenels, M.; Degrande, G.; Lombaert, G.; Galvin, P. Applications of a 2.5D coupled FE-BE methodology for the dynamic interaction between longitudinally invariant structures and the soil. In Proceedings of the 8th National Congress on Theoretical and Applied Mechanics, Brussels, Belgium, 28–29 May 2009. [Google Scholar]
  12. Wang, T.; Jiang, B.; Sun, X. Train-Induced Vibration Prediction and Control of a Metro Depot and Over-Track Buildings. Buildings 2023, 13, 1995. [Google Scholar] [CrossRef]
  13. Kedia, N.; Kumar, A.; Singh, Y. Prediction of underground metro train-induced ground vibration using hybrid PSO-ANN approach. Neural Comput. Appl. 2023, 35, 8171–8195. [Google Scholar] [CrossRef]
  14. Melke, J. Noise and vibration from underground railway lines-proposals for a prediction procedure. J. Sound Vibr. 1988, 120, 391–406. [Google Scholar] [CrossRef]
  15. Paneiro, G.; Durao, F.; Silva, M.; Neves, P. Artificial neural network model for ground vibration amplitudes prediction due to light railway traffic in urban areas. Neural Comput. Appl. 2018, 29, 1045–1057. [Google Scholar] [CrossRef]
  16. Torstensson, P.; Nielsen, J. Simulation of dynamic vehicle–track interaction on small radius curves. Veh. Syst. Dyn. 2011, 49, 1711–1732. [Google Scholar] [CrossRef]
  17. Jenkins, H.; Stephenson, J.; Clayton, G.; Morland, G.; Lyon, D. The effect of track and vehicle parameters on wheel/rail vertical dynamic loads. J. Railw. 1974, 3, 2–16. [Google Scholar]
  18. Zhang, Y.; Bai, B. Simulation of excitation loads on tunnel structure by underground train vibration. J. Vib. Shock 2000, 19, 68–71. (In Chinese) [Google Scholar]
  19. Di, G.; Xie, Z.; Guo, J. Predict the influence of environmental vibration from high-speed railway on over-track buildings. Sustainability 2021, 13, 3218. [Google Scholar] [CrossRef]
  20. Guo, T.; Cao, Z.; Zhang, Z.; Li, A. Numerical simulation of floor vibrations of a metro depot under moving subway trains. J. Vib. Control 2018, 24, 4353–4366. [Google Scholar] [CrossRef]
  21. Xie, W.; Chen, Y.; Yao, C. Vibration analysis of train depot over-track buildings induced by train load. J. Vib. Shock 2016, 35, 110–115. (In Chinese) [Google Scholar]
  22. Wu, Y.; Zhang, B.; Liu, Y.; Li, X. Law of vibrations influence of subway on metro depot over-track building. J. China Railw. Soc. 2015, 37, 98–103. (In Chinese) [Google Scholar]
  23. Cao, Z. Serviceability Analysis and Vibration Control of Elevated Metro Depot and Over-Depot Residential Building Complex. Ph.D. Thesis, Southeast University, Nanjing, China, 2018. (In Chinese). [Google Scholar]
  24. Zou, C. Train Vibration Transmission and Mitigation in Metro Depot and Over-Track Buildings. Ph.D. Thesis, South China University of Technology, Guang Zhou, China, 2017. (In Chinese). [Google Scholar]
  25. HJ 453-2018; Technical Guidelines for Environment Impact Assessment of Urban Rail Transit. Ministry of Ecology and Environment of The People’s Republic of China: Beijing, China, 2018. (In Chinese)
  26. Lopes, P.; Costa, P.; Ferraz, M.; Calçada, R.; Cardoso, A. Numerical modeling of vibrations induced by railway traffic in tunnels: From the source to the nearby buildings. Soil Dyn. Earthq. Eng. 2014, 61, 269–285. [Google Scholar] [CrossRef]
  27. Colaco, A.; Costa, P.; Amado-Mendes, P.; Godinho, L. Prediction of Vibrations and Reradiated Noise Due to Railway Traffic: A Comprehensive Hybrid Model Based on a Finite Element Method and Method of Fundamental Solutions Approach. J. Vib. Acoust. 2017, 139, 061009. [Google Scholar] [CrossRef]
Figure 2. The load of vertical vibration from trains in the straight section of the throat area.
Applsci 14 08598 g002
Figure 3. The geometric model of track, soil, and over-track platform and building.
Applsci 14 08598 g003
Figure 4. Layouts of verification points in the measured metro depot.
Applsci 14 08598 g004
Figure 5. Layouts of vibration acceleration sensors at each sampling point: (a) ground; (b) column of the over-track platform.
Applsci 14 08598 g005
Figure 6. The comparison of the measured and simulated 1/3 octave spectrum of the vertical vibration acceleration level: (a) ground; (b) column of the over-track platform.
Applsci 14 08598 g006
Figure 7. Layouts of the civil building and measurement points: (a) horizontal layout; (b) vertical layout.
Applsci 14 08598 g007
Figure 8. The measured results of vertical vibration at C1: (a) vibration acceleration in time domain; (b) frequency spectra of vibration acceleration between 0 Hz and 250 Hz.
Applsci 14 08598 g008
Figure 9. The VLZmax at each floor in the frame and shear wall buildings with 4–20 storeys: (a) frame structure; (b) shear wall structure.
Applsci 14 08598 g009
Figure 10. The influence of N on the VLZmax of the first floor.
Applsci 14 08598 g010
Figure 11. The influence of N on the ΔVLZmax in buildings.
Applsci 14 08598 g011
Figure 12. The influence of W on the VLZmax of the first floor.
Applsci 14 08598 g012
Figure 13. The influence of R on the VLZmax of the first floor.
Applsci 14 08598 g013
Figure 14. The influence of W on ΔVLZmax in buildings.
Applsci 14 08598 g014
Figure 15. The influence of R on ΔVLZmax in buildings.
Applsci 14 08598 g015
Figure 16. The influence of D on the VLZmax of the first floor.
Applsci 14 08598 g016
Figure 17. The influence of H on the VLZmax of the first floor.
Applsci 14 08598 g017
Figure 18. The influence of T on the VLZmax of the first floor.
Applsci 14 08598 g018
Figure 19. The influence of S on the VLZmax of the first floor.
Applsci 14 08598 g019
Table 1. The material parameters of each component.
MaterialsDensity (kg/m3)Elastic Modulus (MPa)Poisson’s Ratio
Rail7850210,0000.25
Sleeper250030,0000.20
Track-bed2500420,0000.30
Artificial fill layer19802050.31
Pulverized clay layer15301200.35
Fine sand layer19401750.44
C40 concrete250032,5000.20
Standard brick160020000.15
Table 2. The comparison between measured results and simulated results in the measured metro depot.
Verification PointPositionVLZmax (dB)
Measured
Results
Simulated
Results
ErrorRelative Error
Z1Ground floor84.286.82.63.08%
Z2Platform columns77.678.31.31.67%
Table 3. The comparison between the measured results and simulated results in a civil building.
Measurement PointVLZmax (dB)VAL (dB)
Measured ResultsSimulated ResultsErrorRelative ErrorMeasured ResultSimulated ResultErrorRelative Error
C283.9 85.11.21.43%100.7102.11.41.39%
C382.3 83.10.80.97%94.195.21.11.17%
C481.8 82.00.2−0.24%90.491.00.60.66%
C580.6 80.2−0.4−0.50%86.586.1−0.4−0.46%
C679.9 79.3−0.6−0.75%84.484.0−0.4−0.47%
C779.3 77.8−1.5−1.89%83.682.7−0.9−1.08%
C878.7 78.2−0.5−0.64%82.481.8−0.6−0.73%
Table 4. Selected values of main structural parameters of the over-track platform.
Height of Transfer Storey,
H (m)
Thickness of Over-Track Platform,
T (m)
Side Length of Cross-Section of Columns Under Over-Track Platform, S (m)
5.5, 6.5, 7.5, 8.5, 9.50.15, 0.20, 0.25, 0.30, 0.350.8, 0.9, 1.0, 1.1, 1.2
Table 5. Selected values of main structural parameters of over-track buildings.
Building StructureTotal Amount of Storeys, NSlab Span, W (m)Aspect Ratio, RHorizontal Distance between Building Centre and Track Central Line, D (m)
Frame4, 8, 123.6, 4.2, 4.81.0, 1.250, 10, 20
shear wall16, 205.4, 6.01.5, 1.75, 2.030, 40
Disclaimer/Publisher’s Note: The statements, opinions and data contained in all publications are solely those of the individual author(s) and contributor(s) and not of MDPI and/or the editor(s). MDPI and/or the editor(s) disclaim responsibility for any injury to people or property resulting from any ideas, methods, instructions or products referred to in the content.

