Article

Constraints on the Geometry of Peripheral Faults above Mafic Sills in the Tarim Basin, China: Kinematic and Mechanical Approaches

1
Institute of Geotechnical Engineering, Zhejiang University of Technology, Hangzhou 310014, China
2
Department of Marine Sciences, Zhejiang University, Zhoushan 316021, China
Appl. Sci. 2024, 14(19), 8621; https://doi.org/10.3390/app14198621
Submission received: 31 July 2024 / Revised: 19 September 2024 / Accepted: 20 September 2024 / Published: 24 September 2024
(This article belongs to the Special Issue Seafloor Magmatic and Hydrothermal Activity)

Abstract

:
Host rock deformation associated with sill emplacement is used to constrain magma transfer and storage within the upper crust. In contrast to classic models suggesting that the host rock above mafic sills is dominated by elastic bending, recent studies show that bounding faults that limit the uplift area can occur at the peripheries of a mafic sill. However, the accurate dip of this type of fault, named peripheral faults here, is still not well constrained. Their origin is also controversial in some cases. In this study, kinematic modeling and limit analysis are performed to better constrain the structure and mechanical properties of the peripheral faults based on seismic interpretation of a mafic sill from the Tarim Basin, China. The trishear kinematic model successfully reproduces peripheral faulting and associated folding of the host rock by performing a displacement of 58 m on a vertical fault plane with a fault propagation (P) to fault slip (S) ratio of 2.5. The limit analysis also predicts vertical damage at the sill tip by sill inflation. These results suggest that the dip angle of the fault in the case study is 90°, which is more accurate than that from the seismic interpretation with an 88° inward dip. This value may vary in other cases as it depends on the sill geometry (such as diameter and inclination), thickness, depth, and mechanical properties of the host rock. The study supports that peripheral faulting and associated folding can occur at the tips of the mafic sill due to the vertical uplift of the host rock caused by sill inflation. It is also suggested that trishear kinematic modeling and limit analysis are effective methods for studying the geometry of peripheral faults.

1. Introduction

Sill emplacement in the shallow upper crust is an important process of the volcanic plumbing system with great significance for the evolution of our planet [1,2]. Magma propagation is controlled by its interaction with the mechanical behavior of the host rock, such as deformation and fracture [3,4]. At shallow crustal depths, host rock deformation associated with sill emplacement is generally expressed as overburden uplifting [3]. For mafic sills, which are often characterized by a high aspect ratio (length vs. thickness), the associated host rock deformation is dominated by elastic bending [4,5,6]. Fractures can also occur at the periphery of a sill when the sill reaches a critical length [4,7]. Previous studies suggested that these inclined fractures at the sill tips were caused by tensile stress [4,8], while more recent research indicates that these fractures are more likely the result of shear failures [3,9,10]. These inclined fractures provide pathways for inclined sheets and promote the formation of saucer-shaped sills, which represent fundamental geometries for magma intrusions in shallow sedimentary sequences [11,12]. In other words, shear failure greatly controls the deflection of flat sills to inclined sheets [9].
Recent studies such as those from Sierra Negra volcano and Alcedo volcano, Galapagos, showed that shear fractures at the tips of mafic sills can also extend to the surface [13,14]. These faults can delimit the uplift area of the host rock and affect the pathway of ascending magma (Figure 1a) [14]. This so-called trapdoor faulting mechanism is considered an end-member type of host rock deformation associated with mafic sill intrusion [15]. Similar faulting has also been observed in analog experiments, in which reverse faults are observed at the terminations of the inclined sheets of saucer-shaped sills (Figure 1b) [16]. As saucer-shaped sills often consist of dolerites in nature [17,18], it is likely that reverse faulting at the tips of mafic sills is also a common mechanism of host rock deformation in contrast to the elastic bending model. Note that these reverse faults will be hereafter referred to as peripheral faults.
However, the current understanding of the structure of these peripheral faults is mostly derived from analog modeling, field observations, and theoretical modeling based on field observations [13,16,19]. Note that these faults are often not well exposed in outcrops and forward and inverse modeling from field observations largely depends on the initial model, which is inherently subject to non-unique solutions [8,20]. For example, at Sierra Negra, the fault is often modeled from surface deformation data such as Global Positioning System (GPS), tilt, and Interferometric Synthetic Aperture Radar (InSAR) data [14,19]. These methods have relatively weak constraints on the fault dip angle. As a matter of fact, a shallower outward dip angle (e.g., 70°) or a subvertical inward value for the fault in the model will yield similar results [21]. Analog experiments can reproduce the growth of mafic sills and peripheral faults, yet a study from natural examples may help us better understand the geometry of peripheral faults [16].
A typical example from the Tarim Basin was selected as a case study, where typical saucer-shaped sills and peripheral faults were observed [18,22]. The seismic reflection data were first interpreted to decipher the structure of peripheral faults. Due to the limitations of the vertical resolution of the seismic reflection data, there were still some errors in determining the dip of the peripheral faults based on seismic data. Therefore, trishear kinematic modeling and finite element limit analysis were used to constrain the detailed geometry and dip angle of the peripheral faults at the sill tips from a kinematic and mechanical perspective, respectively.

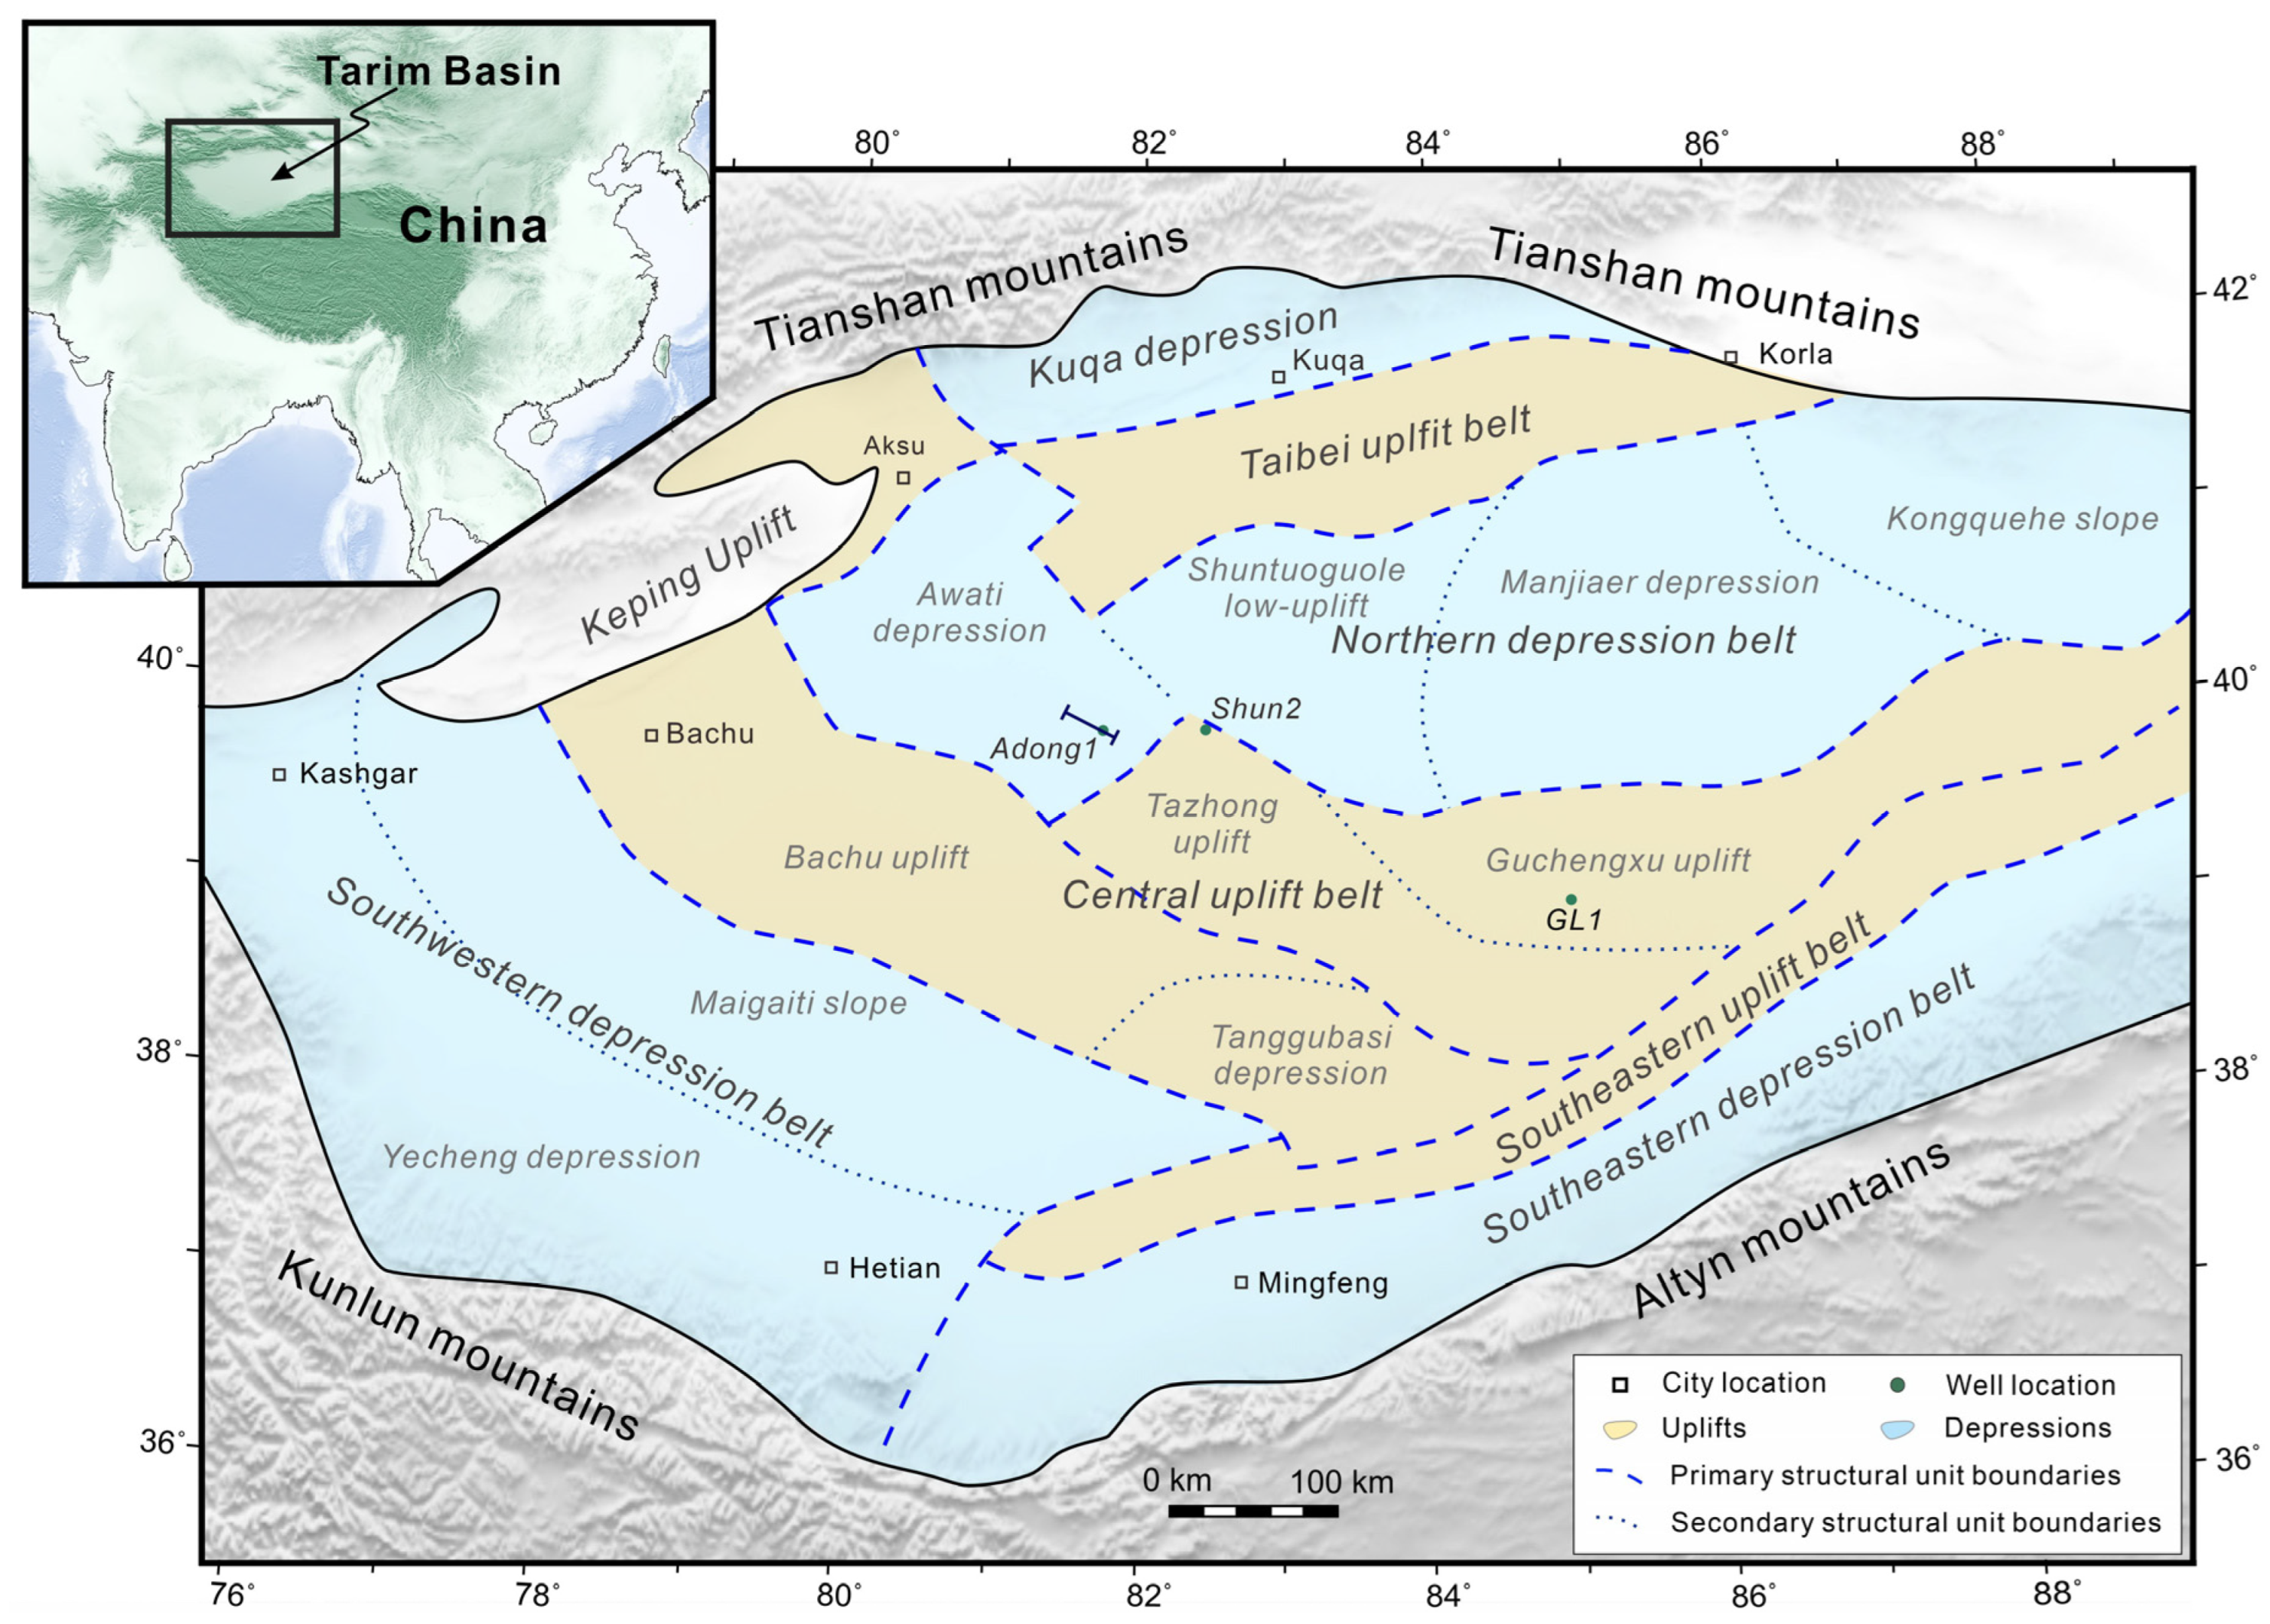
2. Geological Setting

The study area lies in the central part of the Tarim Basin, a large basin located in the northwestern part of China (Figure 2) [23]. The basin formed in response to continental breakup of the Rodinia supercontinent [24]. After its initial formation, it generally turned into a cratonic basin from the Cambrian to Permian periods and converted to a foreland basin since the Triassic [24,25]. It received sediments almost continuously from the Paleozoic to the Cenozoic with a residual thickness of up to 15,000 m. The Cambrian to Middle Ordovician strata mainly consist of dolomites and limestone, and the upper Ordovician to Cenozoic units are predominantly siltstone, mudstone, and sandstone [22]. Extensive magmatic activity occurred within the Tarim basin during the Permian period [26]. The residual flood basalts revealed by seismic profiles and borehole data cover the central and western part of the Tarim Basin with an area of about 250,000 km2; the accumulated thickness of the basalts is up to 780 m [27]. This magmatic activity is called the Tarim Permian Large Igneous Province (LIP) [28,29].
Recent studies demonstrated that mafic sills are widely distributed in the central part of the Tarim Basin [18,22,30]. The sills have been well-imaged by seismic reflection profiles and borehole data from the petroleum industry. They are predominantly emplaced in the Middle and Upper Ordovician strata at current depths of 5–8 km [22]. The geological structure in these areas is relatively simple and the host rock deformation and faulting is also exquisitely imaged in seismic reflection data. Therefore, the Tarim Basin has been suggested as an ideal location for this study.

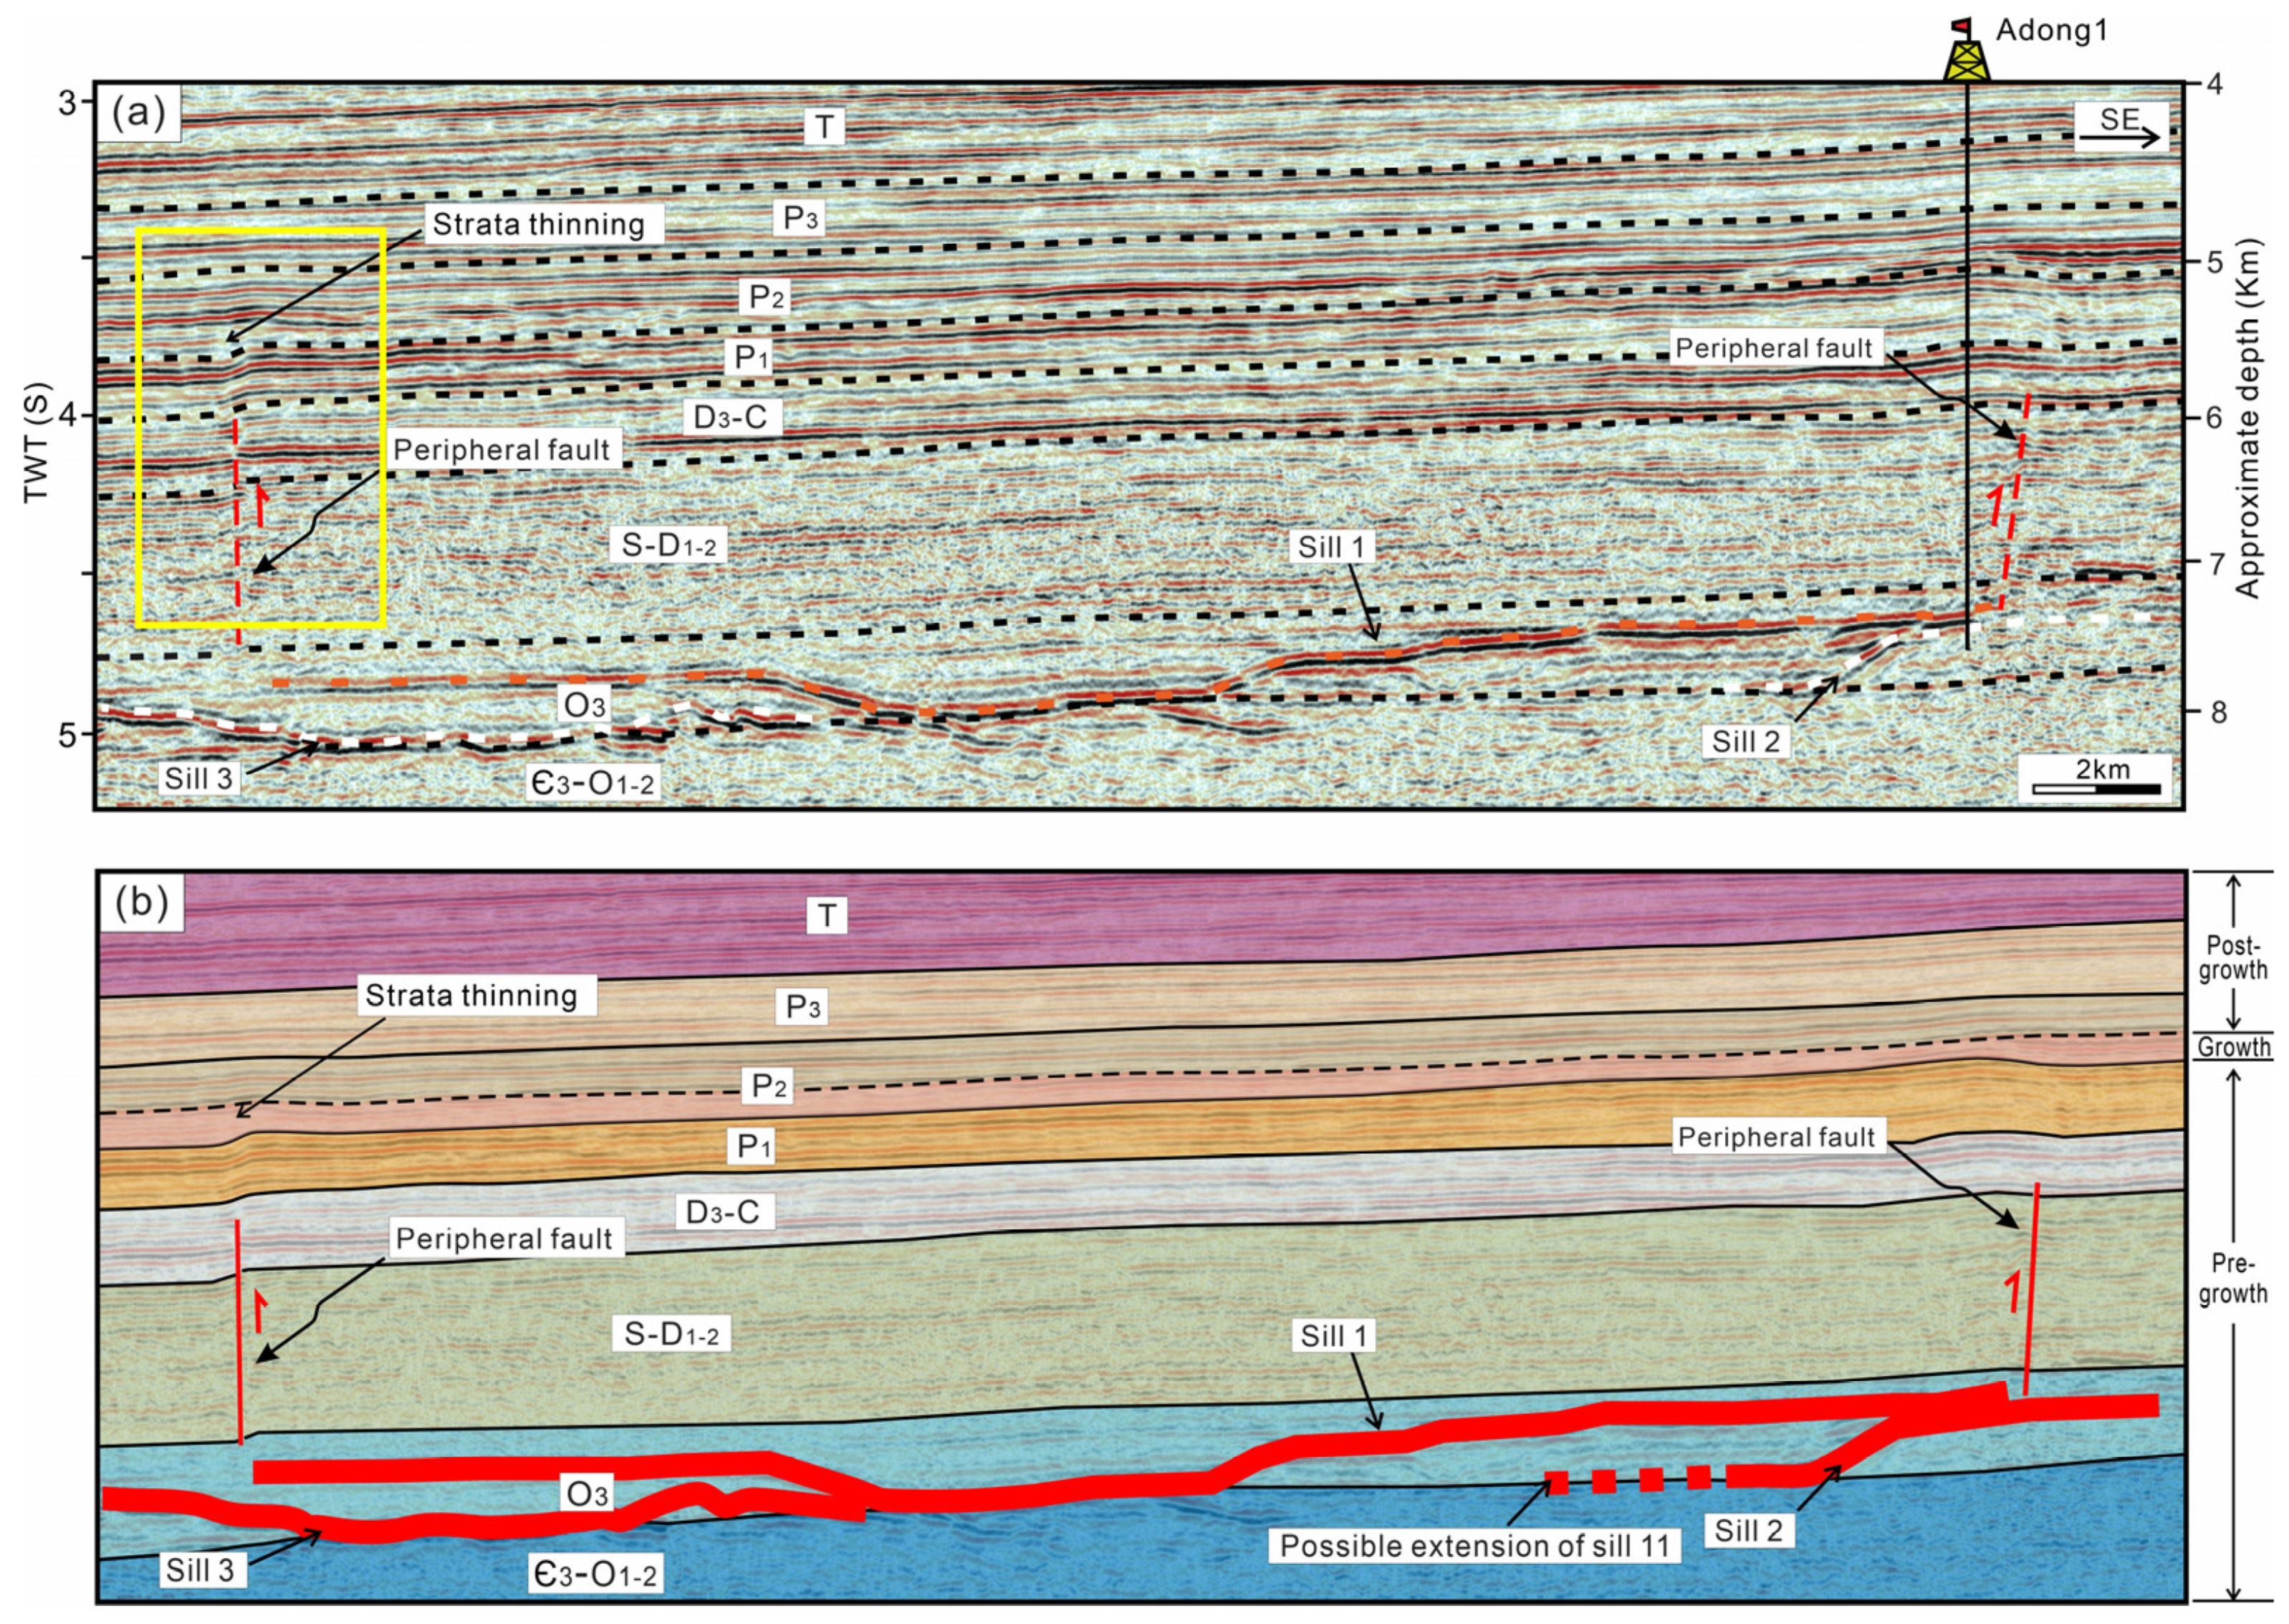
3. Seismic Observations and Interpretation
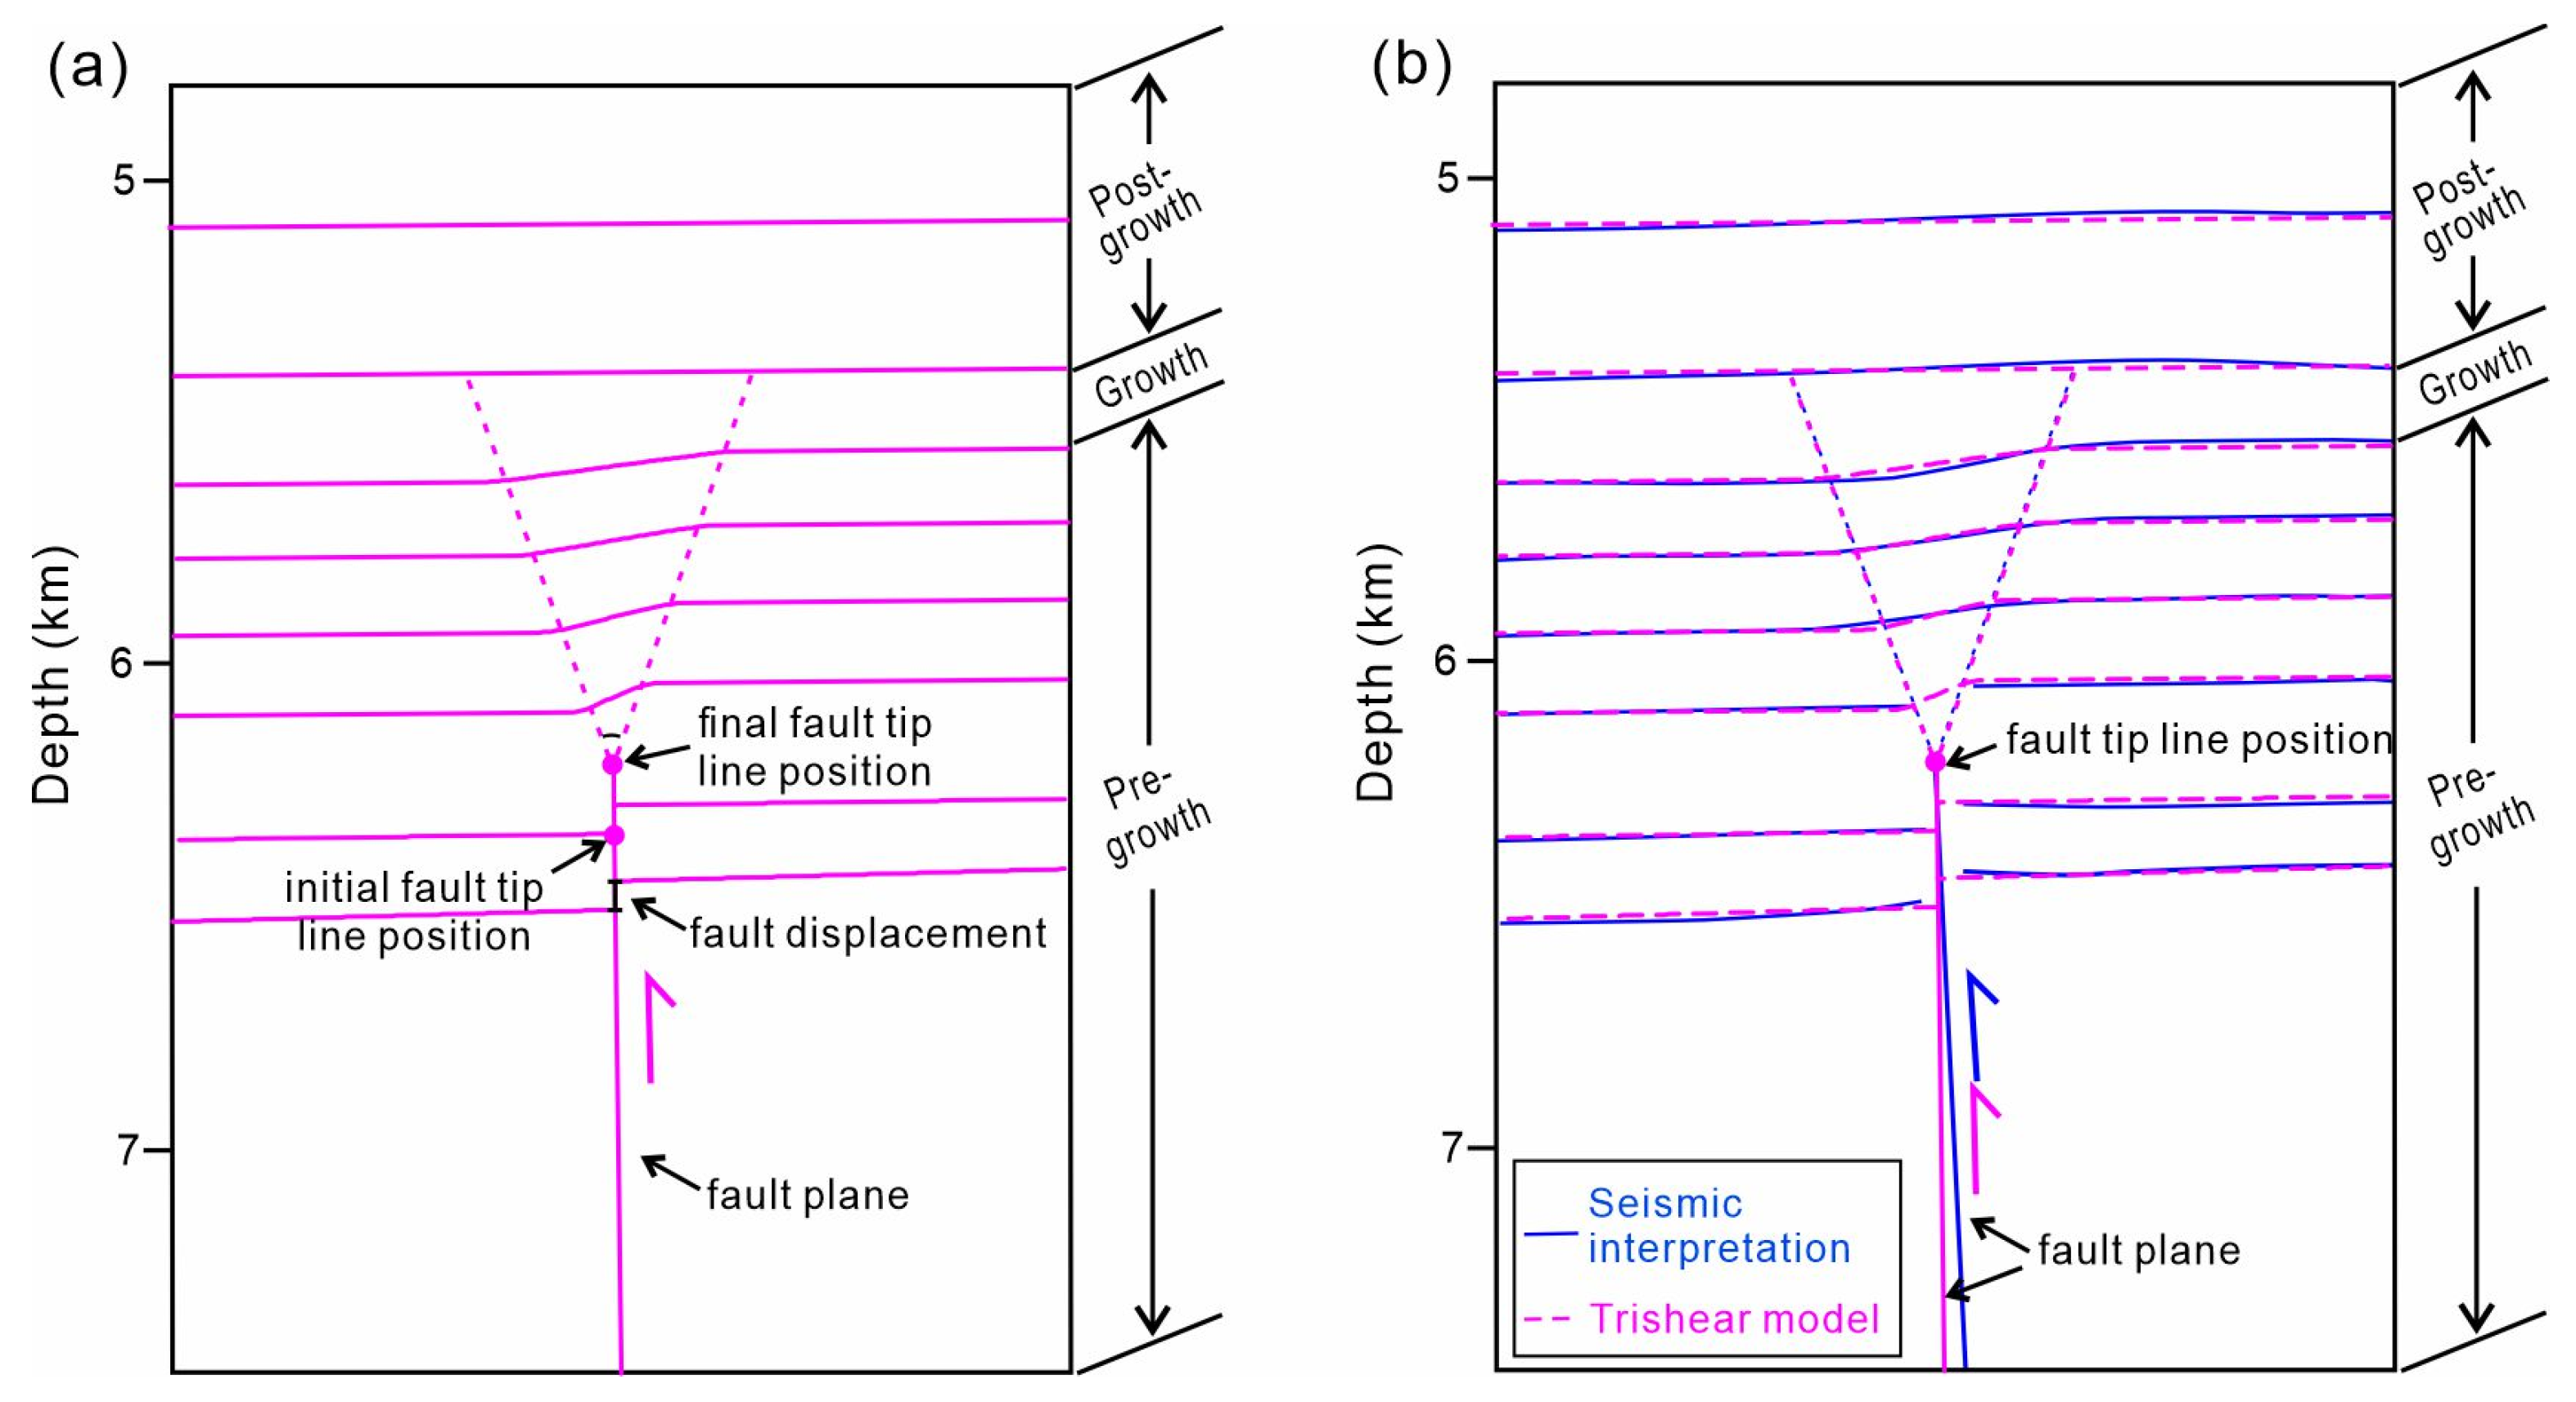
One seismic reflection profile that clearly imaged the igneous sills and structure of the surrounding rocks was selected as a case study. Seismic interpretation of the host rock and the igneous sills in the central part of the Tarim Basin generally follows earlier published works [18,22,30]. Diagnostic seismic facies of sills in the sedimentary basin include high amplitude, abrupt termination, and distinctive geometry [17,22]. The seismic interpretation was also confirmed by drilling holes such as the Adong 1 well. Since the seismic profile in the vertical direction is on a time scale, time-depth conversion is needed to obtain a realistic cross-section of the sill and the peripheral faults. The velocity of the strata in the time-depth conversion is expressed as 0.5t + 1.98 km/s, where t is the two-way travel time in seconds (s), according to the Adong 1 well.
According to seismic reflection characterization and geological evolution, the host rock surrounding the sills is divided into eight structural units (Figure 3), including Triassic strata (T), Upper Permian strata (P3), Middle Permian strata (P2), Lower Permian strata (P1), Upper Devonian to Carboniferous strata (D3-C), Silurian to Middle Devonian strata (S-D1–2), Upper Ordovician strata (O3), and Upper Cambrian to Middle Devonian strata (Є-O1–2). The seismic profile shows that the host layers are generally flat and dip slightly northwestward at <1° (Figure 3a).
Sill 1 (sill 13 in [18]) is a typical saucer-shaped sill consisting of a flat inner sill, inclined sheets, and flat outer sills. Seismic discontinuities and breaks can be clearly observed within the Silurian to Carboniferous strata close to sill 1 terminations (Figure 3a). As the strata across these discontinuities shift, these breaks can be interpreted as the cutoff points for a fault (Figure 3b).
The faults link closely to the termination of the sill and have a near-vertical dip angle. The strata bound by the fault over sill 1 were uplifted. Based on the spatial relationship between the uplift and the sill, it can be concluded that the uplift was induced by the emplacement of the underlying sill 1. Fault displacement diminished within the Upper Devonian and Carboniferous strata and was consumed by fault-propagation folding of the overlying strata. The seismic interpretation also shows that the structural relief of the uplift over the mafic sill gradually vanished within the Middle Permian strata. The stratigraphic layers thinning toward the uplift area are outlined and defined as growth strata (Figure 3b) as these layers are deposited synchronously with the uplifting of preexisting strata, i.e., the growth of peripheral faults. The stratigraphic units above this section are defined as post-growth strata, whereas the layers below this section are the pre-growth strata. It can also be concluded that the actual emplacement depth of the mafic sills is the current depth minus the thickness of the Middle Permian and overlying strata, which is 2–3 km.

4. Kinematic Model

4.1. Model Concept and Setup

Since seismic interpretation cannot accurately constrain the dip of the peripheral fault, kinematic modeling was performed to better determine the fault′s dip angle. Kinematic models establish a relationship between fold geometry, fault shape, and displacement. They offer a systematic framework for constructing the evolution of geological structures that fits the law of conservation of volume [31]. Trishear is a kinematic model for fault propagation folds, an alternative to the parallel kink model. It resembles both the geometry and the finite strain field of fault propagation folds. Trishear, similar to other kinematic models, relies solely on idealized velocity distributions, but it has proven mechanically reasonable in most cases [32]. Therefore, it is a powerful tool for reproducing the geometry of fault propagation folds, predicting the distribution and orientation of fractures within the folds, and estimating the nucleation point of underlying blind thrusts [32].
In trishear, folds develop progressively in a triangular zone of distributed deformation that opens away from the propagating fault tip (Figure 4). At the top of the trishear zone, slip vectors are equal to that of the hanging wall. They are parallel and equal in magnitude to the main fault. At the base of the trishear zone, the footwall is fixed, and the slip is zero. The movement of rock material within the triangular zone ensures the preservation of the cross-sectional area during deformation. To conserve the area, the triangular zone must be symmetrical with respect to the fault [33]. The propagation of the fault tip and migration of the triangular zone through the rock material is explicitly specified in the model by the P/S ratio, which represents the ratio of fault propagation to fault slip.
There are six parameters in trishear kinematic models including the ramp angle, trishear apical angle, displacement, P/S ratio, and X and Y positions of the fault tip line (Figure 4) [33]. In the study area, the trishear apical angle and final X and Y positions of the fault tip line can be generally constrained by the seismic interpretation. Therefore, the model aims to obtain the displacement, ramp angle, and P/S ratio of the peripheral fault. Based on these parameters, the kinematic modeling of the fault can be built.
The left (northwestern) limb of sill 1 in Figure 3a is selected for the mode as the fault and the deformation of the host rock are clearly imaged. The result of seismic interpretation after time–depth conversion is shown in Figure 5a. The fault displacement measured at the disconformity between the Middle and Upper Devonian strata is about 52 m (Figure 5a). According to the deformation of the strata above the fault, the trishear zone bounded by deformation axes is outlined (Figure 5a). The apical angle of the trishear zone is about 40°, and the tipline position is also constrained (Table 1). Based on these results, the initial model for the trishear kinematic is built (Figure 5b). Note that the initial X and Y positions of the fault tip line in Figure 5b are derived from the final trishear kinematic model.

4.2. Results of Kinematic Model
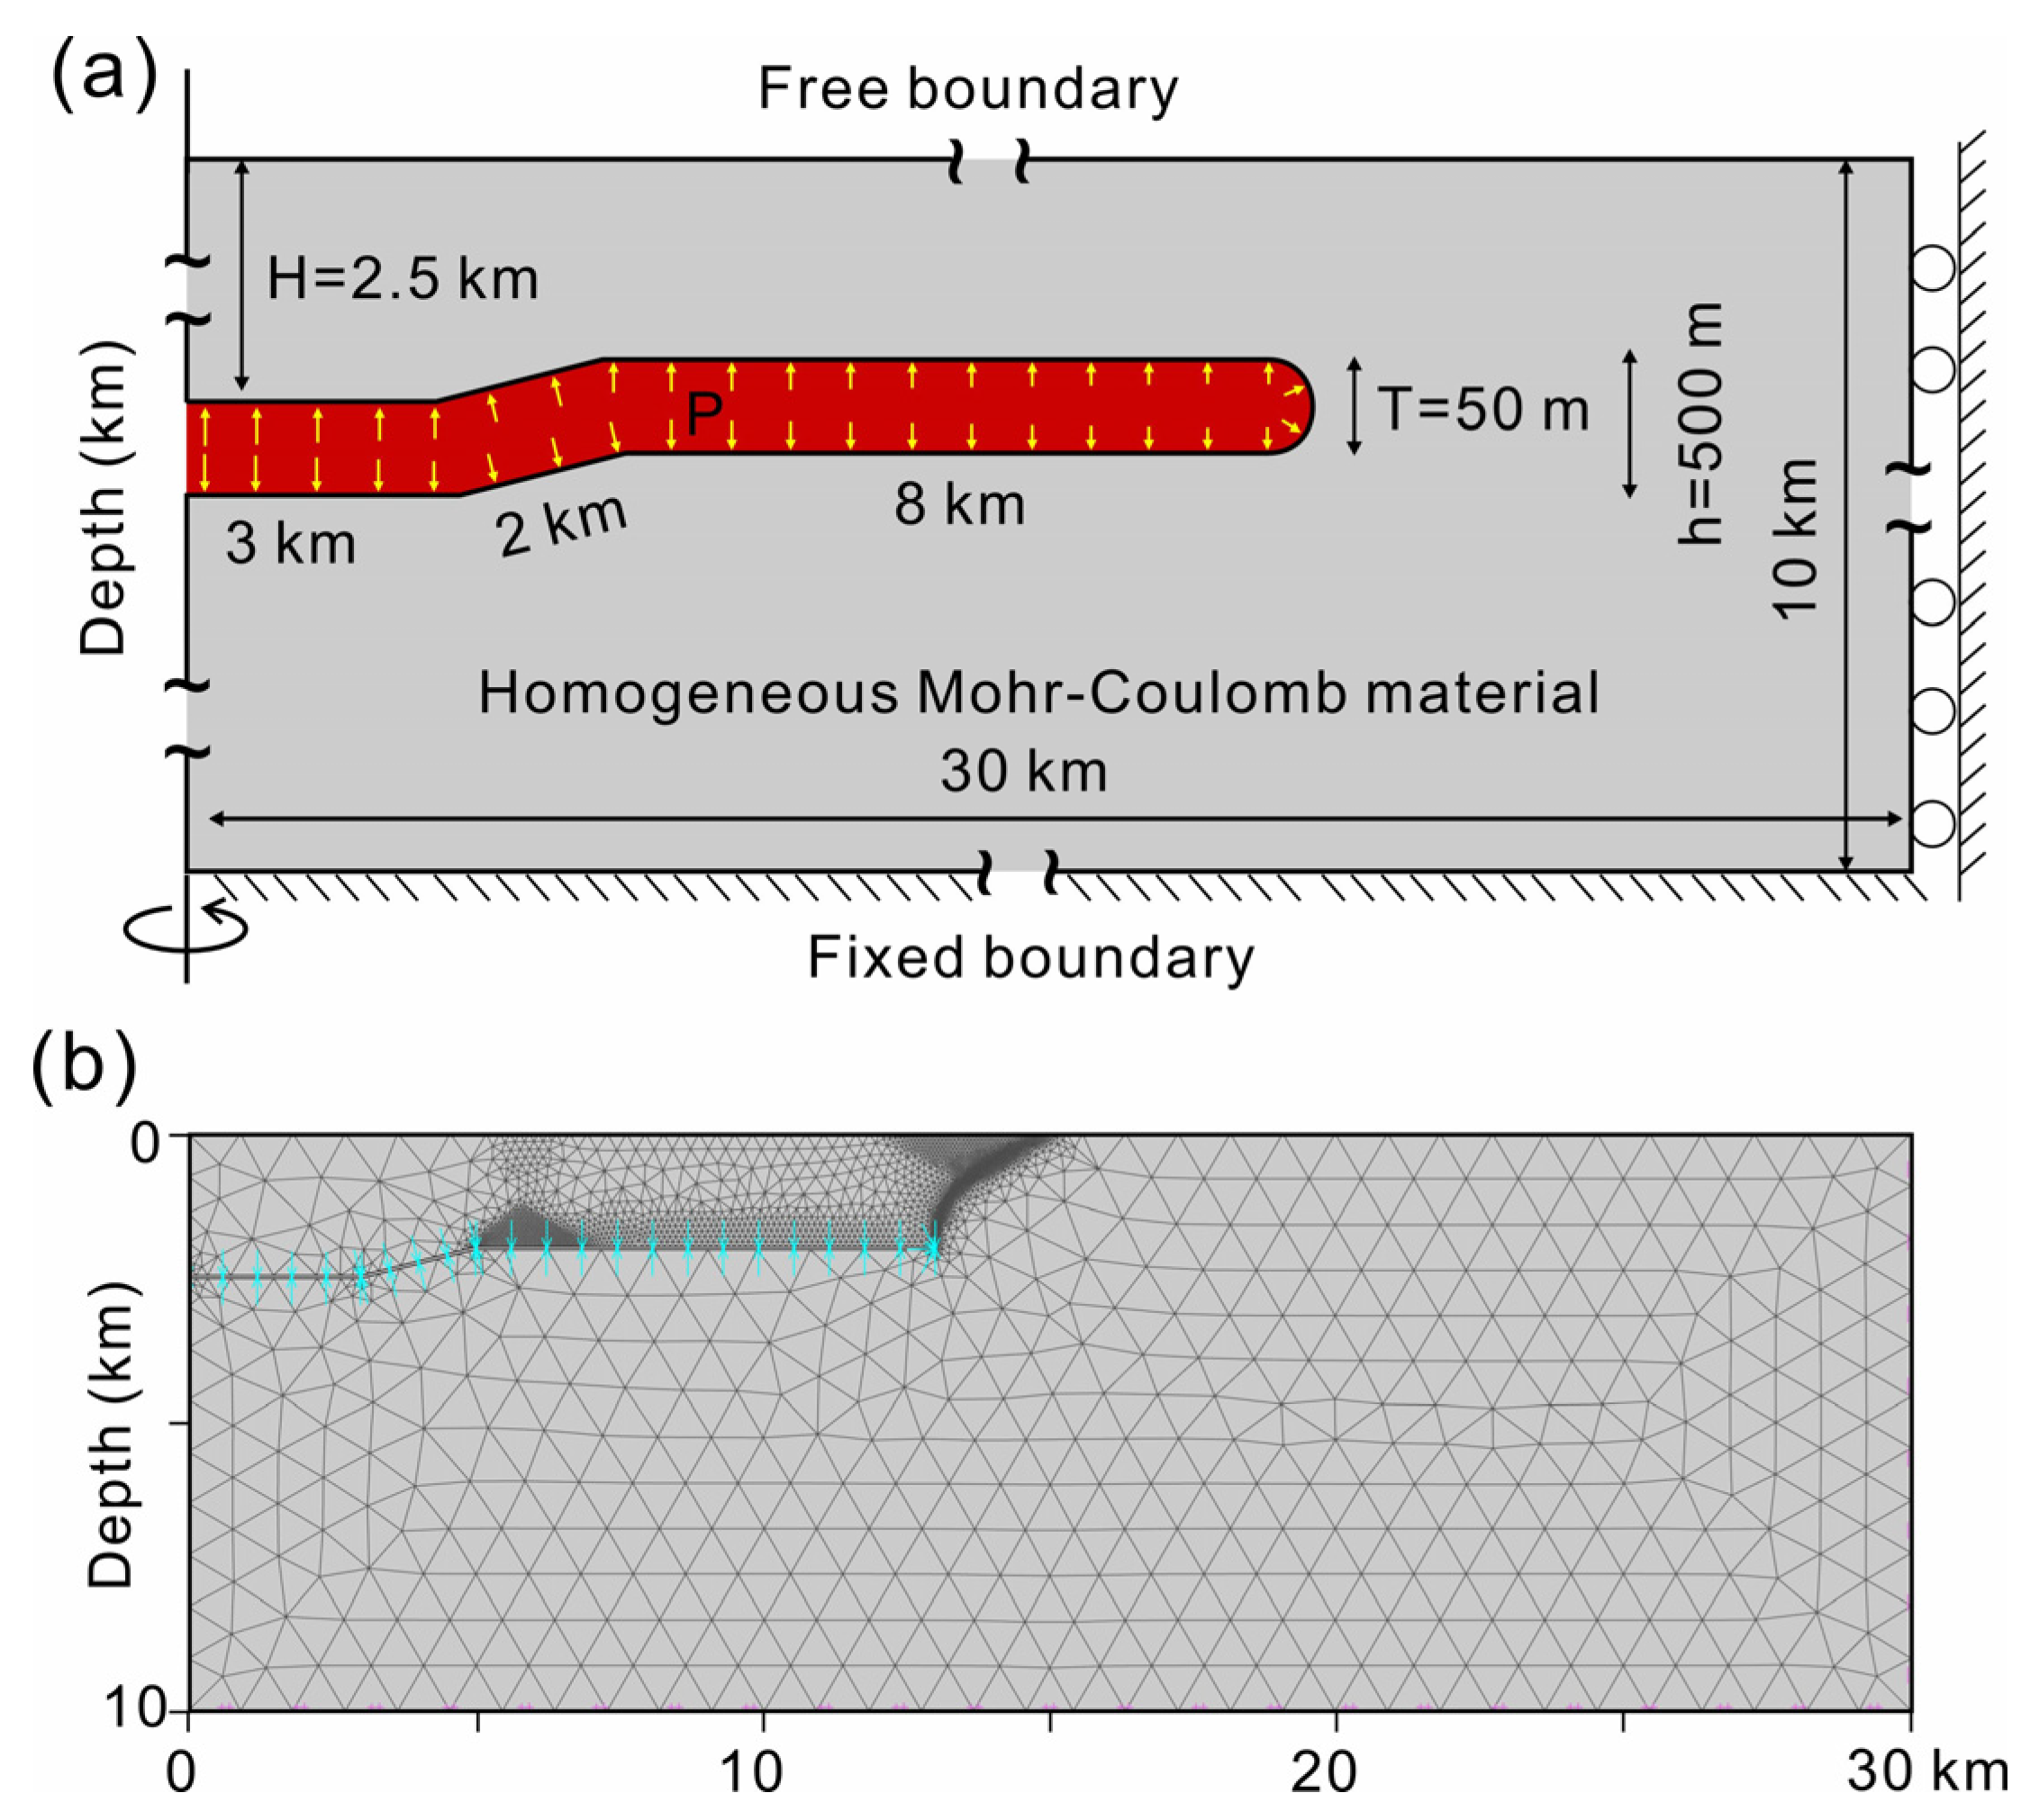
Given the fault displacement, trishear zone, and final tipline position, the author manually searched for the best trishear model that fitted the seismic interpretation results. The results of the trishear kinematic model are shown in Figure 6a and Table 1. The P/S ratio in the model is 2.5. The results are also compared to the seismic interpretation (Figure 6b), indicating that the kinematic model fits the seismic interpretation well. In other words, the deformation of the host rock over the mafic sill can be explained by the mechanism of trishear fault–propagation folding.
However, the kinematic results show that the fault displacement at the disconformity between the Middle and Upper Devonian strata is about 58 m, which is slightly larger than the seismic interpretation (52 m). The dip angle of the fault in the trishear model is vertical, whereas the seismic interpretation suggests an inward dip value of 88° (Table 1). This result may be due to artificial errors in seismic interpretation and seismic data processing. In addition, the kinematic model also determines where the fault tip line was when the trishear fold began to form.

5. Limit Analysis

5.1. Model Concept and Setup

To test the mechanical validity of the interpreted peripheral faults, the static mechanical stability of the brittle host rock of a sill was analyzed by finite element limit analysis [10,34]. The software used in this study was Optum G2 2021. The principle of limit analysis is to predict approximate values of loads that bring a brittle solid to an imminent state of failure [35]. The limit analysis is based on two theorems: the lower and upper bound theorems, also called collapse load theorems. The actual critical load leading to the failure of a brittle solid is between the loads calculated from the lower bound and upper bound theorems. If the range between load estimates calculated from the lower and upper bounds is small enough, the actual critical load that leads to failure can be well constrained. The energy dissipation map of shear stress calculated through limit analysis can also imply the location of failure [9].
Limit analysis has been successfully used to predict fracture zones at the tips of flat concordant sills [3,9,10]. In this study, a saucer-shaped sill comparable to the northwestern limb of sill 1 was modeled because the sill and faulting of the host rock were well imaged, along with the strata, and the sill was well constrained by the Adong 1 well. In the model setup, the sill is represented by a pressurized cavity according to the geometry of the sills in the study area. It is characterized by a well-developed flat outer sill with a relatively small inclined sheet (Figure 7a). In the limit analysis model, the thickness (T) is constant at 50 m, the inner sill intrudes at a depth (H) of 2.5 km, and the dip angle of the inclined sheet is about 14° (arctan 0.25). The sill was simulated to have a constant pressure (Figure 7a). The magma flow and magma density were not considered.
The host rock may be highly heterogeneous as it is layered and consists primarily of mudstone, siltstone, and sandstone, ranging in age from the Upper Ordovician to the Lower Permian. It can be concluded that the host rocks are well consolidated during sill emplacement in the Middle Permian age and are of relatively high competence. For the sake of simplicity, the model neglected the layering of the host rock and simplified it as an isotropic Mohr–Coulomb material. Currently, detailed physical and mechanical properties of the uplifted host rock in the Tarim Basin are still lacking. Based on published works, the model sets the host rock to a density (ρ) of 2.5 × 10³ kg/m3, a cohesion of (C) 20 MPa, an internal friction angle (φ) of 30°, Young′s modulus (E) of 20 GPa, and a Poisson′s ratio (ν) of 0.25 (Table 2) [10,36]. Note that this study primarily focuses on the geometry of shear zones at the tip of a mafic sill. Previous studies showed that the shape of the damage zone is not sensitive to the density, Young′s modulus, or Poisson′s ratio of the host rock [9]. Limit analysis tests performed here show that the cohesion of the host rock only slightly affects the shape of the shear zone (see Supplementary Figure S1). The internal friction angle is derived from earlier works that accurately predicted the dip angle of failure [9,10].
The entire system is axisymmetric about the y axis. In the model setup, the upper boundary was set as a free surface, allowing for a vertical slip at the right boundary but no slip at the lower boundary. The left boundary condition is axial symmetry. The entire numerical domain (i.e., the right half) is 30 km wide and 10 km deep, within which the effect of boundary conditions is negligible. The system was calculated using an adaptive grid with approximately 5000 elements (Figure 7b).

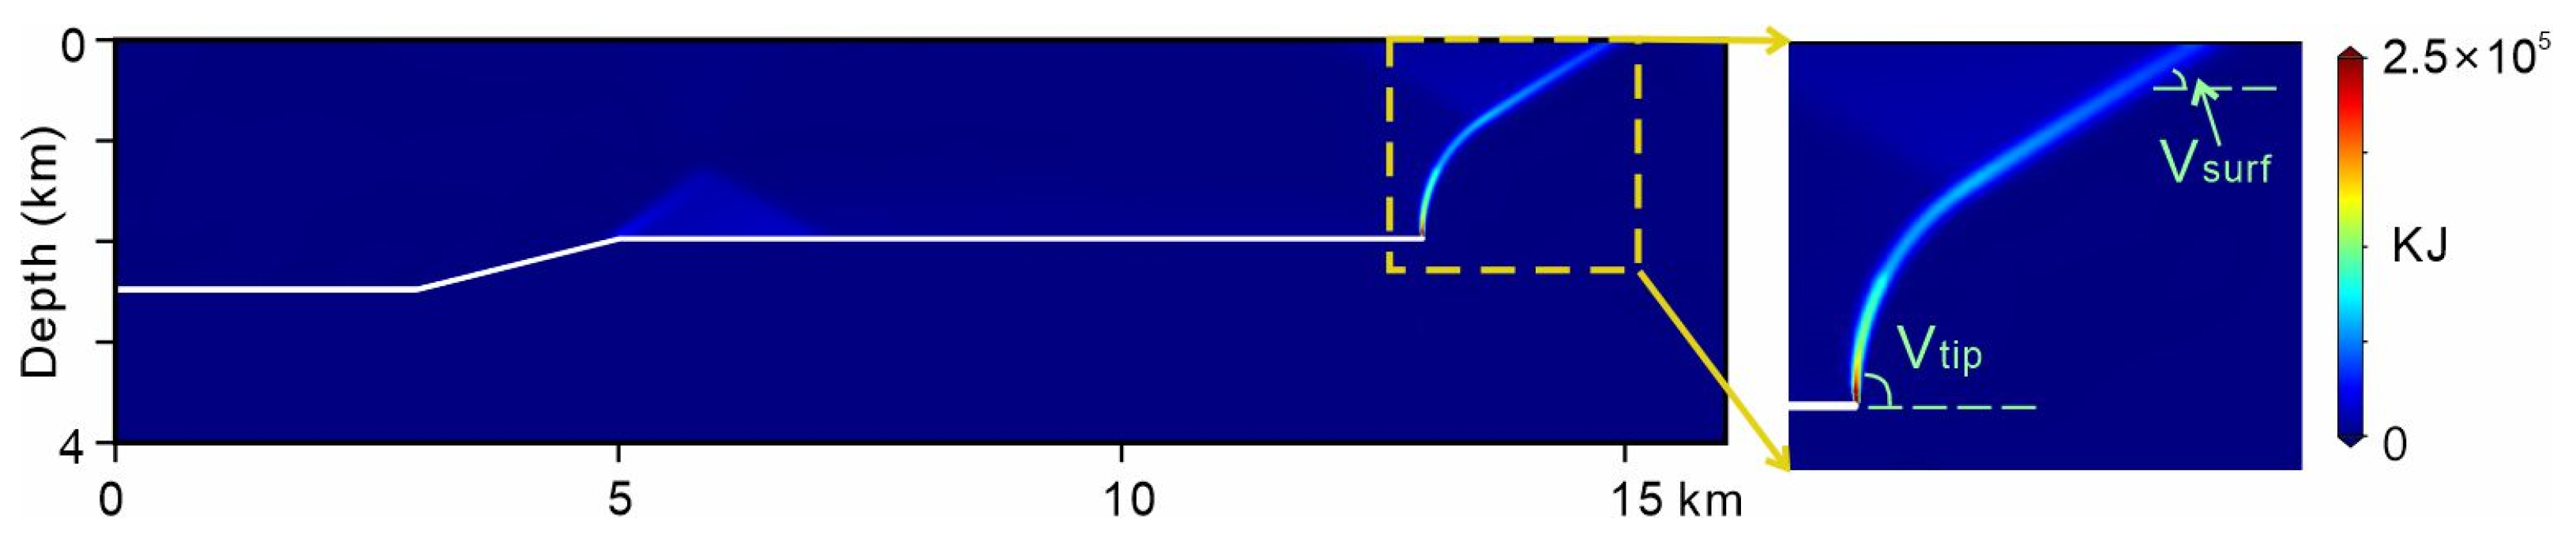
5.2. Results of Limit Analysis

The results indicate that shear failures occur when the pressures of the cavities (sills) reach 56.2 Mpa. The shear zone localizes in inclined zones at the sill tip (Figure 8). The inclined zones are subvertical at the sill tip and curve outward toward the surface. The dip angle at the sill tip, Vtip, is about 90°, and the value at the surface, Vsurf, is about 30°. The energy of shear dissipation decreases rapidly upward from the sill tip. It can be concluded that failure would first occur at the sill tip, which has a dip angle close to 90°. Therefore, the dip angles of the predicted damage zones at the sill tips are consistent with predictions from kinematic modeling and seismic interpretation.

6. Discussion

6.1. The Kinematics of Peripheral Faults

As mentioned above, faulting at the termination of the mafic sill was previously reported at the Calderas of Sierra Negra and Alcedo volcanoes (Galápagos Islands). In these places, the growth of mafic sills is accommodated by faulting at the sill tip [37]. This mechanism, known as trapdoor faulting, is regarded as an end-member type of mafic volcano unrest. Recent studies show that a similar mechanism also occurs at Sumisu Caldera, Izu–Bonin Arc [38].
As mafic sills commonly have a large aspect ratio, the deformation of the overburden is often ascribed to elastic bending. Some authors suggest that peripheral faults at the sill tips at the Calderas of Sierra Negra volcano and Alcedo volcano are reactivating older caldera faults with opposite motion during the uplift or resurgence [36]. The trishear model in this study successfully simulated the geometry and kinematics of peripheral faults and associated uplift, supporting the idea that faults can be purely reverse faults. The kinematic model, consistent with limit analysis, suggests that the dip angle of the fault is 90°, indicating that the fault forms due to the vertical uplift caused by sill inflation.

6.2. The Dip Angle of Peripheral Faults

At the Calderas of Sierra Negra and Alcedo volcanoes, the geometry of the fault is derived from forward modeling of the surface deformation. The results demonstrated that peripheral faults have subvertical angles. However, the detailed results remain unclear and, in some cases, controversial. For example, at the caldera of Sierra Negra, field observations and InSAR data from the 1997–1998 trapdoor faulting event indicate that the trapdoor faults are mainly south-dipping normal faults [13]. Conversely, GPS and InSAR data from the 2005 faulting event suggest that the faults are north-dipping reverse faults [37].
In this study, seismic interpretation, kinematic modeling, and limit analysis were used to constrain the geometry of the peripheral faults. The seismic interpretation shows that the emplacement of saucer-shaped mafic sills can induce peripheral faulting and that the fault is subvertical. The dip angle of the fault is not accurately constrained by the seismic profile, perhaps due to the seismic resolution. The results of limit analysis and kinematic models are fairly consistent, both indicating that the fault has a dip angle of 90°. The results are also similar to the seismic observations. Therefore, it is suggested that the real dip angle of the peripheral fault is 90°. It can also be concluded that kinematic models and limit analysis are effective methods for studying the geometry of peripheral faults.

6.3. The Reliability of the Trihear Model and Limit Analysis

It should be noted that this study involves only one case. The geometry (such as diameter, inclination), thickness, and depth of the sill, as well as the mechanical properties of the host rock (such as cohesion, density, and internal friction angle), are fixed. However, these parameters can vary in different cases. Previous studies show that sills in the central Tarim Basin range from saucer-shaped and strata-concordant to hybrid geometries [22].
As mentioned above, in this case, the predicted shear zone by limit analysis is not sensitive to the mechanical properties of the host rock. However, this may not be true in other cases. Previous studies showed that for tabular sills, the diameter and depth of the sill, as well as the cohesion and internal friction angle of the host rock, can significantly influence the shape of the failure zone at the sill tip [3,9,10]. Therefore, the results suggesting a 90° dip angle for the peripheral fault may only account for sill 1, which is saucer-shaped and emplaced in a depth of ~2.5 km. The value may not be right in other cases.
A systematic test of kinetic modeling and limit analysis may provide robust reliability for these approaches based on a wide range of sills in the study area. This test can also provide more general insights into the structure of peripheral faults and how sill geometry, depth, and mechanical properties of the host rock control the fault geometry, similar to flat sills [3,9,10]. It should be noted that there are large differences between this study and previous works that used the limit analysis on the damage zone at the sill tips [3,9,10]. The damage zones in these previous works were used for inclined sheets of saucer-shaped sills. This study focuses on faulting at the tips of a saucer-shaped sill.
It is possible that both inward dipping reverse faults and outward can occur at the sill tips, as observed from the Black Mesa and Trachyte Mesa intrusions in Henry Mountains, Utah, United States [4,39,40]. However, it should be noted that the intrusions in these areas mainly consist of diorites. The structural relief of the associated uplifts often comprises several hundred meters, which is much larger than those in this study at tens of meters.

7. Conclusions

This study conducted trishear kinematic modeling and limit analysis to accurately constrain the dip angle of peripheral faults at the tips of mafic saucer-shaped sills and better understand the origin of these faults. This case study was based on a saucer-shaped sill and its associated peripheral faults imaged in seismic reflection profiles. The main conclusions of the case study are the following:
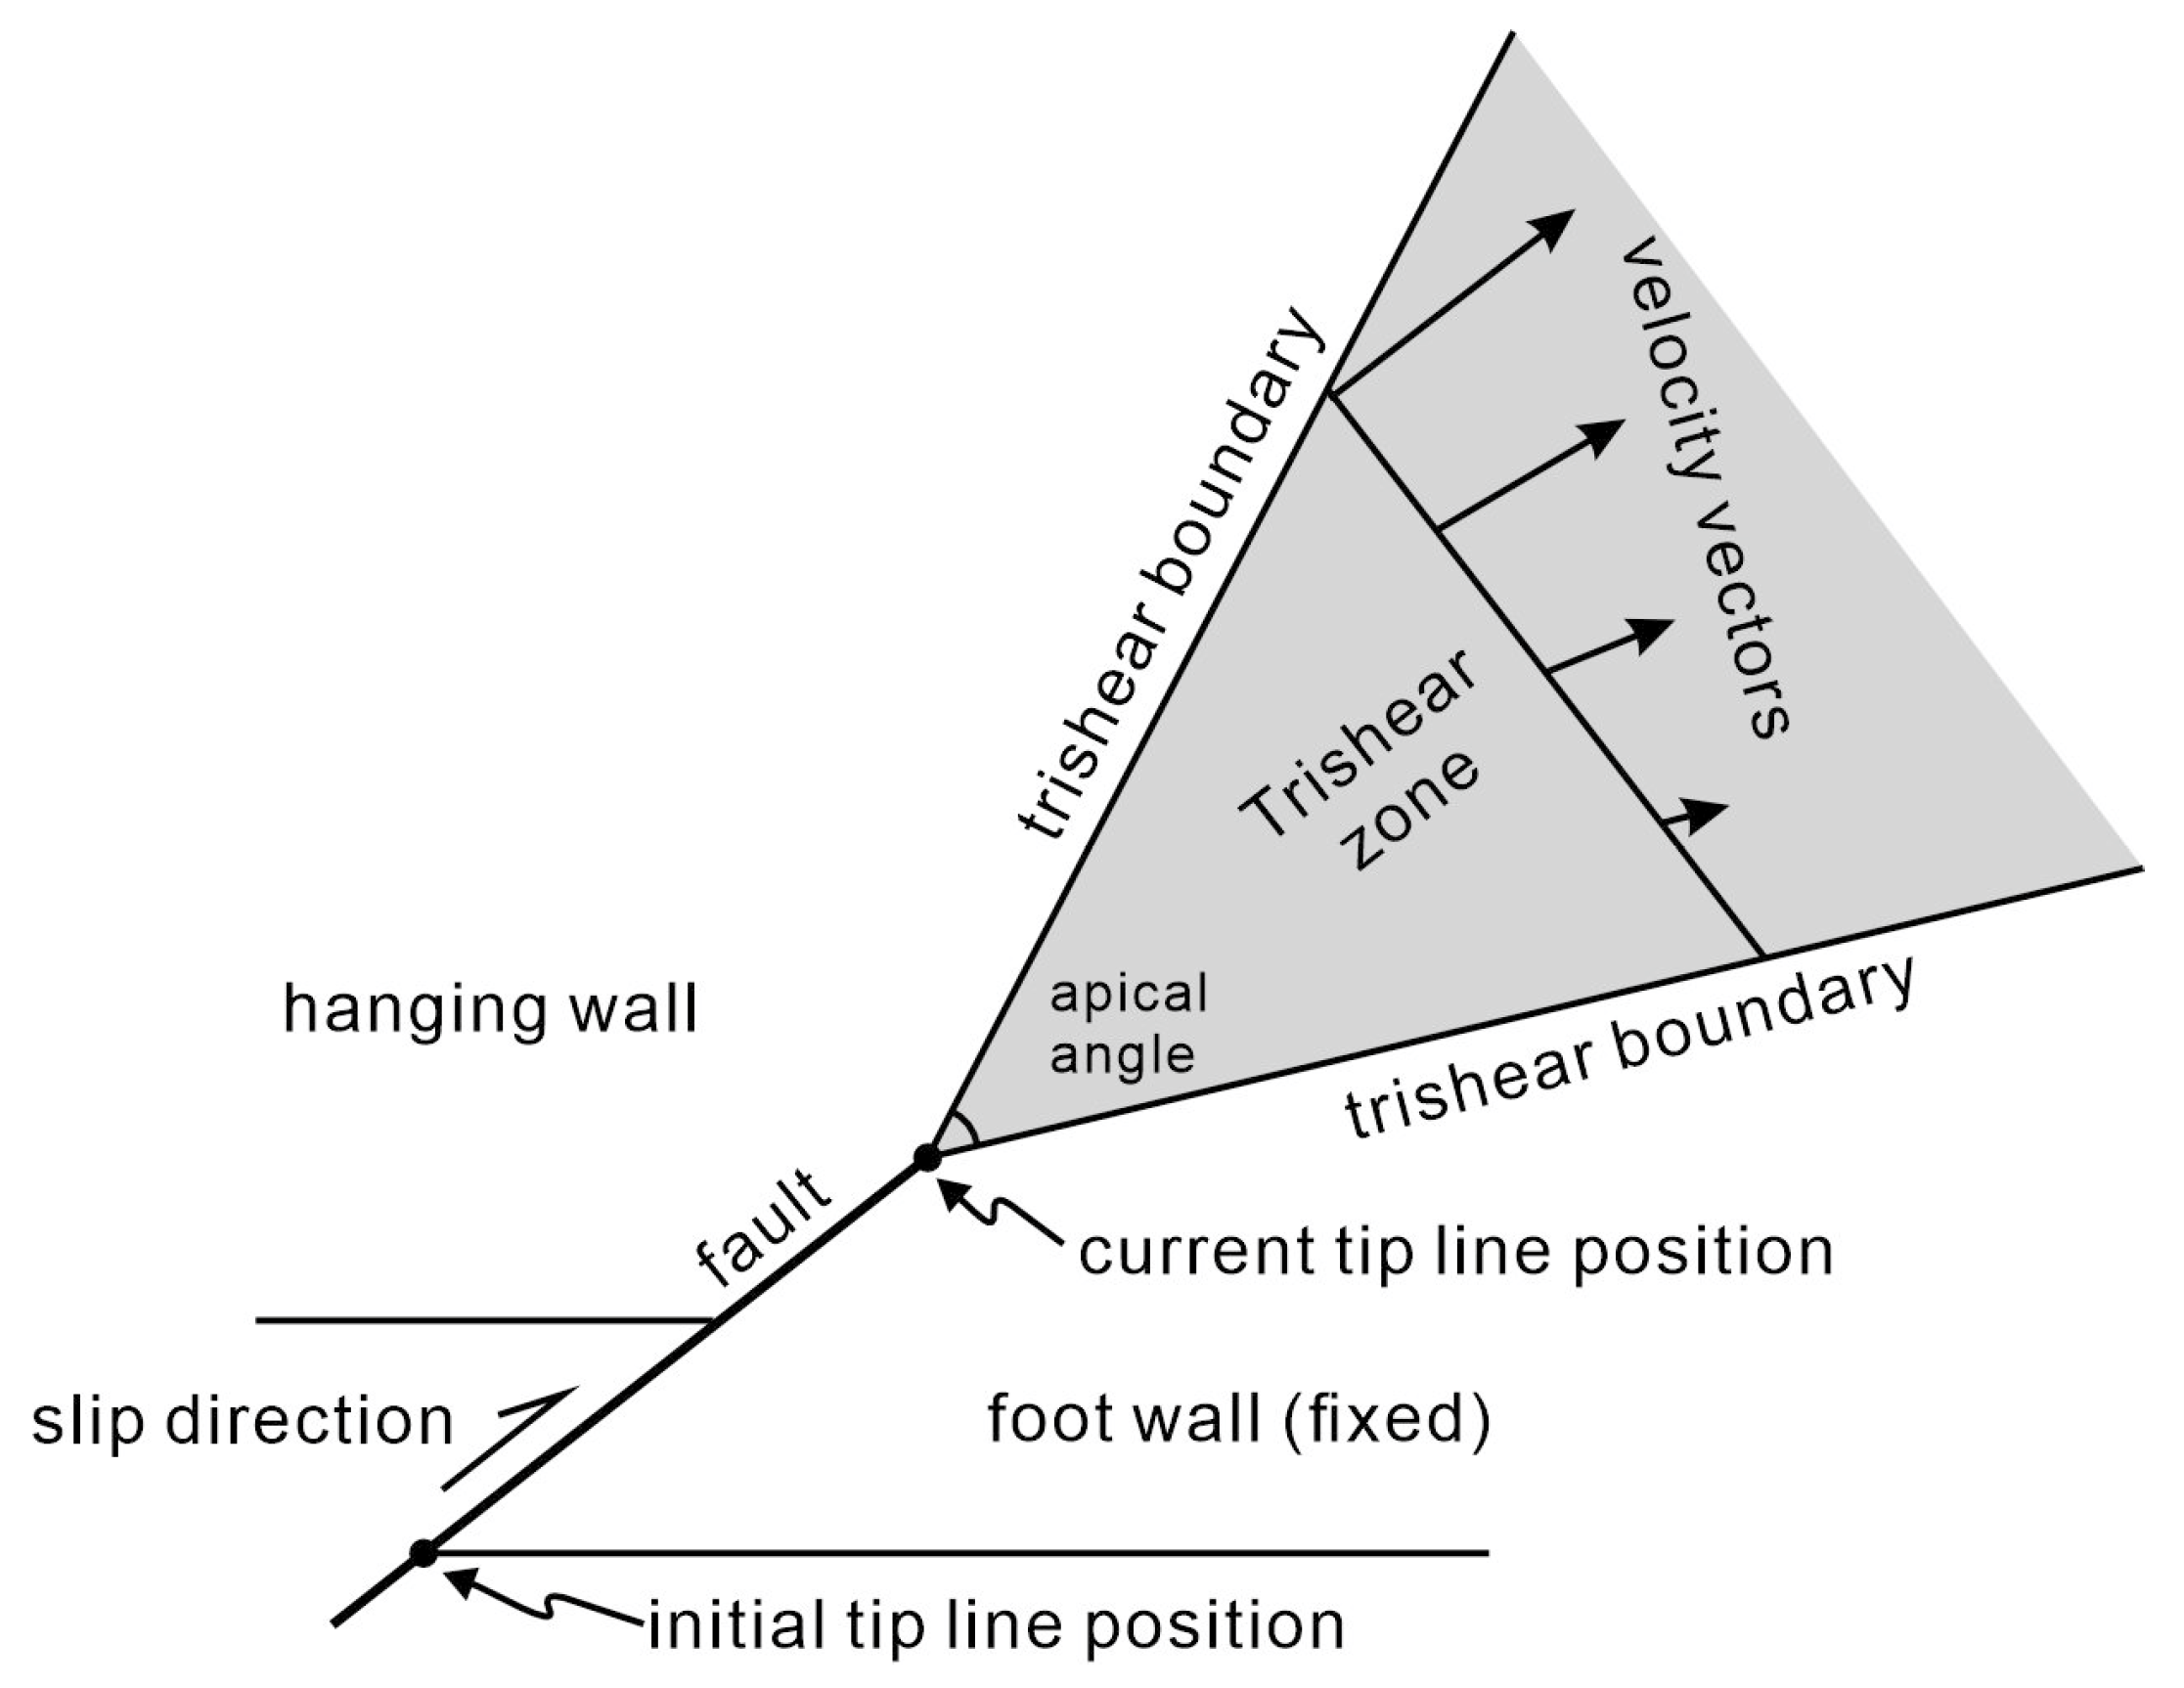
  • The trishear kinematic model successfully reproduces the geometry of peripheral faults at the sill tip and associated folds by performing a fault displacement of 58 m on a vertical fault plane with a P/S ratio of 2.5, where the fault displacement is slightly larger than the value derived from seismic interpretation;
  • The seismic interpretation shows that the dip angle of the fault in the case study is 88° inward dipping. However, both the trishear kinematic model and limit analysis suggest a value of 90°. The latter is believed to better represent the actual value;
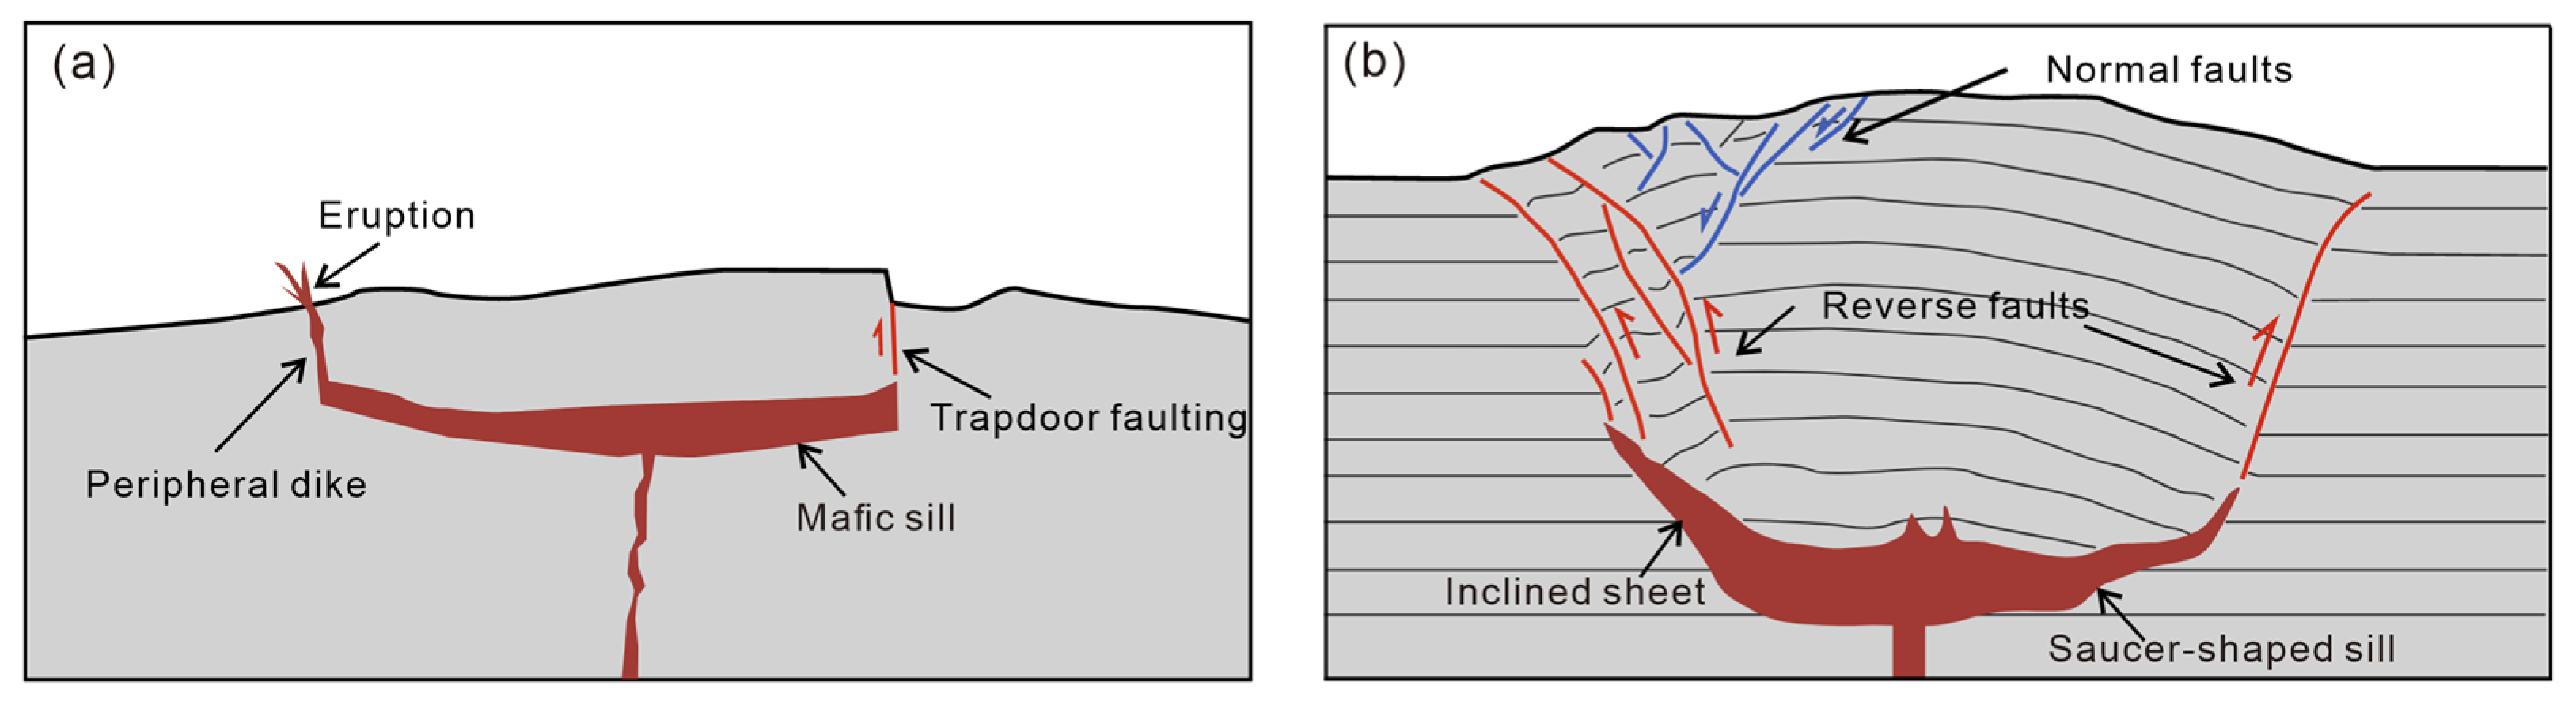
  • In contrast to the classical model where the host rock deformation above mafic sills is dominated by elastic bending, the results support that peripheral faulting and associated uplifting can occur at the tips of the mafic sill as a result of sill inflation;
  • Trishear kinematic modeling and limit analysis are effective methods for studying the geometry and mechanical properties of peripheral faults at the sill tips, respectively.

Supplementary Materials

The following supporting information can be downloaded at: https://www.mdpi.com/article/10.3390/app14198621/s1, Figure S1: Cross-section maps of damage zone with varying values of C.

Funding

This research was supported by the National Natural Science Foundation of China (Grant 41906053).

Institutional Review Board Statement

Not applicable.

Informed Consent Statement

Not applicable.

Data Availability Statement

The data that support the findings of this study are available on request from the corresponding author upon reasonable request.

Acknowledgments

The author acknowledges Optum CE for their academic permission to use OptumG2 in this study. Data mapping is supported by the software Generic Mapping Tools (GMT) [41]. The anonymous reviewers are also thanked for their valuable comments and suggestions, which greatly improved the quality of this manuscript.

Conflicts of Interest

The author declares no conflicts of interest.

References

  1. Sigmundsson, F.; Parks, M.; Pedersen, R.; Jónsdóttir, K.; Ófeigsson, B.G.; Grapenthin, R.; Dumont, S.; Einarsson, P.; Drouin, V.; Heimisson, E.R.; et al. Chapter 11—Magma Movements in Volcanic Plumbing Systems and their Associated Ground Deformation and Seismic Patterns. In Volcanic and Igneous Plumbing Systems; Burchardt, S., Ed.; Elsevier: Amsterdam, The Netherlands, 2018; pp. 285–322. [Google Scholar]
  2. Holt, S.J.; Holford, S.P.; Foden, J. New insights into the magmatic plumbing system of the South Australian Quaternary Basalt province from 3D seismic and geochemical data. Aust. J. Earth Sci. 2013, 60, 797–817. [Google Scholar] [CrossRef]
  3. Schmiedel, T.; Galland, O.; Haug, Ø.T.; Dumazer, G.; Breitkreuz, C. Coulomb failure of Earth’s brittle crust controls growth, emplacement and shapes of igneous sills, saucer-shaped sills and laccoliths. Earth Planet. Sci. Lett. 2019, 510, 161–172. [Google Scholar] [CrossRef]
  4. Pollard, D.D.; Johnson, A.M. Mechanics of growth of some laccolithic intrusions in the Henry mountains, Utah, II: Bending and failure of overburden layers and sill formation. Tectonophysics 1973, 18, 311–354. [Google Scholar] [CrossRef]
  5. Bunger, A.P.; Cruden, A.R. Modeling the growth of laccoliths and large mafic sills: Role of magma body forces. J. Geophys. Res. 2011, 116, 1–18. [Google Scholar] [CrossRef]
  6. Francis, E.H. Magma and sediment-I Emplacement mechanism of late Carboniferous tholeiite sills in northern Britain. J. Geol. Soc. London 1982, 139, 1–20. [Google Scholar] [CrossRef]
  7. Malthe-Sørenssen, A.; Planke, S.; Svensen, H.; Jamtveit, B. Formation of Saucer-Shaped Sills. In Physical Geology of High-Level Magmatic Systems; Breitkreuz, C., Petford, N., Eds.; Geological Society of London Special Publication: London, UK, 2004; pp. 215–227. [Google Scholar]
  8. Hansen, D.M.; Cartwright, J. The three-dimensional geometry and growth of forced folds above saucer-shaped igneous sills. J. Struct. Geol. 2006, 28, 1520–1535. [Google Scholar] [CrossRef]
  9. Haug, Ø.T.; Galland, O.; Souloumiac, P.; Souche, A.; Guldstrand, F.; Schmiedel, T.; Maillot, B. Shear Versus Tensile Failure Mechanisms Induced by Sill Intrusions: Implications for Emplacement of Conical and Saucer-Shaped Intrusions. J. Geophys. Res. Solid. Earth 2018, 123, 3430–3449. [Google Scholar] [CrossRef]
  10. Haug, Ø.T.; Galland, O.; Souloumiac, P.; Souche, A.; Guldstrand, F.; Schmiedel, T. Inelastic damage as a mechanical precursor for the emplacement of saucer-shaped intrusions. Geology 2017, 45, 1099–1102. [Google Scholar] [CrossRef]
  11. Galland, O.; Planke, S.; Neumann, E.; Malthe-Sørenssen, A. Experimental modelling of shallow magma emplacement: Application to saucer-shaped intrusions. Earth Planet. Sci. Lett. 2009, 277, 373–383. [Google Scholar] [CrossRef]
  12. Polteau, S.; Mazzini, A.; Galland, O.; Planke, S.; Malthe-Sørenssen, A. Saucer-shaped intrusions: Occurrences, emplacement and implications. Earth Planet. Sci. Lett. 2008, 266, 195–204. [Google Scholar] [CrossRef]
  13. Amelung, F.; Jonsson, S.; Zebker, H.; Segall, P. Widespread uplift and ‘trapdoor’ faulting on Galapagos volcanoes observed with radar interferometry. Nature 2000, 407, 993–996. [Google Scholar] [CrossRef] [PubMed]
  14. Jónsson, S.; Zebker, H.; Amelung, F. On trapdoor faulting at Sierra Negra volcano, Galápagos. J. Volcanol. Geotherm. Res. 2005, 144, 59–71. [Google Scholar] [CrossRef]
  15. Acocella, V.; Di Lorenzo, R.; Newhall, C.; Scandone, R. An overview of recent (1988 to 2014) caldera unrest: Knowledge and perspectives. Rev. Geophys. 2015, 53, 896–955. [Google Scholar] [CrossRef]
  16. Montanari, D.; Bonini, M.; Corti, G.; Agostini, A.; Del Ventisette, C. Forced folding above shallow magma intrusions: Insights on supercritical fluid flow from analogue modelling. J. Volcanol. Geotherm. Res. 2017, 345, 67–80. [Google Scholar] [CrossRef]
  17. Planke, S.; Rasmussen, T.; Rey, S.S.; Myklebust, R. Seismic Characteristics and Distribution of Volcanic Intrusions and Hydrothermal Vent Complexes in the Vøring and Møre Basins. In Petroleum Geology: North-West Europe and Global Perspectives, Proceedings of the 6th Petroleum Geology Conference, London, UK, 6–9 October 2003; Geological Society of London: London, UK, 2005. [Google Scholar]
  18. Yao, Z. Spatial and Temporal Distribution of Igneous Sills in the Central Tarim Basin and Their Geological Implications. Minerals 2024, 14, 862. [Google Scholar] [CrossRef]
  19. Zheng, Y.; Blackstone, L.; Segall, P. Constraints on Absolute Magma Chamber Volume from Geodetic Measurements of Trapdoor Faulting at Sierra Negra Volcano, Galapagos. Geophys. Res. Lett. 2022, 49, e2021GL095683. [Google Scholar] [CrossRef]
  20. Vasco, D.W. Invariance, groups, and non-uniqueness: The discrete case. Geophys. J. Int. 2007, 168, 473–490. [Google Scholar] [CrossRef]
  21. Galetto, F.; Bagnardi, M.; Acocella, V.; Hooper, A. Noneruptive Unrest at the Caldera of Alcedo Volcano (Galápagos Islands) Revealed by InSAR Data and Geodetic Modeling. J. Geophys. Res. Solid. Earth 2019, 124, 3365–3381. [Google Scholar] [CrossRef]
  22. Yao, Z.; He, G.; Li, C.; Dong, C. Sill geometry and emplacement controlled by a major disconformity in the Tarim Basin, China. Earth Planet. Sci. Lett. 2018, 501, 37–45. [Google Scholar] [CrossRef]
  23. Cong, F.; Tian, J.; Hao, F.; Wang, Q.; Liu, J.; Cao, Z. Differential petroleum charging controlled by movements of two strike-slip faults in the Shunbei area, Tarim Basin, northwestern China. Am. Assoc. Pet. Geol. Bull. 2024, 108, 877–906. [Google Scholar] [CrossRef]
  24. Kang, Y.Z.; Kang, Z.H. Tectonic evolution and oil and gas of Tarim basin. J. Southeast Asian Earth Sci. 1996, 13, 317–325. [Google Scholar]
  25. Lin, C.; Yang, H.; Liu, J.; Rui, Z.; Cai, Z.; Zhu, Y. Distribution and erosion of the Paleozoic tectonic unconformities in the Tarim Basin, Northwest China: Significance for the evolution of paleo-uplifts and tectonic geography during deformation. J. Asian Earth Sci. 2012, 46, 1–19. [Google Scholar] [CrossRef]
  26. Xu, Y.; Wei, X.; Luo, Z.; Liu, H.; Cao, J. The Early Permian Tarim Large Igneous Province: Main characteristics and a plume incubation model. Lithos 2014, 204, 20–35. [Google Scholar] [CrossRef]
  27. Yu, X.; Yang, S.; Chen, H.; Chen, Z.; Li, Z.; Batt, G.E.; Li, Y. Permian flood basalts from the Tarim Basin, Northwest China: SHRIMP zircon U–Pb dating and geochemical characteristics. Gondwana Res. 2011, 20, 485–497. [Google Scholar] [CrossRef]
  28. Li, Z.; Chen, H.; Song, B.; Li, Y.; Yang, S.; Yu, X. Temporal evolution of the Permian large igneous province in Tarim Basin in northwestern China. J. Asian Earth Sci. 2011, 42, 917–927. [Google Scholar] [CrossRef]
  29. Yang, S.; Chen, H.; Li, Z.; Li, Y.; Yu, X.; Li, D. Early Permian Tarim Large Igneous Province in northwest China. Sci. China Earth Sci. 2014, 44, 187–199, (In Chinese with English Abstract). [Google Scholar] [CrossRef]
  30. Tian, W.; Li, X.; Wang, L. Forced Fold Amplitude and Sill Thickness Constrained by Wireline and 3-D Seismic Data Suggest an Elastic Magma-Induced Deformation in Tarim Basin, NW China. Minerals 2021, 11, 293. [Google Scholar] [CrossRef]
  31. Erslev, E.A. Trishear fault-propagation folding. Geology 1991, 19, 617–620. [Google Scholar] [CrossRef]
  32. Cardozo, N.; Bhalla, K.; Zehnder, A.T.; Allmendinger, R.W. Mechanical models of fault propagation folds and comparison to the trishear kinematic model. J. Struct. Geol. 2003, 25, 1–18. [Google Scholar] [CrossRef]
  33. Allmendinger, R.W. Inverse and forward numerical modeling of trishear fault-propagation folds. Tectonics 1998, 17, 640–656. [Google Scholar] [CrossRef]
  34. Guldstrand, F.; Burchardt, S.; Hallot, E.; Galland, O. Dynamics of Surface Deformation Induced by Dikes and Cone Sheets in a Cohesive Coulomb Brittle Crust. J. Geophys. Res. Solid. Earth 2017, 122, 8511–8524. [Google Scholar] [CrossRef]
  35. Souloumiac, P.; Krabbenhøft, K.; Leroy, Y.M.; Maillot, B. Failure in accretionary wedges with the maximum strength theorem: Numerical algorithm and 2D validation. Comput. Geosci. 2010, 14, 793–811. [Google Scholar] [CrossRef]
  36. Schellart, W.P. Shear test results for cohesion and friction coefficients for different granular materials; scaling implications for their usage in analogue modelling. Tectonophysics 2000, 324, 1–16. [Google Scholar] [CrossRef]
  37. Jónsson, S. Stress interaction between magma accumulation and trapdoor faulting on Sierra Negra volcano, Galápagos. Tectonophysics 2009, 471, 36–44. [Google Scholar] [CrossRef]
  38. Sandanbata, O.; Watada, S.; Satake, K.; Kanamori, H.; Rivera, L.; Zhan, Z. Sub-Decadal Volcanic Tsunamis Due to Submarine Trapdoor Faulting at Sumisu Caldera in the Izu–Bonin Arc. J. Geophys. Res. Solid. Earth 2022, 127, e2022JB024213. [Google Scholar] [CrossRef]
  39. de Saint-Blanquat, M.; Habert, G.; Horsman, E.; Morgan, S.S.; Tikoff, B.; Launeau, P.; Gleizes, G. Mechanisms and duration of non-tectonically assisted magma emplacement in the upper crust: The Black Mesa pluton, Henry Mountains, Utah. Tectonophysics 2006, 428, 1–31. [Google Scholar] [CrossRef]
  40. Wilson, P.I.R.; McCaffrey, K.J.W.; Wilson, R.W.; Jarvis, I.; Holdsworth, R.E. Deformation structures associated with the Trachyte Mesa intrusion, Henry Mountains, Utah: Implications for sill and laccolith emplacement mechanisms. J. Struct. Geol. 2016, 87, 30–46. [Google Scholar] [CrossRef]
  41. Wessel, P.; Smith, W.H.F.; Scharroo, R.; Luis, J.; Wobbe, F. Generic Mapping Tools: Improved Version Released. Eos Trans. Am. Geophys. Union. 2013, 94, 409–410. [Google Scholar] [CrossRef]
Figure 1. (a) Schematic diagram showing the uplifting and trapdoor faulting of the host rock above a mafic sill at Sierra Negra [14]. (b) Schematic sketch from an analog experiment illustrating the geometry of the saucer-shaped intrusion (simulated by vegetable polyglycerin) and host rock deformation (simulated by sand) [16].
Applsci 14 08621 g001
Figure 2. Location and structural units of the Tarim Basin after [18]. Bathymetric data of the inlet and the Tarim Basin are derived from GEBCO.
Applsci 14 08621 g002
Figure 3. (a) Semi-interpreted and (b) interpreted seismic profiles showing sill intrusions and peripheral faults in the central part of the Tarim Basin (for location, see Figure 2) after [18,22]. T, P3, P2, P1, D3-C, S-D1–2, O3, Є-O1–2 are the strata symbols of structural units. T—Triassic strata; P3—Upper Permian strata; P2—Middle Permian strata; P1—Lower Permian strata; D3-C—Upper Devonian to Carboniferous strata; S-D1–2—Silurian to Middle Devonian strata; O3—Upper Ordovician strata; Є-O1–2—Upper Cambrian to Middle Devonian strata. The seismic profile in the yellow box is used for time–depth conversion. The growth strata depicted here represent the strata deposited during the uplift. Pre-growth strata and post-growth strata refer to the layers formed before and after this stage, respectively (see text for details).
Applsci 14 08621 g003
Figure 4. Basic geometry of the trishear kinematic model redrawn from [32]. Velocity vectors within the hanging wall, shear zone, and sectors of equal velocity vector are illustrated schematically.
Applsci 14 08621 g004
Figure 5. (a) Structural pattern of the peripheral fault derived from seismic interpretation after time–depth conversion. Solid lines with color are the boundaries of the structural units and black concordant dashed lines are internal bedding planes. T, P3, P2, P1, D3-C, S-D1–2 are strata symbols of structural units (see text or Figure 3 for details). (b) Initial trishear kinematic model of the peripheral fault based on seismic interpretation. Pre-growth, growth, and post-growth are defined based on the relative sequence of deposition and uplifting (see text or Figure 3 for details).
Applsci 14 08621 g005
Figure 6. (a) Structural pattern of the peripheral fault derived from the trishear kinematic model. (b) Structural pattern of the peripheral fault derived from seismic interpretation versus that from the trishear kinematic model. Pre-growth, growth, and post-growth are defined based on the relative sequence of deposition and uplifting (see text or Figure 3 for details).
Applsci 14 08621 g006
Figure 7. (a) Sketch of the model setup. The setup consists of a constant pressure cavity and homogeneous Mohr–Coulomb host rock. The model is 30 km wide, 10 km deep, and axisymmetric. The bottom surface is fixed, the top surface is free, and the right boundary allows vertical slip. (b) Distribution of adaptive triangular mesh. Note that the mesh is denser in areas of stress concentration.
Applsci 14 08621 g007
Figure 8. Shear dissipation map that predicts the damage distribution of the model. The white lines are the modeled sill. The energy dissipation by shear damage is represented by the color scale in kJ. Vtip and Vsurf are measured at the sill tip and at the surface, respectively.
Applsci 14 08621 g008
Table 1. Geometric and kinematic parameters of the peripheral fault from the seismic interpretation and kinematic model.
Seismic InterpretationKinematic Model
Trishear apical angle40°40° 1
Displacement52 m58 m
Dip angle88°90°
P/S ratio/2.5
1 The trishear apical angle of the kinematic model is derived from the seismic interpretation. The values of the X and Y positions of the fault tip line depend on the modeling range. Therefore, they are not included in this table.
Table 2. Mechanical properties of the host rock in the limit analysis.
SymbolParameter DefinitionValue
ρDensity (kg/m3)2.5 × 103
CCohesion (MPa)20
φinternal friction angle (°)30°
EYoung′s modulus (GPa)20
νPoisson′s ratio0.25
Disclaimer/Publisher’s Note: The statements, opinions and data contained in all publications are solely those of the individual author(s) and contributor(s) and not of MDPI and/or the editor(s). MDPI and/or the editor(s) disclaim responsibility for any injury to people or property resulting from any ideas, methods, instructions or products referred to in the content.

