Abstract
Cucumbers (Cucumis sativus) are known for their high water content and nutritional value, making them a valuable addition to a balanced diet. The objective of this study was to evaluate the physicochemical quality (color, moisture, water activity, and texture), and antioxidant/antiradical properties of freshly packed greenhouse-cultivated cucumbers over a 28-day storage period, utilizing a combination of high-throughput analytical techniques, including attenuated total reflectance–Fourier transform infrared (ATR-FTIR) spectroscopy, instrumental analysis, image analysis, and chemometrics. The key findings indicated that the cucumbers underwent a significant loss of moisture during the storage period, with a concomitant decrease in firmness. Color analysis revealed an increase in the yellowness of both the peel and flesh, while image analysis demonstrated increasing dissimilarity and textural disorder, particularly evident by the 13th day of storage. The spectrophotometric and spectroscopic findings demonstrated that the quality of the cucumbers was maintained during the storage period. Meanwhile, regression and discriminant analyses were employed to interpret the collected data. Predictive models were developed with high accuracy to estimate the actual storage days and flesh quality attributes based on textural and color features derived from image analysis. Overall, this study highlights the importance of controlled storage conditions in maintaining cucumber quality and provides a comprehensive approach to monitoring post-harvest changes.
1. Introduction
Cucumber (Cucumis sativus L., Cucurbitaceae) is botanically classified as a fruit and belongs to the Cucurbitaceae family. It is one of the most widely cultivated fruits globally, with its production and cultivation occurring in over 100 countries, as reported by the FAO. This is further supported by the slight increase in total production from 2021 to 2022, which accounted for 92,613,394 tons and 94,718,397 tons, respectively (https://www.fao.org/home/en/) (accessed on 26 May 2024) [1]. Specifically, several Asian countries, including China, Japan, and Indonesia, are responsible for the majority of cucumber production [1]. However, tropical and subtropical regions are more conducive to the optimal production of cucumbers. With regard to Greece, the cultivation and production of cucumbers is a longitudinal process, with an annual yield of between 100,000 and 500,000 tons. This production is associated with traditional dishes, such as tzatziki and pickles, and represents a significant economic activity. In general, geographical factors can exert a significant influence on both the sensory and nutritional characteristics of cucumbers. This is why greenhouses are employed for the cultivation of cucumbers, with the objective of extending the harvest period and ensuring a controlled environment that promotes product homogeneity [2].
So far, cucumbers have been consumed primarily as fresh fruits in salads and pickles or as flavor enhancers in juices and various beverages. In terms of nutritional value, cucumbers are composed of over 95% water, which renders them suitable for incorporation into healthcare products due to their moisturizing effects. Meanwhile, carbohydrates constituted 2.2% of the total composition, while proteins (0.6%) and lipids (0.1%) were also present in trace amounts [3]. More specifically, glucose, fructose, and starch have been identified in the flesh of the fruit [4], while vitamins and minerals, including vitamin K, vitamin C, and vitamin A, as well as potassium, magnesium, and calcium, have also been detected [5]. Interestingly, cucumbers contain a diverse array of phytochemicals, including carotenoids (i.e., carotene, cryptoxanthin, lutein, and zeaxanthin) and antioxidants. These compounds have been linked to a number of beneficial effects, including weight management, as well as antioxidant and anti-inflammatory properties [4]. Notably, a characteristic compound in cucumbers, known as cucurbitacins, has been demonstrated to possess potential anticancer activity [6].
Meanwhile, a multitude of factors, including phenotypic characteristics, cultivation conditions (soil–water quality, temperature, light, and environment), and harvesting time, can influence the composition of cucumbers [7]. The post-harvest handling of cucumbers is essential for maintaining their quality characteristics during storage. Indeed, during the storage period, several physicochemical and nutritional changes occur. More specifically, the conditions (mainly temperature and moisture) can cause cucumbers to lose moisture, which can result in increased weight loss, shrinkage, and a wrinkled appearance [8]. This is also associated with the progression of crispness over time, due to the enzymatic activity that can soften the tissue, thereby reducing the crispness of the fruit. In addition, alterations in color may occur during the storage period. More specifically, exposure to light and ethylene can result in the degradation of chlorophyll, leading to a shift in the cucumber’s color toward yellow [9].
From a nutritional perspective, the antioxidant activity of cucumbers exhibits a slight decline during the storage period [10]. This reduction can be attributed to the degradation of phenolic compounds and vitamins such as vitamin C, or to the action of polyphenol oxidase and peroxidase (the most common enzymatic activities occurring in green fruits), which increase during storage. On the other hand, the use of appropriate packaging that allows for the regulation of key storage factors, including light and mechanical exposure, as well as temperature, can prevent the aforementioned degradation processes and maintain the antioxidant activity and overall quality of cucumbers throughout storage [11]. However, there is a knowledge gap regarding the nutritional and quality changes in packed cucumbers during storage.
By employing a combination of holistic analytical techniques, including both instrumental and statistical methods, this study aims to provide new insights regarding the potential differences related to the physicochemical and quality characteristics of cucumbers during storage. Moreover, one of the main goals was to determine the optimal storage duration for cucumber fruits under suitable storage conditions to maintain their quality. In light of the aforementioned considerations, this study proposes a non-destructive methodology for the assessment of the overall quality of cucumbers from cultivation to consumption. This methodology facilitates decision-making throughout the food supply chain by providing machine learning prediction models for quality characteristics. For this purpose, a series of analytical techniques were employed, including image analysis, attenuated total reflectance–Fourier transform infrared (ATR-FTIR) spectroscopy, spectrophotometric assays (for the determination of total phenolic content, as well as antioxidant and antiradical activity determination), as well as color, texture, water activity, and moisture evaluation. Furthermore, regression and discriminant analyses were also employed to identify significant patterns in the results. Subsequently, in order to anticipate the storage day and the flesh quality of the cucumber samples, predictive models were built using the features derived from the image textural analysis.
2. Materials and Methods
2.1. Cucumber Samples
Cucumber samples exhibiting no visual defects were harvested at the point of commercial maturity by ‘Thrace Greenhouses’ (https://www.thracegreenhouses.com/ (accessed on 1 November 2023)) and transported to the laboratory on the same day of harvest. The samples were cultivated under hydroponic conditions and received in packaging bags with adequate air ventilation (Figure 1). Throughout the duration of the experiment, the samples were stored in laboratory incubators (POL-EKO Cooled incubator ST 3, POL-EKO-APARATURA) and maintained at a stable temperature of 15.0 ± 0.5 °C and relative humidity (60 ± 2%) until the end of the study. The quality evaluation of the samples was initiated on the first day following harvest and comprised a comprehensive array of analyses. On each day of analysis, 10 samples were randomly selected and subjected to all the requisite analyses to assess their quality. The samples were examined at specific time points throughout the course of analysis, namely days 1, 7, 13, 16, 22, and 28. This systematic approach allowed for a comprehensive evaluation of the cucumbers’ quality over the duration of the study.

Figure 1.
Packaging of cucumber samples.
2.2. Image Analysis
For the image analysis of cucumbers, a methodology similar to Sinanoglou et al. was followed [12]. Cucumber samples were photographed using a Sony DSCW800/B (IXUS 100 IS) digital camera (Sony Europe Limited, Edinburgh, UK), positioned at a distance of 15 cm from the cucumber’s surface. Images of the outer surfaces of cucumber peels were captured under consistent lighting conditions. Subsequently, color and texture features were extracted from these images for further analysis. Specifically, three color parameters (L*, a*, and b*) were derived from the colored images, while fifteen textural features were extracted from the grayscale versions. These features were used to analyze the color and textural changes in cucumbers throughout the study. In order to extract the relevant features, a series of regions of interest (ROIs) were selected from each image of every sample [13].
2.3. Physicochemical Measurements
For a comprehensive analysis of color changes throughout the study, the color parameters L* (lightness), a* (red–green chromaticity), b* (blue–yellow chromaticity), and hue (h) angle (position of the color on the color wheel, measured in degrees), of the cucumber samples were measured using a tristimulus chromatometer (CR-400, Minolta, Tokyo, Japan). Calibration was performed with a standard white plate (L*: 97.83, a*: −0.45, b*: +1.88). Measurements were taken from both the outer and inner surfaces of the cucumber samples.
Utilizing an AquaLab dew point water activity meter (model 4TE, METERGroup, Inc., Pullman, WA, USA), the water activity of the cucumber samples was measured. The moisture content of the cucumber samples was quantified by measuring the weight loss resulting from heating in a vacuum oven. The samples were initially weighed and then subjected to reduced pressure in the vacuum oven for a period of 24 h at a stable temperature of 70 °C. After drying, the mass of the samples was recorded in order to determine the moisture content.
The texture of the cucumber flesh samples was assessed using a TA-XTplusC texture analyzer from Stable Micro Systems, Godalming, UK, in accordance with the methodology outlined by Giannakourou et al. [14]. The analysis was conducted on the peeled cucumber samples using a 6.0 mm diameter cylindrical plunger from the outside to the inside to evaluate the flesh while avoiding the placenta. The textural attributes evaluated were firmness, cohesiveness, adhesiveness, springiness, and chewiness.
2.4. Attenuated Total Reflectance–Fourier Transform Infrared Spectroscopy (ATR-FTIR)
Fourier Transform Infrared Spectroscopy with attenuated total reflectance (ATR-FTIR) analysis was conducted using an IRAffinity-1S FTIR Spectrometer, manufactured by Shimadzu in Kyoto, Japan. A diamond internal reflection element (IRE) was utilized. The outer surfaces of the cucumber’s peels were placed in the ATR surface and their spectrum was taken. The spectra of cucumber peel samples and background were collected from 4000 to 499 cm−1, with an average of 20 scans at a resolution of 4 cm−1 and an ATR reference setting of 3284.77 cm−1. Subsequently, the FTIR spectra of cucumber samples underwent ATR correction, normalization, smoothing, and peak picking using LabSolutions IR software (version 2.21).
2.5. Spectrophotometric Assays of Cucumber Peel Phenolic Extract
The preparation of the extracts entailed the mixing of 1 g of cucumber peel with an aqueous, natural ethanol solution (40% v/v) in a ratio of 1:10 (w/v). Subsequently, the mixture was sealed and stored at room temperature (20 °C) for a period of 24 h. Following this period, the resulting diluted extracts were stored at 4 °C in preparation for spectrophotometric analysis. Spectrophotometric measurements were performed using a Spectro 23, Digital Spectrophotometer (Labomed, Inc., Los Angeles, CA, USA). To ensure the accuracy of the results, each measurement was repeated three times.
The total phenolic content (TPC) in the cucumber extracts underwent assessment through a customized adaptation of the Folin–Ciocalteu colorimetric assay, in accordance with the methodology proposed by Andreou et al. [15]. The outcomes were conveyed in terms of milligrams of gallic acid equivalents (GAEs) per gram of cucumber. For the evaluation of antiradical activity, the ABTS+ radical assay was employed following the protocol described by Lantzouraki et al. [16]. The antiradical activity was expressed in milligrams of Trolox equivalents (TEs) per gram of cucumber. Furthermore, to assess the antioxidant potential of the cucumber extracts, the ferric reducing antioxidant power (FRAP) assay was conducted. This assessment followed a modified version of the method proposed by Lantzouraki et al. [17]. The results obtained from the FRAP assay were expressed as milligrams of Fe (II) per gram of cucumber.
2.6. Machine Learning/Discriminant Analysis
In order to discriminate the changes in packed cucumbers over time, the textural features extracted from the image analysis of the different storage stages were subjected to machine learning (ML) methods. Ten (10) distinct ML classifiers from the Scikit-Learn library of the Python programming language {3.12/PEP 693} (https://scikit-learn.org/, accessed on 5 February 2024) were tested on the six (6) classes formed by the six days of measurements and the best ML system was extracted as described in detail by previous publications of the team [12,13]. In the case of our data, the classifier that demonstrated the most optimal performance was the CART classifier. Each combination of features was condensed into two components, designated PCA1 and PCA2, through the application of principal component analysis (PCA). The results of the discriminant analysis, assessed using the ‘Repeated K-Fold’ function from Python’s Scikit-Learn library 1.3.1and a machine learning classifier, were visualized in the form of two-dimensional scatter plots based on the PCA. The plots included class-separating surfaces, which serve to emphasize the distinctions between different classes.
Furthermore, by using Metaboanalyst 6.0, the days of storage were discriminated in order to examine the impact of time on the physicochemical characteristics of the samples. The same study was conducted using the ATR-FTIR dataset. Briefly, the supervised multivariate statistical approaches (PLS-DA and OPLS-DA) were used for the exploratory data analysis (storage at different time points and storage by grouping days 1–13 and days 16–28). VIP plots were also generated to identify the parameters with the greatest contribution to the discrimination (VIP > 1). The data were subjected to autoscaling, which entailed determining mean-centered values and dividing each variable by its standard deviation. The quality of the models and cross-validation were also conducted. The quality of the models was described by the goodness-of-fit R2 (0 ≤ R2 ≤ 1) and the predictive ability Q2 (0 ≤ Q2 ≤ 1) values. The results of both PLS-DA and OPLS-DA were cross-validated through the implementation of permutation tests, comprising 1000 random permutations. Finally, the variables exhibiting the greatest discriminatory potential were subjected to a Wilcoxon non-parametric t-test. p-values were calculated at the significance level of 0.05, and the resulting violin plots were assessed.
2.7. Statistical Analysis and Regression Models
The statistical analysis of the variation in cucumber image features and physicochemical parameters between storage days was performed using the non-parametric Mann–Whitney–Wilcoxon test for two classes. This analysis was conducted using the Python scipy.stats library 1.14.1 (https://docs.scipy.org/doc/scipy/tutorial/stats.html, accessed on 5 February 2024). Additionally, the results were subjected to a significance level of p < 0.05 with one-way ANOVA and post hoc analysis, conducted using the IBM SPSS Statistics software (version 29.0, Chicago, IL, USA) for Windows. The Pearson correlation test was also conducted. Subsequently, a multiple regression was performed using the gradient-boosting regression model and the K-fold evaluation method to predict the actual storage days of the cucumbers, based on both the data extracted from the images and the physicochemical features.
3. Results and Discussion
3.1. Image Texture and Color Assessment of the Outer Surfaces of Cucumber Peels during Storage
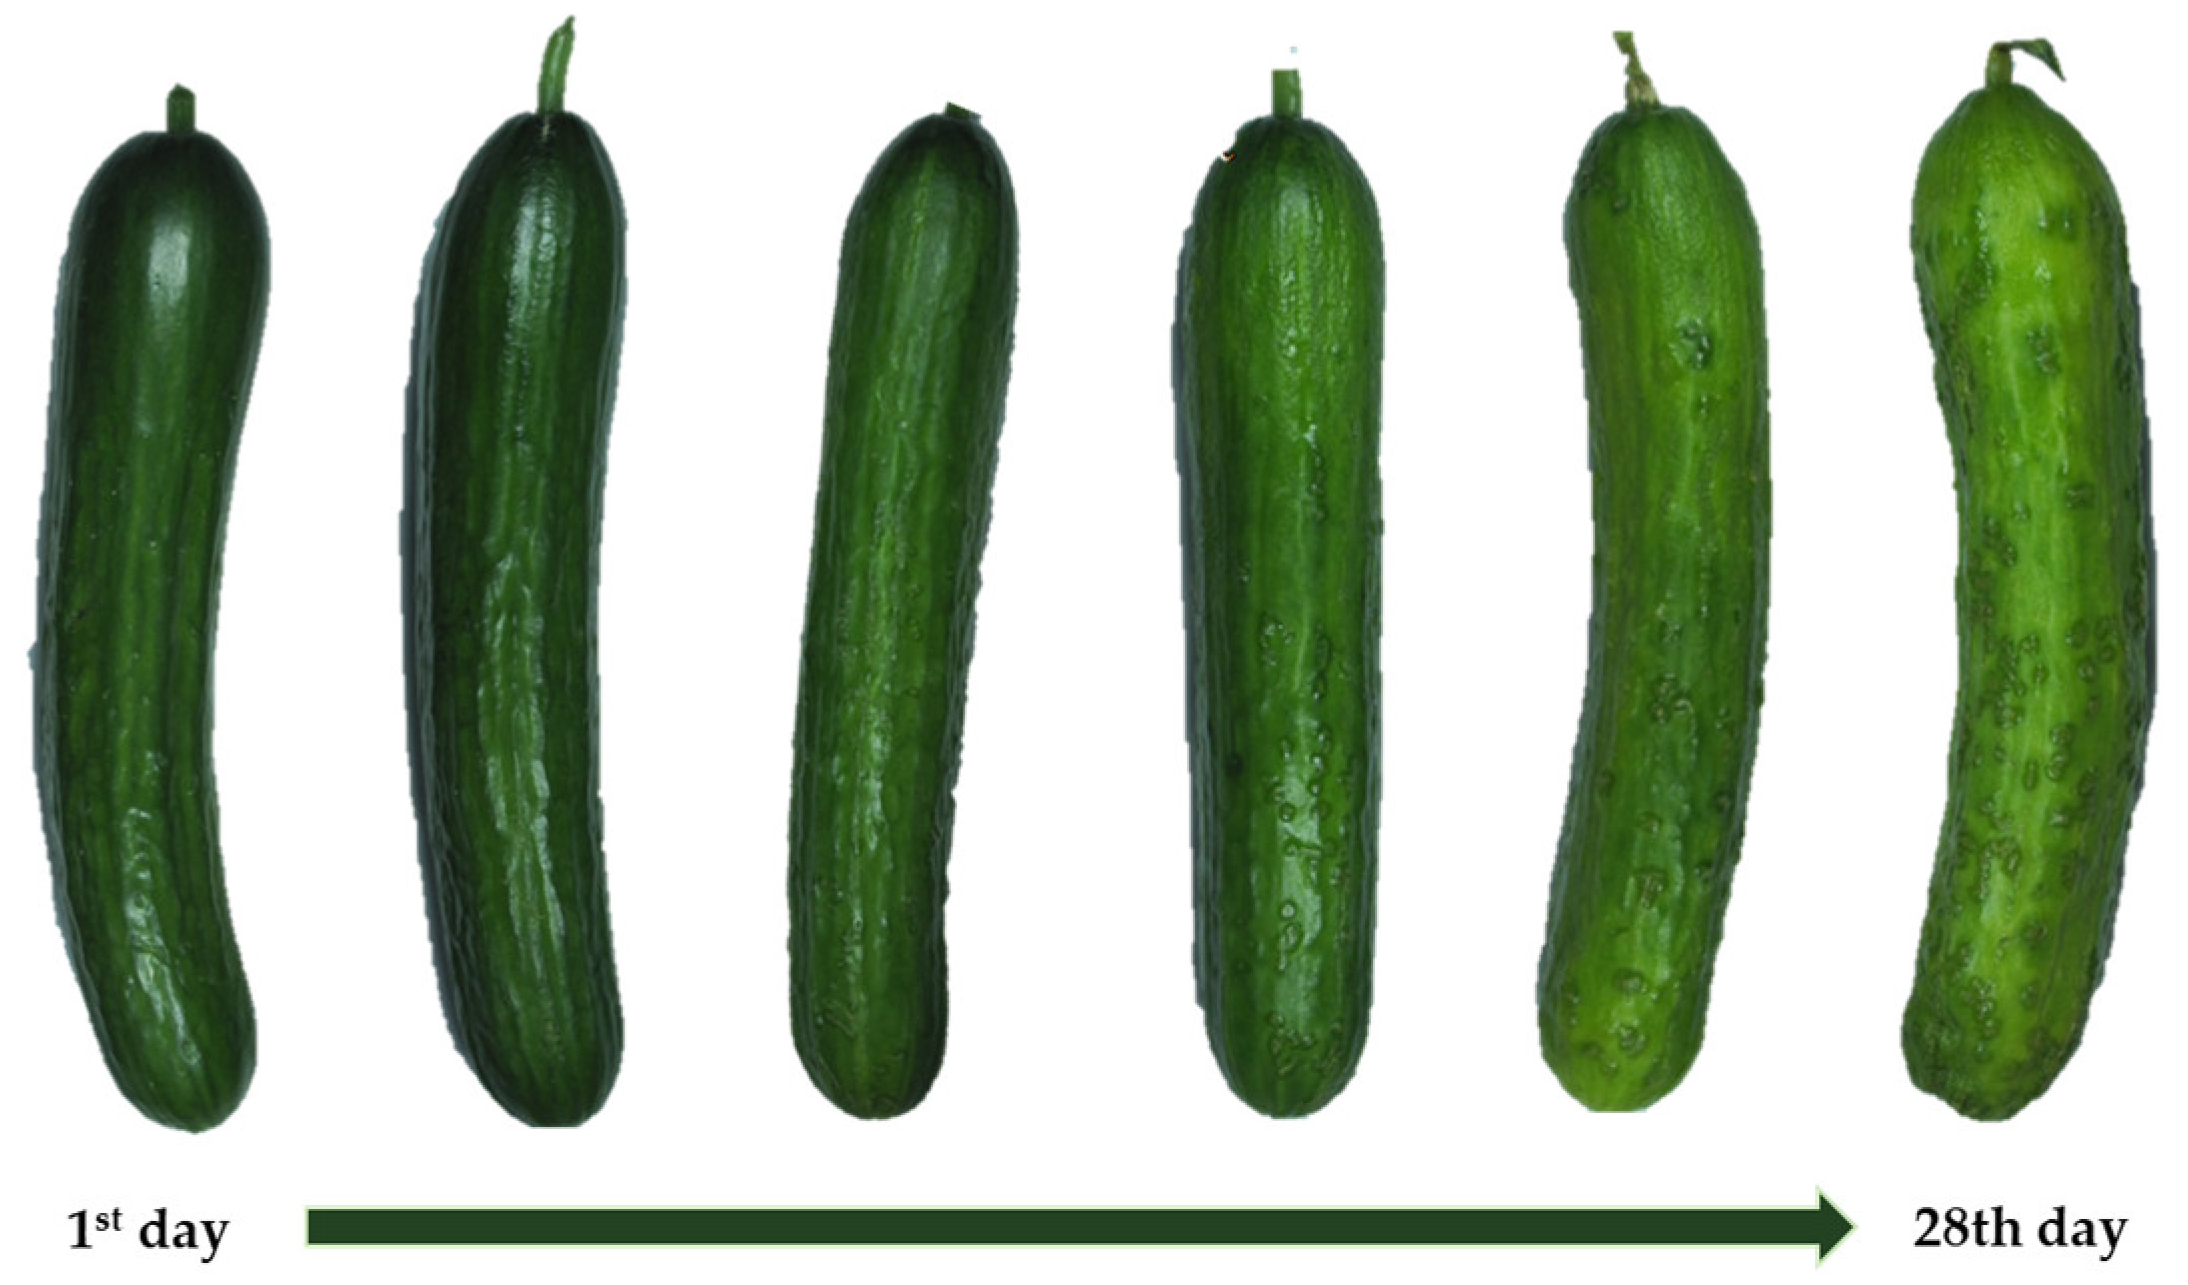
The surface appearance of fruits and vegetables is one of the most important factors in consumer acceptance of these products. Digital image processing is a non-destructive morphometric technology that employs appropriate algorithms to highlight image texture features, thereby enabling key conclusions to be drawn regarding the classification, shelf life, and quality prediction of fruits and vegetables during storage [11,12,17]. Consequently, image analysis was utilized to extract data from digital images of the outer surfaces of cucumber peels, with the objective of evaluating the quality of the cucumbers in relation to the progression of their maturation during storage. For this purpose, machine learning techniques were employed for the analysis of the computed features derived from the colored and grayscale images of the outer surfaces of cucumber peels over the course of 28 days of storage. Figure 2 illustrates the progressive alterations in the appearance of cucumber peels throughout the 28-day storage period, as determined through image analysis.
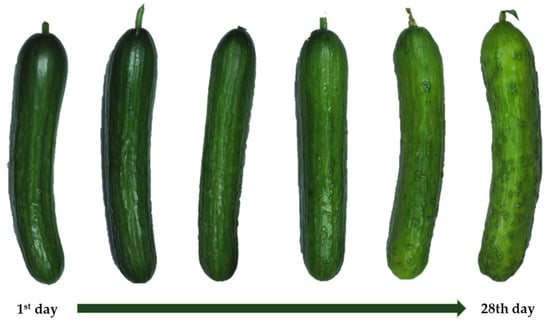
Figure 2.
Representative images of cucumber peel throughout the 28 d storage period (days 1, 7, 13, 16, 22, and 28).
The color parameters L* (lightness), a* (redness–greenness), b* (yellowness–blueness), and h (hue angle) were determined using the colored images of the outer surfaces of cucumber peels and the chromatometer’s results, and they are presented in Table 1. The results demonstrated a significant (p < 0.05) increase in the L* and b* parameters during the storage period, while the a* and h parameters exhibited a statistically significant (p < 0.05) decrease. In particular, the a* values of the outer surfaces of cucumber peels reached a plateau at day 22, with no significant fluctuations until day 28. These findings suggest that during the storage period, the cucumber peel’s color became brighter, with an increase in greenness and yellowness, a shift toward yellow hues, and a gradual conversion from green to yellower green [18]. In accordance with the aforementioned results, Ebrahimi et al. [19] have proposed that these color changes are ascribed to the enzymatic conversion of chlorophyll to yellow-green colored pheophytin during post-harvest storage. Furthermore, Trong et al. [20] have reported that chlorophyll is gradually decomposed during the ripening of cucumbers, resulting in a decrease in the green hue and the dominance of the yellow hues attributed to carotenoids.

Table 1.
Color parameters (L*, a*, b*, h) resulting from the image analysis and chromatometer measurement of the outer surfaces of cucumber peels over the storage period of 1, 7, 13, 16, 22, and 28 days.
Figure 3 depicts the diversity in the most significant textural features extracted from grayscale images of the outer surfaces of cucumber peels throughout the 28-day storage period. Therefore, the textural features, mean (the average intensity of all image pixels), standard deviation (difference from the mean value), dissimilarity (textural image alteration), short-run emphasis (existence of short, successive runs of pixels with comparable intensities inside a picture), and run length non-uniformity (variations in the lengths of runs of similar intensity values within an image) significantly (p < 0.05) increased during the storage period. It is noteworthy that the dissimilarity values indicate that the most significant changes were achieved by the 13th day of storage. On the other hand, gray-level non-uniformity (variability in the distribution of gray levels in the image) and long-run emphasis (longer consecutive runs of pixels with similar intensity values in an image) both decreased (p < 0.05), with an increase in storage time. The results revealed a loss of texture structural order and an increase in the image dissimilarity of cucumber peels, which became less constant and more fractured over the course of the storage period. The above results are considered particularly significant as they align with the findings of numerous researchers [12,13,21,22,23,24] who have established a correlation between alterations in the texture features derived from the food digital image processing of food and its physicochemical characteristics (such as moisture content, texture, dietary value, etc.), overall quality, and microbiological stability.
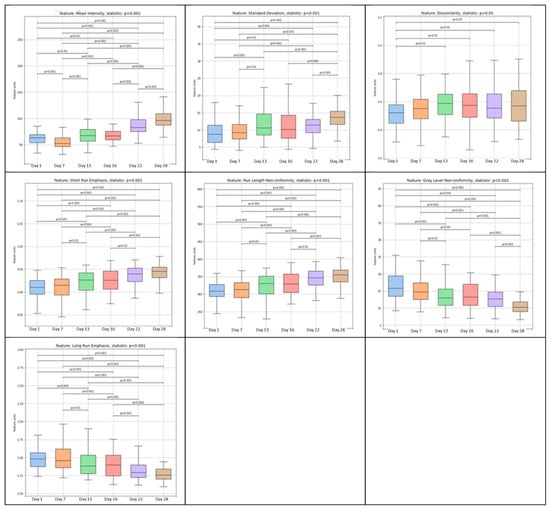
Figure 3.
Variation in image analysis computed features [mean, standard deviation, dissimilarity, short-run emphasis (SRE), run length non-uniformity (RLN), gray-level non-uniformity (GLN), and long-run emphasis (LRE)] of cucumber peel samples at days 1, 7, 13, 16, 22, and 28.
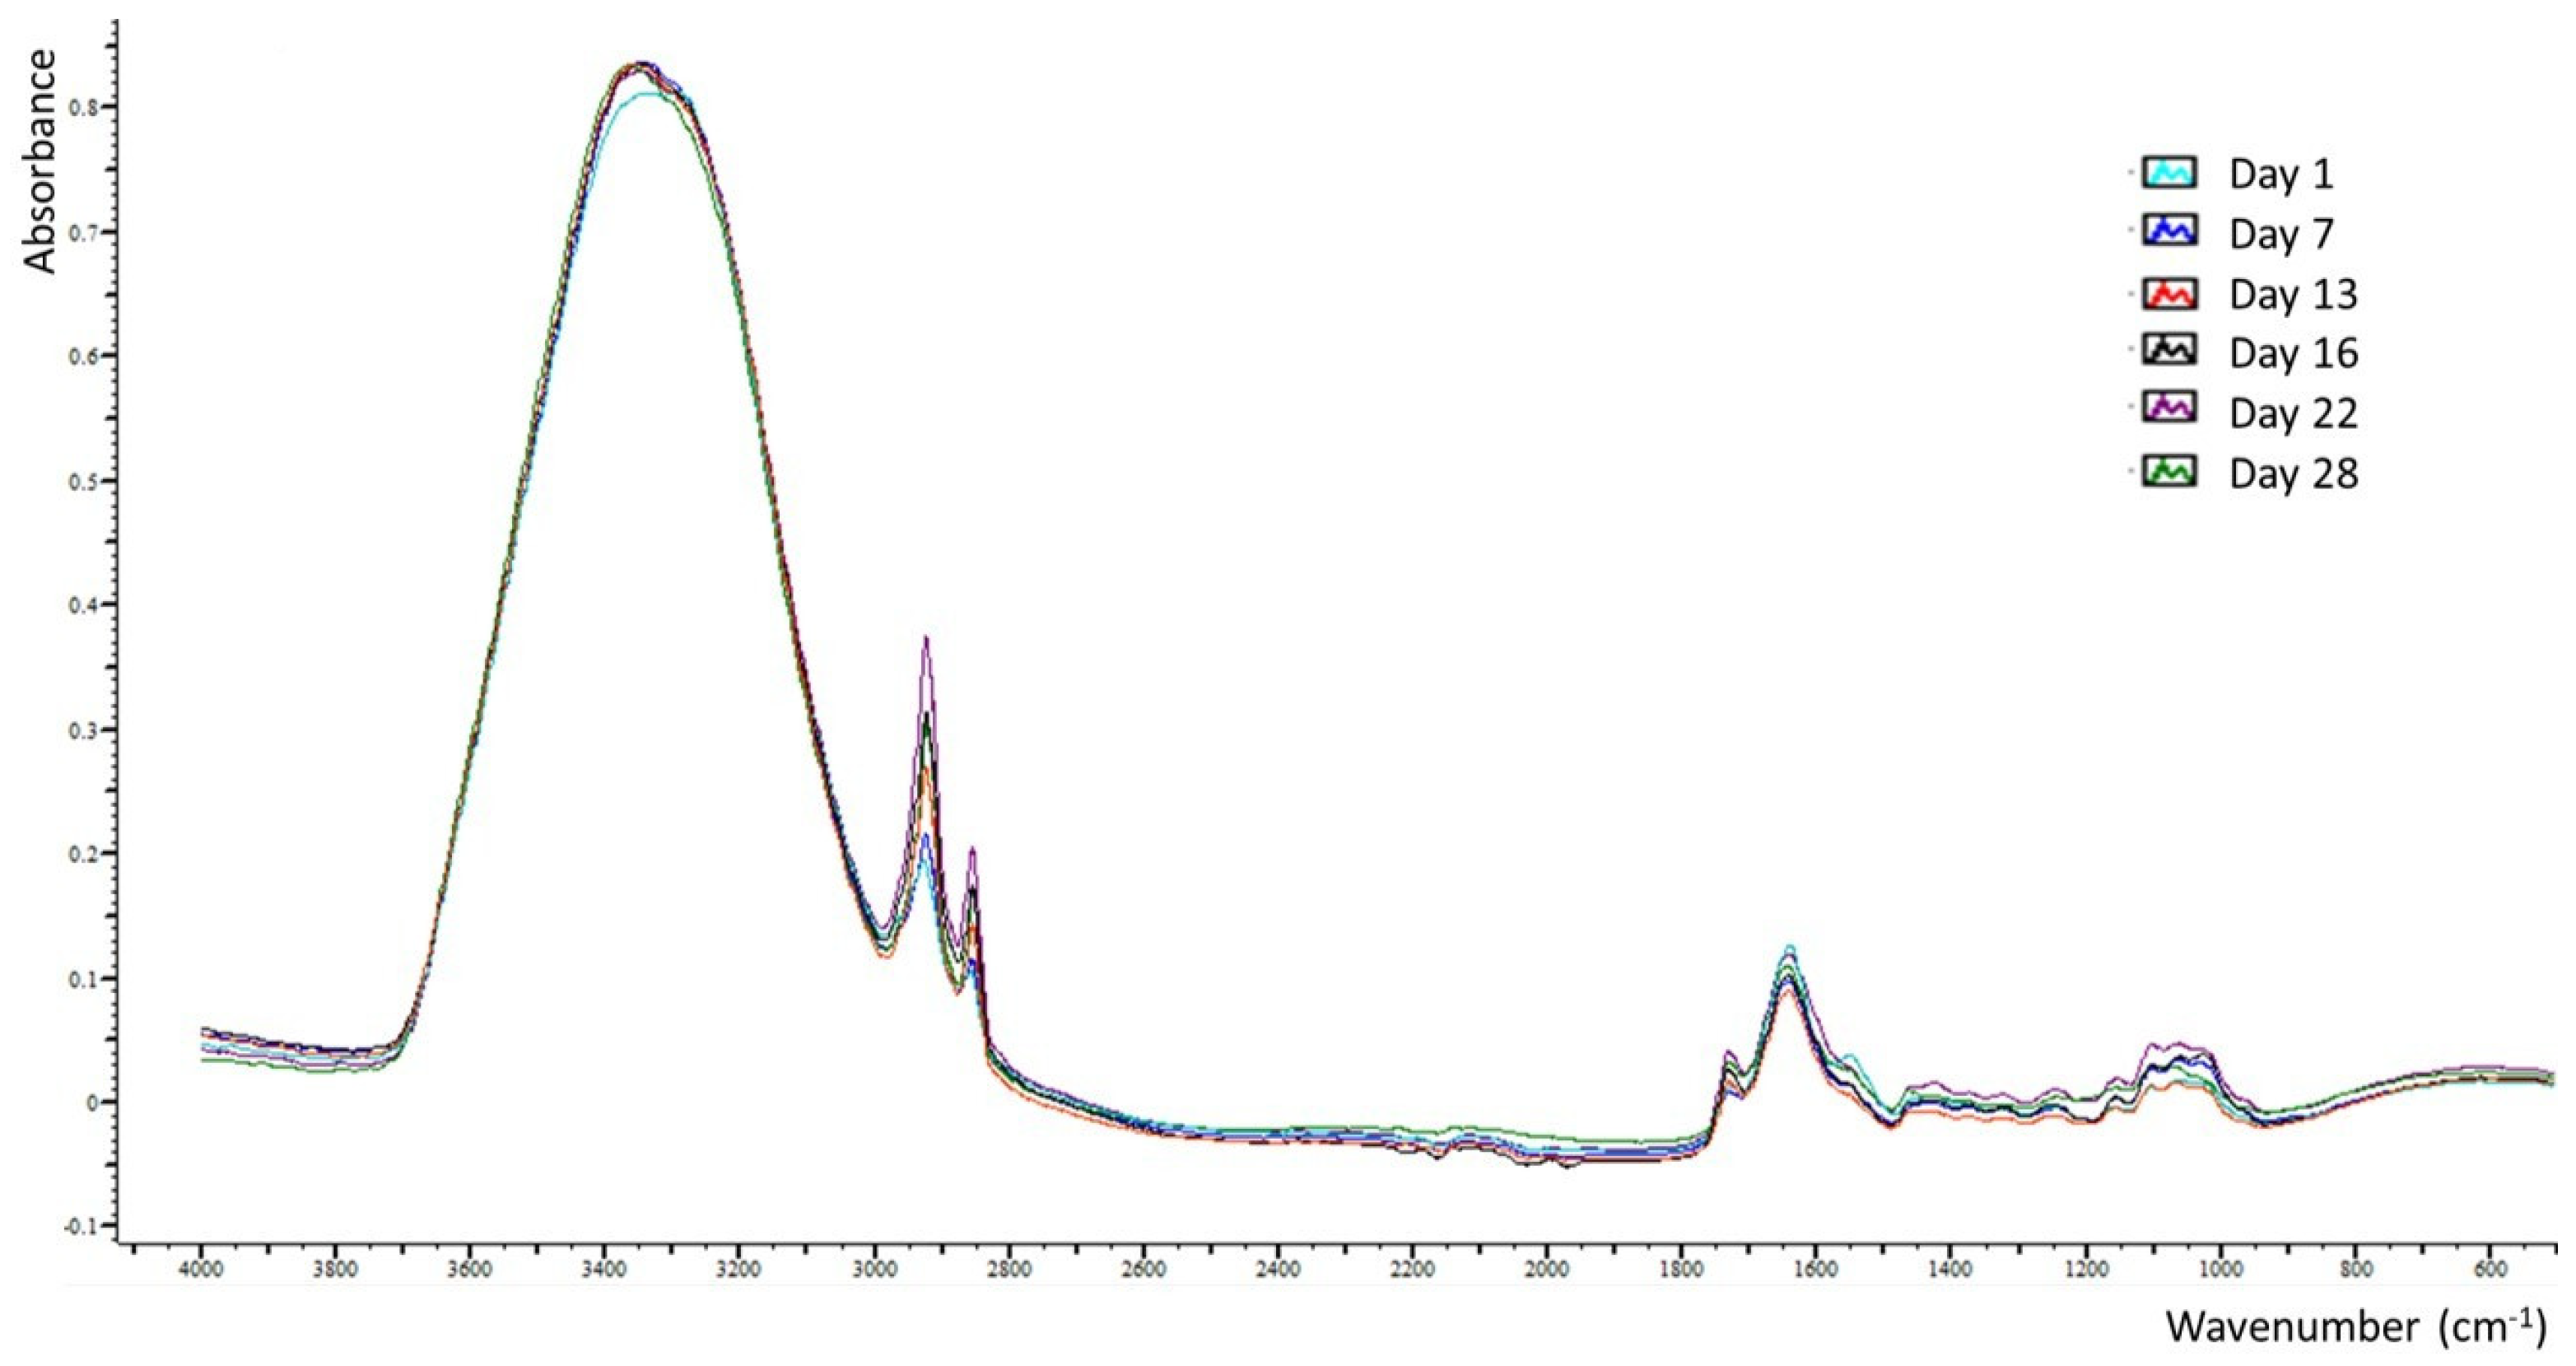
3.2. ATR-FTIR Spectra Interpretation of the Outer Surfaces of Cucumber Peels
The ATR-FTIR spectra bands observed on the outer surfaces of cucumber peels during the storage period (as depicted in Table 2 and Figure 4) were within the spectral range of 4000–499 cm−1. The analysis of these spectra led to several significant findings. The bands located at 3334–3338 and 1635–1641 cm−1, which are, respectively, associated with the stretching and bending vibrations of hydroxyl groups present in water, carbohydrates, organic acids, and phenols [12,25], exhibited consistent high intensities throughout the storage period, indicating stability across all cucumber samples. Conversely, the bands at 2922 and 2854 cm−1, linked, respectively, to asymmetrical and symmetrical C(sp3)-H stretching vibrations of methylene groups found in terpenoids, carboxylic and fatty acids, saponins, carbohydrates, and free amino acids [12,24], displayed a notable (p < 0.05) and progressive increase from day 1 to day 16. Subsequently, the absorbance at 2922 cm−1 reached a plateau, while the absorbance at 2854 cm−1 showed a significant (p < 0.05) decrease until day 22, followed by a slight insignificant increase toward the end of the storage period.
Table 2.
Mean intensities of the ATR-FTIR spectral absorbance bands of the outer surfaces of cucumbers peels during storage period.
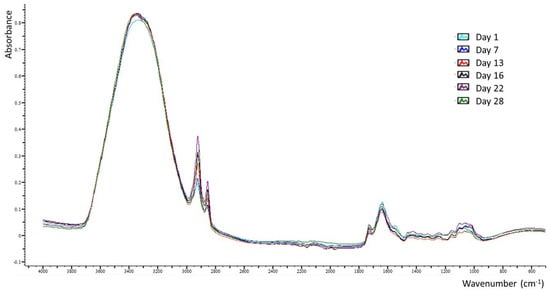
Figure 4.
Overlay of representative ATR-FTIR spectra of each day of storage.
Notably, the appearance of the band at 1460 cm−1, attributed to the bending vibrations of methylene groups [26], was observed for the first time on day 16 and maintained a constant intensity until the end of the storage period, likely associated with the increased intensities of C(sp3)-H stretching vibrations. The band at 1724–1726 cm−1, which is related to the stretching vibrations of the carbonyl group (C=O) in carboxylic acids [26], exhibited a significant (p < 0.05) increase at day 13 and subsequently showed no significant variation until the end of the storage period. The observed fluctuations in the C(sp3)-H and C=O vibrations may be linked to a gradual increase in the organic acid content within the cucumber peel throughout the storage period. This hypothesis is supported by the findings of Ajayi et al. [27], who suggested that the storage of fruits at room temperature could result in an increase in organic acid concentration. According to Sotiroudis et al. [3], cucumber peel contains a high concentration of lactic acid, which has been demonstrated to prevent the growth of harmful germs to improve human health by boosting the immune system [28]. Furthermore, the band at 1546–1552 cm−1, which is associated with the aromatic ring stretch [26], presented a significant (p < 0.05) decrease on day 13 and subsequently remained constant until the end of the storage period. The bands at 1415–1420 and 1317–1319 cm−1, which are ascribed to the combination of C-H rocking and O-H bending vibrations and to O-H in-plane bending vibrations [11,24], respectively, in organic acids and primary or secondary alcohols, showed a significant (p < 0.05) increase from day 1 to day 16, followed by a decrease at day 22. Similar alterations were presented for the intensities of the bands at 1234–1245, 1149–1155, 1097–1101, and 1022–1028 cm−1, which are due to the C-O stretching vibrations of carbohydrates, polysaccharides, and phenolics [12,29]. The band at 524–534 cm−1, which is related to the in-plane bending vibrations of the (C-C-C) and (C-O-C) groups in glycosidic linkage [30], showed insignificant fluctuations during the storage period.
3.3. Spectrophotometric Assays in Cucumber Peel Samples during Storage
The total phenolic content and antiradical and antioxidant activity of cucumber peels were determined on days 1, 7, 13, 16, 22, and 28 of storage using the Folin–Ciocalteu, ABTS, and FRAP spectrophotometric methods, and the results are presented in Table 3.
Table 3.
Total phenolic content (TPC), antiradical activity (ABTS), and antioxidant activity (FRAP) of cucumber peel during storage.
The total phenolic content and antioxidant activity of cucumber peels varied insignificant until day 13 of the experiment and exhibited a significant (p < 0.05) increase at day 16. Afterward, the total phenolic content remained relatively stable until the end of the storage period, whereas the antioxidant activity displayed a significant (p < 0.05) increase at day 28. Additionally, the antiradical activity displayed a significant and progressive increase from day 13 to day 16, followed by a stabilization until the end of the storage period. Moreover, a strong positive correlation (p < 0.05) was observed between the total phenolic content and both the antiradical and antioxidant activity (0.792 and 0.789, respectively). Additionally, a positive correlation was noted between antioxidant activity and antiradical activity (0.684). Interestingly, as the storage period progressed, a significant increase was observed in both the total phenolic content and antiradical/antioxidant activity. This finding may be possibly attributed to a number of factors. As the cucumber ripens, a gradual conversion of phenolic glycosides into aglycon structures with higher antioxidant activity may occur. Another explanation may be the gradual degradation of chlorophyll and the parallel increase in flavonoids and carotenoids, as reported by Trong et al. [20], which occurred as the cucumber color changed from green to yellow (Table 1). Additionally, John et al. [31] reported that cucumber peel extracts showed significant antioxidant and antimicrobial properties, which are largely attributed to their high flavonoid content. Moreover, since the cucumbers are protected by their packaging (Figure 1), the membrane structure of the cucumber peel remains intact and undamaged, and as a result, the phenolic compounds and polyphenol oxidase, which are present in different parts of the cell membrane, are unable to interact with each other. A similar conclusion was reached by Balouchi et al. [32], who found that the total phenolic content and antioxidant activity of broccoli increased during storage at room temperature. Furthermore, cucumber preservation at 15˚C appears to result in enhanced storability and an extended shelf life [7]. Indicatively, an increase in the phenolic content and antioxidant activity during storage at temperatures comparable to those used in the present study has also been observed in other fruits and vegetables such as bananas, strawberries, and mangoes [13,33,34,35].
3.4. Physicochemical Parameters of Cucumber Flesh during Storage
The physicochemical parameters of cucumber flesh samples, including water activity (aw), moisture content (%), color parameters, and texture attributes, were evaluated over a 28-day storage period. The values obtained are presented in Table 4.
Table 4.
Water activity, moisture content, firmness, and color parameters (L*, a*, b*, h) of the cucumber flesh over the storage period of 1, 7, 13, 16, 22, and 28 days.
Based on the results, water activity exhibited a significant (p < 0.05) decrease on day 7 of storage, which was followed by insignificant variations until the end of the storage period. The moisture content (%) exhibited fluctuations throughout the storage period, with two significant (p < 0.05) decreases occurring on days 7 and 28. In accordance with the aforementioned findings, Jahan et al. [7] reported a reduction in the moisture content of cucumbers with increasing storage time.
Regarding the color parameters of the cucumber flesh, the L* (lightness) parameter showed a significant (p < 0.05) increase on day 7, followed by a decrease up to day 22 and a subsequent increase until the end of the storage period. The a* (redness/greenness) parameter demonstrated a significant and progressive (p < 0.05) increase on days 13 and 22. The b* (yellowness/blueness) parameter decreased gradually (p < 0.05) from day 16 to day 22, after which it stabilized until the end of the storage period. The h (hue angle) parameter exhibited two significant (p < 0.05) decreases on days 7 and 28. Interestingly, the findings indicate that a reduction in moisture content may contribute to a decrease in hue values, operating as a time milestone. The color changes in cucumber peel during storage have been the focus of numerous studies, yet there is a lack of reliable reports on color changes in the cucumber flesh. Consequently, the alteration in color parameters of cucumber flesh may be linked to a number of factors, including a decrease in moisture content, chlorophyll degradation, increased respiration due to their high moisture content, and oxygen diffusion into the flesh during storage [20,36].
The firmness, corresponding to the maximum force required to compress the cucumber flesh between the teeth, demonstrated an initial (p < 0.05) increase at day 7, an insignificant fluctuation up to day 16, and afterward, a significant (p < 0.05) and progressive decrease until the end of the storage period. Based on the results, it seems that cucumber preservation at 15˚C in packaging bags with adequate air ventilation successfully delayed the flesh softening until day 16 of the storage period. Cucumbers are particularly susceptible to chilling injury when stored below 10 °C, which results in a subsequent breakdown in texture and the structural collapse of the tissue [37,38]. It is reported that keeping cucumbers at temperatures between 10 °C and 15 °C is an effective method of preserving their color and firmness while avoiding the induction of chilling injury and yellowing [39,40]. Moreover, the integrity of the cell walls of cucumbers may deteriorate, leading to increased evaporation, transpiration, and metabolic activity in fruits and vegetables stored at temperatures exceeding 20 °C, which may result in firmness reduction during the storage period [36,41]. Regarding the gradual decrease in cucumber flesh firmness from day 22 until the end of storage period (Table 4), it has been reported that the progressive degradation and solubilization of structural compounds such as pectin, cellulose, and hemicellulose in the cell wall of fruits and vegetables (such as peach, banana, pitaya, and kiwifruit) due to the enzymatic activity of tissue-degrading enzymes, as well as moisture content decrease during storage, results in flesh softening [12,42,43,44].
3.5. Discriminant Analysis
3.5.1. Analysis Discrimination
As a step further, machine learning (ML) was utilized to provide the discrimination of the cucumber peel samples based on their storage days. Since image analysis is a non-destructive technique, machine learning was utilized to demonstrate the utility of image analysis as a tool that can be employed by the industry. Specifically, discriminant analysis was applied to ascertain the most effective combinations of textural features extracted from colored and grayscale images of the cucumber peel, with the objective of grouping the cucumber samples based on different storage days. This was accomplished through the utilization of the Classification and Regression Decision-Tree classifier. Principal component analysis (PCA) illustrated a distinct separation and segregation of the samples across PC1, reflecting the variance derived from image textural features during the storage period. The scatter diagram (Figure 5) shows the discrimination amongst cucumber peel samples from days 1, 13, 22, and 28, with an overall discrimination accuracy of 90.0%, based on the features of mean skewness homogeneity and short-run emphasis. The combination of four features resulted in the creation of a high-performance machine learning system that was able to accurately classify cucumber samples based on their storage day. Specifically, it classified correctly 9, 9, 8 and 10 samples at days 1, 13, 22 and 28, respectively out of 10 samples.

Figure 5.
Scatter plot providing the discrimination among cucumber samples on days 1, 13, 22, and 28.
3.5.2. Internal Physicochemical Characteristics/Texture Analysis
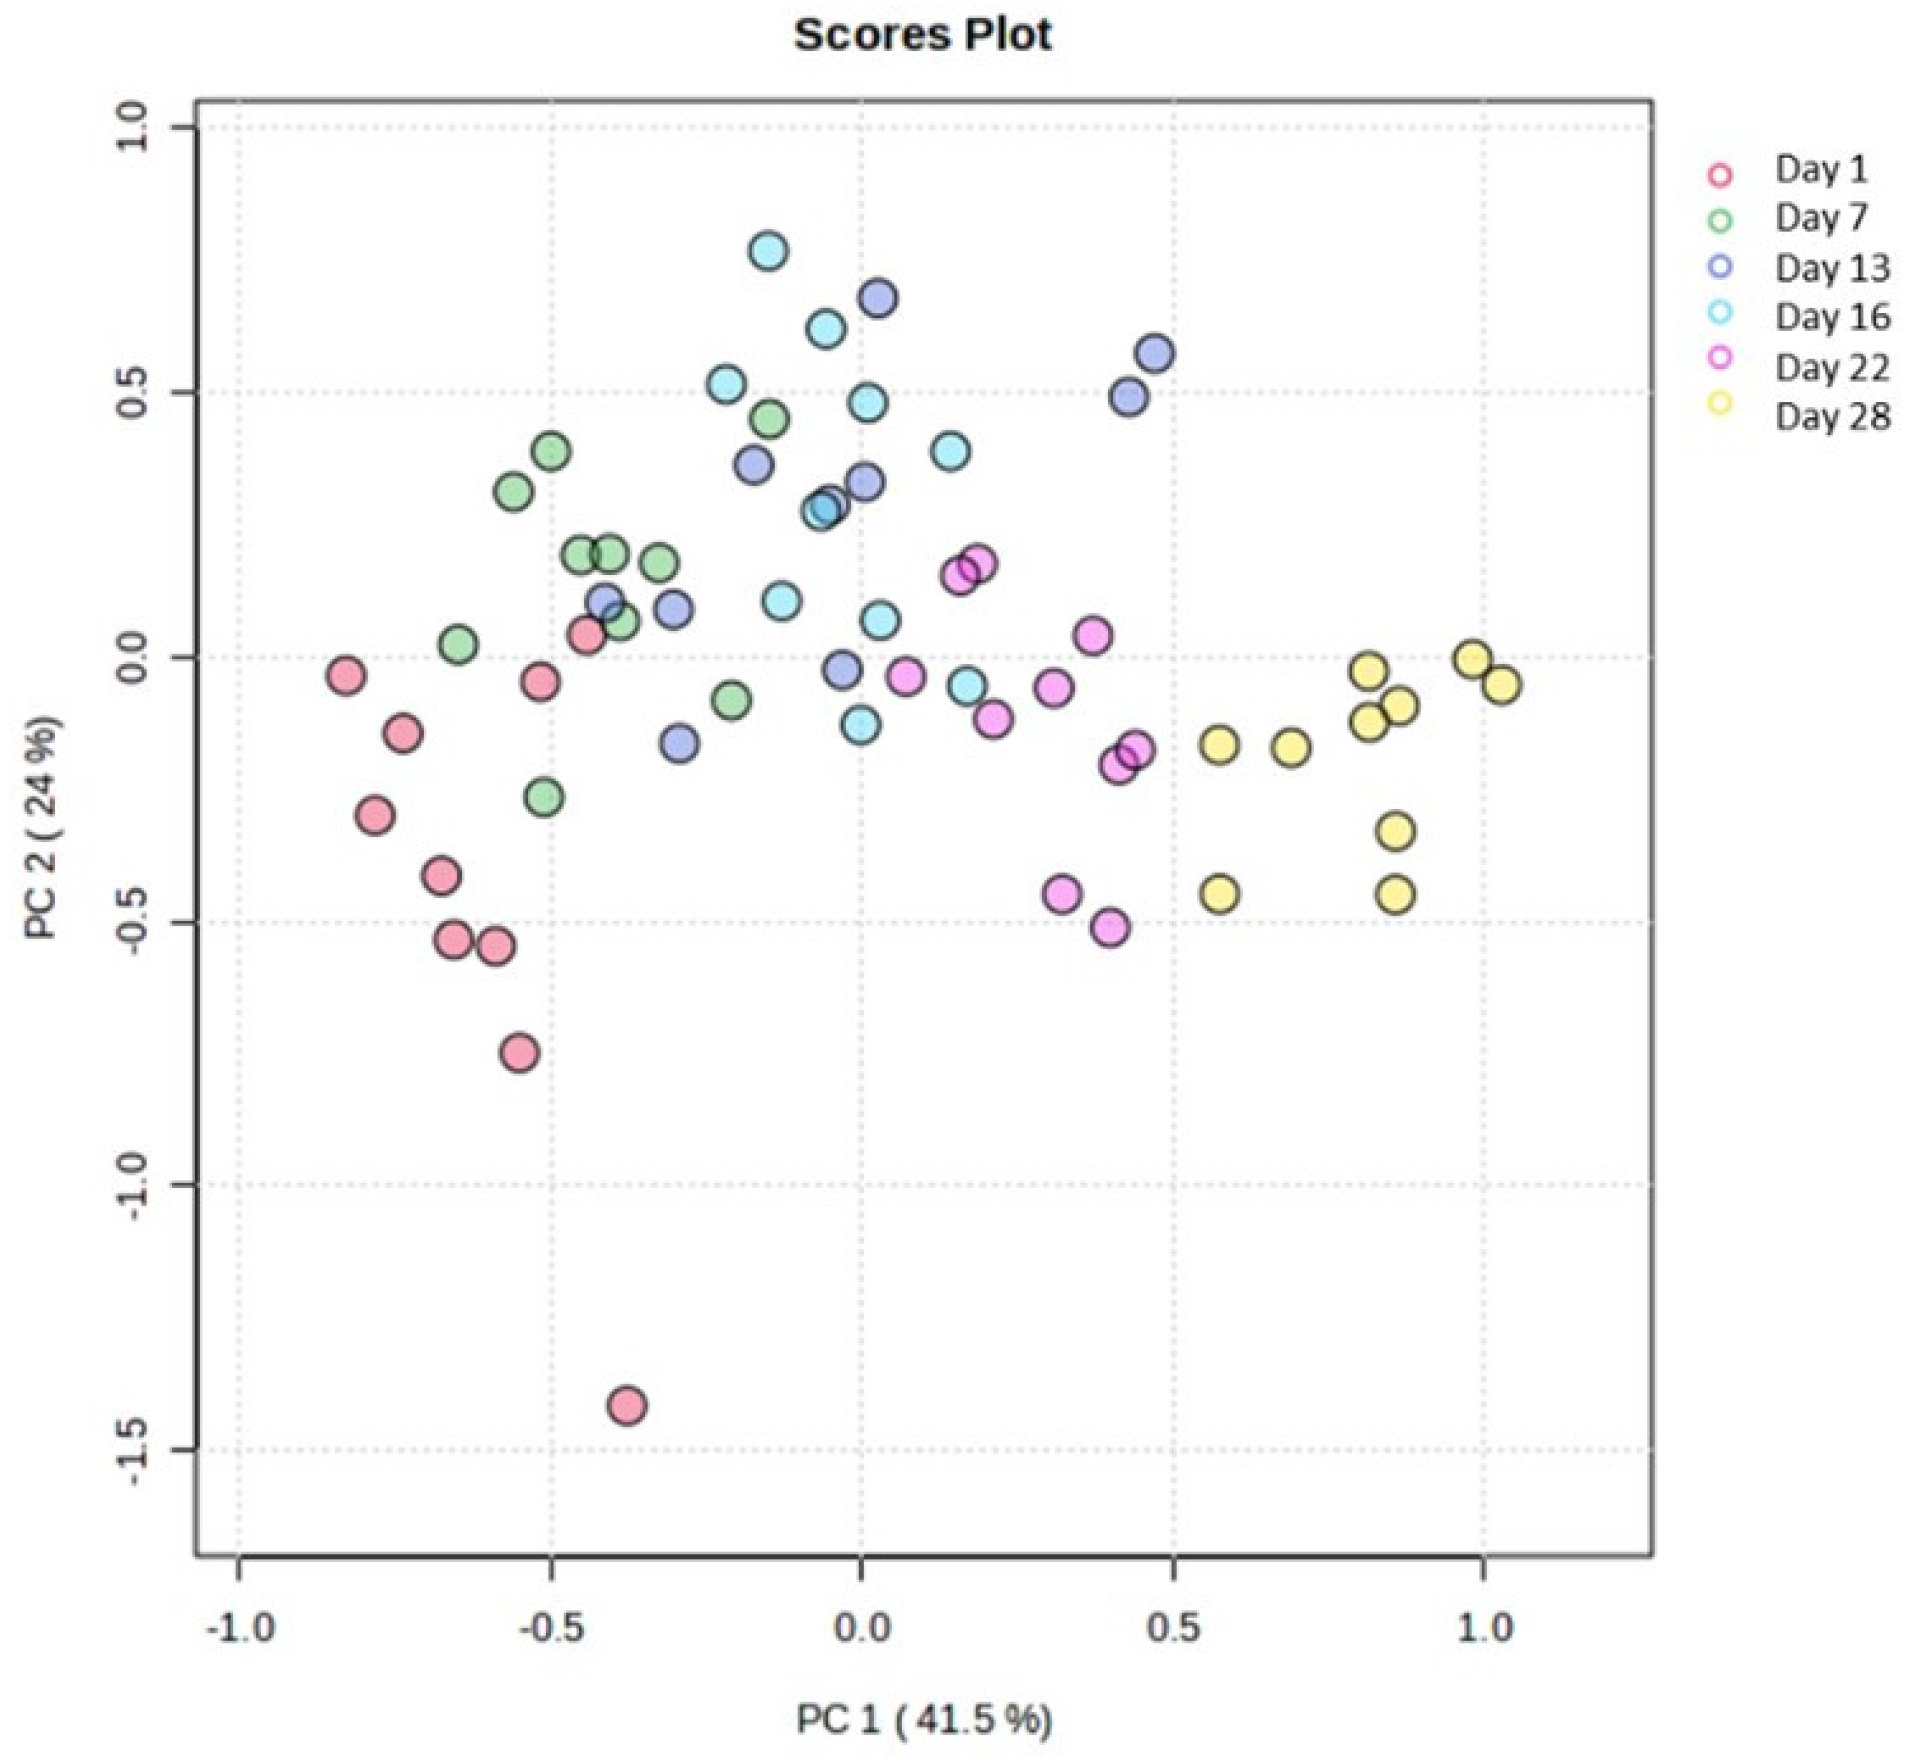
Moreover, the features obtained from physicochemical analysis (L*, a*, b*, h), along with data derived from the texture analysis of cucumber flesh, were also subjected to multivariate statistical analysis by using the Metaboanalyst 6.0 platform. An unsupervised principal component analysis was conducted in order to gain an overview of the sample space. The resulting scores plot (Figure 6) revealed a pattern among the storage days along the first principal component, which accounted for 41.5% of the variance in the studied cucumber samples.
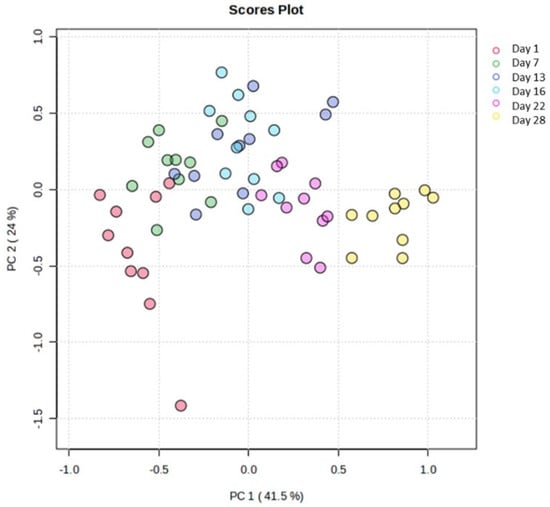
Figure 6.
Scores plot of the PCA. Days’ numbers refer to storage days of the samples.
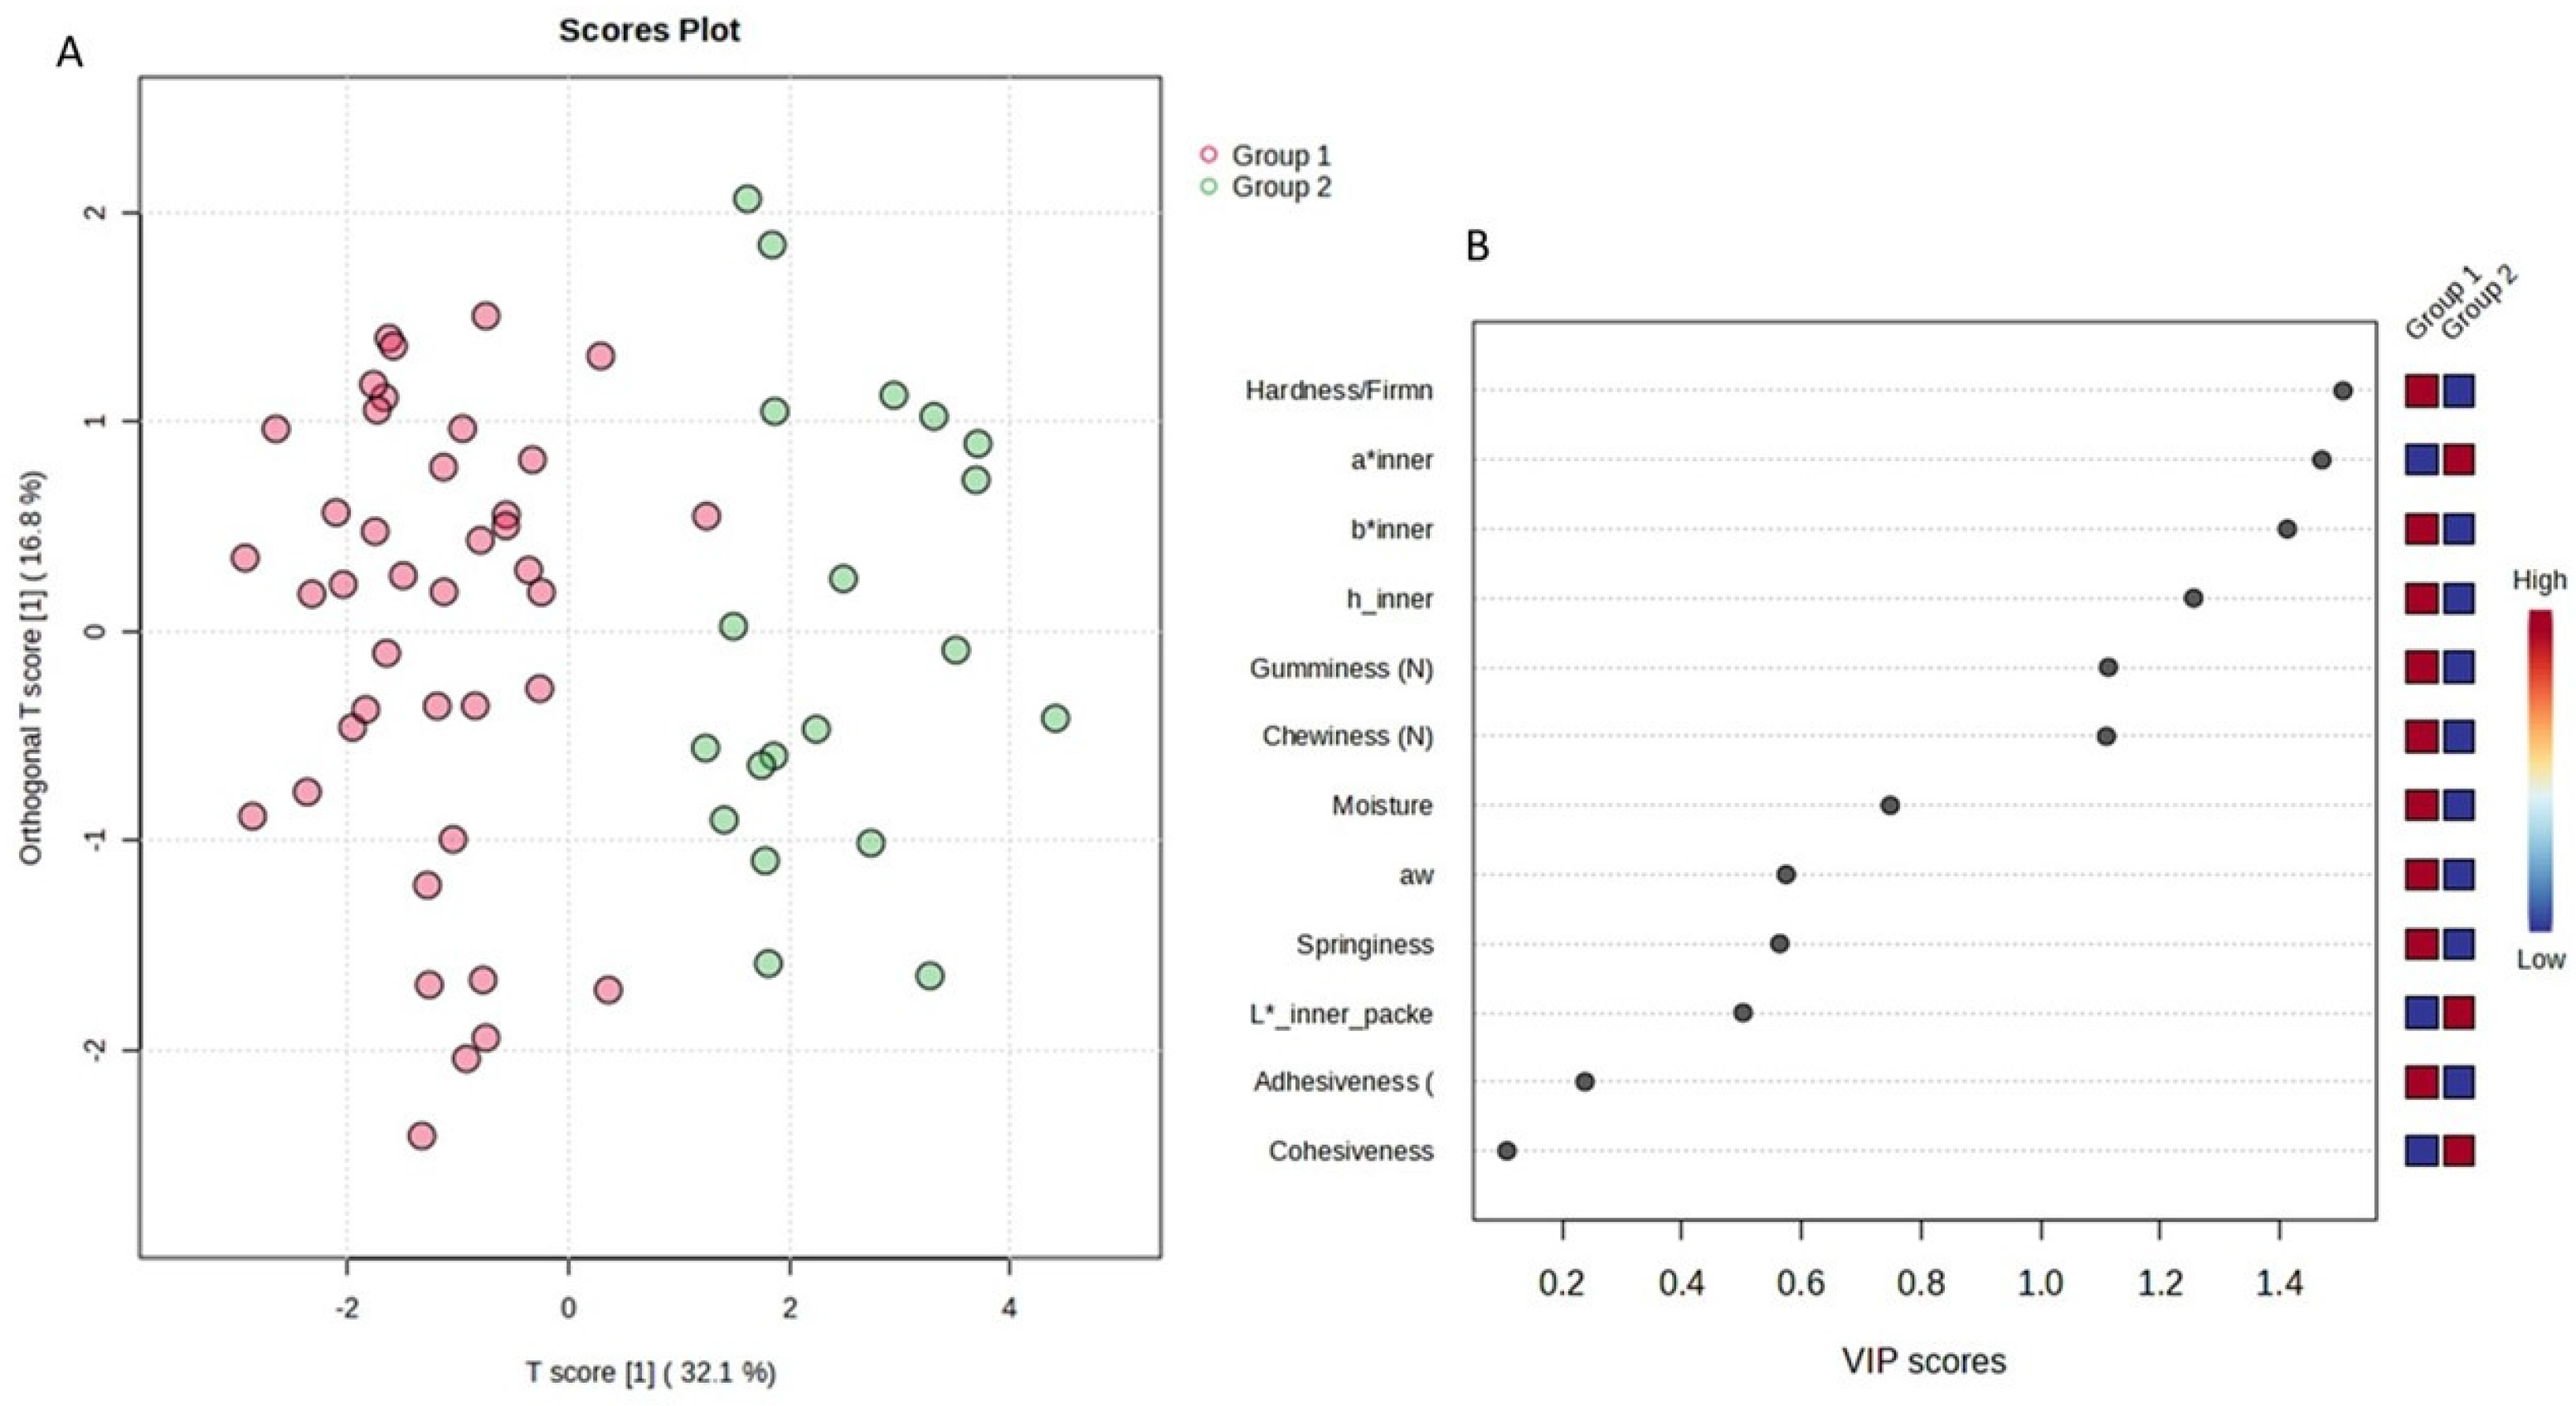
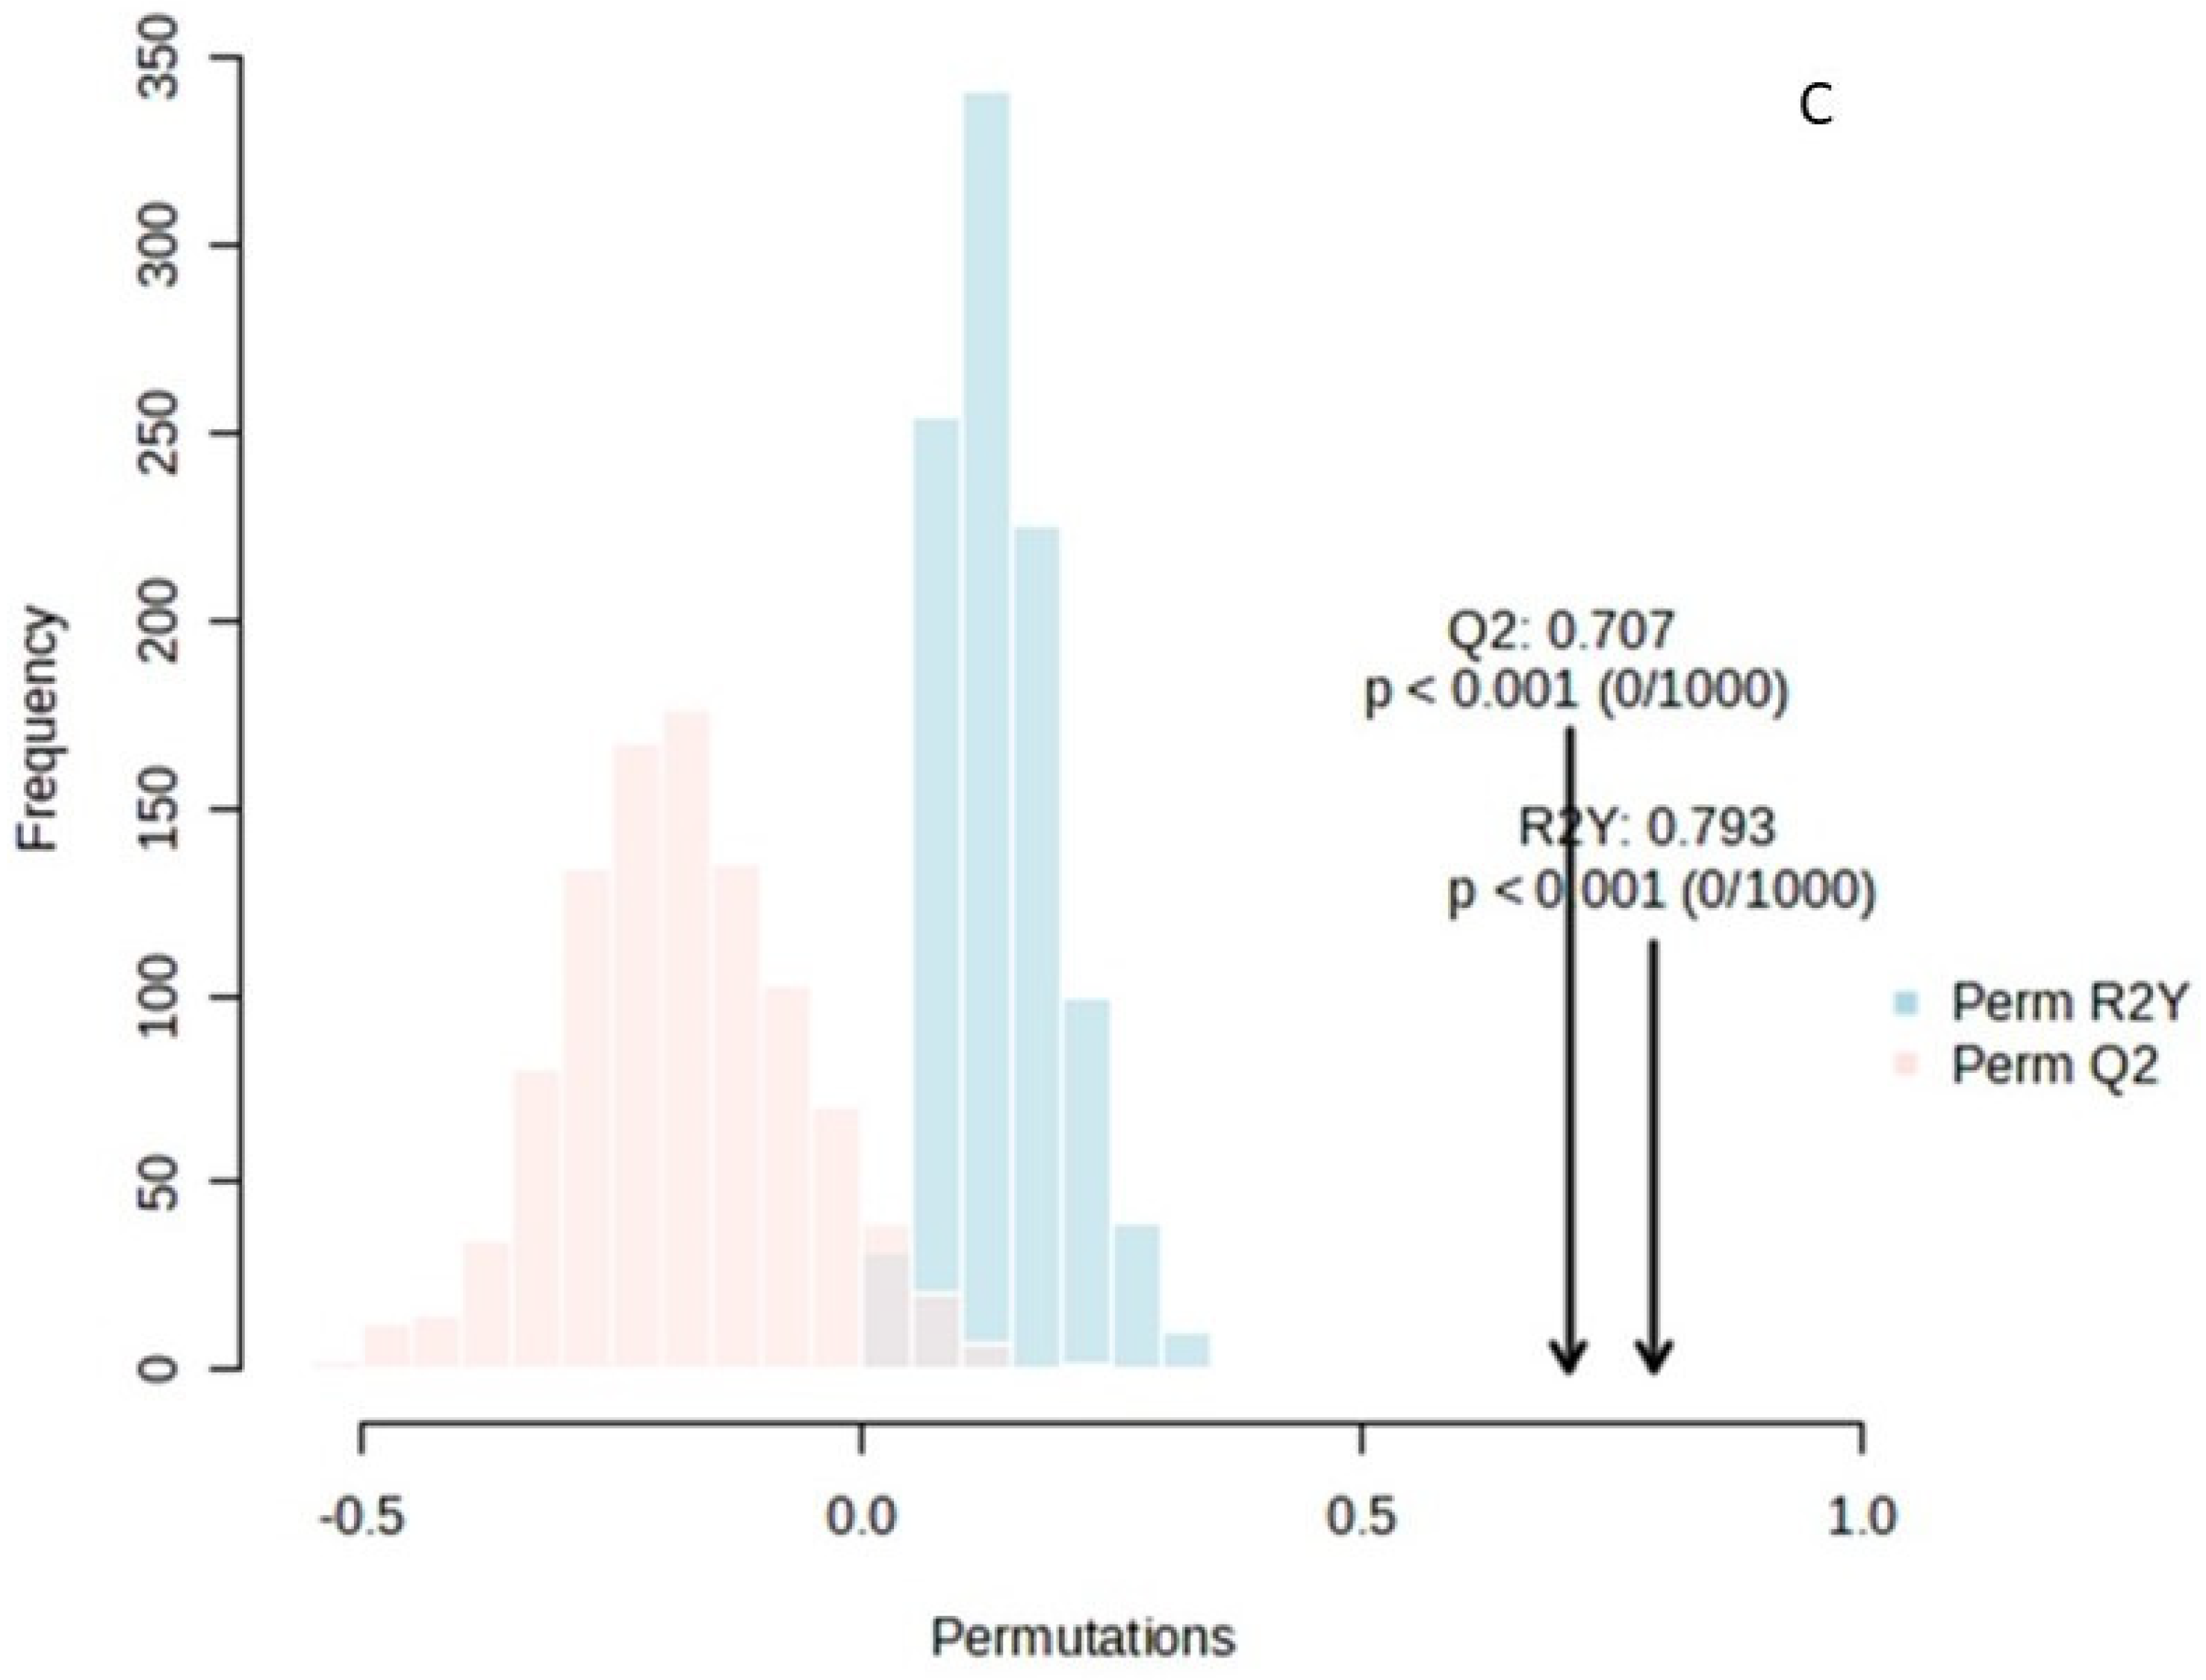
Thus, the sample space was divided into two (2) main groups (day 1 to day 13—Group 1 and day 16 to day 28—Group 2) in order to simulate and draw conclusions about the characteristics of cucumbers under fortnightly storage conditions. Indeed, the supervised orthogonal partial least square–discriminant analysis (OPLS-DA) revealed the separation of the studied groups across the first component (Figure 7A). The variable importance projection (VIP) plot was then drawn to identify the variables with the greatest discriminative ability (VIP > 1) among the two studied groups (Figure 7B). Indicatively, hardness, chewiness, gumminess, a* inner, b* inner, and h inner were the features with the most discriminant power among the two groups (Figure 7B). All models were validated using permutation test statistics (Figure 7C). It is clearly illustrated that the first fortnight is associated with higher values of hardness, b* inner, h inner, chewiness, and gumminess, and lower values of a* inner.
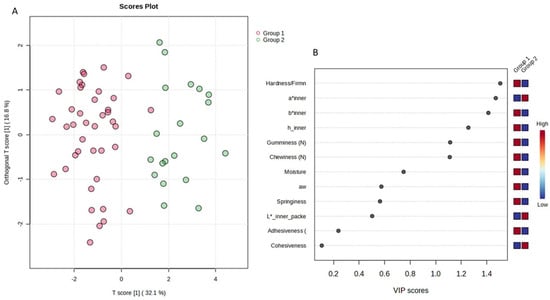

Figure 7.
OPLS-DA analysis for the sample space: (A) score plot of OPLS-DA analysis. The red and green dots correspond to Group 1 and Group 2 classification, respectively; (B) VIP plot of the studied features; (C) validation of the OPLS-DA analysis by permutation test statistics indicates that the extracted model is significantly different from a model built on random data. The permutation tests were carried out with 1000 random permutations, thus providing significance of the model at the 0.001 level (R2Y = 0.793 and Q2 = 0.707).
3.5.3. ATR-FTIR Discriminant Analysis
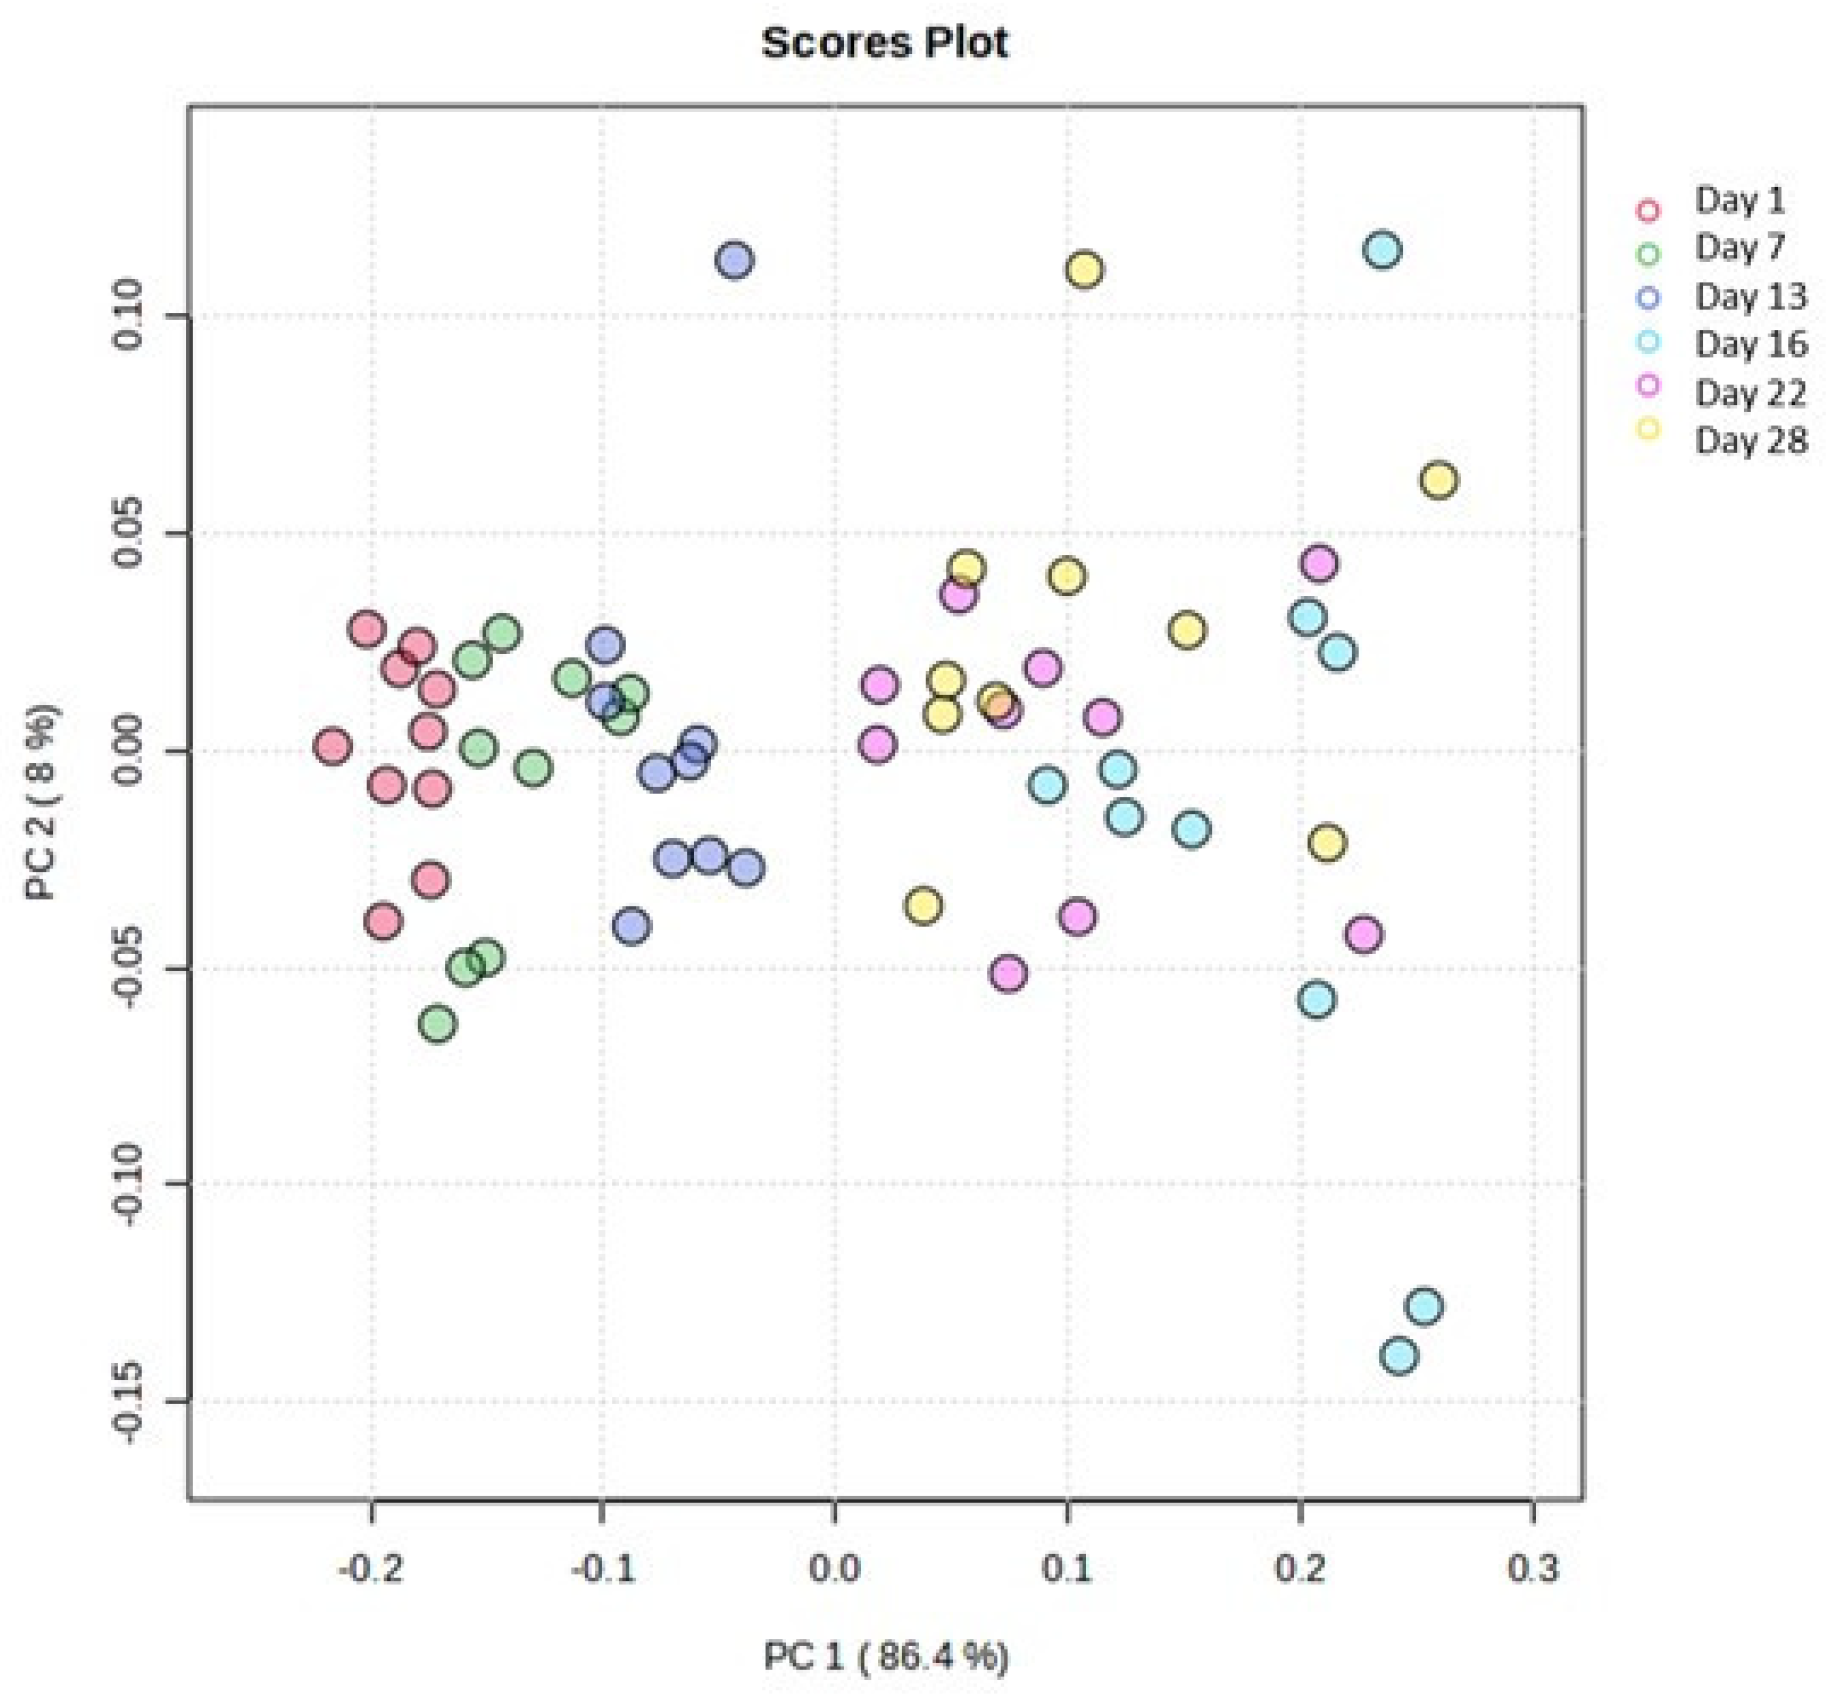
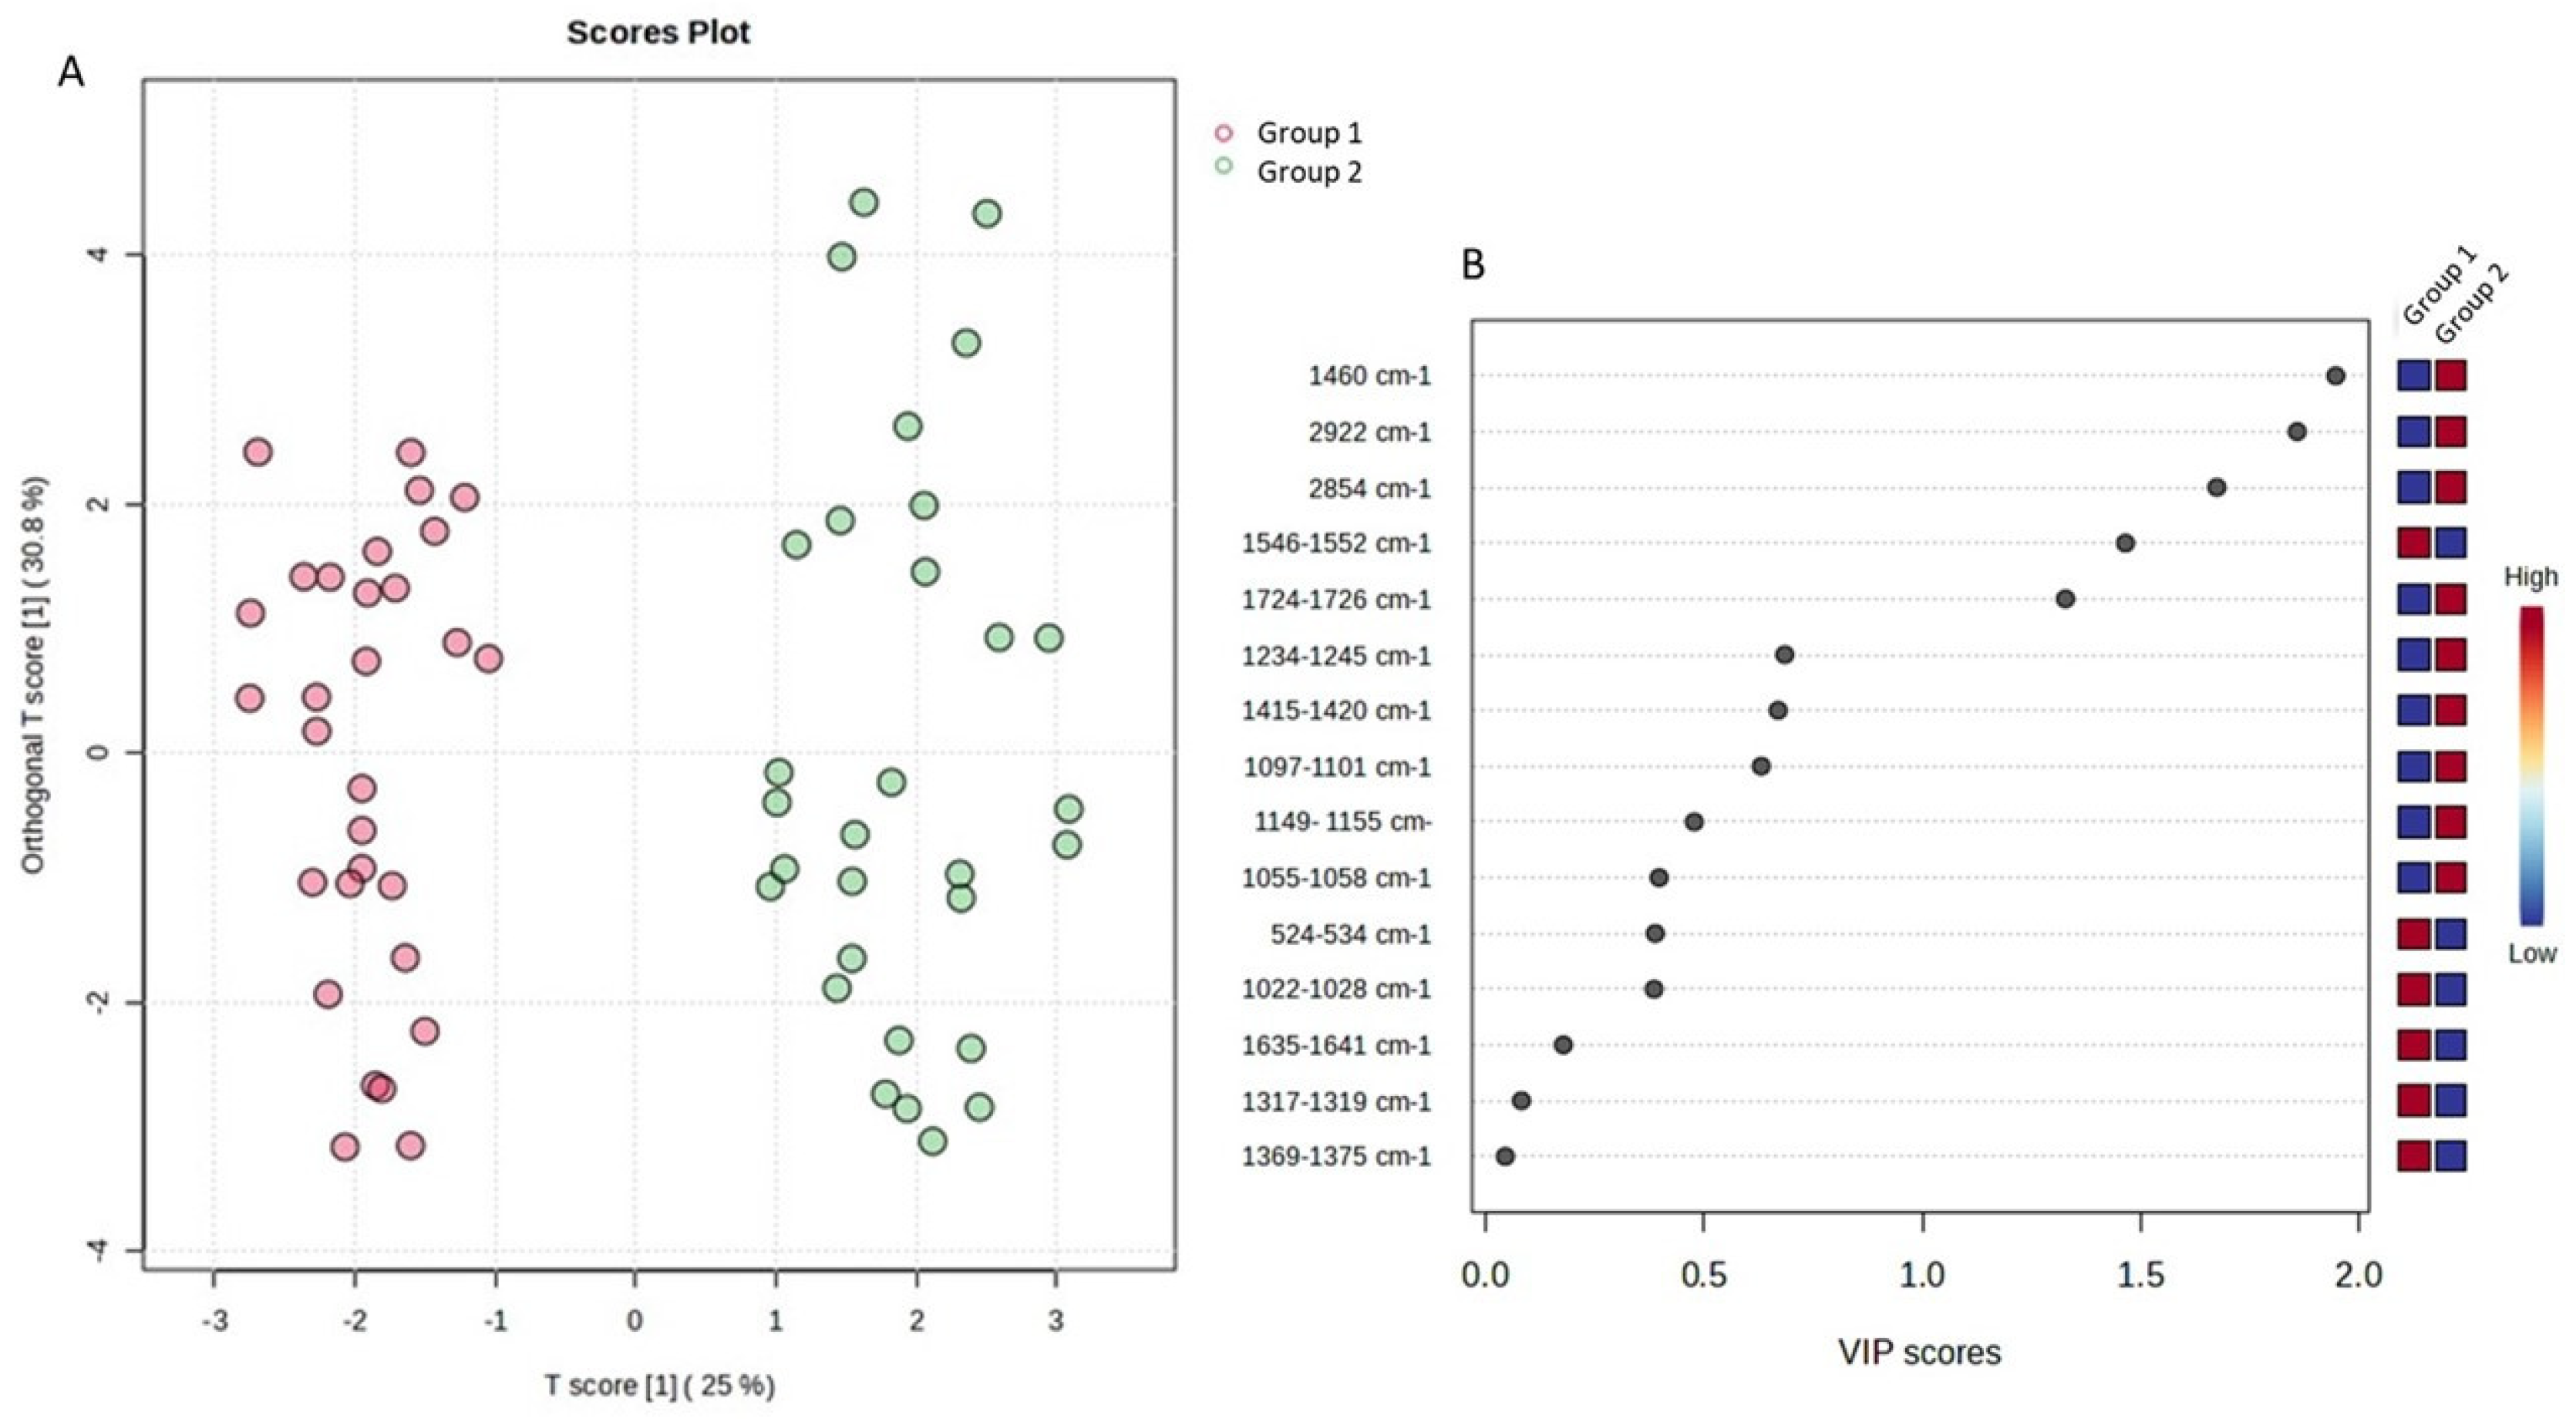
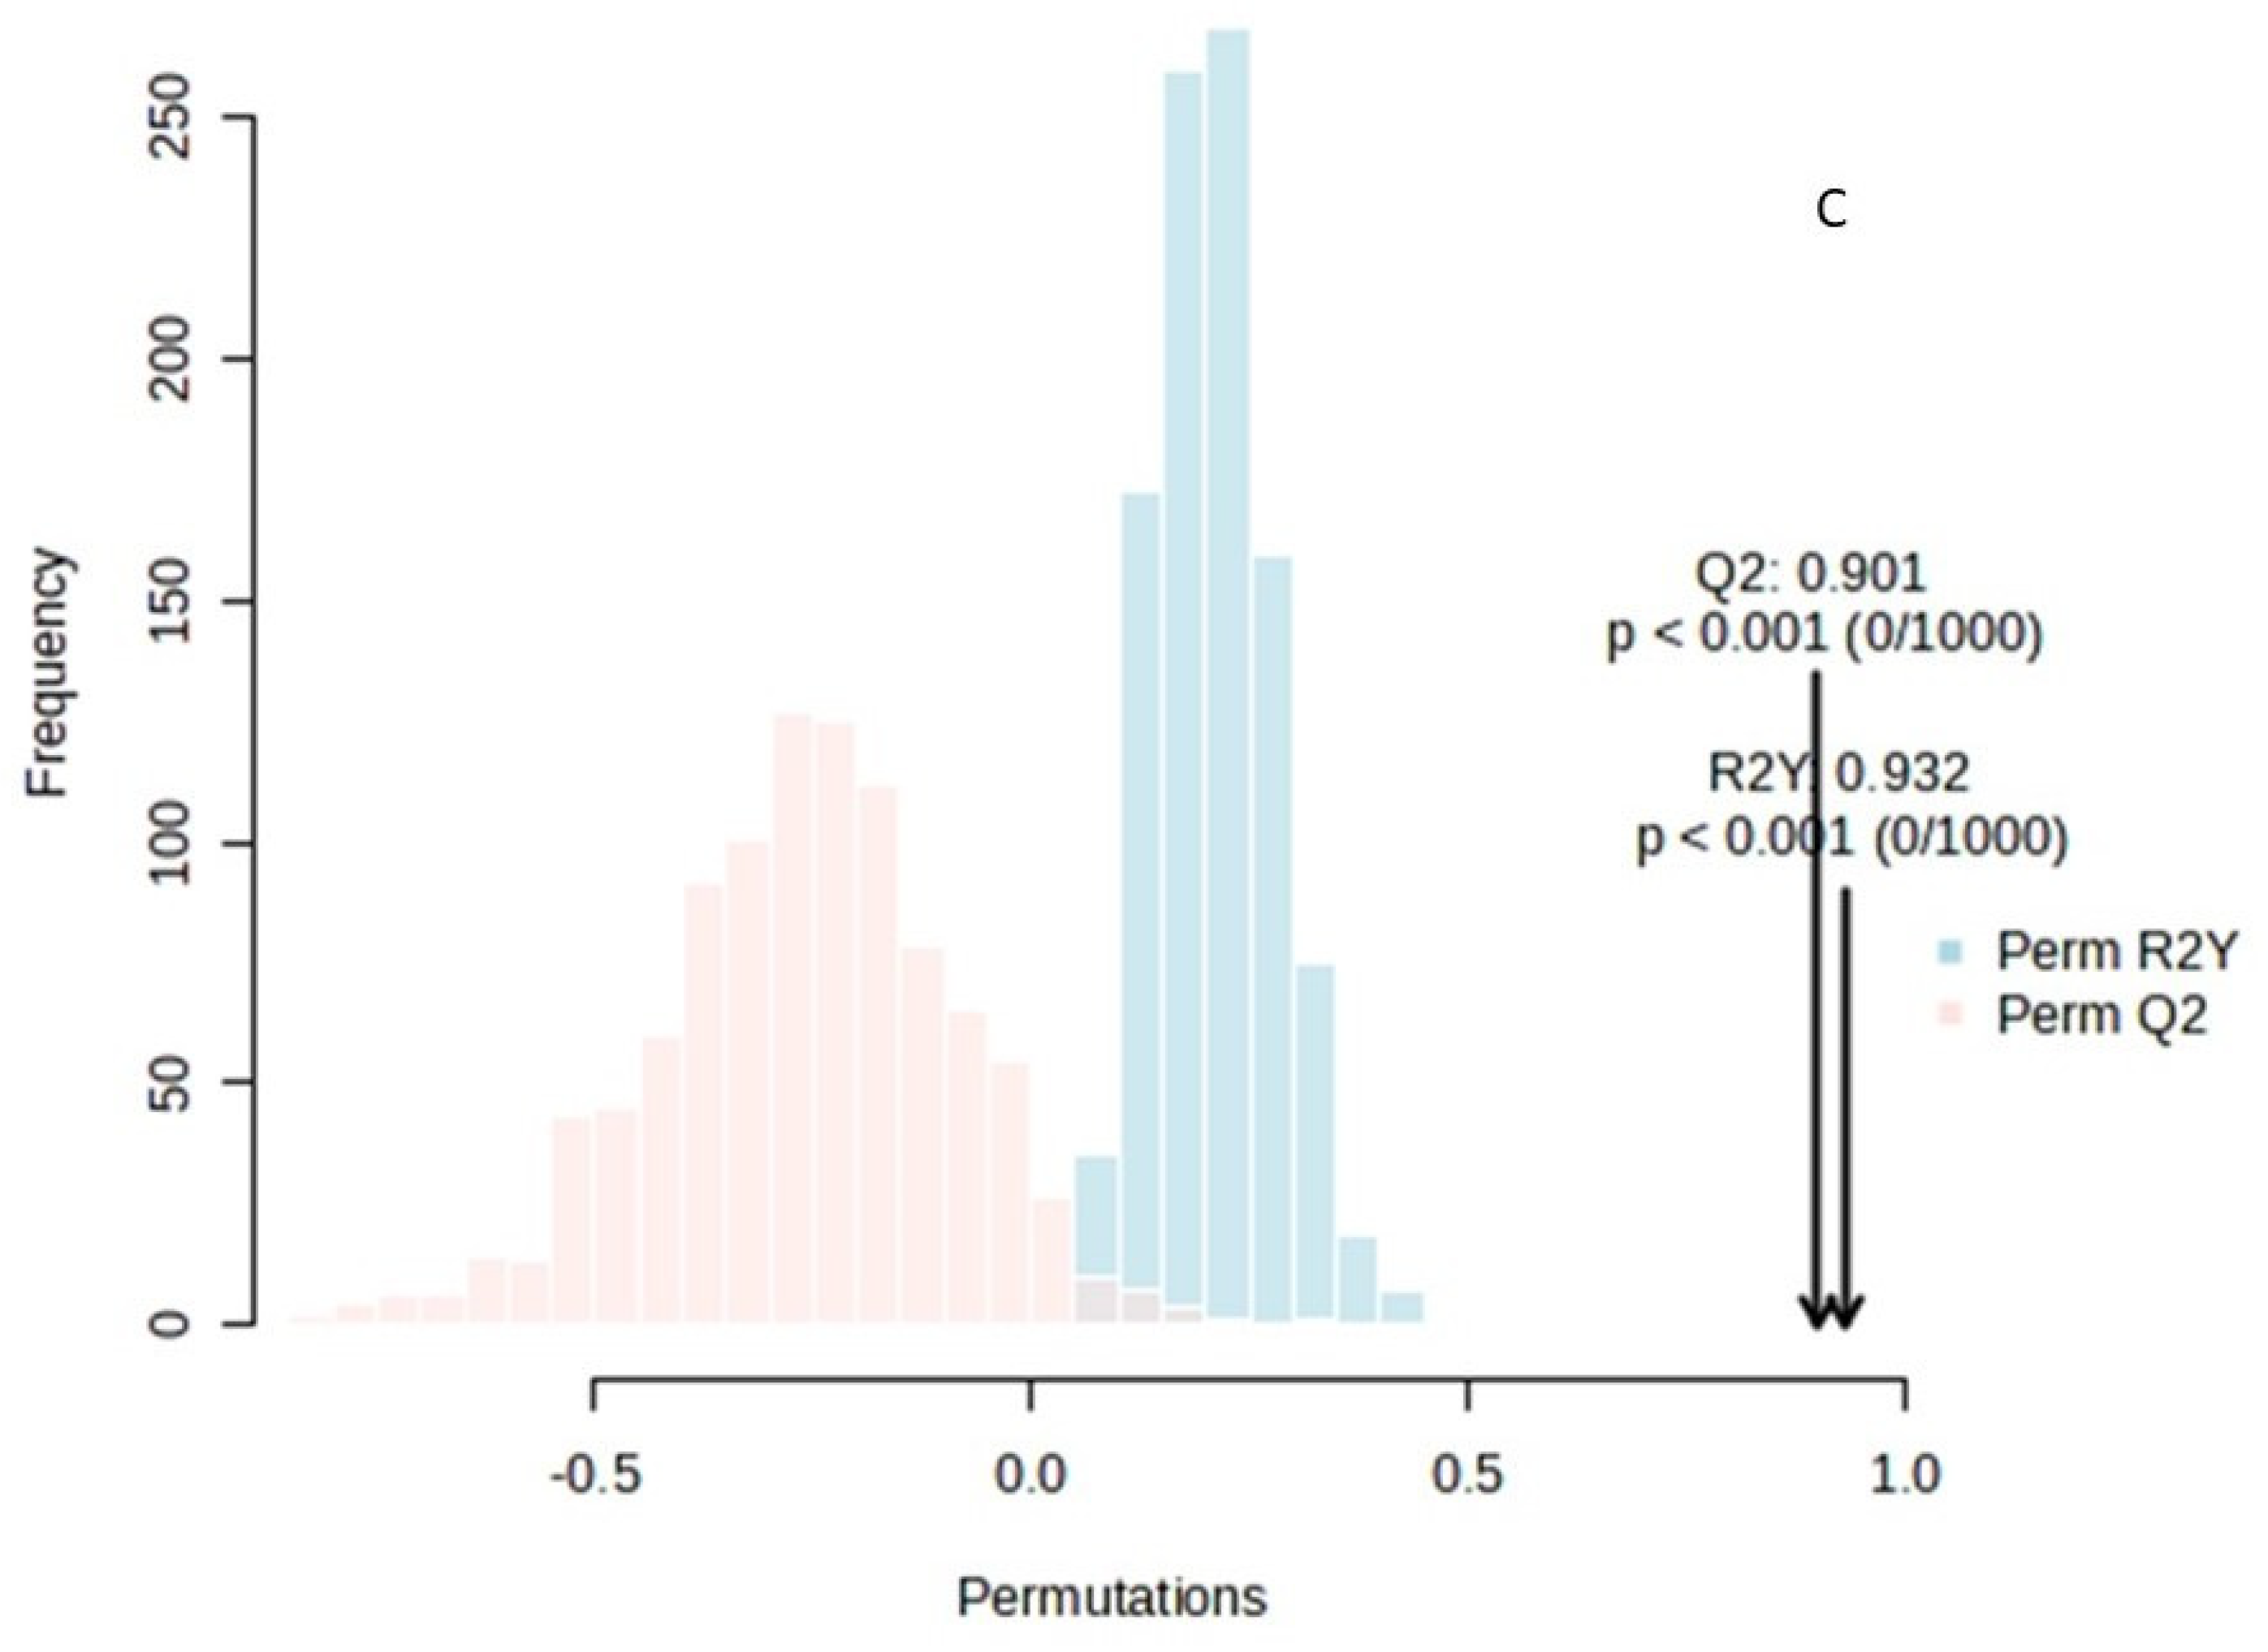
A comparable pattern was observed comparing the ATR-FTIR spectra. In particular, the application of PCA revealed a clear grouping tendency of the samples in relation to the fortnight of storage, as illustrated in Figure 8. Thus, the application of the supervised OPLS-DA and the resulting VIP diagram highlighted the regions of the ATR-FTIR spectra that were responsible for this separation (Figure 9). The region of the spectra with the highest abundance during the first fortnight was found to be 1724–1726 cm−1, while the regions 1460 cm−1, 2922 cm−1, 2854 cm−1 and 1546–1552 cm−1 exhibited greater abundance during the second fortnight of storage.
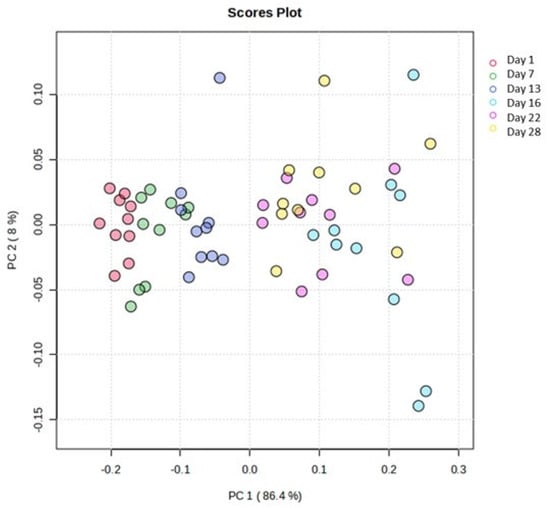
Figure 8.
Scores plot of the PCA. Days’ numbers refer to the storage days of the samples. The variance of projection in the studied groups was calculated at 86.4% along the first principal component.
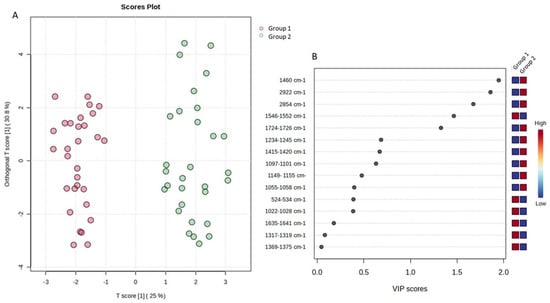

Figure 9.
OPLS-DA analysis for the sample space: (A) score plot of OPLS-DA analysis. The red and green dots correspond to Group 1 and Group 2 classification, respectively; (B) VIP plot of the studied features; (C) validation of the OPLS-DA analysis by permutation test statistics indicates that the extracted model is significantly different from a model built on random data. The permutation tests were carried out with 1000 random permutations, thus providing significance of the model at the 0.001 level (R2Y = 0.932 and Q2 = 0.901).
Overall, the significant variables identified in each individual discriminant analysis model were found to align with the outcomes of the statistical analysis. Moreover, through discrimination, the tendency of the samples to be grouped according to the fortnight of storage was revealed. In fact, the comparative analysis between the two fortnights highlights the dynamic nature of cucumber quality. The findings of this study reveal significant differences in the quality characteristics of cucumbers across the two fortnights, with notable implications for agricultural practices and market strategies.
3.6. Regression Analysis
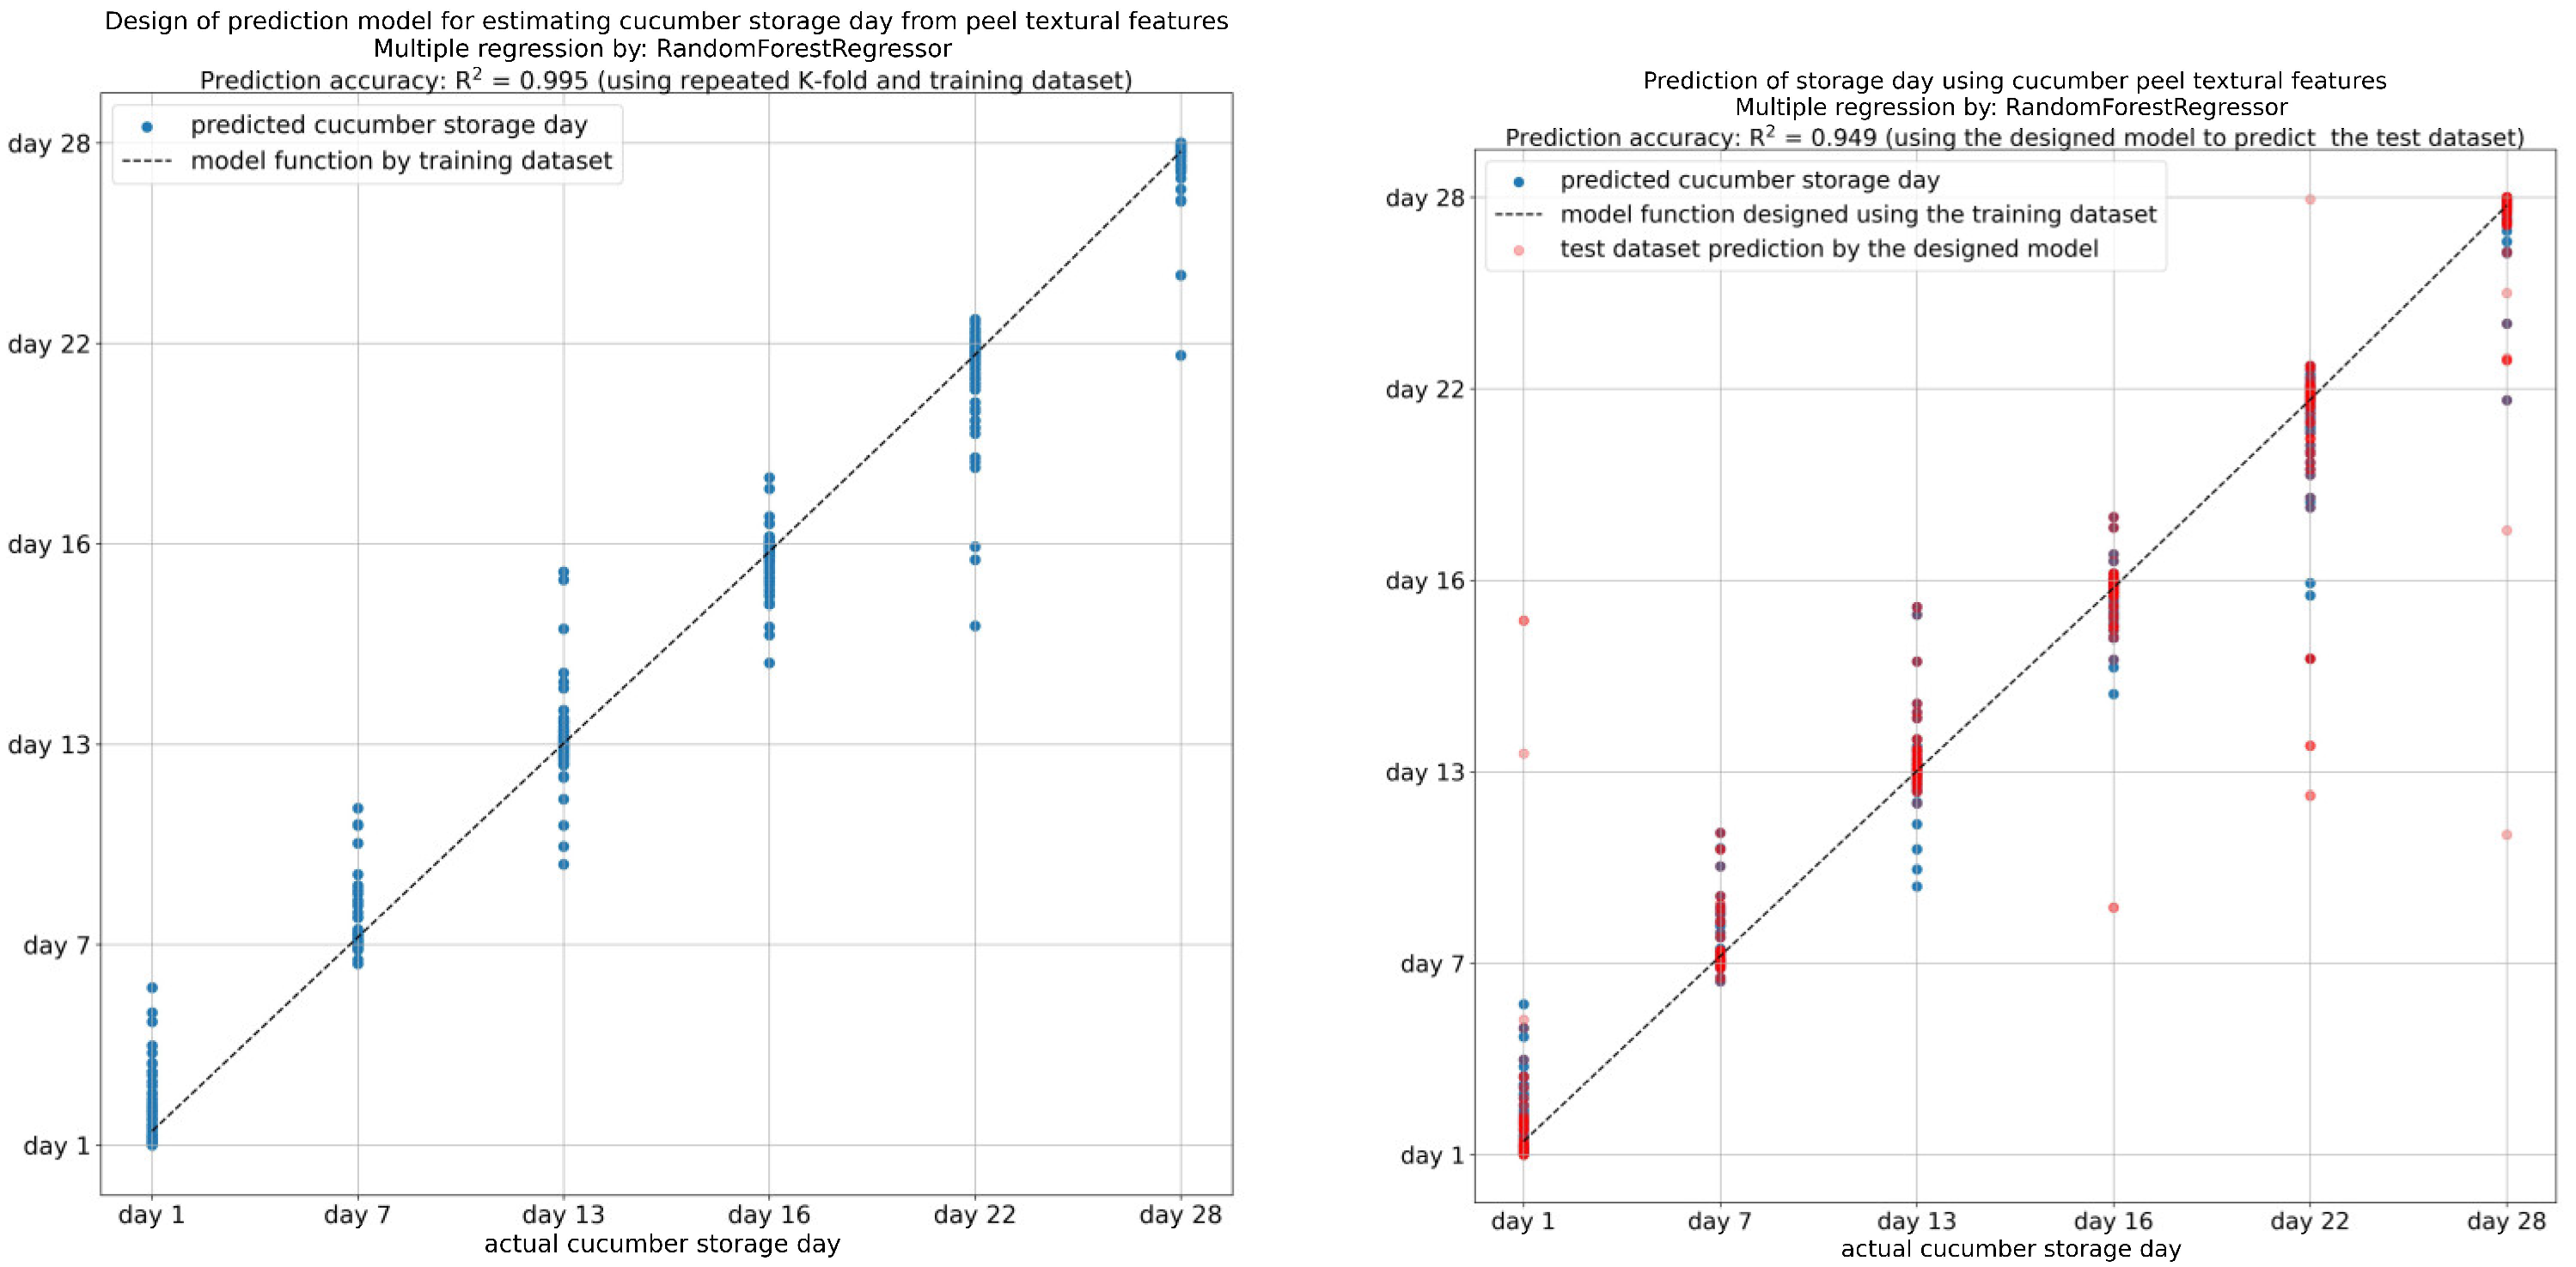
Investigating the quality of fruits and vegetables during their storage is crucial to maintaining consistent quality for consumers and reducing post-harvest spoilage. Consequently, the textural features derived from the image analysis of the cucumber peels were used to develop predictive models for the evaluation of storage time and flesh quality parameters during storage. A gradient-boosting regression model was selected to use for this particular task. Gradient boosting is a machine learning approach that is suitable for both regression and classification assignments. The method involves the construction of multiple decision trees sequentially, rectifying the errors of each tree in turn, thus enhancing the accuracy of the final model. The K-fold evaluation technique was used. In K-fold cross-validation, the dataset is partitioned into K subsets, and the model undergoes training and evaluation K times, with each repetition using a different subset as the test set and the remaining subsets as the training set. This approach aids in obtaining a more dependable estimation of the model’s performance. The coefficient of determination (R-squared, R2) quantifies how well the regression model aligns with the observed data. In a further step, using the features extracted from the cucumber peel images, a regression analysis was performed to create models for cucumber samples’ storage day prediction. The textural features with the highest coefficient of determination (R2 > 0.995) were gray-level non-uniformity (GLN), L*, a*, b*, contrast, mean, correlation, standard deviation, skewness, and long-run emphasis (LRE) (Figure 10). Taken together, the findings showed that a gradient-boosting regression model trained with image-extracted features can effectively predict the storage day of cucumber samples with high accuracy. Other studies in several food matrices have also yielded comparable findings [13,24], thereby underscoring the significance of utilizing image texture analysis results in food preservation research.
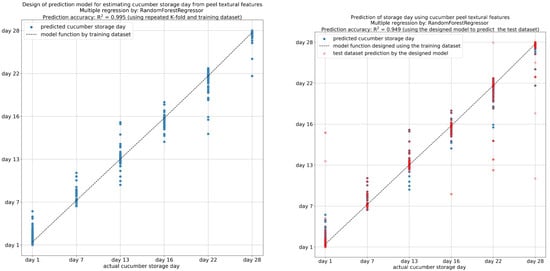
Figure 10.
Prediction of cucumber storage days from textural features of cucumber peel.
In an additional step, the physicochemical quality parameters of cucumber flesh (h angle, moisture, and firmness) were correlated with textural features derived from the grayscale images of the cucumber peel in order to estimate the quality of the cucumbers during the 28-day storage period (Figure 11). The results demonstrated that the standard deviation, contrast (the level of fluctuations in intensity within the image), energy (homogeneity of gray levels in an image), and angular second moment (ASM) (original image’s homogeneity) values of the cucumber peel are reliable indicators of the moisture content of the cucumber flesh (with a mean R2 > 0.96 and a test R2 > 0.93). Moreover, the standard deviation, skewness, kurtosis, and angular second moment (ASM) values of the cucumber peel are effective indicators of the firmness values of the cucumber flesh (with a mean R2 > 0.97 and test R2 > 0.95), whereas the standard deviation, skewness, contrast, and homogeneity of hue angle values (with a mean R2 > 0.98 and test R2 > 0.96) were reliable indicators of the h angle of the cucumber flesh. A predictive modeling application that utilizes the features derived from image analysis can be employed as a tool for the assessment of fruit and vegetable quality and shelf life.
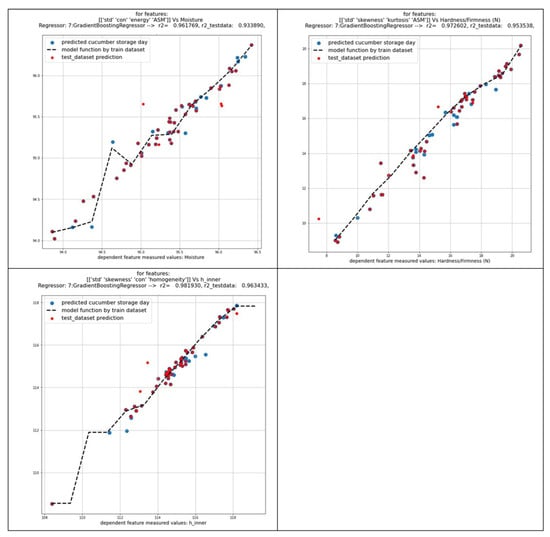
Figure 11.
Prediction of cucumber flesh quality parameters by image textural features of cucumber peel.
4. Conclusions
This study assessed the preservation of greenhouse-cultivated cucumbers (Cucumis sativus) during a 28-day storage period at 15 °C in packaging bags using a combination of non-destructive image textural analysis, infrared spectroscopy, physicochemical analysis, and statistical methods including regression and discriminant analysis. The study demonstrated a significant increase in the total phenolic content and antioxidant/antiradical activity over the storage duration, thereby highlighting the dynamic changes in nutritional properties that occur during storage. Significant alterations in the spectral data corresponded with changes in the phenolic content and antioxidant activity, indicating the potential of FTIR to provide detailed insights into the composition of cucumbers over time. The color analysis revealed chlorophyll degradation, which resulted in the yellowing of the peel, while image analysis demonstrated an increasing dissimilarity and textural disorder, which was particularly evident by the 13th day of storage. In addition, changes in color parameters, such as hue angle, were closely monitored and were found to be reliable indicators of the cucumbers’ freshness and overall quality. The utilization of image analysis proved to be a valuable, non-destructive method for the assessment and classification of cucumber quality. This technique enabled the extraction of key quality parameters from the peel, thereby offering insights into the internal quality attributes of the cucumbers. Predictive models, constructed from image analysis data, showed promise in estimating the quality and shelf life of cucumbers.
Despite the fact that the present study employs a holistic approach to the quality assessment of cucumbers, it is still characterized by limitations that should be further investigated. More specifically, the image analysis, although effective, mostly relies on specific software and algorithms, which might limit reproducibility if different tools are used. Furthermore, the integration of microbial stability and sensory evaluation could provide a more comprehensive understanding of cucumber quality during storage. As a step further, a comparative study of the impact of different preservation methods may also provide new insights into the progression of cucumber quality.
Overall, this study highlights the significance of controlled storage conditions in preserving cucumber quality and provides a comprehensive methodology for monitoring post-harvest changes. By integrating advanced analytical techniques, this research enhances the understanding and the ability to manage fruit and vegetable shelf life, thereby contributing to the development of more effective storage and distribution strategies. This study highlights the potential of combining instrumental and image analysis techniques with statistical methods to improve the monitoring and prediction of cucumber quality, thereby supporting the fresh produce supply chain.
Author Contributions
Conceptualization, V.J.S., P.Z. and D.C.; methodology P.C., G.L., K.T., D.C., V.J.S. and E.K.; software D.C. and P.C.; validation T.T. and E.K.; formal analysis, T.T., P.C. and E.K.; investigation V.J.S., P.Z., D.C., P.C., G.L., K.T., E.K. and T.T.; resources, P.C.; data curation, P.C., D.C.; writing—original draft preparation V.J.S., G.L., P.C. and K.T.; writing—review and editing E.K., V.J.S. and T.T.; visualization, P.C. and D.C.; supervision V.J.S. and P.Z.; project administration, V.J.S. All authors have read and agreed to the published version of the manuscript.
Funding
This research received no external funding.
Institutional Review Board Statement
Not applicable.
Informed Consent Statement
Not applicable.
Data Availability Statement
The data presented in this study are available on request from the corresponding author.
Acknowledgments
We are grateful to “Thrace Greenhouses S.A” for kindly providing the cucumber samples. We are grateful to Kyriakaki Charikleia for her valuable help with physicochemical analyses.
Conflicts of Interest
The authors declare no conflicts of interest.
References
- Food and Agriculture Organization. FAOSTAT. Available online: https://www.fao.org/home/en/ (accessed on 1 June 2024).
- Wdowikowska, A.; Reda, M.; Kabała, K.; Chohura, P.; Jurga, A.; Janiak, K.; Janicka, M. Water and Nutrient Recovery for Cucumber Hydroponic Cultivation in Simultaneous Biological Treatment of Urine and Grey Water. Plants 2023, 12, 1286. [Google Scholar] [CrossRef] [PubMed]
- Sotiroudis, G.; Melliou, E.; Sotiroudis, T.G.; Chinou, I. Chemical analysis, antioxidant and antimicrobial activity of three Greek cucumber (Cucumis sativus) cultivars. J. Food Biochem. 2010, 34, 61–78. [Google Scholar] [CrossRef]
- Uthpala, T.G.; Marapana, R.A.U.; Lakmini, K.P.; Wettimuny, D.C. Nutritional Bioactive Compounds and Health Benefits of Fresh and Processed Cucumber (Cucumis sativus L.). Sumerianz J. Biotechnol. 2020, 3, 75–82. [Google Scholar] [CrossRef]
- Kaur, P.; Devgan, K.; Kumar, N.; Kaur, A.; Kumar, M.; Sandhu, K. Quality retention and shelf-life prolongation of cucumbers (Cucumis sativus L.) under different cool storage systems with passive modified atmosphere bulk packaging. Packag. Technol. Sci. 2021, 34, 567–578. [Google Scholar] [CrossRef]
- Mukherjee, P.K.; Nema, N.K.; Maity, N.; Sarkar, B.K. Phytochemical and therapeutic potential of cucumber. Fitoterapia 2013, 84, 227–236. [Google Scholar] [CrossRef] [PubMed]
- Jahan, S.E.; Hassan, M.K.; Roy, S.; Ahmed, Q.M.; Hasan, G.N.; Muna, A.Y.; Sarkar, M.N. Effects of different postharvest treatments on nutritional quality and shelf life of cucumber. Asian J. Crop Soil Plan. Nutr. 2020, 2, 51–61. [Google Scholar] [CrossRef]
- Eskin, M. Quality and Preservation of Vegetables, 1st ed.; Eskin, N.A.M., Ed.; CRC Press: Boca Raton, FL, USA, 2021; ISBN 978-1-00-321038-2. [Google Scholar]
- Chen, C.; Zhou, G.; Chen, J.; Liu, X.; Lu, X.; Chen, H.; Tian, Y. Integrated Metabolome and Transcriptome Analysis Unveils Novel Pathway Involved in the Formation of Yellow Peel in Cucumber. Int. J. Mol. Sci. 2021, 22, 1494. [Google Scholar] [CrossRef]
- Kevers, C.; Falkowski, M.; Tabart, J.; Defraigne, J.-O.; Dommes, J.; Pincemail, J. Evolution of Antioxidant Capacity during Storage of Selected Fruits and Vegetables. J. Agric. Food Chem. 2007, 55, 8596–8603. [Google Scholar] [CrossRef]
- Thirupathi Vasuki, M.; Kadirvel, V.; Pejavara Narayana, G. Smart packaging—An overview of concepts and applications in various food industries. Food Bioeng. 2023, 2, 25–41. [Google Scholar] [CrossRef]
- Sinanoglou, V.J.; Tsiaka, T.; Aouant, K.; Mouka, E.; Ladika, G.; Kritsi, E.; Konteles, S.J.; Ioannou, A.-G.; Zoumpoulakis, P.; Strati, I.F.; et al. Quality Assessment of Banana Ripening Stages by Combining Analytical Methods and Image Analysis. Appl. Sci. 2023, 13, 3533. [Google Scholar] [CrossRef]
- Ladika, G.; Strati, I.F.; Tsiaka, T.; Cavouras, D.; Sinanoglou, V.J. On the Assessment of Strawberries’ Shelf-Life and Quality, Based on Image Analysis, Physicochemical Methods, and Chemometrics. Foods 2024, 13, 234. [Google Scholar] [CrossRef] [PubMed]
- Giannakourou, M.C.; Stavropoulou, N.; Tsironi, T.; Lougovois, V.; Kyrana, V.; Konteles, S.J.; Sinanoglou, V.J. Application of hurdle technology for the shelf life extension of European eel (Anguilla anguilla) fillets. Aquac. Fish. 2023, 8, 393–402. [Google Scholar] [CrossRef]
- Andreou, V.; Strati, I.F.; Fotakis, C.; Liouni, M.; Zoumpoulakis, P.; Sinanoglou, V.J. Herbal distillates: A new era of grape marc distillates with enriched antioxidant profile. Food Chem. 2018, 253, 171–178. [Google Scholar] [CrossRef]
- Lantzouraki, D.Z.; Sinanoglou, V.J.; Zoumpoulakis, P.G.; Glamočlija, J.; Ćirić, A.; Soković, M.; Heropoulos, G.; Proestos, C. Antiradical–antimicrobial activity and phenolic profile of pomegranate (Punica granatum L.) juices from different cultivars: A comparative study. RSC Adv. 2015, 5, 2602–2614. [Google Scholar] [CrossRef]
- Lantzouraki, D.Z.; Sinanoglou, V.J.; Zoumpoulakis, P.; Proestos, C. Comparison of the Antioxidant and Antiradical Activity of Pomegranate (Punica granatum L.) by Ultrasound-Assisted and Classical Extraction. Anal. Lett. 2016, 49, 969–978. [Google Scholar] [CrossRef]
- Manninen, H.; Paakki, M.; Hopia, A.; Franzén, R. Measuring the green color of vegetables from digital images using image analysis. LWT-Food Sci. Technol. 2015, 63, 1184–1190. [Google Scholar] [CrossRef]
- Ebrahimi, P.; Shokramraji, Z.; Tavakkoli, S.; Mihaylova, D.; Lante, A. Chlorophylls as Natural Bioactive Compounds Existing in Food By-Products: A Critical Review. Plants 2023, 12, 1533. [Google Scholar] [CrossRef]
- Trong, L.V.; Phuong, H.T.; Thinh, B.B. Changes in the Physiological and Biochemical Parameters of Cucumber (Cucumis sativus L.) during Fruit Development. FWIAFE 2023, 16, 143–154. [Google Scholar] [CrossRef]
- Subhashree, S.N.; Sunoj, S.; Xue, J.; Bora, G.C. Quantification of browning in apples using colour and textural features by image analysis. Food Qual. Saf. 2017, 1, 221–226. [Google Scholar] [CrossRef]
- Meenu, M.; Kurade, C.; Neelapu, B.C.; Kalra, S.; Ramaswamy, H.S.; Yu, Y. A concise review on food quality assessment using digital image processing. Trends Food Sci. Technol. 2021, 118, 106–124. [Google Scholar] [CrossRef]
- Palumbo, M.; Cefola, M.; Pace, B.; Attolico, G.; Colelli, G. Computer vision system based on conventional imaging for non-destructively evaluating quality attributes in fresh and packaged fruit and vegetables. Postharvest Biol. Technol. 2023, 200, 112332. [Google Scholar] [CrossRef]
- Kritsi, E.; Ladika, G.; Stavropoulou, N.A.; Oikonomakou, M.; Ioannou, A.-G.; Christodoulou, P.; Konteles, S.J.; Cavouras, D.; Sinanoglou, V.J. Evaluation of the Quality Changes in Three Commercial Pastourma Samples during Refrigerated Storage Using Physicochemical, Microbiological, and Image Analyses Combined with Chemometrics. Foods 2024, 13, 1017. [Google Scholar] [CrossRef] [PubMed]
- Kozłowicz, K.; Różyło, R.; Gładyszewska, B.; Matwijczuk, A.; Gładyszewski, G.; Chocyk, D.; Samborska, K.; Piekut, J.; Smolewska, M. Identification of sugars and phenolic compounds in honey powders with the use of GC–MS, FTIR spectroscopy, and X-ray diffraction. Sci. Rep. 2020, 10, 16269. [Google Scholar] [CrossRef] [PubMed]
- Nandiyanto, A.B.D.; Oktiani, R.; Ragadhita, R. How to Read and Interpret FTIR Spectroscope of Organic Material. Indones. J. Sci. Technol. 2019, 4, 97. [Google Scholar] [CrossRef]
- Ajayi, A.A.; Vining-Ogu, I.C.; Akalonu, X.C.; Danladi, J.G.; Briggs, T.A.; Chukwu-Eze, U.S. Evaluation of Selected Organic Acids in some common Fruits Cucumber, Water Melon, Soursop in Ebonyi State, Nigeria. Int. J. Res. Innov. Appl. Sci. 2023, 8, 15–18. Available online: https://www.rsisinternational.org/journals/ijrias/DigitalLibrary/volume-8-issue-1/15-18.pdf (accessed on 12 September 2024).
- Abdul Hakim, B.N.; Xuan, N.J.; Oslan, S.N.H. A Comprehensive Review of Bioactive Compounds from Lactic Acid Bacteria: Potential Functions as Functional Food in Dietetics and the Food Industry. Foods 2023, 12, 2850. [Google Scholar] [CrossRef]
- Hong, T.; Yin, J.-Y.; Nie, S.-P.; Xie, M.-Y. Applications of infrared spectroscopy in polysaccharide structural analysis: Progress, challenge and perspective. Food Chem. X 2021, 12, 100168. [Google Scholar] [CrossRef]
- Wiercigroch, E.; Szafraniec, E.; Czamara, K.; Pacia, M.Z.; Majzner, K.; Kochan, K.; Kaczor, A.; Baranska, M.; Malek, K. Raman and infrared spectroscopy of carbohydrates: A review. Spectrochim. Acta Part A Mol. Biomol. Spectrosc. 2017, 185, 317–335. [Google Scholar] [CrossRef]
- John, S.; Priyadarshini, S.; Monica, S.J.; Sivaraj, C.; Arumugam, P. In vitro antioxidant and antimicrobial properties of cucumis sativus l. peel extracts. Int. Res. J. Pharm. 2018, 9, 56–60. [Google Scholar] [CrossRef]
- Balouchi, Z. Changes of antioxidant compounds of broccoli (Brassica oleracea L.Var. Italica) during storage at low and high temperatures. South West. J. Hortic. Biol. Environ. 2011, 2, 193–212. [Google Scholar]
- Muralidhara, B.M.; Veena, G.L.; Rajan, S.; Bhattacherjee, A.K.; Malav, P.K. Effect of post harvest ripening on bioactive secondary metabolites and antioxidant activity in mango cv. Amrapali. J. Hortic. Sci. 2018, 13, 152–158. [Google Scholar] [CrossRef]
- Bilgin, Ö.F.; Nogay, G.; Kafkas, N.E.; Kafkas, S. Some Fruit Quality Characteristics of ‘Grand Naine’ Banana Fruits during Various Ripening Stages. Int. J. Agric. For. Life Sci. 2022, 6, 24–27. [Google Scholar]
- Kritsi, E.; Tsiaka, T.; Sotiroudis, G.; Mouka, E.; Aouant, K.; Ladika, G.; Zoumpoulakis, P.; Cavouras, D.; Sinanoglou, V.J. Potential Health Benefits of Banana Phenolic Content during Ripening by Implementing Analytical and In Silico Techniques. Life 2023, 13, 332. [Google Scholar] [CrossRef]
- Al-Hadrami, A.; Pathare, P.B.; Al-Dairi, M.; Al-Mahdouri, A. Investigation of Bruise Damage and Storage on Cucumber Quality. AgriEngineering 2023, 5, 855–875. [Google Scholar] [CrossRef]
- Adamicki, F. Effects of storage temperature and wrapping on the keeping quality of cucumber fruits. Acta Hortic. 1985, 156, 269–272. [Google Scholar] [CrossRef]
- Wang, J.; Zhao, Y.; Ma, Z.; Zheng, Y.; Jin, P. Hydrogen Sulfide Treatment Alleviates Chilling Injury in Cucumber Fruit by Regulating Antioxidant Capacity, Energy Metabolism and Proline Metabolism. Foods 2022, 11, 2749. [Google Scholar] [CrossRef]
- Matsui, T.; Kosugi, Y.; Miki, E. Postharvest changes in the activities of sugar-metabolizing enzymes in cucumber fruit stored at different temperatures. Food Preserv. Sci. 2008, 34, 133–138. [Google Scholar] [CrossRef]
- Dhall, R.K.; Sharma, S.R.; Mahajan, B.V.C. Effect of shrink wrap packaging for maintaining quality of cucumber during storage. J. Food Sci. Technol. 2012, 49, 495–499. [Google Scholar] [CrossRef]
- Eboibi, O.; Uguru, H. Storage conditions effect on physic-mechanical properties of Nandini cucumber. Int. J. Eng. Technol. Res. 2017, 7, 264925. [Google Scholar]
- Pan, Y.; Li, X.; Jia, X.; Zhao, Y.; Li, H.; Zhang, L. Storage temperature without fluctuation enhances shelf-life and improves postharvest quality of peach. J. Food Process Preserv. 2019, 43, e13881. [Google Scholar] [CrossRef]
- Xu, R.; Chen, Q.; Zhang, Y.; Li, J.; Zhou, J.; Wang, Y.; Chang, H.; Meng, F.; Wang, B. Research on Flesh Texture and Quality Traits of Kiwifruit (cv. Xuxiang) with Fluctuating Temperatures during Cold Storage. Foods 2023, 12, 3892. [Google Scholar] [CrossRef] [PubMed]
- Wang, X.; Chen, J.; Luo, D.; Ba, L. Advances in the Understanding of Postharvest Physiological Changes and the Storage and Preservation of Pitaya. Foods 2024, 13, 1307. [Google Scholar] [CrossRef] [PubMed]


Disclaimer/Publisher’s Note: The statements, opinions and data contained in all publications are solely those of the individual author(s) and contributor(s) and not of MDPI and/or the editor(s). MDPI and/or the editor(s) disclaim responsibility for any injury to people or property resulting from any ideas, methods, instructions or products referred to in the content. |
© 2024 by the authors. Licensee MDPI, Basel, Switzerland. This article is an open access article distributed under the terms and conditions of the Creative Commons Attribution (CC BY) license (https://creativecommons.org/licenses/by/4.0/).