Featured Application
The application of this study is all computational studies considering venom peptides as potential sources of therapeutics.
Abstract
Animal venom has been gaining traction as a potential source of therapeutics for various diseases. Spiders encompass a wide variety of venom-producing species, of which tarantulas of the family Theraphosidae are widely known across the globe. Research towards tarantula venom therapeutics has led to its potential application as antinociceptives. Death receptors are cellular receptors that induce apoptosis—the body’s natural suicide mechanism—to destroy malfunctioning cells. These are particularly of interest in cancer research, as this mechanism is tampered with, resulting in cancer cell proliferation. In this study, the viability of venom toxins from the Theraphosidae family of spiders to induce apoptosis by binding to human death receptors is investigated by carrying out anti-cancer screening, molecular docking, ADMET evaluation, then molecular dynamics and thermodynamic analysis twice, first to ascertain the best receptor–peptide systems per receptor, and secondly to more comprehensively describe binding stability and thermodynamics. Results point to favorable receptor–peptide interactions due to similarities in equilibrium behavior with the death ligand–death receptor systems, along with favorable end-state binding energies and ADMET analysis results. Further inquiry is recommended to assess the real-life efficacy and viability of theraphotoxins as apoptosis therapeutics and further improve on their ability to induce apoptosis.
1. Introduction
One of nature’s most well-known and deadliest products of convergent evolution is venom. Venom, as an evolutionary trait, evolved across various animal families for several reasons, mostly for predation, self-defense, and competition for mates [1,2]. Typically, venom is introduced via a wound through which the toxin is injected into the victim. These venom toxins are not singular compounds but are instead a mixture of peptides which affect the victim by targeting specific sites in tissues that would cause their dysfunction, immobility, and ultimately, death [3]. Although there are several classes of venom, they predominantly belong to four classes: neurotoxins, which target the nervous system; necrotoxins, which induce the death of skin tissue, a process known as necrosis; myotoxins, which afflict muscle tissue; and cytotoxins, which kill individual cells [4].
Spiders are one of the most common venom-producing organisms in the planet, but are generally harmless unless provoked. Their toxins are not as fatal to humans as other organisms such as snakes [5]. Of these spiders, one of the most famous are the tarantulas of the family Theraphosidae, which despite their menacing appearance are being kept as exotic pets [6]. Their global distribution, coupled with their non-fatal venom, make them great pet candidates. Tarantula venom is a cocktail of compounds known as theraphotoxins, which are neurotoxins 31 to 41 amino acids long, linked by disulfide bridges, have an average molar mass of 4047.77 Da, and have isoelectric points (pI) ranging from 9 to 11 [7,8]. In recent years, these neurotoxic properties are being explored as therapeutics, specifically as antinociceptives [9] and alleviators of neurodegeneration [10]. Their uses are also more recently being extended to other ailments such as cancer [11], although this field is yet to be fully established.
Venom has been used as medicine since ancient times, and a re-emergence of venom-based therapeutics has resulted in renewed interest in venom as medicines [12]. Molecules of interest include peptides and non-peptide organic compounds found in the venom of organisms such as snakes [13], spiders [14], and cone snails [15,16]. The high specificity and selectivity to protein targets have rendered venom-based therapeutics an integral area of research for various ailments, including cancer [17]. Although difficulties in extraction, isolation, problems in clinical trials, and delivery of these venom peptides [12] have rendered venom therapeutics research tough, the possibility of doing in silico studies makes possible the evaluation of these venom components as therapeutics without the need for cumbersome extraction and isolation processes and prior to performing in vitro and in vivo studies to confirm their effects on whole, live cells.
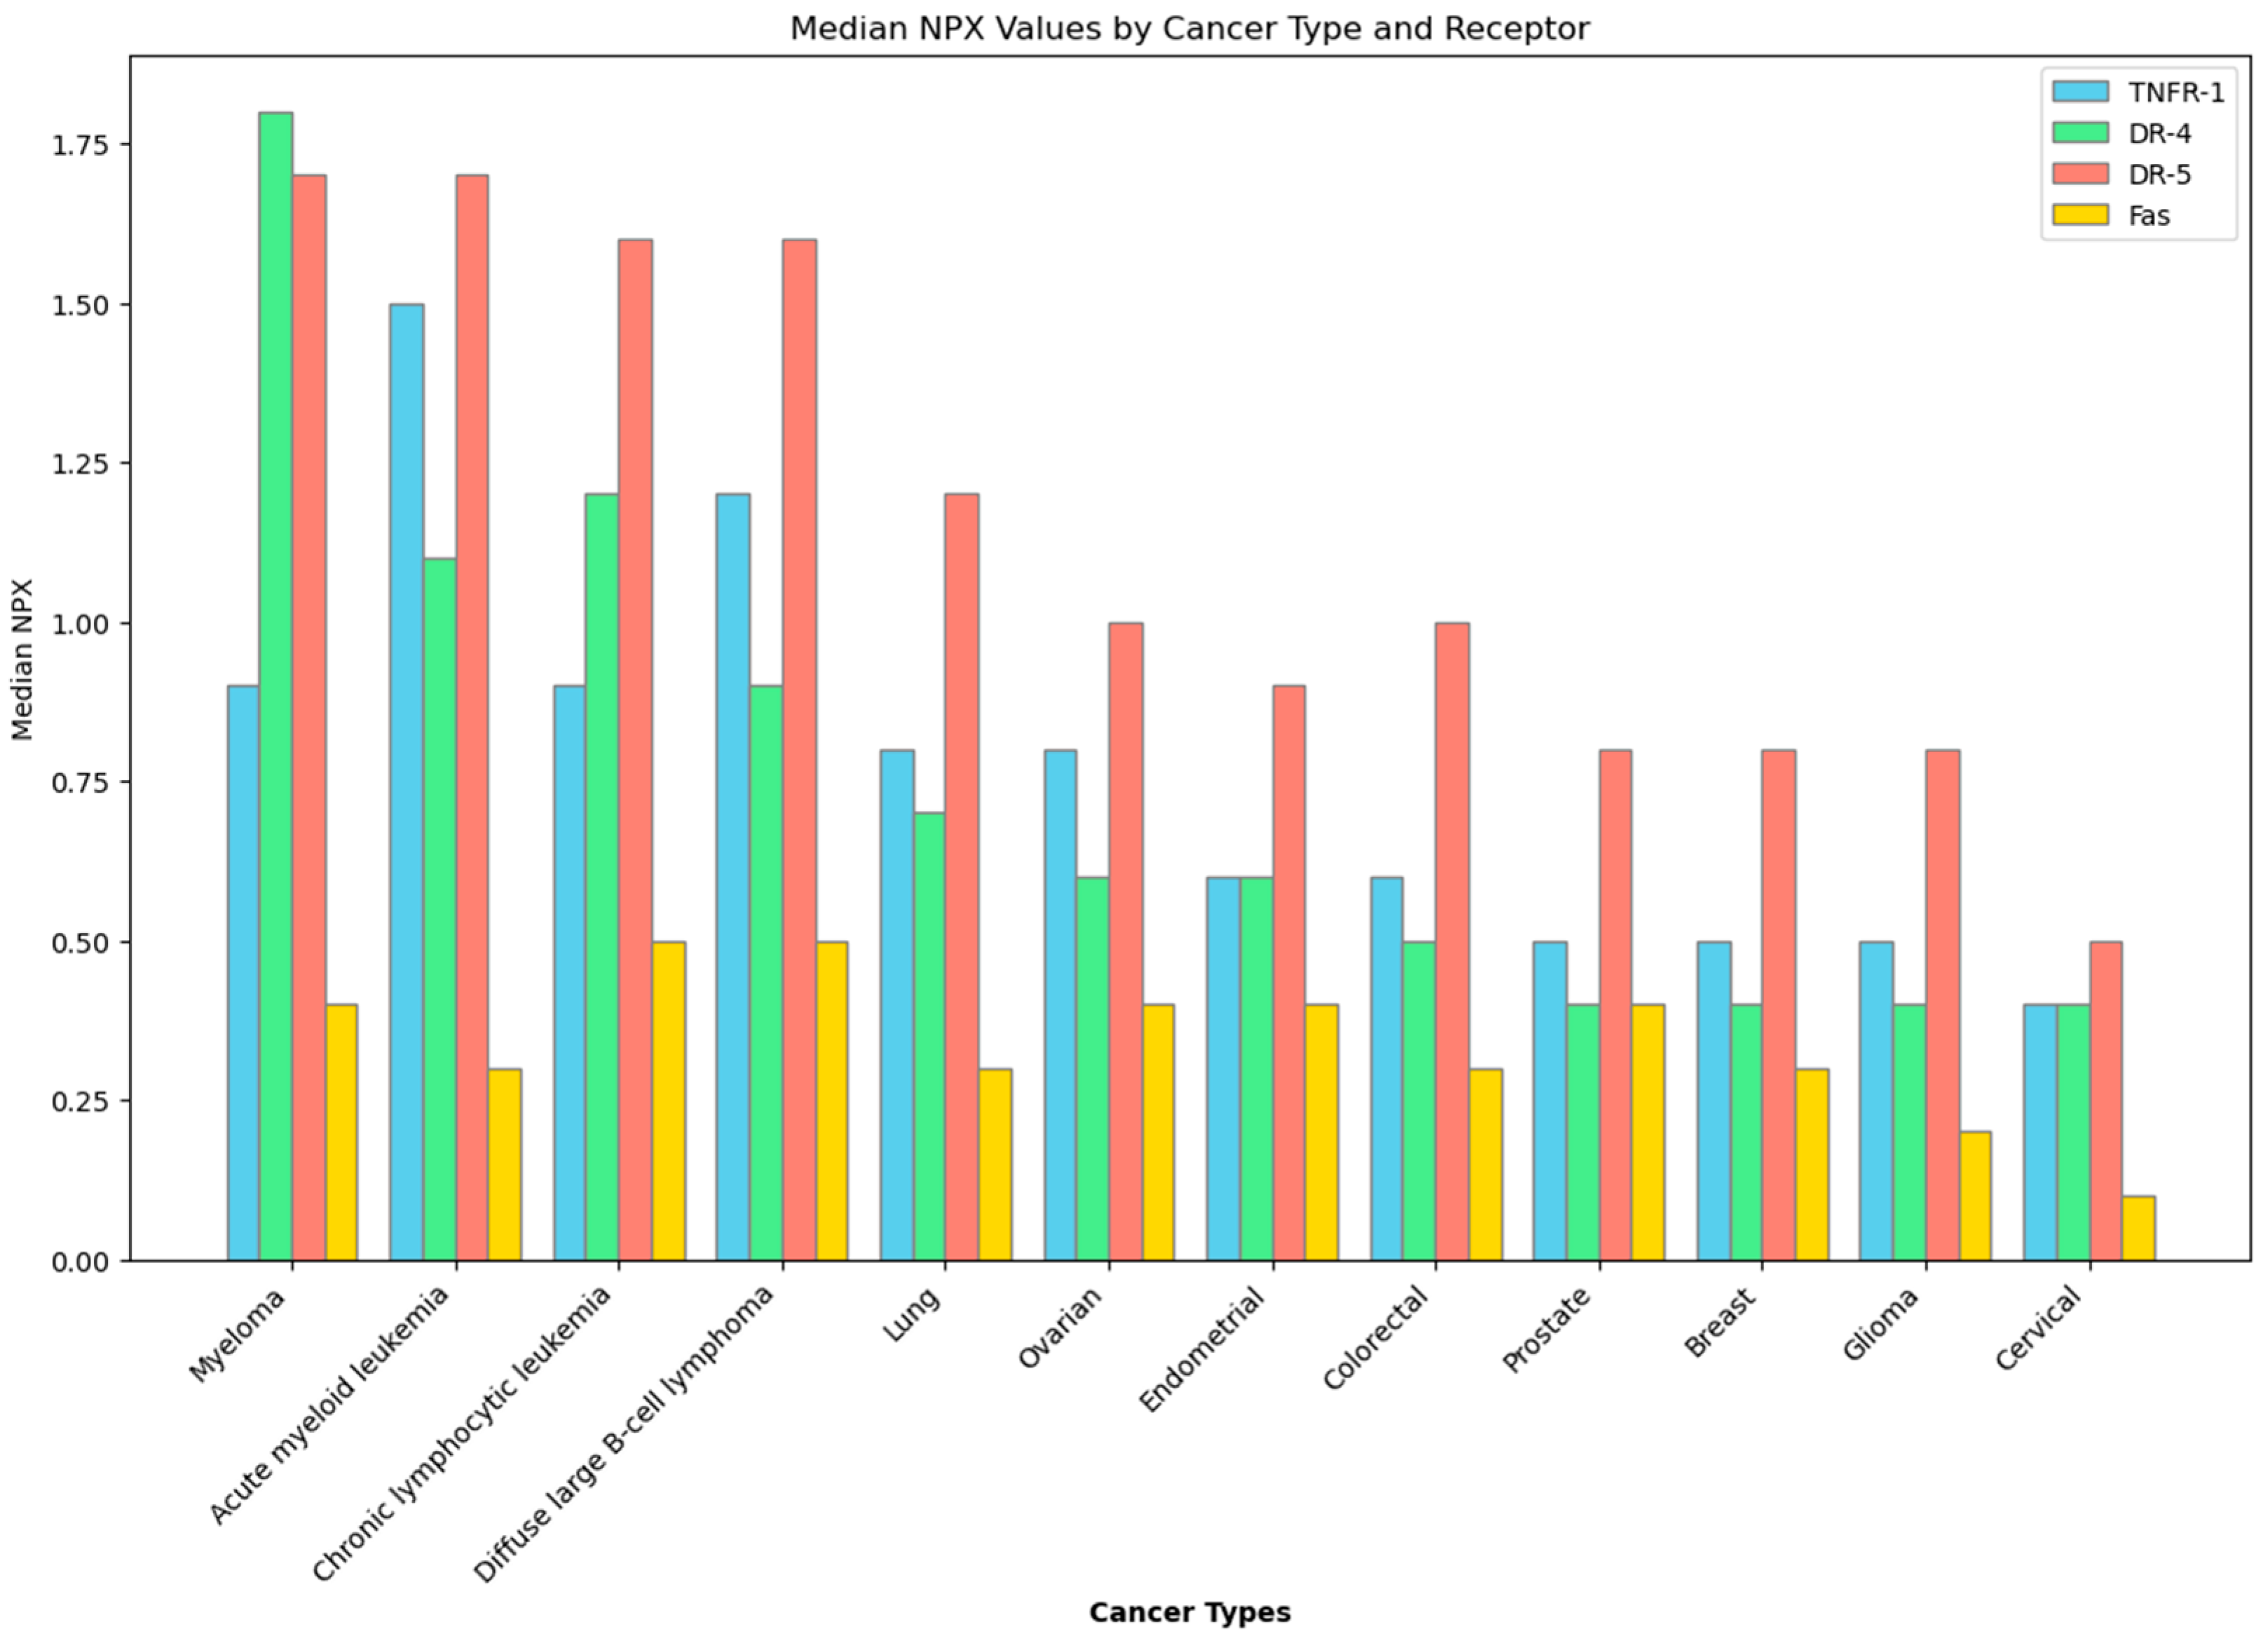
In the context of cancer cells, a desired effect is apoptosis, or programmed cell death—a suicide mechanism that is activated when the body sends signals, either extracellularly by somatic cell scanning of lymphocytes [18] or intracellularly by mediation of proapoptotic proteins [19]. Although apoptosis is ubiquitous, given that is is an important mechanism to rid the body of abnormal cells, death receptors, which are cell surface receptors involved with apoptosis, are not. There are specific types of cancer that express death receptors significantly more than others, as illustrated in Figure 1 [20]. This then supports the idea of utilizing apoptosis in cancer treatment, as the process is already a built-in cancer checking mechanism that has only been tampered with when genetic mutations cause death receptors to be inactivated [19,21,22]. Reactivation of these death receptors may initiate the apoptotic cascade in cancer cells, and studies focusing on recombinant death ligands—molecules that are derived from proteins that naturally associate with death receptors to initiate apoptosis—have yielded positive results, signifying the viability of death receptors as anti-cancer targets, especially that of death receptor 4 (DR-4) and death receptor 5 (DR-5) [23,24]. Other death receptors in the body, such as Type 1 TNF Receptor (TNFR-1), and Fas Receptor (Fas) have yet to be explored as potential anti-cancer therapeutics, but exploration into their viability is still warranted due to their being also part of the extrinsic apoptotic pathway [25]. While there are no current therapeutics based on these death receptors, current studies continue to explore different ways by utilizing the extrinsic apoptotic pathway’s death receptors to induce apoptosis as a cure for cancer.

Figure 1.
Expression of death receptors in different cancer types. Data obtained from the Human Protein Atlas. NPX—Normalized Protein eXpression.
This study aims to explore and quantify the viability of theraphotoxins as potential apoptotic therapeutics via their binding with the death receptors DR-4, DR-5, TNFR-1, and Fas by carrying out molecular docking and molecular dynamics studies to gauge the possibility of their binding and simulating their interactions within the body via a solvated system, as well as to investigate the thermodynamics of binding in order to quantify the favorability and stability of these ligand–receptor complexes. Death ligand binding with their respective death receptors served as controls for the analysis. Subsequent absorption, distribution, metabolism, and excretion–toxicity (ADMET) analyses were carried out to gauge how the body would process these theraphotoxins should they be introduced into the body. This study is promising, as it can serve as the baseline for research involving spider venom peptides for targeted therapies, and it can further improve existing cancer treatment options. Furthermore, it may be a new source of jobs to specifically cater for the care and responsible venom harvesting of Theraphosidae spiders, as well as those related to the commercialization and raising of public awareness towards venom-based therapeutics, and even the advent of new patents relating to these therapeutics.
2. Materials and Methods
2.1. Protein and Venom Structures
The overall flow of methods carried out in the study are given in Figure 2. Pertinent death receptor and death ligand structures were obtained from the Protein Data Bank (https://www.rcsb.org/, accessed on 13 August 2023) [26]. Three-dimensional structures of death receptors DR-4 (PDB ID: 5cir) [27], DR-5 (PDB ID: 1d0g) [28], TNFR-1 (PDB ID: 7kp7) [29], and Fas (PDB ID: 3tje) [30] and death ligands TRAIL (PDB ID: 1d0g)s [28], tumor necrosis factor-alpha (PDB ID: 1tnf) [31], and Fas-L (PDB ID: 4msv) [32] were isolated from the other components present in their crystallographic structure by cleaning them using Autodock [33].
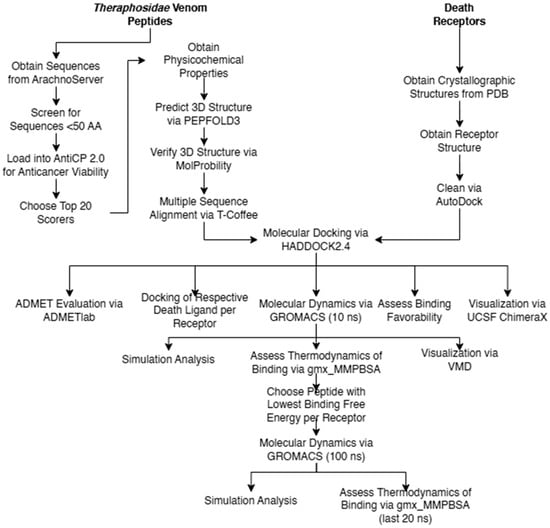
Figure 2.
Methodological flow chart.
Theraphotoxin sequences were obtained from Arachnoserver (https://arachnoserver.qfab.org/mainMenu.html, accessed 13 on August 2023) [34]. Of the 450 theraphotoxin sequences available, only those with sequences of less than 50 amino acids were considered, diminishing the number of viable samples to 337 sequences, which were then subject to screening. The limit of 50 amino acids is based on chemical synthesis considerations, with longer chains being increasingly difficult to synthesize on a large scale [35].
2.2. Anti-Cancer Screening
The 337 sequences were first screened for their anti-cancer viability and physicochemical properties by submitting their peptide sequences to AntiCP 2.0 (https://webs.iiitd.edu.in/raghava/anticp2/, accessed on 15 August 2023) [36], a web-based prediction server for anticancer peptide prediction which determines the probability that a peptide sequence may have anti-cancer properties by comparing it to known anti-cancer peptide sequences. The default Model 1 was used in the prediction. Of the 337 sequences, only 20 were chosen based on the numerical score of the peptides’ similarity to known anti-cancer sequences.
These top 20 scorers had their 3D structure predicted via PEP-FOLD 3 (https://bioserv.rpbs.univ-paris-diderot.fr/services/PEP-FOLD3/, accessed 15 August 2023) [37,38,39]. The 3D configurations of these structures were validated for their hydrogen placement and all-atom contacts using MolProbity (http://molprobity.biochem.duke.edu/, accessed on 14 August 2023) [40], and the structure with the best MolProbity score was chosen for docking. The sequences of the top 20 scorers were subject to multiple sequence alignment using T-Coffee (https://tcoffee.crg.eu/, accessed on 10 January 2024) [41,42], a multiple sequence alignment webserver for proteins, RNA, and DNA.
2.3. Molecular Docking
Cleaned death receptor and death ligand structures, and theraphotoxins were loaded onto the HADDOCK2.4 webserver (https://wenmr.science.uu.nl/haddock2.4/, accessed on 15 August 2023) [43,44]. Docking was carried out for death receptor–death ligand and death receptor–theraphotoxin pairs, with the former serving as control. As association of death receptors with the corresponding death ligand is trimeric in nature, the ‘C3 symmetry’ option was chosen to account for this phenomenon [25]. The docking was constrained to interactions between receptor and ligand only to obtain docked structures similar to those found in crystallographic studies, and the docking was considered as ‘protein-protein’, as the theraphotoxin structures were too long to be considered peptides by the server. The active sites and residue length per monomer for each death receptor system were noted and considered for docking [27,28,45,46,47,48]. HADDOCK scores, a linear combination of different energy terms and buried surface area, served as the primary metric for verifying whether the docking is ‘good’ or ‘bad’, with negative scores being favorable [49]. The top three (3) and the worst (1) scorers per death receptor were obtained and were then subjected to molecular dynamics simulations. Finally, the docking results were visualized using PyMOL [50,51] and UCSF ChimeraX [52,53,54].
2.4. Molecular Dynamics
GROMACS 2023.2 was used to carry out initial 10 ns molecular dynamics simulations on the selected docked systems [55,56,57]. The CHARMM36 all-atom force field was used. The docked systems were placed in a dodecahedron where the distance between the system and the box was set to 1 nm and solvated with water using the CHARMM-modified TIP3P water model [58]. Charges were balanced by adding Na+ or Cl− atoms, depending on the charge of the system. The system energy was minimized using the steepest descent integrator for 50,000 steps with a tolerance of 1000 kJ/mol. A 100-ps NVT equilibration using a V-rescale thermostat [59] at 300 K was carried out on the system, followed by a 100 ps NPT equilibration using a C-rescale barostat [60] at 300 K and 1 bar. Finally, a 10 ns molecular dynamics simulation was run with the leap frog integrator and Parrinello–Rahman barostat [61] with a time constant of 2 ps. Trajectories and energies were updated at 10 ps intervals. Throughout the runs, electrostatic interactions were treated with the particle-mesh Ewald (PME) method [62], and electrostatic and van der Waals cutoffs were set at 1 nm [63]. After the simulations, the trajectories were sorted according to death receptor, and the root mean square deviation (RMSD), root mean square fluctuation (RMSF), radius of gyration (Rg), solvent-accessible surface area (SASA), hydrogen bond distribution and distance, and atomic distance were obtained. The plots for these parameters were then visualized via XMGrace [64], and trajectory and structure files were visualized using VMD [65,66].
2.5. Thermodynamic Analysis
Molecular Mechanics Generalized Born Surface Area (MMGBSA) and Molecular Mechanics Poisson–Boltzmann Surface Area (MMPBSA) were used to calculate the binding free energy (ΔH), interaction entropy (-TΔS), and Gibbs energy of binding (ΔG) of the death receptor–death ligand and death receptor–theraphotoxin systems. Calculations were carried out using the gmx_MMPBSA plugin, which utilizes AMBER’s MMPBSA.py module for end-state free energy calculations [67,68]. The two approaches were used to gauge the difference in ΔG due to their popularity and widespread use in biochemical systems [69]. End-state calculations between the two methods were compared to see which model would yield a more favorable (negative) ΔG.
Initial molecular dynamics and thermodynamics experiments seek to ascertain which peptide–receptor pair is most stable and which is hence designated the best pair. For each receptor, the peptide that gave the lowest ΔG with the most appropriate method was chosen, and a full 100 ns molecular dynamics simulation was carried out once more. The same set of MD parameters were obtained from this run, and a thermodynamic analysis using the best model was applied to the last 20 ns of the simulation time.
2.6. ADMET Evaluation
Systematic evaluation of each selected theraphotoxin for its absorption, distribution, metabolism, excretion, and toxicity (ADMET) was carried out using Admetlab (https://admet.scbdd.com/home/index/, accessed on 28 October 2023) webserver [70]. Parameters such as permeability (Papp), human intestinal absorption (HIA), blood brain barrier (BBB) permeability, viability as cytochrome P450 1A2, 3A4, 2C9, 2C19, and 2D6 inhibitor or substrate, half-life time, human hepatotoxicity (H-HT), AMES mutagenicity, hERG blockers, and LD50 were considered for the evaluation.
3. Results and Discussion
3.1. Anti-Cancer Screening
The results of the initial anti-cancer screening of the theraphotoxins, displaying the top 20 scorers, are given in Table 1. Score values indicate sequence similarity against known anti-cancer peptide sequences in the AntiCP 2.0 library, which have values that range from 0, meaning that a sequence has no similarity with anti-cancer peptide sequences, to 1, which means that it does. These show that there is some level of likeness between the theraphotoxins and known anti-cancer peptides. Little to no research is available on the possible medicinal applications of the venom peptides in cancer therapeutics, meaning that research centered on these would be novel. A majority of the species that scored top hits are from China, with the exception of Grammostola rosea and Hysterocrates gigas. Interestingly, the species which yielded the top-scoring peptide, Chilobrachys guangxiensis, has been seen to inhibit the voltage-gated Na+ channels in rat cardiac myocytes, a property common to theraphotoxins [71].

Table 1.
Anti-cancer score of the top 20 theraphotoxins.
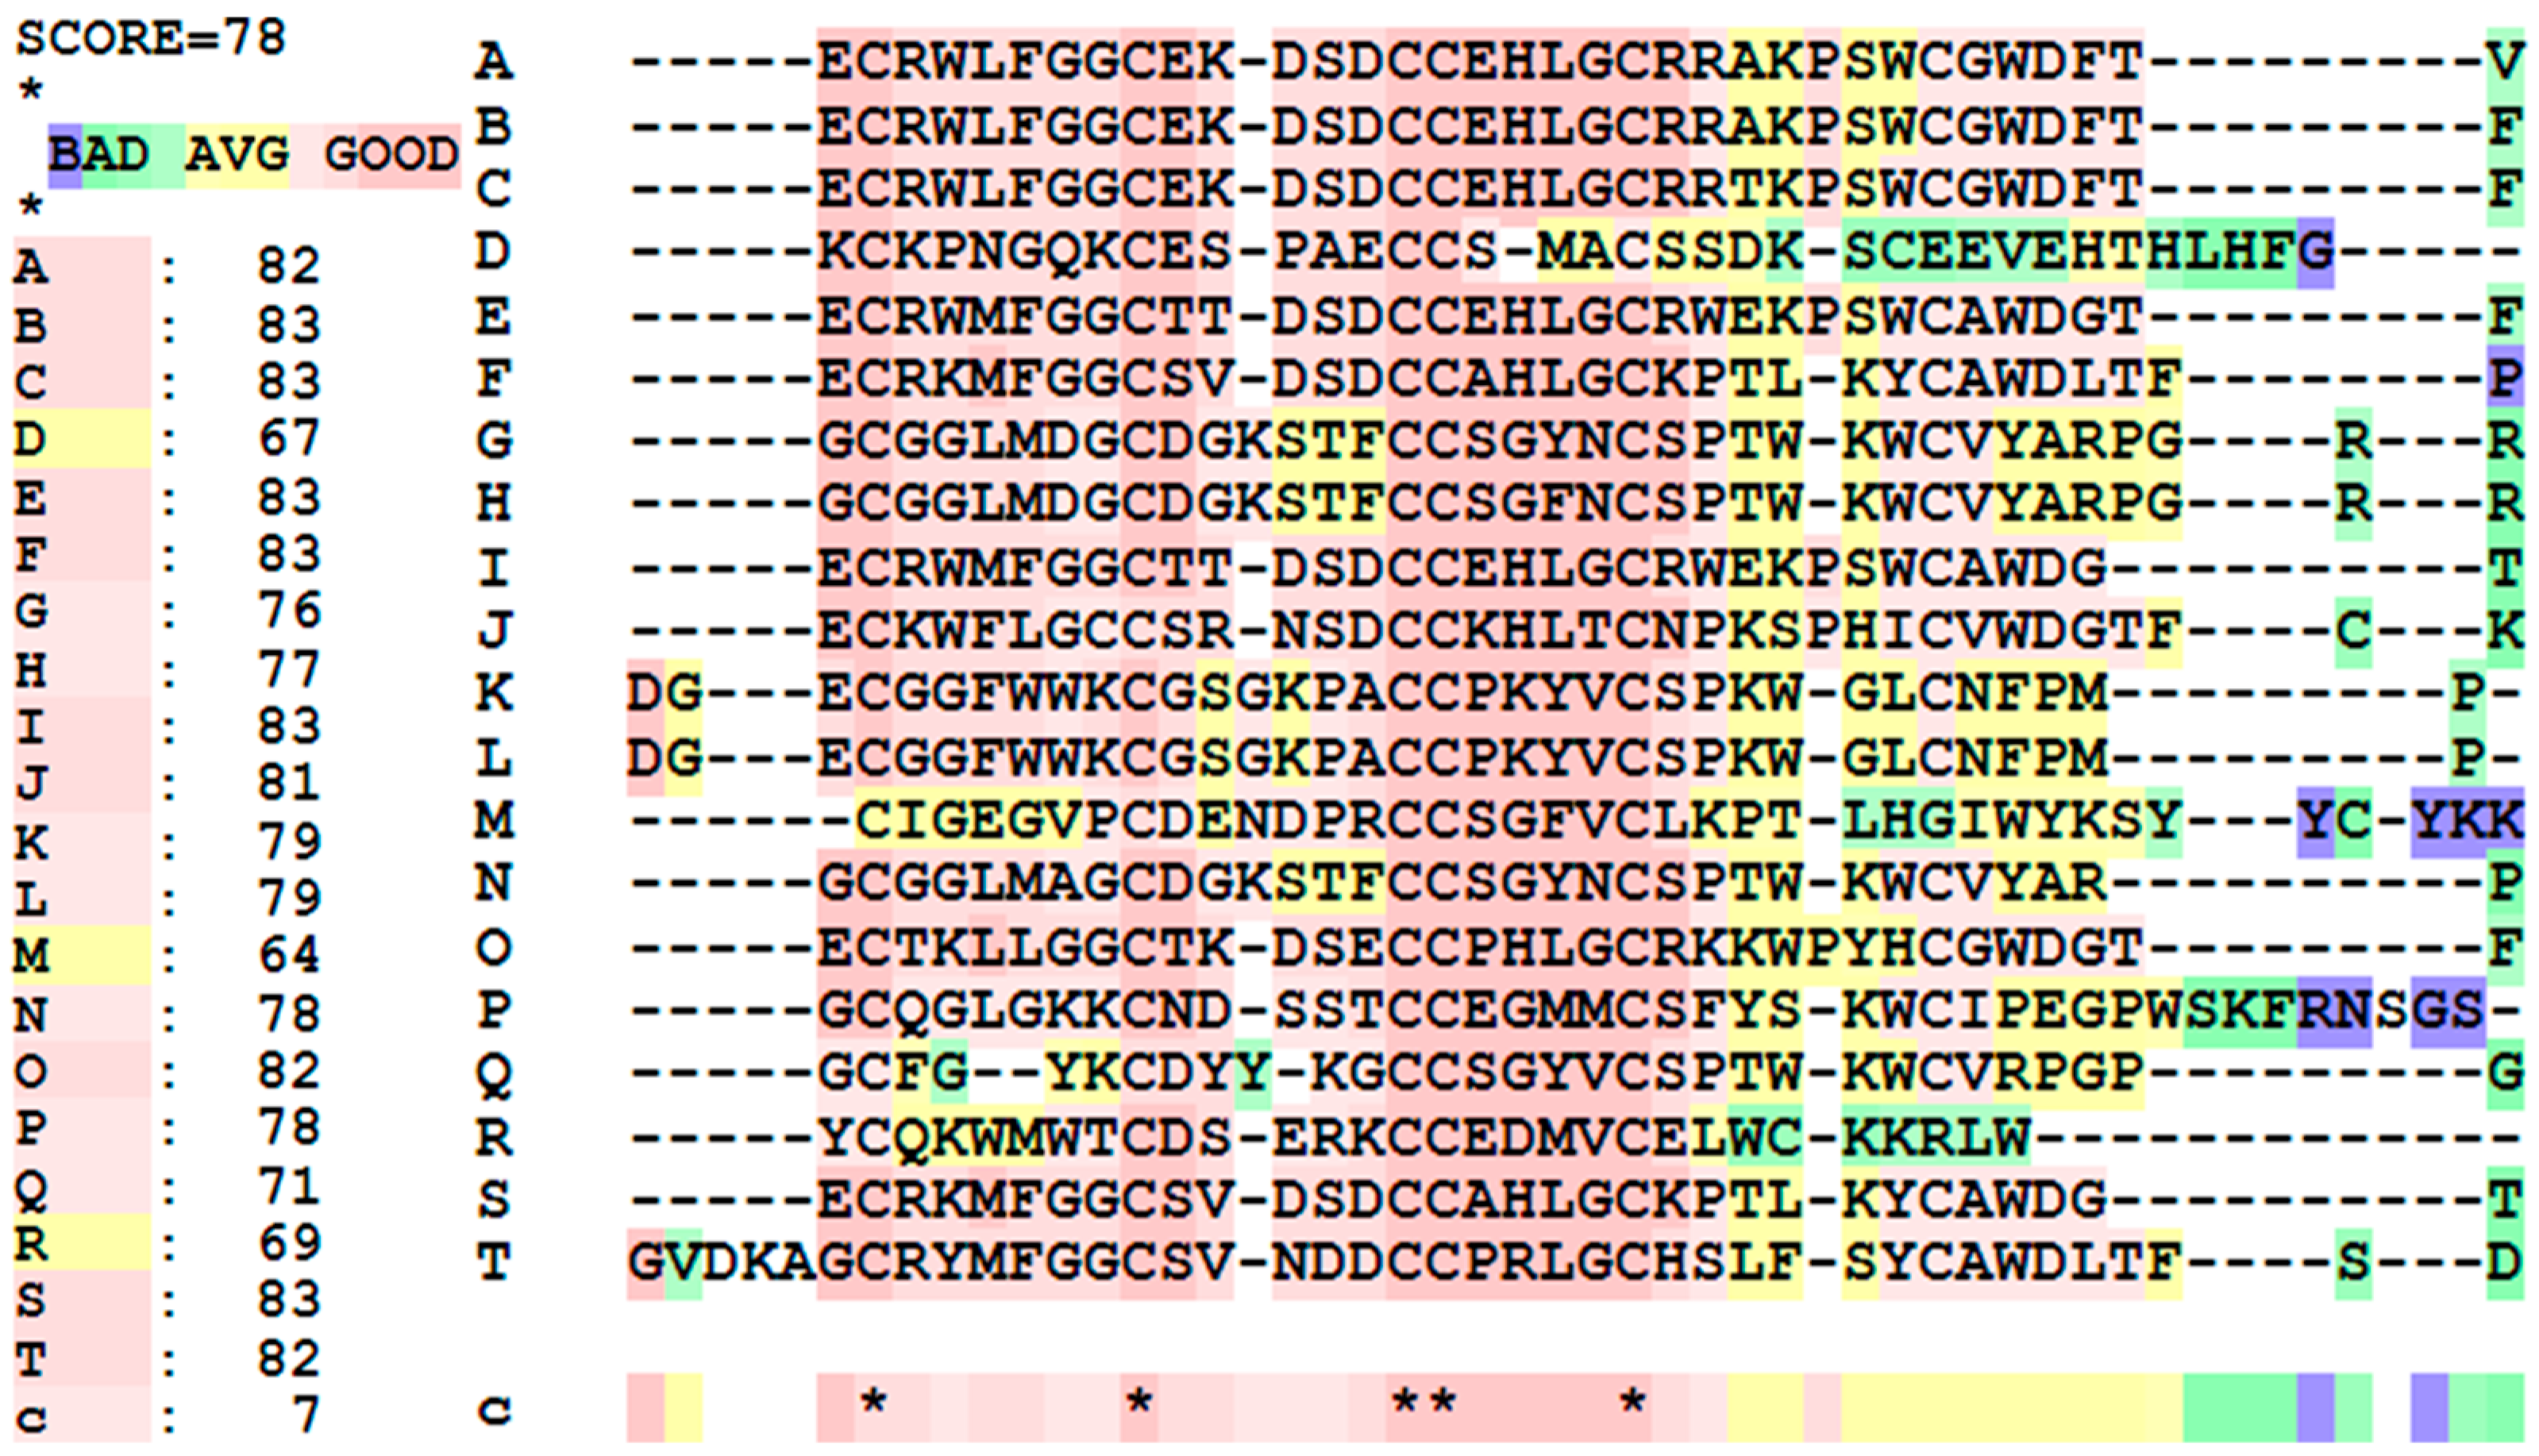
For the multiple sequence alignment of these top 20 peptides, given in Figure 3, the overall score for the peptides is 78, meaning that there is a high degree of similarity with the samples. Toxins A, B, C, E, F, I, J, O, S, and T have high sequence similarity, while D, M, and R are not as similar. Focusing on the sequences, there are five highly conserved cysteine residues, highlighting their importance in the toxins’ structure and biological activity. Aside from this, a huge chunk of the sequences have similarities, either having the exact same amino acid, or having amino acids that have similar physicochemical properties.
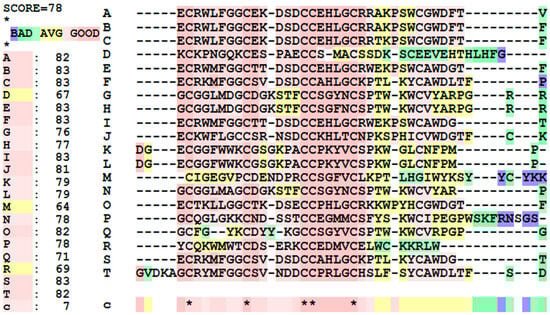
Figure 3.
Multiple sequence alignments and similarity scores of the top 20 anti-cancer peptides. (*) indicate that a residue is similar to all peptides. (**) are just two different amino acids that are similar in all sequences tested.
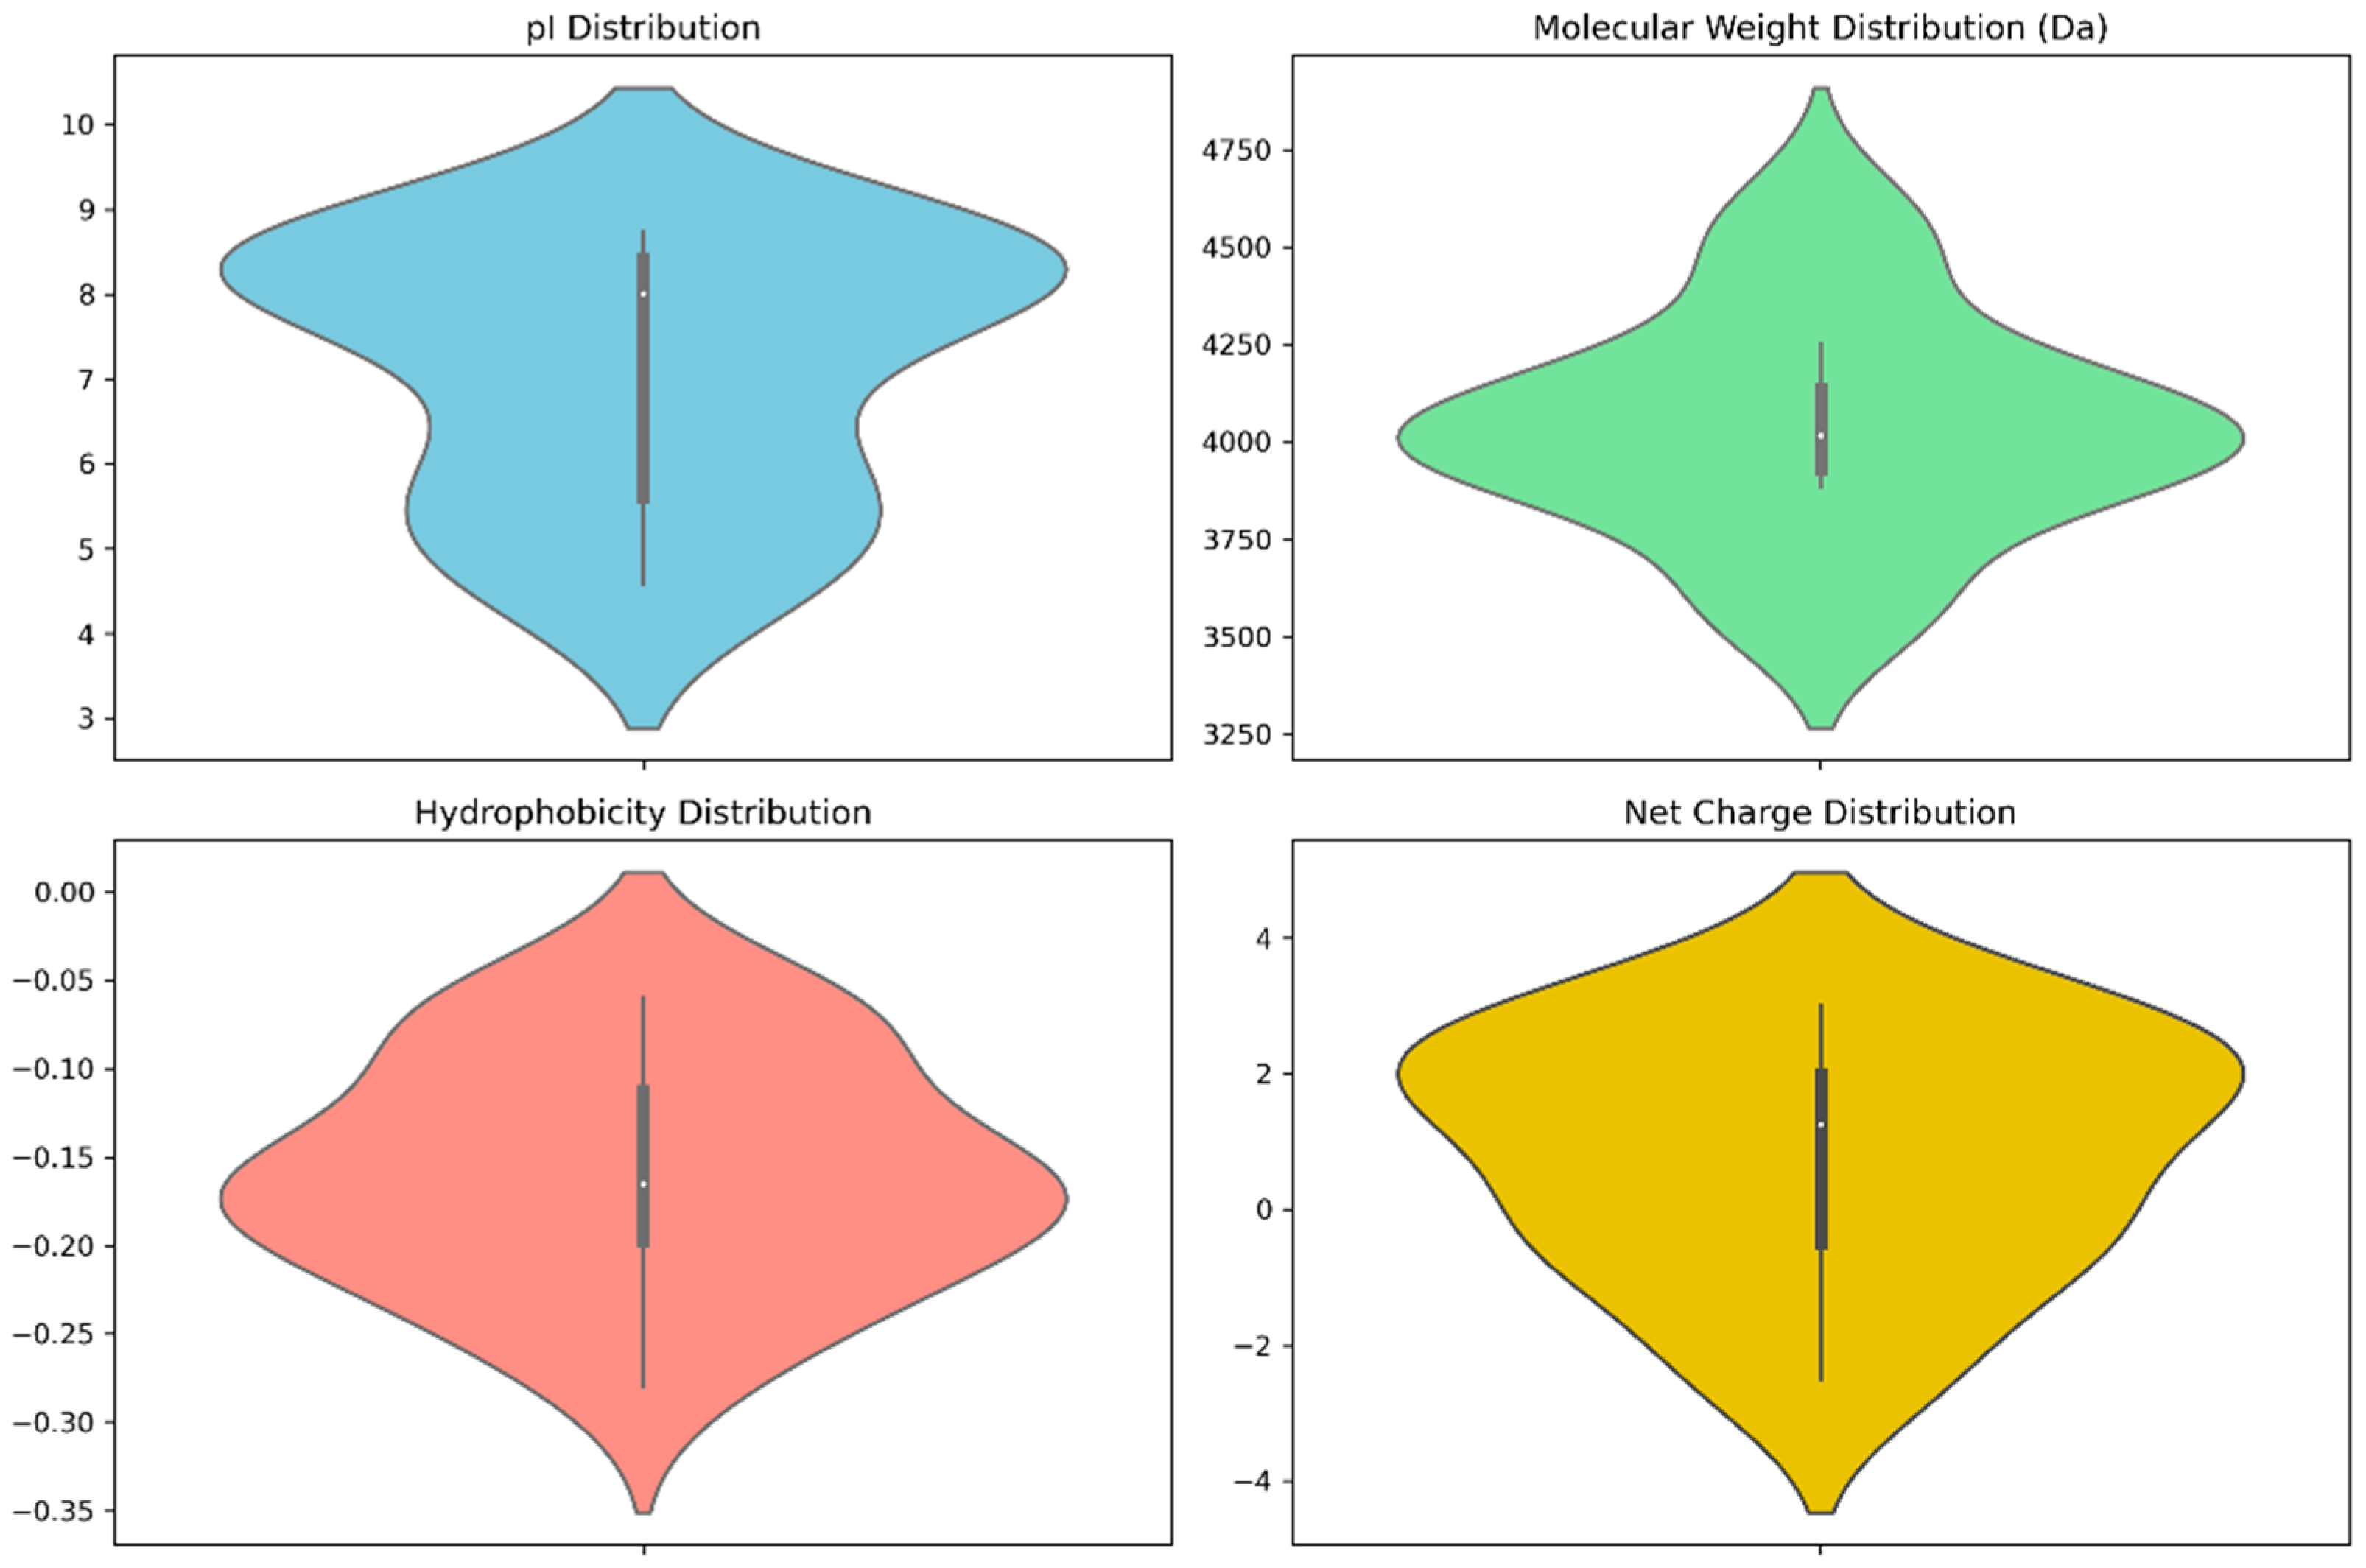
Pertinent physicochemical properties that significantly affect the anti-cancer properties of venom peptides are plotted in Figure 4, while specific numerical values and other auxiliary physicochemical properties are noted in Table S1 of the Supplementary Materials. These properties include molecular weight, isoelectric point (pI), hydrophobicity, and net charge. Molecular weight plays a key role in drug administration, as a drug’s diffusion through the bloodstream is influenced by its size. The calculated molecular weights are bunched up at 4000 Da, typical to that of tarantula venom peptides, which range from 3500 to 4500 Da [72].
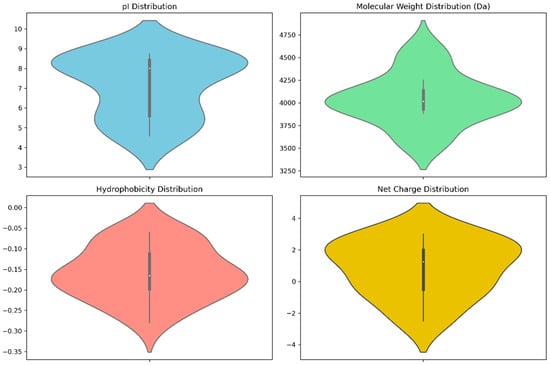
Figure 4.
Violin plots of anti-cancer scores and physicochemical properties.
The isoelectric point is another important property in discerning anti-cancer therapeutics. Ideal anti-cancer peptides should have high pI values, as the difference in charge facilitates more favorable interaction between the negatively charged cell membrane [73] The results note pI values that range from a slightly acidic 4.9 to a slightly basic 8.6, with a greater number of peptides having basic pI values, which is ideal for anti-cancer peptides. It is worth noting that top scorers have lower pI values, as given in Table S1.
Hydrophobicity determines the interactions between the peptide and the cellular membrane. Since cell membranes are amphipathic, hydrophobic properties are considered ideal for targets that reside inside the cell. The peptides showed low hydrophobicity, having mostly negative values, which may hinder their permeability through the lipid bilayer of cancer cell membranes [74]. However, this is not much of an issue, as death receptors are extracellular proteins [75] and there is no need for diffusion into the cell.
Net charge is connected to how the peptide would interact with its target. Webservers typically calculate charge against a pH of 7 unless specified. Here, the overall net charges range from −2.5 to +3, with the top-scoring peptides being anionic, slightly deviating from the ideal of positive charge for anti-cancer peptides, as these positive charges lead to more favorable interactions with the negatively-charged cancer cell membrane [76].
The violin plots of the physicochemical properties, as presented in Figure 3, show that the top-scoring peptides’ properties are bunched up to specific values, with a greater spread indicating that a greater number of peptides have those values for their physicochemical properties.
In summary, although these calculated physicochemical properties generally imply difficulty in permeating target cells, it is not a problem, as the peptides’ targets are extracellular receptors. Aggregating these parameters leads to the medium viability of these theraphotoxins as anti-cancer peptides, with net charge posing the largest negative effect.
3.2. Molecular Docking
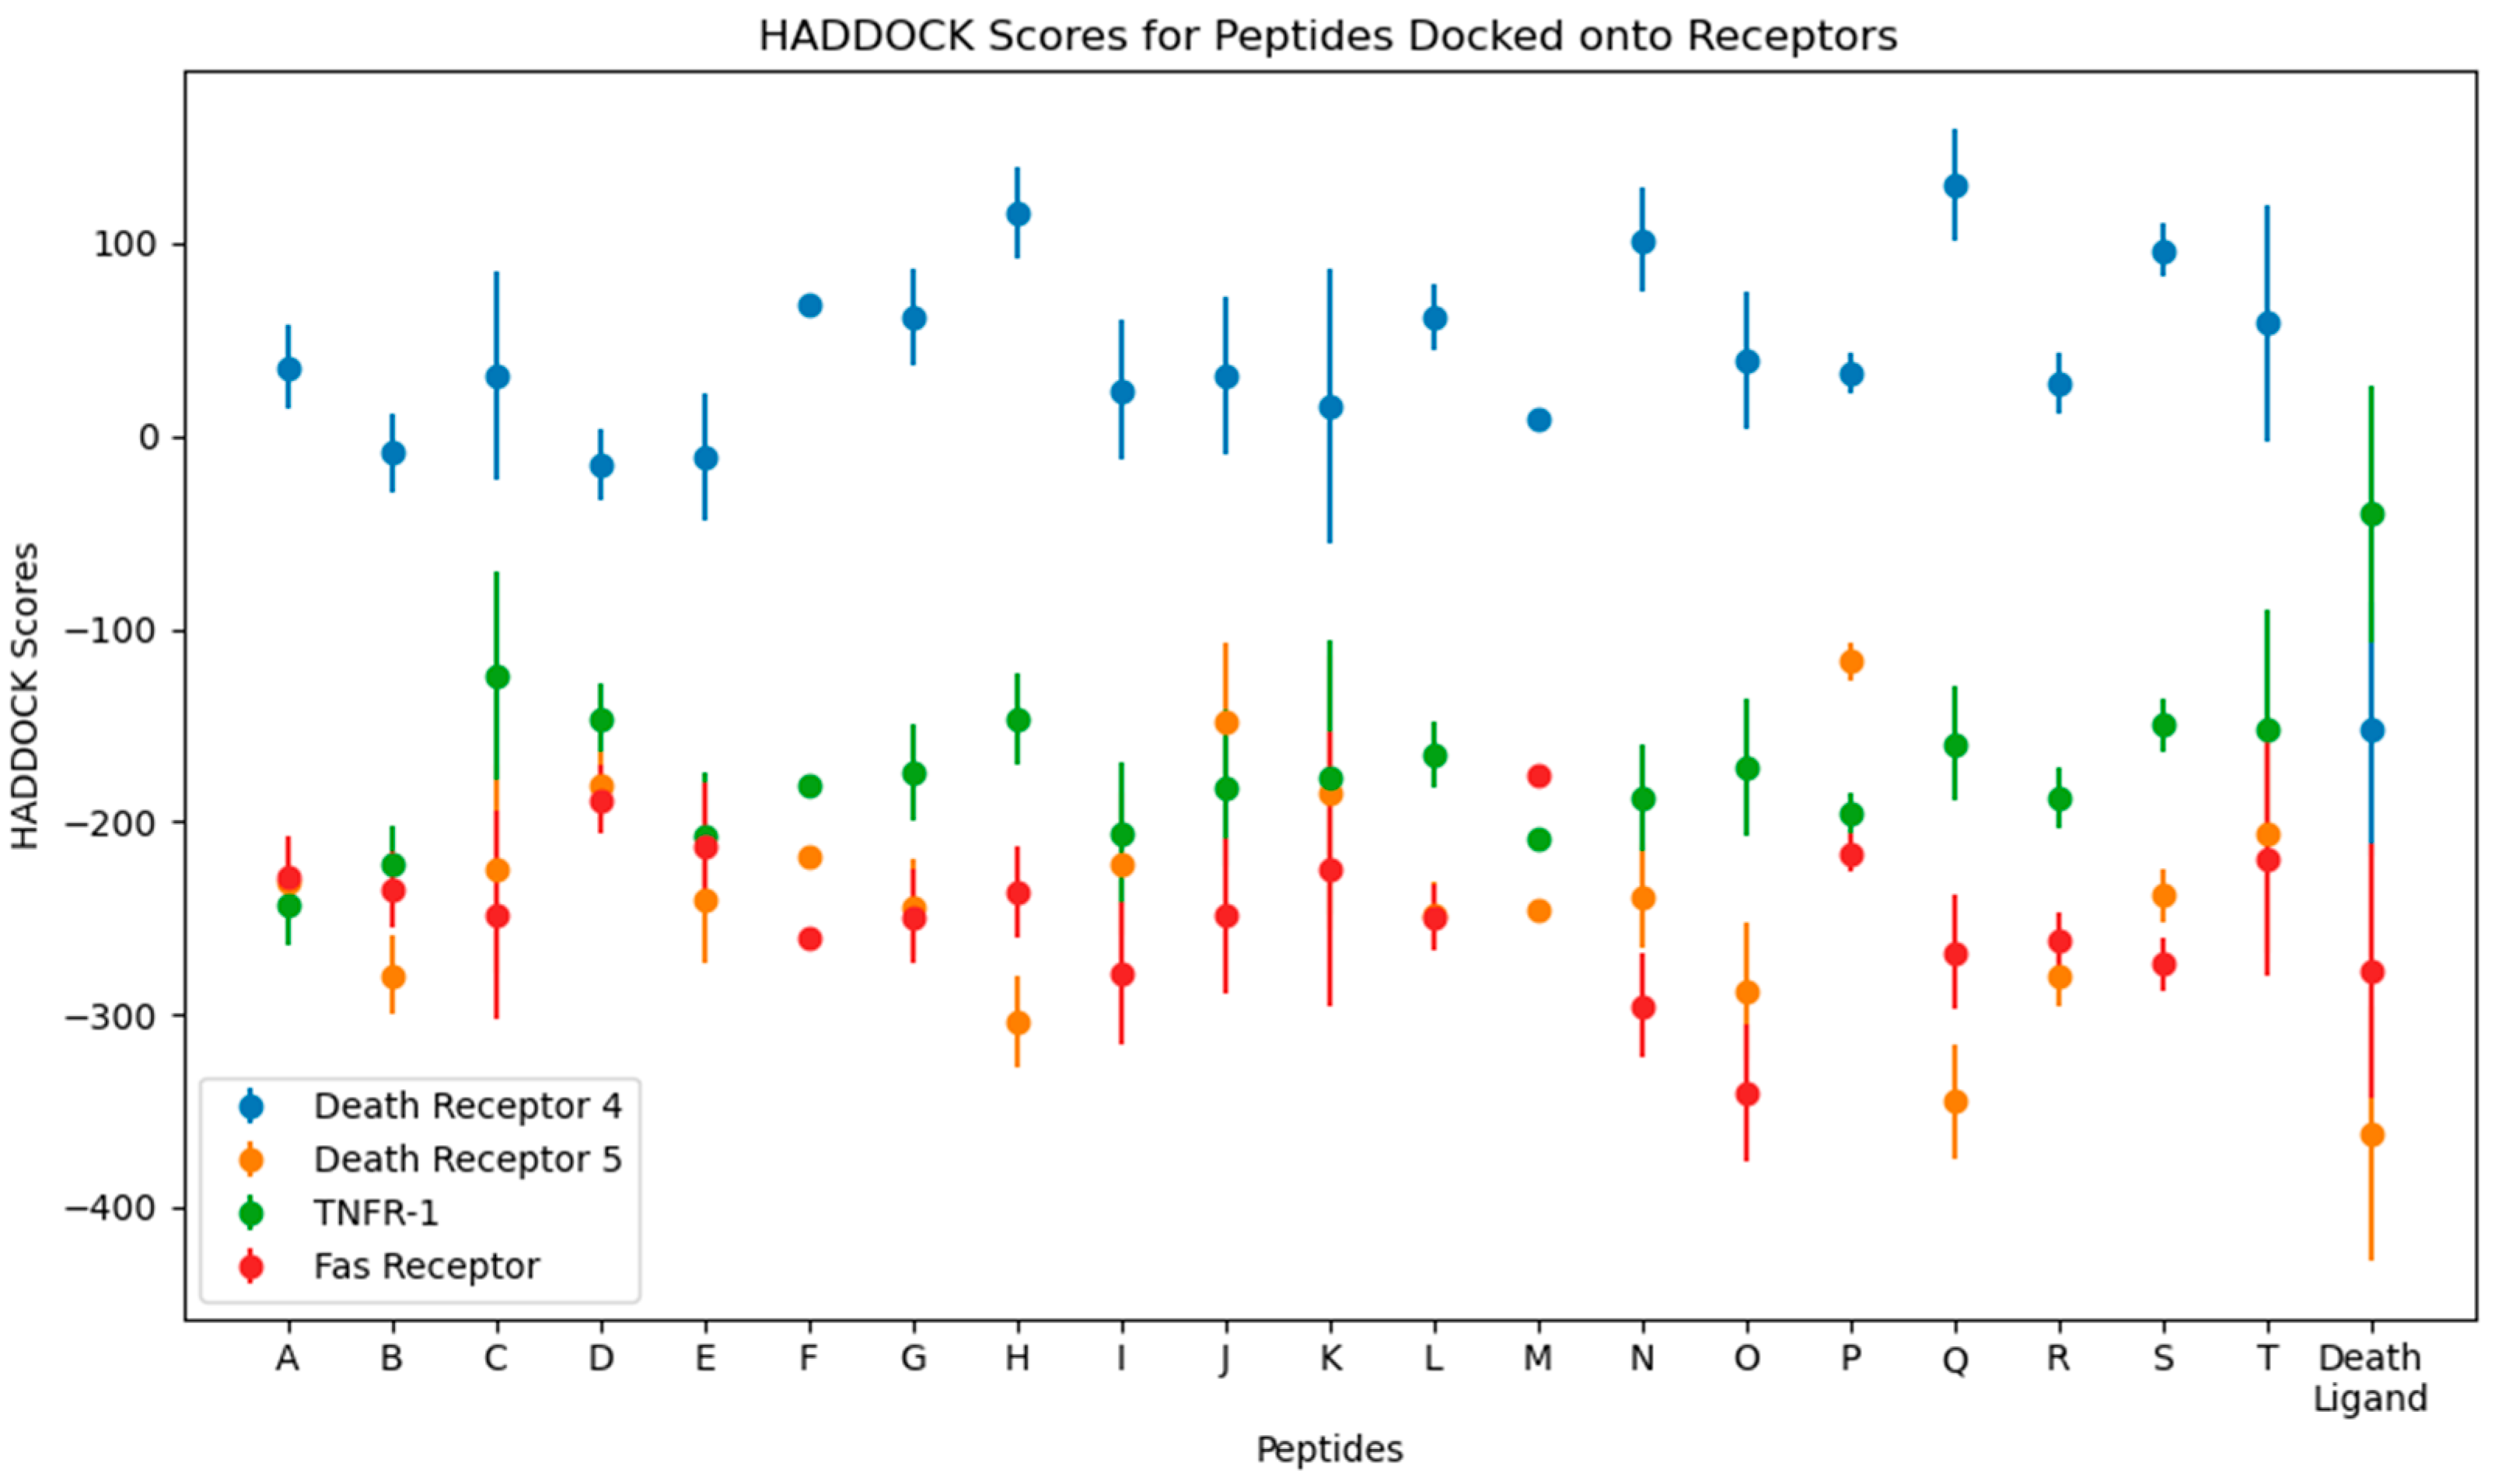
Numerical results of the docking procedure are tabulated in Table S2 of the Supplementary Materials. HADDOCK scores glean over the favorability of the docking of the ligand and receptor and are scored in arbitrary units. The rule of thumb is that the more negative the score, the better. The Z-score indicates the number of standard deviations from which the chosen cluster is located in terms of score. These values are obtained from the top-ranking cluster, the best-scored out of all available clusters in the docking [44]. The HADDOCK scores are plotted in Figure 5.
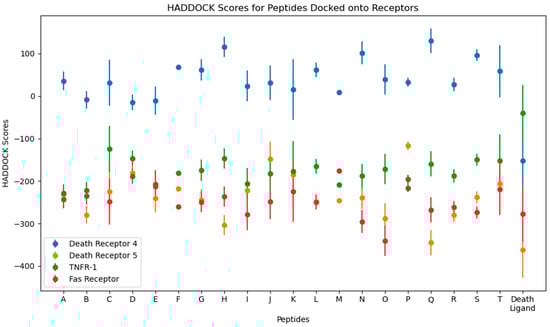
Figure 5.
Plots for the HADDOCK scores and Z-scores from the molecular docking of the top 10 peptides.
From the docking, the top three peptides with the highest HADDOCK score and the lowest-scoring peptide were chosen for further analysis. The choice for these four systems is arbitrary and is based on a hypothesis that the time element may give rise to significant differences in their behavior, as was performed using molecular dynamics simulations.
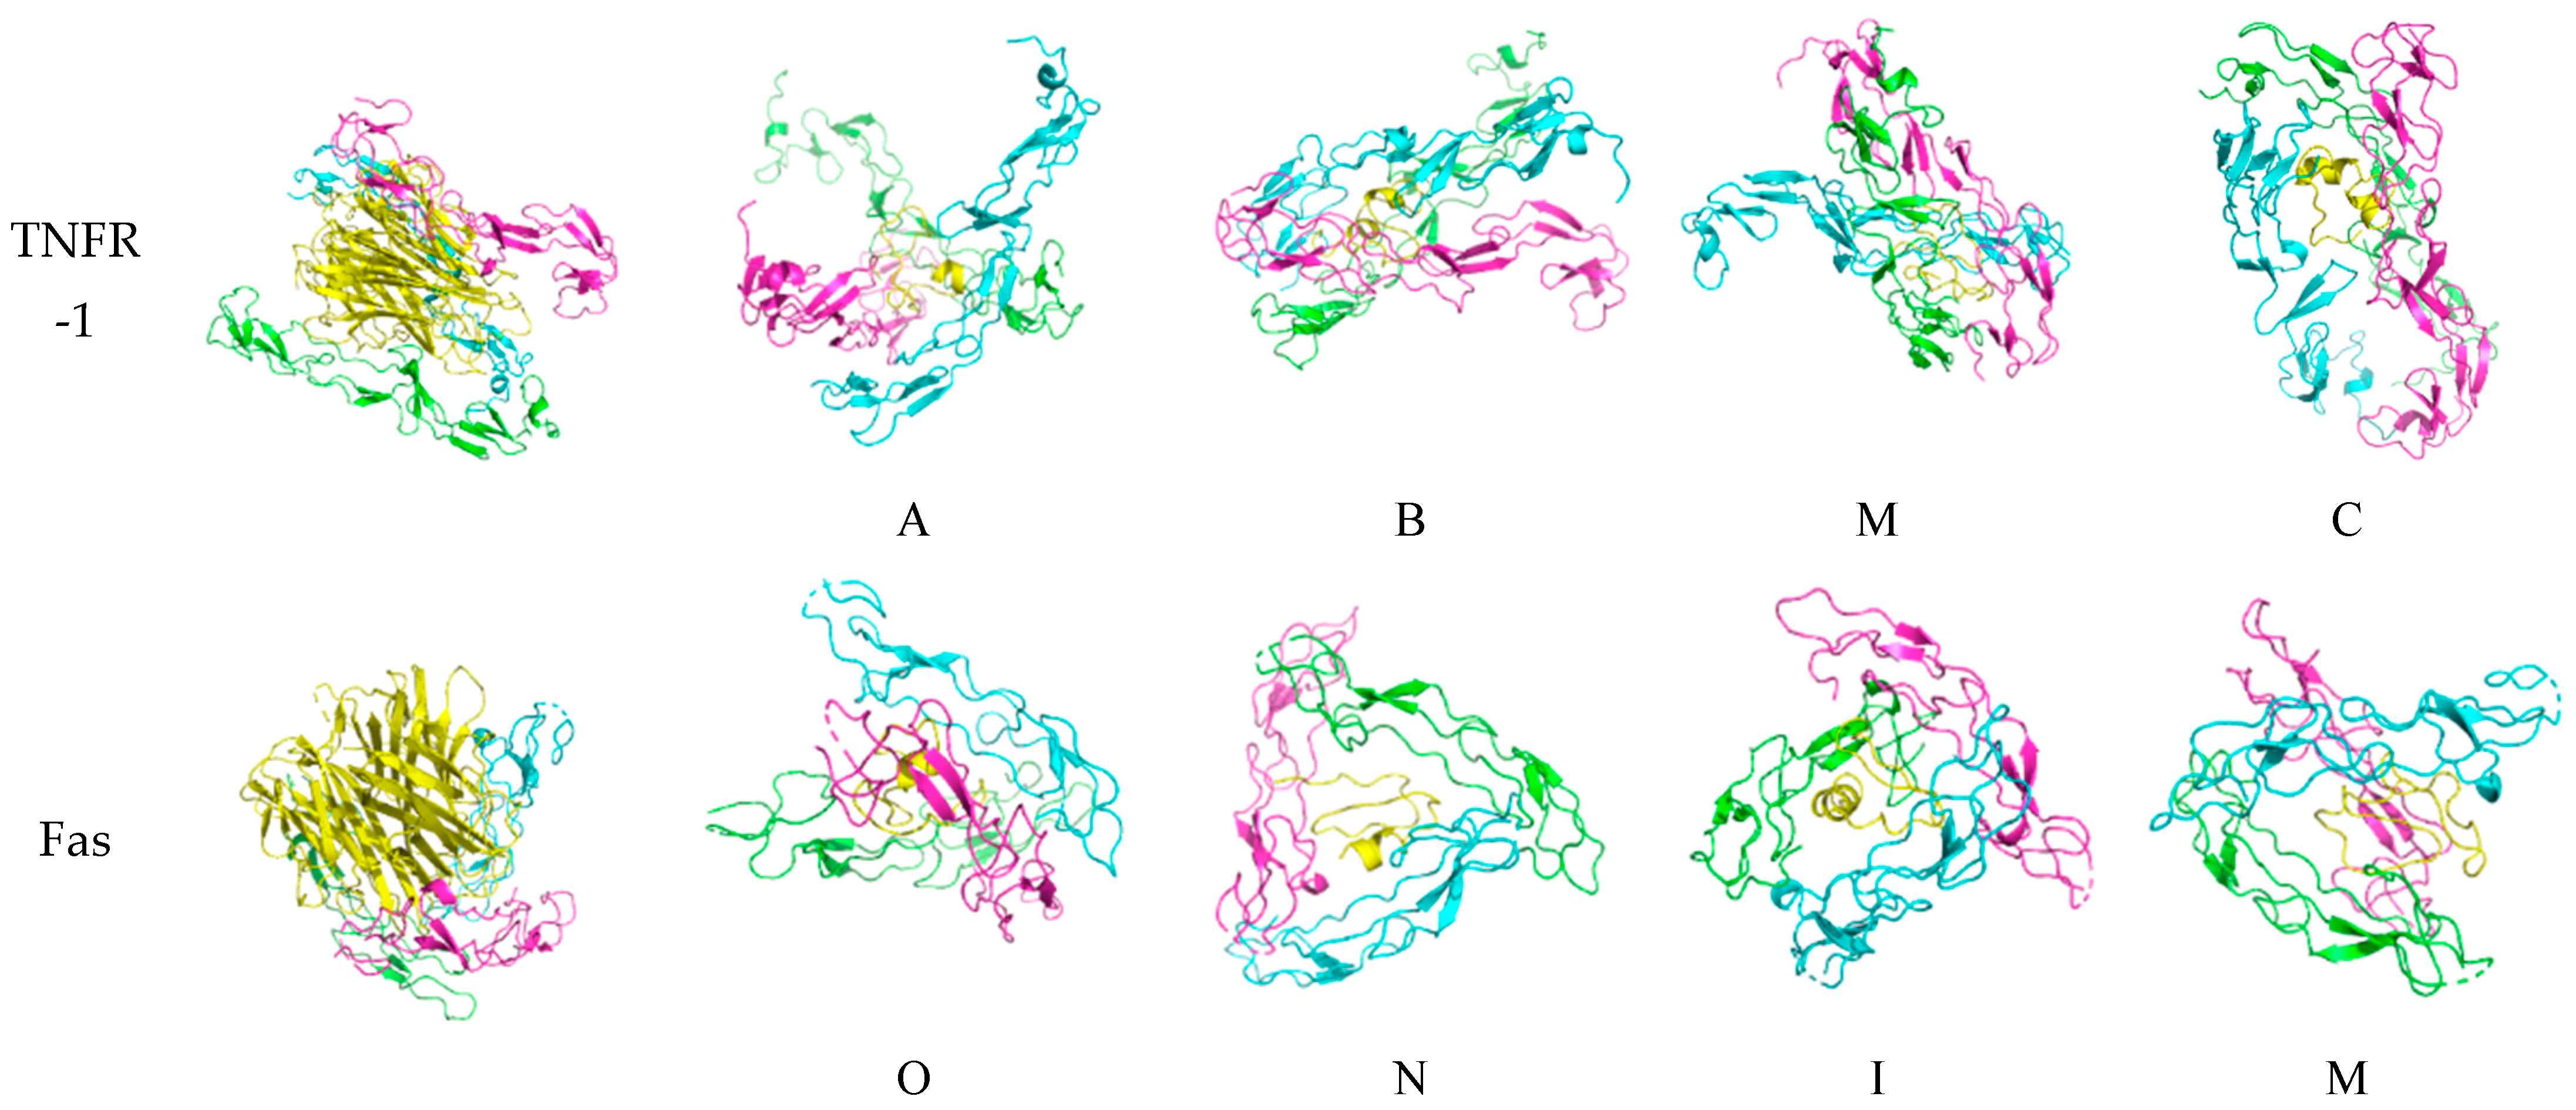
For DR-4, the top HADDOCK scorers are D, E, and B, and the lowest is Q. For DR-5, Q, H, and O, and the lowest is P. For TNFR-1, A, B, and M, and the worst is C. Finally, for the Fas Receptor, O, N, and I, and the lowest is M. Interestingly, Q is shared between DR-4 and DR-5, with it being the worst scorer in the former while the best in the latter. Other peptides shared by multiple receptors are B, a good scorer for DR-4 and TNFR-1, and M, a good scorer in TNFR-1, while being the worst in Fas.
Death ligands were also docked and their HADDOCK scores compared to the peptides. Three trends were seen, as follows: one wherein the death ligand scored lower than the peptides, as with TRAIL in DR-4; one where the death ligand scored similarly with the peptides, as with TRAIL in DR-5 and Fas-L in Fas; and one with the death ligand scoring higher, as with TNF-α in TNFR-1.
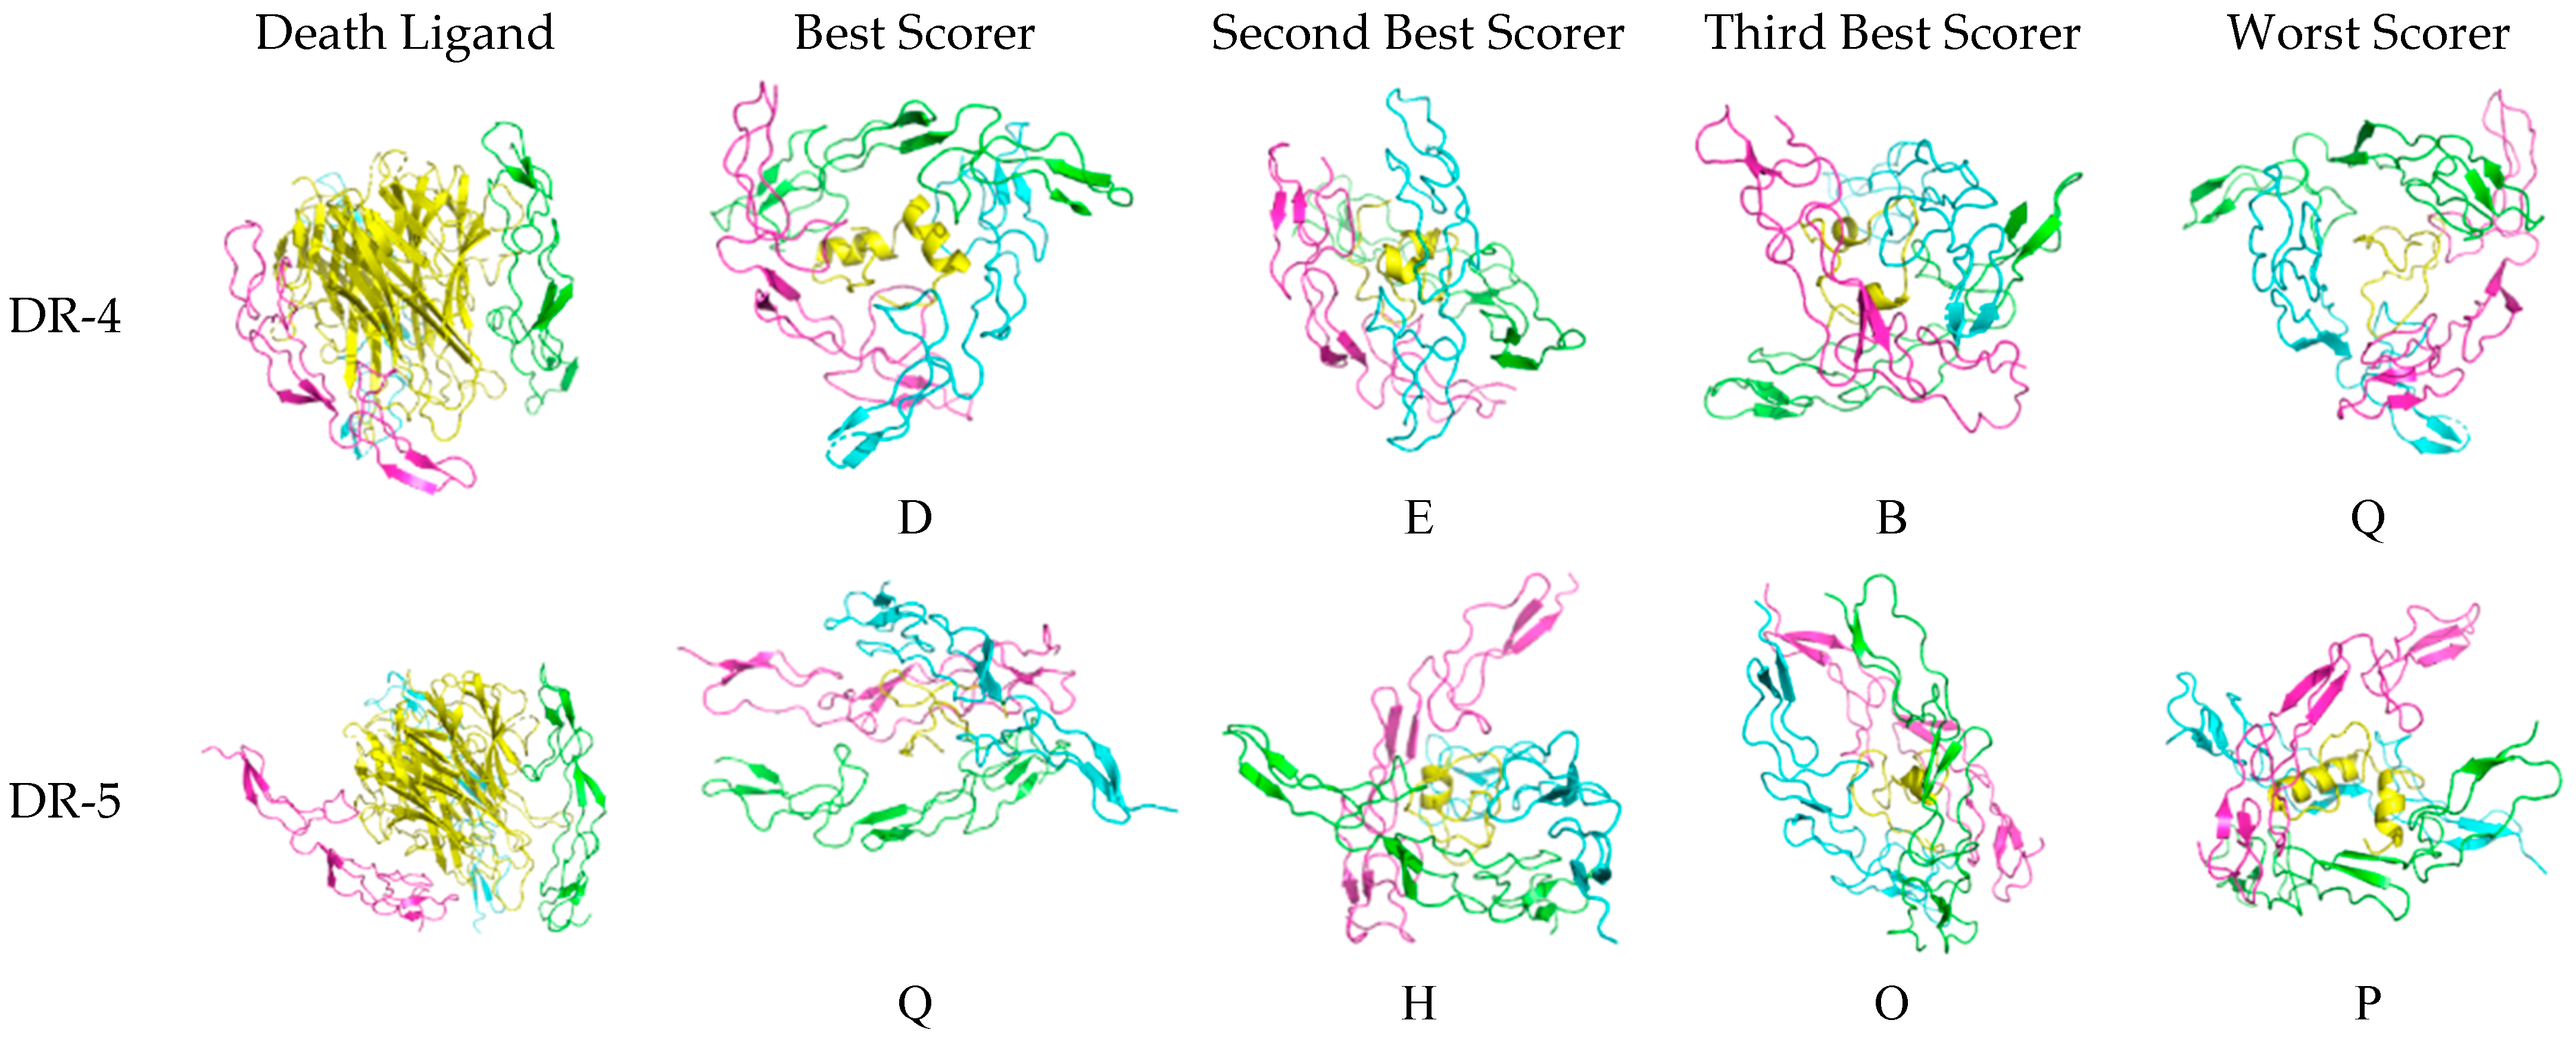
The three-dimensional configuration of the docked peptides to the receptors varies when compared to the actual death ligand, as shown in Figure 6. For DR-4, the receptor monomers tend to bind to the theraphotoxin in a slanted, almost horizontal manner, as the peptides are being encircled by the monomeric chains rather than being vertically clasped by them as with TRAIL, except E, which exhibits a similar docking profile. The binding of TRAIL to DR-4 is similar to what is observed in crystallographic studies [27].
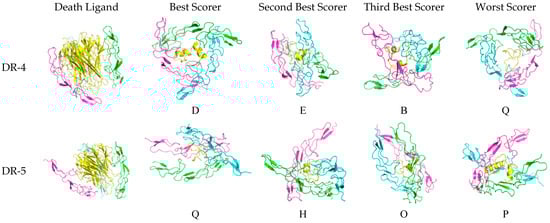

Figure 6.
Docked death receptor and ligand systems. Green, blue, and pink represent chains A, B, and C of the receptor, while yellow represents the ligand. The letter of each docked system correspond to the identity of the peptide that was docked.
For DR-5, there is much less horizontal encircling and much more vertical clasping, although H is slanted. Interestingly, the binding of TRAIL to DR-5 is asymmetric, which is unlike what is found in crystallographic studies [28]. This difference may arise from what the server assesses as more favorable upon docking.
For TNFR-1, the binding of A is slanted as compared to the other peptides, which are clasped vertically by the monomers. The blue chain in M is slightly skewed in binding as compared to the green and pink chains. The binding of TNF-α is also similar to what is found in characterization studies.
Lastly, for Fas, the binding is skewed and slanted, with O, N, and I being mostly encircled horizontally, while the chains binding M are more diagonal. The binding of Fas-L is characterized by the interaction with the bottom half of the ligand and the top halves of each monomeric chain. Although there are no existing crystallographic structures of the Fas-Fas-L system, when comparing it to the other systems, it looks asymmetric and unlike the nearly perfect binding configuration of DR-4 and TRAIL.
The number of hydrogen bonds between the peptide and receptor varies on which residues interact. The number of hydrogen bonds per docked system varies from 8 to 22. The specific interacting residues are enumerated in Table S3. No trends were evident with each death receptor system. A visualization of these hydrogen bonds is given in Figures S1–S4.
3.3. Molecular Dynamics and Thermodynamics Analysis
Initial 10 ns molecular dynamics simulations and thermodynamics analyses resulted in the following receptor–peptide pairs having the most stable end-state thermodynamics results, all based on the MMPBSA model: DR-4-Q, DR-5-Q, TNFR-1-A, and Fas-I.
Complete breakdown of the molecular dynamics plots and thermodynamics analysis of all other peptides considered for molecular dynamics using both the MMGBSA and MMPBSA models are given in the Supplementary Materials.
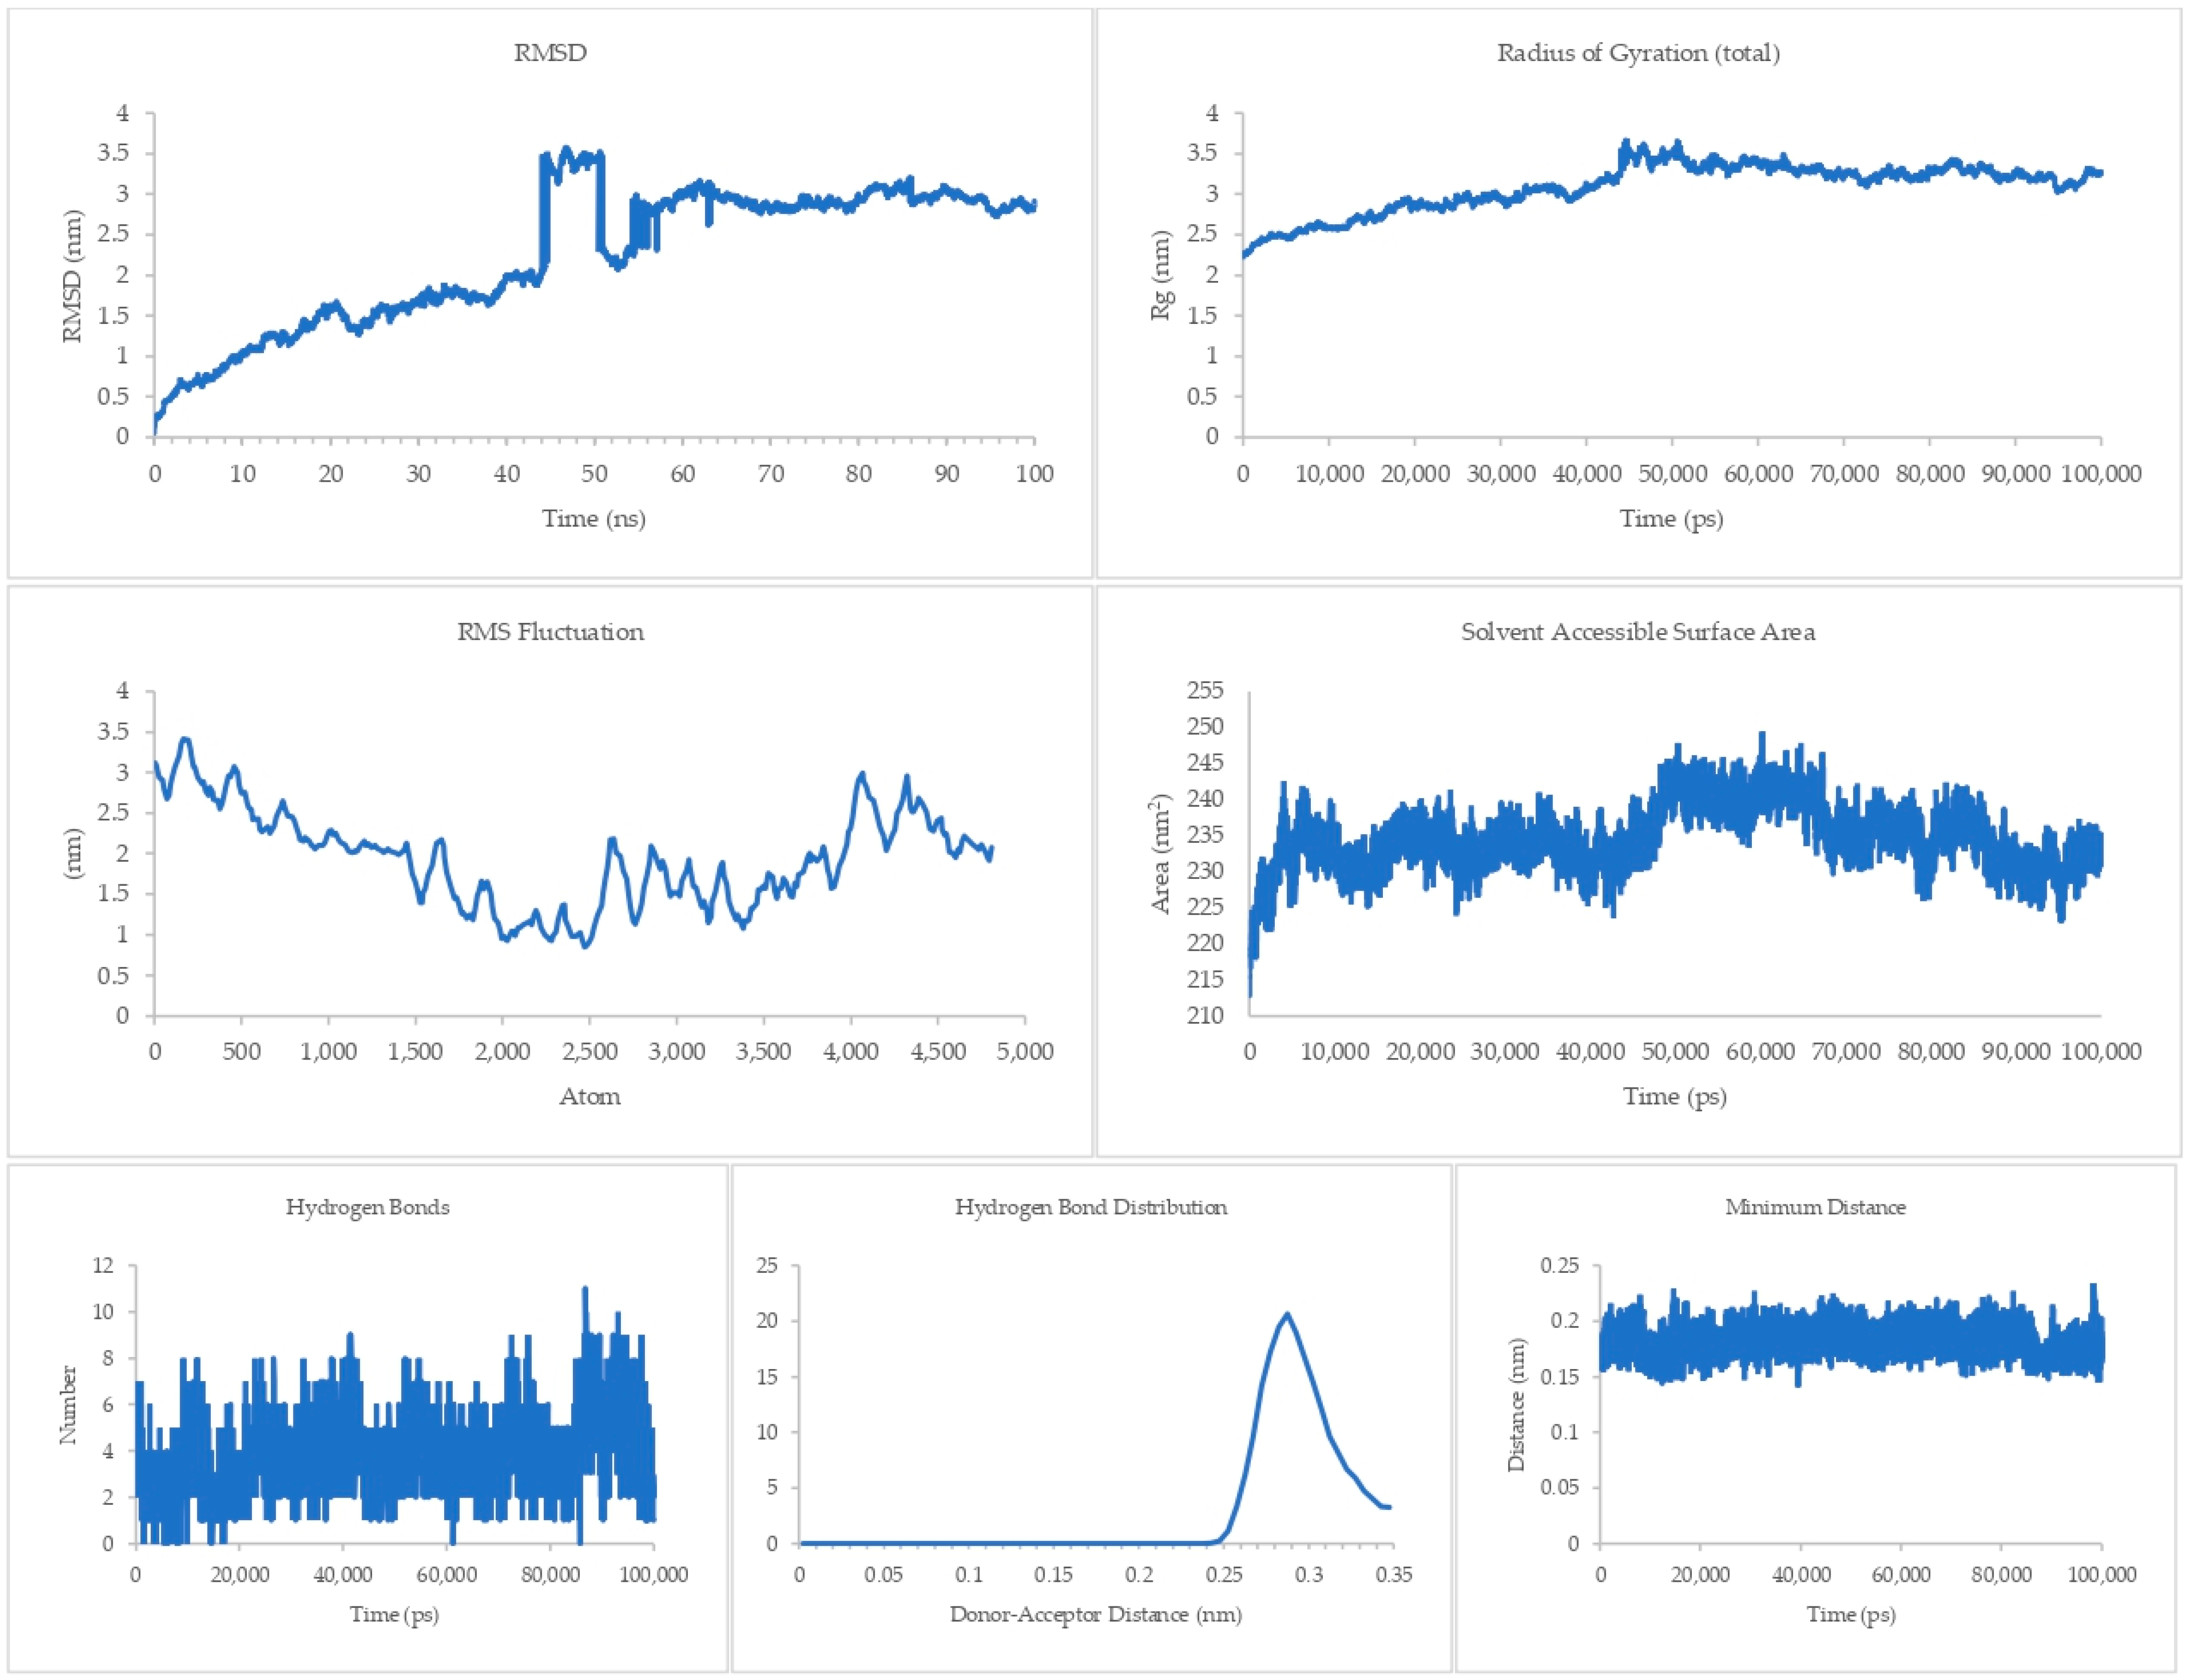
The equilibrium state of the peptide–receptor pair is explored in molecular dynamics simulations. Noted in Figure 7 are the results for the DR-4-Q system, which had the lowest MMPBSA score in the initial runs. Extending the simulation to 100 ns shows that the complex is able to fully stabilize only at t > 70 ns, where the RMSD value ranged from 3 to 3.5 nm only. These high RMSD values signify significant conformational changes in the system. A sharp rise can be seen between the 40 to 50 ns time interval, which then dips back to normal by the 50 to 60 ns mark. This may be due to transitional changes in the configuration of the system brought about by temporary conformational changes in secondary structure or changes induced by solvation. The magnitude of the RMSD is high for this system, which signifies that there is a great degree of conformational change happening to the complex, implying a high degree of flexibility. This is carried over to the RMSF and Rg values, which are about the same magnitude as that of the RMSD, again noting the high flexibility of the bonds in the system. This can be connected the presence of only a small number of Cys residues in DR4’s sequence [27]. This then merits flexibility due to a lack of significant disulfide linkages within the receptor. Interestingly, the Rg plot is flatter than that of the RMSD, but the rise is reflected at the 40 to 50 ns mark. The SASA plot notes that solvents can intrude the system, which is in agreement with the flexibility notions being pointed out by the latter three parameters.
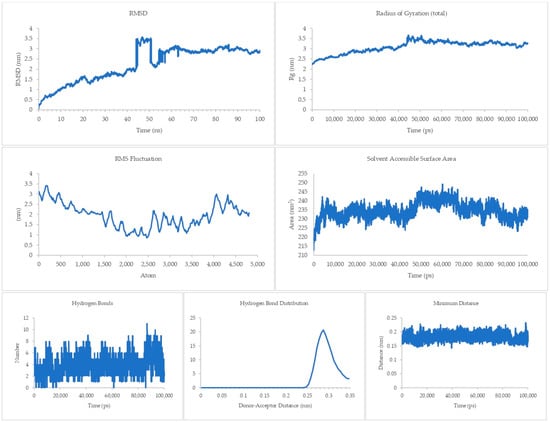
Figure 7.
100 ns molecular dynamics results for the death receptor 4 and Q system.
Although the four main parameters are high, it can be gathered from the hydrogen bonds, hydrogen bond distribution, and minimum distance that the system is indeed just very flexible and that the complex does not dissociate. This is most salient in the minimum distance plot straddling from 0.15 to 0.25 nm and the hydrogen bond distribution staying mostly at 0.29 nm. This then confirms that at equilibrium the system can associate and can stay associated for a period of time.
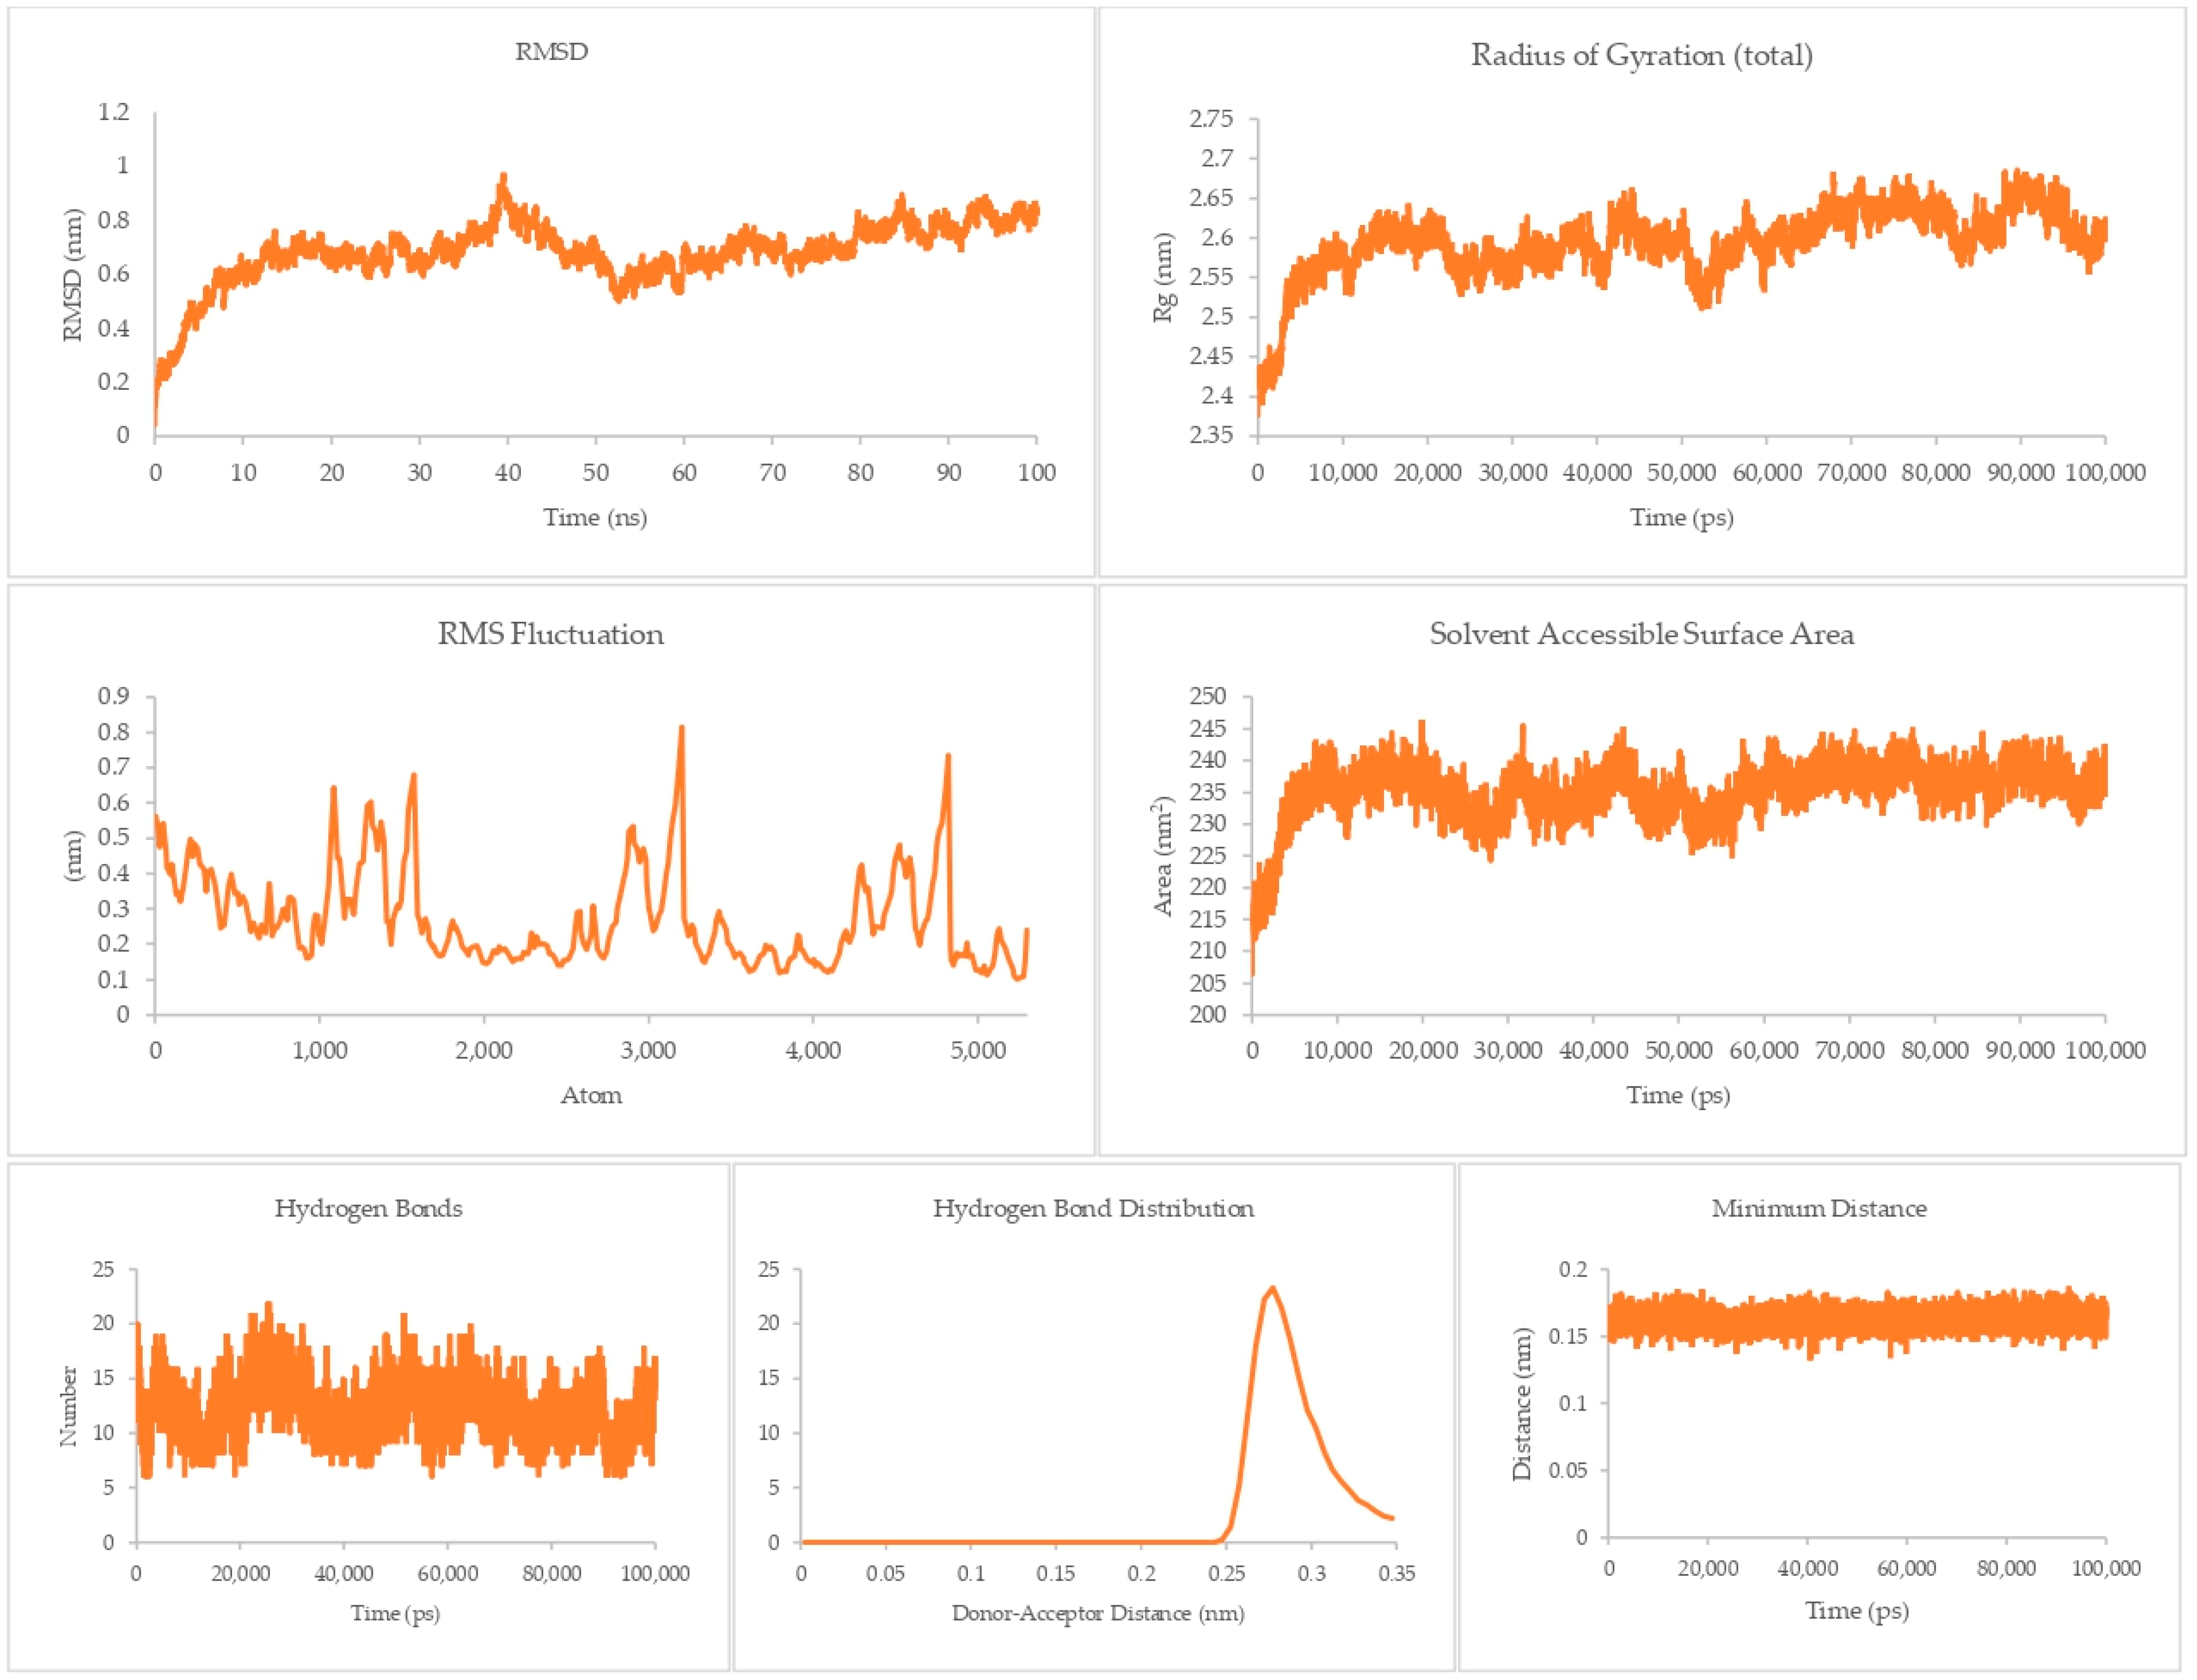
The theraphotoxin Q also showed the lowest MMPBSA score in the initial screening for DR-5. For the DR-5-Q system, as presented in Figure 8, a more consistent RMSD can be seen, as the graph does not have any sudden rises and dips throughout the simulation time. Apart from the peak at around 40 ns, there is a slow and steady rise in the latter part of the graph. Numerically, the RMSD values of this system only ever approach 1 nm, indicating a more rigid structure as compared to the DR-4-Q system. This is consistent with the RMSF values per atom, which never exceed the 1 nm mark, indicating less flexibility. The Rg, however, is much more in line with the Rg profile of the DR-4-Q system, where the Rg values of the system go over 2 nm. Still, the profile only ever goes between 2.5 to 2.7 nm in the latter half of the simulation time; thus, the system is able to hold its conformation. In terms of SASA, there is a similarity between the profile and numerical values of this system and the previous, which can be attributed to the fact that the same peptide was used and that DR-4 and DR-5 are similar structure-wise. Given that this is the case, solvents may intrude but cannot destroy the docked conformation.
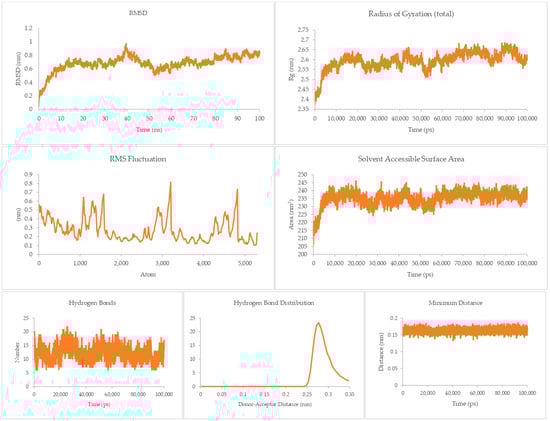
Figure 8.
100 ns molecular dynamics results for the death receptor 5 and Q system.
Auxiliary parameters such as hydrogen bonds, hydrogen bond distribution, and minimum distance mirror those of the DR-4-Q system in terms of profile and numerical value, ratifying the stability of the complex at equilibrium.
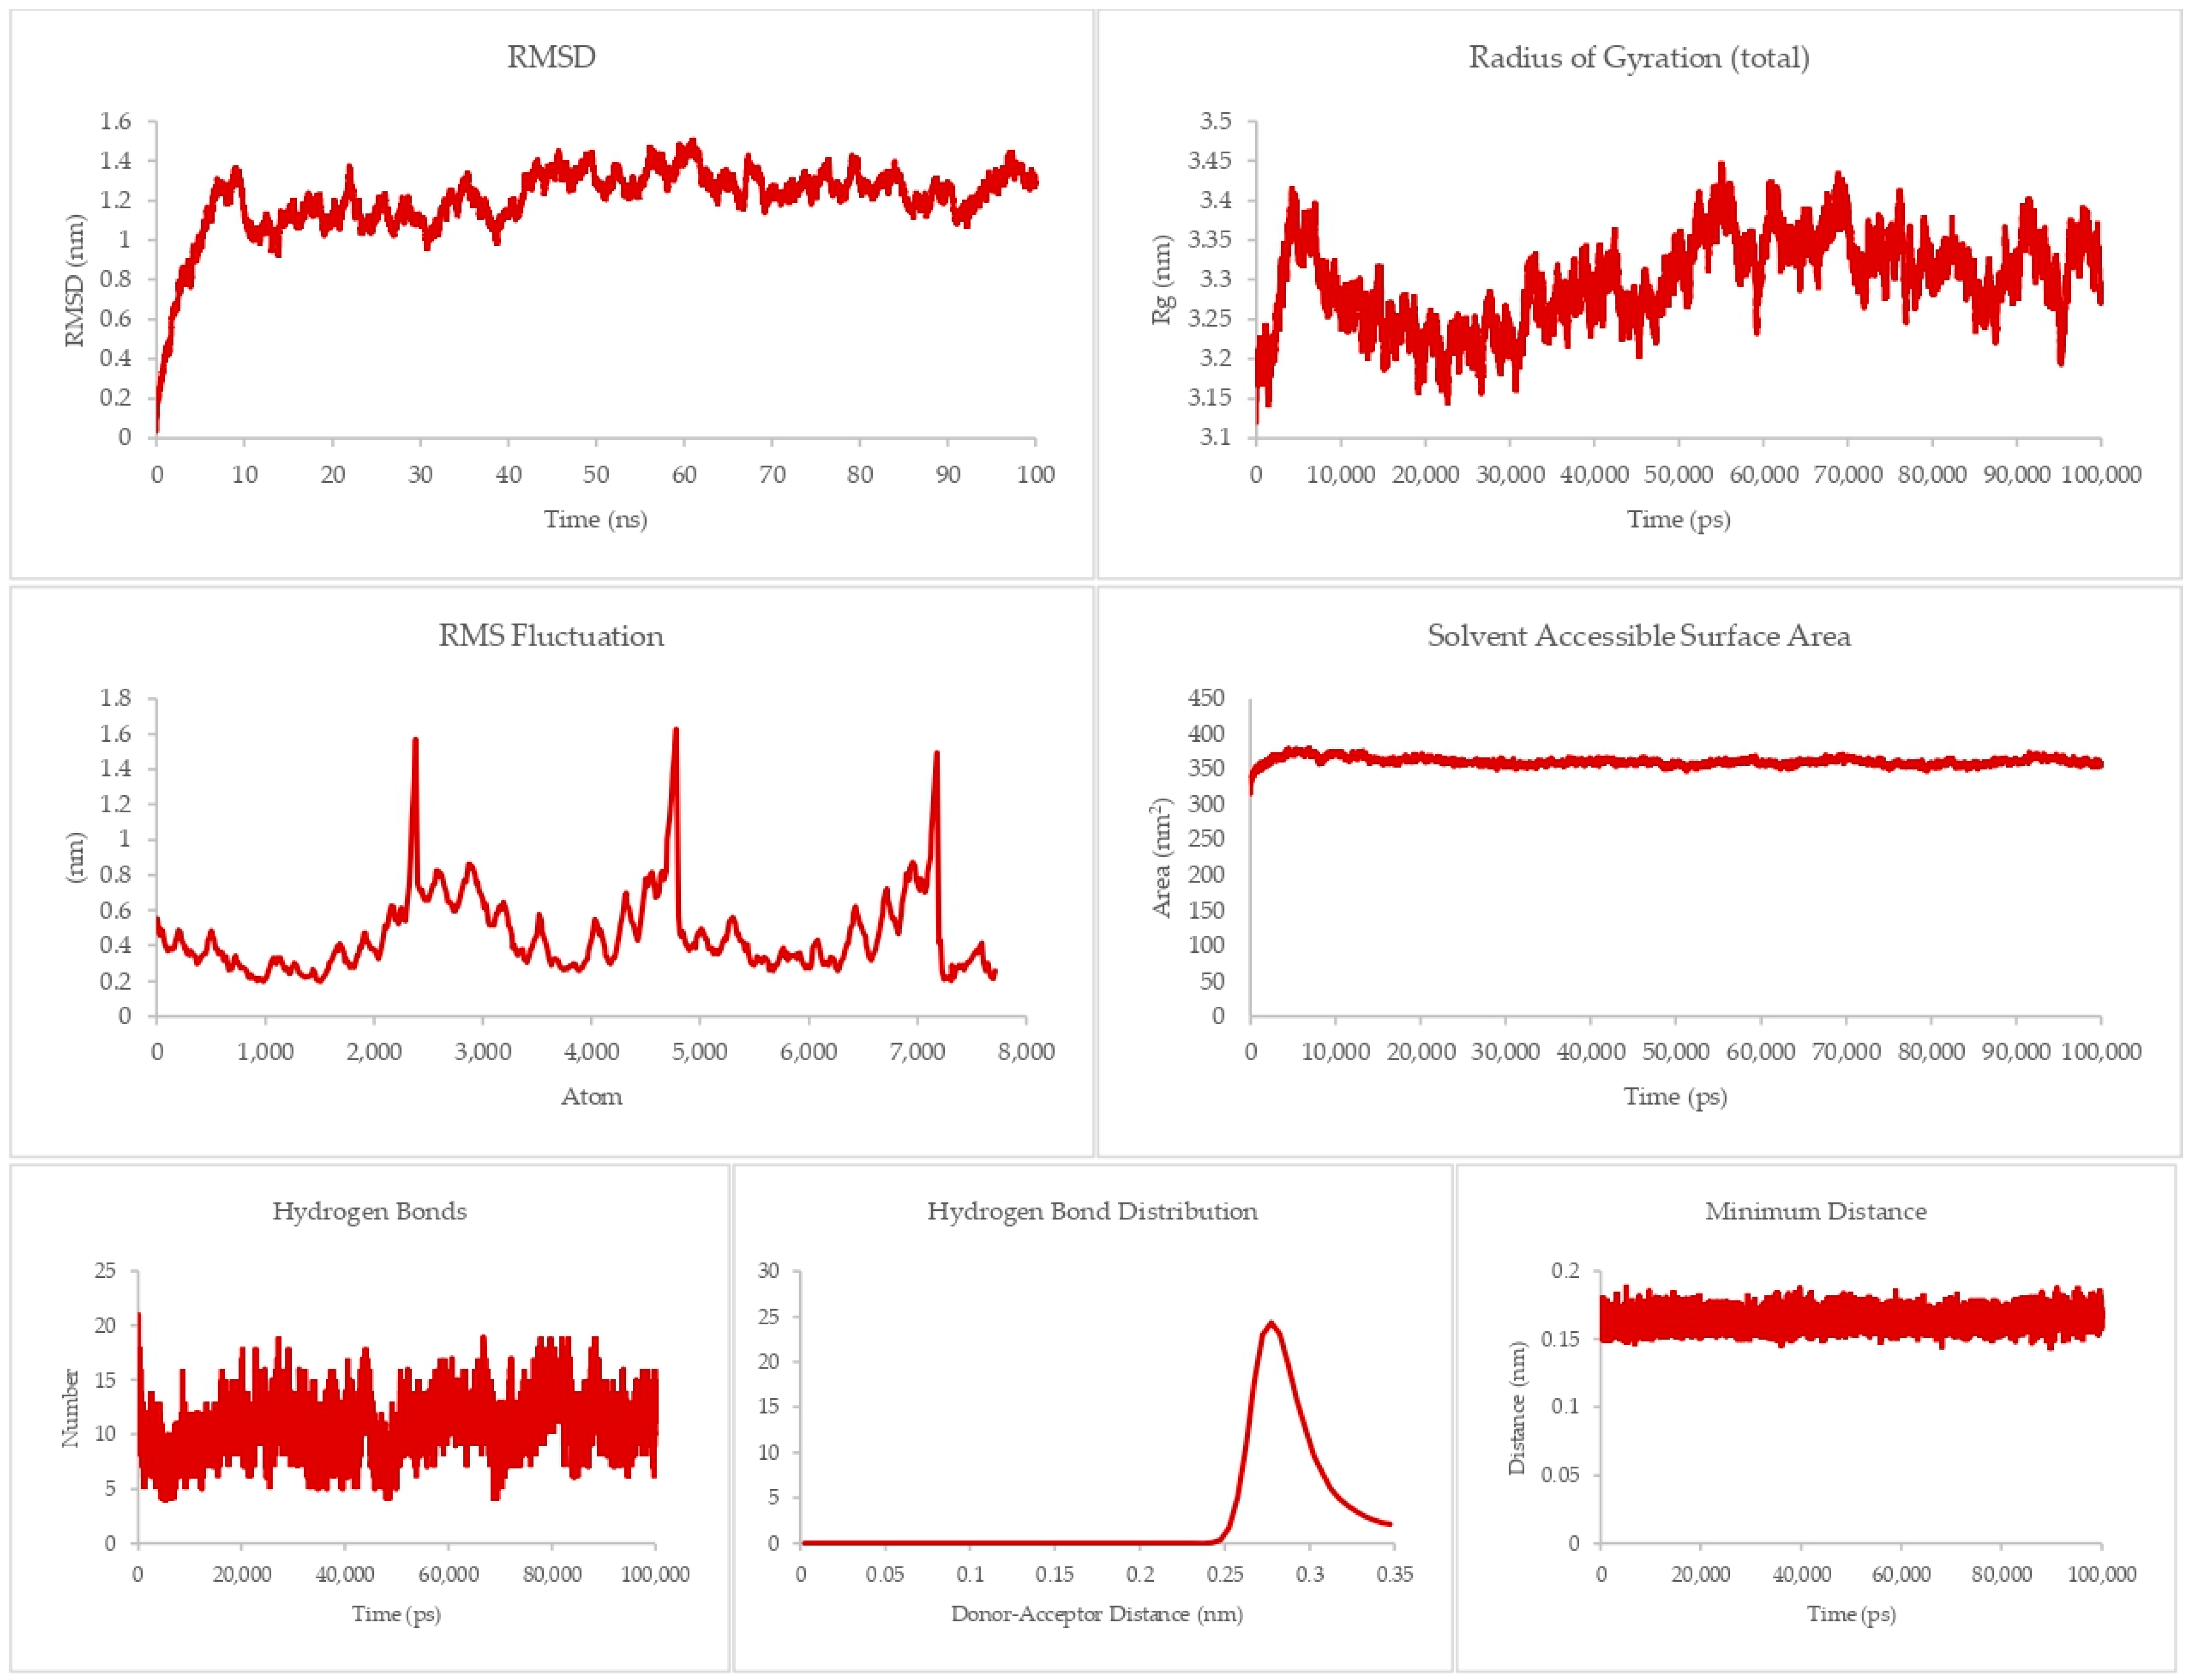
A different trend can be gleaned from the TNFR-1-A system, as shown in Figure 9. The RMSD ranges from 0.8 to 1.4 nm in the majority of the run. Although the magnitude of the RMSD is not as great as that for the DR4-Q system, the rises and dips throughout this system imply some conformational flexibility, as was observed for DR5-Q. This is supported by the RMSF where there are sharp rises, indicating that some atoms experience a great degree of change from their initial positions, and of the Rg, where the profile sees more ups and downs than the previous two systems, implying its greater susceptibility to conformational changes. Still, the magnitude of the conformational changes is not enough to destroy the complex. The SASA’s profile is interesting, as it plateaus to a value of around 350 cm2. This shows that the system is much less susceptible to intrusion by solvents.
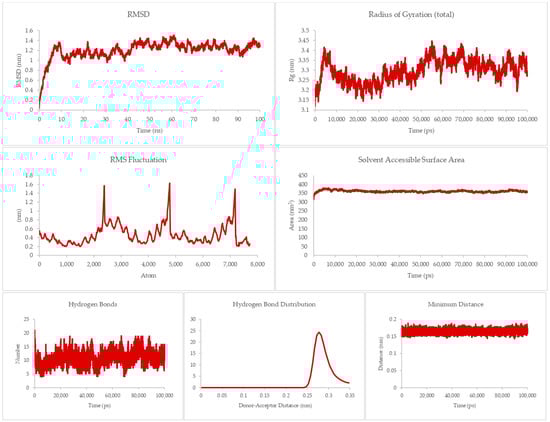
Figure 9.
100 ns molecular dynamics results for the TNFR-1 and A system.
Hydrogen bond, hydrogen bond distribution, and minimum distance are still the same as in the previous systems, suggesting good overall stability for the associated complex.
Another unique scenario can be seen for the Fas-I system, as given in Figure 10. The RMSD profile relatively stays flat, disregarding the transient blips at around 80 and 90 ns. Magnitude-wise, it is similar to DR-5-Q, given that towards the end of the run, the RMSD settles at above 2.5 nm. This behavior shows that the system is more consistent with the degree of deviations from the initial state, unlike the other previous systems where the presence of rises and falls throughout the system implies flexibility fluctuations. The flexibility of the system is supported by the rises and falls in the RMSF plot, where there are some groups that are more susceptible to changes in conformation than others. The Rg and SASA plots are predominantly plateau-like, suggesting some form of complex stability in that it cannot be easily disrupted by intramolecular (folding on itself) and intermolecular (solvent) agents which call for the dissociation of the complex.
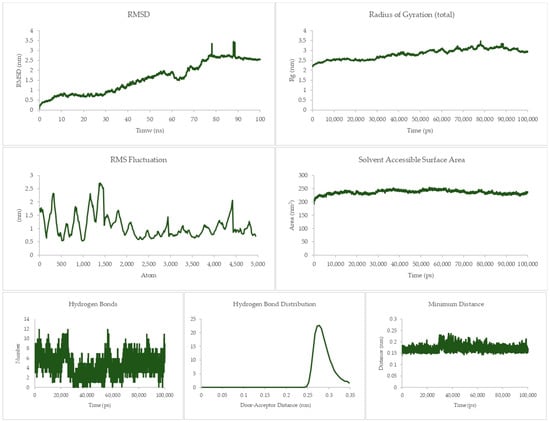
Figure 10.
100 ns molecular dynamics results for the Fas and I system.
The other three parameters are still the same as for the previous systems, which still solidify the notion of stability of the complex.
The four different profiles show that the DR-4 and DR-5 systems behave differently upon association with peptide Q, even though these receptors are from the same family and are structurally similar. Flexibility is the greatest in the DR-4 system and the least in DR-5.
No other peptides besides Q are shared with the other receptors, and thus a definitive comparison cannot be drawn. From the plots, it can be gleaned that the complexes show varying degrees of flexibility upon association, with some being more rigid than others. These can then mirror the behavior of the systems in the body. Although these are the case, two parameters are consistent with the four systems—the hydrogen bond distribution and the minimum distance between receptor and peptide. The lack of significant deviations in these plots allows us to conclude that the systems will not spontaneously dissociate appreciably, meaning that the docked conformations are favored.
The ultimate measure of the receptor–peptide complexes’ stability is in the end-state binding energy, given in ΔG. MMPBSA calculations were initiated, as this model accounts for electrostatics. This model gave lower ΔG values than MMGBSA during the initial end-state thermodynamics calculations. For the four final systems, a chart of the ΔH, TΔS, and ΔG is given in Figure 11. Here, the most negative ΔG value is associated with the DR-5 system, while the highest is that of the Fas. This means that the association of DR-5 and Q is the most energetically favorable out of the four systems, while Fas, being the only system with a positive ΔG value, is the least stable. This also implies that the association will not be appreciable at equilibrium. Other than that, all other three exhibit a favorable association, making these systems stable at equilibrium.
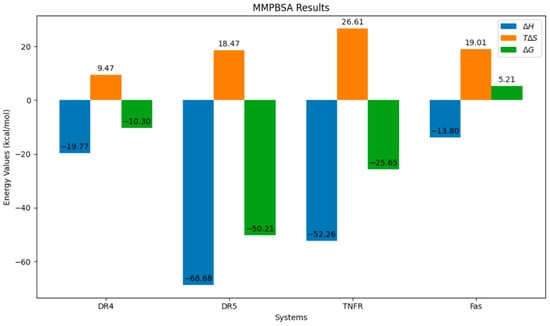
Figure 11.
End-state thermodynamics results of the four systems.
3.4. ADMET Evaluation
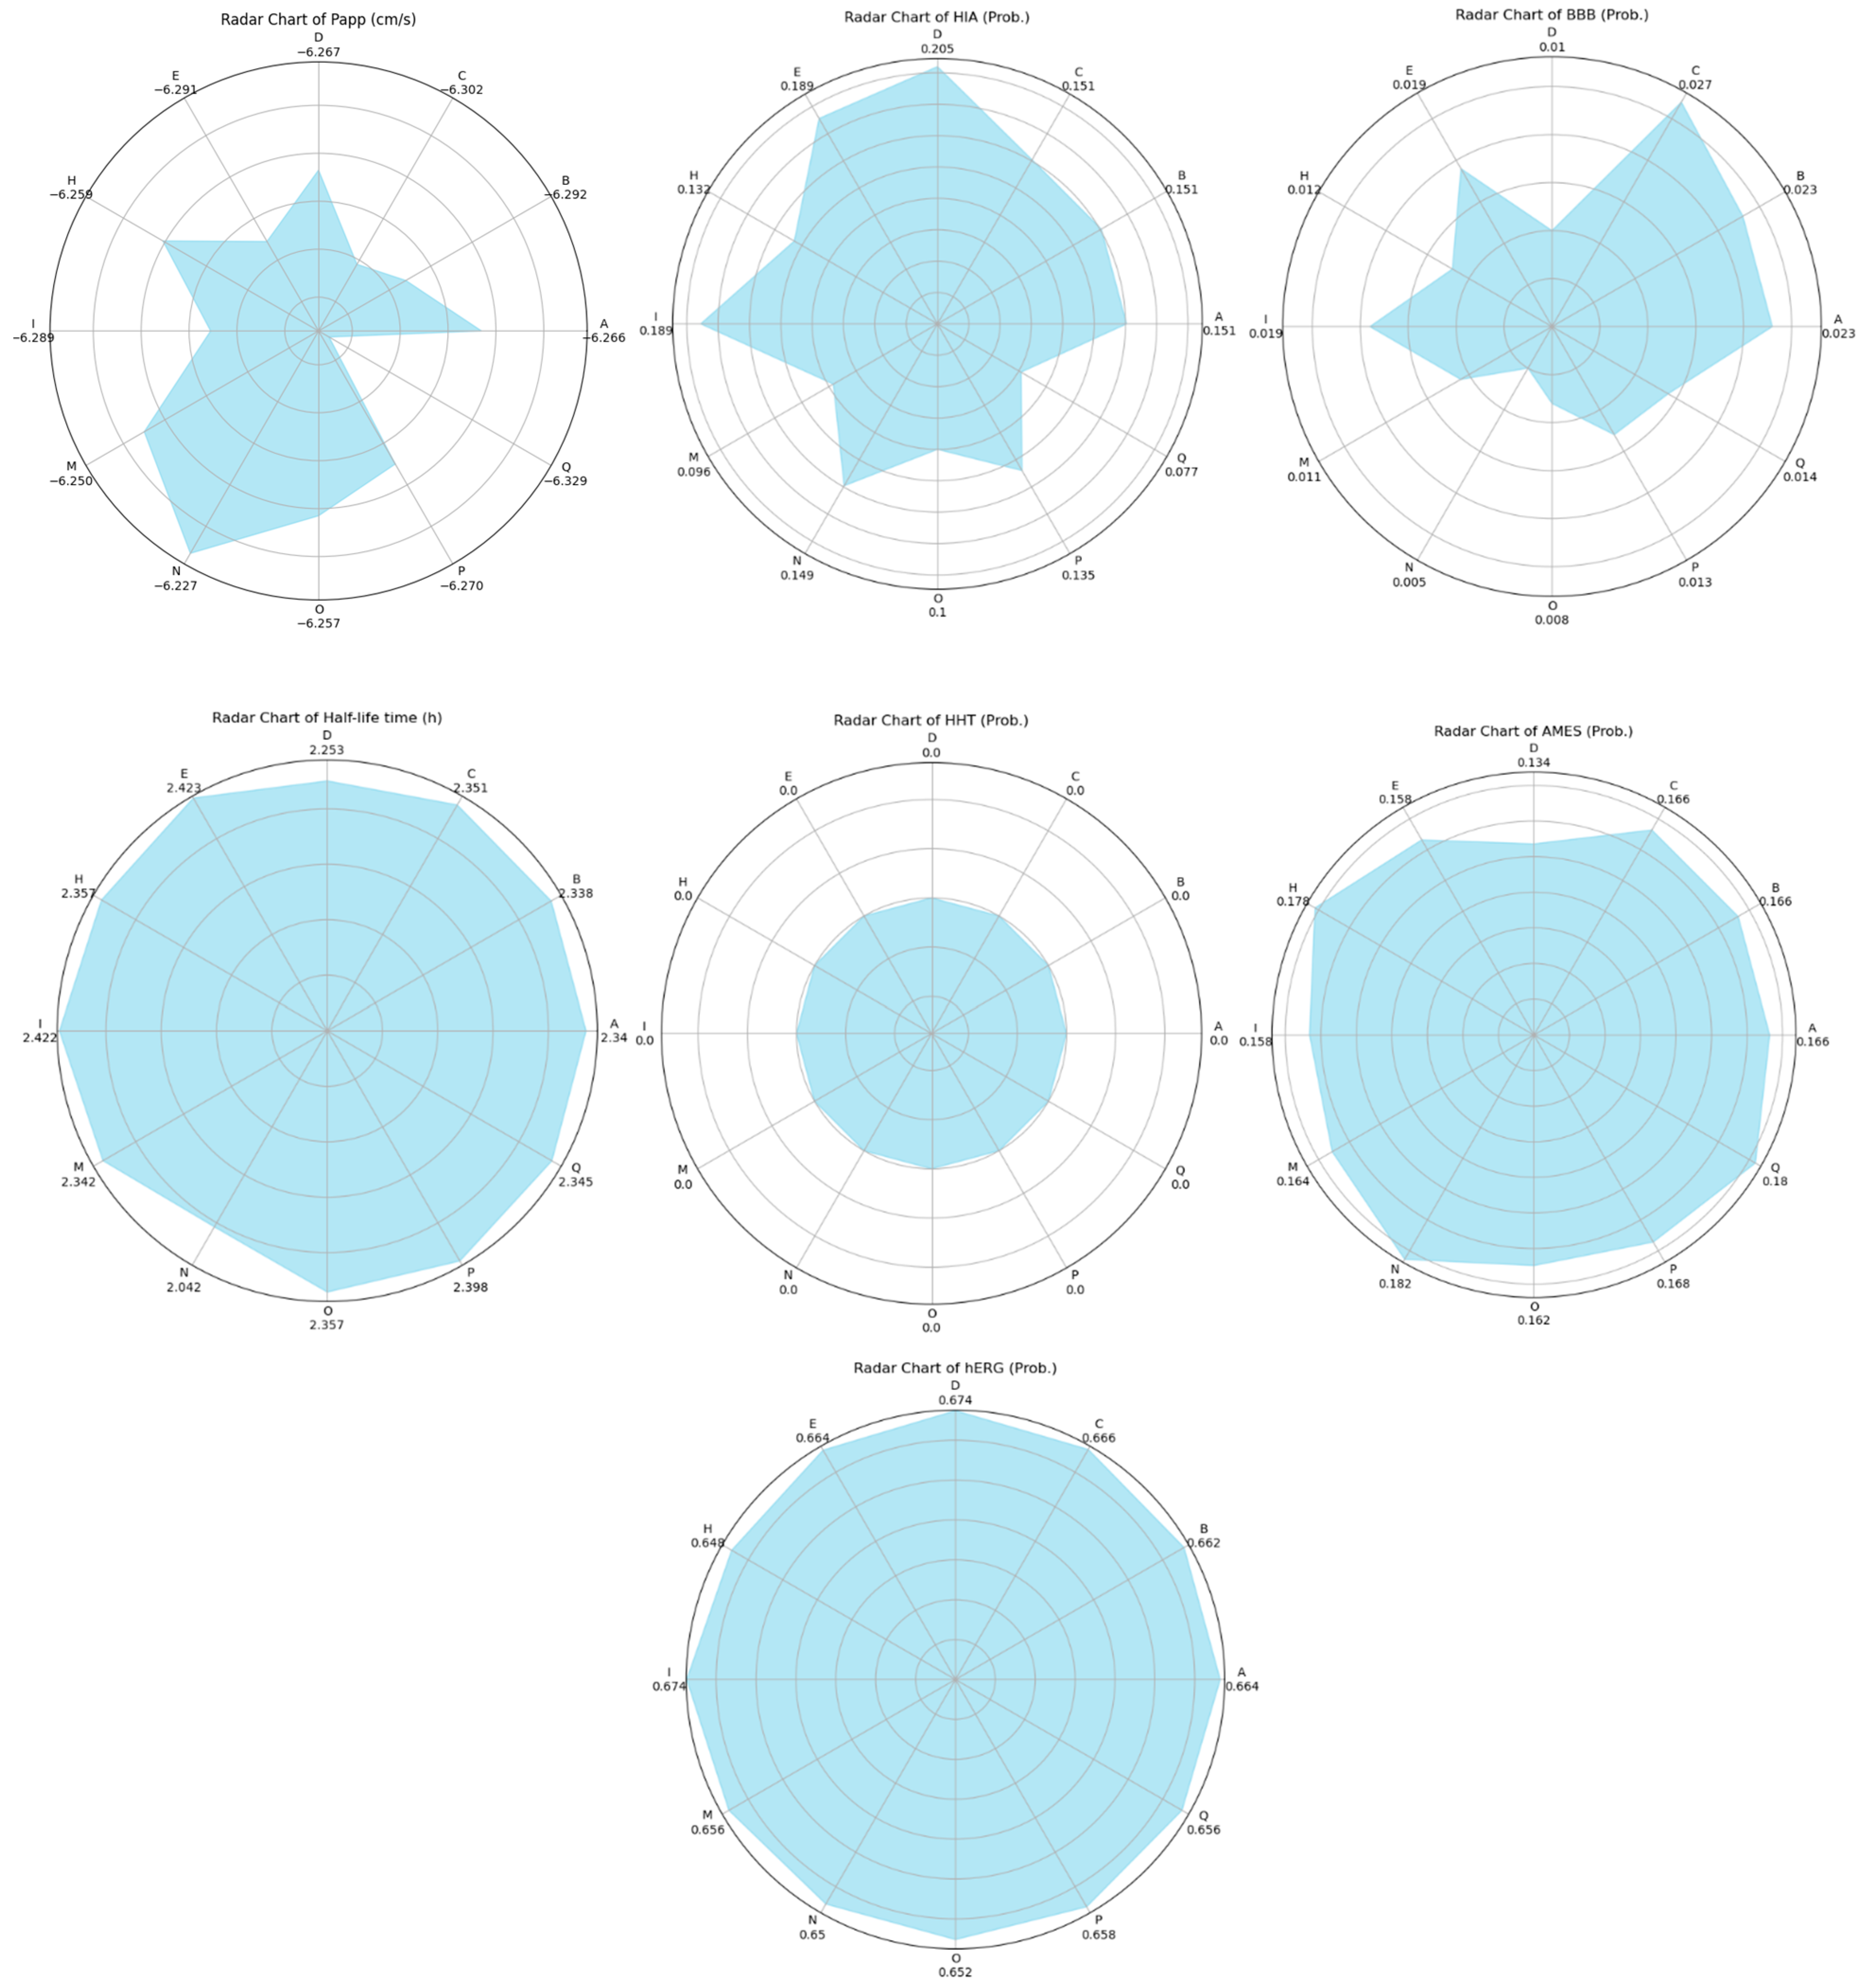
The results of a comprehensive ADMET evaluation of the theraphotoxins used in the molecular docking and dynamics simulations are given in Figure 12, while the numerical values of these parameters are given in Table S6 of the Supplementary Materials.

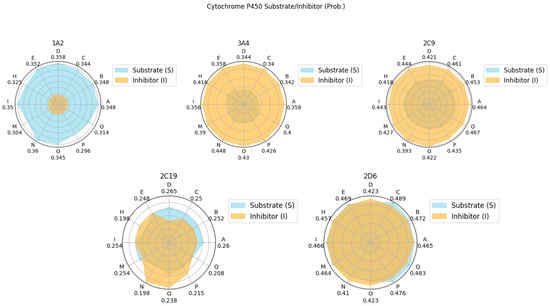
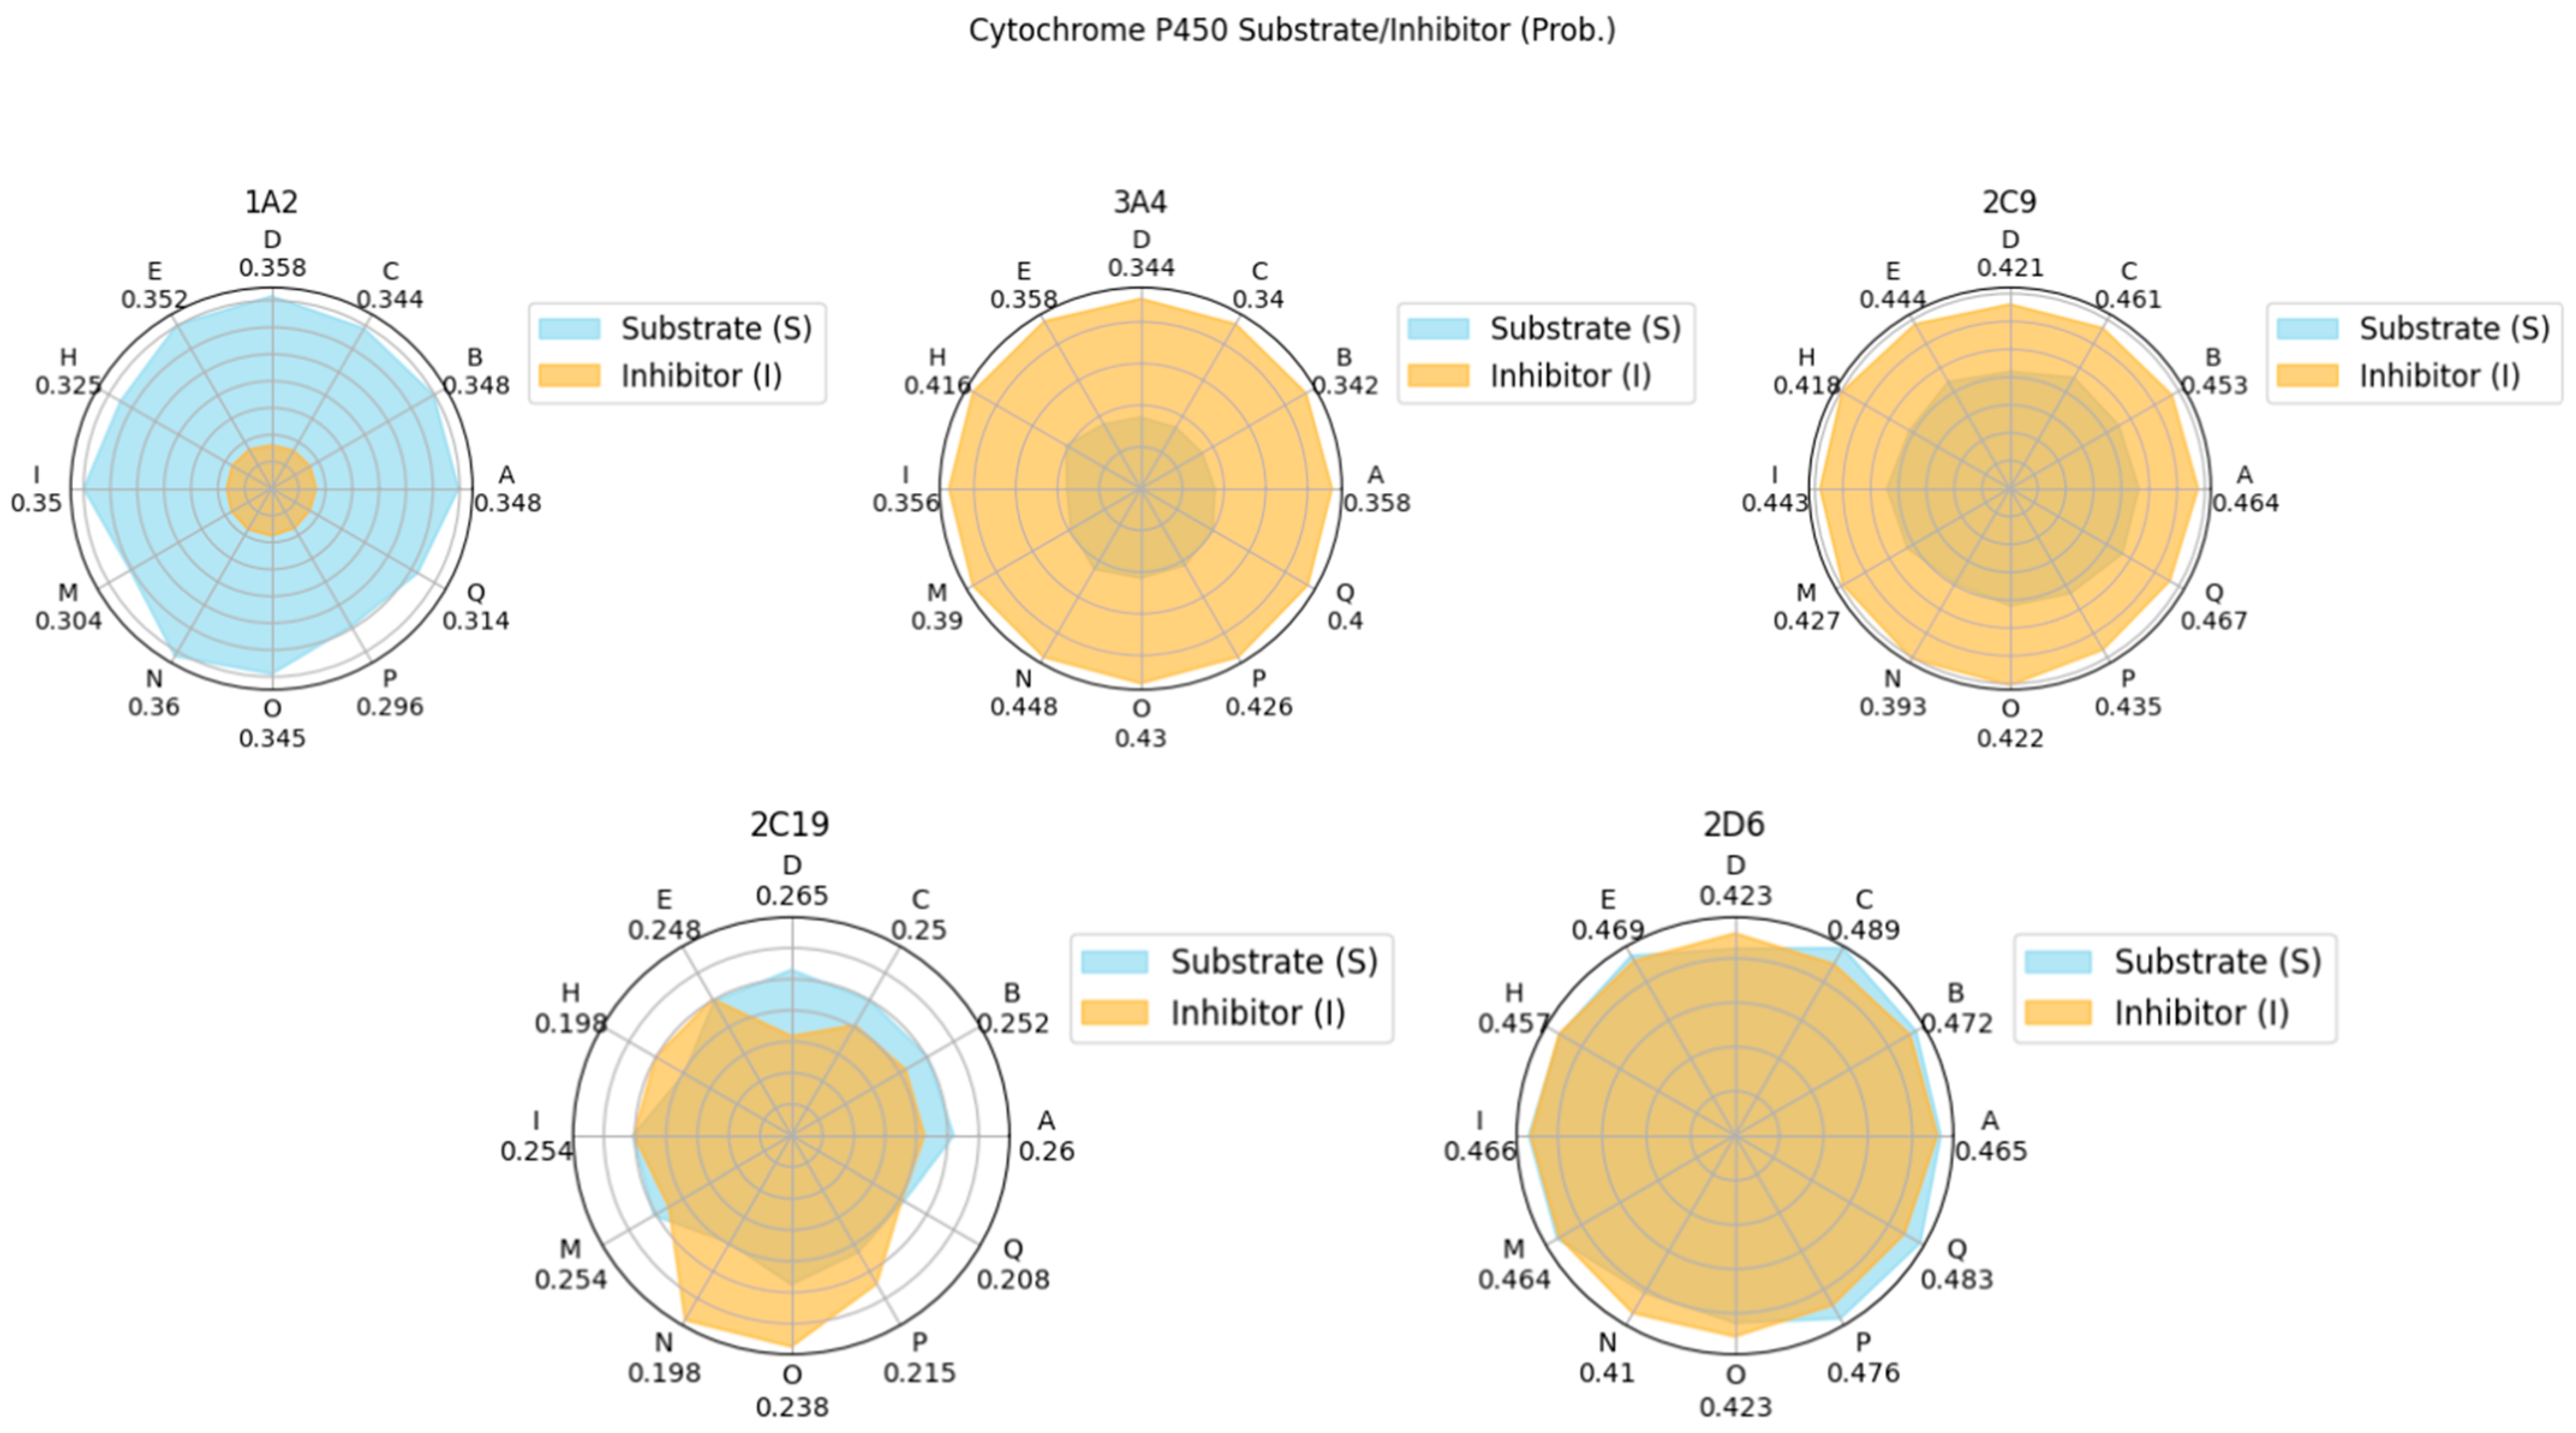
Figure 12.
Radar plots of the ADMET characteristics of simulated theraphotoxins. Numerical values in Cytochrome P450 plots correspond to their probability as substrates.
Papp values correspond to the intestinal permeability of drugs by using the Caco-2 monolayer cell model derived from human colorectal carcinoma and is a measure of the ease of permeation of drugs in the intestine. Good Papp scores for drugs have values that are more negative (or greater in magnitude) than −5.15 cm/s [77]. Given that all the peptides have Papp scores of around −6, this shows that these peptides can easily permeate into the intestine.
Complementary to this is the HIA, which evaluates the absorption of drugs into the intestinal mucosa [78]. Although the permeability of the theraphotoxins is high, their absorption is relatively low. Thus, the challenge arises to engineer the peptides to improve absorptivity while retaining permeability in formulation, should they eventually become therapeutics. The two seemingly contradicting results can be further investigated by in vitro experimentation to fully gauge whether the absorption of the peptide is indeed favorable or not.
BBB refers to the probability that these drugs will cross the blood–brain barrier. It can be seen in Figure 12 that the BBB values are very low, indicating that the penetration of these drugs into the blood–brain barrier is highly unlikely, which is the expected case given that the samples are peptides bearing a nonzero net charge; ideal molecules that can cross the said barrier will only have molecular masses of 400 to 600 Da and be highly hydrophobic [79]. This means that the peptides are not suitable for cancers that affect the brain, as they are unable to pass through, unless conjugated to drug delivery systems to assist their passage.
Cytochrome P450 (CYP) is a family of various ubiquitous enzymes which have differing functions, with isoforms 1A2, 3A4, 2C9, 2C19, and 2D6 being heavily involved in drug metabolism. Here, the theraphotoxins are screened for their possibility to act either as a substrate or as an inhibitor to these enzymes [80,81]. The peptides were found to have a higher probability of being a substrate for CYP1A2 and CYP2C9, while the opposite was observed for CYP3A4. In CYP2C19, the probability of the peptides being both substrates and inhibitors is quite low. For CYP2D6, the probability of these peptides being either substrates or inhibitors are comparable, both having medium probability. As the interaction of these peptides with various CYP isoforms differ, potential effects on the pharmacokinetics of other drugs taken simultaneously by target patients must be considered [82].
The half-life provides a measure of how long the drug stays within the body. Ideally, drugs should remain in the body for >0.5 h. Drugs that stay for <3 h are categorized as low, those that stay from 3 h to 8 h are moderate, and those that stay >8 h are high [83]. All the half- life values of the peptides are over 2 h; this means that half of the amount of peptides initially administered would have already been metabolized by the body after 2 h. This provides a baseline for drug dosing. It must then be carefully studied whether the peptide has already performed its function by the time half of it has been flushed out of the body.
H-HT refers to the possibility of a drug to damage the liver. Given that all of the peptides have zero as their probability for hepatotoxicity, this tells us that they are H-HT-negative, meaning they do not pose a significant threat to the liver in terms of toxicity to hepatocytes [84].
AMES, or Ames mutagenicity, refers to the probability of a therapeutic to induce genetic mutations. These genetic mutations may come as harmless, beneficial, or both [85]. Given that the peptides have low probability values, it may be construed that they are not likely to induce genetic mutations in their hosts. The magnitude and extent of the mutagenicity, and the manifestation of such mutations, is another potential area for study.
hERG blockers are substances that block the human-ether-a-go-go-related-gene (hERG) K+ channels responsible for cardiac repolarization. The blocking of these ion channels may increase the risk of arrythmia, and is thus evaluated to ascertain the possibility that a drug might be potentially pro-arrhythmic [86]. In Figure 12, all peptides have hERG probability values of around 0.6, meaning that they have medium probability of blocking hERG channels and being pro-arrhythmic. This potential of theraphotoxins to be hERG blockers may be connected to the inherent property of theraphotoxins to bind and inhibit voltage-gated ion channels such as that of Na+, K+, and Ca2+ in their prey, with some studies pointing to certain toxins from Chilobrachys jingzhao that can inhibit the hERG channel as gating modifiers [8,87]. Although no cases have been noted wherein tarantula bites have induced heart attacks in humans, this property must still be revisited and improved upon when engineering peptides for administration as anti-cancer drugs to minimize or fully prevent this side-effect from occurring. Drug design studies have pointed to modifications such as decreasing lipophilicity and lowering basicity to lessen the negative effect of hERG blocking [88].
Dose lethality is commonly measured with LD50, which is the dose of a substance required to kill 50% of tested animals within a specified time frame. Low toxicity merits LD50 values > 500 mg/kg [89]. In Figure 12, the LD50 values of the theraphotoxins are significantly greater than this 500 mg/kg threshold limit, indicating that they are very much low in toxicity.
In summary, the ADMET characterization of the theraphotoxins yielded favorable results in Papp, half-time life, H-HT, AMES, and LD50. Areas that need to be considered for improvement include HIA, CYP, and hERG, especially the latter, as it is connected to the cardiac cycle. Modifications in these parameters are needed in order to optimize the positive effects of the administration of the peptides while minimizing the deleterious ones. This then opens up the avenue for further research on engineering theraphotoxins as effectors of death receptors.
Although these results present a predominantly favorable ADMET evaluation of the theraphotoxins, there is limited available information on the ADMET evaluation of actual therapeutics being tested as activators of the extrinsic apoptotic pathway. A well-studied activator is lexatumumab, a recombinant monoclonal antibody derived from a mouse myeloma cell line that affects DR-5. Pharmacokinetic analysis during Phase I trials of the therapeutic showed that it is well tolerated up to 10 mg/kg for 14 days, with minimal toxicity to its hosts with various solid cancers [90]. Studies on lexatumumab showed that patients experienced fatigue, pain in the tumor site, hypokalemia, and transaminitis [91]. The therapeutic is still in its experimental stage and as such, further studies are needed to fully understand its mechanism, toxicity, and selectivity.
An extensive in silico evaluation of the binding, stability, and ADMET properties of these theraphotoxins has yielded results which are both beneficial and harmful to some extent. Although the stability and thermodynamics of binding are favorable, as well as with some ADMET properties, the biggest challenge comes from improving the peptide’s interactions with hERG channels, the blockage of which may incur arrhythmia. As these results are computational in nature, the results are then only theoretical in nature and should not be taken as actual proof that theraphotoxins can bind to death receptors. Apoptosis is a complex process that involves signal transductions that prime a cell for its death. The paper only explored the first part of this pathway, which is the binding of a ligand onto a death receptor. It is essential and highly important that in vitro and in vivo studies that explore the real-life interactions between the theraphotoxins and death receptors in living organisms are carried out in order to validate the results of this paper. Although such studies involve tedious processes of venom extraction, purification, and characterization prior to the actual investigations to assess their interactions with death receptors in living organisms, the narrowing down of target receptors to investigate helps bring down costs for resource usage. Careful planning of experiments is needed in order to further ensure efficient use of resources while maximizing data gathering. In theory, theraphotoxins are good potential apoptosis-inducing peptides due to their favorability in binding to death receptors. Actual experiments would truly greenlight their viability as therapeutics, especially as potential cancer therapeutics.
4. Conclusions
The study probed the possibility of using theraphotoxins as apoptosis-inducing therapeutics by carrying out anti-cancer screening, molecular docking, molecular dynamics, thermodynamics analysis, and ADMET evaluation. Here, the theraphotoxins were found to have mild anti-cancer viability, exhibit some ideal physicochemical properties expected of anti-cancer peptides, bind favorably with death receptors in terms of end-state thermodynamics, have stabilities comparable to that of the associated death ligands, and have some good ADMET properties such as Papp, half-time life, H-HT, AMES, and LD50. Parameters such as HIA, CYP, and hERG must be improved, along with experimental validation on the various parameters elucidated in this paper, to fully realize theraphotoxins as a potential apoptosis-inducing therapeutic for cancer suppression.
Future studies may also choose to re-evaluate the results of this paper and carry out further analysis in terms of molecular docking, molecular dynamics, thermodynamics analysis, and ADMET evaluation, or carry out other tests such as phylogenetic analyses and quantitative structure–activity relationship analyses to improve the current landscape of theraphotoxin cancer therapeutic studies.
Supplementary Materials
The following supporting information can be downloaded at: https://www.mdpi.com/article/10.3390/app14198701/s1, Figure S1. Hydrogen Bond Interactions for Peptide-DR-4 System. (a) D, (b) E, (c) B, (d) Q. Figure S2. Hydrogen Bond Interactions for Peptide-DR-5 System. From top to bottom, left to right: (a) Q, (b) H, (c) O, (d) P. Figure S3. Hydrogen Bond Interactions for Peptide-TNFR-1 System. From top to bottom, left to right: (a) A, (b) B, (c) M, (d) C. Figure S4. Hydrogen Bond Interactions for Peptide-Fas System. From top to bottom, left to right: (a) O, (b) N, (c) I, (d) M. Figure S5. Graphs of Molecular Dynamics Simulation Results on Ligand-Death Receptor 4 Complex. The color coding is as follows: D—red, C—green, B—blue, Q—orange. Figure S6. Graphs of Molecular Dynamics Simulation Results on Ligand-Death Receptor 5 Complex. The color coding is as follows: Q—red, H—green, O—blue, P—orange. Figure S7. Graphs of Molecular Dynamics Simulation Results on Ligand-TNFR-1 Complex. The color coding is as follows: A—red, B—green, M—blue, C—orange. Figure S8. Graphs of Molecular Dynamics Simulation Results on Ligand-Fas Complex. The color coding is as follows: O—red, N—green, I—blue, M—orange. Table S1. Anti-Cancer Score of the Top 20 Theraphotoxins and Their Physicochemical Properties. Table S2. Molecular Docking Results of Theraphotoxin and Death Ligands on Death Receptors. Table S3. Residues Exhibiting Hydrogen Bonding Between Theraphotoxins and Death Receptors. Table S4. Thermodynamic Profile of the Theraphotoxins and Death Ligand Binding onto Death Receptors Based on MMGBSA. Table S5. Thermodynamic Profile of the Theraphotoxins and Death Ligand Binding onto Death Receptors Based on MMPBSA. Table S6. ADMET Characteristics of Simulated Theraphotoxins.
Author Contributions
Conceptualization, J.I.R.Q.; methodology, J.I.R.Q.; validation, L.L.T.; formal analysis, J.I.R.Q.; investigation, J.I.R.Q.; resources, J.I.R.Q.; data curation, J.I.R.Q.; writing—original draft preparation, J.I.R.Q.; writing—review and editing, J.I.R.Q., L.L.T., P.M.P.T.F.; visualization, J.I.R.Q., P.M.P.T.F.; supervision, L.L.T., P.M.P.T.F.; project administration, L.L.T. All authors have read and agreed to the published version of the manuscript.
Funding
This research received no external funding.
Institutional Review Board Statement
Not applicable.
Informed Consent Statement
Not applicable.
Data Availability Statement
Publicly available datasets were analyzed in this study. The data can be found here: Human Protein Atlas: [https://www.proteinatlas.org/, accessed on 14 April 2024]; Arachnoserver: [https://arachnoserver.qfab.org/mainMenu.html, accessed on 13 August 2023]; Protein Data Bank: [https://www.rcsb.org/, accessed on 13 August 2023]. Other data related to the article can be seen within the article or in the Supplementary Materials.
Acknowledgments
This paper would like to acknowledge and extend its warmest thanks to the various institutions responsible for allowing in silico biochemical studies to be carried out, especially those who developed the following: AntiCP 2.0, PEP-FOLD 3, MolProbility, T-Coffee, HADDOCK2.4, GROMACS, UCSF ChimeraX, PyMOL, Autodock, Autodock Tools, VMD, XMGrace, gmx_MMPBSA, and Admetlab. This paper would also like to acknowledge the following internet repositories—RCSB PDB and Arachnoserver—for freely disseminating critical information used in this study.
Conflicts of Interest
The authors declare no conflicts of interest.
References
- Schendel, V.; Rash, L.D.; Jenner, R.A.; Undheim, E.A.B. The Diversity of Venom: The Importance of Behavior and Venom System Morphology in Understanding Its Ecology and Evolution. Toxins 2019, 11, 666. [Google Scholar] [CrossRef]
- Zancolli, G.; Reijnders, M.; Waterhouse, R.M.; Robinson-Rechavi, M. Convergent Evolution of Venom Gland Transcriptomes across Metazoa. Proc. Natl. Acad. Sci. USA 2022, 119, e2111392119. [Google Scholar] [CrossRef]
- Utkin, Y. Animal Venoms and Their Components: Molecular Mechanisms of Action. Toxins 2021, 13, 415. [Google Scholar] [CrossRef]
- Morsy, M.A.; Gupta, S.; Dora, C.P.; Jhawat, V.; Dhanawat, M.; Mehta, D.; Gupta, K.; Nair, A.B.; El-Daly, M. Venoms Classification and Therapeutic Uses: A Narrative Review. Eur. Rev. Med. Pharmacol. Sci. 2023, 27, 1633–1653. [Google Scholar] [CrossRef]
- Lüddecke, T.; Herzig, V.; von Reumont, B.M.; Vilcinskas, A. The Biology and Evolution of Spider Venoms. Biol. Rev. 2022, 97, 163–178. [Google Scholar] [CrossRef]
- Hauke, T.J.; Herzig, V. Love Bites–Do Venomous Arachnids Make Safe Pets? Toxicon 2021, 190, 65–72. [Google Scholar] [CrossRef]
- Kong, E.L.; Hart, K.K. Tarantula Spider Toxicity. In StatPearls; StatPearls Publishing: Treasure Island, FL, USA, 2022. [Google Scholar]
- Wang, Y.; Luo, Z.; Lei, S.; Li, S.; Li, X.; Yuan, C. Effects and Mechanism of Gating Modifier Spider Toxins on the HERG Channel. Toxicon 2021, 189, 56–64. [Google Scholar] [CrossRef]
- Agwa, A.J.; Tran, P.; Mueller, A.; Tran, H.N.T.; Deuis, J.R.; Israel, M.R.; McMahon, K.L.; Craik, D.J.; Vetter, I.; Schroeder, C.I. Manipulation of a Spider Peptide Toxin Alters Its Affinity for Lipid Bilayers and Potency and Selectivity for Voltage-Gated Sodium Channel Subtype 1.7. J. Biol. Chem. 2020, 295, 5067–5080. [Google Scholar] [CrossRef]
- Yu, D.; Ahmed, A.; Jayasi, J.; Womac, A.; Sally, O.; Bae, C. Inflammation Condition Sensitizes Piezo1 Mechanosensitive Channel in Mouse Cerebellum Astrocyte. Front. Cell. Neurosci. 2023, 17, 1200946. [Google Scholar] [CrossRef]
- Foley, S.; Lüddecke, T.; Cheng, D.Q.; Krehenwinkel, H.; Künzel, S.; Longhorn, S.J.; Wendt, I.; von Wirth, V.; Tänzler, R.; Vences, M.; et al. Tarantula Phylogenomics: A Robust Phylogeny of Deep Theraphosid Clades Inferred from Transcriptome Data Sheds Light on the Prickly Issue of Urticating Setae Evolution. Mol. Phylogenet. Evol. 2019, 140, 106573. [Google Scholar] [CrossRef]
- Bordon, K.d.C.F.; Cologna, C.T.; Fornari-Baldo, E.C.; Pinheiro-Júnior, E.L.; Cerni, F.A.; Amorim, F.G.; Anjolette, F.A.P.; Cordeiro, F.A.; Wiezel, G.A.; Cardoso, I.A.; et al. From Animal Poisons and Venoms to Medicines: Achievements, Challenges and Perspectives in Drug Discovery. Front. Pharmacol. 2020, 11, 1132. [Google Scholar] [CrossRef]
- Oliveira, A.L.; Viegas, M.F.; da Silva, S.L.; Soares, A.M.; Ramos, M.J.; Fernandes, P.A. The Chemistry of Snake Venom and Its Medicinal Potential. Nat. Rev. Chem. 2022, 6, 451–469. [Google Scholar] [CrossRef]
- Langenegger, N.; Nentwig, W.; Kuhn-nentwig, L. Spider Venom: Components, Modes of Action, and Novel Strategies in Transcriptomic and Proteomic Analyses. Toxins 2019, 11, 611. [Google Scholar] [CrossRef]
- Kikuchi, A.K.V.; Tayo, L.L. Principal Component and Structural Element Analysis Provide Insights into the Evolutionary Divergence of Conotoxins. Biology 2023, 12, 20. [Google Scholar] [CrossRef]
- Kikuchi, A.K.V.; Tayo, L.L.; Fowler, P.M.P.; Mailem, R.C. Computational Study on Conus Textile Conopeptides for Mediating Ion Channel Transport. In Proceedings of the 2023 10th International Conference on Bioinformatics Research and Applications, Wrocław, Poland, 9–12 October 2023; pp. 173–183. [Google Scholar] [CrossRef]
- Pennington, M.W.; Czerwinski, A.; Norton, R.S. Peptide Therapeutics from Venom: Current Status and Potential. Bioorg. Med. Chem. 2018, 26, 2738–2758. [Google Scholar] [CrossRef]
- Yanumula, A.; Cusick, J.K. Biochemistry, Extrinsic Pathway of Apoptosis. In StatPearls; StatPearls Publishing: Treasure Island, FL, USA, 2022. [Google Scholar]
- Jan, R.; Chaudhry, G.-e.-S. Understanding Apoptosis and Apoptotic Pathways Targeted Cancer Therapeutics. Adv. Pharm. Bull. 2019, 9, 205. [Google Scholar] [CrossRef]
- Diaz Arguello, O.A.; Haisma, H.J. Apoptosis-Inducing Tnf Superfamily Ligands for Cancer Therapy. Cancers 2021, 13, 1543. [Google Scholar] [CrossRef]
- Pfeffer, C.M.; Singh, A.T.K. Apoptosis: A Target for Anticancer Therapy. Int. J. Mol. Sci. 2018, 19, 448. [Google Scholar] [CrossRef]
- Papenfuss, K.; Cordier, S.M.; Walczak, H. Death Receptors as Targets for Anti-Cancer Therapy. J. Cell. Mol. Med. 2008, 12, 2566–2585. [Google Scholar] [CrossRef]
- Ukrainskaya, V.M.; Stepanov, A.V.; Glagoleva, I.S.; Knorre, V.D.; Belogurov, A.A.; Gabibov, A.G. Death Receptors: New Opportunities in Cancer Therapy. Acta Nat. 2017, 9, 55. [Google Scholar] [CrossRef]
- Di Cristofano, F.; George, A.; Tajiknia, V.; Ghandali, M.; Wu, L.; Zhang, Y.; Srinivasan, P.; Strandberg, J.; Hahn, M.; Uruchurtu, A.S.S.; et al. Therapeutic Targeting of TRAIL Death Receptors. Biochem. Soc. Trans. 2023, 51, 57–70. [Google Scholar] [CrossRef]
- Green, D.R. The Death Receptor Pathway of Apoptosis. Cold Spring Harb. Perspect. Biol. 2022, 14, 1–14. [Google Scholar] [CrossRef]
- Burley, S.K.; Berman, H.M.; Kleywegt, G.J.; Markley, J.L.; Nakamura, H.; Velankar, S. Protein Data Bank (PDB): The Single Global Macromolecular Structure Archive. Methods Mol. Biol. 2017, 1607, 627–641. [Google Scholar] [CrossRef]
- Ramamurthy, V.; Yamniuk, A.P.; Lawrence, E.J.; Yong, W.; Schneeweis, L.A.; Cheng, L.; Murdock, M.; Corbett, M.J.; Doyle, M.L.; Sheriff, S. The Structure of the Death Receptor 4-TNF-Related Apoptosis-Inducing Ligand (DR4-TRAIL) Complex. Acta Crystallogr. Sect. Struct. Biol. Commun. 2015, 71, 1273–1281. [Google Scholar] [CrossRef]
- Hymowitz, S.G.; Christinger, H.W.; Fuh, G.; Ultsch, M.; O’Connell, M.; Kelley, R.F.; Ashkenazi, A.; De Vos, A.M. Triggering Cell Death: The Crystal Structure of Apo2L/TRAIL in a Complex with Death Receptor 5. Mol. Cell 1999, 4, 563–571. [Google Scholar] [CrossRef]
- McMillan, D.; Martinez-Fleites, C.; Porter, J.; Fox, D.; Davis, R.; Mori, P.; Ceska, T.; Carrington, B.; Lawson, A.; Bourne, T.; et al. Structural Insights into the Disruption of TNF-TNFR1 Signalling by Small Molecules Stabilising a Distorted TNF. Nat. Commun. 2021, 12, 582. [Google Scholar] [CrossRef]
- Chodorge, M.; Züger, S.; Stirnimann, C.; Briand, C.; Jermutus, L.; Grütter, M.G.; Minter, R.R. A Series of Fas Receptor Agonist Antibodies That Demonstrate an Inverse Correlation between Affinity and Potency. Cell Death Differ. 2012, 19, 1187–1195. [Google Scholar] [CrossRef]
- Eck, M.J.; Sprang, S.R. The Structure of Tumor Necrosis Factor-α at 2.6 Å Resolution. Implications for Receptor Binding. J. Biol. Chem. 1989, 264, 17595–17605. [Google Scholar] [CrossRef]
- Liu, W.; Ramagopal, U.; Cheng, H.; Bonanno, J.B.; Toro, R.; Bhosle, R.; Zhan, C.; Almo, S.C. Crystal Structure of the Complex of Human FasL and Its Decoy Receptor DcR3. Structure 2016, 24, 2016–2023. [Google Scholar] [CrossRef] [PubMed]
- Morris, G.M.; Ruth, H.; Lindstrom, W.; Sanner, M.F.; Belew, R.K.; Goodsell, D.S.; Olson, A.J. AutoDock4 and AutoDockTools4: Automated Docking with Selective Receptor Flexibility. J. Comput. Chem. 2009, 30, 2785. [Google Scholar] [CrossRef] [PubMed]
- Wood, D.L.A.; Miljenović, T.; Cai, S.; Raven, R.J.; Kaas, Q.; Escoubas, P.; Herzig, V.; Wilson, D.; King, G.F. ArachnoServer: A Database of Protein Toxins from Spiders. BMC Genom. 2009, 10, 375. [Google Scholar] [CrossRef]
- Wang, L.; Wang, N.; Zhang, W.; Cheng, X.; Yan, Z.; Shao, G.; Wang, X.; Wang, R.; Fu, C. Therapeutic Peptides: Current Applications and Future Directions. Signal Transduct. Target. Ther. 2022, 7, 48. [Google Scholar] [CrossRef]
- Agrawal, P.; Bhagat, D.; Mahalwal, M.; Sharma, N.; Raghava, G.P.S. AntiCP 2.0: An Updated Model for Predicting Anticancer Peptides. Brief. Bioinform. 2021, 22, bbaa153. [Google Scholar] [CrossRef]
- Shen, Y.; Maupetit, J.; Derreumaux, P.; Tufféry, P. Improved PEP-FOLD Approach for Peptide and Miniprotein Structure Prediction. J. Chem. Theory Comput. 2014, 10, 4745–4758. [Google Scholar] [CrossRef]
- Thévenet, P.; Shen, Y.; Maupetit, J.; Guyon, F.; Derreumaux, P.; Tufféry, P. PEP-FOLD: An Updated de Novo Structure Prediction Server for Both Linear and Disulfide Bonded Cyclic Peptides. Nucleic Acids Res. 2012, 40, W288–W293. [Google Scholar] [CrossRef]
- Lamiable, A.; Thevenet, P.; Rey, J.; Vavrusa, M.; Derreumaux, P.; Tuffery, P. PEP-FOLD3: Faster de Novo Structure Prediction for Linear Peptides in Solution and in Complex. Nucleic Acids Res. 2016, 44, W449–W454. [Google Scholar] [CrossRef]
- Williams, C.J.; Headd, J.J.; Moriarty, N.W.; Prisant, M.G.; Videau, L.L.; Deis, L.N.; Verma, V.; Keedy, D.A.; Hintze, B.J.; Chen, V.B.; et al. MolProbity: More and Better Reference Data for Improved All-Atom Structure Validation. Protein Sci. 2018, 27, 293–315. [Google Scholar] [CrossRef]
- Di Tommaso, P.; Moretti, S.; Xenarios, I.; Orobitg, M.; Montanyola, A.; Chang, J.M.; Taly, J.F.; Notredame, C. T-Coffee: A Web Server for the Multiple Sequence Alignment of Protein and RNA Sequences Using Structural Information and Homology Extension. Nucleic Acids Res. 2011, 39, 13–17. [Google Scholar] [CrossRef]
- Armougom, F.; Moretti, S.; Poirot, O.; Audic, S.; Dumas, P.; Schaeli, B.; Keduas, V.; Notredame, C. Expresso: Automatic Incorporation of Structural Information in Multiple Sequence Alignments Using 3D-Coffee. Nucleic Acids Res. 2006, 34, 604–608. [Google Scholar] [CrossRef]
- Honorato, R.V.; Koukos, P.I.; Jiménez-García, B.; Tsaregorodtsev, A.; Verlato, M.; Giachetti, A.; Rosato, A.; Bonvin, A.M.J.J. Structural Biology in the Clouds: The WeNMR-EOSC Ecosystem. Front. Mol. Biosci. 2021, 8, 729513. [Google Scholar] [CrossRef]
- Van Zundert, G.C.P.; Rodrigues, J.P.G.L.M.; Trellet, M.; Schmitz, C.; Kastritis, P.L.; Karaca, E.; Melquiond, A.S.J.; Van Dijk, M.; De Vries, S.J.; Bonvin, A.M.J.J. The HADDOCK2.2 Web Server: User-Friendly Integrative Modeling of Biomolecular Complexes. J. Mol. Biol. 2016, 428, 720–725. [Google Scholar] [CrossRef]
- Banner, D.W.; D’Arcy, A.; Janes, W.; Gentz, R.; Schoenfeld, H.J.; Broger, C.; Loetscher, H.; Lesslauer, W. Crystal Structure of the Soluble Human 55 Kd TNF Receptor-Human TNFβ Complex: Implications for TNF Receptor Activation. Cell 1993, 73, 431–445. [Google Scholar] [CrossRef]
- Van Ostade, X.; Tavernier, J.; Prange, T.; Fiers, W. Localization of the Active Site of Human Tumour Necrosis Factor (HTNF) by Mutational Analysis. EMBO J. 1991, 10, 827–836. [Google Scholar] [CrossRef]
- Bajorath, J. Identification of the Ligand Binding Site in Fas (CD95) and Analysis of Fas-Ligand Interactions. Proteins Struct. Funct. Genet. 1999, 35, 475–482. [Google Scholar] [CrossRef]
- Zia, K.; Ashraf, S.; Jabeen, A.; Saeed, M.; Nur-e-Alam, M.; Ahmed, S.; Al-Rehaily, A.J.; Ul-Haq, Z. Identification of Potential TNF-α Inhibitors: From In Silico to In Vitro Studies. Sci. Rep. 2020, 10, 20974. [Google Scholar] [CrossRef]
- Garcia, G.; Grinstead, J. Assessing HADDOCK’s Protein-Ligand Ensemble Docking Capabilities through Urokinase Inhibitors. Ph.D. Thesis, University of Puget Sound, Tacoma, WA, USA, 2018. [Google Scholar]
- Schrödinger, L. The {PyMOL} Molecular Graphics System, Version 1.8. 2015. Available online: https://pymol.org/support.html (accessed on 15 August 2023).
- DeLano, W.L. PyMOL: An Open-Source Molecular Graphics Tool. CCP4 Newsl. Protein Crystallogr. 2002, 40, 82–92. [Google Scholar]
- Goddard, T.D.; Huang, C.C.; Meng, E.C.; Pettersen, E.F.; Couch, G.S.; Morris, J.H.; Ferrin, T.E. UCSF ChimeraX: Meeting Modern Challenges in Visualization and Analysis. Protein Sci. 2018, 27, 14–25. [Google Scholar] [CrossRef]
- Pettersen, E.F.; Goddard, T.D.; Huang, C.C.; Meng, E.C.; Couch, G.S.; Croll, T.I.; Morris, J.H.; Ferrin, T.E. UCSF ChimeraX: Structure Visualization for Researchers, Educators, and Developers. Protein Sci. 2021, 30, 70–82. [Google Scholar] [CrossRef]
- Meng, E.C.; Goddard, T.D.; Pettersen, E.F.; Couch, G.S.; Pearson, Z.J.; Morris, J.H.; Ferrin, T.E. UCSF ChimeraX: Tools for Structure Building and Analysis. Protein Sci. 2023, 32, e4792. [Google Scholar] [CrossRef]
- Abraham, M.J.; Murtola, T.; Schulz, R.; Páll, S.; Smith, J.C.; Hess, B.; Lindah, E. Gromacs: High Performance Molecular Simulations through Multi-Level Parallelism from Laptops to Supercomputers. SoftwareX 2015, 1–2, 19–25. [Google Scholar] [CrossRef]
- GROMACS Development Team. GROMACS 2023.2 Manual. Zenodo 2023. [Google Scholar] [CrossRef]
- GROMACS Development Team. GROMACS 2023.2 Source Code. Zenodo 2023. [Google Scholar] [CrossRef]
- Ong, E.E.S.; Liow, J.L. The Temperature-Dependent Structure, Hydrogen Bonding and Other Related Dynamic Properties of the Standard TIP3P and CHARMM-Modified TIP3P Water Models. Fluid Phase Equilib. 2019, 481, 55–65. [Google Scholar] [CrossRef]
- Bussi, G.; Donadio, D.; Parrinello, M. Canonical Sampling through Velocity Rescaling. J. Chem. Phys. 2007, 126, 014101. [Google Scholar] [CrossRef]
- Bernetti, M.; Bussi, G. Pressure Control Using Stochastic Cell Rescaling. J. Chem. Phys. 2020, 153, 114107. [Google Scholar] [CrossRef]
- Nosé, S.; Klein, M.L. Constant Pressure Molecular Dynamics for Molecular Systems. Mol. Phys. 1983, 50, 1055–1076. [Google Scholar] [CrossRef]
- Darden, T.; York, D.; Pedersen, L. Particle Mesh Ewald: An N⋅log(N) Method for Ewald Sums in Large Systems. J. Chem. Phys. 1993, 98, 10089–10092. [Google Scholar] [CrossRef]
- Lemkul, J.A. From Proteins to Perturbed Hamiltonians: A Suite of Tutorials for the GROMACS-2018 Molecular Simulation Package [Article v1.0]. Living J. Comput. Mol. Sci. 2019, 1, 5068. [Google Scholar] [CrossRef]
- Turner, P.J. XMGRACE, version 5.1.25; Center for Coastal and Land-Margin Research, Oregon Graduate Institute of Science and Technology: Beaverton, OR, USA, 2015. [Google Scholar]
- Humphrey, W.; Dalke, A.; Schulten, K. VMD: Visual molecular dynamics. J. Mol. Graph. 1996, 14, 33–38. [Google Scholar] [CrossRef]
- Eargle, J.; Wright, D.; Luthey-Schulten, Z. Multiple Alignment of Protein Structures and Sequences for VMD. Bioinformatics 2006, 22, 504–506. [Google Scholar] [CrossRef]
- Valdés-Tresanco, M.S.; Valdés-Tresanco, M.E.; Valiente, P.A.; Moreno, E. Gmx_MMPBSA: A New Tool to Perform End-State Free Energy Calculations with GROMACS. J. Chem. Theory Comput. 2021, 17, 6281–6291. [Google Scholar] [CrossRef]
- Miller, B.R.; McGee, T.D.; Swails, J.M.; Homeyer, N.; Gohlke, H.; Roitberg, A.E. MMPBSA.Py: An Efficient Program for End-State Free Energy Calculations. J. Chem. Theory Comput. 2012, 8, 3314–3321. [Google Scholar] [CrossRef]
- Wang, E.; Sun, H.; Wang, J.; Wang, Z.; Liu, H.; Zhang, J.Z.H.; Hou, T. End-Point Binding Free Energy Calculation with MM/PBSA and MM/GBSA: Strategies and Applications in Drug Design. Chem. Rev. 2019, 119, 9478–9508. [Google Scholar] [CrossRef]
- Dong, J.; Wang, N.N.; Yao, Z.J.; Zhang, L.; Cheng, Y.; Ouyang, D.; Lu, A.P.; Cao, D.S. Admetlab: A Platform for Systematic ADMET Evaluation Based on a Comprehensively Collected ADMET Database. J. Cheminform. 2018, 10, 29. [Google Scholar] [CrossRef]
- Xiao, Y.; Tang, J.; Yang, Y.; Wang, M.; Hu, W.; Xie, J.; Zeng, X.; Liang, S. Jingzhaotoxin-III, a Novel Spider Toxin Inhibiting Activation of Voltage-Gated Sodium Channel in Rat Cardiac Myocytes. J. Biol. Chem. 2004, 279, 26220–26226. [Google Scholar] [CrossRef]
- Escoubas, P.; Rash, L. Tarantulas: Eight-Legged Pharmacists and Combinatorial Chemists. Toxicon 2004, 43, 555–574. [Google Scholar] [CrossRef]
- Soon, T.N.; Chia, A.Y.Y.; Yap, W.H.; Tang, Y.-Q. Anticancer Mechanisms of Bioactive Peptides. Protein Pept. Lett. 2020, 27, 823–830. [Google Scholar] [CrossRef]
- Chiangjong, W.; Chutipongtanate, S.; Hongeng, S. Anticancer Peptide: Physicochemical Property, Functional Aspect and Trend in Clinical Application (Review). Int. J. Oncol. 2020, 57, 678–696. [Google Scholar] [CrossRef]
- Danial, N.N.; Hockenbery, D.M. Cell Death. Hematol. Basic Princ. Pract. 2018, 7, 186–196. [Google Scholar] [CrossRef]
- Liscano, Y.; Oñate-Garzón, J.; Delgado, J.P. Peptides with Dual Antimicrobial–Anticancer Activity: Strategies to Overcome Peptide Limitations and Rational Design of Anticancer Peptides. Molecules 2020, 25, 4245. [Google Scholar] [CrossRef]
- Wang, N.N.; Dong, J.; Deng, Y.H.; Zhu, M.F.; Wen, M.; Yao, Z.J.; Lu, A.P.; Wang, J.B.; Cao, D.S. ADME Properties Evaluation in Drug Discovery: Prediction of Caco-2 Cell Permeability Using a Combination of NSGA-II and Boosting. J. Chem. Inf. Model. 2016, 56, 763–773. [Google Scholar] [CrossRef]
- Wang, N.N.; Huang, C.; Dong, J.; Yao, Z.J.; Zhu, M.F.; Deng, Z.K.; Lv, B.; Lu, A.P.; Chen, A.F.; Cao, D.S. Predicting Human Intestinal Absorption with Modified Random Forest Approach: A Comprehensive Evaluation of Molecular Representation, Unbalanced Data, and Applicability Domain Issues. RSC Adv. 2017, 7, 19007–19018. [Google Scholar] [CrossRef]
- Pardridge, W.M. CNS Drug Design Based on Principles of Blood-Brain Barrier Transport. J. Neurochem. 1998, 70, 1781–1792. [Google Scholar] [CrossRef]
- Veith, H.; Southall, N.; Huang, R.; James, T.; Fayne, D.; Artemenko, N.; Shen, M.; Inglese, J.; Austin, C.P.; Lloyd, D.G.; et al. Comprehensive Characterization of Cytochrome P450 Isozyme Selectivity across Chemical Libraries. Nat. Biotechnol. 2009, 27, 1050–1055. [Google Scholar] [CrossRef]
- Rostkowski, M.; Spjuth, O.; Rydberg, P. WhichCyp: Prediction of Cytochromes P450 Inhibition. Bioinformatics 2013, 29, 2051–2052. [Google Scholar] [CrossRef]
- Guengerich, F.P. Roles of Cytochrome P450 Enzymes in Pharmacology and Toxicology: Past, Present, and Future. Adv. Pharmacol. 2022, 95, 1–47. [Google Scholar] [CrossRef]
- Kerns, E.H.; Di, L. Drug-Like Properties: Concepts, Structure Design and Methods, 1st ed.; Elsevier: Burlington, MA, USA; San Diego, CA, USA; London, UK, 2008; ISBN 9780123695208. [Google Scholar]
- Mulliner, D.; Schmidt, F.; Stolte, M.; Spirkl, H.P.; Czich, A.; Amberg, A. Computational Models for Human and Animal Hepatotoxicity with a Global Application Scope. Chem. Res. Toxicol. 2016, 29, 757–767. [Google Scholar] [CrossRef]
- Xu, C.; Cheng, F.; Chen, L.; Du, Z.; Li, W.; Liu, G.; Lee, P.W.; Tang, Y. In Silico Prediction of Chemical Ames Mutagenicity. J. Chem. Inf. Model. 2012, 52, 2840–2847. [Google Scholar] [CrossRef]
- Sanguinetti, M.C.; Mitcheson, J.S. Predicting Drug-HERG Channel Interactions That Cause Acquired Long QT Syndrome. Trends Pharmacol. Sci. 2005, 26, 119–124. [Google Scholar] [CrossRef]
- Deng, M.; Jiang, L.; Luo, X.; Tao, H.; Liang, S. Jingzhaotoxin-X, a Gating Modifier of Kv4.2 and Kv4.3 Potassium Channels Purified from the Venom of the Chinese Tarantula Chilobrachys Jingzhao. J. Venom. Anim. Toxins Incl. Trop. Dis. 2020, 26, e20190043. [Google Scholar] [CrossRef]
- Garrido, A.; Lepailleur, A.; Mignani, S.M.; Dallemagne, P.; Rochais, C. HERG Toxicity Assessment: Useful Guidelines for Drug Design. Eur. J. Med. Chem. 2020, 195, 112290. [Google Scholar] [CrossRef]
- Zhu, H.; Martin, T.M.; Ye, L.; Sedykh, A.; Young, D.M.; Tropsha, A. Quantitative Structure-Activity Relationship Modeling of Rat Acute Toxicity by Oral Exposure. Chem. Res. Toxicol. 2009, 22, 1913–1921. [Google Scholar] [CrossRef]
- Wakelee, H.A.; Patnaik, A.; Sikic, B.I.; Mita, M.; Fox, N.L.; Miceli, R.; Ullrich, S.J.; Fisher, G.A.; Tolcher, A.W. Phase I and Pharmacokinetic Study of Lexatumumab (HGS-ETR2) given Every 2 Weeks in Patients with Advanced Solid Tumors. Ann. Oncol. 2009, 21, 376–381. [Google Scholar] [CrossRef]
- Merchant, M.S.; Geller, J.I.; Baird, K.; Chou, A.J.; Galli, S.; Charles, A.; Amaoko, M.; Rhee, E.H.; Price, A.; Wexler, L.H.; et al. Phase I Trial and Pharmacokinetic Study of Lexatumumab in Pediatric Patients with Solid Tumors. J. Clin. Oncol. 2012, 30, 4141–4147. [Google Scholar] [CrossRef]


Disclaimer/Publisher’s Note: The statements, opinions and data contained in all publications are solely those of the individual author(s) and contributor(s) and not of MDPI and/or the editor(s). MDPI and/or the editor(s) disclaim responsibility for any injury to people or property resulting from any ideas, methods, instructions or products referred to in the content. |
© 2024 by the authors. Licensee MDPI, Basel, Switzerland. This article is an open access article distributed under the terms and conditions of the Creative Commons Attribution (CC BY) license (https://creativecommons.org/licenses/by/4.0/).