Article

Study on Dynamic Response Characteristics and Monitoring Indicators of High-Speed Railway Subgrade in Karst Areas

1
School of Civil Engineering, Beijing Jiaotong University, Beijing 100044, China
2
China Railway Siyuan Survey and Design Group Co., Ltd., Wuhan 430063, China
*
Author to whom correspondence should be addressed.
Appl. Sci. 2024, 14(19), 8715; https://doi.org/10.3390/app14198715
Submission received: 28 August 2024 / Revised: 24 September 2024 / Accepted: 25 September 2024 / Published: 27 September 2024

Abstract

:
The impact of karst collapses on railway engineering spans the entire lifecycle of railway construction and operation, with train loads being a significant factor in inducing such collapses. To study the dynamic response characteristics of subgrades in karst areas and to select appropriate monitoring points and indicators for long-term effective monitoring, a numerical simulation method was employed to analyze the vibration response characteristics of the subgrade. A three-dimensional finite element model coupling the high-speed train, ballastless track, and subgrade foundation was established to study the vibration responses of subgrades when the train passes over a subgrade with an underlying soil hole and one without a soil hole. The results indicate that when there was a soil hole, both the dynamic displacement amplitude and vibration acceleration amplitude decreased, while the dominant frequency slightly increased, with the dominant frequency being higher at locations closer to the soil hole. The vibration response at the soil hole location showed significant attenuation, with the attenuation coefficient of dynamic displacement amplitude being higher than that of the vibration acceleration amplitude. Monitoring points were arranged at positions 0 m to 10 m from the toe of the slope, with vertical dynamic displacement, vertical vibration acceleration, the dominant frequency of vertical vibration acceleration, and corresponding amplitude selected as monitoring indicators. These indicators effectively reflect whether soil holes exist within the subgrade and help identify the locations of defects. This study summarizes the dynamic response characteristics of subgrades in karst areas under different conditions, providing a basis for the design and monitoring of railway subgrades in regions prone to karst collapse.

1. Introduction

Karst environments are characterized by distinctive landforms related to dissolution and a dominant subsurface drainage [1]. China has an extensive distribution of karst regions. As the railway mileage in China increases, it is inevitable that railways will be constructed in areas with potential karst geological hazards. During train operations, irregularities in the track can cause the wheels to collide with the track, generating vibrations. As the train speed increases, these vibrations become more severe [2]. The presence of both train-induced vibrations and karst formations may lead to instability and collapse of the railway subgrade, posing significant safety risks to the normal operation of the railway [3,4].
When studying the dynamic response of track subgrade structures under train loads, these loads are typically considered as moving harmonic loads, moving dead loads, or moving mass systems. Track subgrade structures are often simplified as viscoelastic foundation beams. Research on the dynamic response of structures under moving mass has largely focused on beams, using methods such as modal superposition, direct integration, finite element methods, and discretization techniques. These studies consistently highlight the significant influence of moving mass velocity, inertia effects, and boundary conditions on beam and plate behavior. Akin et al. [5,6] discovered that neglecting the inertia of moving masses can lead to errors of up to 80%, while Lee U. [7] demonstrated that the separation between moving masses and structures significantly impacts interaction forces and beam responses, particularly as velocity and mass ratio increase. Yamchelou et al. [8] further revealed that the maximum vibration amplitude of plates subjected to moving masses occurs at points other than the center, challenging conventional analysis methods. Recent advancements, such as the moving finite element method proposed by Ye et al. [9], the spectral element method by Chen et al. [10], and the nonlinear analysis by De Oliveira et al. [11], have been developed to account for complex beam geometries and material behaviors, highlighting the need for more accurate dynamic models in railway and structural applications.
Current research on the vibration response of railway subgrades often relies on measured data or numerical simulations to obtain the characteristics of changes in indicators such as subgrade vibration acceleration, speed, and displacement. These characteristics are then compared to identify differences in subgrade vibration responses under various conditions [12,13,14]. Auersch [15] utilized half-space theory to calculate wave propagation in homogeneous or layered soils, approximating the dynamic load of the train as a fixed dynamic load. He computed the wave field generated by train loads and analyzed the causes of vibrations at different frequencies. Cai et al. [16] simulated the vertical strain effects of train loads on natural undisturbed soils through CHCA experiments. Liu et al. [17] concluded the time-domain characteristics of the varying moisture content on the dynamic stresses and dynamic accelerations along the depth direction. Li et al. [18] found that high-frequency vibrations in soft soil attenuate more significantly, whereas low-frequency vibrations in rock formations showed greater attenuation through analysis of measured data. Li et al. [19] found that the amplitude of dynamic response parameters of each subgrade structural layer increases with the axle load through numerical simulations, and the increase in speed has a greater impact on vertical dynamic displacement and dynamic stress than on dynamic acceleration. Li et al. [20] established a coupling model of vehicle-track-subgrade considering track irregularity and concluded that the vertical dynamic displacement amplitude of the subgrade surface under the superimposed vibration of a double-track railway is approximately 50% higher than that of a single-track railway. Qu et al. [21] conducted a comparative analysis of the spectral characteristics and vibration amplitude of subgrade vibrations based on vibration response experiments of high-speed railway embankment-bridge transition sections.
Using the characteristics of elastic wave propagation attenuation to detect the health status of an object is a common method in non-destructive testing [22,23,24]. Existing research often relies on the attenuation characteristics of indicators exhibited by elastic waves as they pass through different media of rock and soil to identify internal cracks, voids, and damage within the geotechnical body [25,26,27]. Li et al. [28] discovered that elastic wave attenuation is significant in mined-out areas and decreases after backfilling but is not completely eliminated; this feature can be used to monitor cavities in mining areas. Liu et al. [29] found through experiments that the main cause of elastic wave attenuation is the compaction degree of mineral particles, followed by the development of joints and bedding, which can monitor the compositional structure of geotechnical bodies. Duan et al. [30] used crosshole seismic CT techniques to image the P-wave velocities of the limestone stratum, establishing the relationship between the P-wave velocity and geological anomalies, demonstrating that elastic waves can be used for karst detection. Li et al. [31] studied the propagation and attenuation characteristics of elastic waves in layered coal rock, pure coal, and pure sandstone using an elastic wave generation device, providing optimized and corrected theoretical foundations for microseismic technology. Jing et al. [32] introduced the characteristic parameter within the framework of the flicker noise spectrum and analyzed the relationship between the acoustic emission -value and -value, revealing their effectiveness in predicting instability and monitoring dynamic hazards in coal and magnetite formations. Shen et al. [33] explored the detection of roadbed erosion using vibration-excited acoustic waveform arrays on the pavement, analyzing 2D spectra, transient waveforms, and sound field distributions, and found that soil erosion leading to a water layer beneath the pavement alters mode wave characteristics, causing frequency spectrum disconnections and resonance phenomena, which serve as indicators of serious roadbed erosion.
Although significant progress has been made in the study of subgrade vibration response, existing research often overlooks the long-term dynamic monitoring of the internal structure of the subgrade during railway operation [34]. Additionally, there is limited research on the dynamic response characteristics of karst subgrades and the use of vibration response to assess the condition of railway subgrades [35]. The formation of karst soil cavities is sudden and unpredictable, and once they reach a state of critical equilibrium, they pose safety hazards. Therefore, dynamic monitoring of the vibration response of the subgrade environment during train operation is essential.
This study examines wheel-rail vibration as the vibration source and establishes a three-dimensional finite element model coupling the train, ballastless track, and subgrade foundation. The vibration response characteristics of the surrounding environment are compared when a high-speed train passes over a subgrade without a soil hole and with an underlying soil hole in karst areas. The monitoring indicators, including dynamic displacement, vibration acceleration, and dominant frequency, are discussed, and their attenuation patterns under conditions of subgrades without a soil hole and with a soil hole are analyzed. Additionally, the selection of monitoring points is examined, providing a reference for monitoring hidden soil holes beneath the subgrade during railway operation.

2. Numerical Simulation

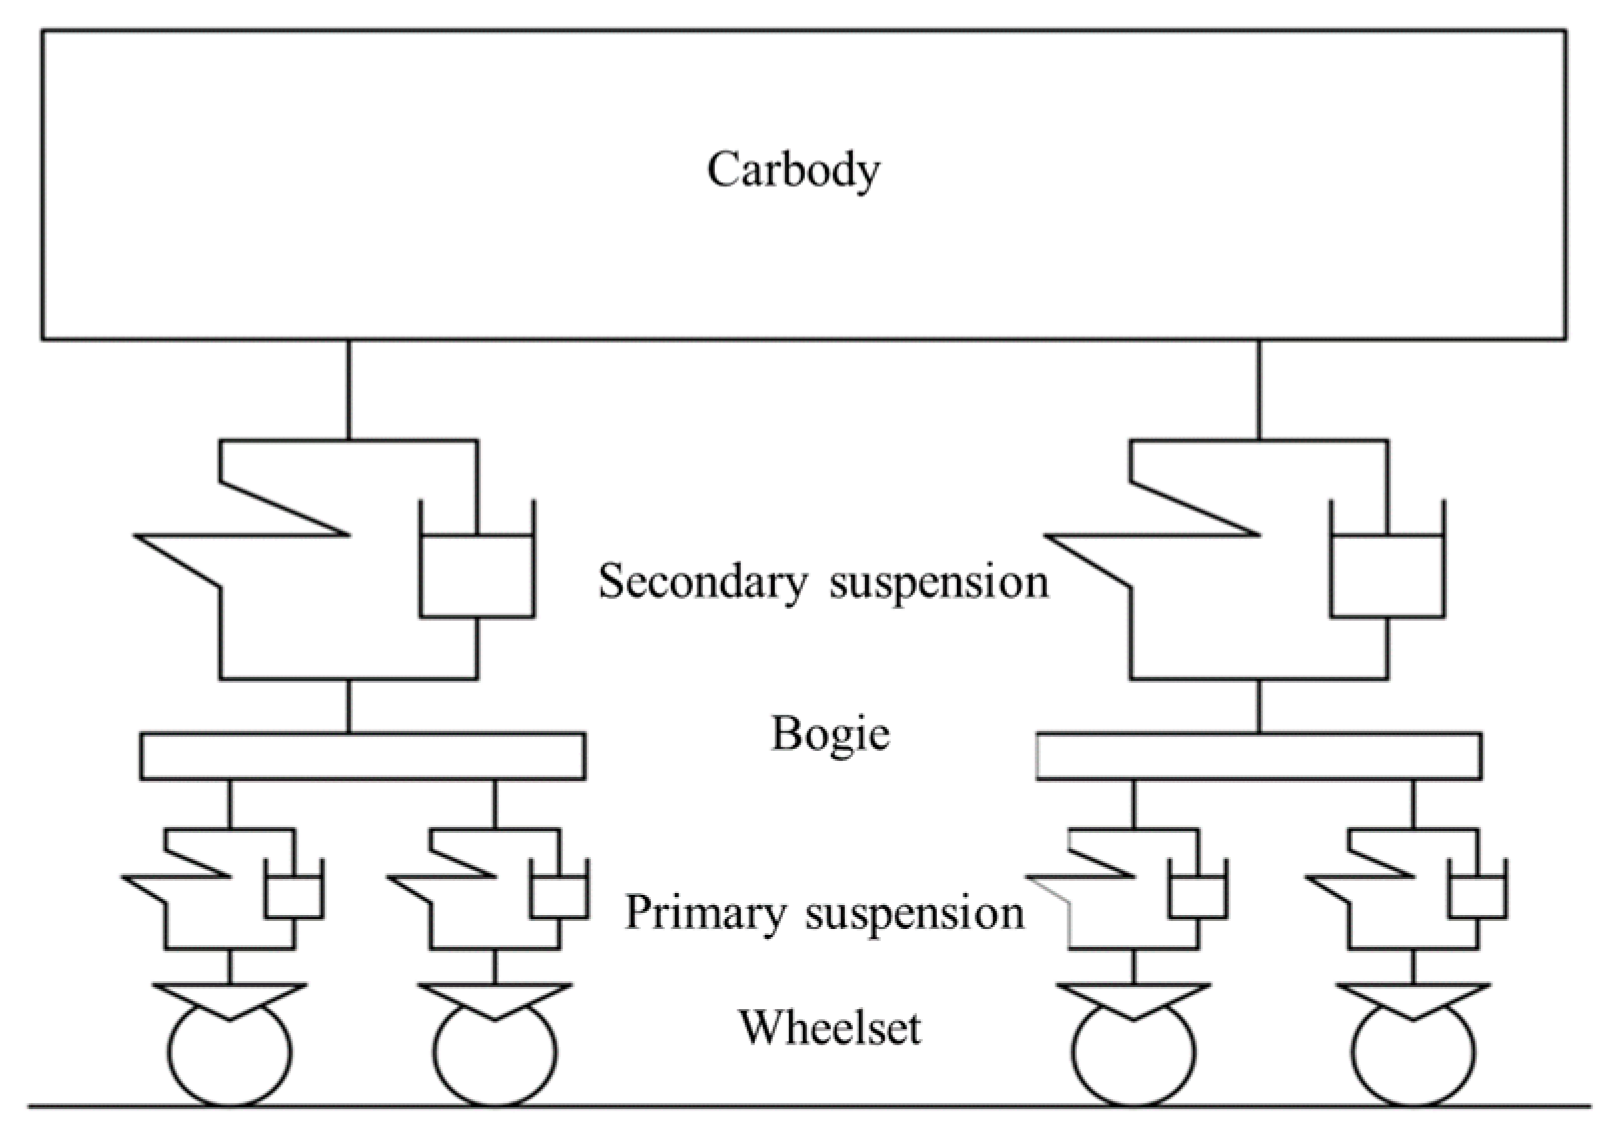
2.1. Vehicle-Track-Subgrade Coupled Model
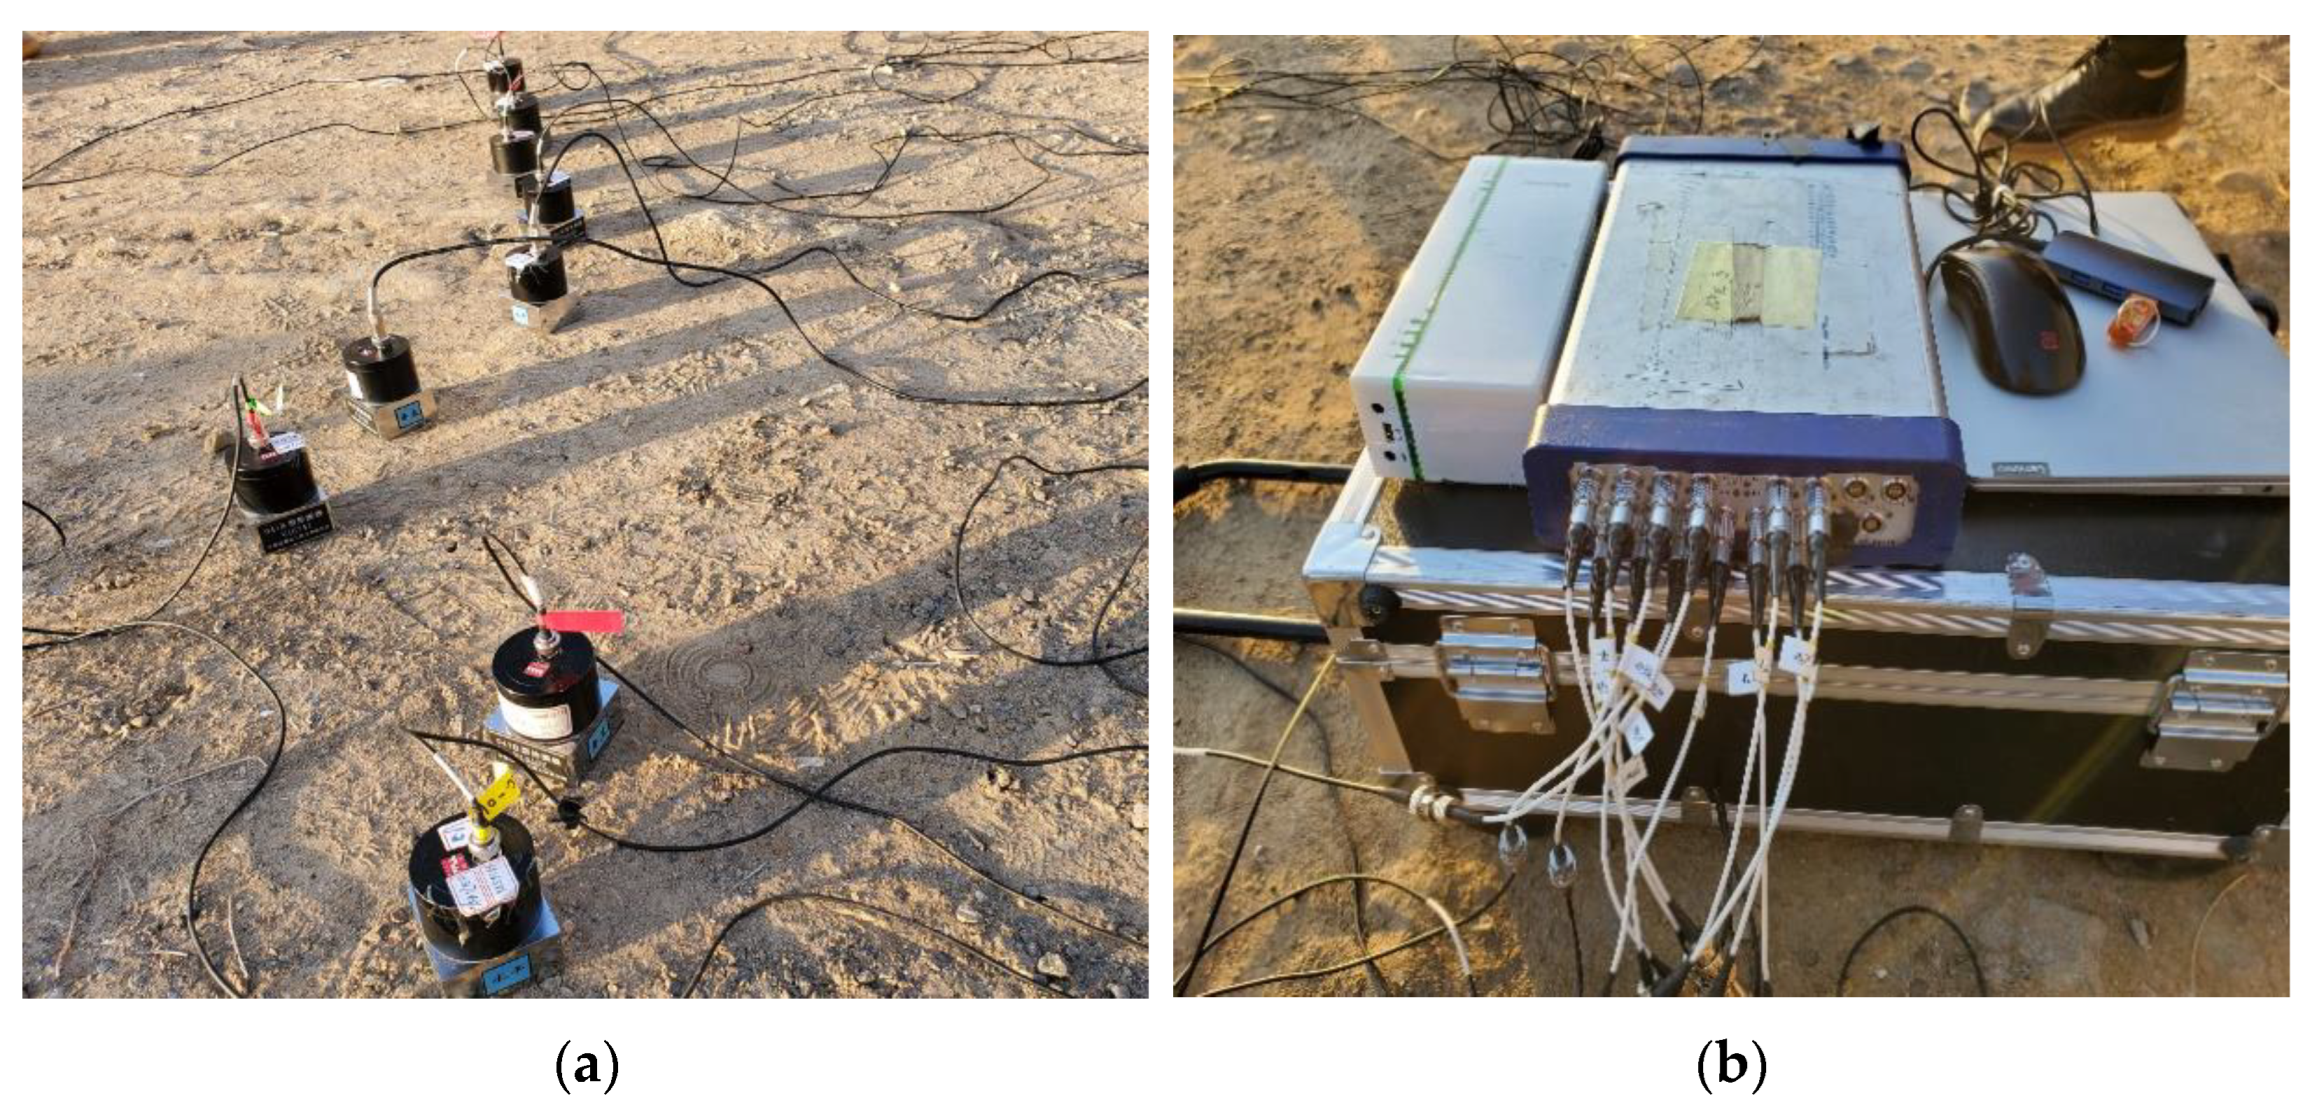
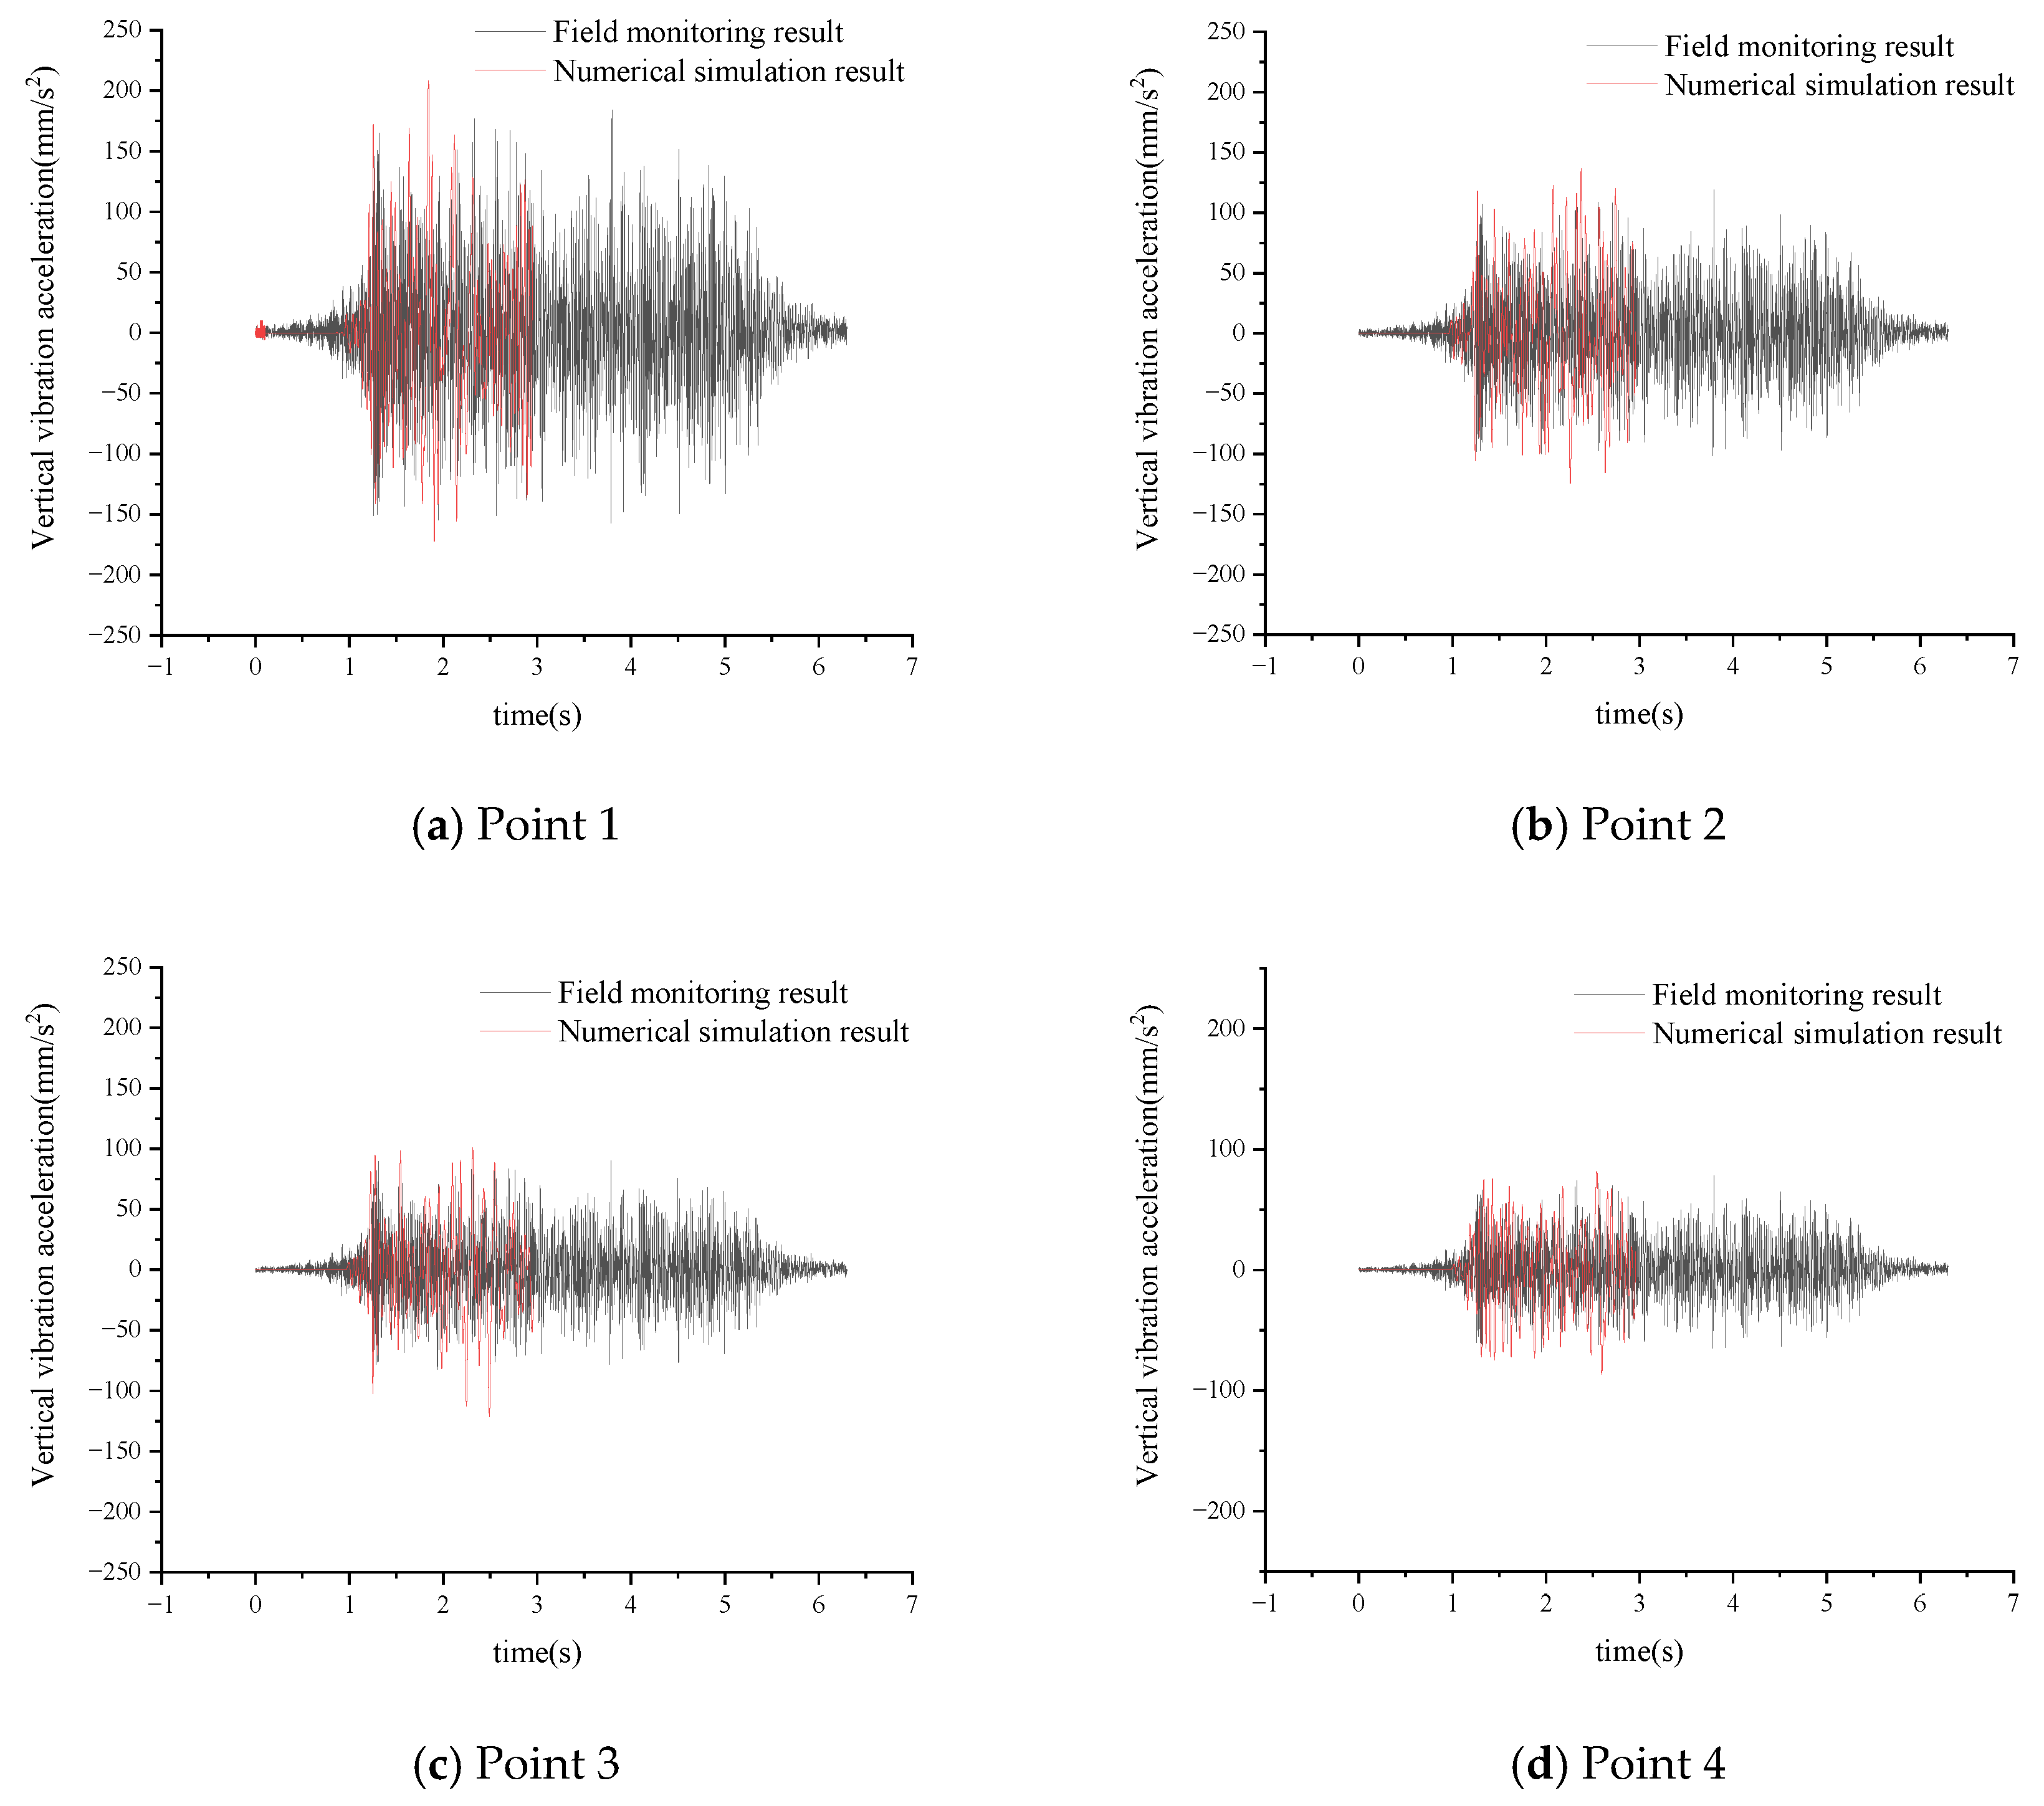
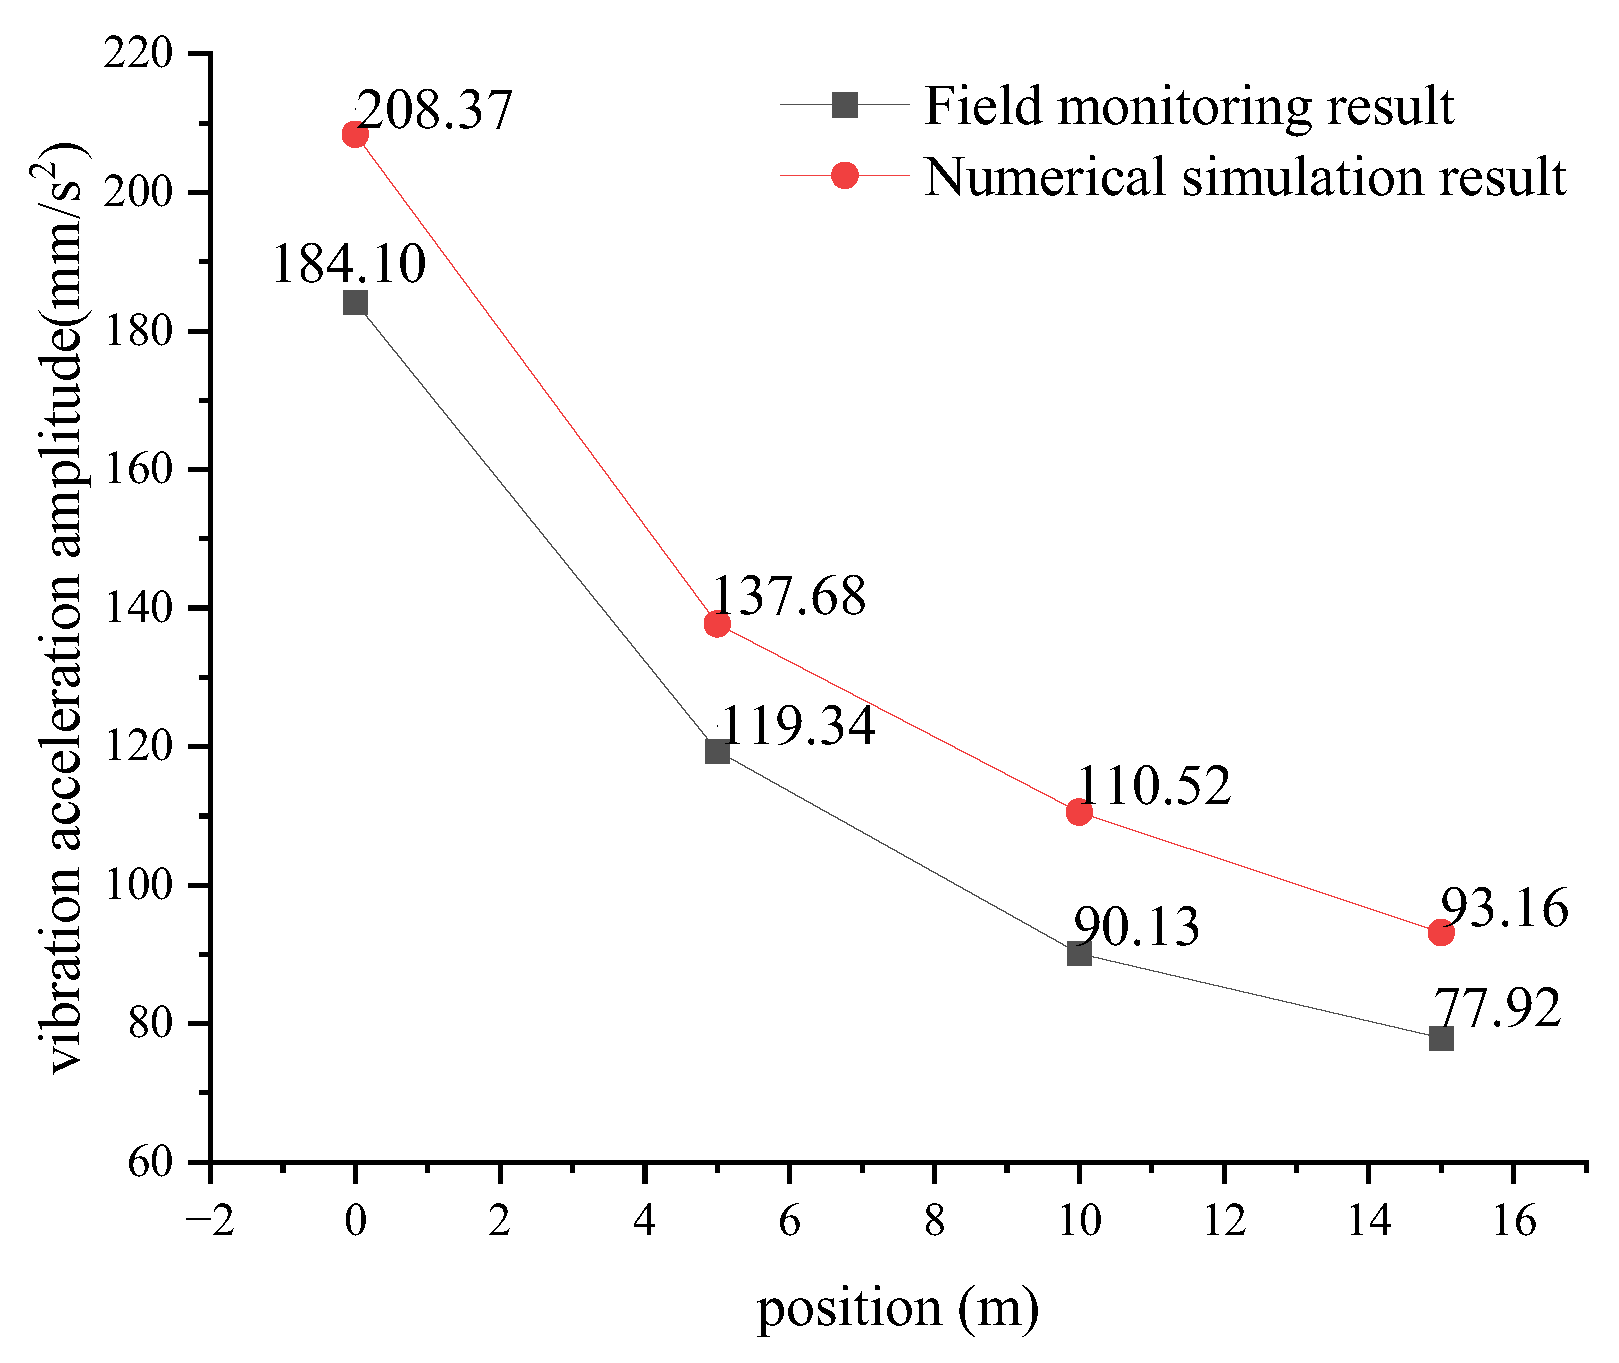
A refined nonlinear analysis model of the vehicle-track-subgrade system was established using the finite element software ABAQUS (https://software.3ds.com/). During the vehicle modeling, the main structure was simplified into three parts: the carbody, bogie, and wheelset, which were connected through the primary suspension and secondary suspension. The simplified dynamic model of the vehicle [36] is shown in Figure 1. The vehicle model assumes complete symmetry on both sides and does not consider the effect of eccentric forces. The primary suspension and secondary suspension were simplified to undergo completely linear deformations, modeled using connector elements. The dimensions of the vehicle components were modeled on a 1:1 scale, referencing the CRH3 train. The axle load of the vehicle was simulated as a concentrated force applied at the vehicle’s center of gravity, with the interactions between components set to transfer forces downward. The wheel tread adopts the wear-type tread. The main parameters of the train vehicle model are shown in Table 1.
This study focused on the CRTS II slab ballastless track, simulating structures including the rail, fasteners, track slab, CA mortar layer, and supporting layer [37]. The fasteners were simulated using Cartesian connectors, with their calculation parameters shown in Table 2. The rail model was based on the geometric cross-section of a domestic 60 kg/m rail. To replicate the actual conditions of the rail, the track irregularity spectrum was applied to the model using random process theory. According to the fitting formulas for track irregularities specified in the High-speed Railway Ballastless Track Irregularity Spectrum, various irregularities such as gauge irregularity, alignment irregularity, and vertical irregularity were incorporated into the track. Damping materials were defined using Rayleigh damping, considering both mass damping and material damping, with the damping expression as follows:
C = α M + β K
where α is the mass damping coefficient, β is the stiffness damping coefficient.
The subgrade section included the subgrade surface layer, the subgrade bottom layer, and the lower embankment. The subgrade width was set to 8.6 m, with a slope ratio of 1:1.5. The foundation section included the surface soil layer and bedrock, with the soil cavity located within the surface soil layer directly beneath the subgrade. To improve the accuracy of the model, the mesh density was increased in the subgrade structure and soil cavity areas. The irregularly shaped soil cavity was discretized using C3D4 elements, while the subgrade foundation and track structure, which have more regular shapes, were divided into C3D8R elements. Although the vehicle model is not included in the dynamic response analysis, the vehicle body was meshed using R3D4 (4-node 3D rigid) and R3D3 (3-node 3D rigid) elements for other structural analyses. Binding constraints are set between the layers of the track slab and between the track and the subgrade surface layer. In total, the track structure contained 42,108 elements and 77,223 nodes, the soil cavity structure had 1671 elements, and the subgrade structure consisted of 293,004 elements.
In the analysis, the rail and track structures were modeled as elastic materials, while the subgrade and foundation soils were represented using the Mohr–Coulomb ideal elastic–plastic constitutive model. This approach accounted for the plastic deformation of the roadbed structure and the geotechnical body, allowing the model to effectively simulate subgrade stability and potential collapse under varying load conditions. The parameters of the track-subgrade model are shown in Table 3.
Due to the complex stress conditions of subgrades and the limitation that finite element models cannot simulate an infinite foundation, it is necessary to set reasonable boundary conditions for the finite subgrade structure model. In this study, a viscoelastic boundary was employed for the foundation model because it provides an effective solution for simulating wave propagation into infinite regions, reducing reflections at the boundary, and mimicking the soil’s elastic recovery behavior. The viscoelastic boundary simulates wave propagation into an infinite region and the soil’s elastic recovery by applying parallel spring-damper systems to the artificially truncated boundary nodes. In ABAQUS, continuously distributed spring-damper systems are applied to the tangential and normal directions of the boundary nodes. The viscoelastic artificial boundary adopts the two-parameter Kelvin solid model, and the expressions for the spring stiffness and damping coefficients are shown in Equation (2).
K BN = α N G R i I A i C BN = ρ c P i I A i K BT = α T G R i I A i C BT = ρ c S i I A i
where K BN and C BN represent the normal stiffness and damping coefficient of the spring, respectively; K BT and C BT represent the tangential stiffness and damping coefficient of the spring, respectively; G is the shear modulus of the medium; ρ is the density of the medium; R is the distance from the vibration source to the artificial boundary point; c p and c s represent the P-wave velocity and S-wave velocity of the medium, respectively; i I A i denotes the area of the artificial boundary; the tangential direction α T is 2; and the normal direction α N is 4.
In summary, the finite element model shown in Figure 2 was established.
The contact between the wheel and rail primarily considered the normal force and the tangential force. The normal force between the wheel and rail was calculated based on Hertzian contact theory [38], with the formula as follows:
P t = 1 G Δ Z t 3 / 2
where G represents the wheel-rail contact constant. For this study, a wear-type wheel tread was used, with G = 3.68 R 0.115 × 10 8 (m/N2/3), R is the wheel-rail radius, and Δ Z t represents the elastic compression between the wheel and rail at time t .
The tangential force between the wheel and rail mainly includes the tangential creep forces and spin moment. Creep between the wheel and rail generated frictional forces that resist relative sliding at the contact surface. The friction coefficient was the ratio of the vertical force on the wheel-rail to the frictional force, and it varied under different conditions, including static and dynamic friction coefficients. Therefore, the expression for the tangential force was as follows:
F = μ × P t = μ k + μ s μ k e d c r ˙ e q × P t
where μ k and μ s are the dynamic and static friction coefficients, respectively, d c is the damping coefficient, r ˙ e q represents the relative sliding speed at the wheel-rail contact surface, P t is the normal force between the wheel and rail, and the friction coefficient is taken as 0.3.

2.2. Validation

The field monitoring location was at the DK820+955 to DK821+200 subgrade section of the Shanghai–Kunming high-speed railway in Guizhou. The vibration monitoring device used was the 291-2 vibration picker developed by the China Earthquake Administration, as depicted in Figure 3. This equipment has an acceleration resolution of 1 × 10⁻⁵ m/s2, with a maximum measurable vibration acceleration of 40 m/s2. The data-acquisition system, designed by the Beijing Oriental Institute of Vibration and Noise Technology, was paired with DASP-V11 software (http://www.coinv.com/home) for data processing.
Four positions were selected at 5-m intervals to monitor the vibration response of the surrounding foundation environment during train passage. A schematic diagram of the distribution of the monitoring points is shown in Figure 4.
To validate the rationality of the model, four measurement points corresponding to the actual monitoring locations were selected: 0 m, 5 m, 10 m, and 15 m from the subgrade centerline. The vertical vibration acceleration values at these points were extracted and compared with the field monitoring data. The comparison of vibration acceleration between field monitoring and numerical simulation is shown in Figure 5, and the comparison of vibration acceleration amplitude is shown in Figure 6.
The two data groups from measuring point 1, which exhibited the smallest amplitude errors between the measured and simulated results and the highest curve fit, were analyzed using one-way ANOVA with a significance level α of 0.05. The significance value p of 0.064 > α indicated no significant difference between the two groups, confirming the accuracy of the model at measuring point 1. Additionally, the vibration propagation farther from the subgrade had minimal impact on the stability of the soil hole and subgrade, with the measuring points closer to the subgrade showing smaller error values. This demonstrates that the model could be reliably applied to the dynamic response analysis of soil within the subgrade. As illustrated in Figure 5 and Figure 6, both the field monitoring and numerical simulation of vertical vibration acceleration waveforms showed significant variations in vibration acceleration. The peak values in the numerical simulation were slightly higher than those from field monitoring, with errors within 20 mm/s2 and error rates of 11.18%, 9.96%, 9.99%, and 8.27%, all within an acceptable range. The smaller vibration acceleration observed during field monitoring could be attributed to various factors, including the complexity of site conditions, the presence of vegetation, and the varying soil-damping properties at different locations, which affected the dissipation of vibration energy through the ground. In the numerical simulation, we made certain necessary simplifications, such as treating the infinite foundation as finite elements with viscoelastic boundaries and not accounting for soil property differences. These simplifications helped reduce computational complexity while still capturing the essential dynamic response of the system. Additionally, the train speed during field monitoring was 239 km/h, slightly lower than the simulated speed of 250 km/h. These factors contributed to the higher vibration acceleration in the simulation results. Overall, the small error between the simulation and field monitoring confirmed the model’s accuracy and suitability for dynamic response analysis. Future work could refine the model by incorporating variable soil-damping properties and more precise train speed conditions.

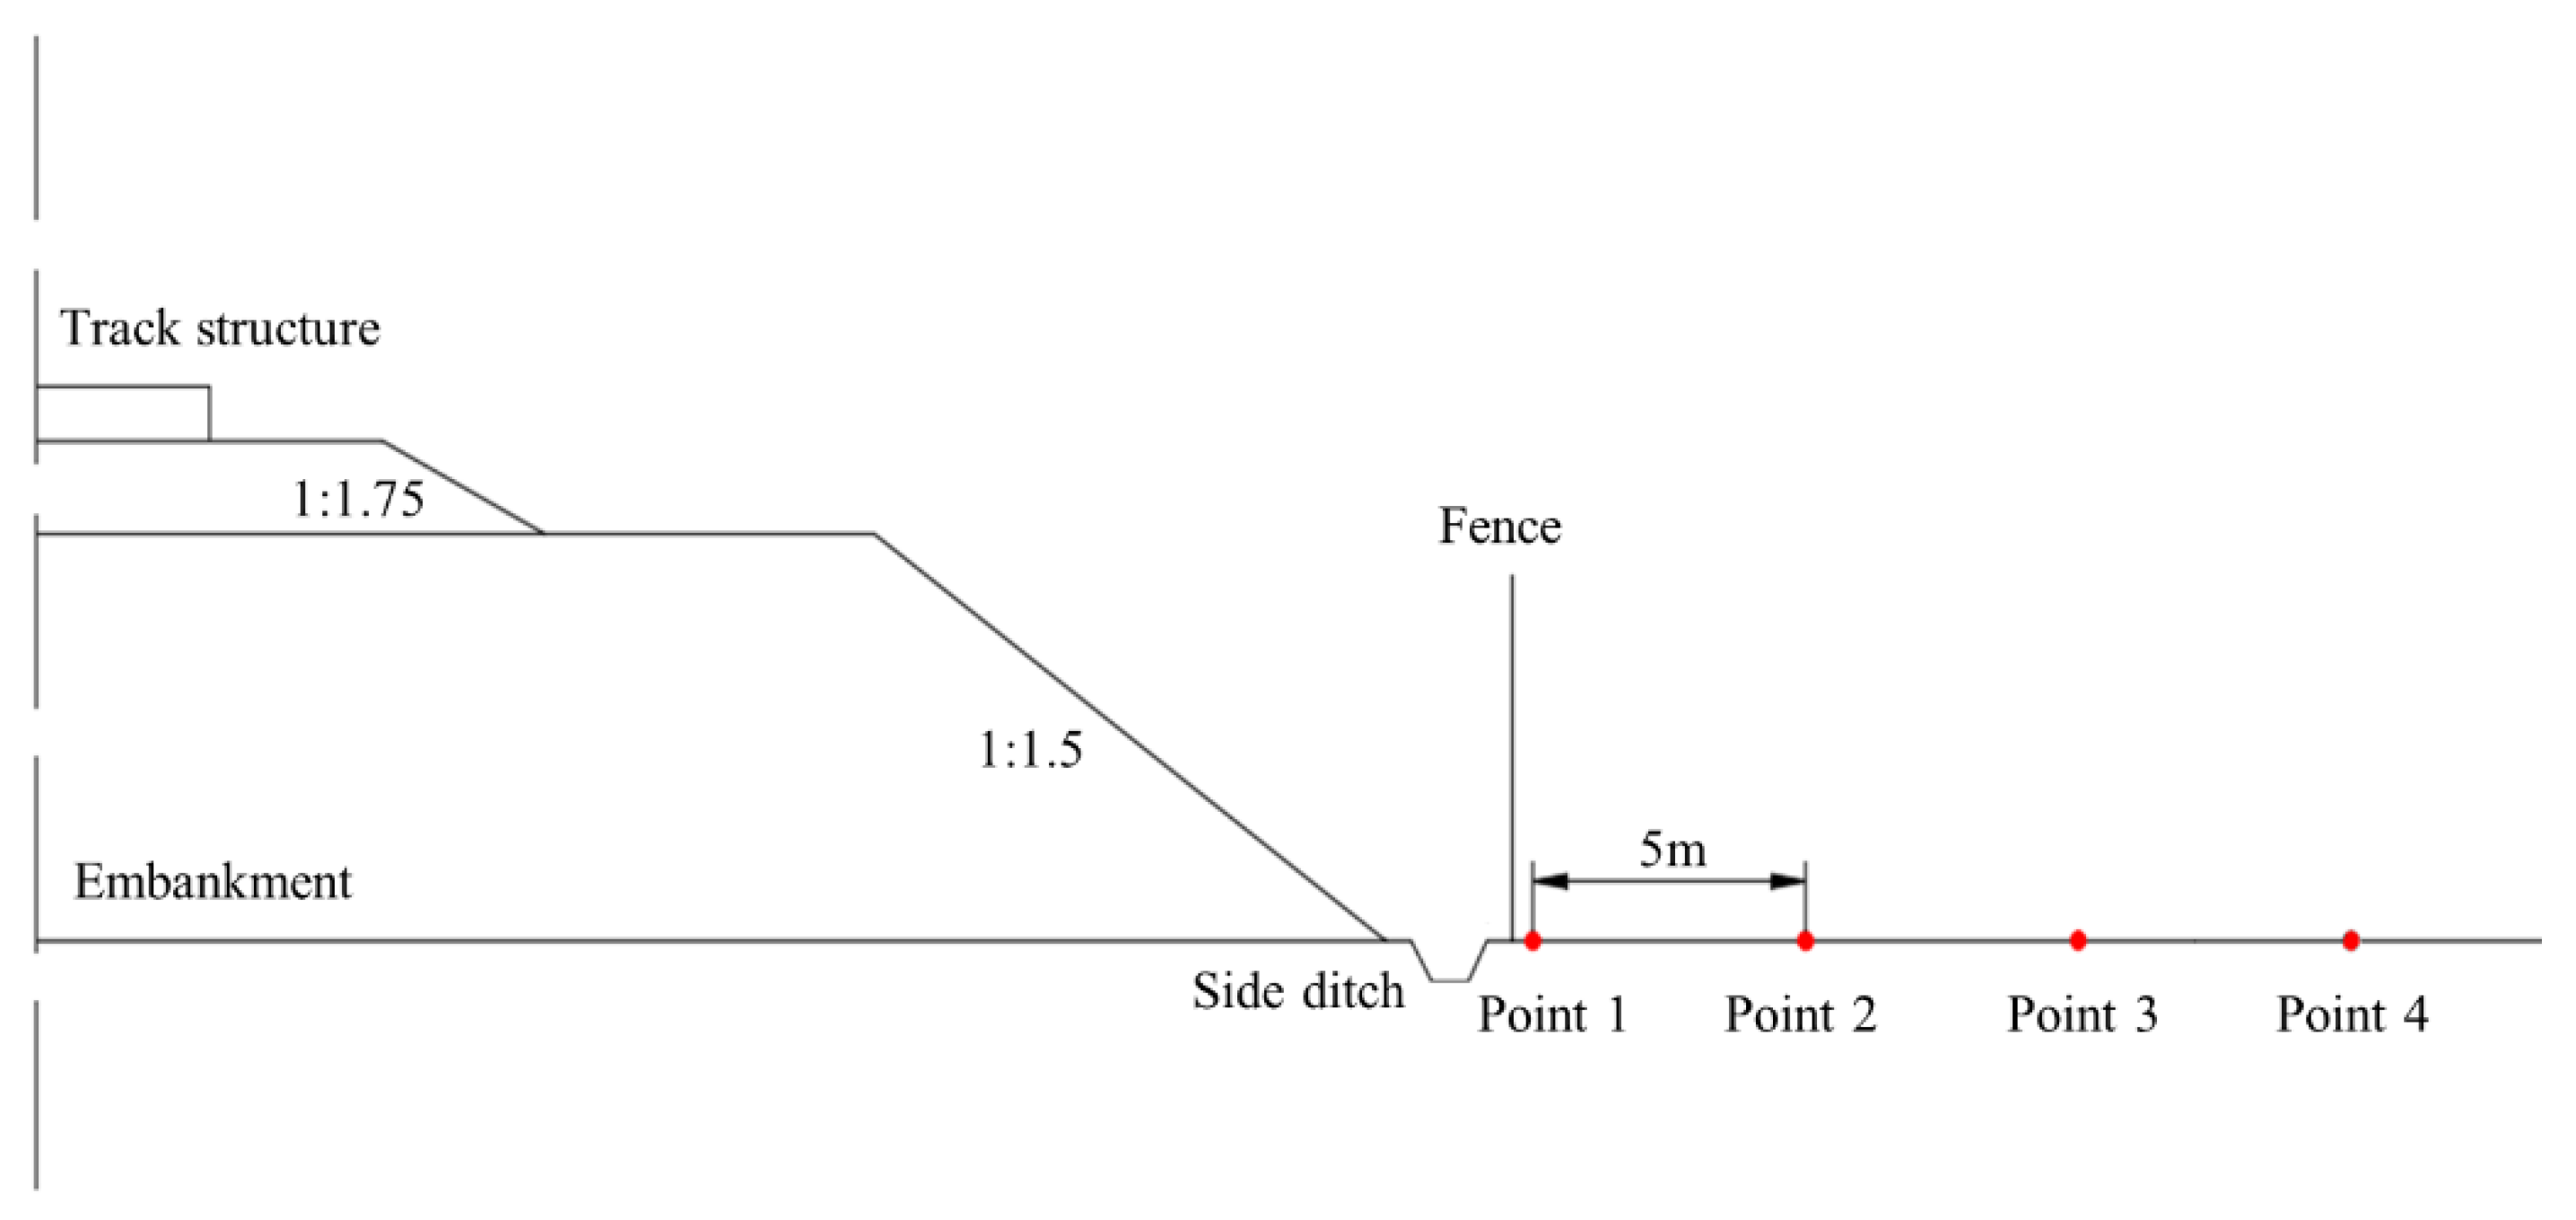
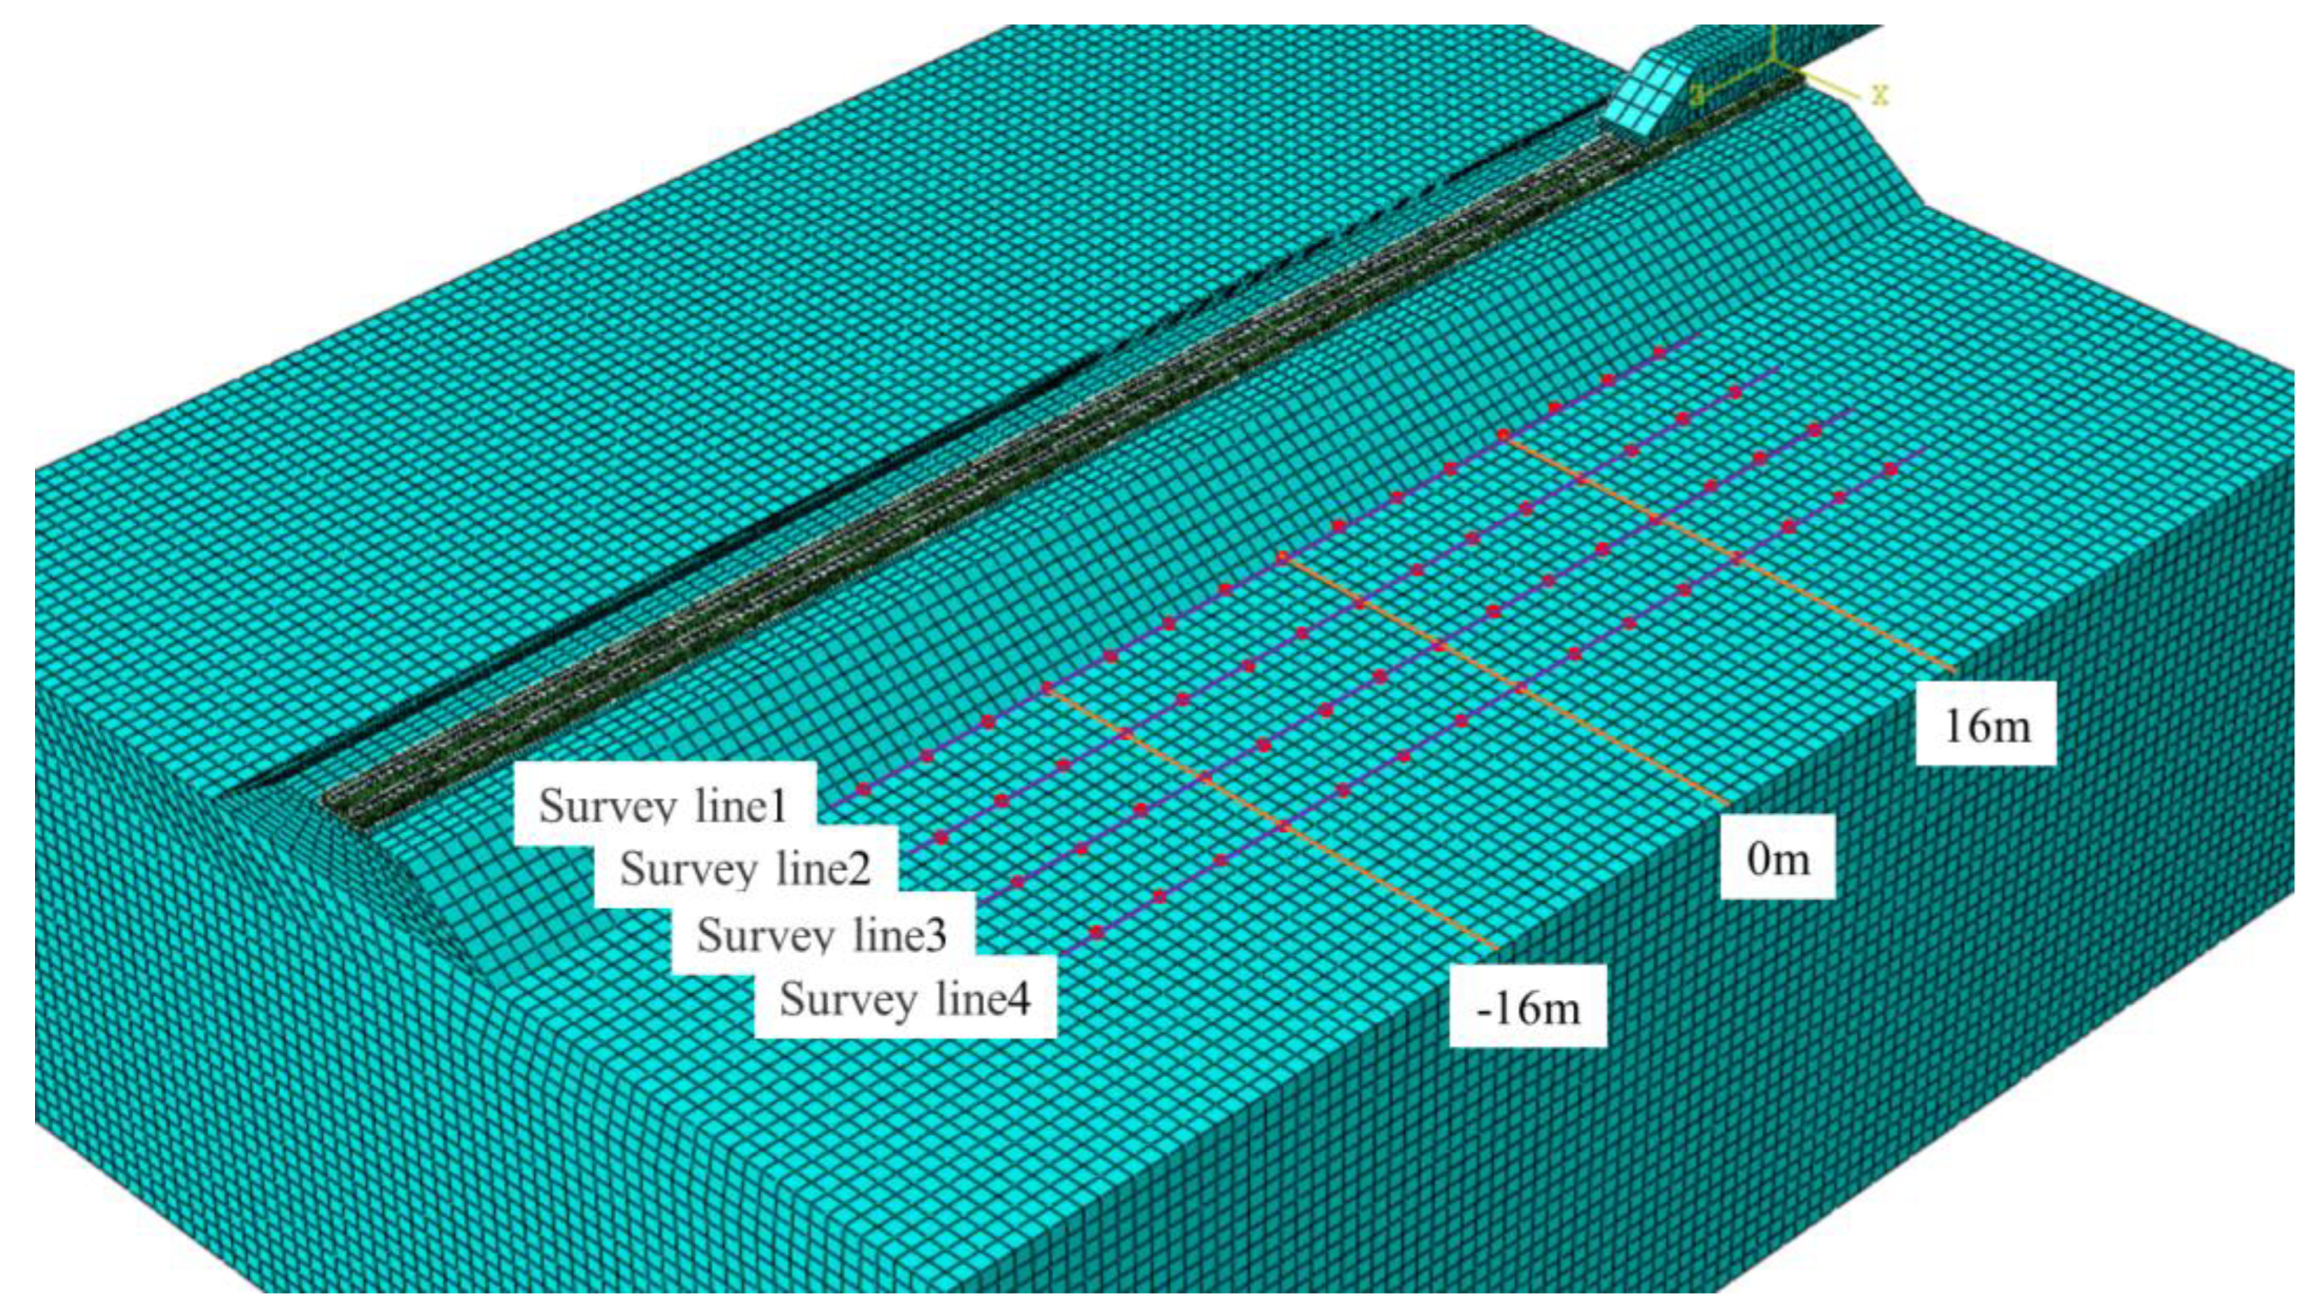
2.3. Design of Monitoring Points and Conditions

To achieve real-time monitoring of the entire subgrade for internal defects and to detect the specific locations where defects may occur, monitoring points were arranged on the left side of the subgrade. Four survey lines were laid out parallel to the subgrade direction at distances of 0 m, 5 m, 10 m, and 15 m from the toe of the slope, designated as survey lines 1 to 4. Fifteen rows of monitoring points were arranged perpendicular to the subgrade direction, with intervals of 4 m. The soil cavity was set at the centerline of the subgrade and the middle of the model. For ease of description, the center of the soil cavity was considered the origin. The left side of the soil cavity was taken as the negative direction and the right side as the positive direction. The layout of the monitoring points is shown in Figure 7.
For the train load, the axle weight was 16t and the train speed was 250 km/h. In the dynamic response analysis model of the subgrade, under the condition of a normal subgrade without soil holes, the subgrade filling height was 4 m. There was an underlying soil hole in the subgrade in karst areas, and the distance from the top plate of the soil hole to the subgrade filling body was 2 m. The soil hole was modeled as an ellipsoid with a long semi-axis of 1.5 m and a short semi-axis of 1 m. The modeled soil hole is shown in Figure 8. The two conditions simulated the passage of the train over a normal healthy subgrade and the subgrade in karst areas, respectively, to compare the vibration responses at the monitoring points and analyze the dynamic response characteristics of the high-speed railway subgrade.

3. Results and Discussion

Existing research indicated that under the influence of moving loads of identical size and speed, the displacement response patterns of a viscoelastic half-space body were similar in all three directions. However, the amplitude of vertical displacement was significantly greater than that of longitudinal and horizontal displacements [39]. Based on this, this paper primarily explores the vibration response of vertical dynamic displacement and vertical vibration acceleration.

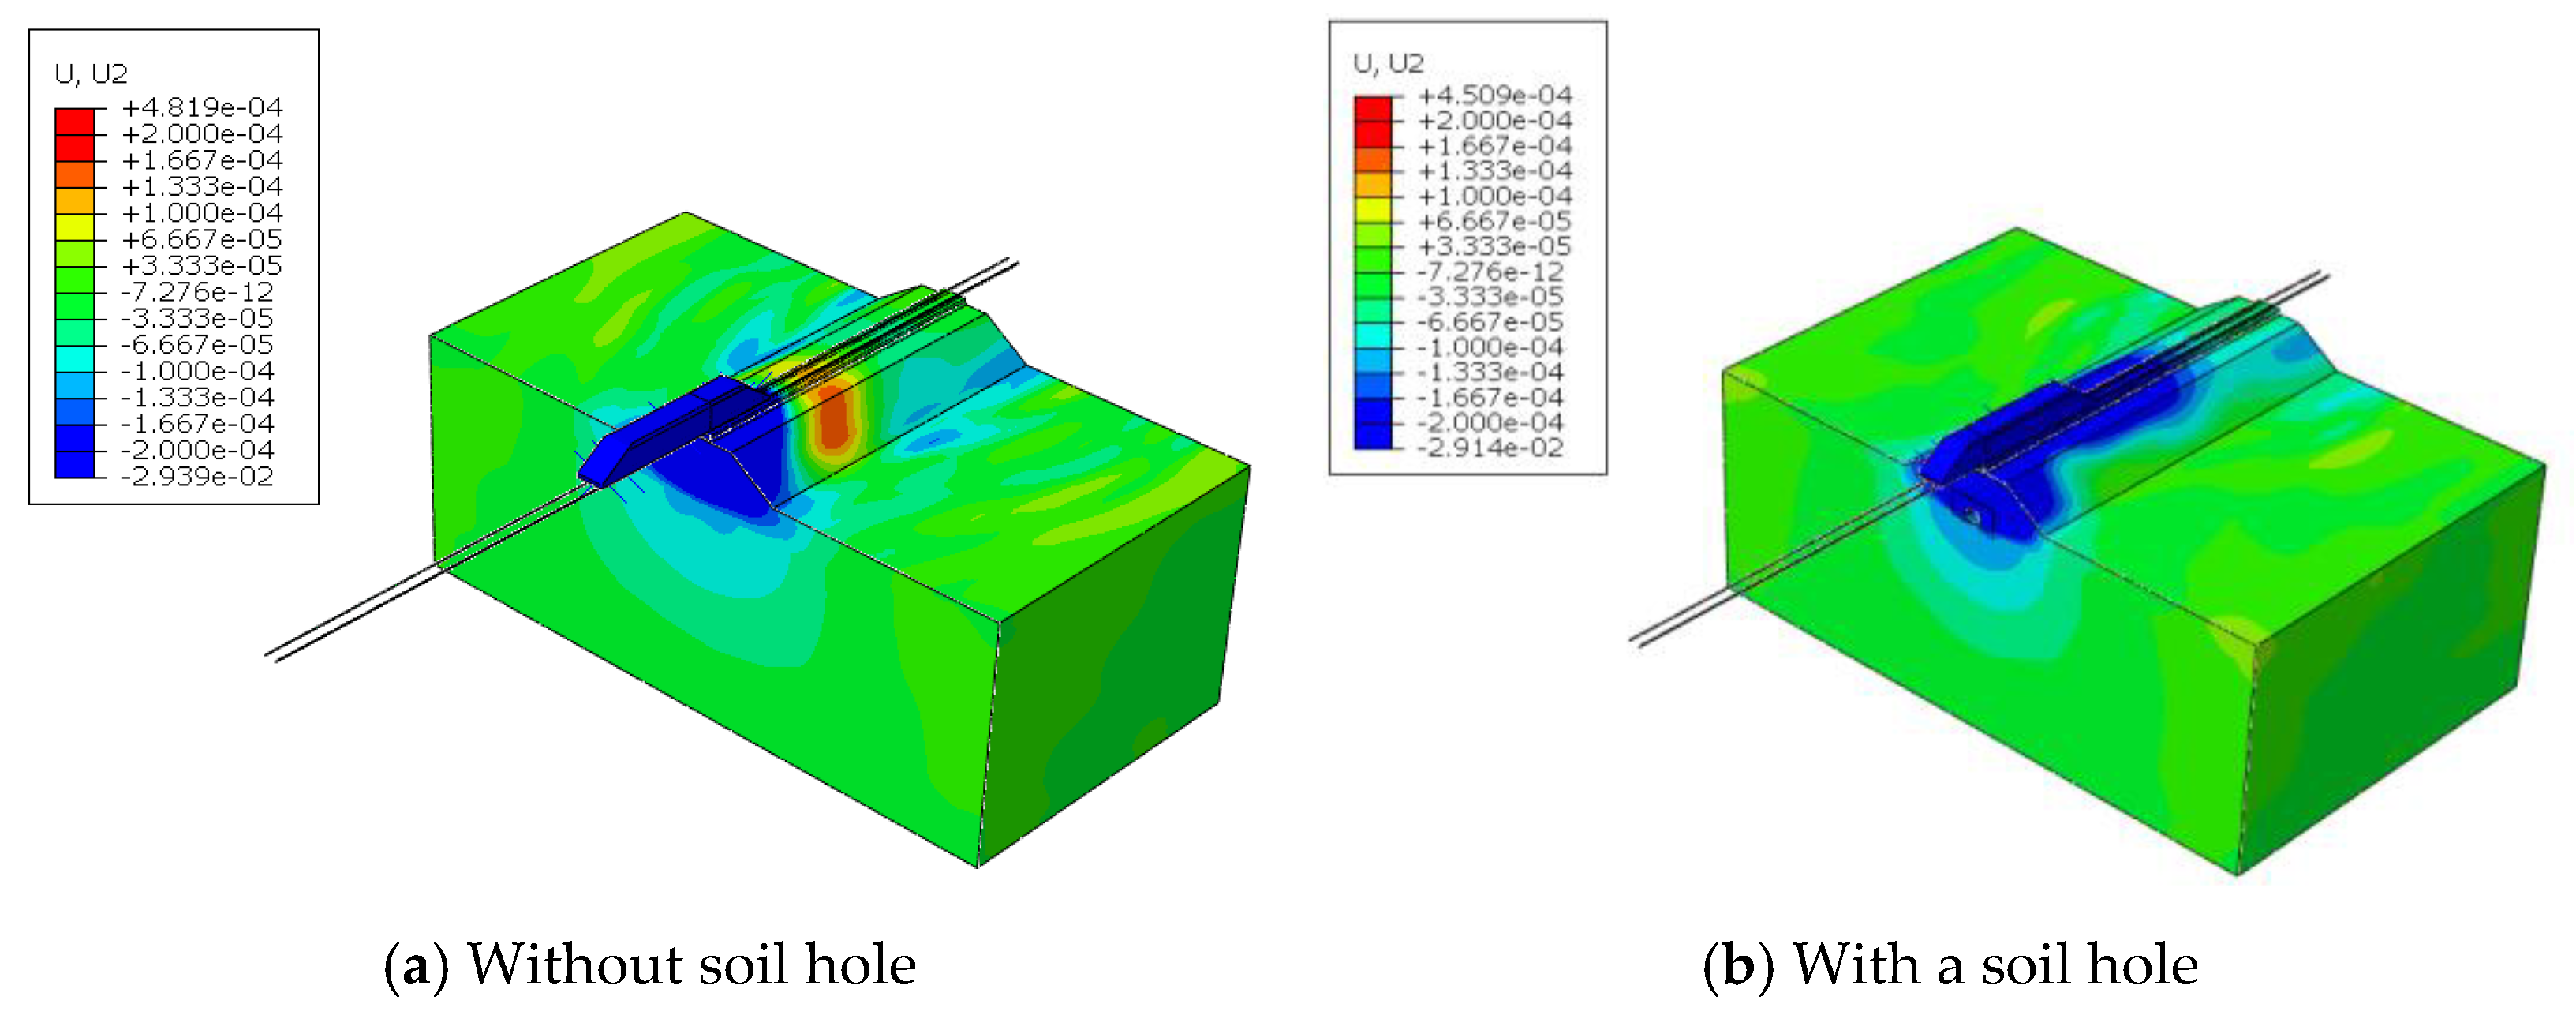
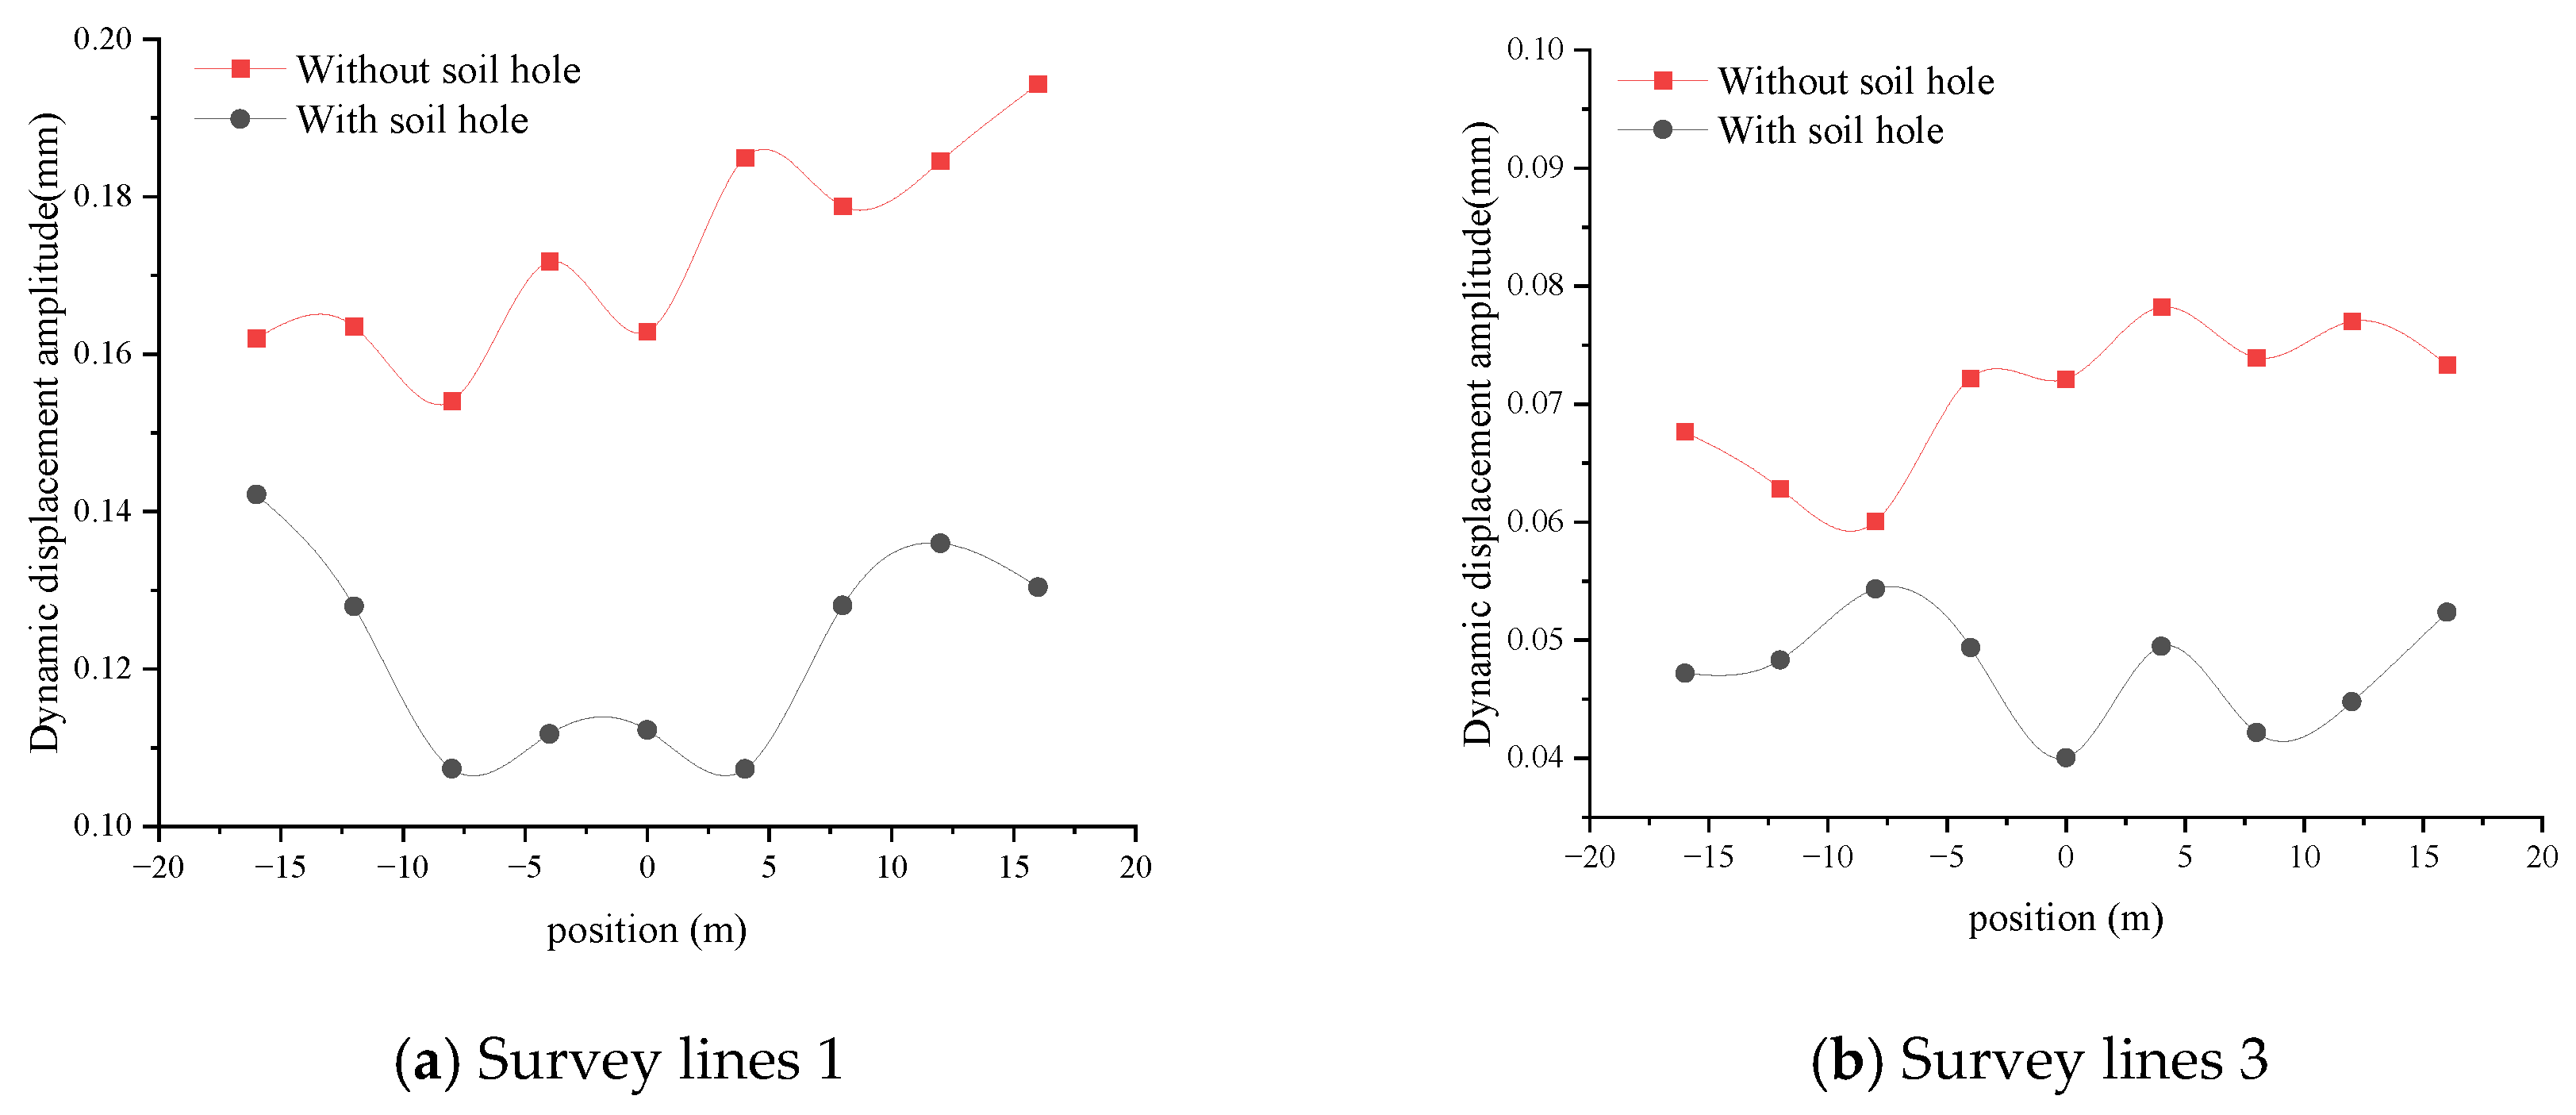
3.1. Distribution Characteristics of the Subgrade Dynamic Displacement

The time history curves of the vertical dynamic displacements at different monitoring points on survey line 1 at the toe of the slope when the train passed over the subgrade with an underlying soil hole and that without a soil hole are shown in Figure 9. As the train passed, both conditions exhibited two peaks in vertical dynamic displacement. This indicated that after the first bogie passed, the soil experienced significant vibration, which propagated to the toe of the subgrade slope, corresponding to the first peak. Subsequently, due to soil rebound and the passage of the second bogie, the overlapping vibrations created a second peak, resulting in a double-peak phenomenon. When there was no soil hole, the peak vertical dynamic displacements at the three positions were 0.162 mm, 0.163 mm, and 0.184 mm, respectively, whereas those with the underlying soil hole were 0.142 mm, 0.112 mm, and 0.130 mm, respectively. Calculations showed that the peak vertical dynamic displacements with the underlying soil hole were reduced by 12.35%, 33.29%, and 28.99% compared to the no-soil-hole condition, indicating that the amplitude of dynamic displacement was higher when there was no soil hole. Additionally, when there was a soil hole, the peak vertical dynamic displacement at the 0 m position was reduced by 21.11% and 13.85% compared to the −16 m and 16 m positions, respectively, indicating a significant attenuation of dynamic displacement amplitude at positions farther from the soil hole compared to those closer to it.
The displacement cloud diagram visually displays this characteristic. The displacement cloud diagrams of the vehicle at the same moment under both conditions are shown in Figure 10. The propagation distance of dynamic displacement was significantly farther when there was no soil hole. At the same positions, the dynamic displacement was notably greater without the soil hole, indicating that the presence of the soil hole increased the attenuation of elastic waves. That was because the integrity of the normal subgrade was better, resulting in less attenuation of elastic wave propagation, whereas the presence of a soil hole led to a looser soil structure, causing greater attenuation of elastic wave propagation.
The distribution characteristics of dynamic displacement amplitude in the subgrade of a high-speed railway in a karst area are shown in Figure 11. The vertical dynamic displacement amplitude was significantly greater when there was no soil hole compared to a soil hole. The dynamic displacement amplitudes at measurement points on survey line 1 were greater than those on survey line 3, indicating that the dynamic displacement significantly attenuated as the distance increased. Along the train’s running direction, the dynamic displacement amplitude without a soil hole showed a fluctuating decreasing trend, while when there was a soil hole, the dynamic displacement amplitude had no clear pattern. However, the vertical dynamic displacement amplitude curve on survey line 1 showed a concave shape, indicating that the attenuation coefficient of dynamic displacement amplitude at the soil hole location was greater than at other locations. In contrast, survey line 3, being farther from the soil hole, showed no clear pattern.
Table 4 shows the attenuation coefficient of dynamic displacement amplitude along the train running direction under different conditions. The attenuation range at the toe of the slope was approximately 30–40%, while at the position 10 m from the toe of the slope, the attenuation range was about 30–45%, with greater attenuation near the soil hole compared to other locations. Comparing the amplitude curves and attenuation coefficients, it was evident that the attenuation of the vertical vibration acceleration amplitude curve was more pronounced at the same positions. Considering that the vertical dynamic displacement decreased to below 0.02 mm at positions farther from the toe of the slope, this monitoring location might experience significant errors due to environmental changes, making accurate monitoring difficult. Therefore, the position 15 m from the toe of the slope was not included as a monitoring point for analysis.
In summary, the vertical dynamic displacement within a range of 0 m to 10 m from the toe of the subgrade slope can serve as an indicator of potential defects such as holes within the subgrade. If monitoring reveals a significant decrease in the dynamic displacement amplitude at or a certain distance from the toe of the subgrade, with an attenuation rate of approximately 30–50%, it can be inferred that there may be defects like soil holes in that section of the subgrade. The closer the monitoring point is to the defect, the greater the attenuation rate. By identifying the location with the maximum attenuation rate, the position of the defect can be determined, thereby assessing the hazardous state of the karst subgrade.

3.2. Distribution Characteristics of the Subgrade Vibration Acceleration

Vibration acceleration is an indicator reflecting the intensity of vibration at a specific point. Due to the high frequency and amplitude changes in the vibration acceleration curve, to reduce experimental error, the vibration acceleration amplitude was taken as the average of the five peak absolute values.
The spatial distribution relationship of vibration acceleration amplitude at the measurement points on survey lines 1 and 3 under different conditions is illustrated in Figure 12. The vertical vibration acceleration amplitude under the condition without a soil hole was consistently higher than that under the condition with a soil hole. At the position 10 m from the toe of the slope, the subgrade vibration acceleration amplitude showed significant attenuation compared to the toe position. Specifically, at the toe position with a soil hole, the vertical vibration acceleration curve featured smaller values in the middle and larger values on both sides, indicating that the closer the location is to the soil hole, the greater the attenuation of vibration acceleration. At the position 10 m from the toe of the slope, the subgrade vibration acceleration amplitude curve showed a wavy pattern, with the presence of the soil hole having little impact. Under the condition without a soil hole, the peak vertical vibration accelerations were 200.56 mm/s2, 208.34 mm/s2, and 242.41 mm/s2 at various positions, while with a soil hole, the peak values decreased to 164.31 mm/s2, 136.98 mm/s2, and 176.72 mm/s2, representing reductions of 18.07%, 36.26%, and 27.09%, respectively. This demonstrates that the vertical vibration accelerations were significantly higher without a soil hole at all positions. At the −16 m position, the vibration acceleration increased by 3.73% compared to the 0 m position without a soil hole, while it decreased by 19.95% in the presence of a soil hole. Similarly, at the 16 m position, the vibration acceleration decreased by 14.05% without a soil hole and by 29.01% with a soil hole. These results indicate that when a soil hole is present, the closer the distance to the hole, the greater the impact on elastic wave propagation, leading to more significant vibration attenuation. This occurs because the presence of the soil hole affects the propagation of elastic waves; as elastic waves pass through an air medium, the energy attenuation is greater than when they propagate through dense soil, resulting in a corresponding reduction in vertical vibration acceleration amplitude.
Calculations show that the attenuation range at the toe of the slope was approximately 30–40%, while the attenuation range at the position 10 m from the toe was about 10–30%, with more significant attenuation closer to the soil hole. Further calculations reveal that the vertical vibration acceleration at the monitoring point 15 m from the toe of the slope drops below 80 mm/s2, which could be affected by environmental factors, leading to potential monitoring errors. Therefore, monitoring points 15 m from the toe of the slope are not considered suitable for dynamic monitoring of the internal health of the subgrade.
In summary, the vibration acceleration at positions 0 m to 10 m from the toe of the slope can serve as a dynamic monitoring indicator for assessing the internal health of the subgrade. When the vibration acceleration monitored at the toe of the subgrade shows an attenuation rate of 30–40% compared to other segments of the subgrade without defects, it can be inferred that there are cavities or other defects within the subgrade.

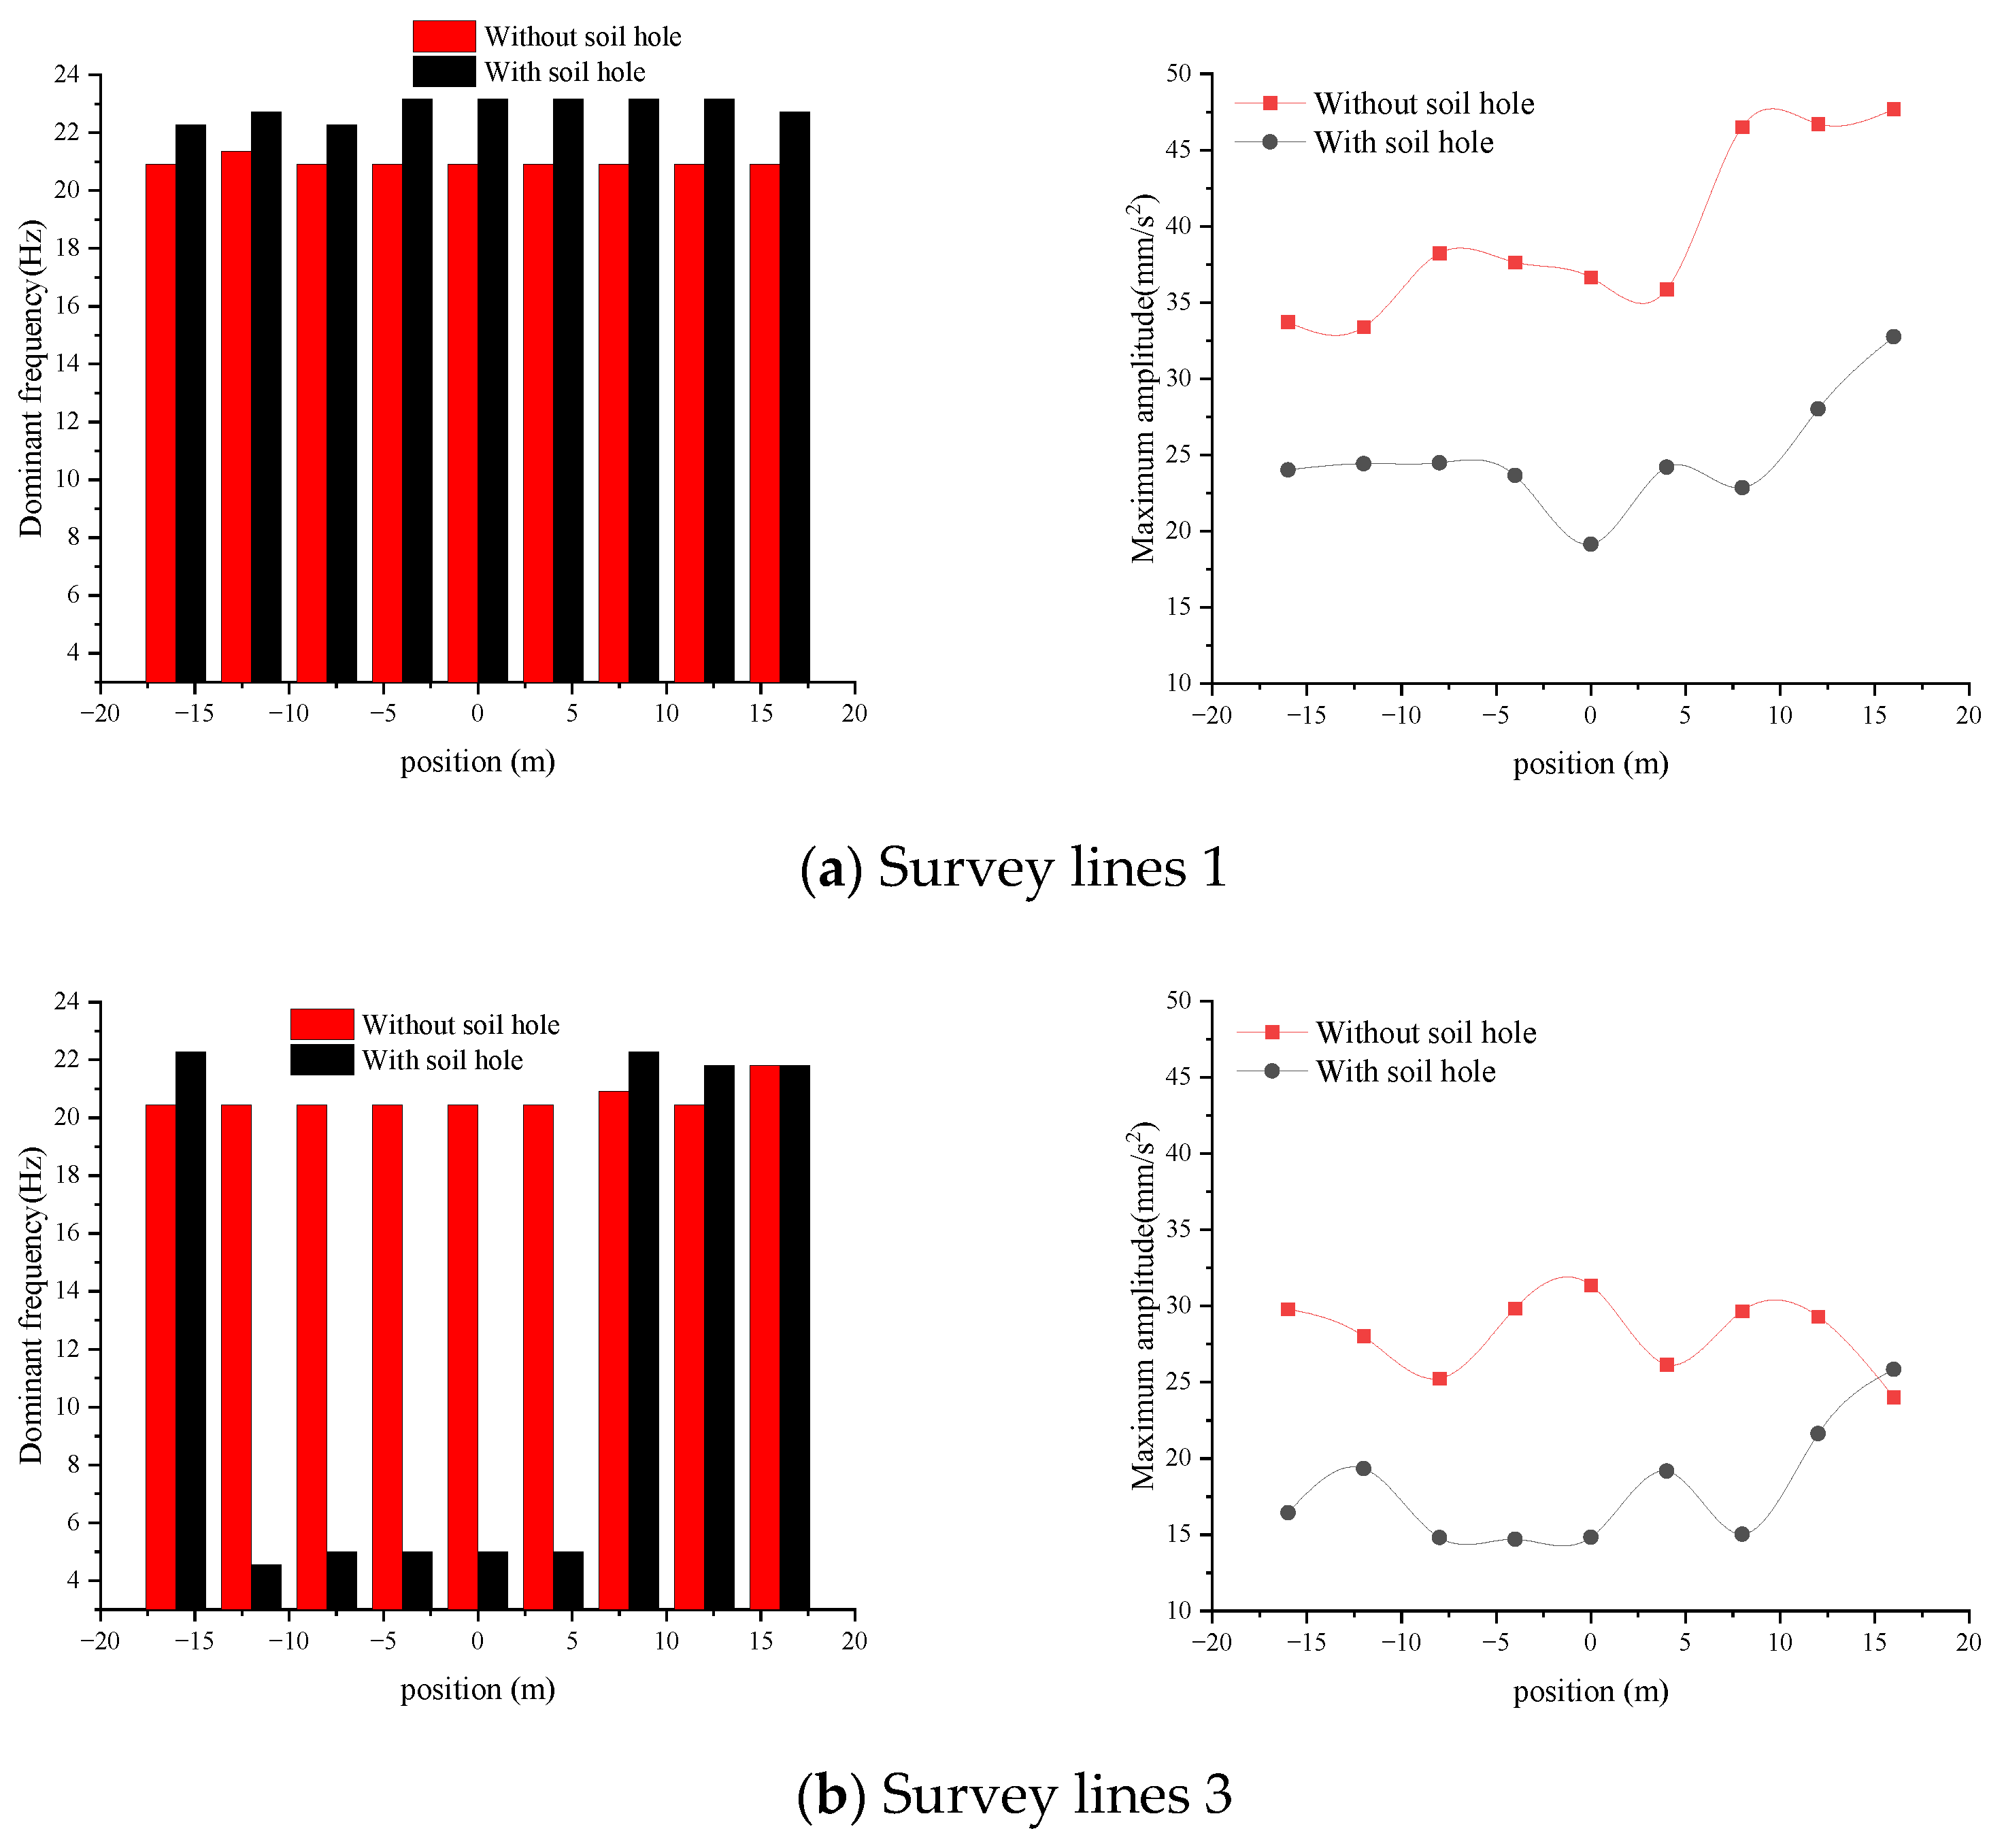
3.3. Distribution Characteristics of the Dominant Frequency and Amplitude of Subgrade Vibrations

In Section 3.2, the time-domain curves of subgrade vibration acceleration were analyzed. However, frequency-domain analysis can provide additional and distinct information. By performing a Fourier transform on the time-domain curves of vertical vibration acceleration, frequency-domain curves were obtained. The characteristic values, dominant frequency, and corresponding maximum amplitude from the frequency-domain curves were then analyzed.
The spectra of the vibration acceleration at different measuring points at different measurement points on survey line 1 at the toe of the slope under both conditions are shown in Figure 13. As shown in Figure 12, the dominant frequency under the condition without a soil hole was 20.91 Hz, while the dominant frequencies under the condition with a soil hole were 22.27 Hz, 23.18 Hz, and 22.73 Hz, respectively. This suggests that the dominant frequency is slightly higher under the condition with a soil hole compared to the condition without a soil hole, and the closer the position is to the soil hole, the higher the dominant frequency becomes. The maximum amplitudes at the three positions under the condition without a soil hole were 33.72 mm/s2, 36.66 mm/s2, and 47.68 mm/s2, respectively, while under the condition with a soil hole, the maximum amplitudes were reduced to 24.02 mm/s2, 19.14 mm/s2, and 32.76 mm/s2, representing attenuations of 28.76%, 47.79%, and 31.29%, respectively. These results indicate that the maximum amplitude is higher under the condition without a soil hole, while under the condition with a soil hole, the amplitude attenuation is more pronounced, particularly near the soil hole.
The spatial relationship curves of the dominant frequency and corresponding amplitude at the measurement points on survey lines 1 and 3 are shown in Figure 14. Comparing the dominant frequencies, it can be seen that the frequencies at the toe of the slope were concentrated in the 20–24 Hz range, while at the position 10 m from the toe of the slope on survey line 3, the frequency at the soil hole location dropped to 5 Hz, indicating that high-frequency vibrations have been largely absorbed by the soil. Comparing the amplitudes of the frequency-domain curves, it was evident that the farther the position was from the vibration source, the smaller the amplitude. The maximum amplitudes at the −16 m, 0 m, and 16 m positions on survey line 3, 10 m from the toe of the slope, under the condition without a soil hole were 21.8 mm/s2, 22.35 mm/s2, and 24.02 mm/s2, respectively, while under the condition with a soil hole, the maximum amplitudes were 16.45 mm/s2, 14.85 mm/s2, and 25.85 mm/s2, respectively. Compared to the condition without a soil hole, the amplitudes under the condition with a soil hole had attenuated by 24.54%, 33.56%, and −7.62%. Under the condition with a soil hole, the central position had a smaller maximum amplitude and a greater degree of attenuation compared to other positions, consistent with the characteristics observed at the toe of the subgrade.
In summary, the dominant frequency and corresponding amplitude of the vertical vibration acceleration frequency-domain curves at positions 0–10 m from the toe of the slope can also serve as dynamic monitoring indicators for assessing the health of the subgrade. Under karst subgrade conditions, the dominant frequency tends to decrease significantly as the distance from the monitoring point to the toe of the slope increases, with a corresponding decrease in amplitude. When the amplitude attenuation rate is around 30% to 50% compared to the healthy section of the subgrade, and the dominant frequency decreases significantly at locations farther from the toe of the slope, it can be inferred that there are cavities or other defects within the subgrade. The specific location of the soil cavity can be identified based on the monitoring point with the maximum frequency attenuation and the monitoring point with the greatest corresponding amplitude attenuation, thereby identifying the hazardous state of the karst subgrade.

4. Conclusions

This study analyzes the dynamic response characteristics of a high-speed railway subgrade in karst areas under moving train loads through numerical simulation, with a focus on selecting long-term monitoring points and indicators based on vibration response. The results obtained in this study are as follows:
(1) A refined nonlinear analysis model of the vehicle-track-subgrade system was established. Both field monitoring and numerical simulation of vertical vibration acceleration waveforms showed significant changes in vibration acceleration with minimal error, verifying the model’s accuracy.
(2) When there was a soil hole, the dynamic displacement amplitude and vibration acceleration amplitude of the subgrade decreased compared to when there was no soil hole, while the dominant frequency increased. Additionally, the dynamic displacement amplitude curves and vibration acceleration amplitude curves at various monitoring points near the toe of the slope showed a concave shape, with the dominant frequency being higher at locations closer to the soil hole. This all indicates that the vibration response at the soil hole location experiences significant attenuation.
(3) Utilizing the vibration response characteristics of the surrounding environment during train operation, the method of setting multiple monitoring points at equal distances along the direction parallel to the subgrade can effectively monitor the subgrade under different conditions. This approach allows for the detection of defects within the subgrade and the determination of their locations based on the attenuation of characteristic indicators.
(4) Monitoring points arranged at positions 0–10 m from the toe of the slope can effectively capture real-time changes in various indicators. The selected monitoring indicators include vertical dynamic displacement, vertical vibration acceleration, the dominant frequency of vertical vibration acceleration, and the corresponding amplitude, which can effectively indicate whether there are soil holes within the subgrade and identify the location of defects.

Author Contributions

Conceptualization, M.B.; Methodology, L.Y., Y.W. and H.L.; Software, Y.W.; Validation, L.Y. and Y.W.; Formal analysis, L.Y., Y.W. and H.L.; Data curation, L.Y. and Y.W.; Writing-original draft, L.Y., Y.W. and H.L.; Writing-review editing, M.B. and H.L.; Visualization, L.Y. and Y.W.; Supervision, M.B. All authors have read and agreed to the published version of the manuscript.

Funding

This research was funded by the National Natural Science Foundation of China (NSFC) grant number 42172311.

Institutional Review Board Statement

Not applicable.

Informed Consent Statement

Not applicable.

Data Availability Statement

The data presented in this study are available on request from the corresponding author.

Conflicts of Interest

Author Yanfeng Wei was employed by the company China Railway Siyuan Survey and Design Group Co., Ltd. The remaining authors declare that the research was conducted in the absence of any commercial or financial relationships that could be construed as a potential conflict of interest.

References

  1. Gutiérrez, F.; Parise, M.; De Waele, J.; Jourde, H. A review on natural and human-induced geohazards and impacts in karst. Earth-Sci. Rev. 2014, 138, 61–88. [Google Scholar] [CrossRef]
  2. An, B.L.; Gao, L.; Xin, T.; Xiang, G.R.; Wang, J. A Novel Approach of Identifying Railway Track Rail’s Modal Frequency from Wheel-Rail Excitation and its Application in High-Speed Railway Monitoring. IEEE Access 2019, 7, 180986–180997. [Google Scholar] [CrossRef]
  3. Gutiérrez, F.; Zarroca, M.; Linares, R.; Roqué, C.; Carbonel, D.; Guerrero, J.; McCalpin, J.P.; Comas, X.; Cooper, A.H. Identifying the Boundaries of Sinkholes and Subsidence Areas via Trenching and Establishing Setback Distances. Eng. Geol. 2018, 233, 255–268. [Google Scholar] [CrossRef]
  4. Fan, H.B.; Zhang, Y.H.; He, S.Y.; Wang, K.; Wang, X.L.; Wang, H. Hazards and Treatment of Karst Tunneling in Qinling-Daba Mountainous Area: Overview and Lessons Learnt from Yichang-Wanzhou Railway System. Environ. Earth Sci. 2018, 77, 1–18. [Google Scholar] [CrossRef]
  5. Akin, J.E.; Mofid, M. Numerical solution for response of beams with moving mass. J. Struct. Eng. 1989, 115, 120–131. [Google Scholar] [CrossRef]
  6. Mofid, M.; Akin, J.E. Discrete element response of beams with traveling mass. Adv. Eng. Softw. 1996, 25, 321–331. [Google Scholar] [CrossRef]
  7. Lee, U. Separation between the flexible structure and the moving mass sliding on it. J. Sound Vib. 1998, 209, 867–877. [Google Scholar] [CrossRef]
  8. Yamchelou, M.T.; Nikbin, I.M.; Zareian, H.; Charkhtab, S. Assessing Absolute Maximum Vibration Amplitude of a Rectangular Plate Subjected to a Moving Mass. Iran. J. Sci. Technol. Trans. Civ. Eng. 2017, 41, 135–147. [Google Scholar] [CrossRef]
  9. Ye, Z.C.; Chen, H.H. Vibration analysis of a simply supported beam under moving mass based on moving finite element method. Front. Mech. Eng. China 2009, 4, 397–400. [Google Scholar] [CrossRef]
  10. Chen, Q.; Yang, G.L.; Wang, X.F. Natural frequency analysis of Euler-Bernoulli beam subjected to moving mass. Chin. J. Comput. Mech. 2012, 29, 340–344. [Google Scholar]
  11. De Oliveira, F.M.; Greco, M. Nonlinear dynamic analysis of beams with layered cross sections under moving masses. J. Braz. Soc. Mech. Sci. Eng. 2015, 37, 451–462. [Google Scholar] [CrossRef]
  12. He, Z.M.; Yang, Y.; Zeng, X.F.; Liu, S.Z. Response Analysis of Subgrade Deformation in Evolution of Concealed Soil Cave. J. Cent. South Univ. (Sci. Technol.) 2018, 49, 3068–3076. [Google Scholar]
  13. Ling, X.Z.; Chen, S.J.; Zhu, Z.Y.; Zhang, F.; Wang, L.N.; Zou, Z.Y. Field Monitoring on the Train-Induced Vibration Response of Track Structure in the Beiluhe Permafrost Region Along Qinghai-Tibet Railway in China. Cold Reg. Sci. Technol. 2010, 60, 75–83. [Google Scholar] [CrossRef]
  14. Ling, X.Z.; Zhang, F.; Zhu, Z.Y.; Ding, L.; Hu, Q.L. Field Experiment of Subgrade Vibration Induced by Passing Train in a Seasonally Frozen Region of Daqing. Earthq. Eng. Eng. Vib. 2009, 8, 149–157. [Google Scholar] [CrossRef]
  15. Auersch, L. Ground Vibration due to Railway Traffic—The Calculation of the Effects of Moving Static Loads and their Experimental Verification. J. Sound Vib. 2006, 293, 599–610. [Google Scholar] [CrossRef]
  16. Cai, Y.Q.; Guo, L.; Jardine, R.J.; Wang, J. Stress-strain Response of Soft Clay to Traffic Loading. Géotechnique 2017, 67, 446–451. [Google Scholar] [CrossRef]
  17. Liu, W.Z.; Huang, X.J.; Sun, X.; Feng, X.M.; Gao, F.L. Field Tests on Dynamic Response and Characteristics of Lateritic Soil Subgrade under the Combined Action of Wetting and Cyclic Loading. Soil Dyn. Earthq. Eng. 2024, 181, 108688. [Google Scholar] [CrossRef]
  18. Li, Z.F.; Yang, X.X.; Zhang, S.; Yu, Y.; Lin, Y.H.; Wu, J.C. Analysis of Soil Differences in Subway Vibration Transmission Paths. Buildings 2024, 14, 1338. [Google Scholar] [CrossRef]
  19. Li, X.; Bai, M.Z.; Wei, Z.J.; Li, P.X.; Shi, H.; Zhang, Y. Dynamic Response and Stability Analysis of High-Speed Railway Subgrade in Karst Areas. IEEE Access 2021, 9, 129188–129206. [Google Scholar]
  20. Li, P.X.; Bai, M.Z.; Wei, Z.J.; Li, X.; Shi, H. Stability Analysis of Subgrade under Dynamic Loading of Single and Double High-Speed Railways in Karst Areas. KSCE J. Civ. Eng. 2022, 26, 3301–3313. [Google Scholar] [CrossRef]
  21. Qu, C.Z.; Tan, X.Y.; Xiao, Y.J.; Wang, Z.; Wei, L.M. Subgrade Vibrations and Long-term Stability of an Embankment-bridge Transition Zone in Non-Ballasted High-Speed Railway. Transp. Geotech. 2024, 45, 101199. [Google Scholar] [CrossRef]
  22. Bai, M.Z.; Liu, H.Y.; Cui, Z.Z.; Wang, D.Y.; Han, J.T.; Gao, C.R.; Li, S.L. A Study on the Influence of Steel Structures in Concrete Subgrades on the Detection of Subgrade Distresses by Ground-penetrating Radar. Sustainability 2023, 15, 16656. [Google Scholar] [CrossRef]
  23. Hou, Z.Z.; Zhao, W.G.; Yang, Y. Identification of Railway Subgrade Defects based on Ground Penetrating Radar. Sci. Rep. 2023, 13, 6030. [Google Scholar] [CrossRef] [PubMed]
  24. Ye, Z.J.; Zhang, C.P.; Ye, Y. Principle of a Low-frequency Transient Electromagnetic Radar System and its Application in the Detection of Underground Pipelines and Voids. Tunn. Undergr. Space Technol. 2022, 122, 104392. [Google Scholar] [CrossRef]
  25. Ren, J.J.; Liu, W.; Du, W.; Zheng, J.L.; Wei, H.; Zhang, K.Y.; Ye, W.L. Identification Method for Subgrade Settlement of Ballastless Track based on Vehicle Vibration Signals and Machine Learning. Constr. Build. Mater. 2023, 369, 130573. [Google Scholar] [CrossRef]
  26. Xiao, J.H.; Bai, Y.Q.; Liu, X.Z.; Song, C.J.; Sun, S.Q.; Liu, X.Z. Feature Analysis of Precipitation-induced Subgrade Defects on a High-Speed Rail Ballasted Track Using Multiple Track Inspection Data: A Case Study. Proc. Inst. Mech. Eng. Part F J. Rail Rapid Transit 2024, 238, 09544097241234094. [Google Scholar] [CrossRef]
  27. Dong, L.H.; Chen, J.D.; Song, D.Q.; Wang, C.W.; Liu, X.L.; Liu, M.X.; Wang, E.Z. Application of Long-range Cross-hole Acoustic Wave Detection Technology in Geotechnical Engineering Detection: Case Studies of Tunnel-Surrounding Rock, Foundation and Subgrade. Sustainability 2022, 14, 16947. [Google Scholar] [CrossRef]
  28. Li, D.; Zhang, J.F.; Wang, C.W.; Jiang, F.X. Propagation Patterns of Microseismic Waves in Rock Strata During Mining: An Experimental Study. Int. J. Miner. Metall. Mater. 2019, 26, 531–537. [Google Scholar] [CrossRef]
  29. Liu, X.L.; Han, M.S.; Li, X.B.; Liu, Z. Elastic Wave Attenuation Characteristics and Relevance for Rock Microstructures. J. Min. Sci. 2020, 56, 216–225. [Google Scholar] [CrossRef]
  30. Duan, C.L.; Yan, C.H.; Xu, B.T.; Zhou, Y.K. Crosshole Seismic CT Data Field Experiments and Interpretation for Karst Caves in Deep Foundations. Eng. Geol. 2017, 228, 180–196. [Google Scholar] [CrossRef]
  31. Li, Q.G.; Lin, F.P.; Hu, Q.T.; Jiang, Z.Z.; Wu, X.B.; Qian, Y.N. Experimental Study on Attenuation Characteristics of Elastic Waves Propagation in Layered Coal Rock. Coal Sci. Technol. 2022, 50, 184–190. [Google Scholar]
  32. Jing, G.; Zhao, Y.X.; Wang, H.; Montanari, P.M.; Lacidogna, G. Study of Coal and Magnetite Collapse Process and Precursor based on Acoustic Emission Flicker Noise Spectroscopy. Rock Mech. Rock Eng. 2024, 1–18. [Google Scholar] [CrossRef]
  33. Shen, J.G.; Liu, J.C.; Shen, Y.J. Coupling Characteristics of Mode Waves and Resonant Waves in Roadbed Erosion Detection. Prog. Geophys. 2022. Available online: http://kns.cnki.net/kcms/detail/11.2982.P.20221228.1012.015.html (accessed on 27 August 2024).
  34. Li, J.; Chen, S.X.; Yu, F.; Dai, Z.J. Remote Monitoring for a High-Speed Railway Subgrade Structure State in a Mountainous Area and its Response Analysis. Bull. Eng. Geol. Environ. 2018, 77, 409–427. [Google Scholar] [CrossRef]
  35. Deng, Z.X.; Xie, K.; Wang, W.B.; Su, Q.; Xu, L.R.; Li, J.S.; Liu, B. A New Method of Rapid-Intelligent Assessment for the Dynamic Service Performance in High-Speed Railway Subgrade. Int. J. Rail Transp. 2024, 1–28. [Google Scholar] [CrossRef]
  36. Aggestam, E.; Nielsen, J.C.O. Simulation of Vertical Dynamic Vehicle–Track Interaction Using a Three-Dimensional Slab Track Model. Eng. Struct. 2020, 222, 110972. [Google Scholar] [CrossRef]
  37. TB10098-2017; Code for Design of High Speed Railway. National Railway Administration of the People’s Republic of China: Beijing, China, 2014.
  38. Guo, X.R.; Yang, Y.F.; Wang, C.; Ling, L.; Wang, K.Y.; Zhai, W.M. Influence of Wheel/Rail Dynamic Interaction Induced by Polygonal Wheels under Braking Condition. J. Mech. Eng. 2023, 59, 196–203. [Google Scholar]
  39. Si, L.T.; Zhao, Y.; Zhang, Y.H. Dynamic Response of Viscoelastic Half-space Subjected to Moving Random Line Loads. Eng. Mech. 2016, 33, 98–106. [Google Scholar]
Figure 1. Simplified diagram of the vehicle model.
Applsci 14 08715 g001
Figure 2. 3D Simulation diagram of the vehicle-track-subgrade.
Applsci 14 08715 g002
Figure 3. Equipment used for field monitoring: (a) Model 291-2 vibration picker, (b) Data-acquisition instrument.
Applsci 14 08715 g003
Figure 4. Distribution diagram of field monitoring points(Point 1: Outside the fence; Point 2: 5 meters from Point 1; Point 3: 10 meters from Point 1; Point 4: 15 meters from Point 1).
Applsci 14 08715 g004
Figure 5. Comparison of vibration acceleration between field monitoring and numerical simulation.
Applsci 14 08715 g005
Figure 6. Comparison of vibration acceleration amplitude between field monitoring and numerical simulation.
Applsci 14 08715 g006
Figure 7. Layout of the monitoring points.
Applsci 14 08715 g007
Figure 8. Mesh division diagram of the soil hole.
Applsci 14 08715 g008
Figure 9. Time history curve of the dynamic displacement at different positions at the toe of the high-speed railway subgrade in karst areas.
Applsci 14 08715 g009
Figure 10. Displacement cloud diagram of the subgrade (unit: mm).
Applsci 14 08715 g010
Figure 11. The distribution characteristics of dynamic displacement amplitude in the subgrade of a high-speed railway in a karst area.
Applsci 14 08715 g011
Figure 12. Spatial distribution of vibration acceleration amplitude at measurement points on survey lines 1 and 3.
Applsci 14 08715 g012
Figure 13. Spectra of the vibration acceleration at different measuring points.
Applsci 14 08715 g013
Figure 14. The spatial relationship curves of the dominant frequency and corresponding amplitude at the measurement points on survey lines 1 and 3.
Applsci 14 08715 g014
Table 1. The main parameters of the train vehicle model.
StructureParameterUnitValue
CarbodyLengthm25.85
Widthm3.3
Heightm3.9
Wheelbasem1.435
Axle loadN478,800
AxleWeightN17,950
BogieWeightN44,700
Table 2. Calculation parameters of fasteners.
ParameterUnitValue
Vertical stiffnessN/m4.5 × 107
Lateral stiffnessN/m3.0 × 102
Vertical dampingN·s/m6.0 × 104
Lateral dampingN·s/m3.625 × 104
Longitudinal dampingKN/group9
Spacingm0.6
Table 3. Parameters of the ballastless track-subgrade model.
Structural LayerModel ParametersRayleigh Damping Coefficients
ParameterUnitValueParameter (Unit: s−1)Value
RailElastic modulusGPa210 α 0.0328
Poisson’s ratio 0.3
Cross-sectional areacm376.45 β 0.0031
Densitykg·m−37800
Track slabElastic modulusGPa35.5 α 0.0983
Poisson’s ratio 0.2
Length × Width × Thicknessm × m × m100 × 2.55 × 0.2 β 0.0092
Densitykg·m−32500
CA mortarElastic modulusMPa7000 α 0.0983
Poisson’s ratio 0.2
ThicknessM0.03 β 0.0092
Densitykg·m−31800
Supporting layerElastic modulusGPa22 α 0.0983
Poisson’s ratio 0.2
Span × Thicknessm × m(2.95/3.25) × 0.3 β 0.0092
Densitykg·m−32500
Subgrade surface layerElastic modulusGPa220 α 0.2620
Poisson’s ratio 0.25
Densitykg·m−32100
CohesionKPa35 β 0.0244
Internal friction angle°43
Length × Thicknessm × m100 × 0.4
Subgrade bottom layerElastic modulusGPa130 α 0.2293
Poisson’s ratio 0.3
Densitykg·m−31900
CohesionKPa13 β 0.0214
Internal friction angle°28
Length × Thicknessm × m100 × 2.3
Subgrade bodyElastic modulusGPa50 α 0.2750
Poisson’s ratio 0.2
Densitykg·m−31800
CohesionKPa30 β 0.0305
Internal friction angle°25
Length × Thicknessm × m100 × 1.3
Surface soil layer of the foundationElastic modulusGPa50 α 0.2454
Poisson’s ratio 0.2
Densitykg·m−31800
CohesionKPa30 β 0.0016
Internal friction angle°25
Length × Width × Thicknessm × m × m100 × 80 × 3
BedrockElastic modulusGPa190 α 0.2454
Poisson’s ratio 0.25
Densitykg·m−32650
CohesionKPa20 β 0.0016
Internal friction angle°44.3
Length × Width × Thicknessm × m × m100 × 80 × 27
Table 4. Attenuation rates of dynamic displacement amplitudes at measurement points on survey lines 1 and 3.
Distance from Soil Cavity (m)Survey Lines 1Survey Lines 3
Dynamic Displacement
Amplitudes (mm)
Attenuation Coefficient (%)Dynamic Displacement
Amplitudes (mm)
Attenuation Coefficient (%)
Normal SubgradeKarst SubgradeNormal SubgradeKarst Subgrade
−160.16200.142212.350.06770.047230.22
−120.16350.128021.730.06290.048323.11
−80.15410.107330.330.06010.05439.55
−40.17180.111734.960.07220.049431.61
00.16280.112333.290.07010.040144.47
40.18500.107341.980.07820.049536.72
80.17880.128128.370.07390.042237.92
120.18450.136029.310.07700.044835.83
160.19430.130428.990.07330.052428.55
Disclaimer/Publisher’s Note: The statements, opinions and data contained in all publications are solely those of the individual author(s) and contributor(s) and not of MDPI and/or the editor(s). MDPI and/or the editor(s) disclaim responsibility for any injury to people or property resulting from any ideas, methods, instructions or products referred to in the content.

