Abstract
This paper deals with the experimental procedures of lock-in thermography (LIT) for polyetheretherketone (PEEK), which is used as a lightweight material in various industrial fields. The LIT has limitations due to non-uniform heating by external optic sources and the non-uniformity correction (NUC) of the infrared (IR) camera. It is generating unintended contrast in the IR image in thermal imaging inspection, reducing detection performance. In this study, the non-uniformity effect was primarily improved by producing an equivalent array halogen lamp. Then, we presented absolute temperature compensation (ATC) and temperature ratio compensation (TRC) techniques, which can equalize the thermal contrast of the test samples by compensating for them using reference samples. By applying compensation techniques to data acquired from the test samples, defect detectability improvement was quantitatively presented. In addition, binarization was performed and detection performance was verified by evaluating the roundness of the detected defects. As a result, the contrast of the IR image was greatly improved by applying the compensation technique. In particular, raw data were enhanced by up to 54% using the ATC compensation technique. Additionally, due to improved contrast, the signal-to-noise ratio (SNR) was improved by 7.93%, and the R2 value of the linear trend equation exceeded 0.99, demonstrating improved proportionality between the defect condition and SNR.
1. Introduction
Polyetheretherketone (PEEK) is a high-performance polymer that is attracting significant attention for various industrial applications. PEEK is a thermoplastic resin that provides a unique combination of properties and can be used even under high-temperature and high-pressure conditions. It has excellent high-temperature resistance, chemical resistance, mechanical strength, dimensional stability, biocompatibility, electrical properties, salt resistance, and radiation resistance, and its application fields are increasingly expanding [1]. It is typically used in the automotive, aerospace, industrial equipment, medical, and oil and gas industries. In particular, in automobiles, it is a material suitable for lightening with excellent physical properties and is applied to various parts, such as engine components, electrical and electronic components, interior materials, and structural components [2,3,4]. PEEK can develop defects such as cracks, incomplete formation, and separated layers during the manufacturing process. Although PEEK is resistant to some harsh chemicals, it can be chemically damaged under certain conditions, and this damage can lead to catastrophic problems, so it is essential to inspect and maintain it beforehand. These defects can cause fatal problems, so inspecting and maintaining them in advance is essential [5,6].
Recently, various structures have undergone significant changes in their quality and quantity by the rapid trends of larger size, higher pressure, and higher speed. Still, it is not possible to expect flawless materials and processing methods. Therefore, it is necessary to determine whether the purpose of use can be satisfied by checking the extent to which defects are contained in the material parts and structures. Non-destructive testing (NDT) refers to a test that examines the condition of the external and internal structures of the object (material, structure, part, etc.) to be inspected without altering its original form or function. Preventing component failure is essential both in manufacturing and in service, as damage seriously reduces the stability of the structure. They are applying effective and reliable non-destructive testing and structural health monitoring to improve economics and availability.
Previously, visual inspection (VT), liquid penetration testing (LPT), magnetic particle testing (MPT), ultrasonic inspection (UT), acoustic emission testing (AE), eddy current testing (ECT), radiographic testing (RT), and thermographic testing (TT) are being studied and applied as non-destructive inspection technologies [5,7,8,9,10]. Among them, the TT has shown great potential and advantages regarding fast inspection speed and the possibility of detecting internal defects through heat conduction through external energy excitation. Additionally, advances in signal and image processing techniques can provide results with high resolution and sensitivity [11,12].
In general, infrared thermographic non-destructive testing uses an active thermography method that uses an external heat source to apply energy to the surface of the test specimen. Representative active thermography includes optical-infrared thermography, eddy current thermography, ultrasonic thermography, laser thermography, and thermography methods utilizing other heat sources. Among them, optical-infrared thermography using optical devices is the most widely used [13,14]. Optical-infrared thermography methods include pulse thermography (PT), which uses instantaneous heating using a high-power flash lamp, and lock-in thermography (LIT), which uses sinusoidal periodic heating using a halogen lamp. Since both measurement methods use heating using an optical source, the energy becomes weaker as the distance from the center of the optical source increases, resulting in uneven energy supply. To improve these limitations, research has been conducted on various signal and data processing algorithms. Representative IR signal processing techniques include Fourier transform-based Pulse Phase Thermography (PPT) [15]. In addition, there are Principal Component Thermography (PCT) [16] using principal component analysis, Thermographic Signal Reconstruction (TSR) [17] using mathematical derivatives, and Wavelet Thermography (VT) [18] based on Wavelet transform. Various studies have been conducted to expand the above signal processing technique and have been published in the literature [19]. However, research on the developing devices and methods that can provide fundamentally uniform heating is insufficient. In addition, with the development of materials, electronics, and signal processing technology, infrared (IR) cameras are becoming more economical, and their resolution and efficiency are improving. Non-destructive testing requires accurate temperature measurement and stable IR image acquisition, and the prevention and supplementation of various error-causing factors are necessary. Infrared energy emitted from the inspection object is converted into temperature through digital levels detected by an IR camera. During the temperature conversion process, imperfections in the black body considered in IR camera calibration, errors in detector non-uniformity correction (NUC), and emissivity measurement errors may occur, and the proper emissivity knowledge, calibration, and correction of emissivity are required [20,21,22,23].
In this study, an equivalent array lamp was designed, manufactured, and applied to the study for uniform heating during digital lock-in thermography testing. In addition, test samples simulating defect conditions of various sizes and depths and reference samples without defects were produced. In a halogen lamp considered as a heat source, the intensity of energy irradiated may appear non-uniform depending on the shape, location, angle, and distance of the heat source. This unevenness creates unintended contrast in the thermogram, which affects the identification and detection of defect shapes. Accordingly, using a reference sample, the transient imbalance caused by the halogen lamp during LIT inspection was confirmed, and a compensation sheet for the thermogram was created. The LIT tests were conducted on the test sample using two existing parabolic halogen lamps and the developed equivalent halogen array (HA) lamp set, and temperature uniformity was verified. To analyze the effect of surface temperature uniformity on the possibility of detecting defects, amplitude and phase data were determined and compared. In addition, the effect of non-uniformity in energy intensity occurring in the LIT experiment was improved by applying a temperature compensation technique. As a result, the effect on defect detectability through uniform heat source energy excitation and temperature compensation was presented quantitatively. Finally, improvements in defect detectability were presented through the evaluation of the signal-to-noise ratio and the defect shape of binarized images.
2. Theory
2.1. Environmental Influences on Temperature Measurement
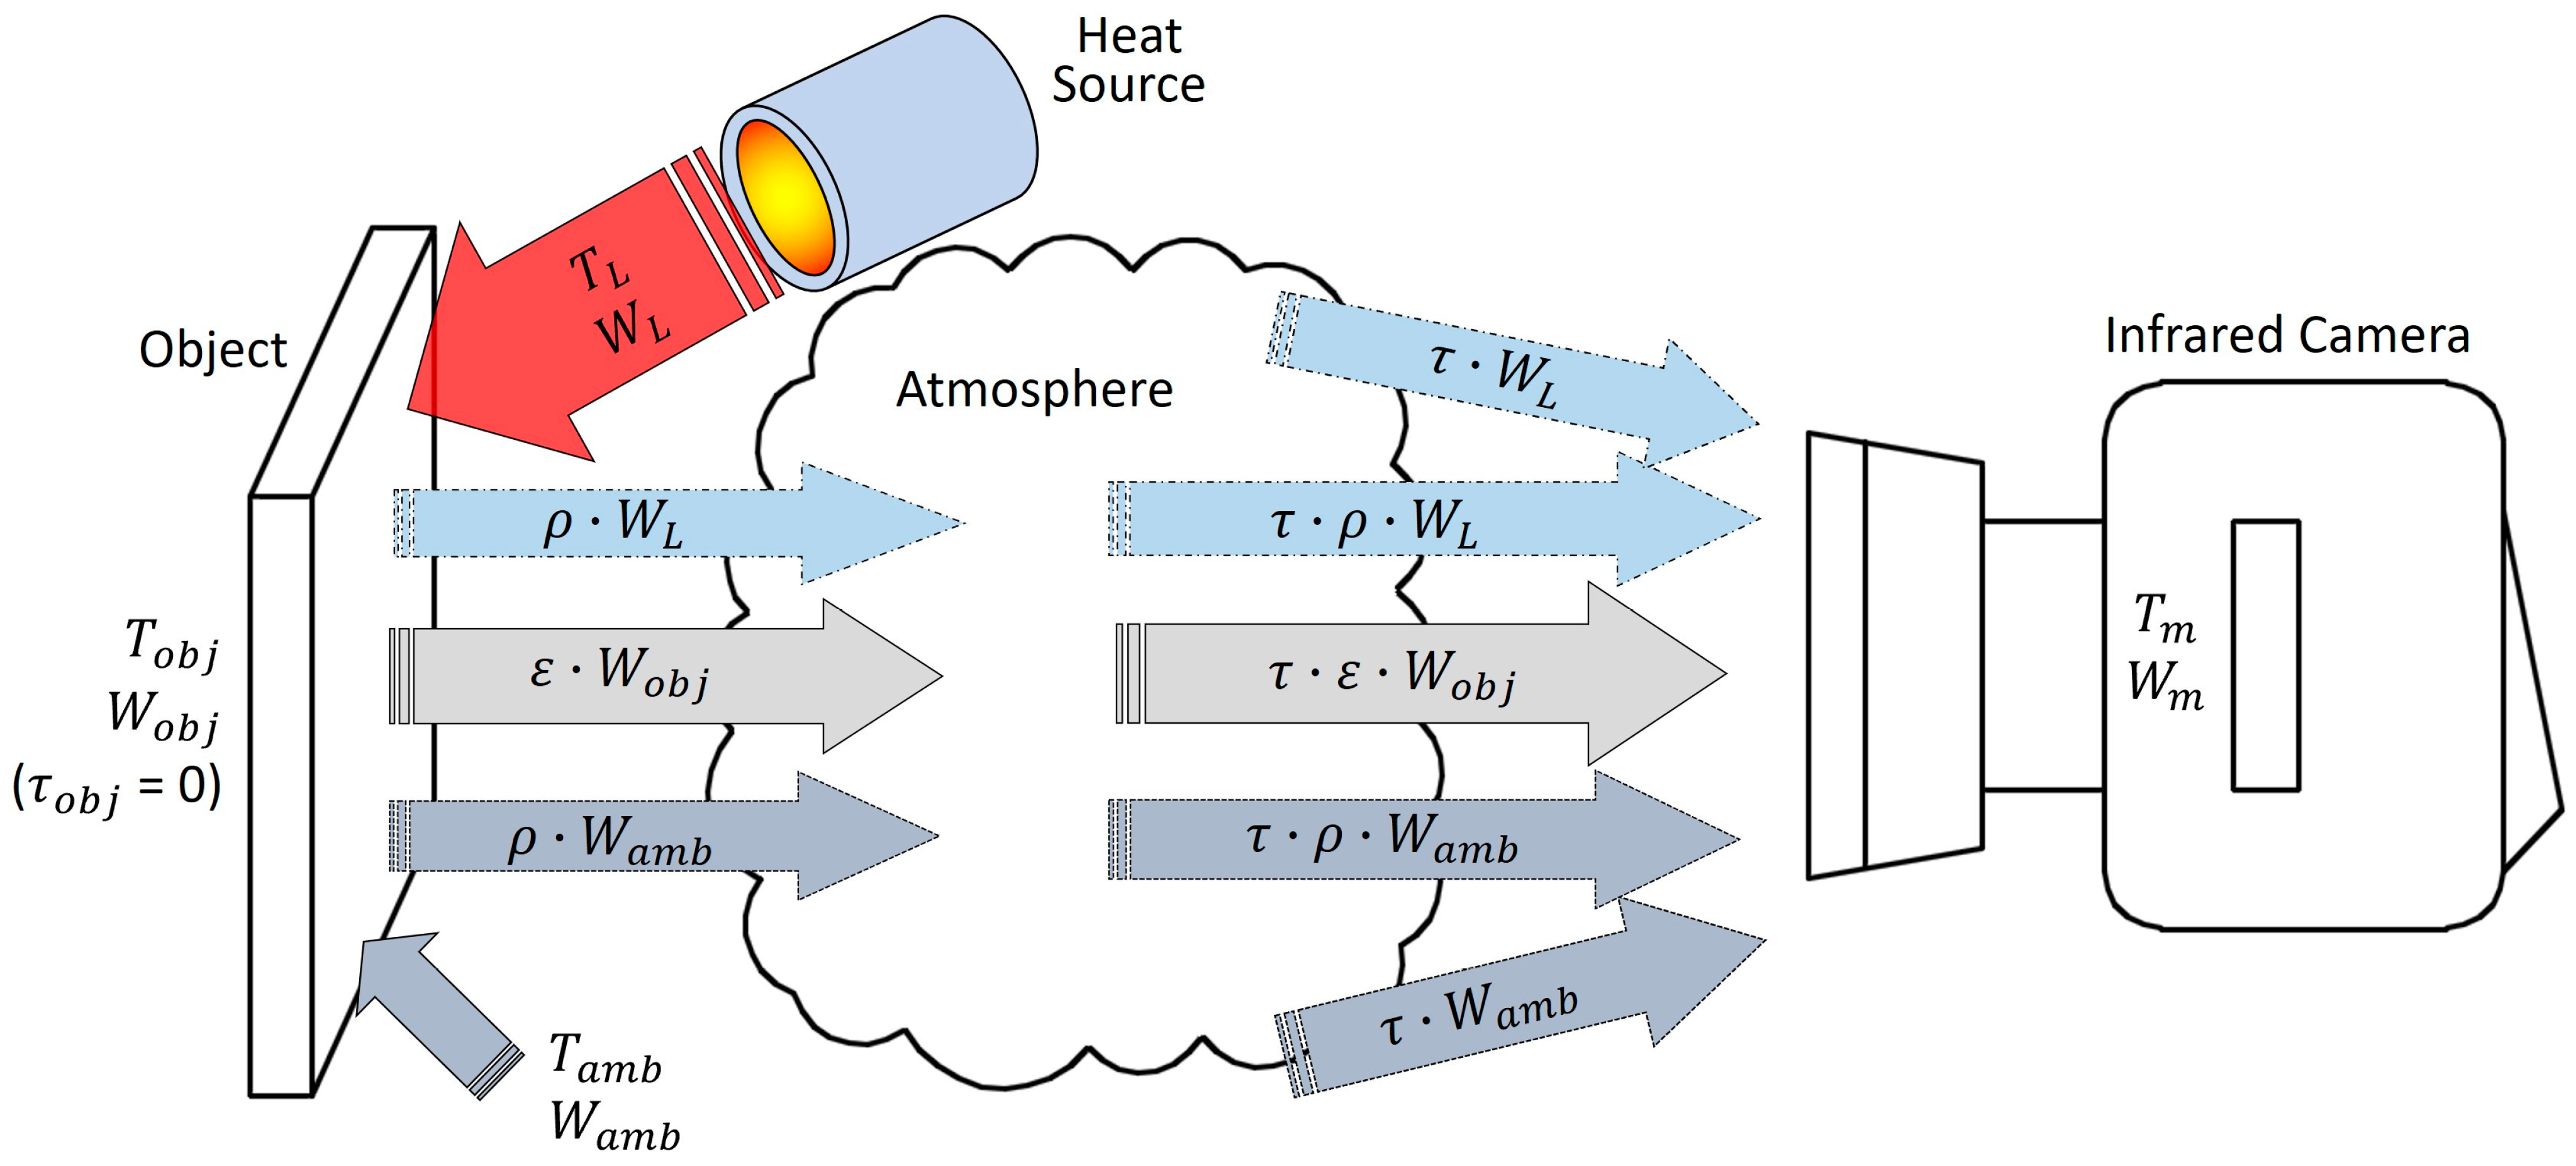
In temperature measurement and non-destructive testing using infrared thermography, the temperature measurement is affected due to radiation from the surrounding environment. This is influenced by emissivity and reflectance. In active thermography, which utilizes an inspection environment under daylight conditions or an external heat source, radiant energy is reflected from the surrounding environment on the surface or flows directly into the infrared (IR) camera. Additionally, measurement errors occur due to the effects of moisture, gases, and convective heat transfer contained in the atmosphere. Figure 1 shows the radiant energy incident on the IR camera due to external heat sources and the surrounding environment during LIT inspection and can be expressed as Equation (1) [4,12].
where is the energy detected by an infrared camera and is measured as the apparent temperature of . In addition, , , and correspond to the temperatures of , and , which are the inspection target, heat source, and surrounding radiant energy, respectively. and are the emissivity and reflectance of the inspection target, and represents the transmittance of the atmosphere. In order to accurately measure the radiant energy of the test object, it is necessary to minimize the influence of the atmosphere and surroundings.

Figure 1.
Principle of radiation emission from surrounding environment and heat source in thermographic testing.
2.2. Lock-In Thermography (LIT)
LIT is a technique that detects the thermal response of the surface after applying sinusoidal heating to the object. The LIT theory was first introduced by Giovanni Maria Carlomagno and Pier Giorgio Berardi in 1976 [24]. LIT determines amplitude and phase data from the detected infrared signal, and defect detection is performed. In addition, it effectively reduces the influence of heat load, object surface emissivity, and environmental factors. Heating by a periodic heat source follows the Fourier heat diffusion law, and heat diffusion through a solid can be expressed as Equation (2).
where T is the temperature and is the thermal diffusivity. If this heat source is modulated, a periodic heat flow is produced in the material. When excitation heating is modulated, a periodic heat flow is produced in the object. This periodic thermal wave within an object causes phase shift and amplitude attenuation and can be detected with an IR camera. The periodical heat transfer through the semi-infinite body resulting thermal wave can be expressed by Equation (3).
where A(z) is the thermal amplitude, is expressed as an angular frequency (), is the phase, is the time, T0 is an initial temperature change by incident thermal energy, is the defect depth, is expressed as the thermal wavelength, and is the thermal diffusion length. Thermal diffusion length is expressed by Equation (4).
From Equation (3), the phase shift () can be expressed as Equation (5), and it can be seen that it is related to the defect depth (z). By contrast, the amplitude () can be expressed by Equation (6), and it can be seen that it is related to the initial temperature (T0).
2.3. Four-Point Phase Shifting Method
In LIT, a modulated sinusoidal heat wave is generated on the sample surface by periodic heat waves. The four-point phase shift method is one of the techniques to evaluate the modulated thermal response generated on the sample surface and is widely used because the processing method is simple and fast. As shown in Figure 2, the phase () and amplitude (A) are defined by Equations (7) and (8) using four temperature data of the same distance, , , , and , in a complete cycle signal [25,26].
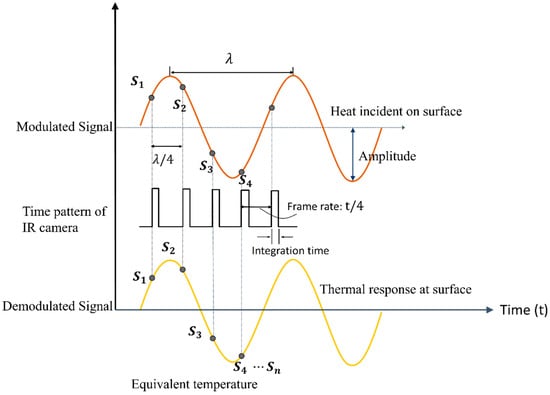
Figure 2.
The principle of the four-point phase shifting method for thermal waves demodulated on the object surface.
2.4. IR Data Non-Uniformity Compensation Method
Currently, most commercial IR cameras use a focal plane array (FPA)-type detector. Typically, a 2D resolution of 640 × 480 pixels is used, and each pixel detects infrared rays at the corresponding location, converts the temperature, and displays it on the image. FPA size and resolution significantly impact the performance and image quality of the IR camera, but various non-uniformity correction (NUC) problems occur due to non-uniformity in the detector arrangement and detection performance. In the case of non-destructive testing that considers thermal maps, the global correction provided by the manufacturer may have limitations, and the development and application of a correction procedure that additionally induces spatial correlation between pixels is effective [27,28]. In general, additional equipment can be minimized through non-uniformity correction. The average image of the acquired images is considered a method of generating a uniform image by applying offset correction derived through an algorithm based on the acquired image.
The non-uniformity correction of the IR camera can be expressed as Equation (9), in which the gain () and offset () correction of each pixel are considered in the and pixel position output values () of the detector.
The halogen lamp applied to the LIT test radiates an uneven heat load due to the location and distance of the light source, irradiation direction, shape of the reflecting surface, and uneven output inside the bulb. Differences in thermal response occur on the surface of the inspection object to which this thermal load is irradiated, causing contrast in measured values in thermography images. In addition, when a light source such as sunlight or a halogen lamp is reflected on the surface and enters the camera lens, it leaves a strong thermal effect on the IR image and can affect the evaluation of thermographic testing and indication.
In this study, absolute temperature compensation (ATC) sheet and temperature ratio compensation (TRC) sheet compensation sheets were considered to improve the accuracy and efficiency of LIT inspection. The compensation sheet adjusts other pixel temperature values equally based on a specific pixel temperature value for the frame-unit IR image acquired throughout the LIT process.
The ATC reconstructs the difference in temperature values of other pixels in the form of a matrix based on the temperature value of a specific pixel in each frame and is defined as Equation (10).
The TRC reconstructs the temperature ratio of other pixels in a matrix form based on the temperature value of a specific pixel in each frame and is defined as Equation (11).
where is the temperature value matrix data of the nth IR image, is the temperature value of the reference pixel in each IR image, and and are the ATC and the RTC of the same matrix size as the IR image. The calculated compensation sheet is applied to all IR images acquired from thermographic testing and is expressed in Equations (12) and (13).
3. Methods
3.1. Reference and Test Sample
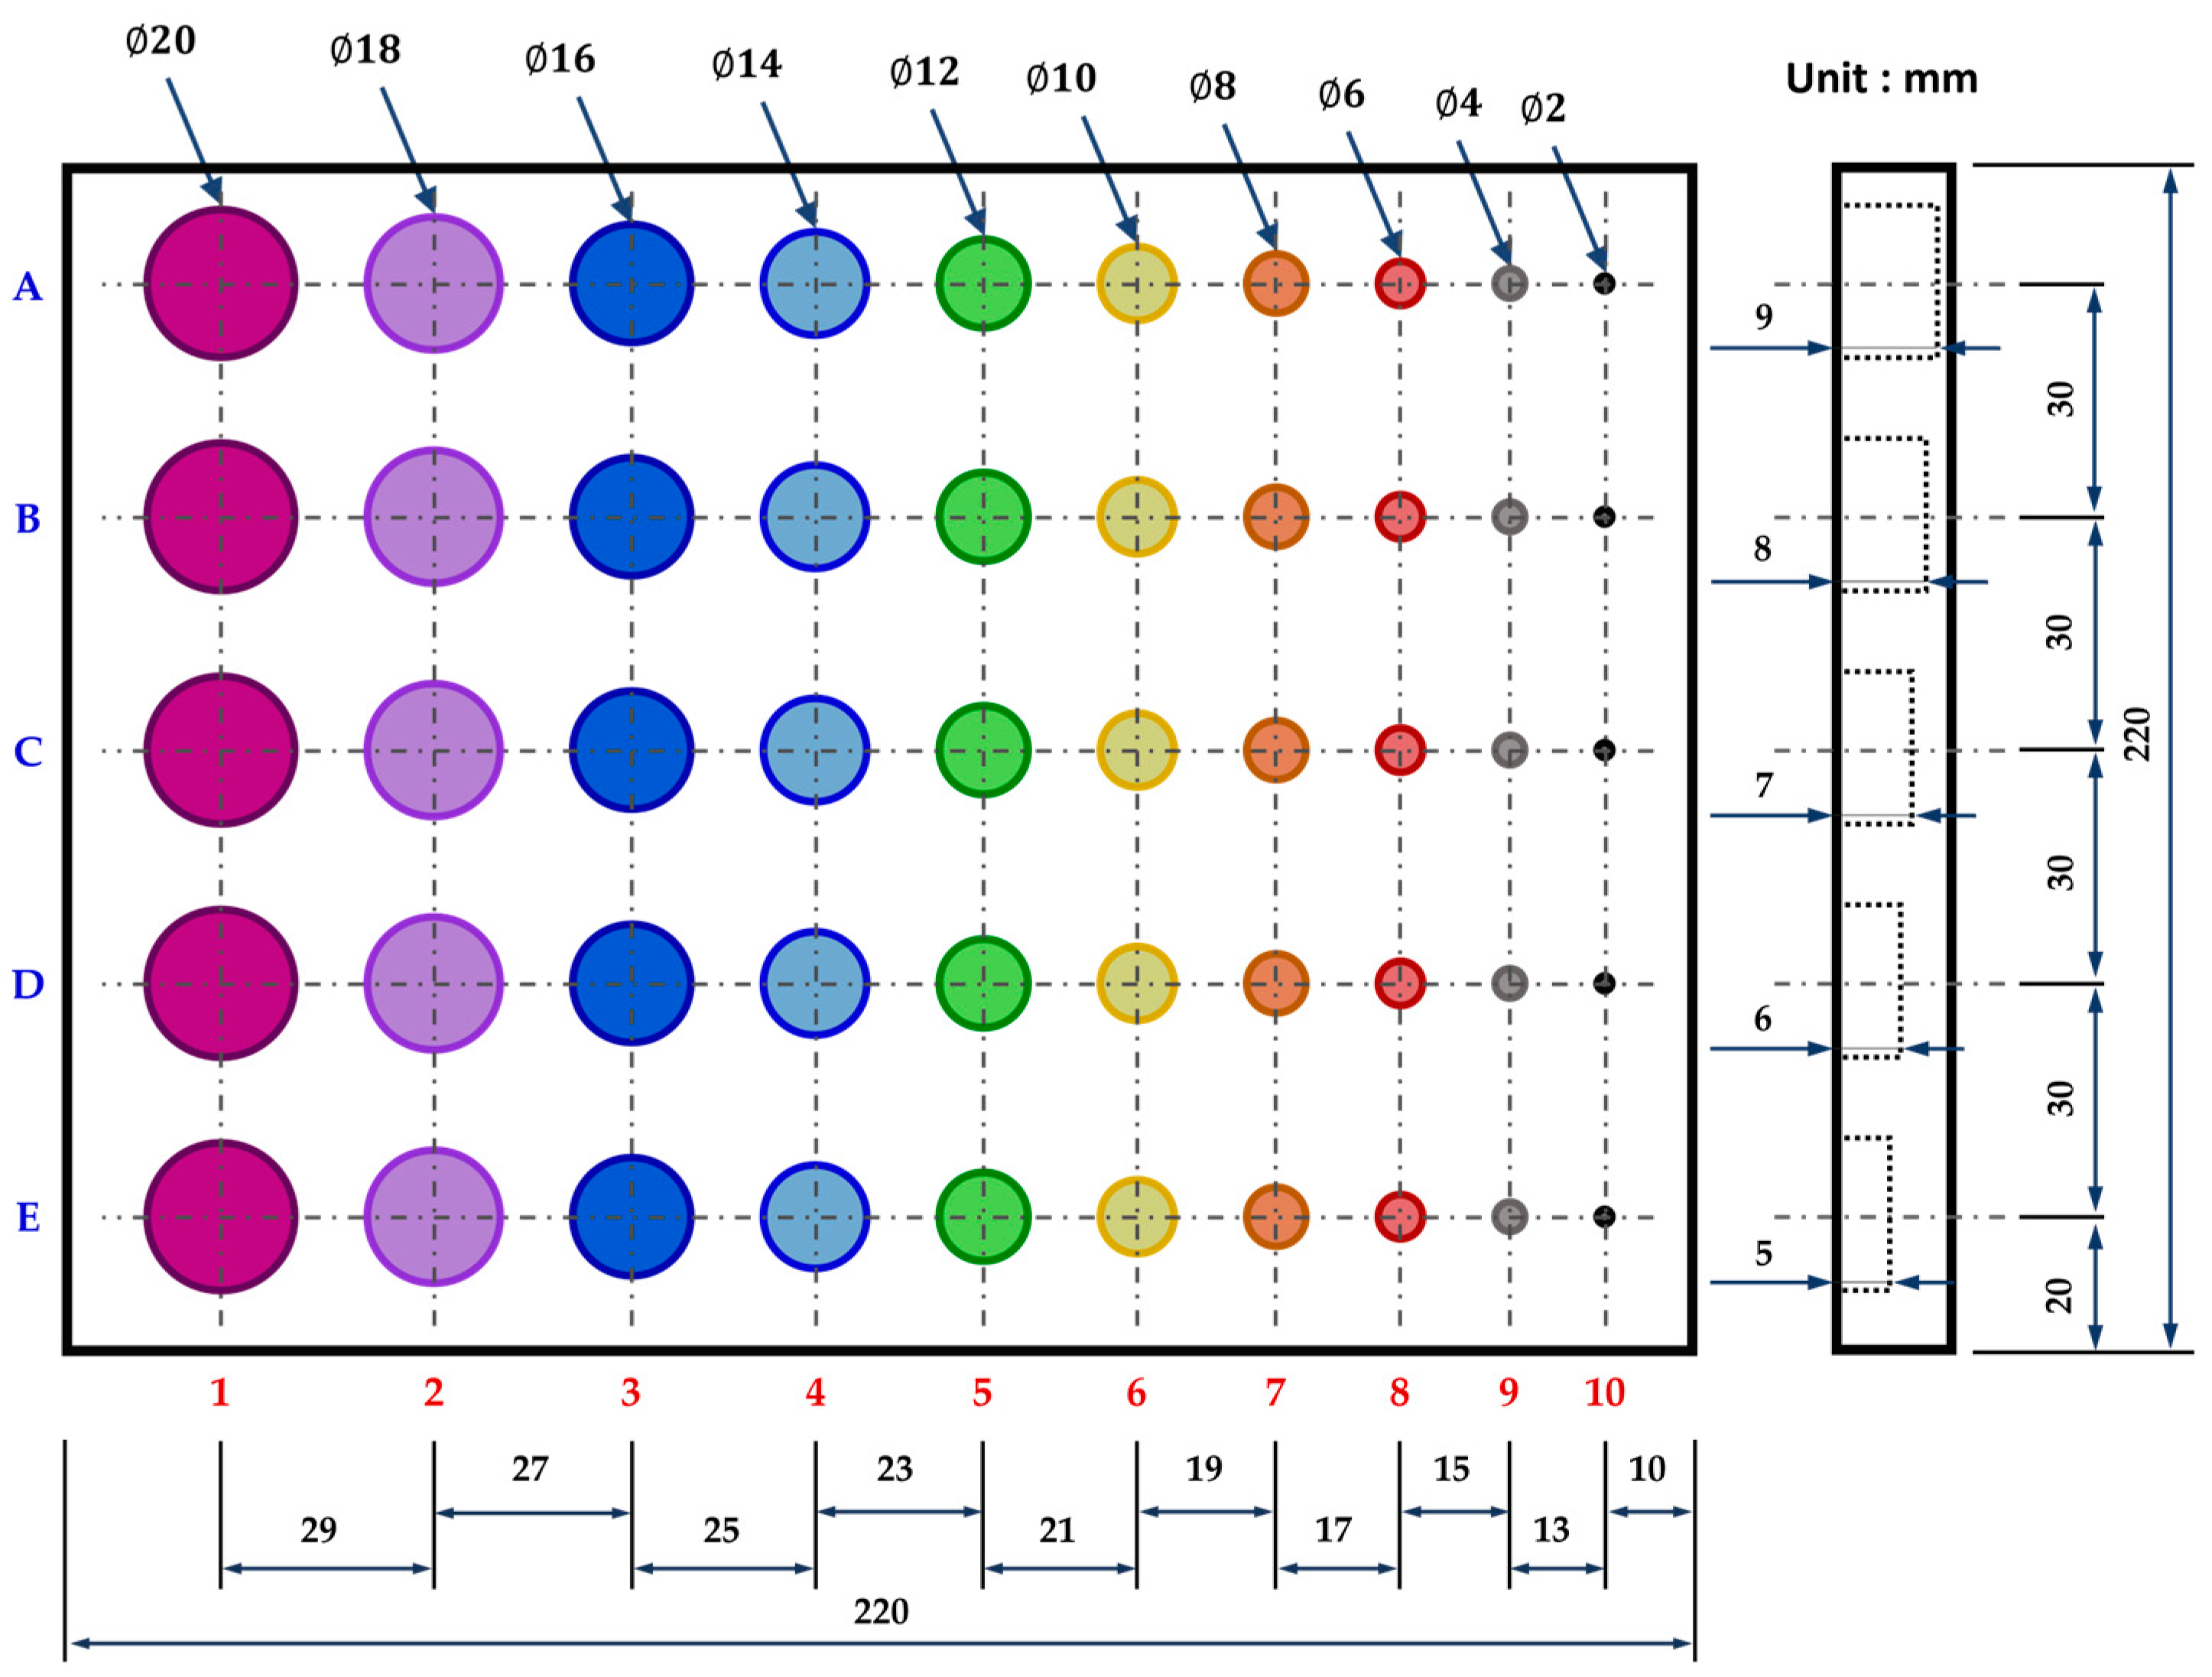
In this study, a reference sample and test a sample with artificial defects were applied. Each PEEK sample was processed by purchasing commercially available materials. The reference sample was the same size and thickness as the test sample and had no defects. The test sample applied in this study was a 10 mm thick square plate sample made of PEEK material. Figure 3 shows the geometric details of the subsurface defect sample. The PEEK test sample size was 220 × 220 mm, and an artificial defect was simulated on the back side. The diameter of the designed defects ranged from 2 mm in diameter to 20 mm in 2 mm intervals, and the defect depth ranged from 5 mm to 9 mm in 1 mm intervals. Each row (A to E) of the test sample had the same defect depth, and each column (1 to 10) had the same defect size. Many defect conditions were simulated in this study because when reviewing the types of actual defect examples, defects with various sizes and different depths occur. Therefore, the purpose was to precisely analyze the level of defect detectability when applying thermal imaging non-destructive testing to PEEK material. Table 1 shows thermomechanical properties of the PEEK material utilized in this study.

Figure 3.
Geometric information of PEEK test sample.

Table 1.
Thermomechanical properties of PEEK materials.
3.2. Experimental Set-Up
In this study, for LIT testing, the LIT device was configured as shown in Figure 4. In general, the LIT system consists of an IR camera for sensing infrared rays emitted from the surface of an object and an optical device that is an external heat source. Additionally, the optical device is controlled by a signal generator and power amplifier to generate heat waves and provide a heat source and the entire LIT system is controlled, and data are acquired by a control PC.
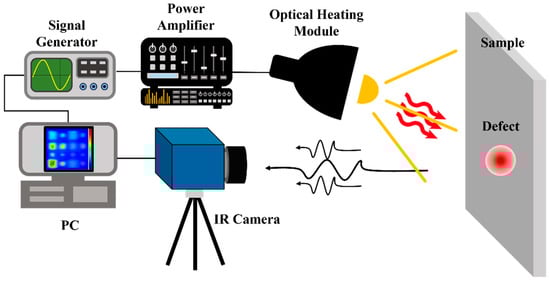
Figure 4.
The experimental configuration for LIT testing with reflection mode.
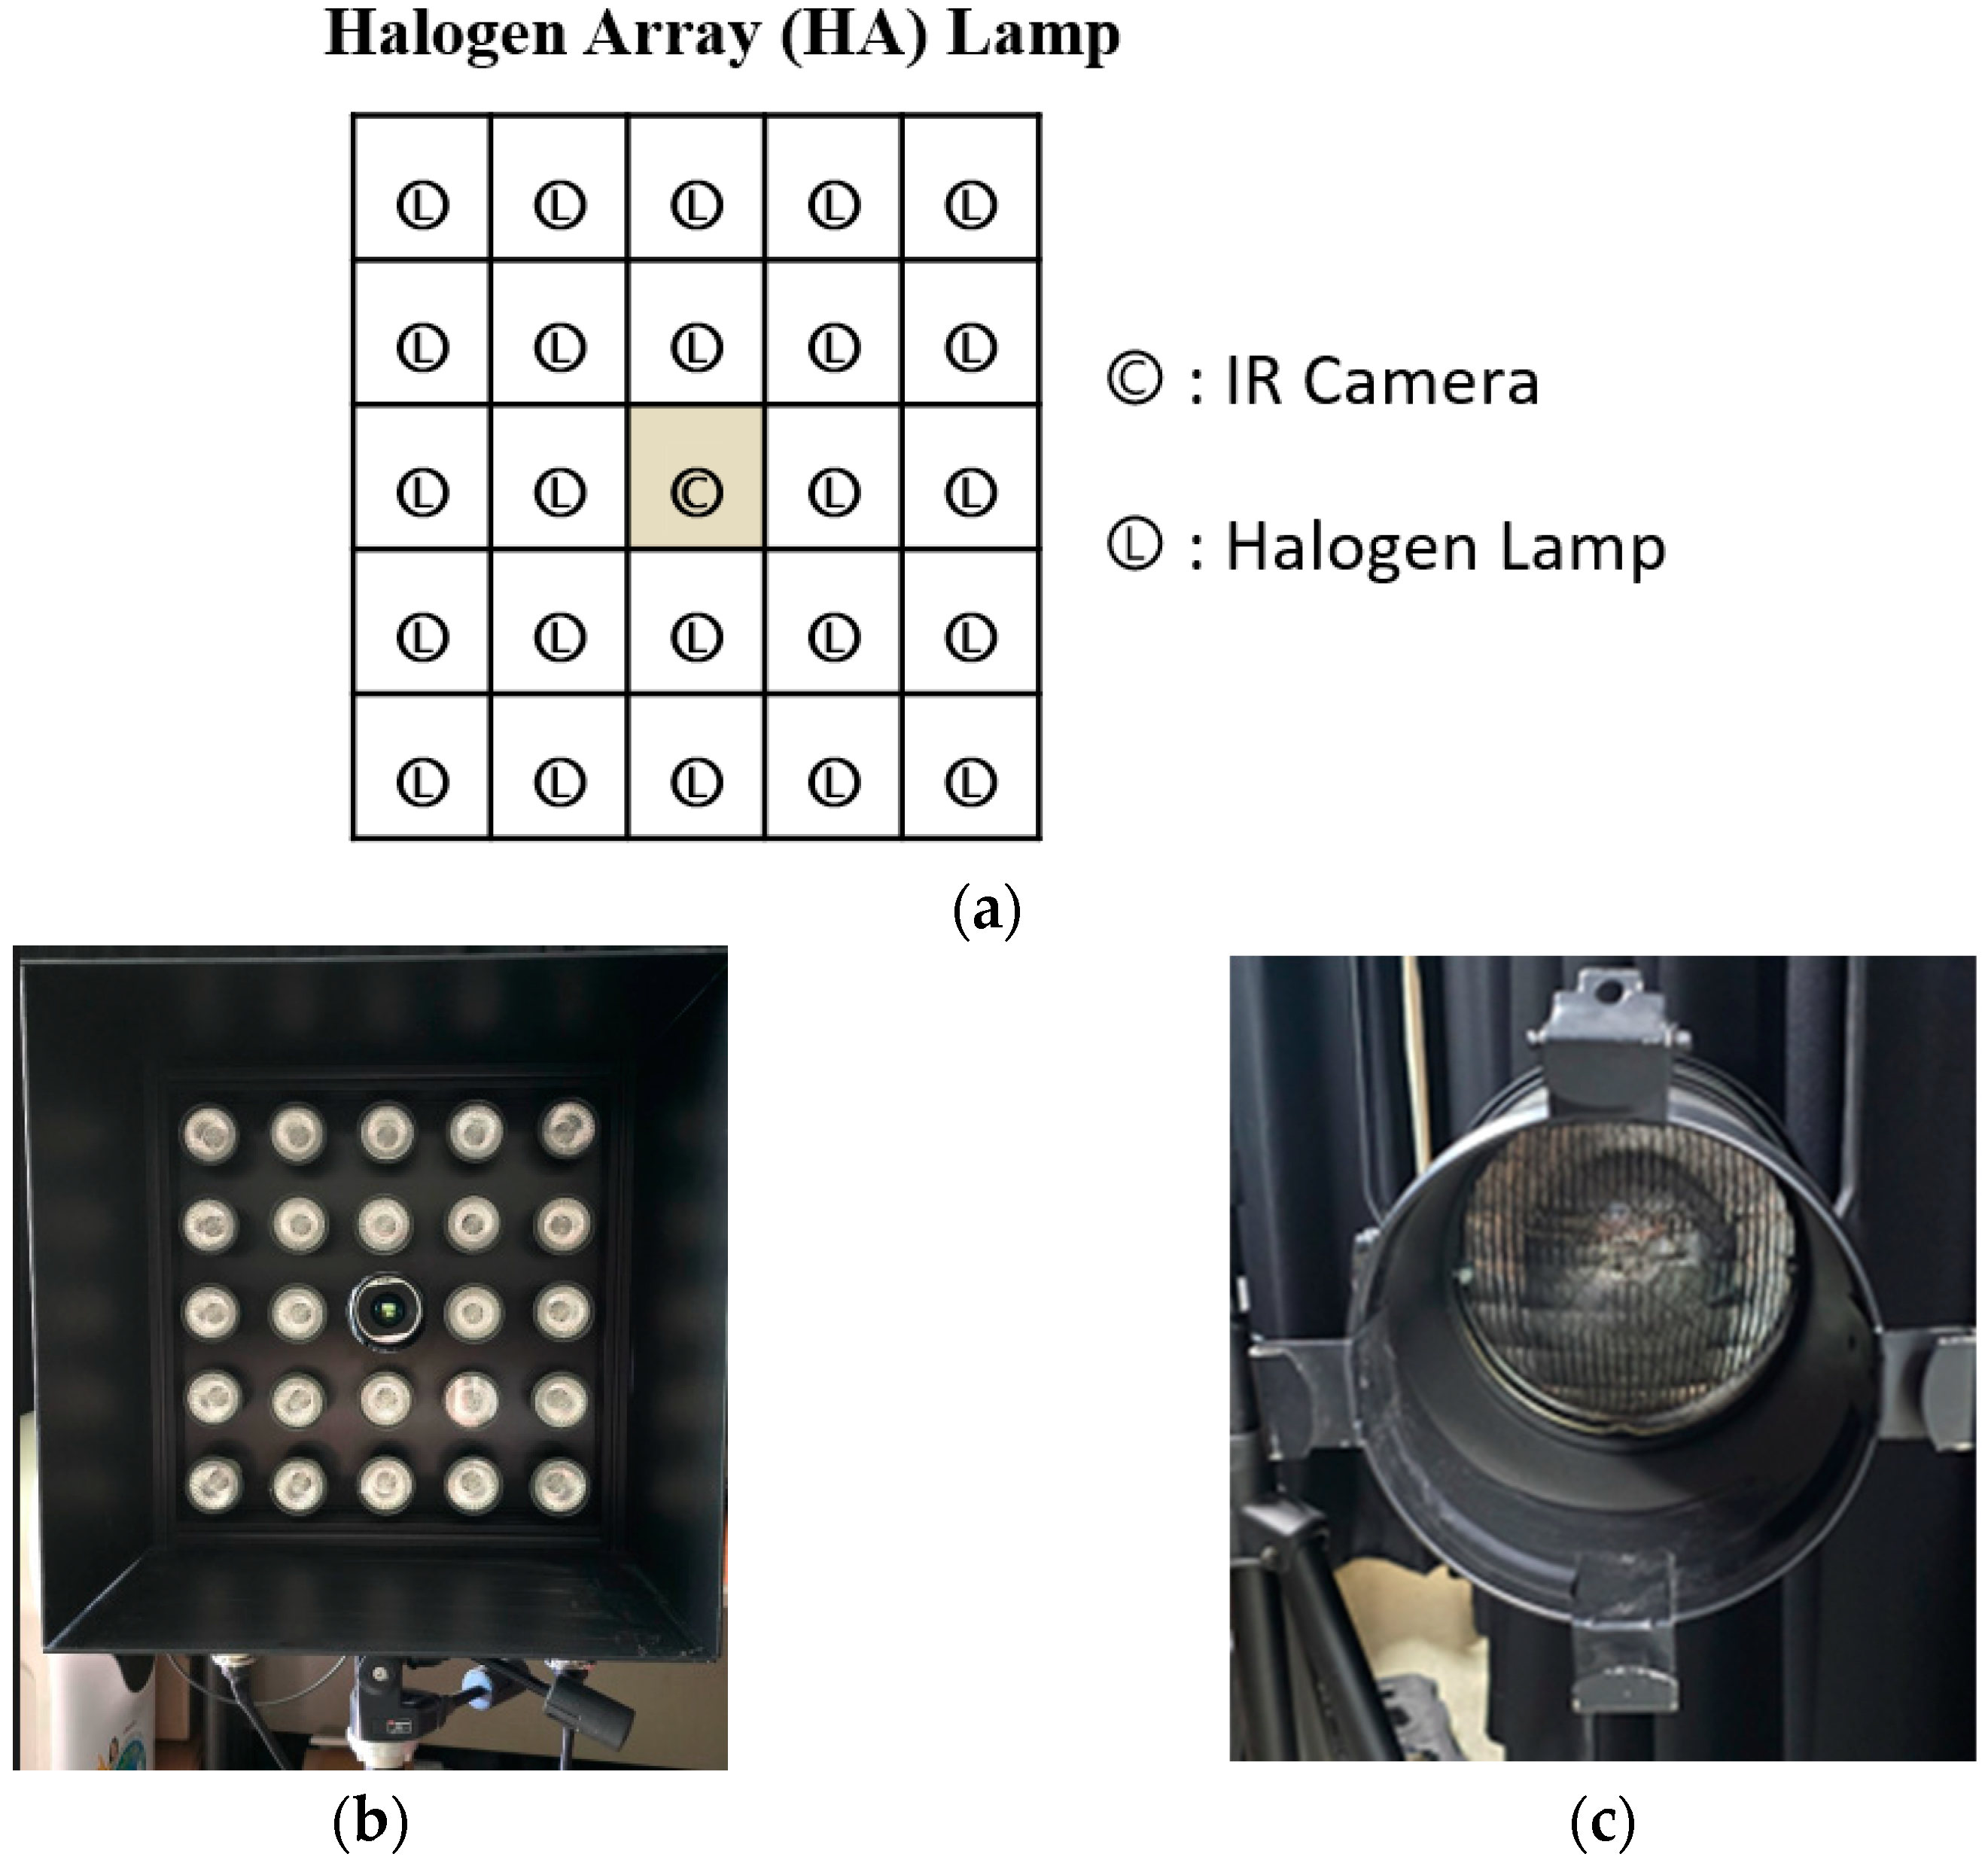
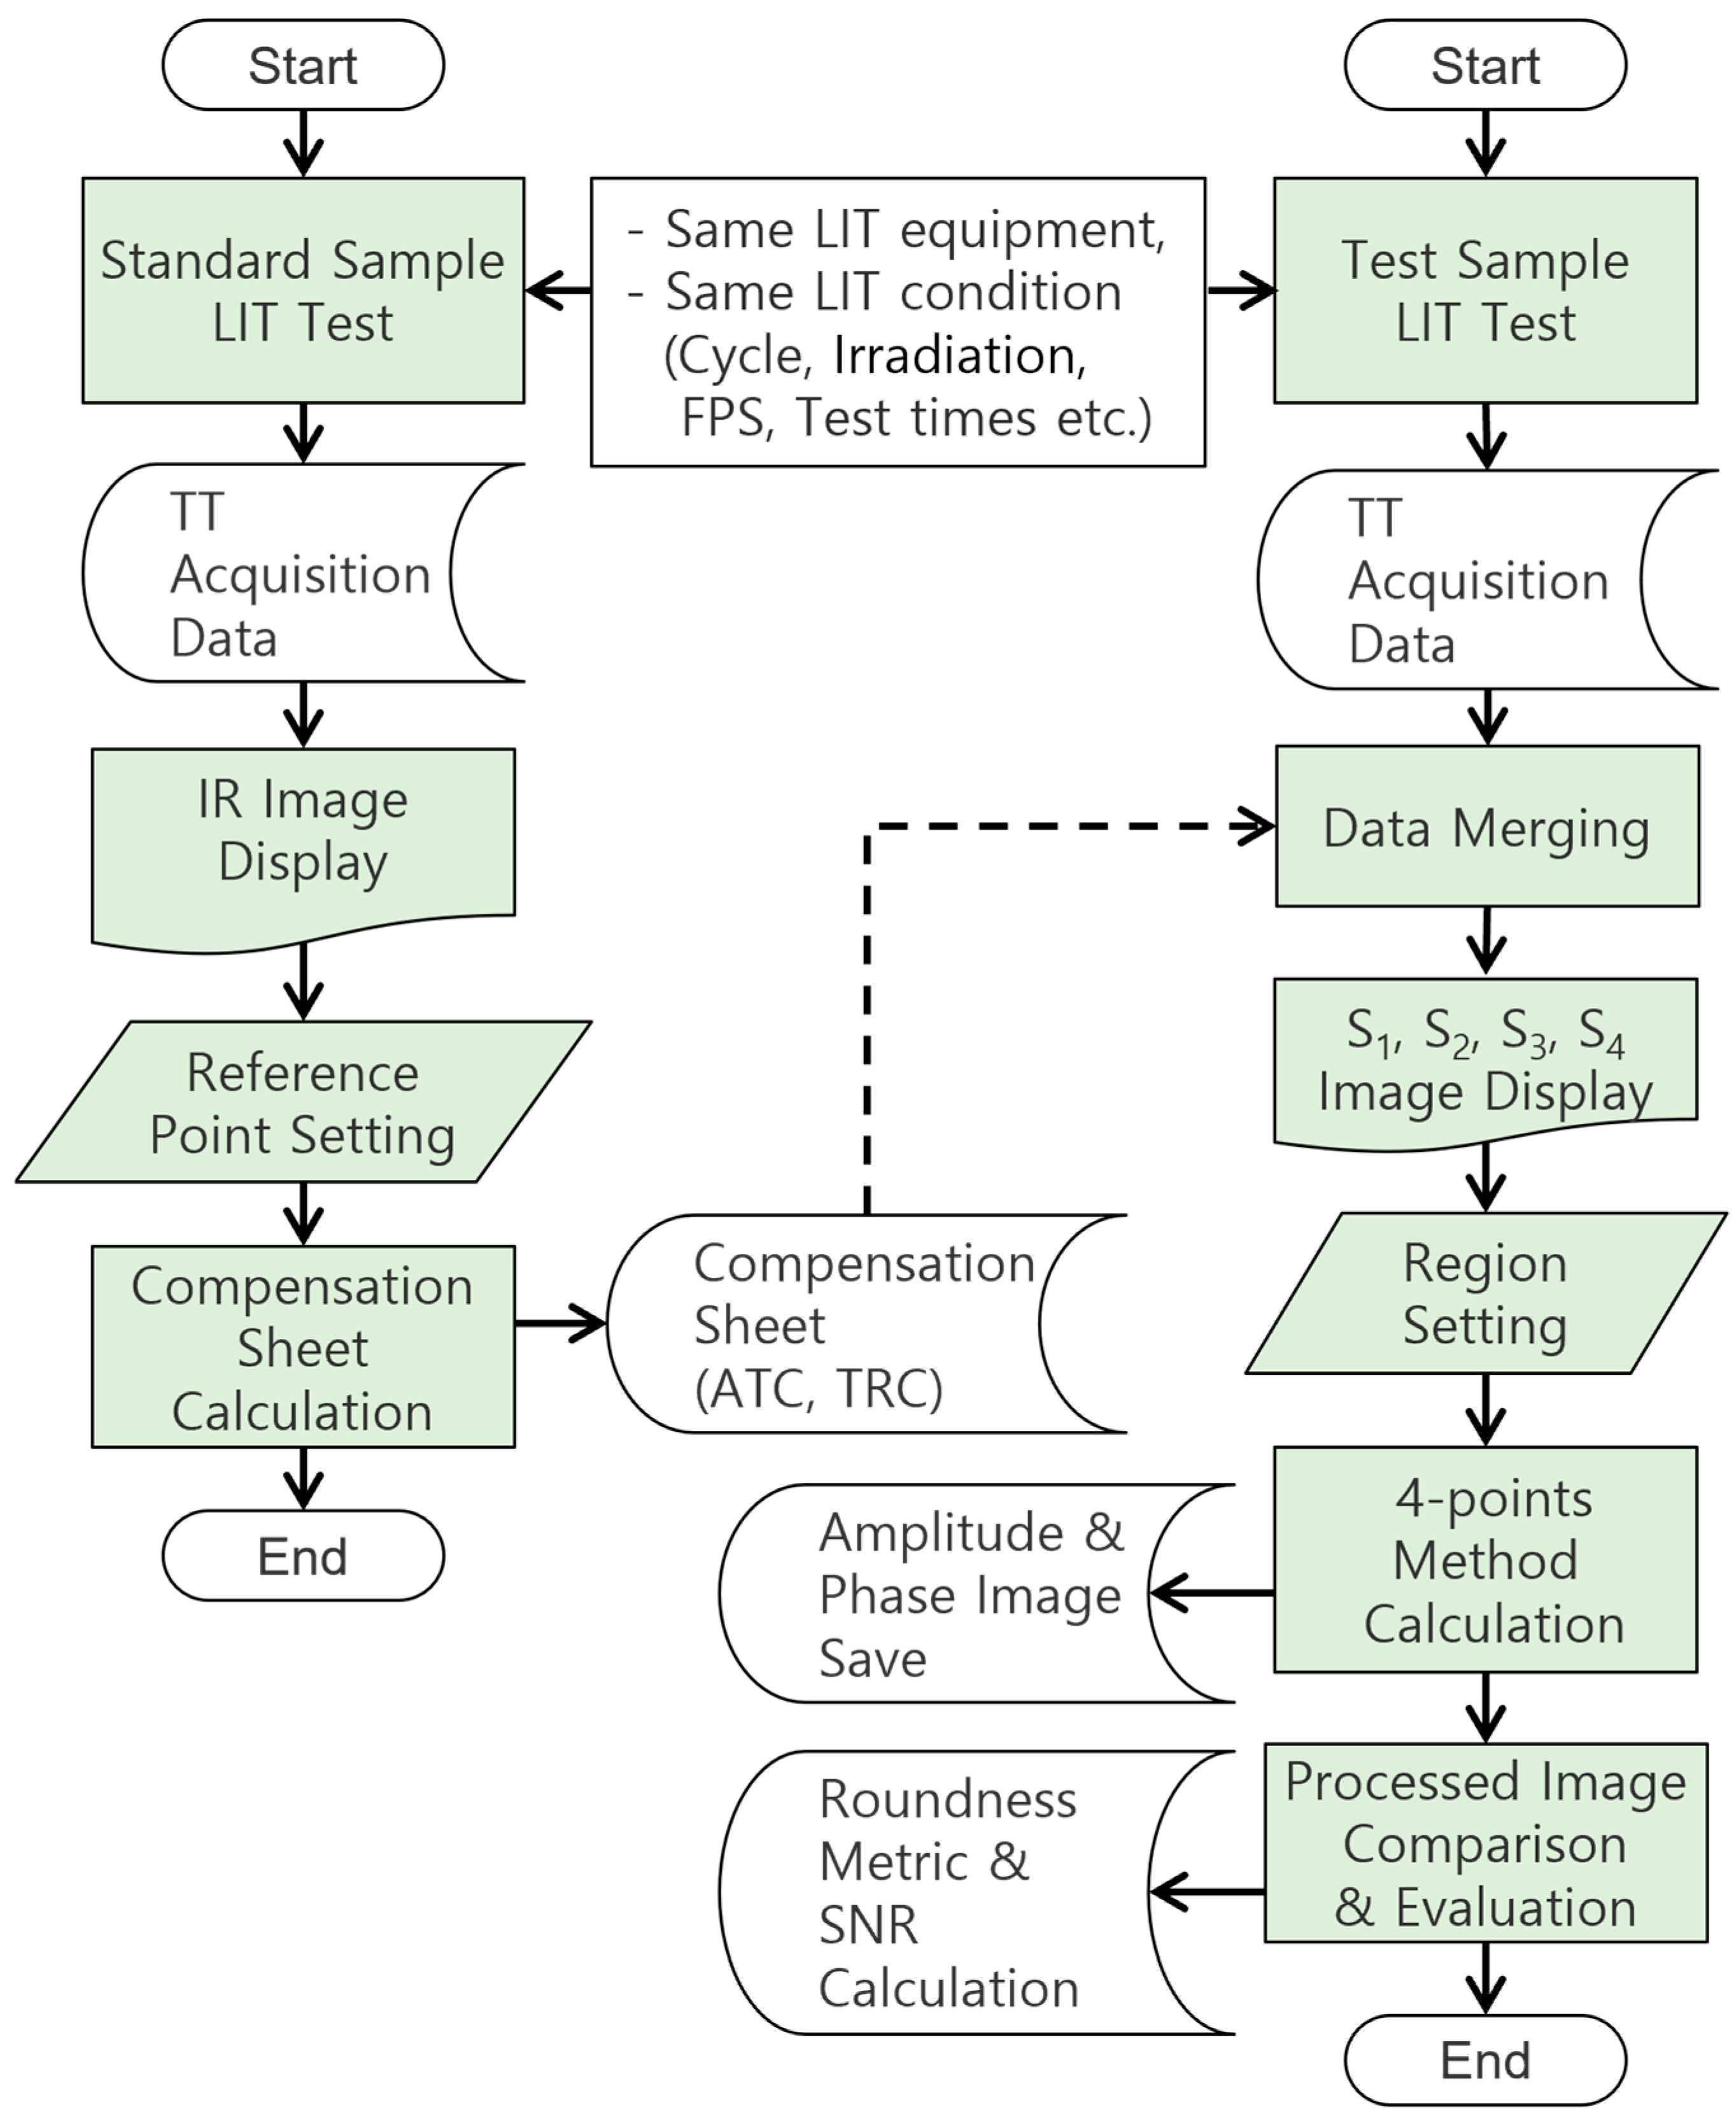
The IR camera used was the FLIR SC655 model (FLIR Systems, Inc., Wilsonville, OR, USA). The FLIR SC655 has a 640 × 480 pixel resolution and a long-wave infrared range of 7.5 to 14 μm. Two types of halogen lamp systems were used as optical devices for external heat source excitation. Figure 5 shows the details of the HA lamp and parabolic halogen lamp. One applied two parabolic halogen lamps (1 kW, H. A. L. M. GmbH, Munich, Germany), currently most commonly used in LIT testing. The other was manufacturing and applying an HA lamp system to provide a uniform heat source. The HA lamp consisted of twenty-four 50 W halogen lamps (1.2 kW, Munich, Germany) arranged in a 5 × 5 arrangement, and an IR camera was installed in the center. The size of the HA lamp set was 400 × 400 mm, and black guide walls were applied to the four external sides to prevent the inflow of external light. The distance between the IR camera and the sample surface was set to 0.5 m. In addition, the distance between the halogen lamps and the sample surface was set to 0.5 m when the HA lamp was applied and 1 m in the case of the parabolic halogen lamp so that the entire light source could cover the specimen surface. In general, the thermal contrast between defective area and sound area was maximized with a sufficient heat source at low frequencies, so the modulation frequency for the LIT experiment was set to 0.01 Hz. IR raw data were acquired by an IR camera at 30 frames per second, and data processing and analysis were performed through MATLAB 2023a coding. Figure 6 shows the process flow, including creating and applying a compensation sheet using a reference sample, acquiring thermal images of the test sample, and applying the compensation sheet to the data, and the LIT analysis process.
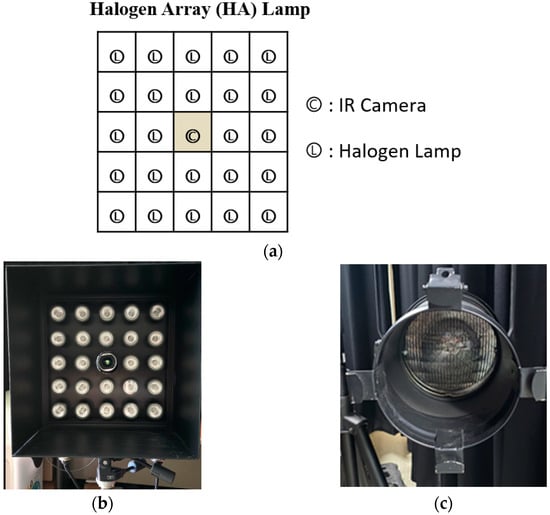
Figure 5.
Information on HA lamp and parabolic lamp: (a) geometric details of HA lamp, (b) HA lamp picture, and (c) conventional parabolic lamp picture.
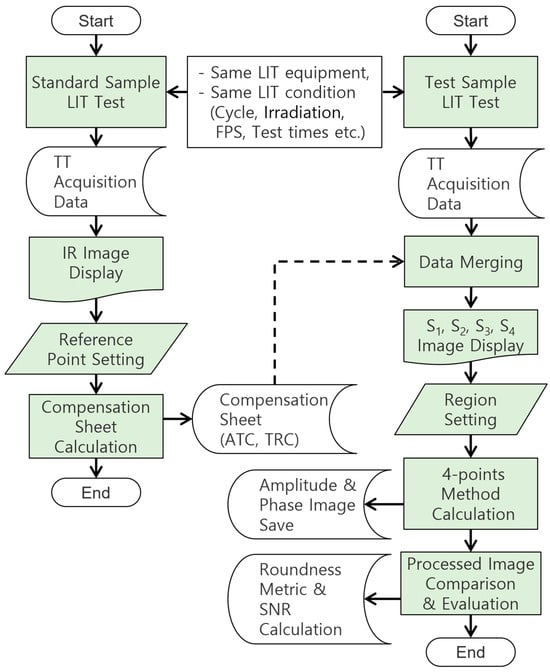
Figure 6.
The LIT testing and analysis flow chart of study.
4. Results and Discussion
4.1. Temperature Distribution at Raw IR Image
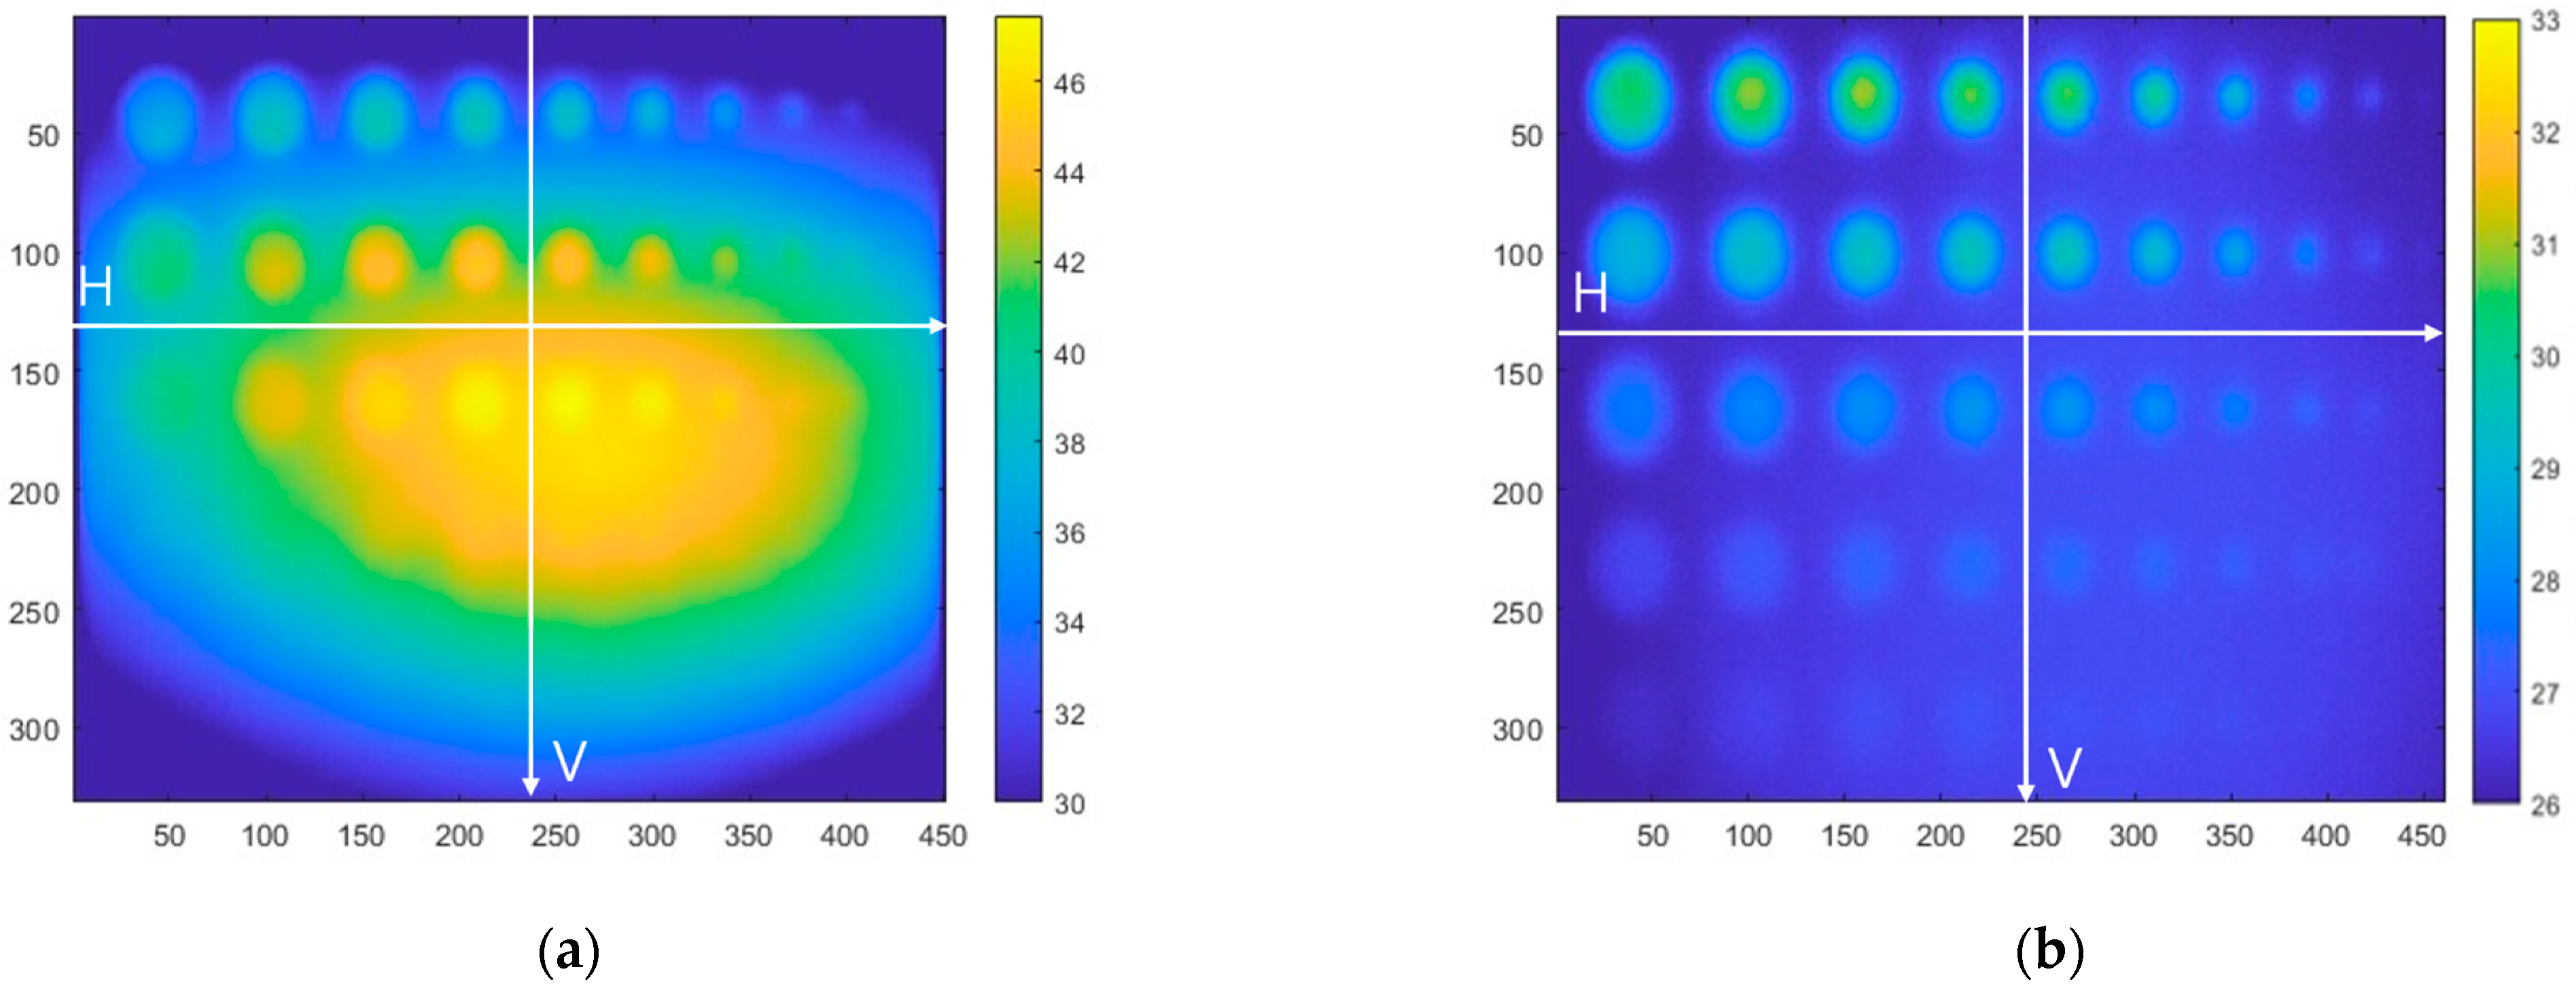
Figure 7 shows the IR image of the existing parabolic halogen lamp and HA lamp. The evaluation point was selected at 50 s when lamp heating ends at a modulation frequency of 0.01 Hz to evaluate temperature uniformity according to heat excitation. In this study, data were acquired along the vertical and horizontal profiles of the sound area close to the center of the specimen, as shown in Figure 7.
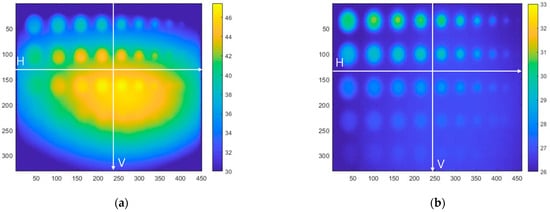
Figure 7.
IR Images at 50 s of modulation frequency 0.01 Hz along each lamp type: (a) parabolic type, (b) HA type.
Figure 8 shows temperature change () trends acquired along vertical and horizontal profiles. In the case of existing parabolic halogen lamps, it can be seen that the intensity of the light source tends to decrease significantly as the distance from the center of the sample increases. On the other hand, it can be seen that the produced HA lamp shows an overall stable trend. The raw data temperature deviation was 16.42 °C (52.57%) for the parabolic lamp and 1.17 °C (15.54%) for the HA lamp. Accordingly, it can be seen that applying the HA lamp provided a more uniform heat source to the surface of the object.
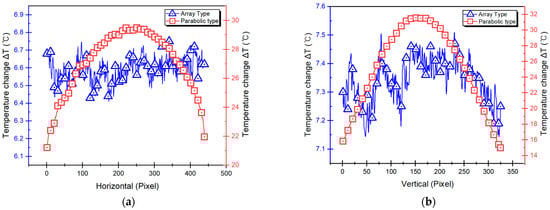
Figure 8.
Sample surface temperature distribution according to lamp type: (a) horizontal direction, (b) vertical direction.
4.2. Data Contrast Enhacnement in Temperature, Amplitude, and Phase Image
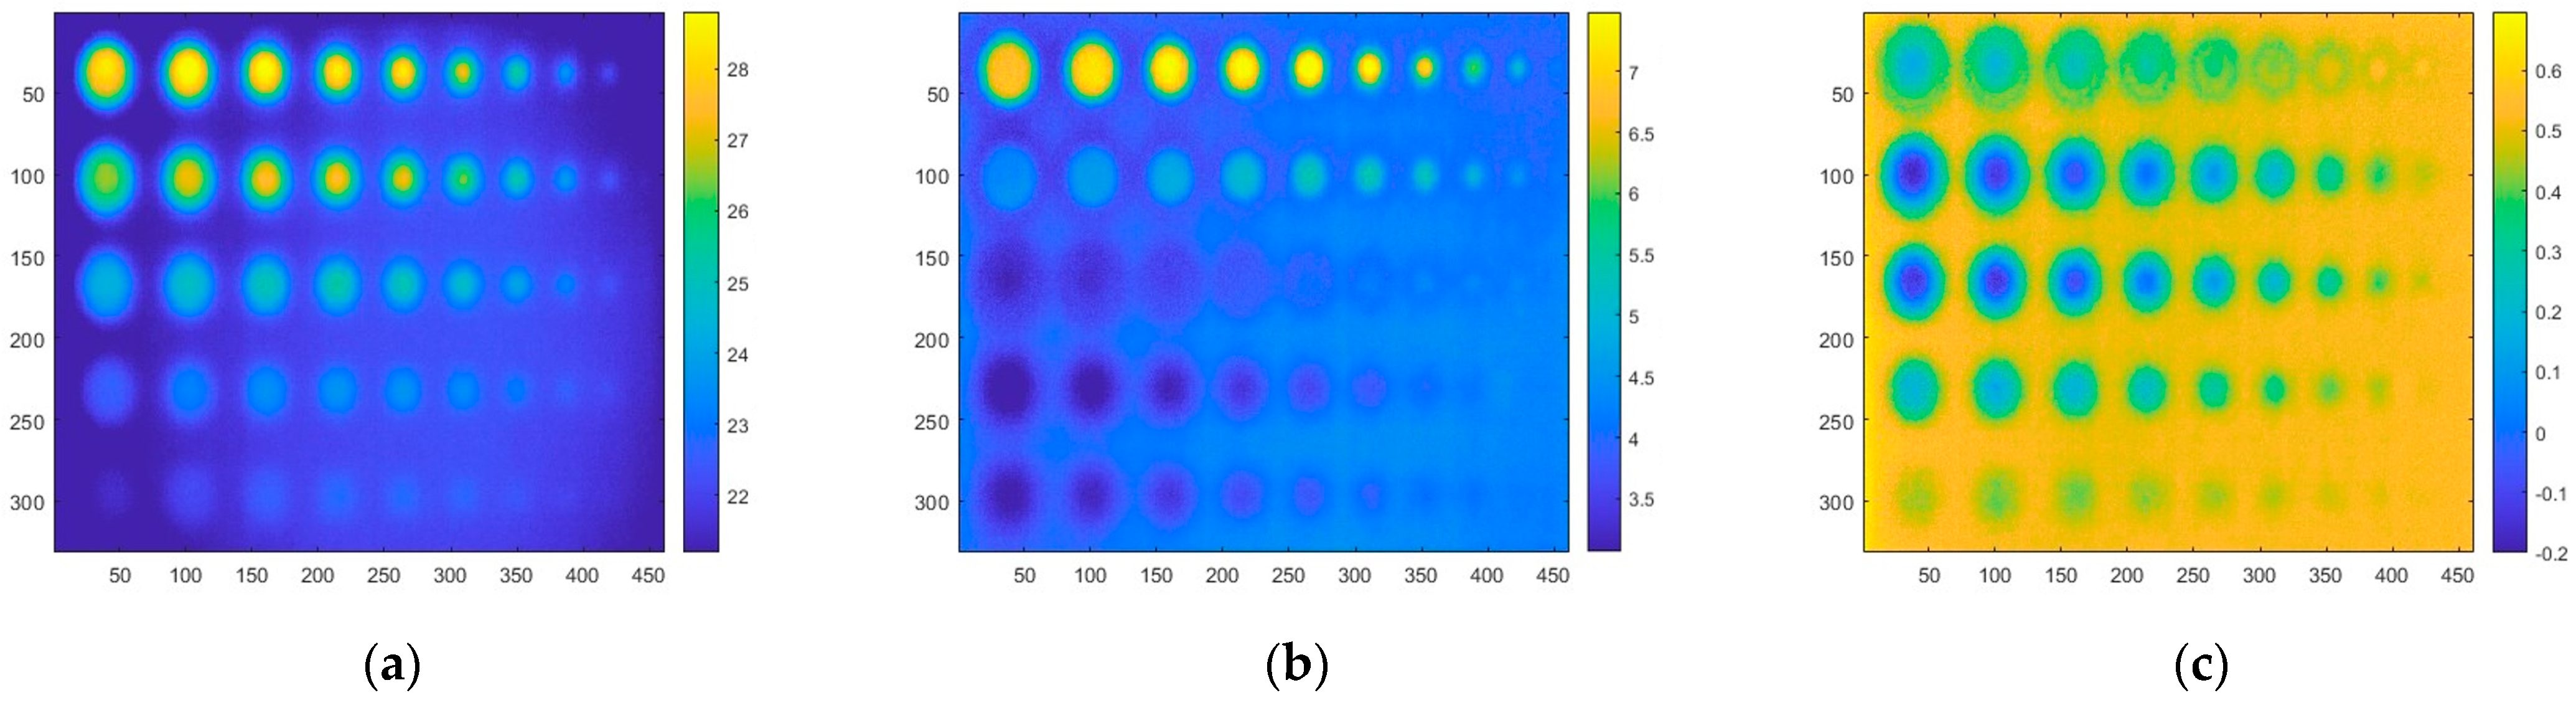
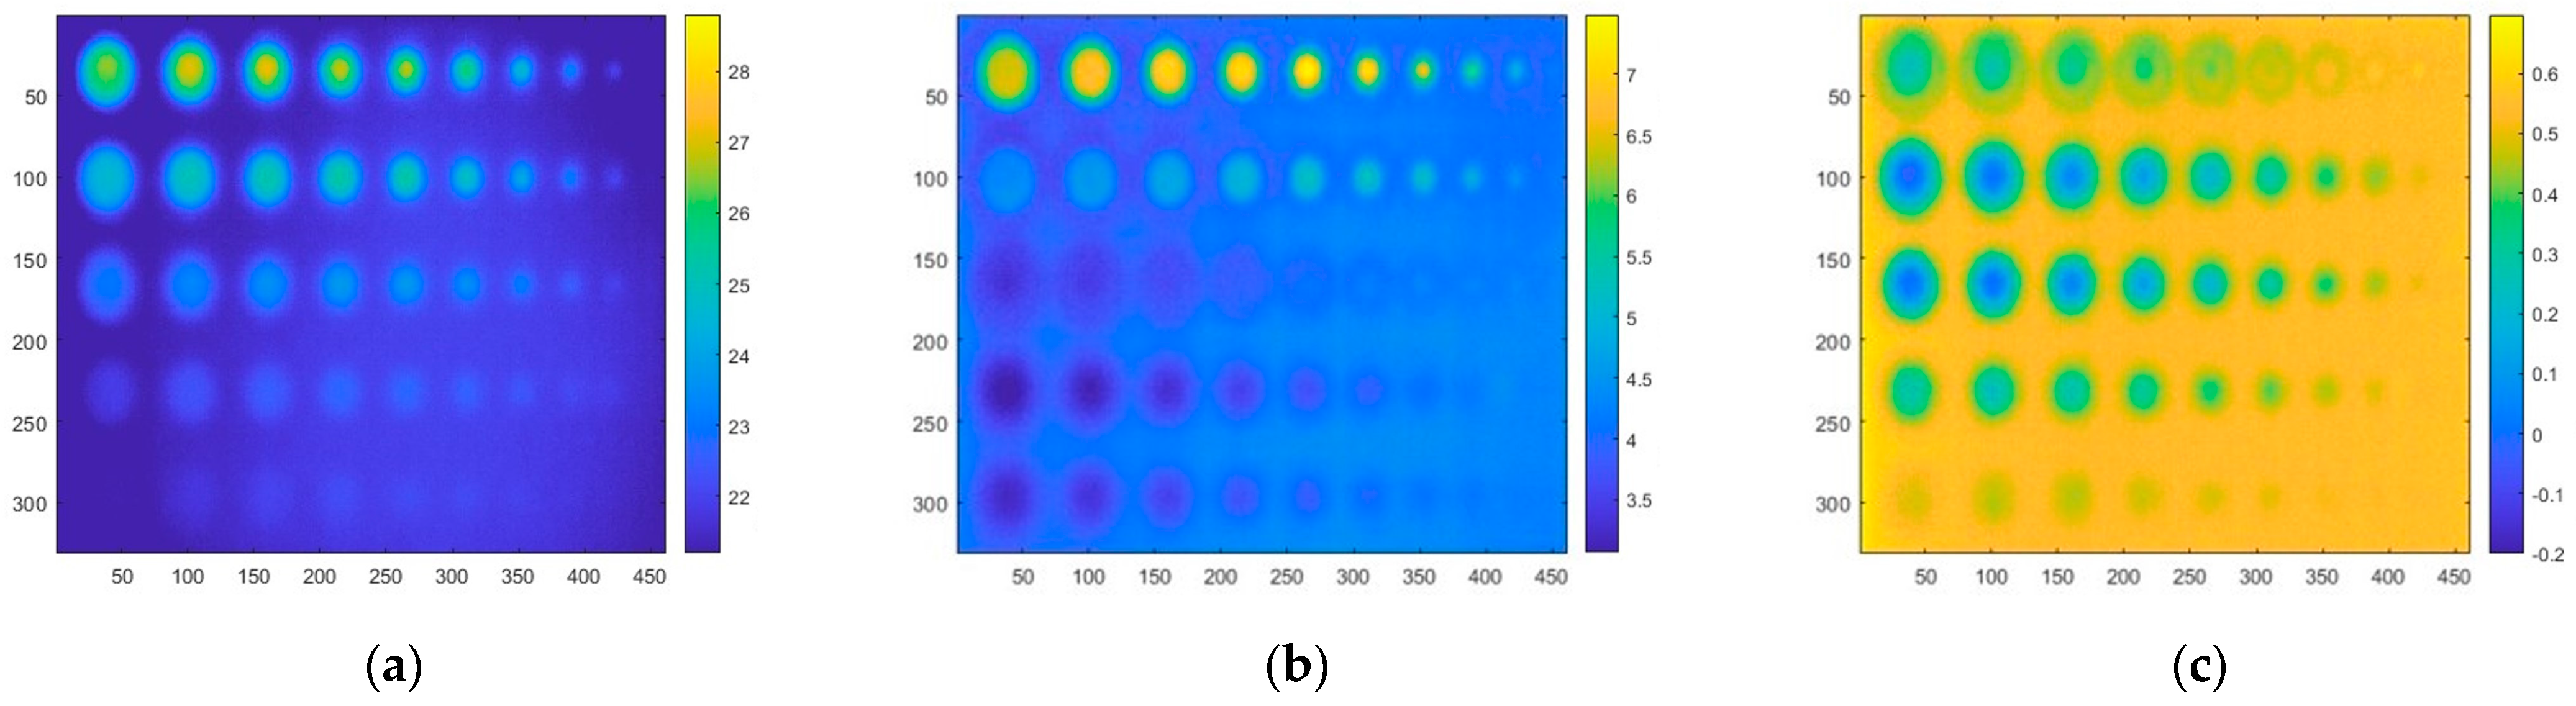
Figure 9 shows the temperature, amplitude, and phase images of LIT without compensation techniques applied. Figure 10 shows LIT’s temperature, amplitude, and phase images applying the ATC compensation technique. Figure 11 shows LIT’s temperature, amplitude, and phase images applying the TRC compensation technique. As shown in Figure 9, Figure 10 and Figure 11, it can be seen that the ATC technique qualitatively improves the contrast compared to the results without the compensation technique applied. As contrast improved in both temperature, amplitude, and phase images, more defects were detected in the images. In particular, in the case of phase images, row C defects (defect depth of 6 mm) and row D defects (defect depth of 7 mm) were detected, qualitatively improving the detection possibility. Unlike ATC, which compensates for the temperature difference, TRC is a method that compensates for the temperature difference as a ratio, so it is thought that the compensation can be applied by expanding or reducing the ratio when the temperature difference between the reference sample and the test sample is large.
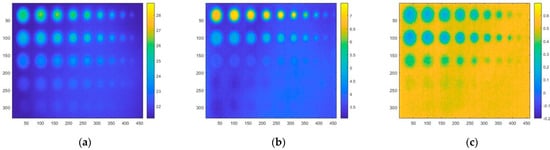
Figure 9.
Images along the data type at modulation frequency 0.01 Hz: (a) raw (temperature), (b) amplitude, and (c) phase.
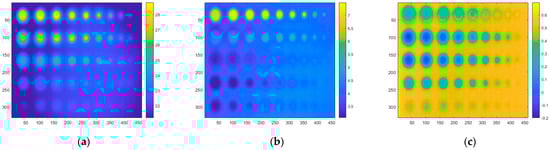
Figure 10.
Images along the data type at modulation frequency 0.01 Hz with the ATC compensation method applied: (a) raw (temperature), (b) amplitude, and (c) phase.

Figure 11.
Images along the data type at modulation frequency 0.01 Hz with the TRC compensation method applied: (a) raw (temperature), (b) amplitude, and (c) phase.
Table 2 shows the contrast values applied to each compensation technique in raw, phase, and amplitude images according to the lamp type. To analyze the improvement effect compared to contrast, data were acquired along the vertical and horizontal profiles in the sound area close to the specimen center, as shown in Figure 7. Standard deviation can compare the degree of data scattering around the average value and can be expressed in the same units as the raw data.
Table 2.
The contrast according to the lamp type and compensation method.
It can be seen that the temperature standard deviation is significantly lower when the equivalent array lamp type is applied. When applying ATC, the standard deviation was found to decrease in all cases, and in the case of TRC, it decreased in most cases, but the improvement effect was insignificant. By applying the compensation sheet using the reference sample, the contrast of the thermal image was confirmed to be improved to a maximum of 54%, close to 1/2, and the effect of ATC was overall better than that of irregular TRC. TRC is a method of compensating for the temperature difference by ratio. When the temperature difference between the reference sample and the test sample is large, compensation is expanded by the ratio. In addition, as the contrast of raw data is improved by the compensation technique, the overall contrast of the phase and amplitude is also improved, and it can be seen that the improvement rate in the horizontal direction is better than the vertical direction. This is believed to be because the resolution of the IR camera is 640 × 480 pixels, a rectangle that is longer in the horizontal direction than in the vertical direction.
4.3. Defect Detectabiliy Enhancement
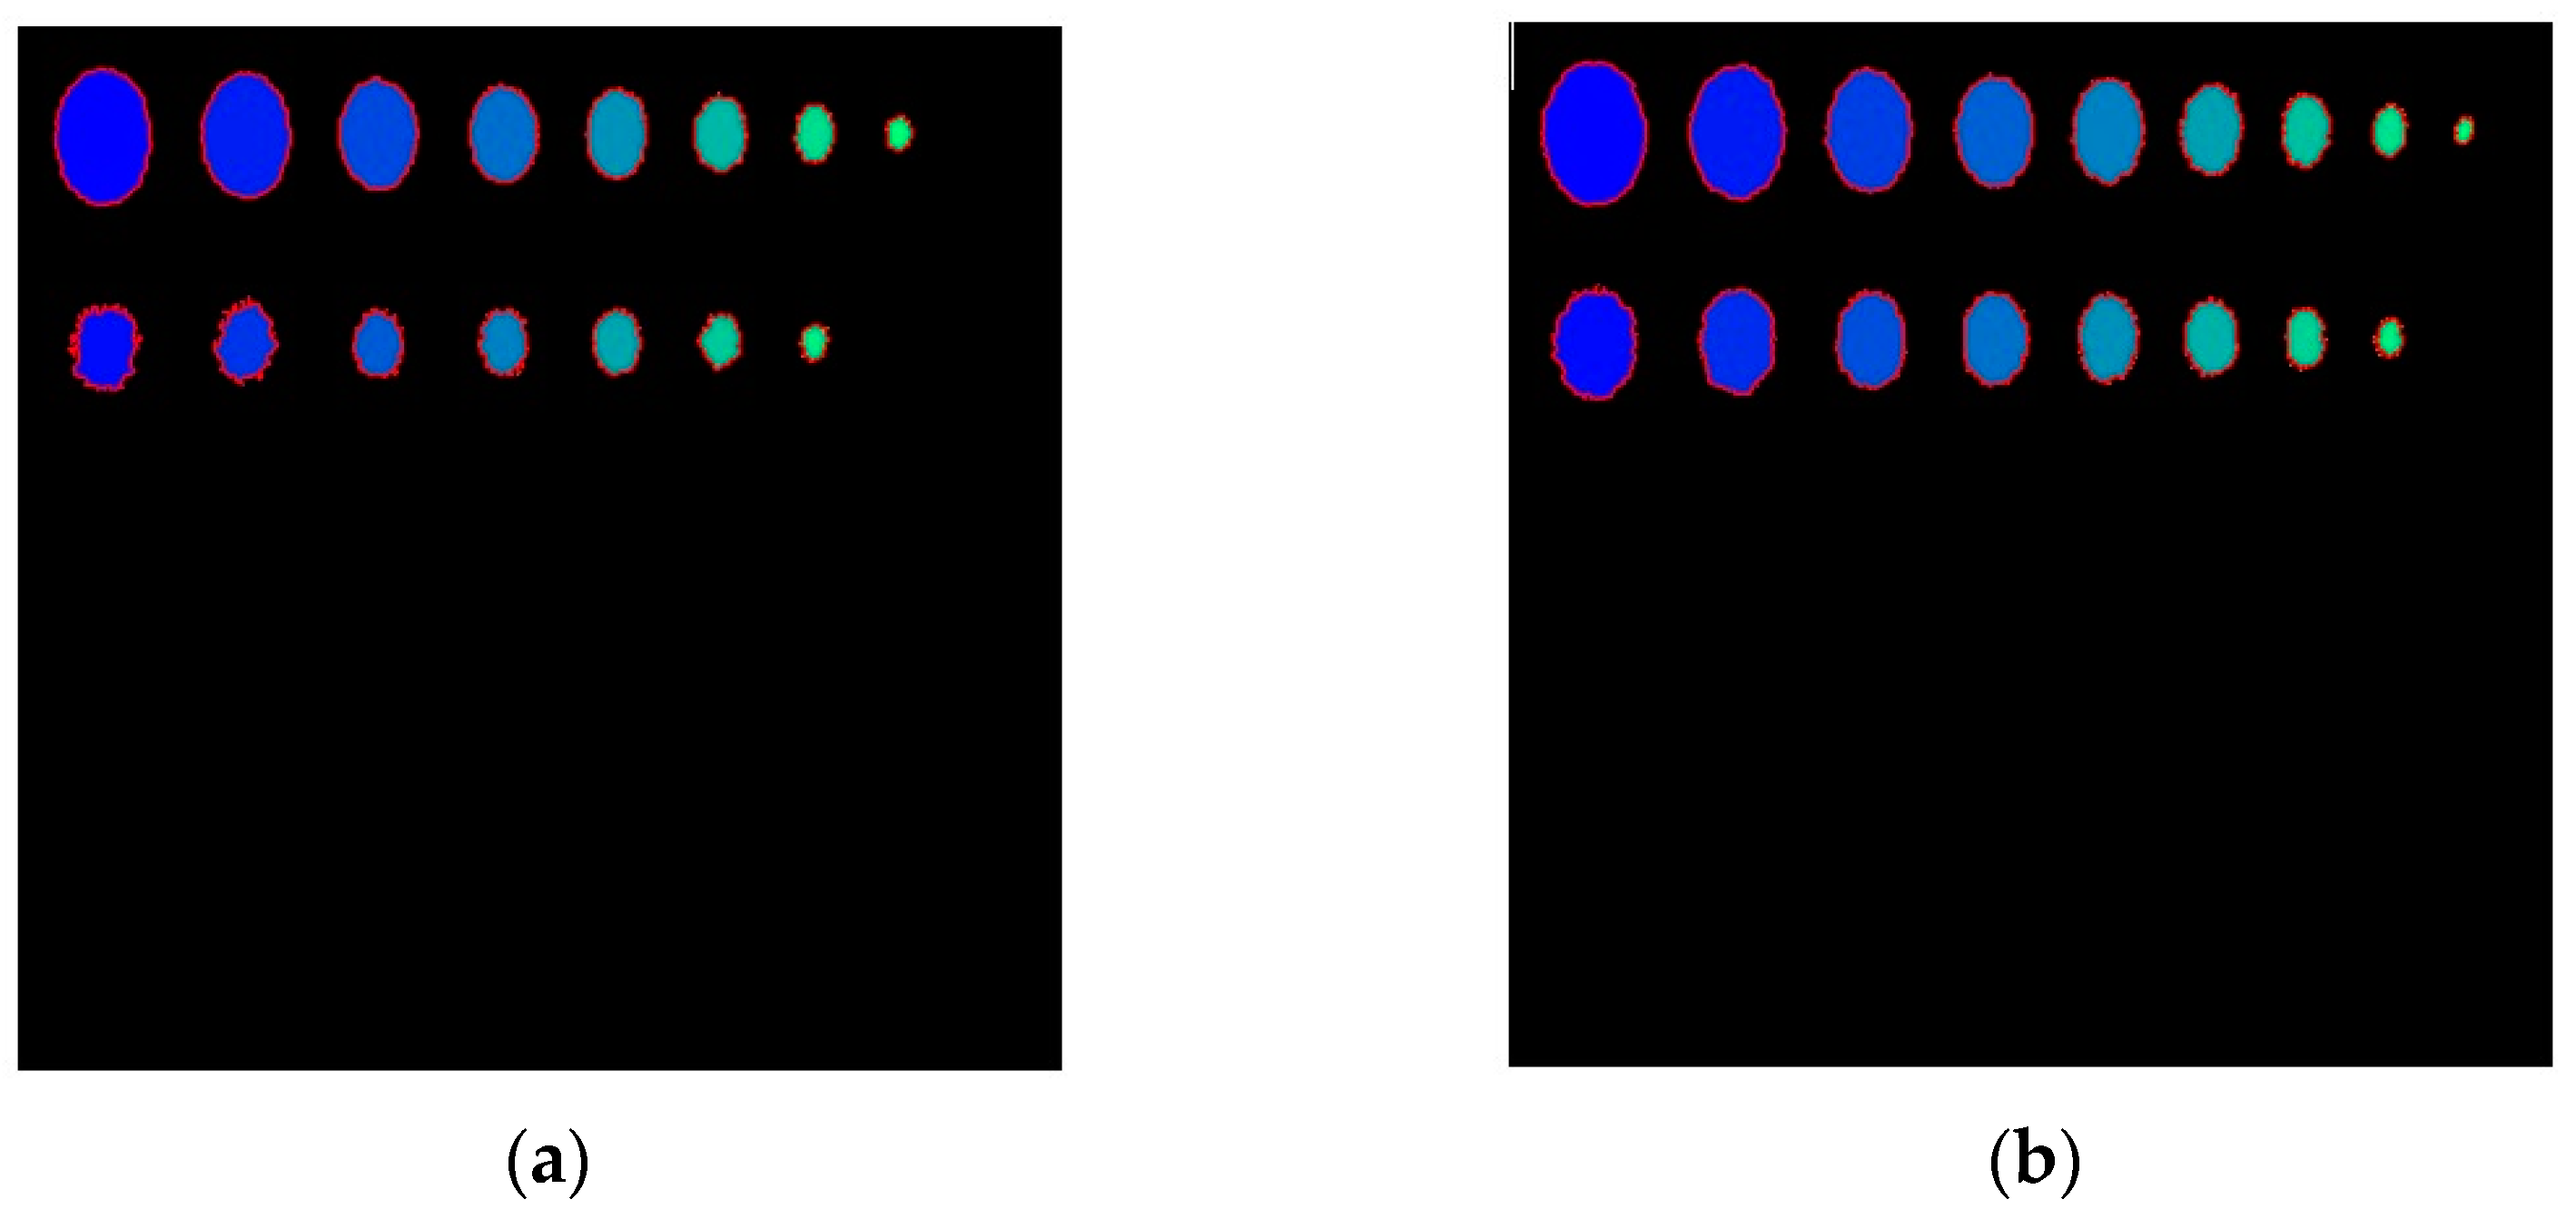
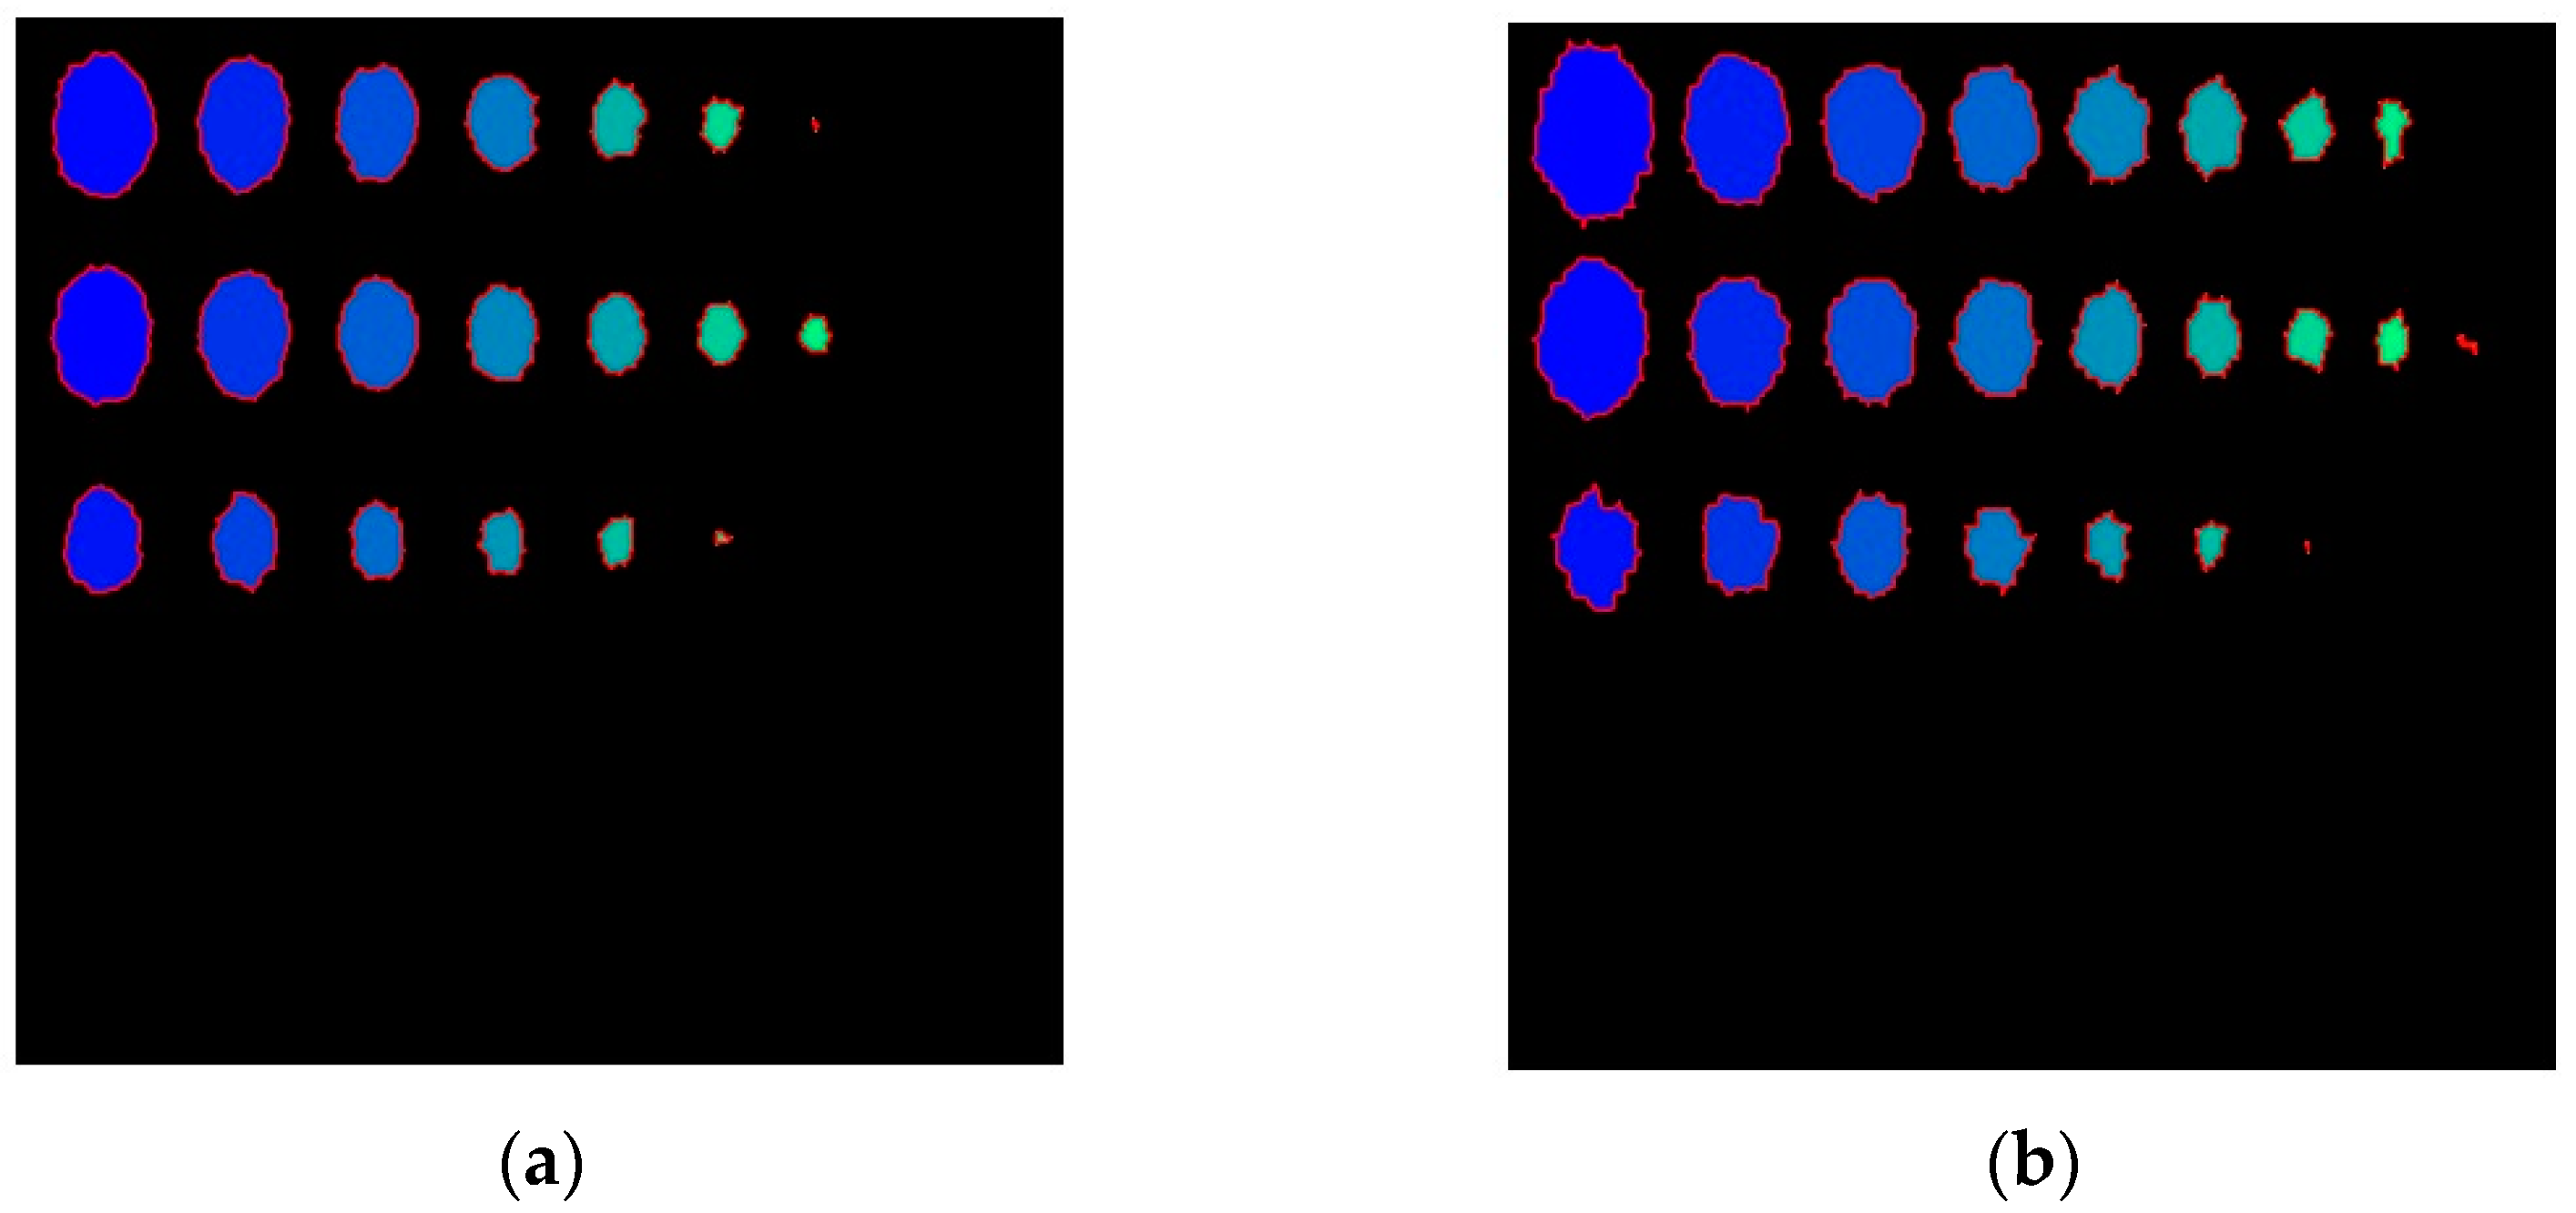
Since the ATC compensation technique showed better performance than the TRC technique in the previous section, binarization for the quantitative evaluation of defect detection was evaluated depending on whether the ATC compensation technique was applied. Figure 12 and Figure 13 show binarized images of the amplitude and phase depending on whether or not the ATC compensation technique is applied. Binarization utilized the well-known Otsu algorithm, which determines the optimal threshold values for the defective and sound area and converts them into binarized images [29].
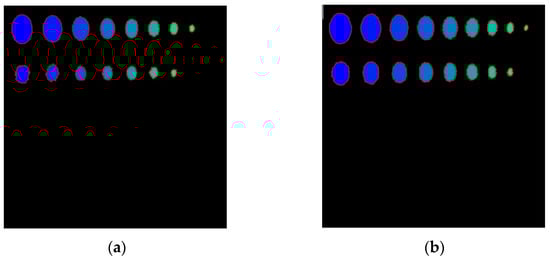
Figure 12.
Amplitude binarization image by Otsu algorithm: (a) not ATC applied, (b) ATC applied.
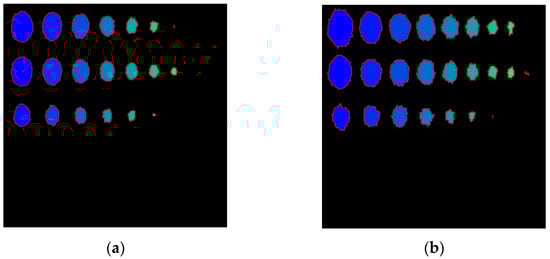
Figure 13.
Phase binarization image by Otsu algorithm: (a) not ATC applied, (b) ATC applied.
It can be seen that as contrast is improved by ATC compensation, defect detection through binarization is also improved. In the amplitude image with ATC applied, in row A (defect depth 9 mm), all defects except the smallest defect of 2 mm in diameter were detected. In the case of defect detection in row B, it can be seen that the defect size is detected relatively similar to the actual defect size in the amplitude image to which ATC is applied.
In the case of the phase binarized image in Figure 13, more defects were detected than in the amplitude image. In the phase, defects in row C (defect depth 7 mm) were also detected, and some defects in row D (defect depth 6 mm) were also incompletely detected. The reason is that the phase is generally less sensitive to emissivity and environmental factors than the amplitude. Also, it can be seen that defect detection performance is better in phase images with ATC applied.
4.4. Defect Detectability and SNR Evaluation
Since circular defects were simulated, the roundness metric was calculated and evaluated to verify that circular defects were accurately detected. Roundness metric evaluation was applied to evaluate the shape of defects detected in the binarized image. The closer the roundness metric evaluation is to 1, the closer it is to being circular. Roundness is determined by the area and perimeter of the defect and is defined as Equation (14) [30].
Table 3 and Table 4 show the results of calculating the roundness metric of defects detected in temperature and phase binarization images according to whether or not the ATC compensation technique was applied. Overall, the amplitude showed better results than the phase for detected defects. In the phase binary image, the overall result value is over 67% (0.67), showing that it is evaluated as close to a circular shape. Amplitude binary images showed higher result values of over 0.75 overall, with a maximum score of 85% (0.85). However, in the phase binarization image, the round metric values for the A7 and C6 defects in the results without ATC applied and the B9 and C7 defects in the results with ATC applied were calculated as very low or high round metric values, which are not considered appropriate to evaluate because they were detected very small.
Table 3.
Roundness metric results in the phase image for each defect.
Table 4.
Roundness metric results in the amplitude image for each defect.
A signal-to-noise ratio (SNR) evaluation was conducted to analyze the effect of improving detection probability by applying equivalent heating and compensation methods. In non-destructive testing, the ratio of defective signals to sound signals is used as a primary evaluation method and is a key factor in evaluating the detectability and uncertainty of defects. SNR can be expressed as Equation (15) [29].
where is the arithmetic means in the defective area, is the arithmetic means in the sound area, and is the standard deviation of the sound area.
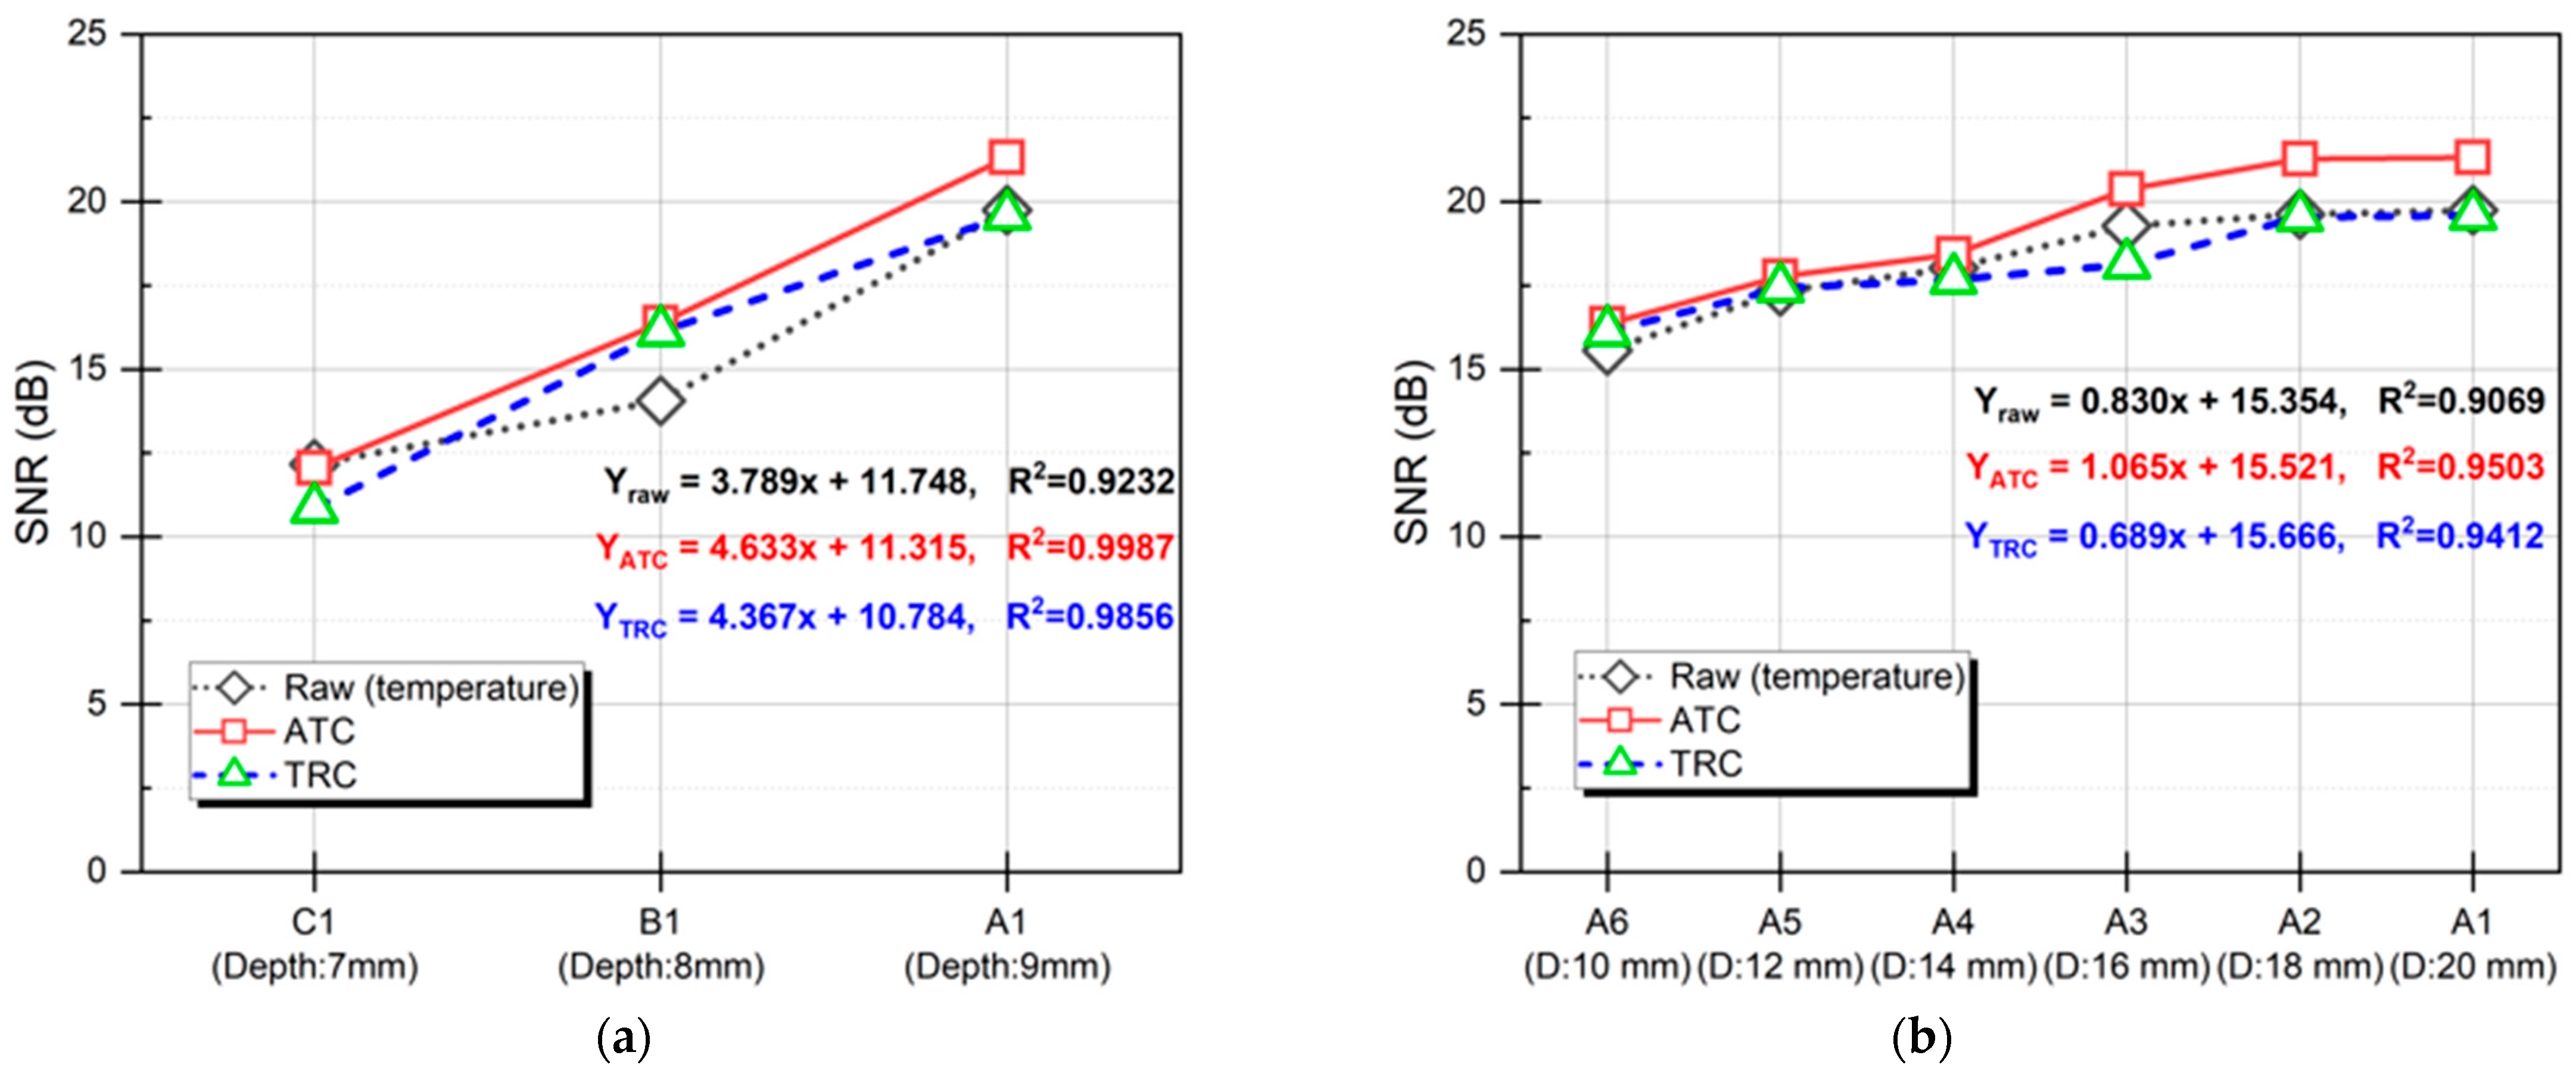
To quantitatively analyze the SNR improvement, an area was selected based on defects detected in the phase binarization image. Figure 14 shows the SNR trend according to the application of ATC and TRC compensation techniques. SNR was evaluated using temperature images to analyze the improvement of each technique. Additionally, to calculate SNR, the values of 3 × 3 pixels in the center of the defect area and 3 × 3 pixels in the adjacent sound area were applied. Figure 14a shows the SNR trend before and after applying ATC and TRC according to the defect depth as a graph and first-order trend equation. As a result, by applying the compensation technique, the original R2 value increases from 0.9232 to 0.9987, improving the proportionality between the depth of the defect and the calculated SNR value. Figure 14b shows the SNR trend before and after applying ATC and TRC according to the defect diameter as a graph and first-order trend equation. Similarly, it can be seen that the original R2 value increases from 0.9069 to 0.9503 through the application of the compensation technique, improving the proportionality between the diameter of the defect and the calculated SNR value. The amount of SNR improvement was about 7.93% (1.57 dB) when ATC was applied to the A1 defect with a defect diameter of 20 mm and a depth of 9 mm. Comprehensively, it is believed that the impact of an uneven heat load was improved through the compensation technique.
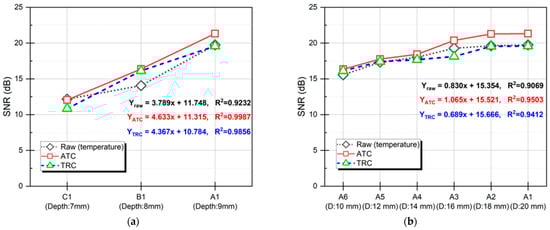
Figure 14.
SNR trend along the compensation method applied: (a) according to defect depth, (b) according to defect diameter.
5. Conclusions
In this paper, a study was conducted to improve the non-uniform thermal response caused by the non-uniform irradiation of the heat load device and the influence of the TT environment when performing defect detection using the LIT technique for PEEK samples. An HA lamp was manufactured to improve the uneven irradiation of the heat source device fundamentally. Then, LIT tests were conducted using HA lamps, including existing parabolic halogen lamps, and the improvement in surface temperature uniformity was analyzed. In addition, to improve the non-uniformity correction (NUC) problem of the FPA detector, ATC and TRC compensation procedures were applied by deriving spatial correlation between pixels, and the improvement in the defect detection possibility was analyzed. The conclusions from this study are as follows.
- (1)
- Surface temperature uniformity is significantly improved due to uniform heating, which is achieved by applying an equivalent halogen array lamp.
- (2)
- By generating compensation techniques using reference samples and applying compensation techniques to defective samples, the contrast of thermal images was greatly improved. In particular, when applying the ATC compensation technique, the standard deviation of temperature distribution was improved by about half compared to raw data.
- (3)
- In addition, the SNR of IR images was improved through the application of compensation techniques, improving the defect detectability in amplitude and phase images.
- (4)
- Lastly, through the evaluation of the roundness of circular defects, it was found that the LIT technique is useful and reliable technology for the non-destructive evaluation of PEEK.
It is expected that the results of this study can be used for the development of thermographic testing technology and devices and the calibration of inspection systems. However, reference samples, test specimens, and stable inspection conditions and procedures will be required. Future work involves plans to conduct a study in two steps. In the first step, the defect detectability and reliability of thermographic testing will be further improved by combining the compensation technique applied in this study with the latest signal processing and image processing algorithms. In the second step, we will plan a PEEK-LIT dataset to apply deep learning techniques and ultimately conduct studies to estimate real-time defect sizes and depths for complex industrial components.
Author Contributions
Conceptualization, Y.C. and W.K.; data curation, Y.C. and H.S.; formal analysis, Y.C. and H.S.; funding acquisition, W.K. and H.S.; investigation, Y.C. and C.K.; methodology, S.L. and C.K.; project administration, W.K.; resources, W.K.; software, Y.C., S.L. and C.K.; supervision, H.S. and W.K.; validation, Y.C., C.K. and H.S.; visualization, Y.C. and S.L.; writing—original draft, Y.C. and C.K.; writing—review and editing, H.S. and W.K. All authors have read and agreed to the published version of the manuscript.
Funding
This study was supported by the National University Development Project by the Ministry of Education in 2023 and the project for Industry–University–Research Collaboration R&D funded by the Korea Ministry of SMEs and Startups (RS-2023-00224854).
Institutional Review Board Statement
Not applicable.
Informed Consent Statement
Not applicable.
Data Availability Statement
The data are only available upon reasonable request from the corresponding author. The data are not publicly available due to privacy.
Conflicts of Interest
Author Chunyoung Kim was employed by the company enesG. The remaining authors declare that the research was conducted in the absence of any commercial or financial relationships that could be construed as a potential conflict of interest.
References
- Ma, H.; Suonan, A.; Zhou, J.; Yuan, Q.; Liu, L.; Zhao, X.; Lou, X.; Yang, C.; Li, D.; Zhang, Y. PEEK (Polyether-Ether-Ketone) and its Composite Materials in Orthopedic Implantation. Arab. J. Chem. 2021, 14, 102977. [Google Scholar] [CrossRef]
- Rinaldi, M.; Ferrara, M.; Pigliaru, L.; Allegranza, C.; Nanni, F. Additive Manufacturing of Polyether Ether Ketone-Based Composites for Space Application: A Mini-Review. CEAS Space J. 2023, 15, 77–87. [Google Scholar] [CrossRef]
- Francis, J.N.; Banerjee, I.; Chugh, A.; Singh, J. Additive Manufacturing of Polyetheretherketone and its Composites: A Review. Polym. Compos. 2022, 43, 5802–5819. [Google Scholar] [CrossRef]
- Ciampa, F.; Mahmoodi, P.; Pinto, F.; Meo, M. Recent Advances in Active Infrared Thermography for Non-Destructive Testing of Aerospace Components. Sensors 2018, 18, 609. [Google Scholar] [CrossRef]
- Chen, J.; Yu, Z.; Jin, H. Nondestructive Testing and Evaluation Techniques of Defects in Fiber-Reinforced Polymer Composites: A Review. Front. Mater. 2022, 9, 986645. [Google Scholar] [CrossRef]
- Ida, N.; Meyendorf, N. Handbook of Advanced Nondestructive Evaluation; Springer International Publishing: Cham, Switzerland, 2019. [Google Scholar]
- Laux, K.A.; Jean-Fulcrand, A.; Sue, H.J.; Bremner, T.; Wong, J. The Influence of Surface Properties on Sliding Contact Temperature and Friction for Polyetheretherketone (PEEK). Polymer 2016, 103, 397–404. [Google Scholar] [CrossRef]
- Yang, R.; He, Y. Optically and Non-Optically Excited Thermography for Composites: A Review. Infrared Phys. Technol. 2016, 75, 26–50. [Google Scholar] [CrossRef]
- Fitch, D.A.; Hoffmeister, B.K.; De Ana, J. Ultrasonic Evaluation of Polyether Ether Ketone and Carbon Fiber-Reinforced PEEK. J. Mater. Sci. 2010, 45, 3768–3777. [Google Scholar] [CrossRef]
- Katunin, A. Criticality of the Self-Heating Effect in Polymers and Polymer Matrix Composites during Fatigue, and their Application in Non-Destructive Testing. Polymers 2018, 11, 19. [Google Scholar] [CrossRef]
- Gupta, M.; Khan, M.A.; Butola, R.; Singari, R.M. Advances in Applications of Non-Destructive Testing (NDT): A Review. Adv. Mater. Process. Technol. 2022, 8, 2286–2307. [Google Scholar] [CrossRef]
- Doshvarpassand, S.; Wu, C.; Wang, X. An Overview of Corrosion Defect Characterization using Active Infrared Thermography. Infrared Phys. Technol. 2019, 96, 366–389. [Google Scholar] [CrossRef]
- Xie, J.; Xu, C.; Wu, C.; Gao, L.; Chen, G.; Li, G.; Song, G. Visualization of Defects in CFRP-Reinforced Steel Structures using Improved Eddy Current Pulsed Thermography. Autom. Constr. 2023, 145, 104643. [Google Scholar] [CrossRef]
- Olafsson, G.; Tighe, R.C.; Boyd, S.W.; Dulieu-Barton, J.M. Lock-in Thermography using Miniature Infra-Red Cameras and Integrated Actuators for Defect Identification in Composite Materials. Opt. Laser Technol. 2022, 147, 107629. [Google Scholar] [CrossRef]
- Poelman, G.; Hedayatrasa, S.; Segers, J.; Van Paepegem, W.; Kersemans, M. Adaptive Spectral Band Integration in Flash Thermography: Enhanced Defect Detectability and Quantification in Composites. Compos. Part B Eng. 2020, 202, 108305. [Google Scholar] [CrossRef]
- Liu, K.; Ma, Z.; Liu, Y.; Yang, J.; Yao, Y. Enhanced Defect Detection in Carbon Fiber Reinforced Polymer Composites Via Generative Kernel Principal Component Thermography. Polymers 2021, 13, 825. [Google Scholar] [CrossRef]
- Ratsakou, A.; Skarlatos, A.; Reboud, C.; Lesselier, D. Shape Reconstruction of Delamination Defects using Thermographic Infrared Signals Based on an Enhanced Canny Approach. Infrared Phys. Technol. 2020, 111, 103527. [Google Scholar] [CrossRef]
- Parrany, A.M. Damage Detection in Circular Cylindrical Shells using Active Thermography and 2-D Discrete Wavelet Analysis. Thin-Walled Struct. 2019, 136, 34–49. [Google Scholar] [CrossRef]
- Chung, Y.; Lee, S.; Kim, W. Latest Advances in Common Signal Processing of Pulsed Thermography for Enhanced Detectability: A Review. Appl. Sci. 2021, 11, 12168. [Google Scholar] [CrossRef]
- Poissenot-Arrigoni, C.; Marcon, B.; Rossi, F.; Fromentin, G. Fast and Easy Radiometric Calibration Method Integration Time Insensitive for Infrared Thermography. Infrared Phys. Technol. 2023, 133, 104741. [Google Scholar] [CrossRef]
- Falsetti, C.; Sisti, M.; Beard, P.F. Infrared Thermography and Calibration Techniques for Gas Turbine Applications: A Review. Infrared Phys. Technol. 2021, 113, 103574. [Google Scholar] [CrossRef]
- Schweikert, K.; Sielaff, A.; Stephan, P. Pixel-Wise in Situ Calibration Method for High Accuracy Infrared Thermography of Moving Targets. Infrared Phys. Technol. 2021, 118, 103862. [Google Scholar] [CrossRef]
- Pron, H.; Bouache, T. Alternative Thermal Calibrations of Focal Plane Array Infrared Cameras. Quant. InfraRed Thermogr. J. 2016, 13, 94–108. [Google Scholar] [CrossRef]
- Carlomagno, G.M.; Berardi, P.G. Unsteady Thermotopography in Non-Destructive Testing. In Proceedings of the 3rd Biannual Exchange, St. Louis, MO, USA, 24–26 August 1976; p. 26. [Google Scholar]
- Ranjit, S.; Kang, K.; Kim, W. Investigation of Lock-in Infrared Thermography for Evaluation of Subsurface Defects Size and Depth. Int. J. Precis. Eng. Manuf. 2015, 16, 2255–2264. [Google Scholar] [CrossRef]
- Lee, S.; Chung, Y.; Kim, C.; Shrestha, R.; Kim, W. Thermographic Inspection of CLP Defects on the Subsurface Based on Binary Image. Int. J. Precis. Eng. Manuf. 2022, 23, 269–279. [Google Scholar] [CrossRef]
- Song, H.; Zhang, K.; Tan, W.; Guo, F.; Zhang, X.; Cao, W. A Non-Uniform Correction Algorithm Based on Scene Nonlinear Filtering Residual Estimation. Curr. Opt. Photonics 2023, 7, 408–418. [Google Scholar]
- Poncelet, M.; Witz, J.; Pron, H.; Wattrisse, B. A Study of IRFPA Camera Measurement Errors: Radiometric Artefacts. Quant. InfraRed Thermogr. J. 2011, 8, 3–20. [Google Scholar] [CrossRef]
- Chung, Y.; Shrestha, R.; Lee, S.; Kim, W. Binarization Mechanism Evaluation for Water Ingress Detectability in Honeycomb Sandwich Structure using Lock-in Thermography. Materials 2022, 15, 2333. [Google Scholar] [CrossRef]
- Takashimizu, Y.; Iiyoshi, M. New Parameter of Roundness R: Circularity Corrected by Aspect Ratio. Prog. Earth Planet. Sci. 2016, 3, 2. [Google Scholar] [CrossRef]


Disclaimer/Publisher’s Note: The statements, opinions and data contained in all publications are solely those of the individual author(s) and contributor(s) and not of MDPI and/or the editor(s). MDPI and/or the editor(s) disclaim responsibility for any injury to people or property resulting from any ideas, methods, instructions or products referred to in the content. |
© 2024 by the authors. Licensee MDPI, Basel, Switzerland. This article is an open access article distributed under the terms and conditions of the Creative Commons Attribution (CC BY) license (https://creativecommons.org/licenses/by/4.0/).