

Notational Analysis of Men’s Singles Pickleball: Game Patterns and Competitive Strategies

 ,
,  , , and
Abstract
:1. Introduction
2. Methods
2.1. Design
2.2. Sample
2.3. Instruments
2.4. Procedure
2.5. Data Analysis
3. Results
Descriptive Analysis
4. Discussion
4.1. Practical Implications
4.2. Limitations and Future Perspectives
5. Conclusions
Author Contributions
Funding
Institutional Review Board Statement
Informed Consent Statement
Data Availability Statement
Acknowledgments
Conflicts of Interest
References
- Terrell, S.L.; Ficquette, P. Exploring Training Strategies to Optimize Court Performance in Older Pickleball Athletes. Available online: https://journals.lww.com/10.1519/SSC.0000000000000703 (accessed on 15 August 2024).
- USA Pickleball. History of the Game. Available online: https://usapickleball.org/what-is-pickleball/history-of-the-game/ (accessed on 26 August 2024).
- Ryu, J.; Yang, H.; Kim, A.C.H.; Kim, K.M.; Heo, J. Understanding pickleball as a new leisure pursuit among older adults. Educ. Gerontol. 2018, 44, 128–138. [Google Scholar] [CrossRef]
- Buzzelli, A.A.; Draper, J.A. Examining the Motivation and Perceived Benefits of Pickleball Participation in Older Adults. J. Aging Phys. Act. 2020, 28, 180–186. [Google Scholar] [CrossRef] [PubMed]
- Heo, J.; Ryu, J.; Yang, H.; Kim, A.C.H.; Rhee, Y. Importance of playing pickleball for older adults’ subjective well-being: A serious leisure perspective. J. Posit. Psychol. 2018, 13, 67–77. [Google Scholar] [CrossRef]
- Cerezuela, J.-L.; Lirola, M.-J.; Cangas, A.J. Pickleball and mental health in adults: A systematic review. Front. Psychol. 2023, 14, 1137047. [Google Scholar] [CrossRef] [PubMed]
- Casper, J.M.; Bocarro, J.N.; Drake, N.R. Physical Activity Associated with Older Adult Pickleball Participation: A Pilot Study. Recreat. Sports J. 2023, 47, 49–56. [Google Scholar] [CrossRef]
- Forrester, M.B. Pickleball-Related Injuries Treated in Emergency Departments. J. Emerg. Med. 2020, 58, 275–279. [Google Scholar] [CrossRef] [PubMed]
- Weiss, H.; Dougherty, J.; DiMaggio, C. Non-fatal senior pickleball and tennis-related injuries treated in United States emergency departments, 2010–2019. Inj. Epidemiol. 2021, 8, 34. [Google Scholar] [CrossRef]
- Barranca-Martínez, J.M.; Hernández-Beltrán, V.; Gamonales, J.M. Pickleball: Deporte alternativo para el área de Educación Física. Lect. Educ. Fís. Deport. 2023, 28, 146–160. [Google Scholar] [CrossRef]
- Kim, I.; Oh, D.; Kim, M.; Cho, K. Teaching Pickleball with In-Depth Content Knowledge in Middle School Physical Education. J. Phys. Educ. Recreat. Danc. 2020, 91, 29–38. [Google Scholar] [CrossRef]
- Sánchez-Pay, A.; Ortega-Soto, J.A.; Sánchez-Alcaraz, B.J. Notational analysis in female grand slam tennis competitions. Kinesiology 2021, 53, 154–161. [Google Scholar] [CrossRef]
- Gutiérrez-Santiago, A.; Cidre-Fuentes, P.; Orío-García, E.; Silva-Pinto, A.J.; Reguera-López-de-la-Osa, X.; Prieto-Lage, I. Women’s Singles Tennis Match Analysis and Probability of Winning a Point. Appl. Sci. 2024, 14, 6761. [Google Scholar] [CrossRef]
- Sánchez-Alcaraz, B.J.; Muñoz, D.; Pradas, F.; Ramón-Llin, J.; Cañas, J.; Sánchez-Pay, A. Analysis of serve and serve-return strategies in elite male and female padel. Appl. Sci. 2020, 10, 6693. [Google Scholar] [CrossRef]
- Escudero-Tena, A.; Sánchez-Alcaraz, B.J.; García-Rubio, J.; Ibáñez, S.J. Analysis of Game Performance Indicators during 2015–2019 World Padel Tour Seasons and Their Influence on Match Outcome. Int. J. Environ. Res. Public Health 2021, 18, 4904. [Google Scholar] [CrossRef] [PubMed]
- Escudero-Tena, A.; Muñoz, D.; Sánchez-Alcaraz, B.J.; García-Rubio, J.; Ibáñez, S.J. Analysis of Errors and Winners in Men’s and Women’s Professional Padel. Appl. Sci. 2022, 12, 8125. [Google Scholar] [CrossRef]
- Prieto-Lage, I.; Reguera-López-de-la-Osa, X.; Durán-Rodríguez, N.; Silva-Pinto, A.J.; Argibay-González, J.C.; Gutiérrez-Santiago, A. Assessing the Probability of Winning a Point in Men’s Padel: A Comprehensive Analysis. Appl. Sci. 2024, 14, 6642. [Google Scholar] [CrossRef]
- Prieto-Lage, I.; Paramés-González, A.; Torres-Santos, D.; Argibay-González, J.C.; Reguera-López-de-la-Osa, X.; GutiérrezSantiago, A. Match analysis and probability of winning a point in elite men’s singles tennis. PLoS ONE 2023, 18, e0286076. [Google Scholar] [CrossRef]
- Prieto-Lage, I.; Paramés-González, A.; Argibay-González, J.C.; Reguera-López-de-la-Osa, X.; Ordóñez-Álvarez, S.; Gutiérrez-Santiago, A. Match Analysis in Women’s Tennis on Clay, Grass and Hard Courts. Int. J. Environ. Res. Public Health 2022, 19, 7955. [Google Scholar] [CrossRef]
- Abdullahi, Y.; Coetzee, B. Notational singles match analysis of male badminton players who participated in the African Badminton Championships. Int. J. Perform. Anal. Sport 2017, 17, 1–16. [Google Scholar] [CrossRef]
- Abian-Vicen, J.; Castanedo, A.; Abian, P.; Sampedro, J. Temporal and notational comparison of badminton matches between men’s singles and women’s singles. Int. J. Perform. Anal. Sport 2013, 13, 310–320. [Google Scholar] [CrossRef]
- Fadhil Abdullah, M.; Janep, M.; Shahrul Azzfar, M.; Abd Karim, Z.; Rahmat, A.; Md Nadzalan, A. Playing Pattern Analysis of Men’s Single Badminton Matches. Int. J. Eng. Technol. 2018, 7, 168. [Google Scholar] [CrossRef]
- Malagoli Lanzoni, I.; Di Michele, R.; Merni, F. A notational analysis of shot characteristics in top-level table tennis players. Eur. J. Sport Sci. 2014, 14, 309–317. [Google Scholar] [CrossRef] [PubMed]
- Doğan, İ.; Revan, S.; Arikan, Ş. Analysis of tennis competitions on different court surface. Turk. J. Sport Exerc. 2021, 23, 60–66. [Google Scholar] [CrossRef]
- Vaverka, F.; Nykodym, J.; Hendl, J.; Zhanel, J.; Zahradnik, D. Association between serve speed and court surface in tennis. Int. J. Perform. Anal. Sport 2018, 18, 262–272. [Google Scholar] [CrossRef]
- Anguera, M.T.; Blanco-Villaseñor, A.; Losada, J.L.; Portell, M. Guidelines for designing and conducting a study that applies observational methodology. Anu. Psicol. 2018, 48, 9–17. [Google Scholar] [CrossRef]
- Anguera, M.T.; Blanco-Villaseñor, A.; Hernández-Mendo, A.; Losada-López, J.L. Observational designs: Their suitability and application in sports psychology. Cuad. Psicol. Deport. 2011, 11, 63–76. [Google Scholar]
- American Psychological Association Ethical principles of psychologists and code of conduct. Am. Psychol. 2002, 57, 1060–1073. [CrossRef]
- González-Prado, C.; Iglesias, X.; Anguera, M.T. Detección de regularidades en taekwondo de alto nivel. Cuad. Psicol. Deport. 2015, 15, 99–110. [Google Scholar] [CrossRef]
- Soto, A.; Camerino, O.; Iglesias, X.; Anguera, M.T.; Castañer, M. LINCE PLUS: Research Software for Behavior Video Analysis. Apunt. Educ. Física i Esports 2019, 137, 149–153. [Google Scholar] [CrossRef]
- Blanco-Villaseñor, A.; Anguera, M.T. Evaluación de la calidad en el registro del comportamiento: Aplicación a deportes de equipo. In Métodos Numéricos en Ciencias Sociales; Oñate, E., García-Sicilia, F., Ramallo, L., Eds.; Centro Internacional de Métodos Numéricos en Ingeniería: Barcelona, Spain, 2000; pp. 30–48. [Google Scholar]
- Cohen, J. Weighted kappa: Nominal scale agreement with provision for scaled disagreement of partial credit. Psychol. Bull. 1968, 70, 213–220. [Google Scholar] [CrossRef]
- Magnusson, M.S. Discovering hidden time patterns in behavior: T-patterns and their detection. Behav. Res. Methods Instrum. Comput. 2000, 32, 93–110. [Google Scholar] [CrossRef]
- Magnusson, M.S. Why Search for Hidden Repeated Temporal Behavior Patterns: T-Pattern Analysis with Theme. Int. J. Clin. Pharmacol. Pharmacother. 2017, 2, 10–15344. [Google Scholar] [CrossRef] [PubMed]
- Fitzpatrick, A.; Stone, J.A.; Choppin, S.; Kelley, J. Important performance characteristics in elite clay and grass court tennis match-play. Int. J. Perform. Anal. Sport 2019, 19, 942–952. [Google Scholar] [CrossRef]
- Fernández-García, Á.I.; Blanca-Torres, J.C.; Hernández-García, R.; Torres-Luque, G. Analysis of the statistical variables related to the service in high performance male tennis in junior and absolute category. Cultura_Ciencia_Deporte 2019, 14, 289–295. [Google Scholar]
- Ramón-Llin, J.; Guzmán, J.F.; Llana, S.; Martínez-Gallego, R.; James, N.; Vučković, G. The Effect of the Return of Serve on the Server Pair’s Movement Parameters and Rally Outcome in Padel Using Cluster Analysis. Front. Psychol. 2019, 10, 1194. [Google Scholar] [CrossRef]
- Courel-Ibáñez, J.; Sánchez-Alcaraz Martínez, B.J.; Cañas, J. Game performance and length of rally in professional padel players. J. Hum. Kinet. 2017, 55, 161–169. [Google Scholar] [CrossRef]
- Sánchez-Alcaraz, B.J.; Jiménez, V.; Muñoz, D.; Ramón-Llin, J. External training load differences between male and female professional padel. J. Sport Health Res. 2021, 13, 445–454. [Google Scholar]
- Fitzpatrick, A.; Stone, J.A.; Choppin, S.; Kelley, J. A simple new method for identifying performance characteristics associated with success in elite tennis. Int. J. Sports Sci. Coach. 2019, 14, 43–50. [Google Scholar] [CrossRef]
- Carboch, J.; Placha, K.; Sklenarik, M. Rally pace and match characteristics of male and female tennis matches at the Australian Open 2017. J. Hum. Sport Exerc. 2018, 13, 743–751. [Google Scholar] [CrossRef]
- Mellado-Arbelo, Ó.; Baiget Vidal, E.; Usón, M.V. Analysis of game actions in professional male padel. Cultura_Ciencia_Deporte 2019, 14, 191–201. [Google Scholar] [CrossRef]
- Sánchez-Alcaraz, B.J.; Jiménez, V.; Muñoz, D.; Ramón-Llin, J. Effectiveness and Distribution of Attacking Strokes to Finish the Point in Professional Padel. Rev. Int. Med. Cienc. Act. Fís. Deport. 2022, 22, 635–648. [Google Scholar] [CrossRef]
- Zhou, Y.; Zong, S.; Cao, R.; Gómez, M.Á.; Chen, C.; Cui, Y. Using network science to analyze tennis stroke patterns. Chaos Solitons Fractals 2023, 170, 113305. [Google Scholar] [CrossRef]
- Ramón-Llin, J.; Guzmán, J.; Martínez-Gallego, R.; Muñoz, D.; Sánchez-Pay, A.; Sánchez-Alcaraz, B.J. Analysis of the situation on the court of the players in the serve and itsrelationship with the direction, the side of the court and the result of the pointin high-level padel. Retos 2021, 41, 399–405. [Google Scholar] [CrossRef]
- Reid, M.; McMurtrie, D.; Crespo, M. The relationship between match statistics and top 100 ranking in professional men’s tennis. Int. J. Perform. Anal. Sport 2010, 10, 131–138. [Google Scholar] [CrossRef]
- Sánchez-Pay, A.; Palao, J.M.; Torres-Luque, G.; Sanz-Rivas, D. Differences in set statistics between wheelchair and conventional tennis on different types of surfaces and by gender. Int. J. Perform. Anal. Sport 2015, 15, 1177–1188. [Google Scholar] [CrossRef]
- Ramón-Llin, J.; Guzmán, J.; Martínez-Gallego, R.; Muñoz, D.; Sánchez-Pay, A.; Sánchez-Alcaraz, B.J. Stroke Analysis in Padel According to Match Outcome and Game Side on Court. Int. J. Environ. Res. Public Health 2020, 17, 7838. [Google Scholar] [CrossRef]


| Criteria | Code | Description |
|---|---|---|
| Service | FS | First service |
| SF | Service fault | |
| Rally length (the serve stroke is counted) | SH | Short rally (1–4 shots). |
| MD | Medium rally (5–8 shots). | |
| LN | Long rally (9+ shots). | |
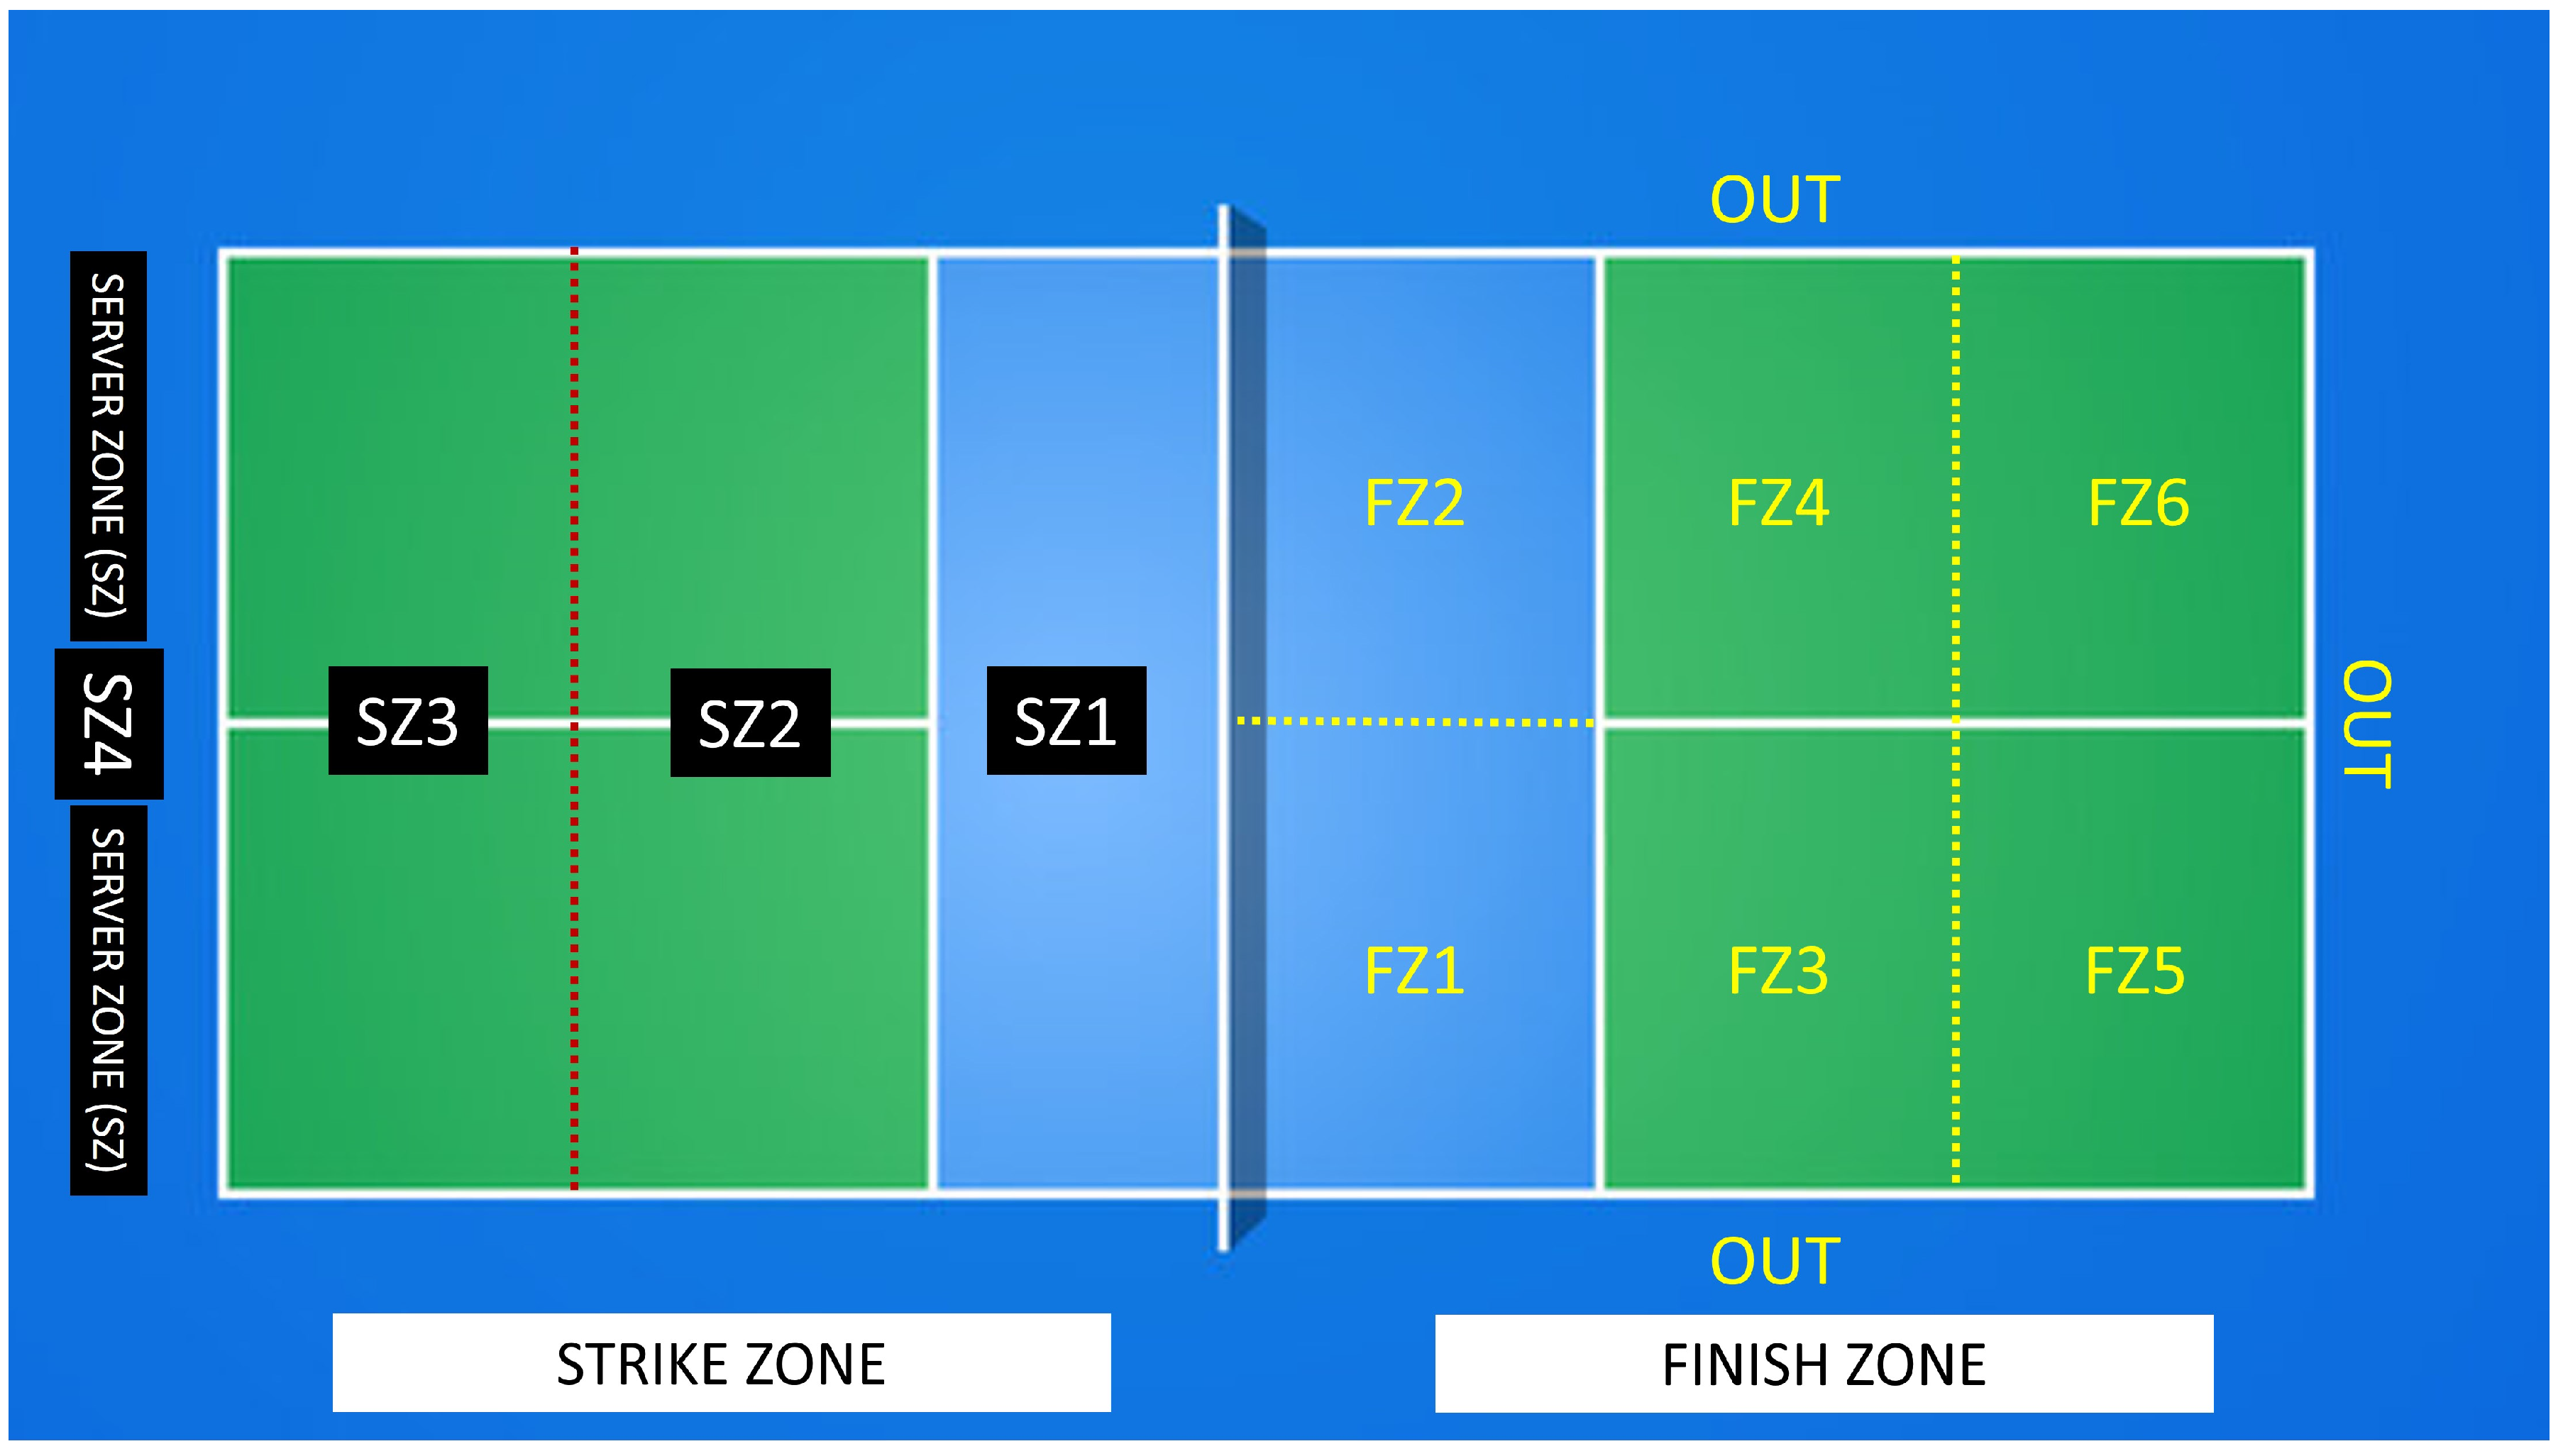
| Strike zone (see Figure 1) | SZ1 | Non-volley zone |
| SZ2 | Mid-court zone | |
| SZ3 | Back court zone, including the baseline | |
| SZ4 | Deep court zone, behind the baseline | |
| SZ | Service zone | |
| Finish zone (see Figure 1) | FZ1 | Left front zone |
| FZ2 | Right front zone | |
| FZ3 | Left mid-court zone | |
| FZ4 | Right mid-court zone | |
| FZ5 | Left back court zone | |
| FZ6 | Right back court zone | |
| NT | Net shot | |
| OUT | Shot out | |
| Winner | SW | The point is won by the server |
| RW | The point is won by the returner | |
| Point ending | SWW | Server wins with a winner or a forced error |
| SWUE | Server wins with an unforced error by the opponent | |
| RWW | Receiver wins with a winner or a forced error | |
| RWUE | Receiver wins with an unforced error by the opponent | |
| Final stroke | ACE | Direct serve |
| FH | Forehand | |
| BH | Backhand | |
| FHV | Forehand volley | |
| BHV | Backhand volley | |
| SM | Smash | |
| LB | Lob | |
| DS | Drop shot | |
| SC | Change of service due to an error in the service | |
| OT | Other type of stroke |
| Criteria | Intra-Kappa Obs1-Obs1 | Intra-Kappa Obs2-Obs2 | Inter-Kappa Obs1-Obs2 |
|---|---|---|---|
| Service | 1 | 1 | 1 |
| Rally length | 0.98 | 0.99 | 0.98 |
| Strike zone | 0.96 | 0.97 | 0.96 |
| Finish zone | 0.97 | 0.99 | 0.98 |
| Winner | 0.99 | 0.99 | 0.97 |
| Point ending | 0.97 | 0.97 | 0.96 |
| Final stroke | 0.96 | 0.99 | 0.96 |
| Mean reliability | 0.98 | 0.99 | 0.97 |
| Criteria | Code | n | % | χ2 Test | Criteria | Code | n | % | χ2 Test |
|---|---|---|---|---|---|---|---|---|---|
| Service | FS | 1118 | 97.6 | χ2 = 1039.547 | Winner | RW | 611 | 53.4 | χ2 = 5.178 |
| SF | 27 | 2.4 | p < 0.001 | SW | 534 | 46.6 | p < 0.023 | ||
| Rally length | LN | 145 | 12.7 | χ2 = 220.215 | Point ending | RWUE | 377 | 32.9 | χ2 = 44.921 |
| MD | 504 | 44.0 | p < 0.001 | RWW | 234 | 20.4 | p < 0.001 | ||
| SH | 496 | 43.3 | SWUE | 291 | 25.4 | ||||
| Strike zone | SZ1 | 12 | 1.0 | χ2 = 944.716 | SWW | 243 | 21.2 | ||
| SZ2 | 581 | 50.7 | p < 0.001 | Final stroke | ACE | 1 | 0.1 | χ2 = 1608.860 | |
| SZ3 | 218 | 19.0 | BH | 248 | 21.7 | p < 0.001 | |||
| SZ4 | 304 | 26.6 | BHV | 203 | 17.7 | ||||
| SZ | 30 | 2.6 | DS | 7 | 0.6 | ||||
| Finish zone | NT | 316 | 27.6 | χ2 = 739.583 | FH | 394 | 34.4 | ||
| OUT | 348 | 30.4 | p < 0.001 | FHV | 237 | 20.7 | |||
| FZ1 | 27 | 2.4 | LB | 6 | 0.5 | ||||
| FZ2 | 20 | 1.7 | OT | 4 | 0.3 | ||||
| FZ3 | 109 | 9.5 | SC | 29 | 2.5 | ||||
| FZ4 | 126 | 11.0 | SM | 16 | 1.4 | ||||
| FZ5 | 93 | 8.1 | |||||||
| FZ6 | 106 | 9.3 |
| Play Pattern SZ2 | n | % | Play Pattern SZ3 | n | % | Play Pattern SZ4 | n | % |
|---|---|---|---|---|---|---|---|---|
| SH | 464 | 100 | ||||||
| SH-SZ2 | 140 | 30.2 | SH-SZ3 | 96 | 20.7 | SH-SZ4 | 228 | 49.1 |
| SH-SZ2-SW | 96 | 68.6 | SH-SZ3-SW | 46 | 47.9 | SH-SZ4-SW | 140 | 61.4 |
| SH-SZ2-SW-SWW | 2 | 1.4 | SH-SZ3-SW-SWW | 39 | 40.6 | SH-SZ4-SW-SWW | 51 | 22.4 |
| SH-SZ2-SW-SWUE | 94 | 67.1 | SH-SZ3-SW-SWUE | 7 | 7.3 | SH-SZ4-SW-SWUE | 89 | 39 |
| SH-SZ2-RW | 44 | 31.4 | SH-SZ3-RW | 52 | 54.2 | SH-SZ4-RW | 88 | 38.6 |
| SH-SZ2-RW-RWW | 43 | 30.7 | SH-SZ3-RW-RWW | 0 | 0 | SH-SZ4-RW-RWW | 7 | 3.1 |
| SH-SZ2-RW-RWUE | 1 | 0.7 | SH-SZ3-RW-RWUE | 52 | 54.2 | SH-SZ4-RW-RWUE | 81 | 35.5 |
| MD | 494 | 100 | ||||||
| MD-SZ2 | 331 | 67 | MD-SZ3 | 105 | 21 | MD-SZ4 | 58 | 12 |
| MD-SZ2-SW | 141 | 42.6 | MD-SZ3-SW | 38 | 36.2 | MD-SZ4-SW | 13 | 22.4 |
| MD-SZ2-SW-SWW | 69 | 20.8 | MD-SZ3-SW-SWW | 36 | 34.3 | MD-SZ4-SW-SWW | 7 | 12.1 |
| MD-SZ2-SW-SWUE | 72 | 21.7 | MD-SZ3-SW-SWUE | 2 | 1.9 | MD-SZ4-SW-SWUE | 6 | 10.3 |
| MD-SZ2-RW | 190 | 57.4 | MD-SZ3-RW | 67 | 63.8 | MD-SZ4-RW | 45 | 77.6 |
| MD-SZ2-RW-RWW | 135 | 40.7 | MD-SZ3-RW-RWW | 4 | 3.8 | MD-SZ4-RW-RWW | 1 | 1.7 |
| MD-SZ2-RW-RWUE | 55 | 16.6 | MD-SZ3-RW-RWUE | 63 | 60 | MD-SZ4-RW-RWUE | 44 | 75.9 |
| Search | Max. | T-Pattern | L | O | % | |
|---|---|---|---|---|---|---|
| FS | 1118 | 100% | ||||
| FS-SH | 469 | 42% | (FS (SH SZ4)) | 3 | 228 | 48.6 |
| (FS (SH SZ2)) | 3 | 140 | 29.8 | |||
| ((FS SH) (SZ4 FH)) | 4 | 179 | 38.1 | |||
| (((FS SH) (SZ2 SW)) SWUE) | 5 | 94 | 20 | |||
| FS-SH-SW | 283 | 60.4% | ((FS (SH SW)) (SWW FH)) | 5 | 80 | 28.2 |
| ((FS (SH NT)) (SW SWUE)) | 5 | 85 | 30 | |||
| ((FS (SH OUT)) (SW SWUE)) | 5 | 105 | 37.1 | |||
| ((((FS SH) (SZ2 SW)) SWUE) BHV) | 6 | 49 | 17.3 | |||
| (FS ((SH SZ4) (SW (SWUE FH)))) | 6 | 67 | 23.6 | |||
| ((FS SH) ((SZ4 OUT) (SW (SWUE FH)))) | 7 | 44 | 15.5 | |||
| FS-SH-RW | 186 | 39.6% | ((FS (SH RW)) (RWUE FH)) | 5 | 97 | 52.1 |
| (FS ((SH NT) (RW (RWUE FH)))) | 6 | 51 | 27.4 | |||
| (FS ((SH OUT) (RW (RWUE FH)))) | 6 | 46 | 24.7 | |||
| (FS ((SH SZ4) (RW (RWUE FH)))) | 6 | 61 | 32.7 | |||
| ((((FS SH) (SZ2 RW)) RWW) FHV) | 6 | 23 | 12.4 | |||
| ((FS SH) ((SZ4 NT) (RW (RWUE FH)))) | 7 | 34 | 18.2 | |||
| FS-MD | 504 | 45.1% | ((FS MD) (SZ2 FHV)) | 4 | 134 | 26.5 |
| (FS (MD SZ2)) | 3 | 331 | 65.6 | |||
| (FS (MD SZ3)) | 3 | 105 | 20.8 | |||
| (FS (MD BH)) | 3 | 130 | 25.8 | |||
| (FS (MD FH)) | 3 | 123 | 24.4 | |||
| FS-MD-SW | 194 | 38.5% | (FS (MD (SW SWW))) | 4 | 113 | 58.2 |
| ((FS MD) (SZ2 SW)) | 4 | 141 | 27.9 | |||
| ((FS MD) (SZ2 (SW SWW))) | 5 | 69 | 35.5 | |||
| ((FS MD) (SZ3 (SW SWW))) | 5 | 36 | 18.5 | |||
| ((FS MD) (FZ4 (SW SWW))) | 5 | 38 | 19.6 | |||
| ((FS MD) (SZ2 (SW SWUE))) | 5 | 72 | 37.1 | |||
| (((FS MD) (SZ2 FZ4)) (SW SWW)) | 6 | 26 | 13.4 | |||
| (FS ((MD SZ2) (SW (SWW FHV)))) | 6 | 31 | 15.9 | |||
| ((FS MD) ((SZ2 FZ4) (SW (SWW FHV)))) | 7 | 12 | 6.2 | |||
| FS-MD-RW | 310 | 61.5% | (FS (MD (RW RWUE))) | 4 | 169 | 54.5 |
| ((FS MD) (SZ2 RW)) | 4 | 190 | 61.3 | |||
| ((FS MD) (SZ2 (RW RWW))) | 5 | 135 | 43.5 | |||
| (FS ((MD SZ2) (RW (RWW FHV)))) | 6 | 72 | 23.2 | |||
| (((FS MD) (SZ2 FZ4)) (RW RWW)) | 6 | 38 | 12.2 | |||
| (((FS MD) (SZ2 FZ3)) (RW RWW)) | 6 | 31 | 10 | |||
| (((FS MD) (SZ2 FZ6)) (RW RWW)) | 6 | 31 | 10 | |||
| ((FS MD) (SZ3 (RW RWUE))) | 5 | 63 | 20.3 | |||
| ((FS (MD RW)) (RWUE BH)) | 5 | 75 | 24.1 | |||
| ((FS (MD RW)) (RWUE FH)) | 5 | 61 | 19.7 | |||
| FS-LN | 145 | 13% | (FS (LN SZ2)) | 3 | 110 | 75.9 |
| (FS (LN (SZ2 BHV))) | 4 | 36 | 24.8 | |||
| (FS (LN (SZ2 FHV))) | 4 | 34 | 23.4 | |||
| FS-LN-SW | 57 | 39.3% | ((FS LN) (SZ2 SW)) | 4 | 49 | 85.9 |
| (FS (LN (SW SWW))) | 4 | 37 | 64.9 | |||
| ((FS LN) (SZ2 (SW SWW))) | 5 | 31 | 54.3 | |||
| (((FS LN) (SZ2 SW)) (SWW FHV)) | 6 | 14 | 24.5 | |||
| FS-LN-RW | 88 | 60.7% | (FS (LN (RW RWUE))) | 4 | 45 | 51.1 |
| ((FS LN) (SZ2 RW)) | 4 | 61 | 69.3 | |||
| ((FS LN) (SZ2 (RW RWW))) | 5 | 42 | 28.9 | |||
| ((FS LN) (SZ2 (RW RWW))) | 5 | 42 | 47.7 | |||
| (((FS LN) (SZ2 FZ3)) (RW RWW)) | 6 | 14 | 15.9 | |||
| (((FS LN) (SZ2 RW)) (RWW BHV)) | 6 | 16 | 18.1 | |||
| (((FS LN) (SZ2 RW)) (RWW FHV)) | 6 | 13 | 14.7 |
Disclaimer/Publisher’s Note: The statements, opinions and data contained in all publications are solely those of the individual author(s) and contributor(s) and not of MDPI and/or the editor(s). MDPI and/or the editor(s) disclaim responsibility for any injury to people or property resulting from any ideas, methods, instructions or products referred to in the content. |
© 2024 by the authors. Licensee MDPI, Basel, Switzerland. This article is an open access article distributed under the terms and conditions of the Creative Commons Attribution (CC BY) license (https://creativecommons.org/licenses/by/4.0/).
Share and Cite
Prieto-Lage, I.; Reguera-López-de-la-Osa, X.; Juncal-López, A.; Silva-Pinto, A.J.; Argibay-González, J.C.; Gutiérrez-Santiago, A. Notational Analysis of Men’s Singles Pickleball: Game Patterns and Competitive Strategies. Appl. Sci. 2024, 14, 8724. https://doi.org/10.3390/app14198724
Prieto-Lage I, Reguera-López-de-la-Osa X, Juncal-López A, Silva-Pinto AJ, Argibay-González JC, Gutiérrez-Santiago A. Notational Analysis of Men’s Singles Pickleball: Game Patterns and Competitive Strategies. Applied Sciences. 2024; 14(19):8724. https://doi.org/10.3390/app14198724
Chicago/Turabian StylePrieto-Lage, Iván, Xoana Reguera-López-de-la-Osa, Abel Juncal-López, Antonio José Silva-Pinto, Juan Carlos Argibay-González, and Alfonso Gutiérrez-Santiago. 2024. "Notational Analysis of Men’s Singles Pickleball: Game Patterns and Competitive Strategies" Applied Sciences 14, no. 19: 8724. https://doi.org/10.3390/app14198724