Review

Optical Measurement System for Monitoring Railway Infrastructure—A Review

by
Kira Zschiesche
1,* and
Alexander Reiterer
1,2
1
Fraunhofer Institute for Physical Measurement Techniques IPM, 79110 Freiburg, Germany
2
Department of Sustainable Systems Engineering INATECH, Albert-Ludwigs-University Freiburg, 79085 Freiburg, Germany
*
Author to whom correspondence should be addressed.
Appl. Sci. 2024, 14(19), 8801; https://doi.org/10.3390/app14198801
Submission received: 21 August 2024 / Revised: 12 September 2024 / Accepted: 20 September 2024 / Published: 30 September 2024

Abstract

:
Rail infrastructure plays an important role in fulfilling the demand for freight and passenger transportation. Increases in traffic volume, heavier axles and vehicles, higher speeds, and increasing climate extremes all contribute to the constant strain on the infrastructure. Due to their major importance in the transportation of people and freight, they are subject to continuous condition monitoring. This is an essential requirement for the selective planning of maintenance tasks and ultimately for safe and reliable operation. Various measuring systems have been developed for this purpose. These must measure precisely, quickly, and robustly under difficult conditions. Whether installed from mobile or stationary platforms, they have to cope with a wide range of ambient temperatures and lighting conditions, harsh environmental influences, and varying degrees of reflection. Despite these circumstances, railway operators require precise measurement data, high data densities even at high traveling speeds, and a user-friendly presentation of the results. Photogrammetry, laser scanning, and fiber optics are light-based measurement methods that are used in this sector. They are able to record with high precision rail infrastructure such as overhead contact systems, clearance profiles, rail tracks, and much more. This article provides an overview of the established and modern optical sensing methods, as well as the use of artificial intelligence as an evaluation method, and highlights their advantages and disadvantages.

1. Introduction

The transport of passengers or freight by rail is characterized by its large transport volume, high speeds, low consumption, and environmental friendliness. An efficient and functioning transport system is essential for a modern economy [1]. Disruptions or breakdowns can have a lasting impact on society and administration if they persist for long periods of time. Maintenance activities are necessary to organize this means of transport efficiently and without disruption. Regular or continuous monitoring of the infrastructure is a key factor. This is being exposed to high stresses due to ever-increasing transport volume, heavier vehicles, higher speeds, and extreme climatic events. Extremely high temperatures can lead to rail misalignments and buckling [2]. Temperatures that are too low lead to brittle tracks, ice formation on the tracks and supply cables, and the blocking of switches (unless they are equipped with heaters) [3].
Various measurement methods and applications have been developed for monitoring infrastructure. There are manually operated systems known as trolleys, such as the Trimble GEDO Vorsys system [4] or the Leica SiTrack:One [5], as well as automated mobile systems that operate from measurement trains and other self-driven platforms. There are a variety of measuring trains in successful use around the world, such as the “Docotor Yellow” used on the Japanese high-speed network for the Shinkansen (“Bullet Train”) [6], IRIS320 operated by Société Nationale des Chemins de Fer Français (SNCF) in France, LIMEZ III operated by Deutsche Bahn AG in Germany [7], and the CIT001 for China Railway and the China Academy of Railway Sciences (CARS) in China [8]. The trains are equipped with different measurement sensors according to their requirements. These special trains offer the advantage of being able to carry out inspections at high speeds but occupy the track during operation.
This article briefly explains the different optical measurement principles employed and provides an overview of a selection of the optical sensors used. Furthermore, advantages and disadvantages are explained.

2. Optical Inspection Technologies in Railways

In the following section, we first provide an overview of the various optical inspection systems in the rail sector. This is followed by an explanation of the monitoring objects and their respective tasks. Section 2.3 then covers the various sensor systems and their providers, sorted by monitoring subjects. Unfortunately, only a few manufacturers provide information on achievable accuracy or resolution, so that a direct comparison of the systems is only possible to a limited extent.

2.1. Overview

Conventional measurement systems are still used in many areas of railway infrastructure inspection. Systems based on tactile methods or visual inspection still make up the majority of railway measurement techniques. The recording and post-processing of data is often still carried out manually or semi-automatically. However, the use of optical sensor technology is being driven forward, primarily to achieve independence from human observers and to further establish automation.
Visual inspection using cameras relies on computer vision techniques. Image processing is used, including edge detection or segmentation. The images obtained are automatically analyzed using customer-specific image processing software. Typical applications are crack or screw detection [9]. The advantage here is the high speeds that can be achieved at relatively low cost. It is considered the most attractive technique for detecting surface defects [10]. A disadvantage is the dependence on ambient lighting. Camera systems only work in daylight or under artificial lighting. Adequate focusing must also be ensured, which is not trivial with recording rates that are often very high and with changing distances.
The use of laser scanners is becoming increasingly important in many areas of application. They provide impressive results by capturing precise data in a short amount of time and are often used for routine measurement of clearance. A big challenge for the use of laser-based measuring devices is the different reflectivity of objects, and also harsh environmental conditions, e.g., fog [11]. In contrast to camera-based methods, laser scanners can also be used at night without artificial lighting. They deliver high point densities of up to several million points per second with a precision of a few millimeters. This, in turn, generates large amounts of data that need to be processed. However, the post-processing time can be reduced by analyzing and interpreting the measured values in real time, e.g., by comparing measured geometries with a digital model. Another important issue is absolute eye safety, which must be guaranteed. This can be considered by using special wavelengths and fast-rotating deflection mirrors. An overview of laser scanning technologies and their applications for road and railway infrastructure monitoring can be found in [12].
Fiber optic sensors are characterized by their high sensitivity, resistance to electromagnetic interference, and robustness in harsh environments [13]. The technology is based on changes in the physical properties of light waves that propagate in the optical fibers due to external excitation. They are used in civil structures to measure strain, temperature, and vibration. They enable autonomous long-term monitoring over long distances and can detect changes to infrastructures at an early stage. Installation poses a major challenge. Broken fibers or bending loss can occur, which can lead to signal loss [13]. Compensating for varying ambient temperatures is another problem. Maintenance must also be carried out on site. In the following section, the focus is more on scanners and camera systems and less on fiber optics.

2.2. Monitoring Subjects

Monitoring in the railway sector involves many different objects and conditions. In the following section, we explain and clarify various monitoring subjects that are detected by optical sensors.
A railway track consists of rails, fasteners, sleepers and ballast as well as the underlying subsoil (see Figure 1). It constantly degrades with use. Sleepers are an important part of the track system. They are transverse elements that are used for the rigidity and fastening of the rails in the corresponding track gauge [14]. In combination with the fastening system, they absorb the dynamic train loads and distribute the load to the ballast [15]. They can be made of different materials such as concrete, wood, or steel. In the following section, we will concentrate on concrete sleepers, as these are most often used. Vegetation on railway tracks is special problem. The vegetation changes the elasticity of the track bed. The ballast fulfills the task of absorbing load peaks that act on the track due to traffic [16]. A change therefore represents a risk.
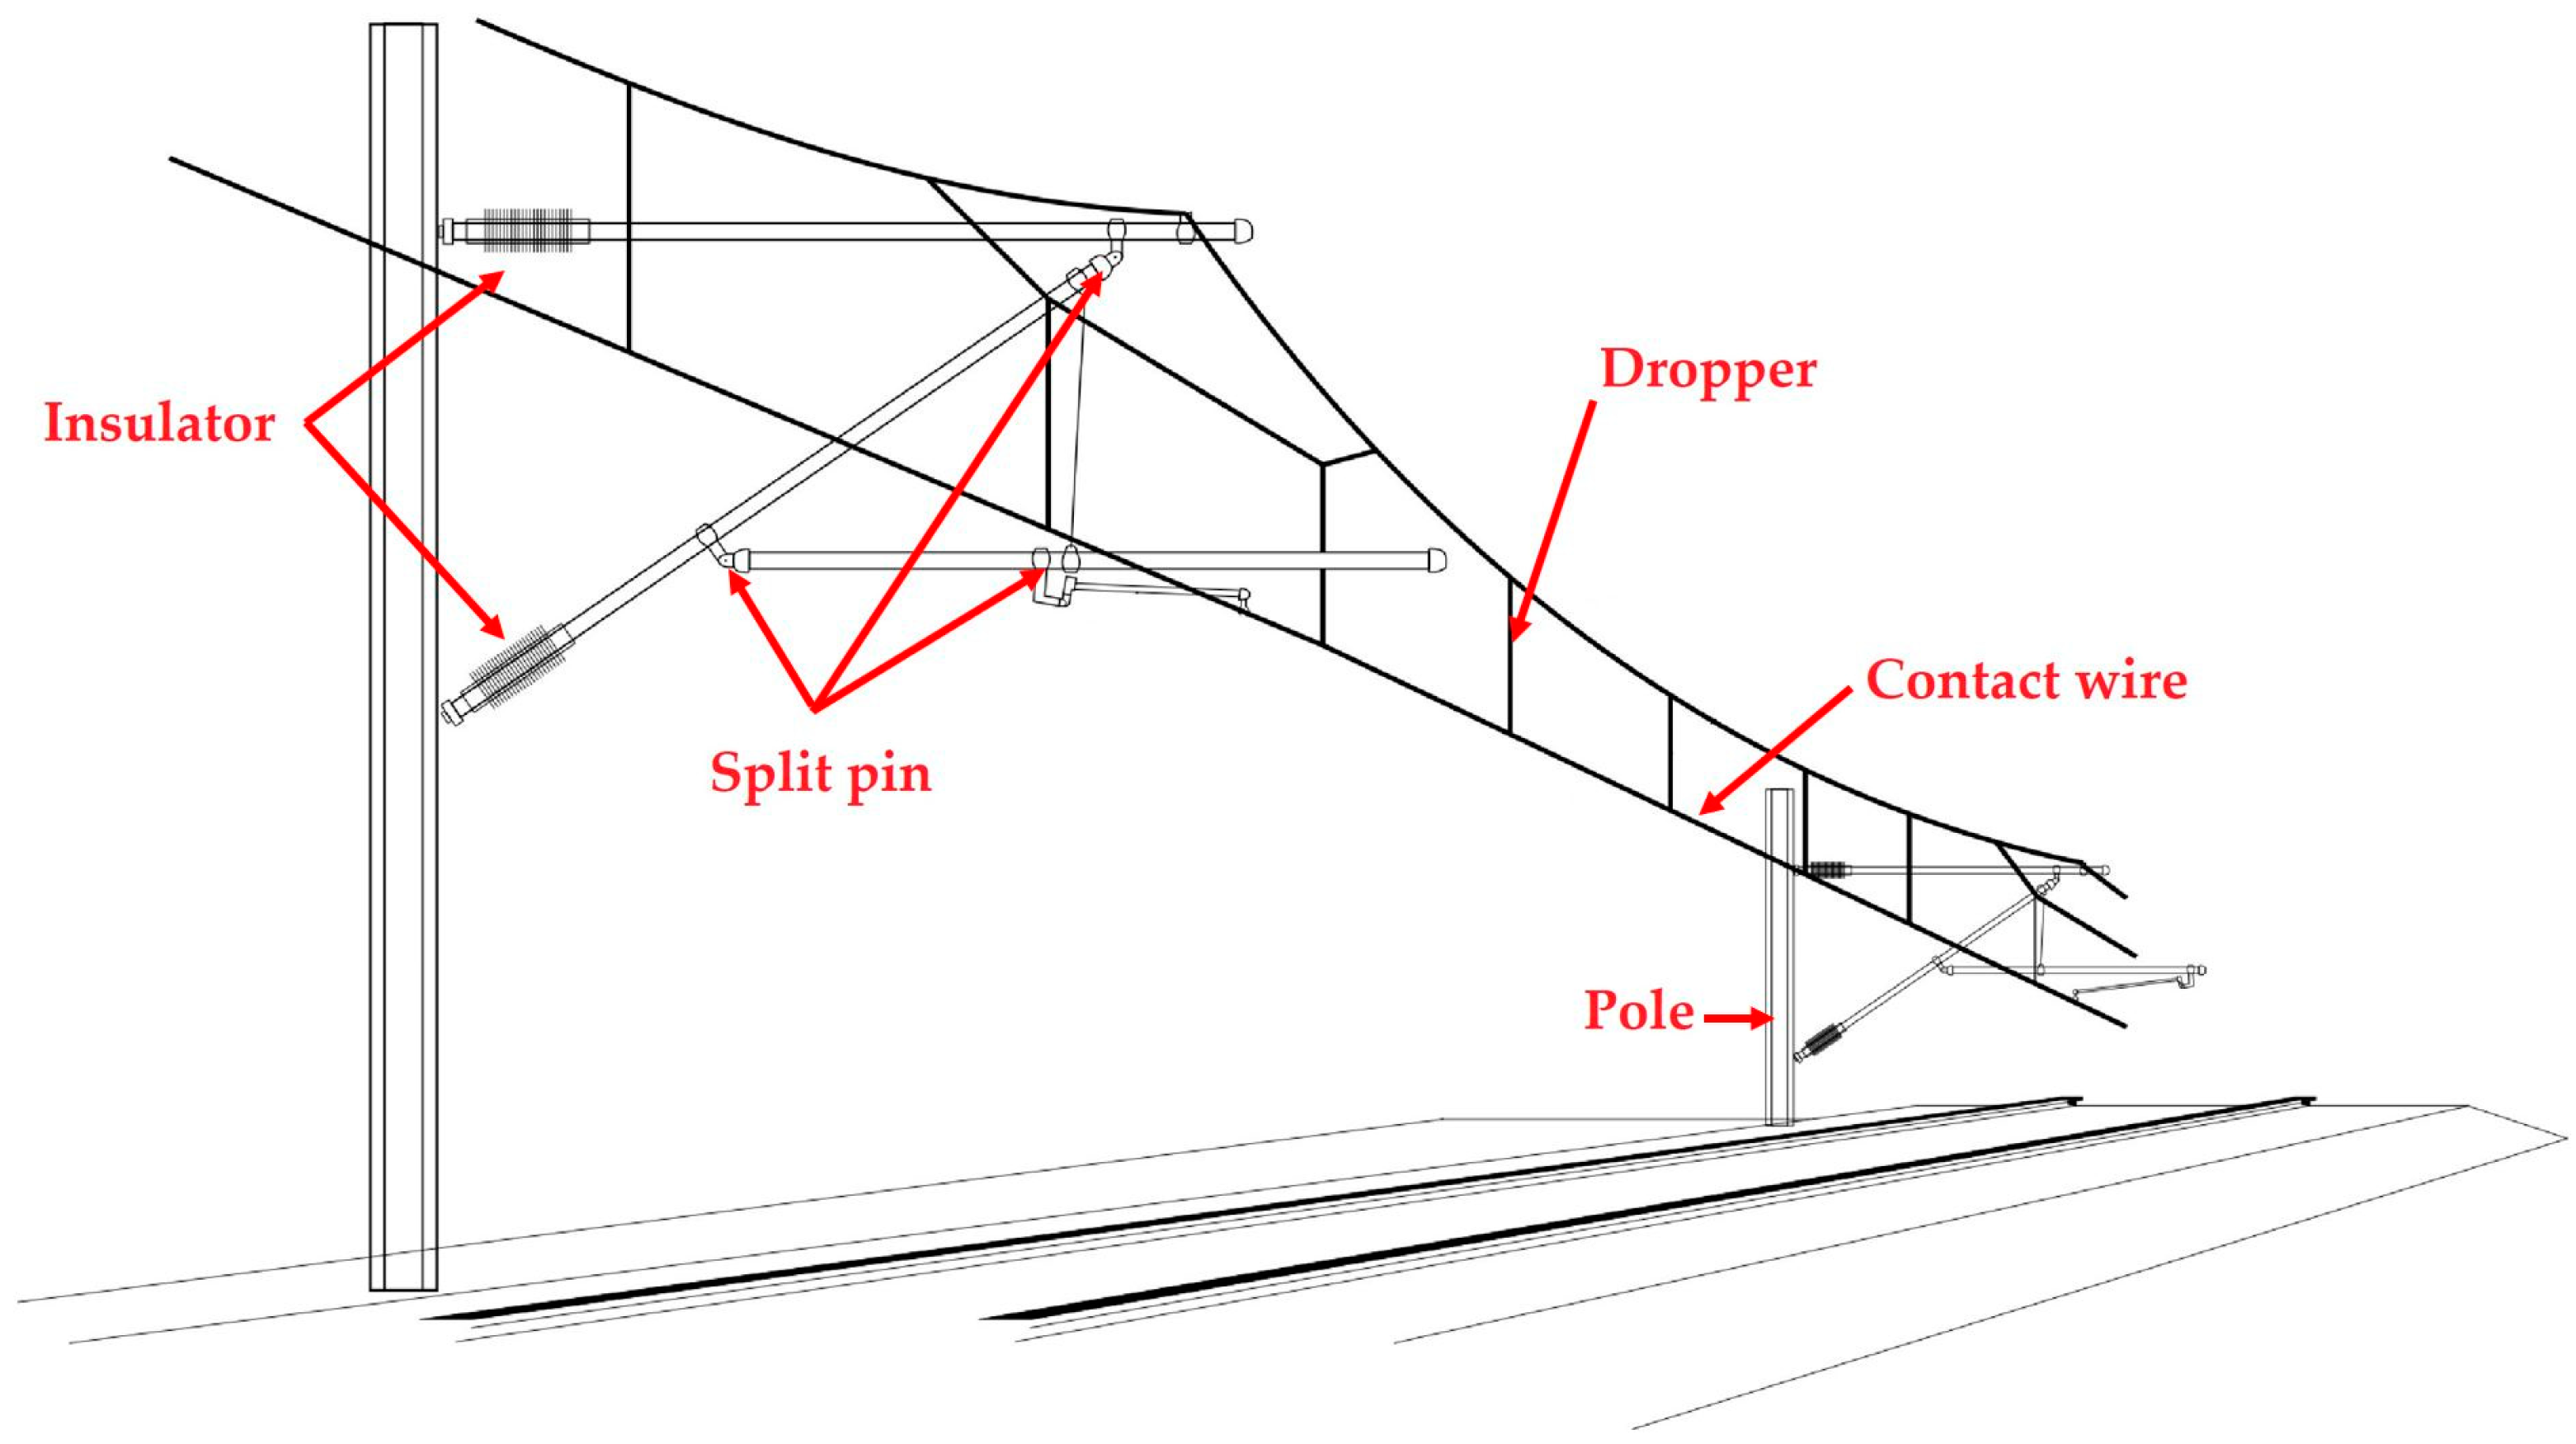
In electric rail systems, tramways, and overhead buses, the multiple units, locomotives or buses pick up the electric power via a pantograph in the Overhead Contact System (OCS) (see Figure 2). The OCS consists of many individual components, including the overhead contact line, reinforcement and switch cross conductors, longitudinal and transverse support structures, voltage protection units, and insulators. Overhead Contact Lines (OCL) are given a horizontal zigzag pattern to provide a uniform contact with the pantograph. The pantograph causes repetitive contact along the wires, which wears them out. Defects or failures in this system lead to delays and possibly to safety risks. It is therefore important to guarantee ideal contact between the pantograph and the overhead line [17]. The development of pantographs worldwide can be seen as an evolutionary process: from two-arm pantographs with a complex structure and high weight to single-arm pantographs with a simple structure, less weight, and more flexibility [17]. When monitoring the contact wire, it is not only the position that is of interest but also the degree of wear. Its main function is to transmit power through the sliding contact. The main causes of failure are poor positioning and heavy wear [18]. Improper positioning or sagging of the contact wire can cause the pantograph to become detached from the contact wire, which, in turn, can lead to destruction of the OCL. This can be caused by weather conditions or incorrect installation [18]. The wear of the contact wire is determined on the assumption that the contact wire is round and the diameter of the unused contact wire is known. The remaining thickness can therefore be determined by calculating the measured diameter [11].
Tunnels are an important infrastructure facility. Through mountains, under water, and bypassing obstacles, they provide time-efficient connections for passenger and freight traffic (Figure 3 left). Tunnels are constantly stressed by the environment and human uses. Water ingress and structural deformations have a significant impact on safety. Inspections must be carried out regularly to evaluate the condition of the structure. The purpose of recording the clearance is to record the free area above and next to the tracks in order to carry out a collision test with objects such as vegetation (Figure 3 right).

2.3. Sensor Systems

There are several different mobile and stationary optical measuring systems in the railway sector. We name various suppliers of measuring systems and briefly explain the methodology and parameters, if available. Table 1 provides an overview of the various optical measurement systems on the market and their areas of application with regard to the objects to be examined. A more detailed explanation follows in the individual sections.

2.3.1. Sleepers

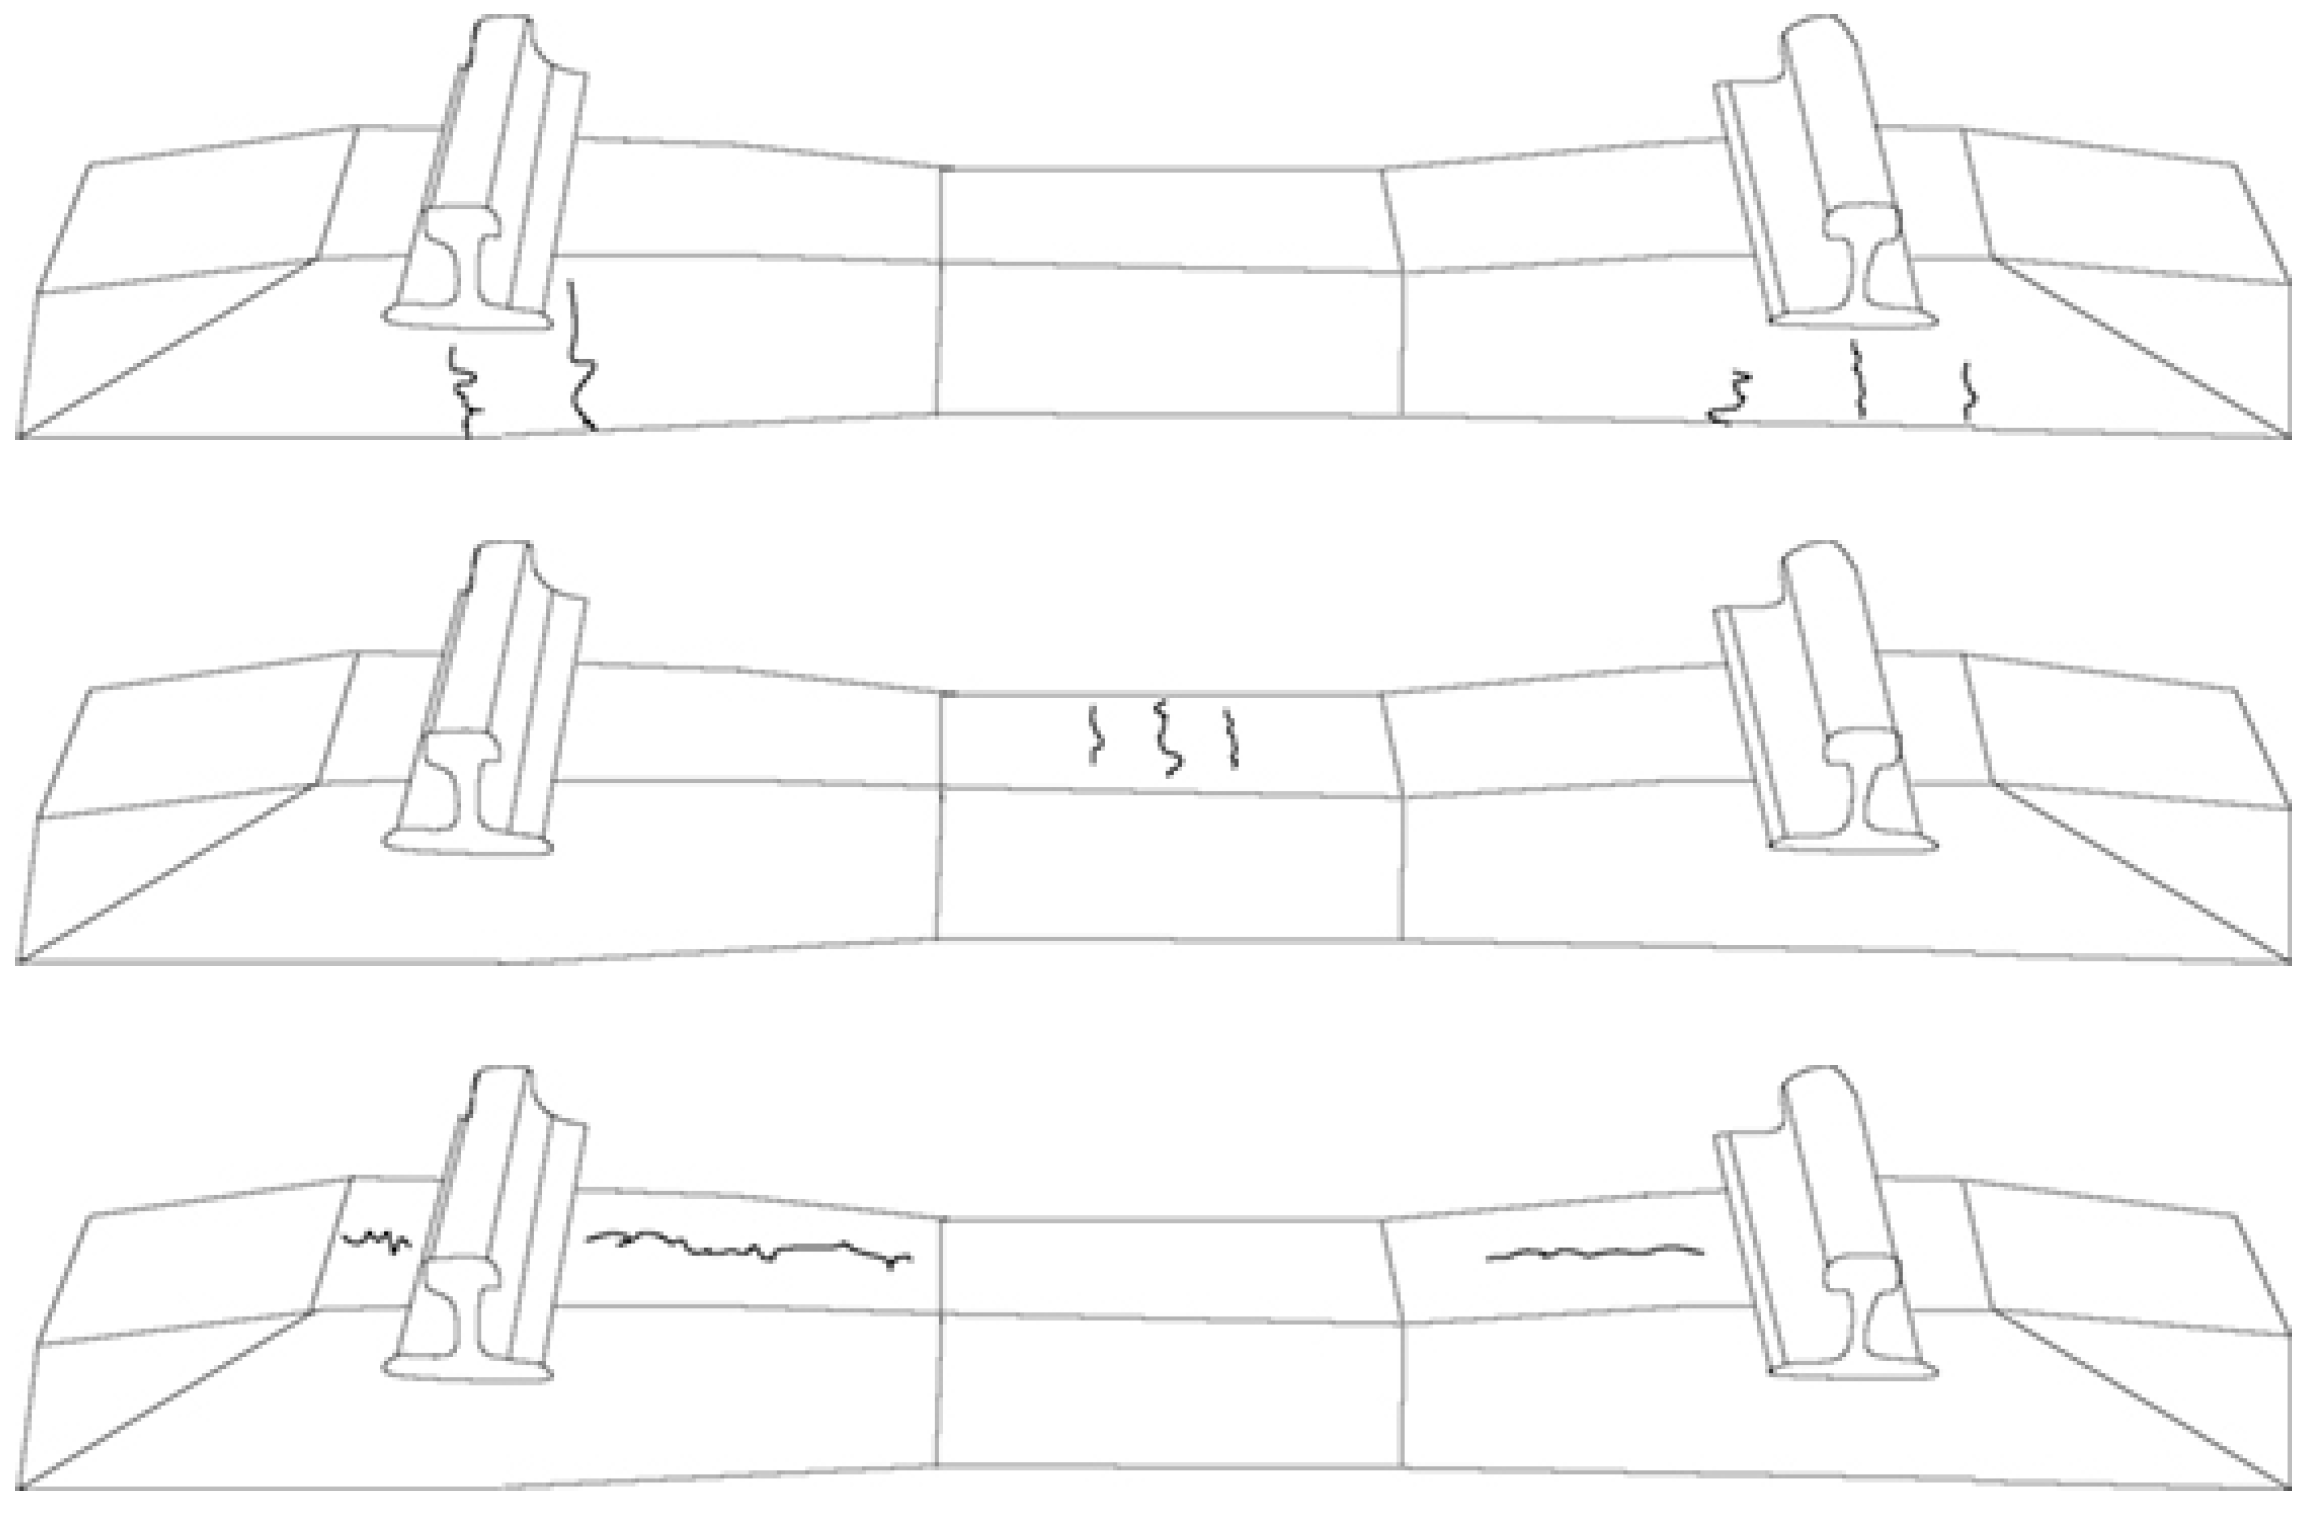
According to worldwide studies, the main causes of concrete sleeper failure are rail seat deterioration and installation and tamping damage. The top five causes of failure are tamping damage, cracking from center binding, cracking from environmental or chemical degradation, cracking due to dynamic loads, and wear or fatigue of the shoulder/fastening system. [15] The main types of cracks of concrete sleepers are given in Figure 4 [50].
Visual inspection is still the most common assessment method for railway sleepers [51]. New developments are moving toward so-called smart sleepers. Here, measurement sensors are built into or onto the sleeper. The limitations of using smart sleepers include their production costs and the limited data on long-term performance, which can be incompatible with the lifetime of the sleeper. An overview is given in [52]. bvSys have developed a camera system for checking for cracks in concrete sleepers or roadways [20]. Four line-scan cameras, mounted underneath the vehicle, record the sleepers at speeds of up to 100 km/h with the aid of LED lighting. Cracks with a width of 0.5 mm or more are detected automatically. The manufacturer specifies a resolution of 0.5 × 0.5 mm. Other systems are based on recording the entire railway track. A distinction can be made between the inspection of the track geometry and the inspection of rail defects [53]. The determination of track geometry features includes the track gauge, cross slope/cant, longitudinal plane, alignment, and twist [54]. The V-Cube measuring system from MERMEC is designed to detect 50 different types of defects in sleepers, ballast, and fastenings and to perform rolling surface analysis [21]. The data are captured by means of images that are analyzed using algorithms and a model-based approach.
A disadvantage of the purely optical examination of the sleepers lies in the limitation of the visible areas. Only the area that is not covered by the ballast, track, or fastenings can be recorded. No statements can be made about the depth of the cracks, nor whether there are changes over time as there are usually no comparisons over several measurements due to the lack of localization.

2.3.2. Track

Damage that occurs can be divided into three large groups. Defects during manufacture (tache ovale or kidney defect); damage due to improper handling, installation, or use (e.g., wheel burn due to spinning wheels); and damage due to exhaustion (e.g., head cracks and squat defects) [55].
For track geometry, MERMEC offers a measuring system that successfully deliver all critical rail geometry parameters (track gauge, cross level/cant, twist, alignment and longitudinal level, mid-chord offset, and optional parameters) at speeds of up to 400 km/h [22]. Unfortunately, there is no information on the achievable accuracy or resolution. With SOKOL, TVEMA offers a measuring system for recording track geometry up to a speed of 250 km/h. This speed can be achieved by combining optical triangulation and inertial measurement [24]. The TRACK-V2 from SelectraVision also works without contact and measures both the profile and the wear of the track [25]. Fraunhofer IPM offers a measuring system based on cameras and line-lasers. The sensors are arranged transverse to the direction of travel, are permanently mounted on the vehicle frame, and detect the track geometry based on laser light-section technique (see Figure 5). Depending on the design of the system and its distance from the track; sub-millimeter accuracy can be achieved with this system [23].
In general, it is important to pay attention to which parameters are recorded in detail. The specifications vary considerably from provider to provider. Here, too, only superficial or geometric deviations can be detected. Faults within the track are not detected. Mounting underneath the vehicle can lead to soiling of the camera openings. These must be cleaned regularly in order to capture usable images. Depending on the manufacturer, different automatic cleaning variants are available.

2.3.3. Vegetation

For the detection of vegetation, bvSys has developed an inspection system that inspects the entire track area at speeds of up to 100 km/h. The area is recorded using four digital color line-scan cameras, lenses with fixed focal lengths and artificial lighting. The evaluation is carried out online and automatically. Linking with a spraying system is possible [26]. Fraunhofer IPM has developed a Weed Detection System (WDS) for the detection of vegetation at speeds of up to 100 km/h. The system works with RGB and NIR cameras. Due to the characteristic fingerprint of green vegetation, it is automatically detected. Thanks to artificial lighting, the system can also work at night. When combined with a spray nozzle, speeds of up to 50 km/h can be achieved [27]. The use of this measurement technology can significantly reduce the consumption of herbicides [56].
Geometric accuracy is not a particular challenge with these systems. Instead, attention must be paid to the required speed of image processing, signal evaluation, and signal forwarding to the existing technology for applying the herbicide [56]. The disadvantage is the dependence on sufficient ambient light or additional lighting.

2.3.4. Pantographs

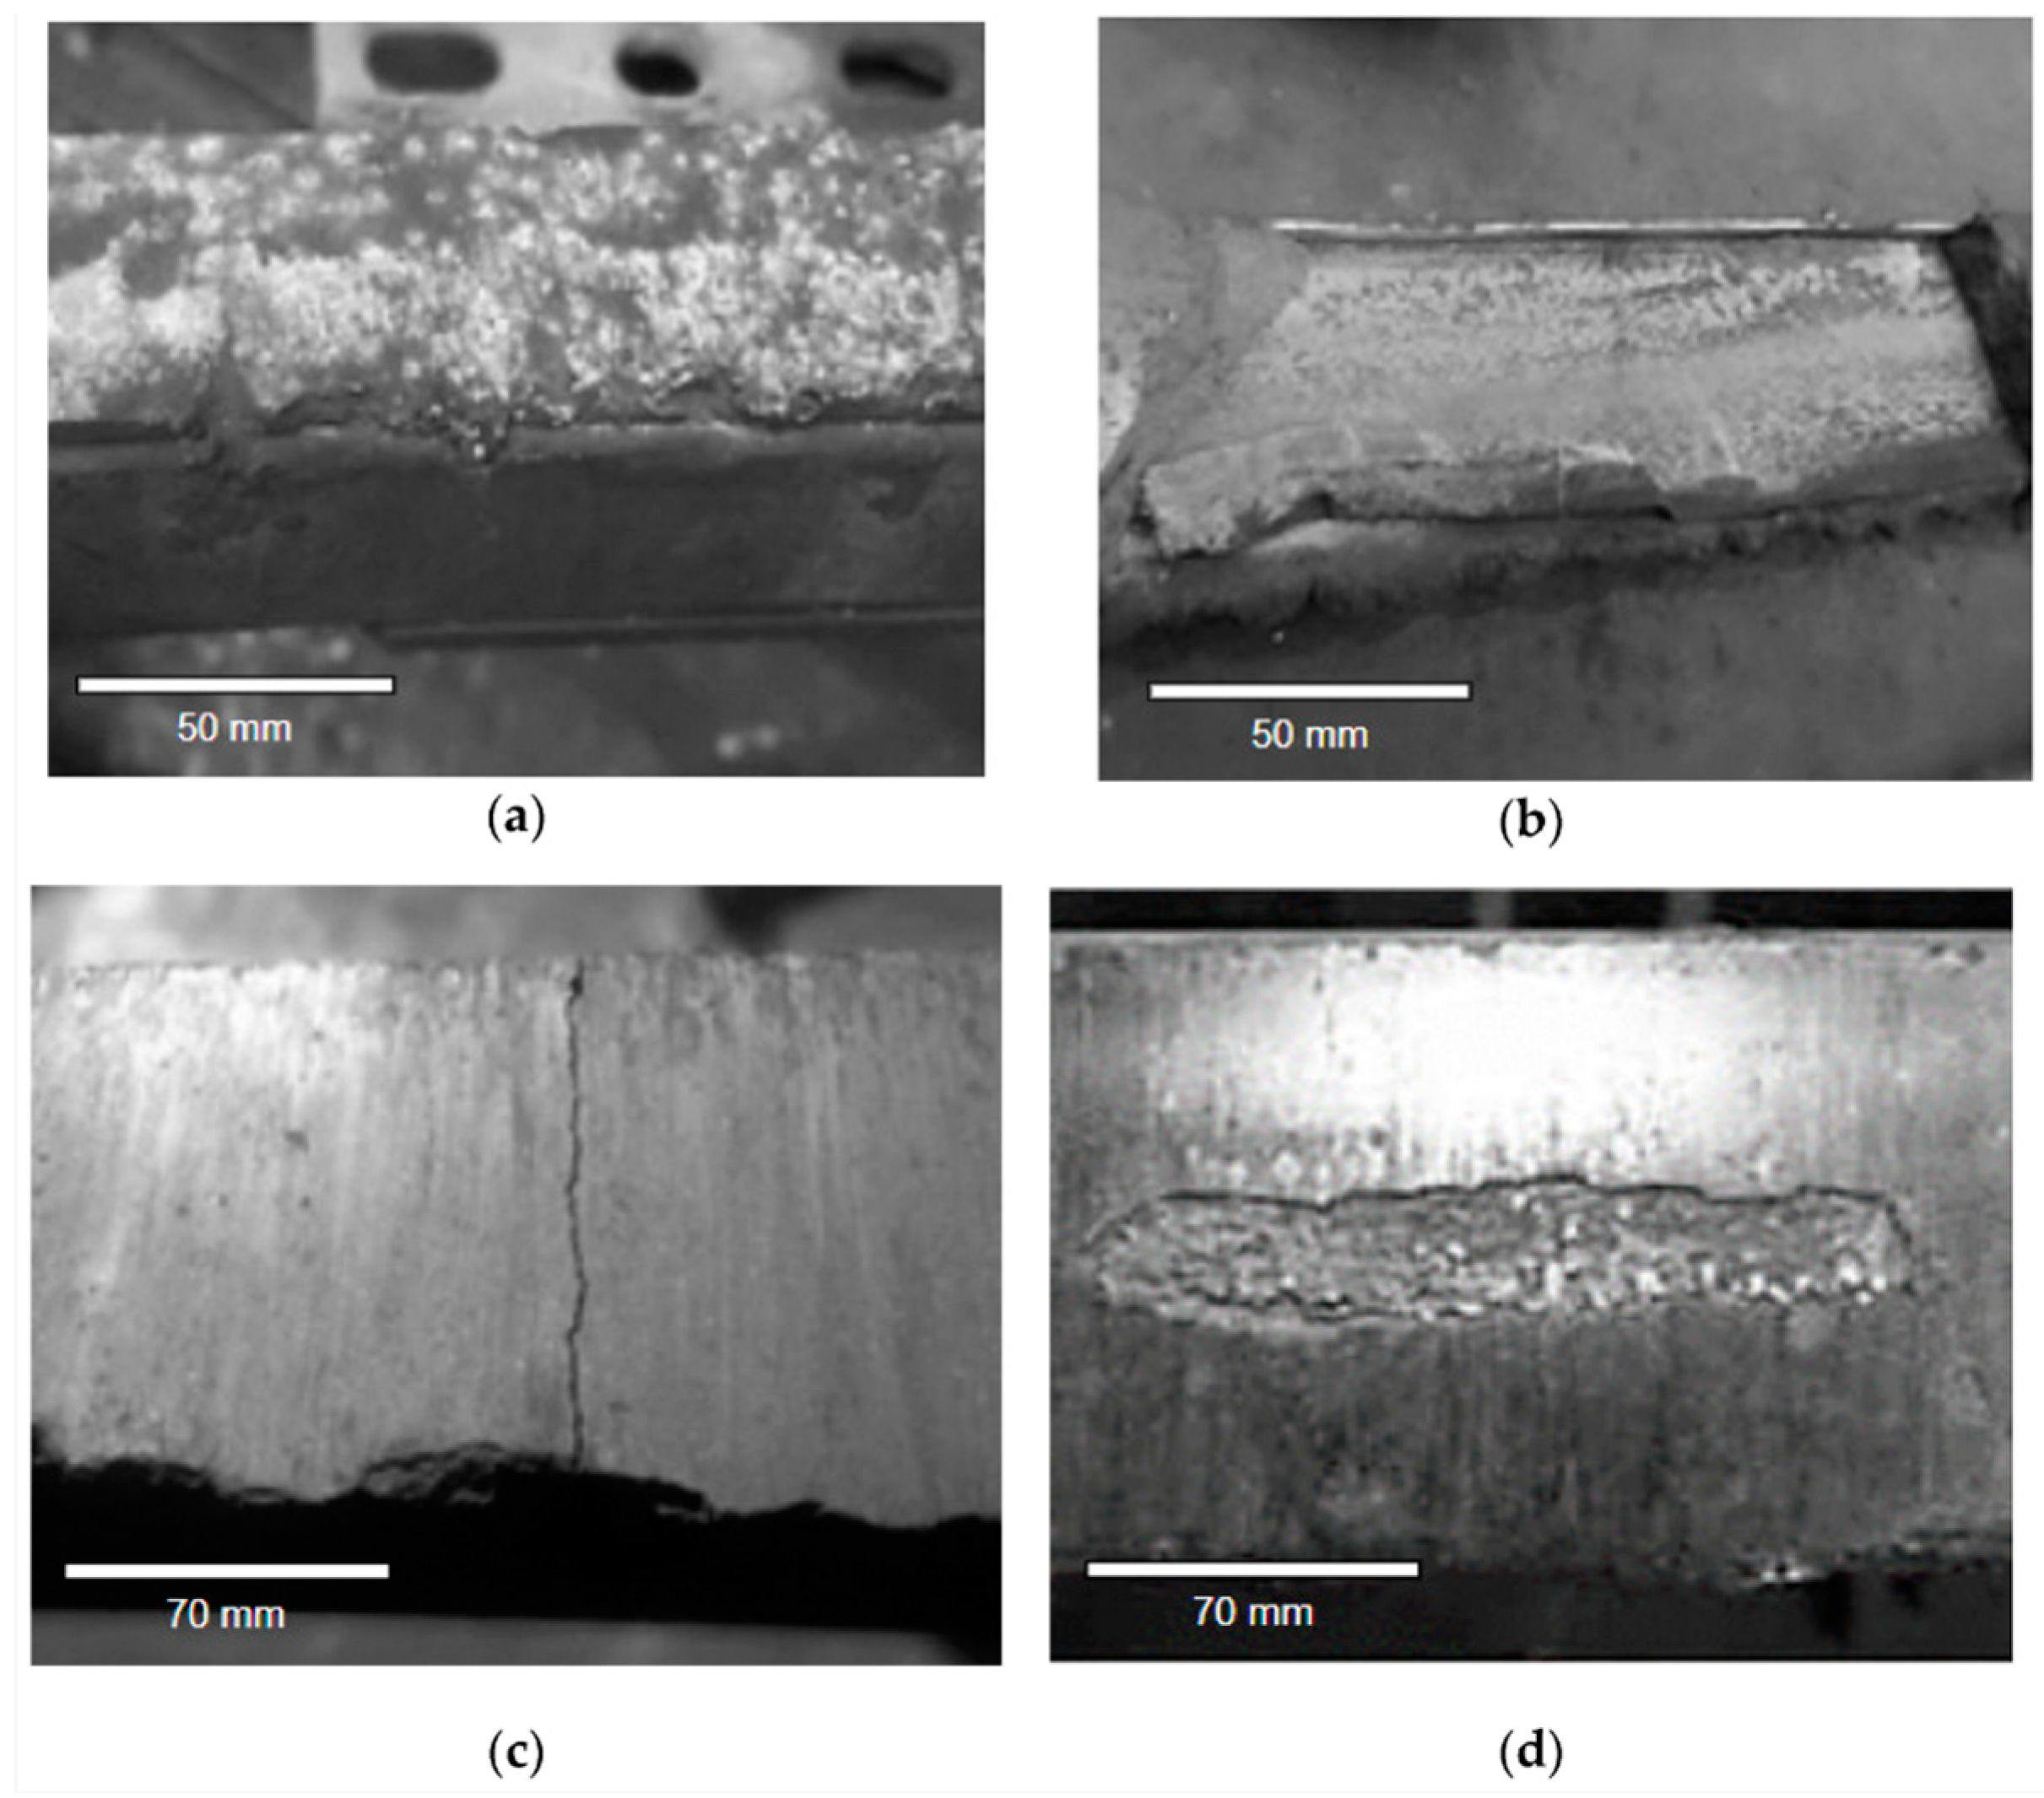
The most common damage to pantograph is abnormal wear and cracking. These often occur in combination. Abnormal wear increases the replacement interval of the graphite strips and leads to defects such as eccentric wear, marginal wear, crack chipping, strip burns, concave wear, and arc erosion (Figure 6). Studies have shown that cracks in the pantograph significantly increase the wear rate [57].
SelectraVision offers a measuring system to check pantographs. Cameras and laser systems attached to masts or other infrastructures are used. The aim is to check geometry, wear, tension and temperature, for instance. Unfortunately, the supplier does not provide any technical information [28]. In [58], a thermal imaging camera is used to detect electrical arc discharges caused by the interaction between the current collector and the OCL.
When installed outdoors, the camera- and laser-based system is dependent on the ambient lighting and weather conditions (except in the case of artificial lighting). Dirt on the system must be removed manually or an automatic system must be installed. The positioning of the carrier vehicle, including the pantograph, will never be exactly in the same place, which must be considered when aligning and calibrating or focusing in order to obtain sharp images without underexposure or overexposure. The accuracies here will also depend on the distance of the system to the pantograph and the sensor technology used.
Figure 6. Damages failure of the contact strip of the pantograph. (a) Material melting as a result of arcing; (b) detachment of a piece of carbon strip; (c) crack of a strip; and (d) the top layer of the strip is peeling off [59].
Applsci 14 08801 g006

2.3.5. Contact Wire

Typical faults in contact wires are wear and tear (caused by constant contact with the pantograph), excessive sag, corrosion of metallic parts of the contact wire, incorrect alignment, damage caused by weather, and environmental influences and soiling.
To counteract contact wire failure, various measuring systems for the regular inspection of height and stagger have proven themselves in practice. To determine positions, bvSys has installed digital line-scan cameras with a laser-based lighting unit on the roof of the measuring train. At speeds of up to 120 km/h, graphic data of the overhead line is continuously collected [29]. The evaluation is performed in the post-process. A triangulation method is used to determine the wear of the contact wire. A cross-sectional plane is generated and recorded using a camera and a laser. At a speed of 200 km/h of the carrier vehicle, the contact wire thickness can be determined [30]. At a speed of up to 320 km/h, the MERMEC system uses laser scanners and high-resolution cameras to record up to eight contact wires and determine their position and residual thickness [31]. SelectraVision has two systems for use on vehicles. CAT-V can measure height and stagger using a laser scanner mounted on the roof. Cameras can also be optionally installed in the system [32]. The CAT-VW can also determine wear, which achieves a resolution of 5 mm at 320 km/h [60]. With its Contact Wire Recording System (CRS), Fraunhofer IPM offers a sensor system that uses a laser scanner to determine the position of up to eight wires. Depending on the reflection and the distance of the system to the wire, an accuracy of 5 mm can be achieved [34]. The Wire Wear Monitoring System (WWS) uses cameras to determine the degree of wear. The uncertainty is described with ± 0.3 mm to 0.5 mm (mainly determined by the degree of wear) [35]. Both systems are part of the Contact Wire Inspection System (CIS) (Figure 7) and can be used for measurements up to a speed of 250 km/h independent of ambient light [33]. The system is also available in a slower version [61].
Due to the different heights of the contact wire along a route, the camera-based systems have to adjust their focus, which is why it is essential to determine the relevant distance. Different ambient lighting can also lead to overexposure of the images, which makes it difficult to evaluate the degree of wear. Contamination of the wire can also lead to incorrect determination of the residual thickness.

2.3.6. Pole

The pole detection serves to give orientation during maintenance. For example, a defective part of the OCS can be georeferenced by the two adjacent poles, even if no GNSS (Global Navigation Satellite System) signal is available. The poles are usually detected from the point clouds using various algorithms [62,63]. However, there are also measuring systems that have been specially developed for this task. The measuring system from MERMEC consists of two laser distance-measuring systems mounted on the roof that are aligned vertically upwards. If both detection units register an object at the same time, then it is stored as a pole. The system works up to a speed of 320 km/h of the carrier vehicle [36]. The Laser Pole Detection System (LPS) by Fraunhofer IPM is based on the same measuring principle. Its range is up to 4 m at 62,000 measurements per second. It can be used successfully at speeds 5–260 km/h, but at less than 5 km/h the laser switches off for eye protection [37]. The LPS is also available as part of the Contact Wire Inspection System (CIS) (Figure 7).

2.3.7. Tunnel

Permanent monitoring and evaluation of the structural characteristics are of crucial importance for the service life of the tunnel and for safety during operation. Tunnel closures must be avoided and at the same time the data must be recorded without gaps and with the necessary accuracy. Optical sensors can be used here to enable non-destructive inspections. The current trend is toward comprehensive 3D recording of tunnel surfaces with specific measurement and mapping of prominent damage such as cracks. Here, too, there are different realization approaches. Laser measurements are used most frequently, but combinations with photogrammetric measurements are also used. Dibit Measuring Technique offers a photogrammetric measurement system that allows optional combination with a line-scan laser [38]. During continuous movement, the system records the tunnel surface at 360 degrees. The high-speed cameras provide the texture of the tunnel structures at a range of up to 30 m. An absolute accuracy of about 5 mm and a geometric resolution of 1 mm is achieved. This allows the possibility of detecting cracks up to 0.3 mm in width [64]. With its T-Sight 200, MERMEC offers a system with a rotating laser mirror that scans 360° transverse profiles. The measuring range is specified as 0.5 to 25 m [39]. The Laser Tunnel Scanning System (LTSS) from Pavemetrics uses six laser scanners to acquire 2D images and high-resolution 3D profiles of tunnel linings at a range of up to 12 m, with 1 mm longitudinal scanning interval at speeds of up to 110 km/h. The manufacturer specifies a vertical accuracy of 0.25 mm [40]. TVEMA also combines up to six high-speed laser scanners to achieve minimum distances (0.05 m) between the profiles even at speeds of up to 320 km/h [41]. The Tunnel Inspection System (TIS) from Fraunhofer IPM uses two laser beams with different wavelengths to provide moisture content in addition to 3D information [65]. The system works with a relative measuring accuracy of 1 to 5 mm at a measuring rate of 2 MHz. Approximately 350° of the surroundings are detected with a range of up to 10 m [42].
Fraunhofer IPM is currently developing a system for the contactless detection of cavities behind tunnel surfaces using laser technology. This innovative system leverages advanced laser scanning techniques to identify and map hidden cavities and irregularities without the need for physical contact with the tunnel structure. The use of laser technology allows for high precision and accuracy in detecting these anomalies, which is crucial for maintaining the structural integrity and safety of tunnels. This system represents a significant advancement in non-destructive testing methods and it is expected to greatly enhance the ability to conduct thorough and reliable tunnel inspections [65,66].

2.3.8. Clearance

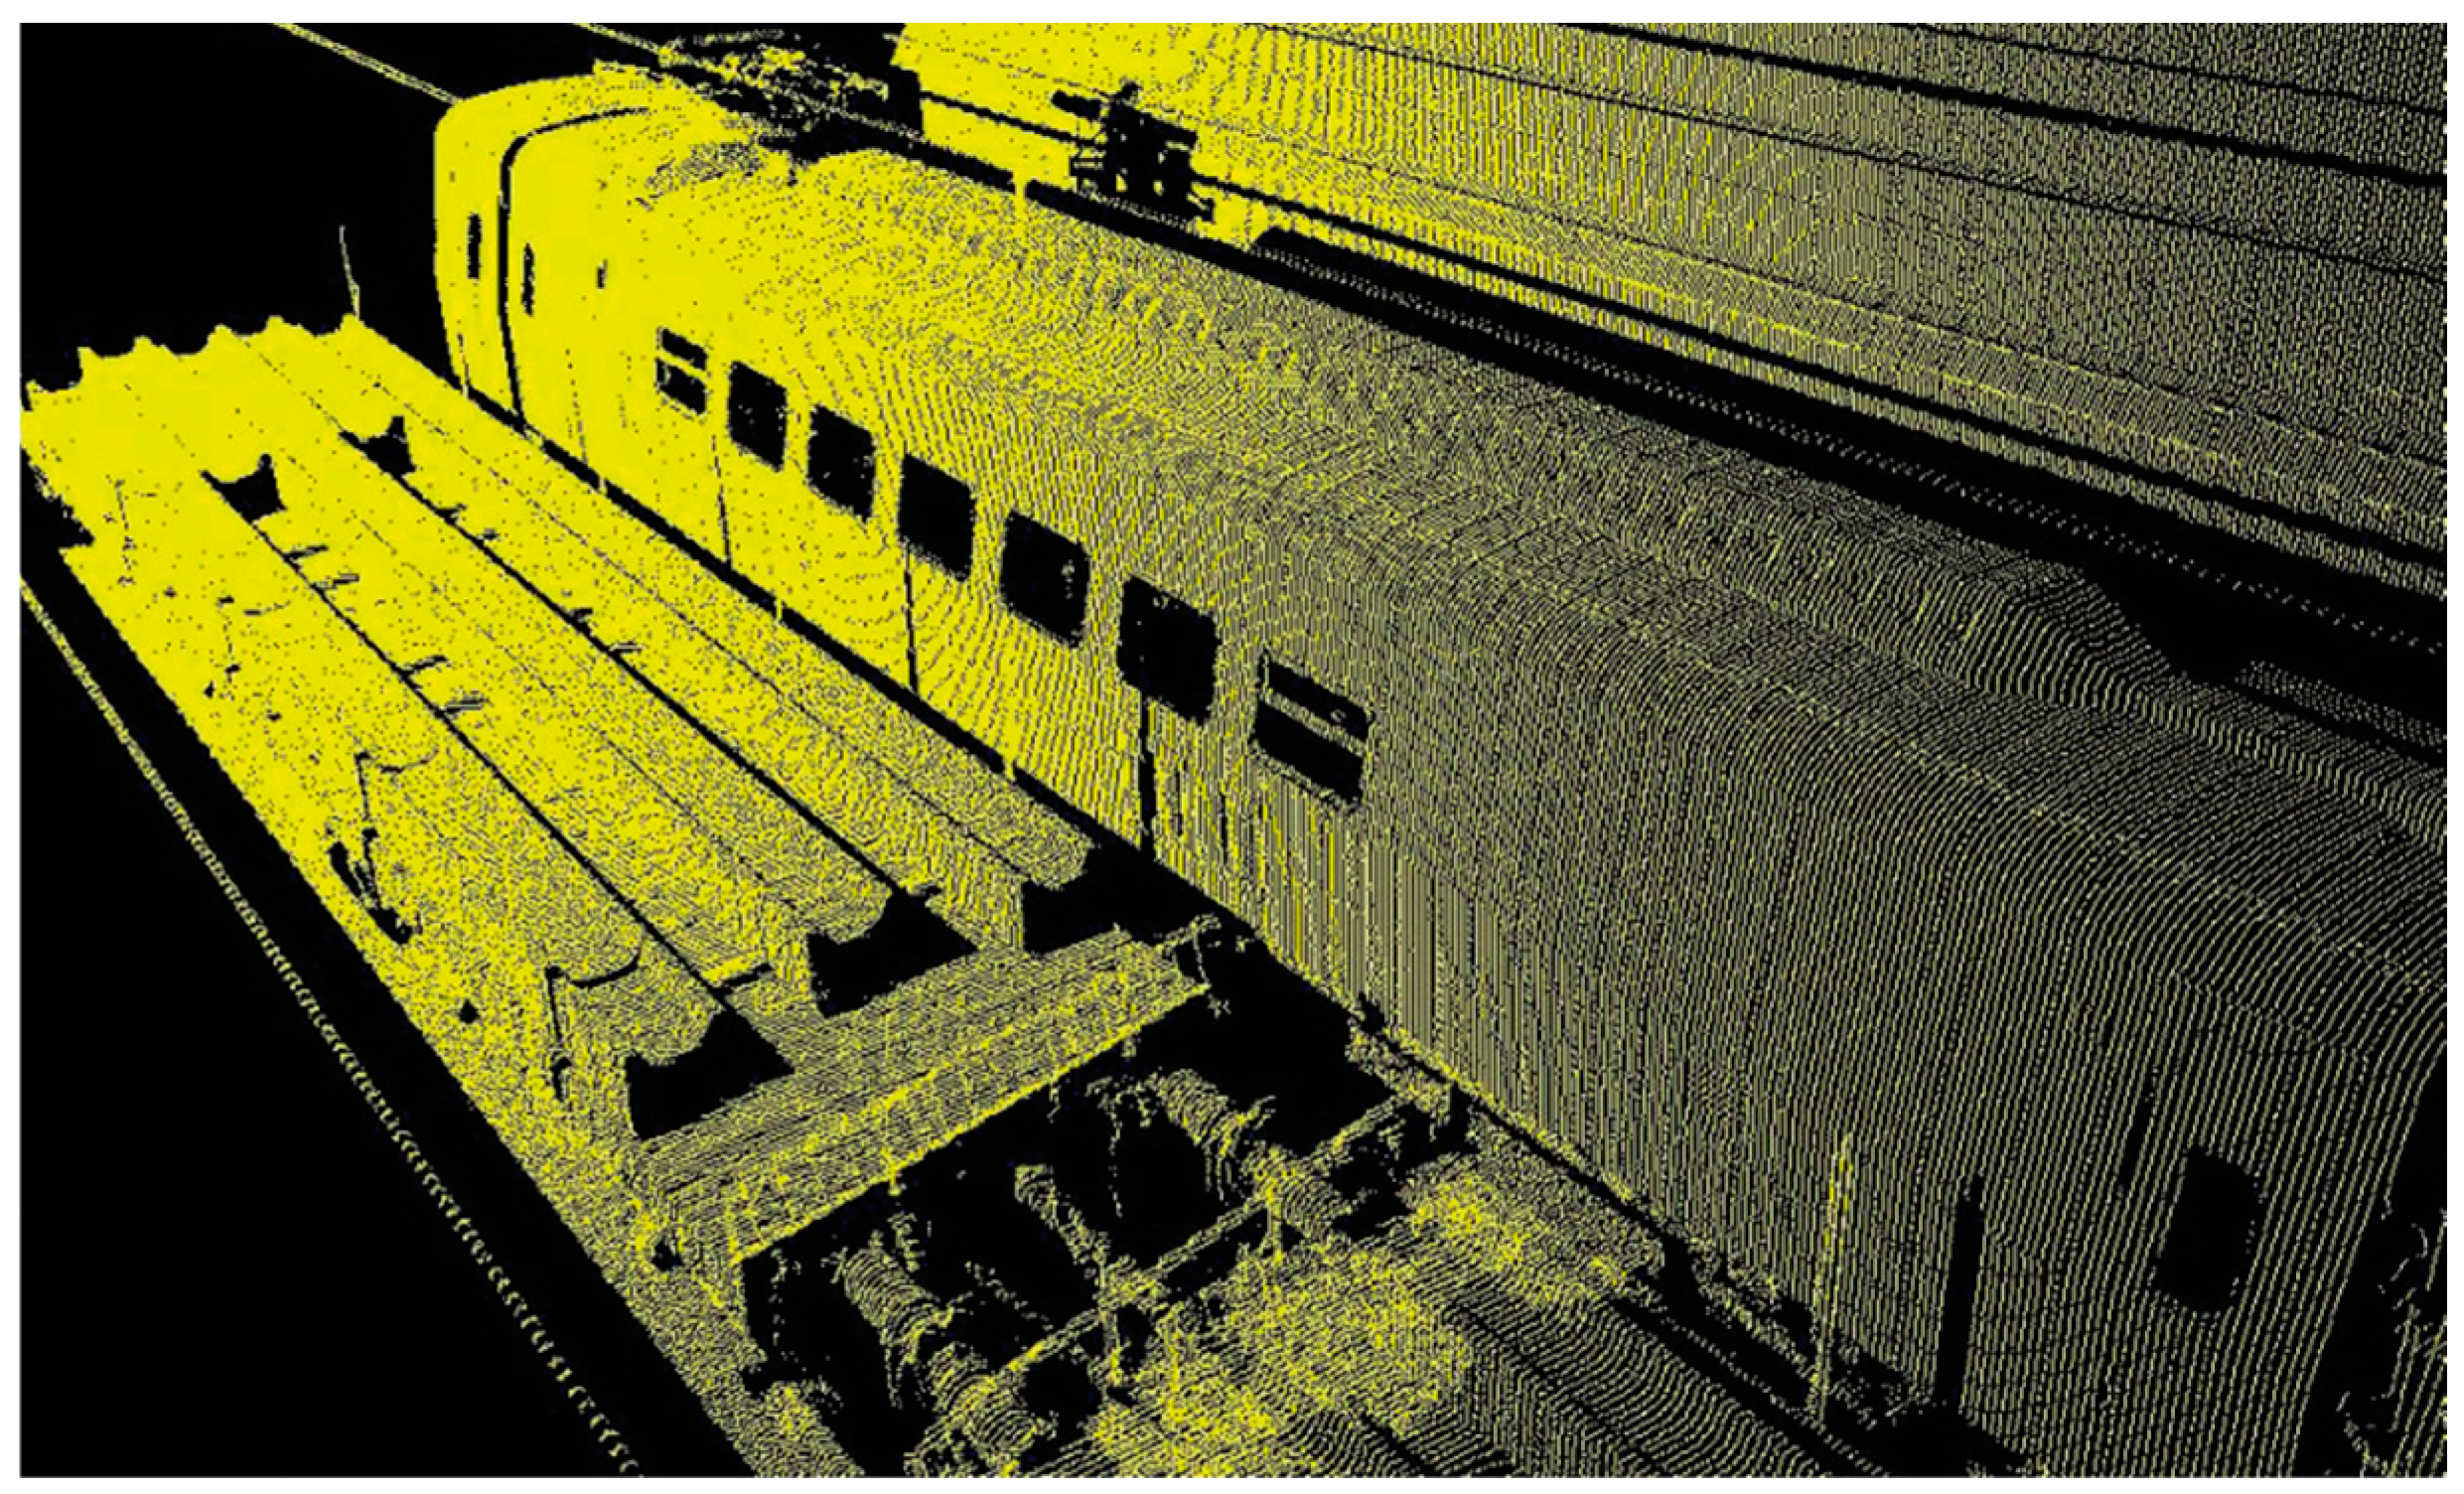
The measurement of the clearance is similar to the survey of tunnel structures. This involves measuring the clear space in order to keep the area free of obstacles and objects. It describes the vertical transverse plane of a track. MERMEC and TVEMA use the same measuring systems for both applications. Fraunhofer IPM offers additional measuring systems designed for clearance surveying. For example, two High-Speed Profilers (HSP) are installed on the LIMEZ III measurement train of Deutsche Bahn (see Figure 8), which can capture up to 1110 profiles per second. At a train speed of 100 km/h, this results in a profile distance of 25 mm [7,43]. At the present time, the measurement technology is being converted to a new measurement train (Gleismesstriebzug GMTZ) with simultaneous maintenance and updating of the infrastructure components of the measurement technology. The use of the data for Building Information Modeling (BIM) and infrastructure data acquisition will play an important role in the future.
The Clearance Profile Scanner (CPS) from Fraunhofer IPM can detect up to 200 profiles per second [67]. At a vehicle speed of 50 km/h, this results in a profile distance of 70 mm, with more points per profile. The distance resolution is specified with 1 mm and uncertainty at an object is specified with about 3–7 mm. RIEGL offers the VMX-RAIL, a mobile laser scanner system developed for track and clearance surveying [44]. Three scanners with different orientations are combined. The system can record 750 profiles per second and is specified by the manufacturer for speeds up to 130 km/h. Optionally, six cameras can be installed with the system. The accuracy is specified with 5 mm and the resolution is specified with 3 mm at a 30 m range under RIEGL test conditions [44]. Zoller + Fröhlich offers laser scanner specially for railway applications like clearance measurements. These scanners operate accurately at speeds up to 120 km/h [45]. The resolution of the range is specified as 0.1 mm with a range noise of 0.5 mm (Z + F PROFILER® 9012, Zoller & Fröhlich GmbH, Wangen im Allgäu, Germany).

2.3.9. Wheels

Wheels are an essential component of the railroad system. Various defects such as cracks, fatigue, scaling, spalling, flat spots, cavities, and indentations can occur [68]. Some damage types are shown in Figure 9. Repeated monitoring of these signs of degradation is therefore important in order to counteract the risk of failure. Laser scanners and cameras are frequently used here as sensors. Ref. [69] shows the combined use of laser profile measurements and evaluation using machine vision. Overall, the combination of different sensors and evaluation using AI has improved the detection of surface defects. The W-Inspect system from MERMEC uses high-resolution cameras and ad hoc lighting for automated inspection. The surface of the wheel is inspected while the train is moving [46]. SelectraVision’s laser and camera-based system inspects train wheels up to a driving speed of 150 km/h. The system is locally installed and able to measure the profile of a wheel with an accuracy of 0.5 mm [47]. A complete overview of wheel testing is given in [70].
By using camera sensors, it is also possible to detect defects without thickness or depth. Laser-based systems, on the other hand, make it possible to detect surface wear. The use of AI can support the automation of detection here, see also Figure 14 [69]. Wayside camera/laser systems (except when they are permanently installed) have a clear advantage over other counterparts as strain gauges because they can be relocated. However, these systems need proper calibration before functioning [70]. Changing light conditions represent a major challenge. Reflections, shadows, and motion blur make detection difficult.

2.3.10. Rolling Stock

In so-called train-monitoring portals, the measuring sensors are permanently installed, and the moving train passes through the portal. Swiss Federal Railways SBB uses a combination of cameras and laser scanners to compare the measured train profile with a reference profile. This is intended to identify incorrectly loaded or defective vehicles, to avoid collisions with the railroad infrastructure and when trains are passing each other, and to prevent fires and damage to property caused by contact with overhead wires [72]. For example, an incorrect inclination of the wagons can affect the stability of the train and increase the risk of derailment, or an insufficient twisting of the wagons can lead to poor curving and impair safety. One laser scanner designed for this task is the Sector Profile Scanner (SPS) from Fraunhofer IPM [49]. The SPS was developed and implemented according to the requirements and specifications of Ansaldo STS S.p.A. (now Hitachi Rail STS). A total of four of these scanners are combined to form a portal and can therefore detect the entire train as it passes (see Figure 10). At a train speed of 360 km/h, the High Profile Density (HPD) setup provides 900 data points per profile at 3200 profiles per second, giving a density of 32 profiles per meter and a distance uncertainty of about 10 mm at a range of 10 m. Ref. [48] mentions a successful detection of the train profile at 330 km/h without specifying a point density or accuracy.
The great advantage of these systems is that the train can pass through the portal at relatively fast speeds. The portals mentioned here are limited to detecting the upper part of the train and do not detect the underside. Due to the characteristics of laser scanners, reflective surfaces are difficult or impossible to detect. Weather dependency due to the unprotected outdoor installation also influences the measurement quality. A permanent power supply must be provided.

3. Robotic and Autonomous Inspection

Robotic and Autonomous Systems (RAS) are also used for inspection and maintenance. They impress with their high levels of safety and efficiency and are mainly used for rolling stock or railway track maintenance [73,74]. These systems can be equipped with diverse sensor technology and thus perform a wide variety of tasks. Of course, this also includes optical sensors, primarily cameras, and laser systems.
Unmanned Ground Vehicle (UGV) and walking vehicles are vehicles that operate without a human on board. There are many different designs for this kind of carrier platform. These can operate completely autonomously but are often controlled remotely. An example would be ANYmal, which is used for the inspection of rail vehicles as it can easily move under trains and in cabins [75]. Felix [76], Railpod [77] and RIIS1005 [78] are just a few robots developed for use on railroad infrastructures. They were developed to fully automate the data quality of switches and crossings and track inspections. West Japan Railways has unveiled a “humanoid robot” to work on heavy machinery on its lines [79]. The prototype does not work autonomously but is controlled from a cockpit by a human. Its task is to help with the maintenance of the equipment. This is intended to increase safety for workers. Ref. [80] shows the use of an autonomous robot to inspect dangerous areas, for example railway tracks after a rockfall. It moves along the wires on the overhead line masts to check the condition of the tracks. Several of these robots can hang on steel cables at the same time and are independent of the weather; only the sensors used are affected by the weather.
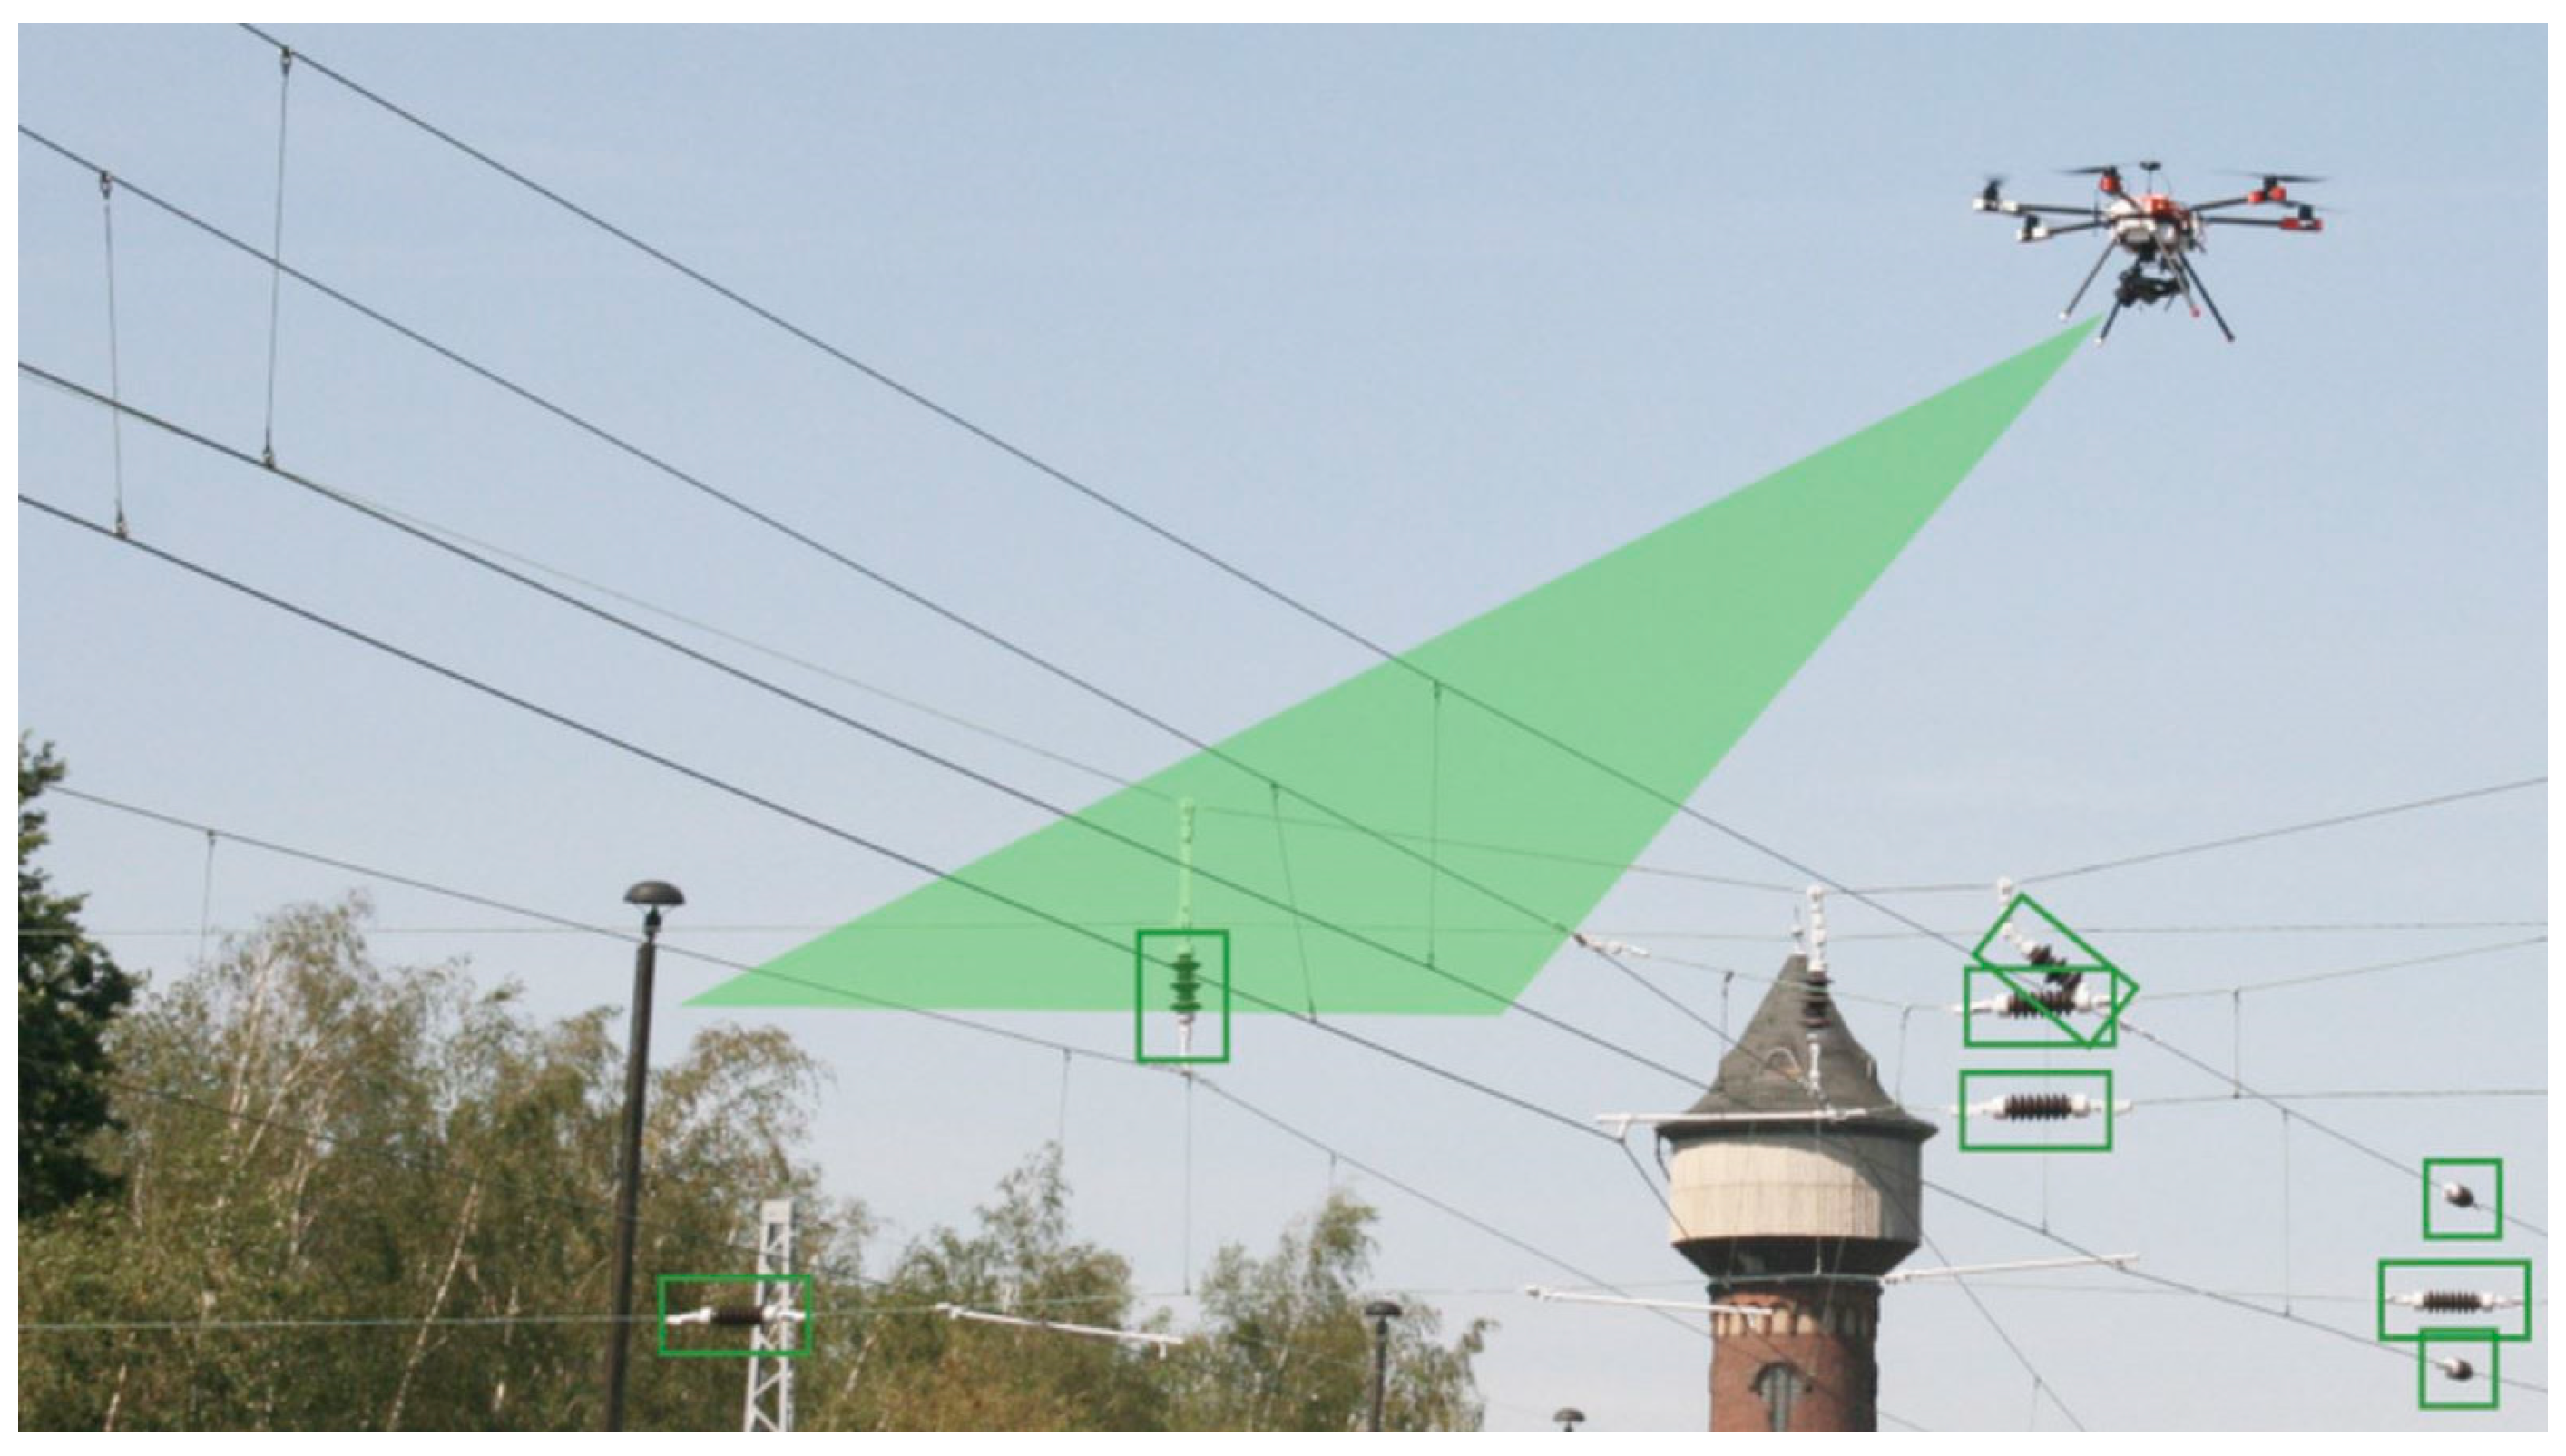
The Unmanned Aerial Vehicle (UAV) is a flight platform in which various sensors can be integrated. It is externally controlled but can also fly autonomously. UAVs are easy to operate and are able to fly and cover large areas quickly. There is no need to enter the danger zone of the track. The disadvantages are its limited battery life and loading capacity, dependency on good weather conditions, and risk of dropping [81]. Nordic Unmanned ASA offers an UAV specialized for track/catenary/infrastructure inspection, surveillance, and safety [82]. The UAV is combined with an UGV. Ref. [83] uses a UAV equipped with cameras to inspect railway catenary. Insulators are automatically detected using the image data and AI. Insulators were identified from a distance of 20 m in such a way that the condition of the insulator is recognizable (Figure 11). Fraunhofer IPM is working on the autonomous inspection of infrastructure (in this case bridges) using optical sensors. Both UAVs and UGVs are used. The systems use cameras and laser scanners and employ computer-assisted evaluation and analysis processes using machine learning and artificial intelligence [84,85,86].
An overview of fields of application for robotic and autonomous inspection systems can be found in [81,87].

4. Data Analysis and Evaluation by AI

Many of the measurement systems presented here generate large amounts of data, such as point clouds in clearance measurement and images from measurement cameras. These need to be evaluated quickly and comprehensively. Automated analysis of the inspection data can reduce the time required and the use of human resources. Machine learning algorithms can be applied to reduce the time and cost of detecting defects or anomalies.
In recent years, the evaluation and analysis techniques have also proven to be effective in the field of artificial intelligence (AI) in connection with the rail industry. AI is defined as a computerized system that is capable of performing physical tasks and cognitive functions, solving various problems or making decisions without explicit human instruction [88]. Ref. [89] shows that AI research in rail infrastructure is mainly concerned with the track system (77%); civil structures (14%), substructures (5%) and catenary system (4%) receive less attention. However, papers from the areas of railway signaling technology, rolling stock, and operations were excluded in this research.
AI can be used to solve various clearly defined tasks. Classification and segmentation involve the task of distinguishing between different defects or objects, with segmentation assigning the optical data of the point cloud or image to an object class.
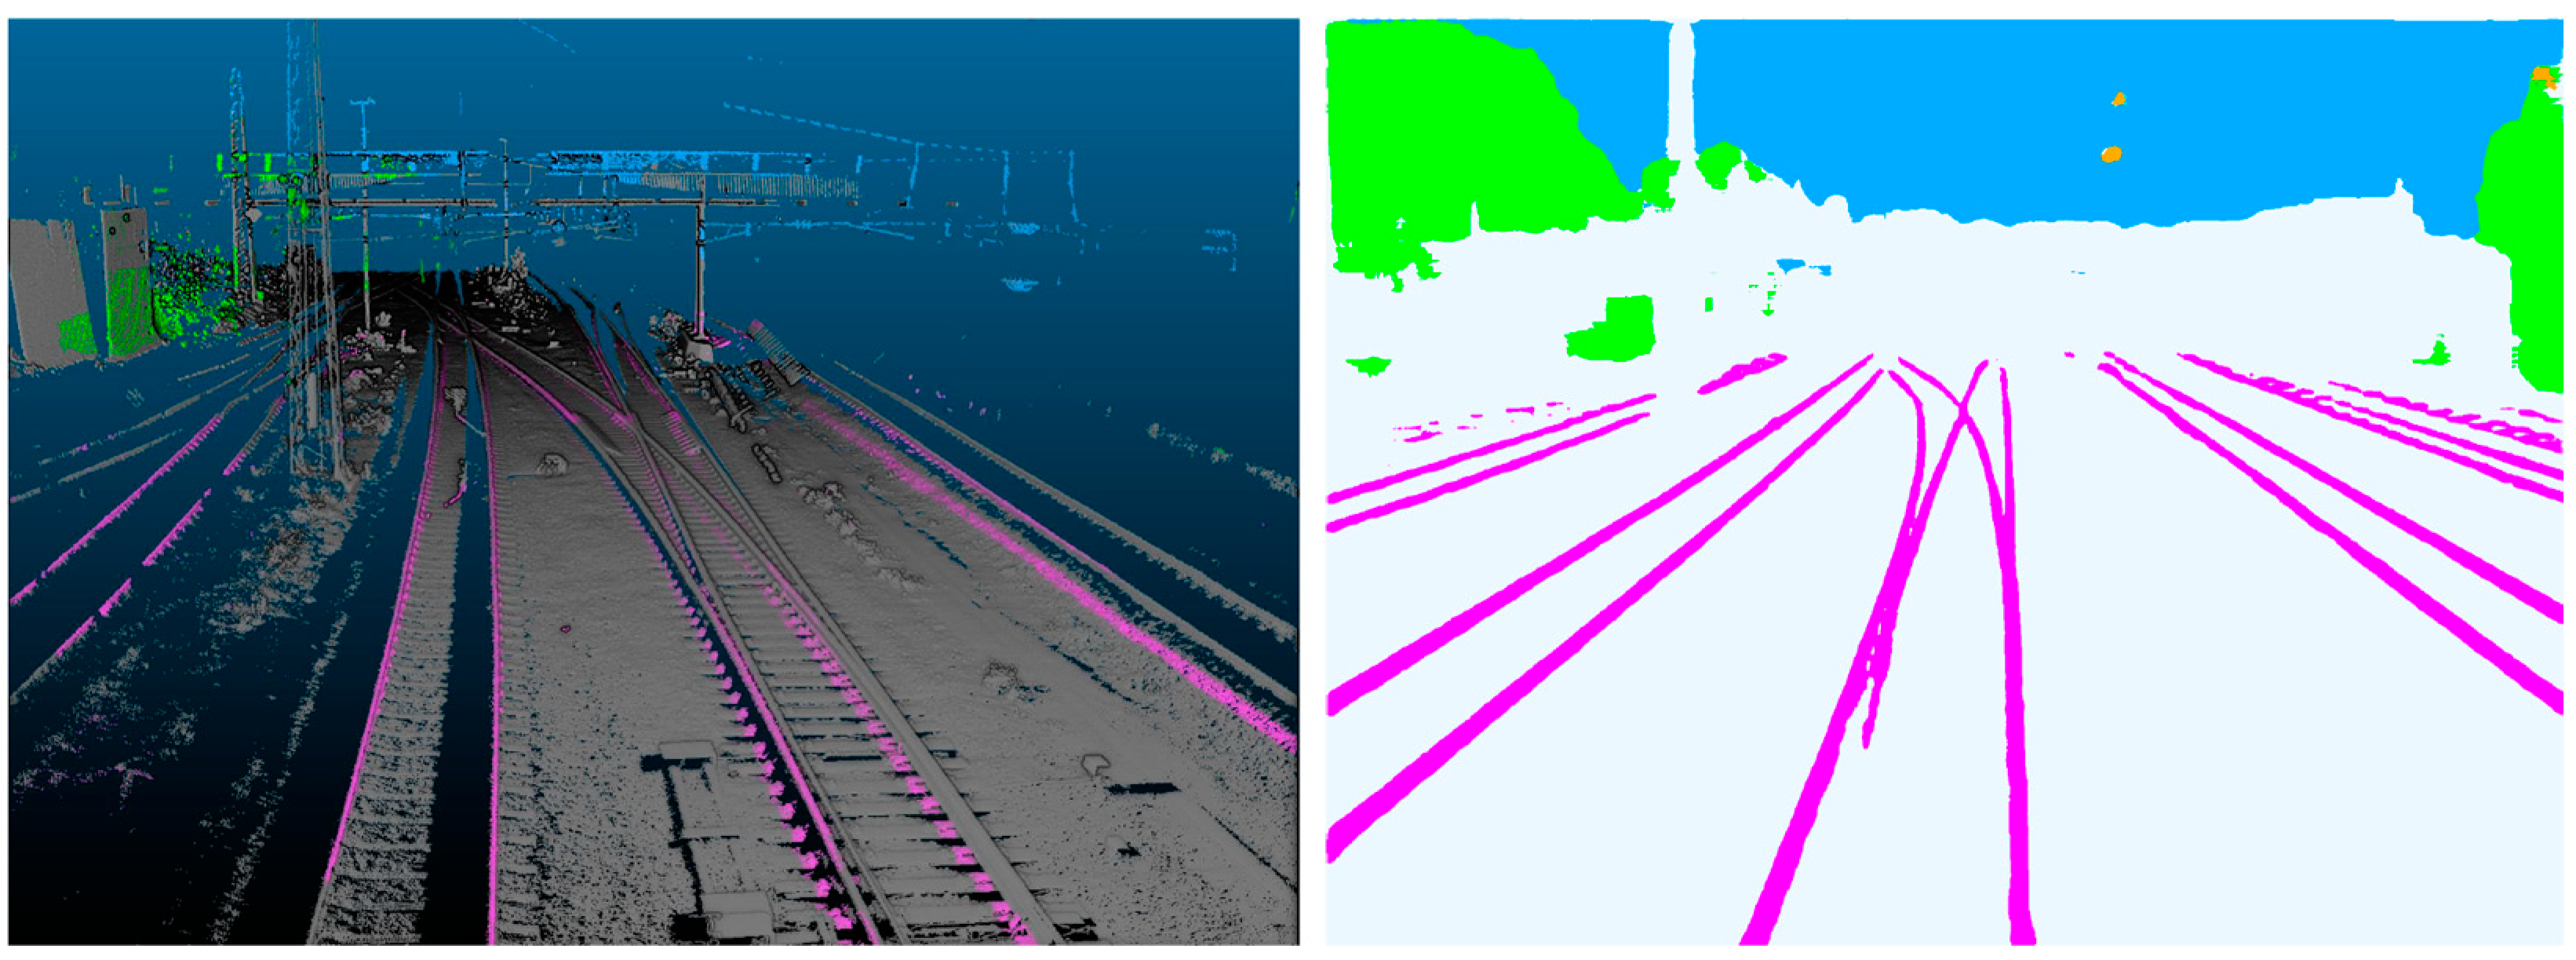
Even major rail operators have already investigated the benefits of AI in their sector. For example, SIGNON (https://signon-group.com/ (accessed on 12 September 2024)), a fully owned subsidiary of Deutsche Bahn AG, has developed a neural network for recognizing infrastructure elements based on image data. Objects such as boundary signs, catenary masts, signals, and signs are recognized. Using data from Deutsche Bahn AG’s LIMEZ III measurement train in 2020, Fraunhofer IPM has implemented a demonstrator that uses AI to classify or segment object types in images and then project them back into the point cloud (see Figure 12). In this way, a segmented point cloud is generated in which each point is given an object label. Reliable results were achieved for manually matched point clouds. For an automated back projection, more parameters of camera calibration and orientation need to be known. Network Rail (https://www.networkrail.co.uk/ (accessed on 12 September 2024)), owner of the property assets of the former British Rail, uses AI and video images to find and then remove forgotten scrap at the side of the track. They are also working with the University of Sheffield to use a camera and AI to identify contaminants such as leaves (generally referred to as ‘black layer’) on the rails and freeze them with dry ice particles in a supersonic air stream to clean the railhead [90,91].
In the following section, we only deal with AI analyses of data from optical sensor technology. A survey on using AI in the entire railroad sector can be found here [89,92,93].
There are several defects that affect railway networks. Defects of the rail area include defects of the rail surface, fasteners, ballast, and sleepers. In order to detect defects on the track surface, ref. [94] has merged two Deep Learning (DL) models with each other. Features of the two models are combined to achieve a higher accuracy. Using classical image processing such as contrast equalization, the images are pre-processed and achieve a classification success of 97.10%. To detect so-called “squats”, which can lead to rail fractures, on the rail surface, ref. [95] uses a deep convolutional neural network (DCNN), an N-step ahead prediction model for defect severity and crack growth analysis, and a Bayesian inference model for failure-probability estimation. A squat is a surface defect caused by metal fatigue. To automatically detect cracks, their location, and the crack’s boundary, ref. [96] uses a bi-layer data-driven framework. Ref. [97] deals with the inspection of sleepers and rail fastenings with the help of line-scan cameras. The focus is on the detection of good, broken, or missing fasteners (object detection) and the segmentation of chips and crumbling concrete ties and other material classes.
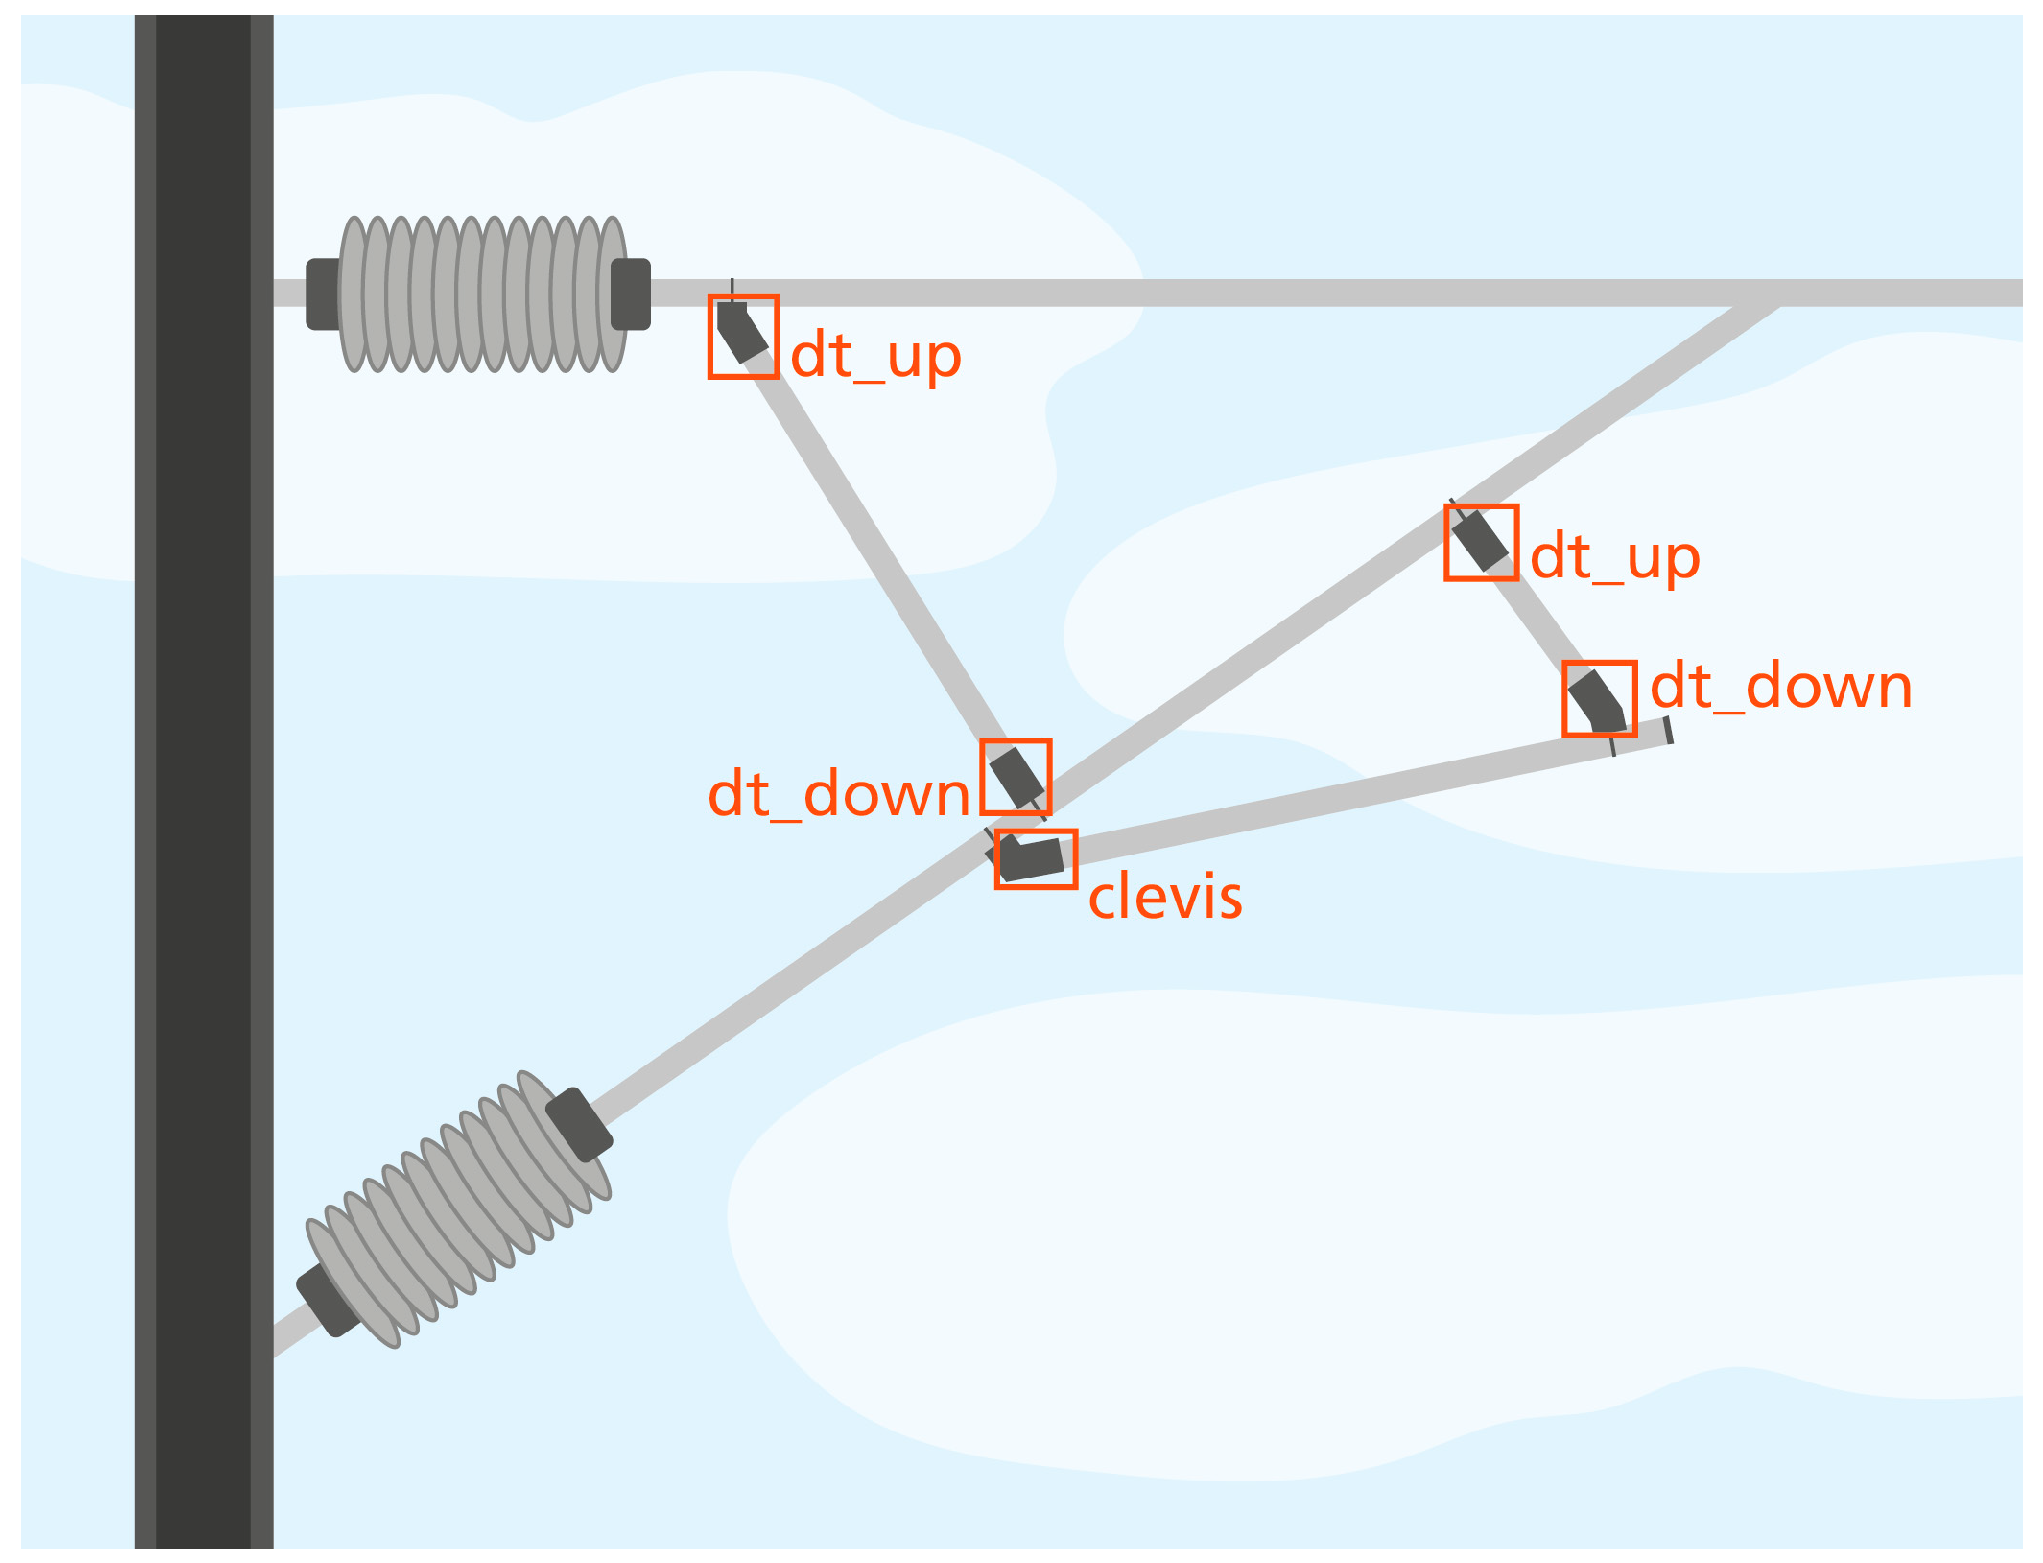
Another major area that needs to be examined for defects is the catenary wire and the catenary support devices. Catenary systems are an important part of the electrified railroad system. This area is becoming increasingly complex and variable. Ref. [98] is concerned with the detection of defective fasteners of the cantilever joints on the catenary support devices. They use a three-stage architecture to automatically assess the three cantilever joints and the six fasteners and judge the missing elements using images. DCNNs are used and the results show promising accuracy in the detection of defects. A similar topic is dealt with in [99]. Here, AI is used to determine the status of split pins in catenary support devices (Figure 13). A distinction is made between three different categories: normal, severely loose, and missing. The proposed system provides effective and fast results but still shows potential for latent loose cases.
The aim of [100] is to recognize several catenary components simultaneously using AI. In images six categories of catenary components such as the messenger cable base, the flat cantilever, the positioning support, the insulator, the 42 type sleeve double ear, and the 55 type sleeve double ear with rotating double ear are mainly to be recognized. Different algorithms such as linear local tangent space alignment (LLTSA) and kernel function extreme learning machine (KELM) are used to detect components based on new optimized features. Ref. [101] presents a solution for the detection of defects on the insulator surface. The images were captured by an inspection train on a high-speed line. A deep material classifier (DMC) and a deep denoising autoencoder (DDAE) are integrated into a deep multitask neural network (DMNN). The advantage is that no defective samples are required for training to enable simultaneous segmentation and defect detection. The experimental results show that surface defects are successfully and effectively detected.
Wheel defects not only cause noise and vibration emissions, but also cause damage to the infrastructure. Ref. [69] deals with the application of AI for the detection of wheel defects on the surface (Figure 14). They combine a laser profile sensor, a laser distance sensor, and a digital video camera as an inspection system and detect defects using machine vision. The images are converted into line segments using filter algorithms and evaluated by the AI. The final assessment is based on the profile and image data.

5. Discussion

In recent years, there has been a clear trend toward automation. Individual sub-steps or tasks are increasingly being taken over by new methods and algorithms. More and more different sensor systems are being linked together to obtain better and more detailed information about the condition of the object to be evaluated. In the near future, these multi-sensor systems will evolve into collaborative robots that can be used autonomously or in cooperation with human workers in railway maintenance. The sensor technology employed will become more effective in terms of detection and smaller in design, making it easier to deploy on smaller carrier platforms such as UAVs.
Optical processes continue to demonstrate their potential in the non-destructive detection of damage, now extending beyond surface-level analysis. Using thermographic cameras or specialized lasers, it is already possible to draw conclusions about the interior condition of an object, thereby obtaining more comprehensive information from the recorded data. The development of laser-based systems toward the use of different methods for distance determination (phase-shift measurement, pulsed time-of-flight measurement) as well as the use of different wavelengths should be further promoted to counteract the current limits and deficits.
Both in the acquisition of measurement data and in their evaluation and analysis, the methods are evolving from heuristic approaches to the use of artificial intelligence for the semantic interpretation of 3D and 2D data. The application of AI in analyzing and evaluating sensor data from optical measurement systems is becoming increasingly significant. The wide range of potential applications highlights the great promise of this tool. The developments and research mentioned here provide just a brief insight into the possible applications, but it is clear that AI is becoming more established and important in visual inspection technology. It can detect errors in real time and reduce human error, thereby increasing productivity and improving efficiency and safety in the rail industry.
Manual inspections are gradually being replaced by automated interpretations. Fully autonomous measurement platforms that carry out infrastructure inspections independently of human control would be possible. The use of sensor systems in regular train services could significantly shorten inspection intervals. Another challenge is the cost-effective management of large volumes of data. There are already approaches to reduce big data not only in post-processing but also in real time, minimizing the data to the necessary amount. This significantly reduces storage requirements. However, there is a lack of standardization in data processing, and solutions are often tailored only to specific requirements.

6. Conclusions and Outlook

The rail sector in general is a conservative and traditional sector that is slow to open up to new technologies. National regulations for safety obligations and responsibilities for safety standards also make it difficult to implement innovations quickly. Nevertheless, 5G, AI and the Internet of Things (IoT), cloud computing, multi-sensor systems, robotics, and UAVs will enable more precise and efficient measurements, which in turn will lead to increased safety and performance in the rail infrastructure and therefore also in transportation. Analyzing digital measurement data is becoming increasingly important to gain valuable information and make well-grounded decisions. By using advanced technologies such as artificial intelligence, machine learning, and big data analysis, more information can be extracted from measurement data than ever before. These technologies make it possible to process large amounts of data in real time and even make predictions. By integrating IoT devices, sensors can continuously collect data and transmit it over the internet, enabling comprehensive monitoring and analysis in real time.
With the introduction of the European Train Control System (ETCS) [102], a standardized control system is being implemented, which should lead to greater safety and efficiency and also ensure interoperability between the various national railroad systems. Overall, rail measurement technology will continue to play an important role in ensuring the efficiency and safety of rail transportation worldwide.

Author Contributions

Conceptualization, K.Z. and A.R.; methodology, K.Z.; investigation, K.Z.; resources, K.Z. and A.R.; writing—original draft preparation, K.Z. and A.R.; writing—review and editing, K.Z. and A.R.; visualization, K.Z.; supervision, A.R. All authors have read and agreed to the published version of the manuscript.

Funding

This research received no external funding.

Institutional Review Board Statement

Not applicable.

Informed Consent Statement

Not applicable.

Data Availability Statement

Data derived from public domain resources.

Conflicts of Interest

The authors declare no conflicts of interest.

References

  1. Mattsson, L.-G.; Jenelius, E. Vulnerability and resilience of transport systems—A discussion of recent research. Transp. Res. Part A Policy Pract. 2015, 81, 16–34. [Google Scholar] [CrossRef]
  2. Dobney, K.; Baker, C.J.; Quinn, A.D.; Chapman, L. Quantifying the effects of high summer temperatures due to climate change on buckling and rail related delays in south-east United Kingdom. Meteorol. Appl. 2009, 16, 245–251. [Google Scholar] [CrossRef]
  3. Oslakovic, I.S.; ter Maat, H.; Hartmann, A.; Dewulf, G. Risk Assessment of Climate Change Impacts on Railway Infrastructure. In Proceedings of the EPOC 2013 Conference—Engineering Project Organization Conference, Devil’s Thumb Range, CO, USA, 9–11 July 2013; pp. 9–11. [Google Scholar]
  4. Trimble Inc. GEDO Vorsys: Pre-Measurment for Tamping. 2022. Available online: https://download.trimble-railway.com/download/#498-950-gedo-vorsys-system (accessed on 3 April 2024).
  5. Leica Geosystems AG. SiTrack:One. Available online: https://www.google.com/url?sa=t&source=web&rct=j&opi=89978449&url=https://leica-geosystems.com/-/media/files/leicageosystems/products/datasheets/sitrack_one_by_leica_geosystems_ds.ashx%3Fla%3Den%26hash%3DBF4BD4D2D7B19F6983B9A29E72F2F5CE&ved=2ahUKEwiHyamJmeCIAxVwc_EDHdvuEoYQFnoECBQQAQ&usg=AOvVaw0nXG_UtLaP7ndGDbmwTl9- (accessed on 26 September 2024).
  6. Hisa, T.; Kanaya, M.; Sakai, M.; Hamaoka, K. Rail and contact line inspection technology for safe and reliable railway traffic. Hitachi Review 2012, 61, 325–330. [Google Scholar]
  7. Wirth, H. Der neue Lichtraummesszug LIMEZ III der Deutschen Bahn AG. ZfV 2008, 133, 180–186. [Google Scholar]
  8. Wikipedia. China Railway Comprehensive Inspection Trains. Available online: https://en.wikipedia.org/w/index.php?title=China_Railway_comprehensive_inspection_trains&oldid=1219488938 (accessed on 24 June 2024).
  9. Li, Q.; Ren, S. A Real-Time Visual Inspection System for Discrete Surface Defects of Rail Heads. IEEE Trans. Instrum. Meas. 2012, 61, 2189–2199. [Google Scholar] [CrossRef]
  10. Papaelias, M.P.; Roberts, C.; Davis, C.L. A review on non-destructive evaluation of rails: State-of-the-art and future development. Proc. Inst. Mech. Eng. Part F J. Rail Rapid Transit 2008, 222, 367–384. [Google Scholar] [CrossRef]
  11. Reiterer, A.; Höfler, H.; Wölfelschneider, H.; Baulig, C.; Maindorfer, I.; Dimopoulos, N.; Schwarzer, S.; Dambacher, M. Railway Measurement Techniques: Opportunities and Challenges. In Proceedings of the Second International Conference on Railway Technology: Research, Development and Maintenance, Ajaccio, Corsica, France, 8–11 April 2014; Pombo, J., Ed.; Civil-Comp Press: Stirlingshire, UK, 2014. [Google Scholar]
  12. Soilán, M.; Sánchez-Rodríguez, A.; Del Río-Barral, P.; Perez-Collazo, C.; Arias, P.; Riveiro, B. Review of Laser Scanning Technologies and Their Applications for Road and Railway Infrastructure Monitoring. Infrastructures 2019, 4, 58. [Google Scholar] [CrossRef]
  13. Du, C.; Dutta, S.; Kurup, P.; Yu, T.; Wang, X. A review of railway infrastructure monitoring using fiber optic sensors. Sens. Actuators A Phys. 2020, 303, 111728. [Google Scholar] [CrossRef]
  14. Kerr, A. Fundamentals Of Railway Track Engineering; Simmons Boardman Pub Co.: Omaha, NE, USA, 2003. [Google Scholar]
  15. Ferdous, W.; Manalo, A. Failures of mainline railway sleepers and suggested remedies—Review of current practice. Eng. Fail. Anal. 2014, 44, 17–35. [Google Scholar] [CrossRef]
  16. Werner, C.S.; Frey, S.; Reiterer, A. Automated visual vegetation detection for weed management on transportation infrastructure. In SPIE Optical Metrology; Automated Visual Inspection and Machine Vision V; SPIE: München, Germany, 2023; pp. 114–119. [Google Scholar]
  17. Wu, G.; Dong, K.; Xu, Z.; Xiao, S.; Wei, W.; Chen, H.; Li, J.; Huang, Z.; Li, J.; Gao, G.; et al. Pantograph–catenary electrical contact system of high-speed railways: Recent progress, challenges, and outlooks. Rail. Eng. Sci. 2022, 30, 437–467. [Google Scholar] [CrossRef]
  18. Brahimi, M.; Medjaher, K.; Leouatni, M.; Zerhouni, N. Prognostics and Health Management for an Overhead Contact Line System—A Review. Int. J. Progn. Health Manag. 2017, 8, 1–16. [Google Scholar] [CrossRef]
  19. Song, Y.; Zhang, M.; Øiseth, O.; Rønnquist, A. Wind deflection analysis of railway catenary under crosswind based on nonlinear finite element model and wind tunnel test. Mech. Mach. Theory 2022, 168, 104608. [Google Scholar] [CrossRef]
  20. bvSys Bildverarbeitungssysteme GmbH. CrackCheck—bvSys Bildverabeitungssysteme GmbH. Available online: https://www.bvsys.de/54.html (accessed on 23 April 2024).
  21. MER MEC S.p.A. Track Inspection System V-CUBE. Available online: https://www.mermecgroup.com/measurement-br-trains-e-systems/track-inspection/524/track-inspection-v-cube.php (accessed on 5 June 2024).
  22. MER MEC S.p.A. Track Geometry Measurement Systems. Available online: https://www.mermecgroup.com/measurement-br-trains-e-systems/track-measurement/185/track-geometry.php (accessed on 23 April 2024).
  23. Fraunhofer IPM. Track Geometry Measurement System TGM, Freiburg. 2024. Available online: https://www.ipm.fraunhofer.de/content/dam/ipm/en/PDFs/product-information/OF/MTS/Track-Geometry-Measurement-System-TGM.pdf (accessed on 26 September 2024).
  24. TVEMA. Track Geometry Assessment Systems|JSC «Firma Tvema». Available online: https://tvema.com/638 (accessed on 23 April 2024).
  25. SelectraVision. Measuring TRACKS—on VEHICLE: On VEHICLE Solutions for Tracks Measurement. Available online: https://www.selectravision.com/tracks-vehicle.php (accessed on 22 April 2024).
  26. bvSys Bildverarbeitungssysteme GmbH. VegetationCheck—bvSys Bildverabeitungssysteme GmbH. Available online: https://www.bvsys.de/60.html (accessed on 23 April 2024).
  27. Fraunhofer IPM. Weed Detection System: Automatisierte Vegetationskontrolle, Freiburg. 2022. Available online: https://www.ipm.fraunhofer.de/content/dam/ipm/de/PDFs/produktblaetter/OF/AUS/Weed-detection-system-Vegetationskontrolle-automatisiert.pdf (accessed on 26 September 2024).
  28. SelectraVision. Measuring TRAIN | Pantocheck: PantoCheck, Pantograph measuring system: OVERVIEW. Available online: https://www.selectravision.com/products-pantocheck.php (accessed on 22 April 2024).
  29. bvSys Bildverarbeitungssysteme GmbH. CatenaryCheck—bvSys Bildverabeitungssysteme GmbH. Available online: https://www.bvsys.de/62.html (accessed on 23 April 2024).
  30. bvSys Bildverarbeitungssysteme GmbH. WireCheck—bvSys Bildverabeitungssysteme GmbH. Available online: https://www.bvsys.de/63.html (accessed on 23 April 2024).
  31. MER MEC S.p.A. Geometry & Contact Wire Wear Measurement System. Available online: https://www.mermecgroup.com/measurement-br-trains-e-systems/catenary-measurement/78/geometry-e-contact-wire-wear.php (accessed on 23 April 2024).
  32. SelectraVision. CAT-V Equipment for Catenary Geometry Measurement for Vehicle Installation. Available online: https://www.selectravision.com/cat-vehicle.php (accessed on 22 April 2024).
  33. Fraunhofer IPM. Contact Wire Inspection System CIS, Freiburg. 2021. Available online: https://www.ipm.fraunhofer.de/content/dam/ipm/en/PDFs/product-information/OF/MTS/Contact-Wire-Inspection-System-CIS.pdf (accessed on 26 September 2024).
  34. Fraunhofer IPM. Contact Wire Recording System (CRS), Freiburg. 2023. Available online: https://www.ipm.fraunhofer.de/content/dam/ipm/en/PDFs/product-information/OF/MTS/Contact-Wire-Recording-System-CRS.pdf (accessed on 26 September 2024).
  35. Fraunhofer IPM. Wire Wear Monitoring System (WWS), Freiburg. 2022. Available online: https://www.ipm.fraunhofer.de/content/dam/ipm/en/PDFs/product-information/OF/MTS/Wire-wear-monitoring-system-WWS.pdf (accessed on 26 September 2024).
  36. MER MEC S.p.A. Pole Detection System. Available online: https://www.mermecgroup.com/measurement-br-trains-e-systems/catenary-inspection/1027/pole-detection.php (accessed on 23 April 2024).
  37. Fraunhofer IPM. Laser Pole Detection System (LPS), Freiburg. 2022. Available online: https://www.ipm.fraunhofer.de/content/dam/ipm/en/PDFs/product-information/OF/MTS/Laser-Pole-Detection-System-LPS.pdf (accessed on 26 September 2024).
  38. dibit Messtechnik. The System That Defines the Standard DIBIT TSC—Tunnel Scanner: DIBIT TSC—Tunnel Scanner. Available online: https://www.dibit.at/fileadmin/user_upload/TSC_allgemein_engl_V11.pdf (accessed on 18 April 2024).
  39. MER MEC S.p.A. Tunnel und Spielraum Vermessungssysteme. Available online: https://www.mermecgroup.com/de/inspizieren/schienenvermessung/1028/tunnel-und-spielraum.php (accessed on 23 April 2024).
  40. Pavemetrics. Scanning System Laser Tunnel (LTSS). Available online: https://www.pavemetrics.com/wp-content/uploads/2020/01/LTSS-Flyer-LR.pdf (accessed on 28 May 2024).
  41. TVEMA. Clearance Envelope Inspection Systems|JSC «Firma Tvema». Available online: https://tvema.com/641 (accessed on 22 April 2024).
  42. Fraunhofer IPM. Tunnel Inspection System: Simultaneous Geometry and Moisture Measurement, Freiburg. 2022. Available online: https://www.ipm.fraunhofer.de/de/gf/objekterfassung-laserscanning/anw/bahnmesstechnik/tunnelzustand.html (accessed on 26 September 2024).
  43. Fraunhofer IPM. High Speed Profiler: Measuring Geometrical Changes of Structure Gauge, Freiburg. 2022. Available online: https://www.ipm.fraunhofer.de/content/dam/ipm/en/PDFs/product-information/OF/MTS/High-Speed-Profiler-HSP.pdf (accessed on 26 September 2024).
  44. RIEGL Laser Measurement Systems GmbH. RIEGL VMX-RAIL. 2023. Available online: http://www.riegl.com/nc/products/mobile-scanning/produktdetail/product/scanner/67/ (accessed on 31 May 2024).
  45. Zoller & Fröhlich GmbH. Mobile Mapping: Zoller+Fröhlich. Available online: https://www.zofre.de/en/laser-scanners/laserscanning/mobile-mapping (accessed on 4 June 2024).
  46. MER MEC S.p.A. Wheel Parameters Measurement Systems. Available online: https://www.mermecgroup.com/measurement-br-trains-e-systems/train-monitoring/87/wheel-parameters.php (accessed on 23 April 2024).
  47. SelectraVision. Wheel Profile & Diameter Measuring System. Available online: https://www.selectravision.com/wheels.php (accessed on 22 April 2024).
  48. MER MEC S.p.A. Train Profile Measurement Systems. Available online: https://www.mermecgroup.com/measurement-br-trains-e-systems/train-monitoring/1022/train-profile.php (accessed on 29 May 2024).
  49. Fraunhofer IPM. Sector Profile Scanner (SPS), Freiburg. 2022. Available online: https://www.ipm.fraunhofer.de/content/dam/ipm/en/PDFs/product-information/OF/MTS/Sector-Profile-Scanner-SPS.pdf (accessed on 26 September 2024).
  50. You, R.; Li, D.; Ngamkhanong, C.; Janeliukstis, R.; Kaewunruen, S. Fatigue Life Assessment Method for Prestressed Concrete Sleepers. Front. Built Environ. 2017, 3, 68. [Google Scholar] [CrossRef]
  51. Siahkouhi, M.; Wang, J.; Han, X.; Aela, P.; Ni, Y.-Q.; Jing, G. Railway ballast track hanging sleeper defect detection using a smart CNT self-sensing concrete railway sleeper. Constr. Build. Mater. 2023, 399, 132487. [Google Scholar] [CrossRef]
  52. Jing, G.; Siahkouhi, M.; Riley Edwards, J.; Dersch, M.S.; Hoult, N.A. Smart railway sleepers—A review of recent developments, challenges, and future prospects. Constr. Build. Mater. 2021, 271, 121533. [Google Scholar] [CrossRef]
  53. Li, J.; Doh, S.I.; Manogaran, R. Detection and Maintenance for Railway Track Defects: A Review. IOP Conf. Ser. Earth Environ. Sci. 2023, 1140, 12011. [Google Scholar] [CrossRef]
  54. Circelli, M.; Kaviani, N.; Licciardello, R.; Ricci, S.; Rizzetto, L.; Arabani, S.S.; Shi, D. Track geometry monitoring by an on-board computer-vision-based sensor system. Transp. Res. Procedia 2023, 69, 257–264. [Google Scholar] [CrossRef]
  55. Cannon, D.F.; Edel, K.-O.; Grassie, S.L.; Sawley, K. Rail defects: An overview. Fatigue Fract. Eng. Mat. Struct. 2003, 26, 865–886. [Google Scholar] [CrossRef]
  56. Reiterer, A.; Dimopoulus, N.; Frey, S.; Werner, C.S. Nachhaltige Vegetationskontrolle. EI-Eisenbahn Ingenieur 2020, 32–34. [Google Scholar]
  57. Yi, C.; Wang, D.; Zhou, L.; Lin, J. A simulation investigation on the influence of pantograph crack defect on graphite contact strip wear. Eng. Fail. Anal. 2022, 131, 105889. [Google Scholar] [CrossRef]
  58. Landi, A.; Menconi, L.; Sani, L. Hough transform and thermo-vision for monitoring pantograph-catenary system. Proc. Inst. Mech. Eng. Part F J. Rail Rapid Transit 2006, 220, 435–447. [Google Scholar] [CrossRef]
  59. Kuźnar, M.; Lorenc, A.; Kaczor, G. Pantograph Sliding Strips Failure-Reliability Assessment and Damage Reduction Method Based on Decision Tree Model. Materials 2021, 14, 5743. [Google Scholar] [CrossRef] [PubMed]
  60. SelectraVision. Measuring Catenary|on Vehicle|CAT-VW. Available online: https://www.selectravision.com/products-cat-vw.php (accessed on 4 June 2024).
  61. Fraunhofer IPM. Low Speed Contact Wire Inspection System CIS-LS, Freiburg. 2021. Available online: https://www.ipm.fraunhofer.de/content/dam/ipm/en/PDFs/product-information/OF/MTS/Contact-Wire-Inspection-System-CIS-LS.pdf (accessed on 26 September 2024).
  62. Arastounia, M.; Lichti, D.D. Simultaneous identification, modeling and registration refinement of poles using laser scanning point clouds. ISPRS J. Photogramm. Remote Sens. 2021, 181, 327–344. [Google Scholar] [CrossRef]
  63. Liu, T.; Chang, L.; Niu, X.; Liu, J. Pole-Like Object Extraction and Pole-Aided GNSS/IMU/LiDAR-SLAM System in Urban Area. Sensors 2020, 20, 7145. [Google Scholar] [CrossRef] [PubMed]
  64. Mett, M.; Eder, S. 3D tunnel inspection with photogrammetric and hybrid systems. In Proceedings of the Conference: Shotcrete for Underground Support XIV, Pattaya, Thailand, 17–20 November 2019. [Google Scholar]
  65. Vierhub-Lorenz, V.; Predehl, K.; Wolf, S.; Werner, C.S.; Kühnemann, F.; Reiterer, A. A multispectral tunnel inspection system for simultaneous moisture and shape detection. In Proceedings of the Remote Sensing Technologies and Applications in Urban Environments IV, Strasbourg, France, 9–12 September 2019; Erbertseder, T., Ed.; SPIE: Bellingham, DC, USA, 2019; p. 32, ISBN 9781510630178. [Google Scholar]
  66. Vierhub-Lorenz, V.; Kellner, M.; Zipfel, O.; Reiterer, A. A Study on the Effect of Multispectral LiDAR Data on Automated Semantic Segmentation of 3D-Point Clouds. Remote Sens. 2022, 14, 6349. [Google Scholar] [CrossRef]
  67. Fraunhofer IPM. Clearance Profile Scanner (CPS): Measuring Geometrical Changes of Structure Gauge; 2022; Available online: https://www.schienenverkehrsportal.de/download.php?TblName=asm_companyproduct_download&DownloadID=493 (accessed on 12 September 2024).
  68. Zucarelli, T.A.; Vieira, M.A.; Moreira Filho, L.A.; Reis, D.; Reis, L. Failure analysis in railway wheels. Procedia Struct. Integr. 2016, 1, 212–217. [Google Scholar] [CrossRef]
  69. Emoto, T.; Ravankar, A.A.; Ravankar, A.; Emaru, T.; Kobayashi, Y. Automatic inspection of wheel surface defects using a combination of laser sensors and machine vision. SICE J. Control Meas. Syst. Integr. 2024, 17, 57–66. [Google Scholar] [CrossRef]
  70. Shaikh, M.Z.; Ahmed, Z.; Chowdhry, B.S.; Baro, E.N.; Hussain, T.; Uqaili, M.A.; Mehran, S.; Kumar, D.; Shah, A.A. State-of-the-Art Wayside Condition Monitoring Systems for Railway Wheels: A Comprehensive Review. IEEE Access 2023, 11, 13257–13279. [Google Scholar] [CrossRef]
  71. Vaičiūnas, G.; Bureika, G.; Steišūnas, S. Measurement Repeatability of Rail Wheel Loads Caused by Rolling Surface Damages. Appl. Sci. 2023, 13, 4474. [Google Scholar] [CrossRef]
  72. SBB AG. Train Monitoring and Measuring Systems|SBB. Available online: https://bahninfrastruktur.sbb.ch/en/products-and-services/bahnbetrieb/train-monitoring-systems/measuring-systems.html (accessed on 31 May 2024).
  73. Vithanage, R.K.W.; Harrison, C.S.; DeSilva, A.K.M. Importance and Applications of Robotic and Autonomous Systems (RAS) in Railway Maintenance Sector: A Review. Computers 2019, 8, 56. [Google Scholar] [CrossRef]
  74. Iyer, S.; Velmurugan, T.; Gandomi, A.H.; Noor Mohammed, V.; Saravanan, K.; Nandakumar, S. Structural health monitoring of railway tracks using IoT-based multi-robot system. Neural Comput. Appl. 2021, 33, 5897–5915. [Google Scholar] [CrossRef]
  75. ANYbotics and Stadler Service AG Explore the Future of Train Maintenance—ANYbotics. Robotic Inspection for Rail Transport. Available online: https://www.anybotics.com/industries/robotic-inspection-railway-transportation/ (accessed on 27 May 2024).
  76. Loccioni. Railway—Loccioni. Available online: https://www.loccioni.com/en/railway/ (accessed on 4 July 2024).
  77. Our Platform—Rail Pod Inc. Available online: https://www.rail-pod.com/our-platform/ (accessed on 4 July 2024).
  78. Railway-News. Railway Inspection Robot Takes on Maintenance Challenges. Available online: https://railway-news.com/railway-inspection-robot-takes-on-maintenance-challenges/ (accessed on 4 July 2024).
  79. Atack, P.R. Japanese Railway Introduces Infrastructure Robot. Railway Technology [Online]. 4 July 2024. Available online: https://www.railway-technology.com/news/japanese-railway-introduces-infrastructure-robot/ (accessed on 5 July 2024).
  80. Dimec, M.; Kraljević, M.; Žalik, B.; Krejan, M.; Pečnik, S.; Podgorelec, D. Use of LiDAR and autonomous mobile robots in safety and inspection applications on railways. In Proceedings of the Rail Infrastructur Monitoring, Maintenance and Optimization, 7th International Conference on Road and Rail Infrastructure, Pula, Croatia, 11–13 May 2022. [Google Scholar]
  81. Jing, G.; Qin, X.; Wang, H.; Deng, C. Developments, challenges, and perspectives of railway inspection robots. Autom. Constr. 2022, 138, 104242. [Google Scholar] [CrossRef]
  82. Nordic Unmanned. Rail Services—Nordic Unmanned. Available online: https://nordicunmanned.com/de/services/rail/ (accessed on 4 July 2024).
  83. Andert, F.; Kornfeld, N.; Nikodem, F.; Li, H.; Kluckner, S.; Gruber, L.; Kaiser, C. Zustandsüberwachung von Bahnoberleitungen mit Kameradrohnen. EI-Der Eisenbahningenieur 2020, 10–14. Available online: https://elib.dlr.de/134914/1/EI_2020_05_10_16_Andert_Kornfeld.pdf (accessed on 12 September 2024).
  84. Jung, J.T.; Merkle, D.; Reiterer, A. Automated Camera Pose Generation for High-Resolution 3D Reconstruction of Bridges by Unmanned Aerial Vehicles. Remote Sens. 2024, 16, 1393. [Google Scholar] [CrossRef]
  85. Jung, S.; Song, S.; Kim, S.; Park, J.; Her, J.; Roh, K.; Myung, H. Toward Autonomous Bridge Inspection: A framework and experimental results. In Proceedings of the 2019 16th International Conference on Ubiquitous Robots (UR), Jeju, Republic of Korea, 24–27 June 2019; IEEE: Piscataway, NJ, USA, 2019; pp. 208–211, ISBN 978-1-7281-3232-7. [Google Scholar]
  86. Stemmler, S.; Kaufmann, T.; Bange, M.J.; Merkle, D.; Reiterer, A.; Klemt-Albert, K.; Marx, S. Multisource-data-fusion for the digitization of critical infrastructural elements. In Proceedings of the Remote Sensing Technologies and Applications in Urban Environments VII, Berlin, Germany, 5–8 September 2022; Erbertseder, T., Chrysoulakis, N., Zhang, Y., Eds.; SPIE: Bellingham, DC, USA, 2022; p. 4, ISBN 9781510655416. [Google Scholar]
  87. Rahman, M.; Liu, H.; Cardenas, I.D.; Starr, A.; Hall, A.; Anderson, R. A Review on the Prospects of Mobile Manipulators for Smart Maintenance of Railway Track. Appl. Sci. 2023, 13, 6484. [Google Scholar] [CrossRef]
  88. Kaplan, A.; Haenlein, M. Siri, Siri, in my hand: Who’s the fairest in the land? On the interpretations, illustrations, and implications of artificial intelligence. Bus. Horiz. 2019, 62, 15–25. [Google Scholar] [CrossRef]
  89. Phusakulkajorn, W.; Núñez, A.; Wang, H.; Jamshidi, A.; Zoeteman, A.; Ripke, B.; Dollevoet, R.; de Schutter, B.; Li, Z. Artificial intelligence in railway infrastructure: Current research, challenges, and future opportunities. Intell. Transp. Infrastruct. 2023, 2, liad016. [Google Scholar] [CrossRef]
  90. Krier, P.; White, B.T.; Ferriday, P.; Watson, M.; Buckley-Johnstone, L.; Lewis, R.; Lanigan, J.L. Vehicle-based cryogenic rail cleaning: An alternative solution to ‘leaves on the line’. Proc. Inst. Civ. Eng.-Civ. Eng. 2021, 174, 176–182. [Google Scholar] [CrossRef]
  91. Sonagra, R. Using Cryogenics to Blast Leaves from the Line. Network Rail [Online]. 9 November 2023. Available online: https://www.networkrail.co.uk/stories/using-cryogenics-to-blast-leaves-from-the-line/ (accessed on 17 April 2024).
  92. Tang, R.; de Donato, L.; Besinović, N.; Flammini, F.; Goverde, R.M.; Lin, Z.; Liu, R.; Tang, T.; Vittorini, V.; Wang, Z. A literature review of Artificial Intelligence applications in railway systems. Transp. Res. Part C Emerg. Technol. 2022, 140, 103679. [Google Scholar] [CrossRef]
  93. Di Summa, M.; Griseta, M.E.; Mosca, N.; Patruno, C.; Nitti, M.; Renò, V.; Stella, E. A Review on Deep Learning Techniques for Railway Infrastructure Monitoring. IEEE Access 2023, 11, 114638–114661. [Google Scholar] [CrossRef]
  94. Aydin, I.; Akin, E.; Karakose, M. Defect classification based on deep features for railway tracks in sustainable transportation. Appl. Soft Comput. 2021, 111, 107706. [Google Scholar] [CrossRef]
  95. Jamshidi, A.; Faghih-Roohi, S.; Hajizadeh, S.; Núñez, A.; Babuska, R.; Dollevoet, R.; Li, Z.; de Schutter, B. A Big Data Analysis Approach for Rail Failure Risk Assessment. Risk Anal. 2017, 37, 1495–1507. [Google Scholar] [CrossRef] [PubMed]
  96. Gibert, X.; Patel, V.M.; Chellappa, R. Deep Multi-task Learning for Railway Track Inspection. IEEE Trans. Intell. Transp. Syst. 2015, 18, 153–164. [Google Scholar] [CrossRef]
  97. Zhuang, L.; Wang, L.; Zhang, Z.; Tsui, K.L. Automated vision inspection of rail surface cracks: A double-layer data-driven framework. Transp. Res. Part C Emerg. Technol. 2018, 92, 258–277. [Google Scholar] [CrossRef]
  98. Chen, J.; Liu, Z.; Wang, H.; Nunez, A.; Han, Z. Automatic Defect Detection of Fasteners on the Catenary Support Device Using Deep Convolutional Neural Network. IEEE Trans. Instrum. Meas. 2018, 67, 257–269. [Google Scholar] [CrossRef]
  99. Zhong, J.; Liu, Z.; Han, Z.; Han, Y.; Zhang, W. A CNN-Based Defect Inspection Method for Catenary Split Pins in High-Speed Railway. IEEE Trans. Instrum. Meas. 2019, 68, 2849–2860. [Google Scholar] [CrossRef]
  100. Wu, C. Catenary components state detection method based on the dimension reduction-kernel extreme learning machine. Infrared Phys. Technol. 2024, 136, 105079. [Google Scholar] [CrossRef]
  101. Kang, G.; Gao, S.; Yu, L.; Zhang, D. Deep Architecture for High-Speed Railway Insulator Surface Defect Detection: Denoising Autoencoder With Multitask Learning. IEEE Trans. Instrum. Meas. 2019, 68, 2679–2690. [Google Scholar] [CrossRef]
  102. European Commission: Mobility and Transport. ETCS Levels and Modes. Available online: https://transport.ec.europa.eu/transport-modes/rail/ertms/what-ertms-and-how-does-it-work/etcs-levels-and-modes_en (accessed on 29 July 2024).
Figure 1. Components of a railway track.
Applsci 14 08801 g001
Figure 2. OCS structure and support. Image adapted from [19].
Applsci 14 08801 g002
Figure 3. Tunnel (left) and clearance profile (right).
Applsci 14 08801 g003
Figure 4. Main types of cracks in concrete sleepers according to [50]. Upper illustration shows that cracks near the rail seat cannot be detected in the built-up state.
Applsci 14 08801 g004
Figure 5. Non-contact optical track position/geometry measurement system using the light-section method by Fraunhofer IPM, installed on a two-way vehicle.
Applsci 14 08801 g005
Figure 7. CIS with open lid showing the individual sensors: CRS (middle bottom), two LPS (left and right bottom), and LED panels for illumination. The cameras for wire-wear measurement are located between the LED panels (not visible). The metal rails are used for the semi-automatic cleaning system.
Applsci 14 08801 g007
Figure 8. (Left) High-Speed Profiler (HSP) system from Fraunhofer IPM with two sensor heads mounted on the Deutsche Bahn inspection train LIMEZ III. (Right) Image of a point cloud captured by HSP.
Applsci 14 08801 g008
Figure 9. Wheel damage—flat and cracks [71].
Applsci 14 08801 g009
Figure 10. Result of the Sector Profile Scanner (SPS) from Fraunhofer IPM. The 3D image is available immediately after the train has passed and can be analyzed for geometrical irregularities.
Applsci 14 08801 g010
Figure 11. UAV with detected insulators on the overhead line. The green boxes show the detected insulators. Source: DLR/[83].
Applsci 14 08801 g011
Figure 12. (Left) back projection of object recognition from the images into the point cloud. (Right) segmentation from the image data.
Applsci 14 08801 g012
Figure 13. Object detection of split pins using AI. Figure adapted from [99].
Applsci 14 08801 g013
Figure 14. Results of wheel defect detection by YOLOv5 [69].
Applsci 14 08801 g014
Table 1. Overview of measuring systems and monitoring subjects.
SectionMonitoring SubjectsSuppliersMeasuring Systems
(Optical Sensors Only)
Section 2.3.1SleepersbvSys [20]Camera
MERMEC [21]Camera and undefined sensors
Section 2.3.2TrackMERMEC [22]LiDAR and undefined sensors
Fraunhofer IPM [23]Camera and LiDAR
TVEMA [24]
SelectraVision [25]
Section 2.3.3VegetationbvSys [26]Camera
Fraunhofer IPM [27]
Section 2.3.4PantographSelectraVision [28]Camera and LiDAR
Section 2.3.5Contact wirebvSys [29,30]Camera and LiDAR
MERMEC [31]
SelectraVision [25,32]
Fraunhofer IPM [33,34,35]
Section 2.3.6PoleMERMEC [36]LiDAR
Fraunhofer IPM [37]
Section 2.3.7TunnelDibit [38]Camera and LiDAR
MERMEC [39]
Pavemetrics [40]
TVEMA [41]LiDAR
Fraunhofer IPM [42]
Section 2.3.8ClearanceMERMEC [39]Camera and LiDAR
TVEMA [41]LiDAR
Fraunhofer IPM [43]
RIEGL [44]
Zoller + Fröhlich [45]
Section 2.3.9WheelsMERMEC [46]Camera and undefined sensors
SelectraVision [47]Camera and LiDAR
Section 2.3.10Rolling stockMERMEC [48]Camera and LiDAR
Fraunhofer IPM [49]LiDAR
Disclaimer/Publisher’s Note: The statements, opinions and data contained in all publications are solely those of the individual author(s) and contributor(s) and not of MDPI and/or the editor(s). MDPI and/or the editor(s) disclaim responsibility for any injury to people or property resulting from any ideas, methods, instructions or products referred to in the content.