
Remote Sensing Evaluation and Monitoring of Spatial and Temporal Changes in Ecological Environmental Quality in Coal Mining-Intensive Cities


Abstract
:Featured Application
Abstract
1. Introduction
- (1)
- Utilizing Landsat data retrieved from the GEE platform, we aim to develop an ecological index, namely the Resource-Based City Ecological Index (RCEI), specifically designed to assess the ecological quality of cities relying on coal resources. This index takes into account the characteristics of coal exploitation as well as the synergistic effects between mining areas and urban environments.
- (2)
- Employing the RCEI index, we intend to monitor the spatial and temporal changes in the ecological environmental quality of Jincheng City from 1990 to 2022. Additionally, we will conduct a thorough analysis of the spatial distribution patterns of the ecological environmental quality in the city, offering insights into its evolving ecological environment and guiding effective management strategies.
- (3)
- Utilizing the Resource City Ecological Index (RCEI), this investigation will delve into the ecological dynamics encircling two emblematic mining districts within designated buffer zones. This study will contrast the ecological variances at divergent junctures of mining activity—pre-extraction, during active extraction, and post-closure—alongside spatial disparities proximal and distal to urban centers.
- (4)
- Furthermore, this study will scrutinize the intricate repercussions of coal extraction on ambient ecosystems, dissecting temporal and spatial gradients of influence. Synthesizing these multifaceted analyses, this research will proffer strategic counsel and actionable frameworks for mining operations and ecological rehabilitation, charting a course for the sustainable evolution of resource-dependent cities.
2. Study Area and Data Sources
2.1. Study Area
2.2. Data Source
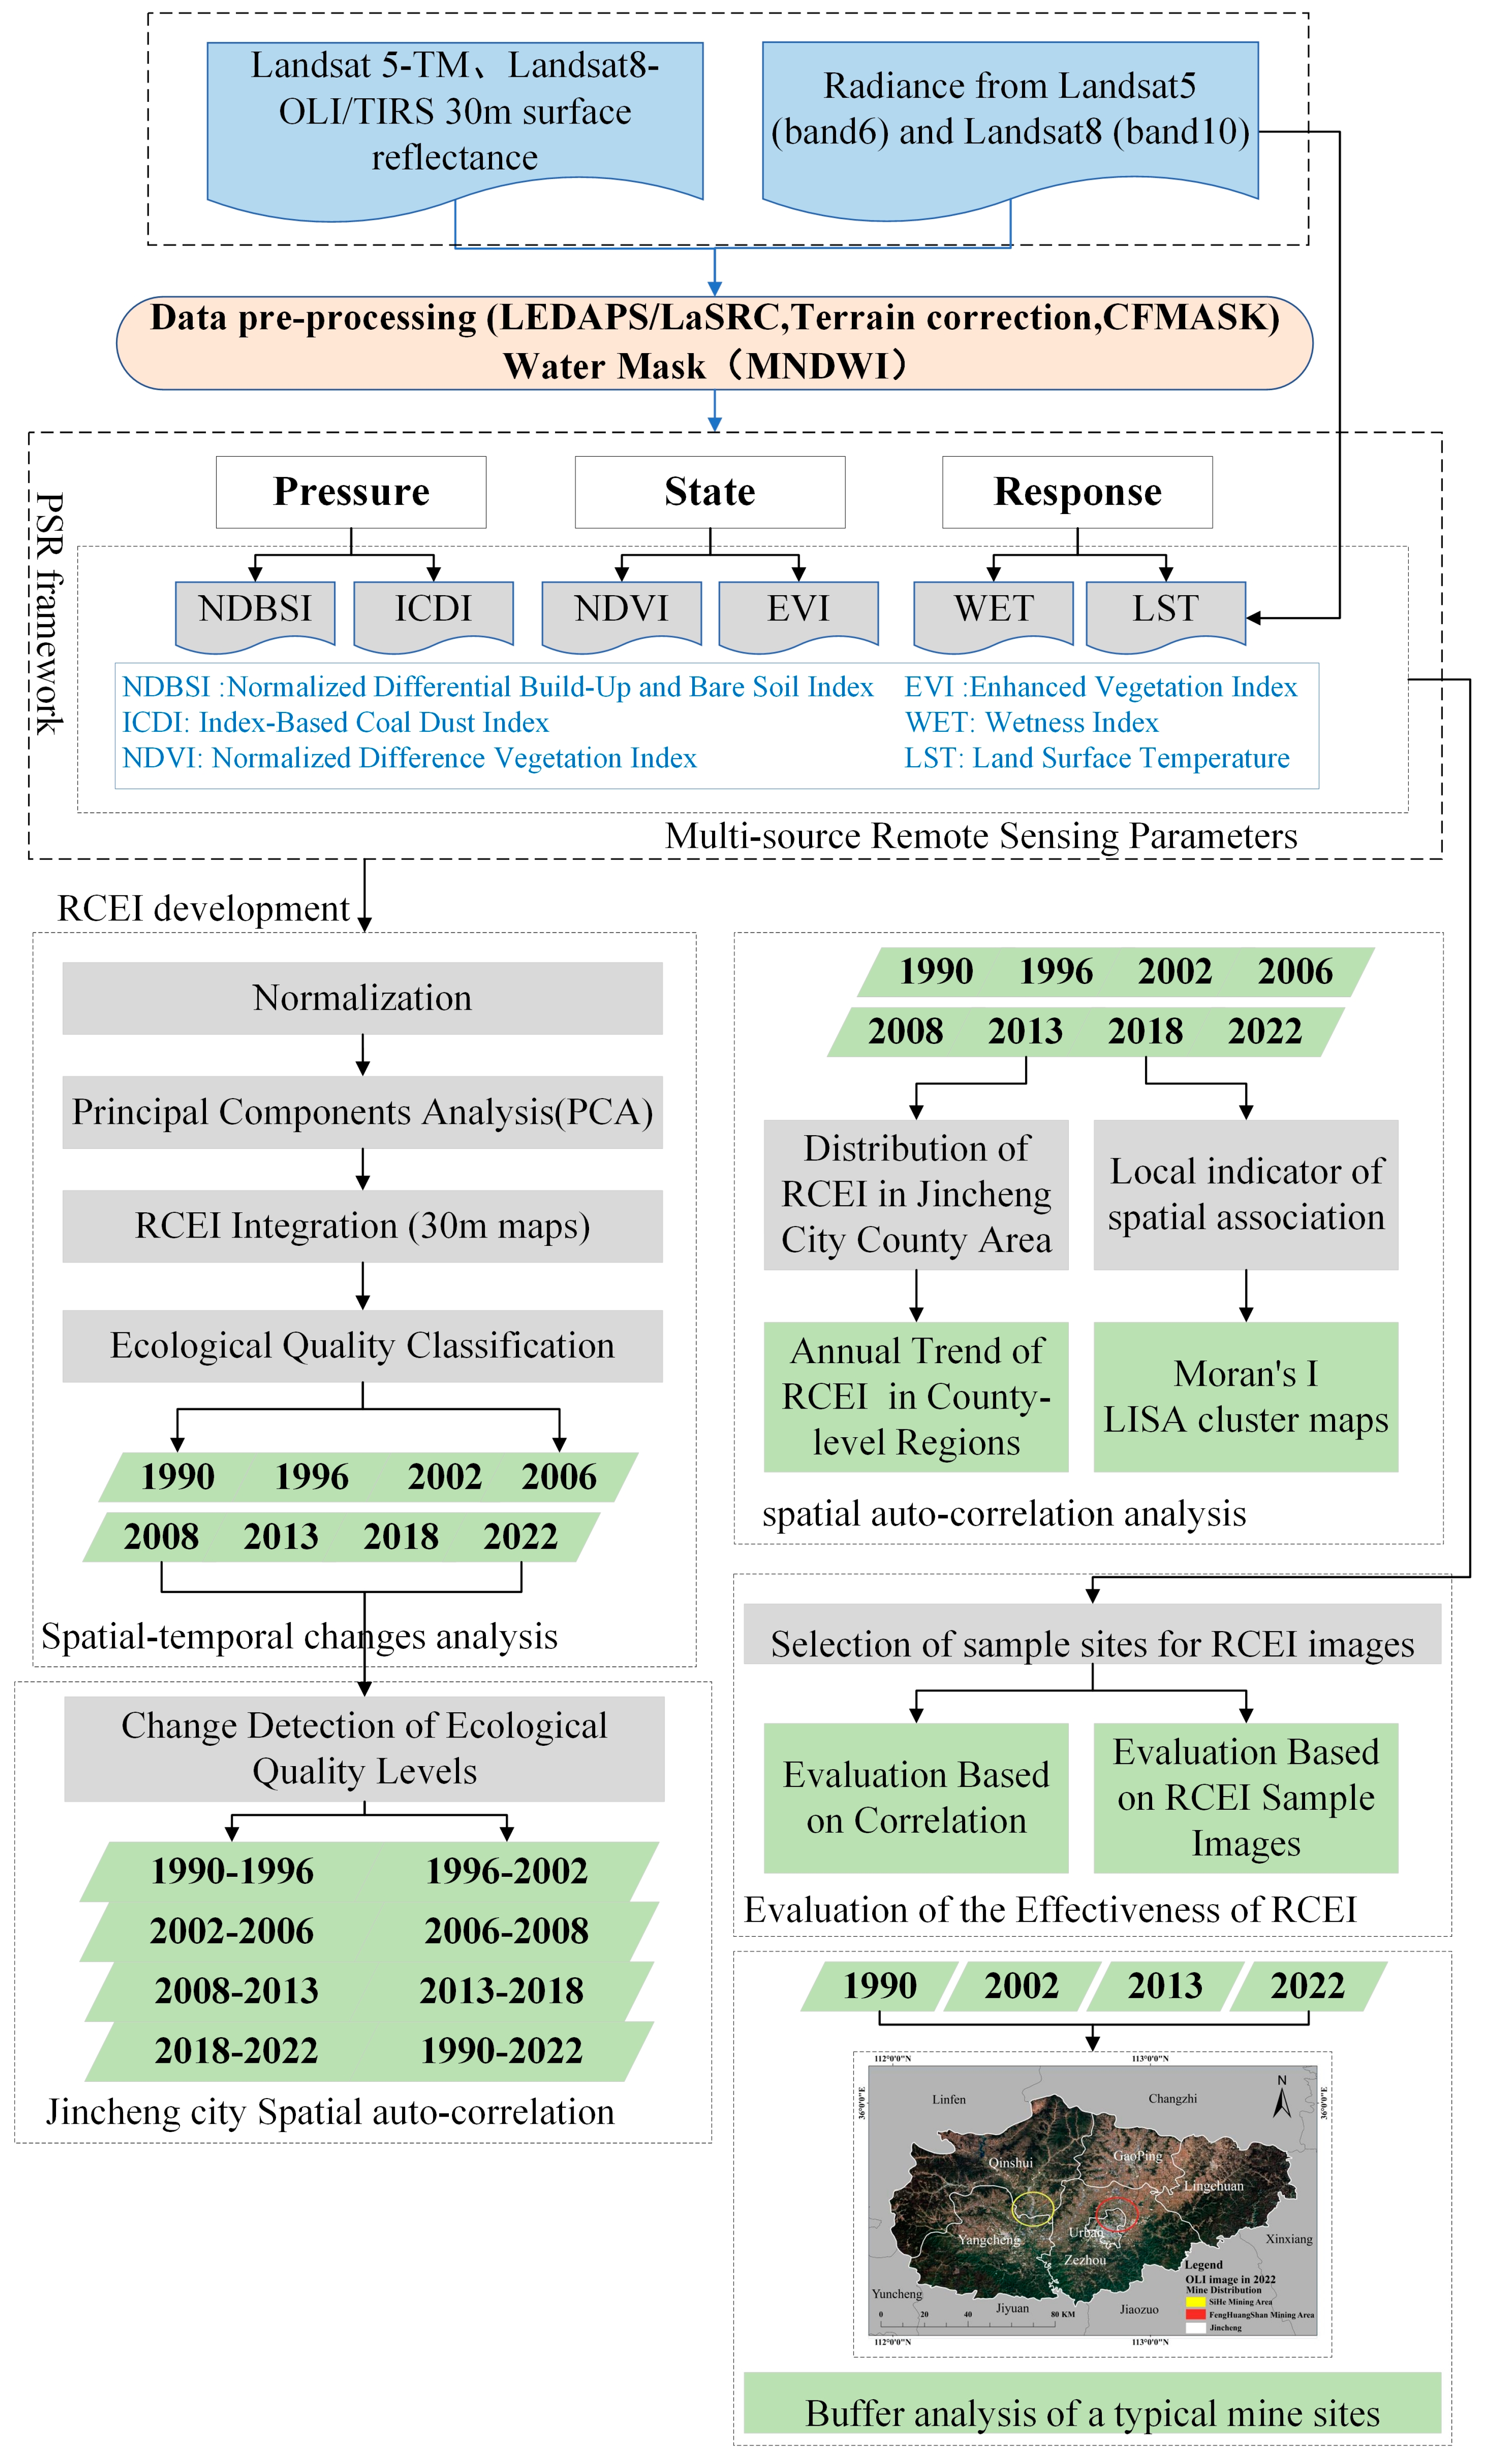
2.3. Methodology
2.3.1. Research Process
2.3.2. Spatial Autocorrelation Analysis
3. Results
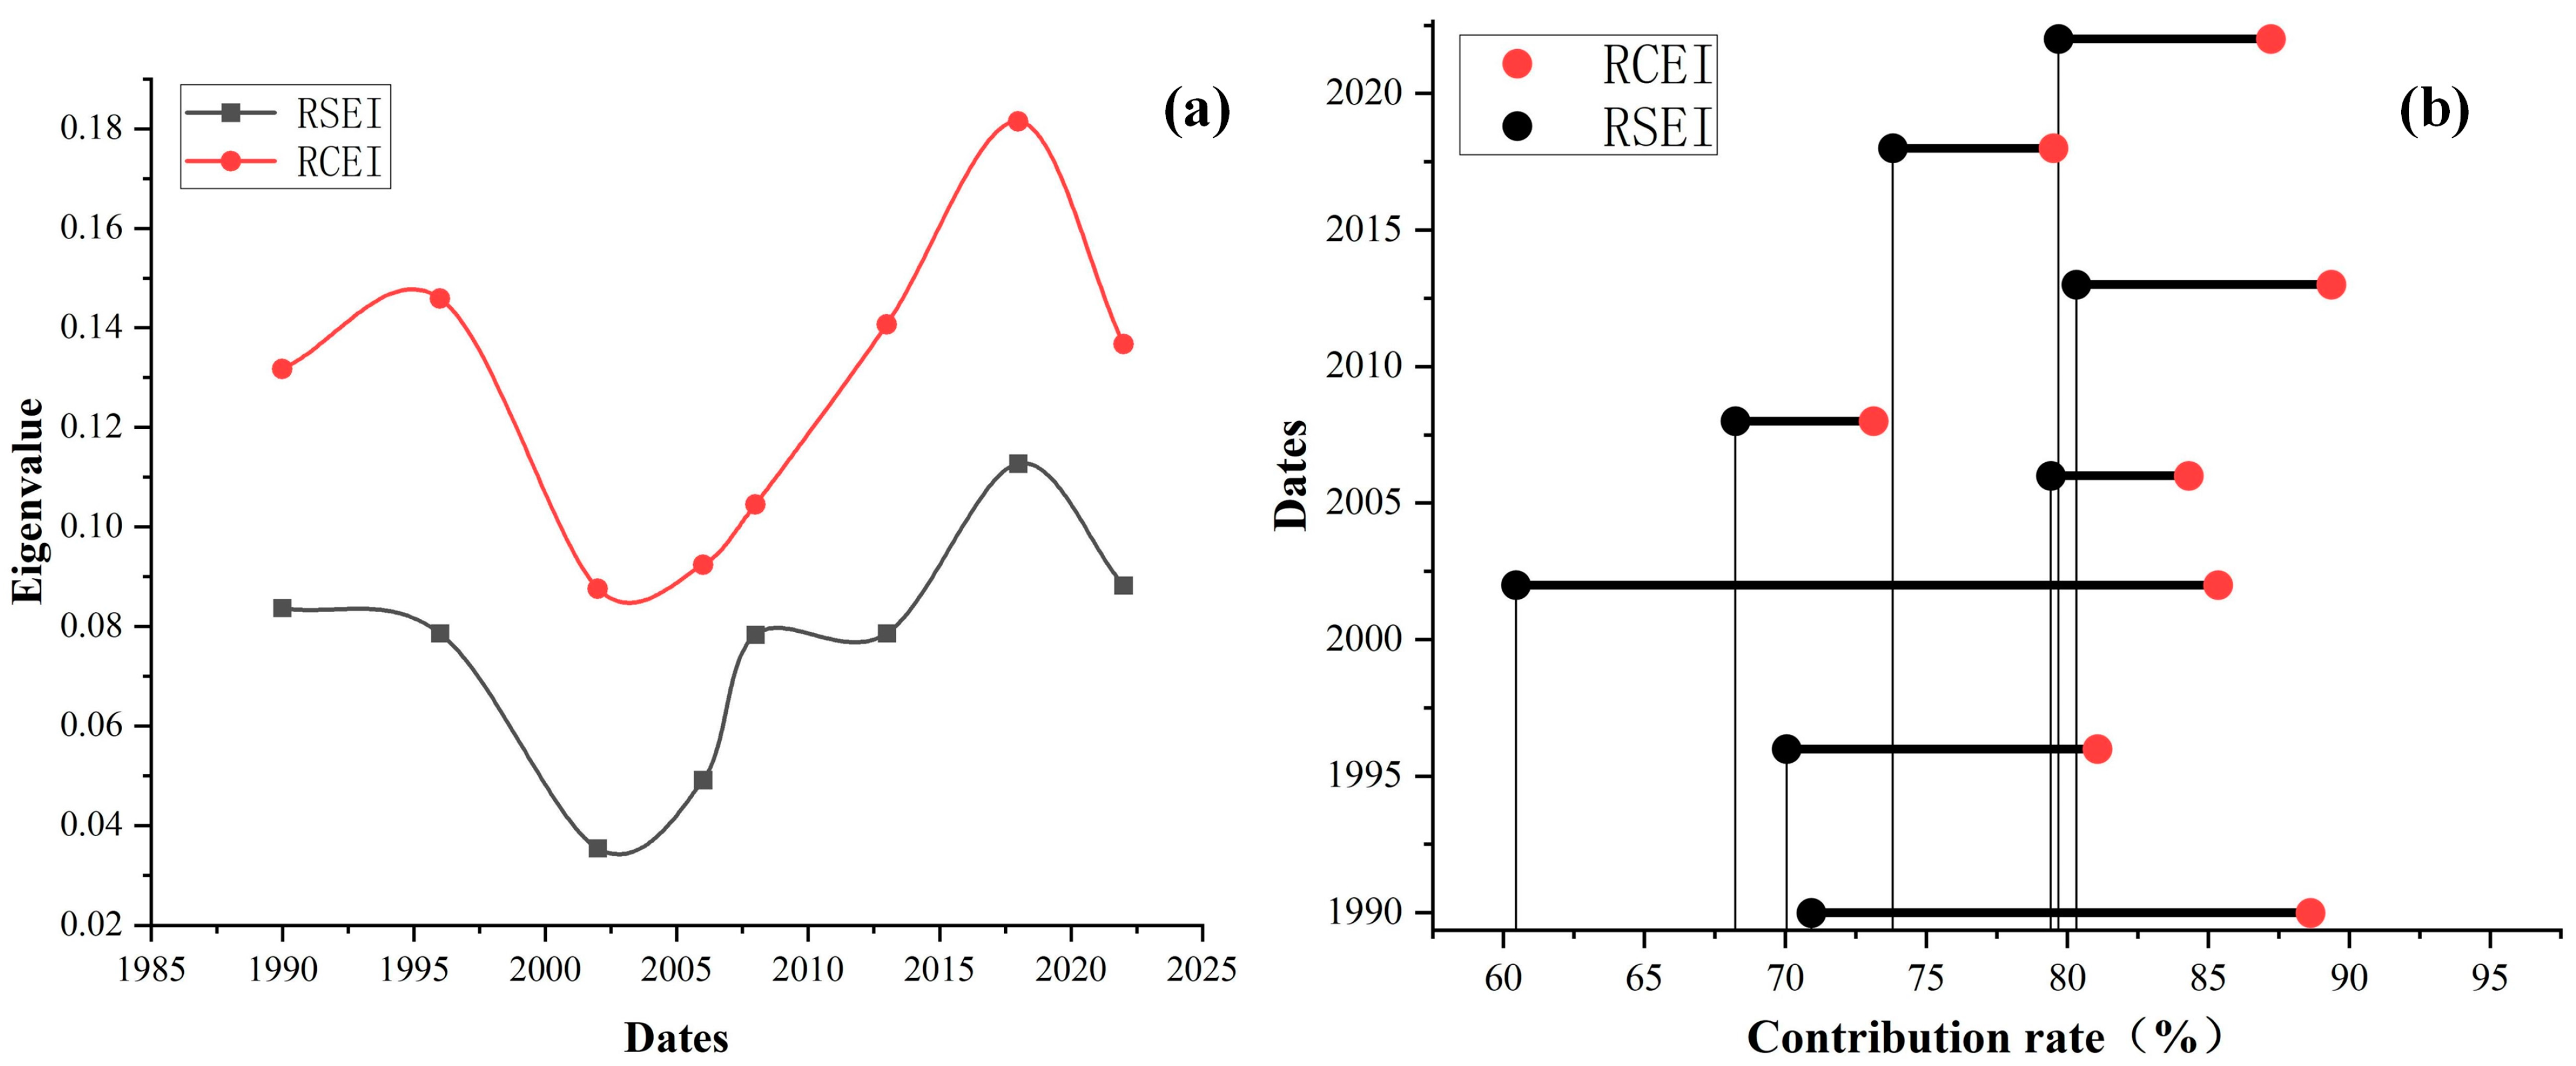
3.1. Comparative Analysis of the Remote Sensing Ecological Index RSEI and Resource-Based City Ecological Index RCEI
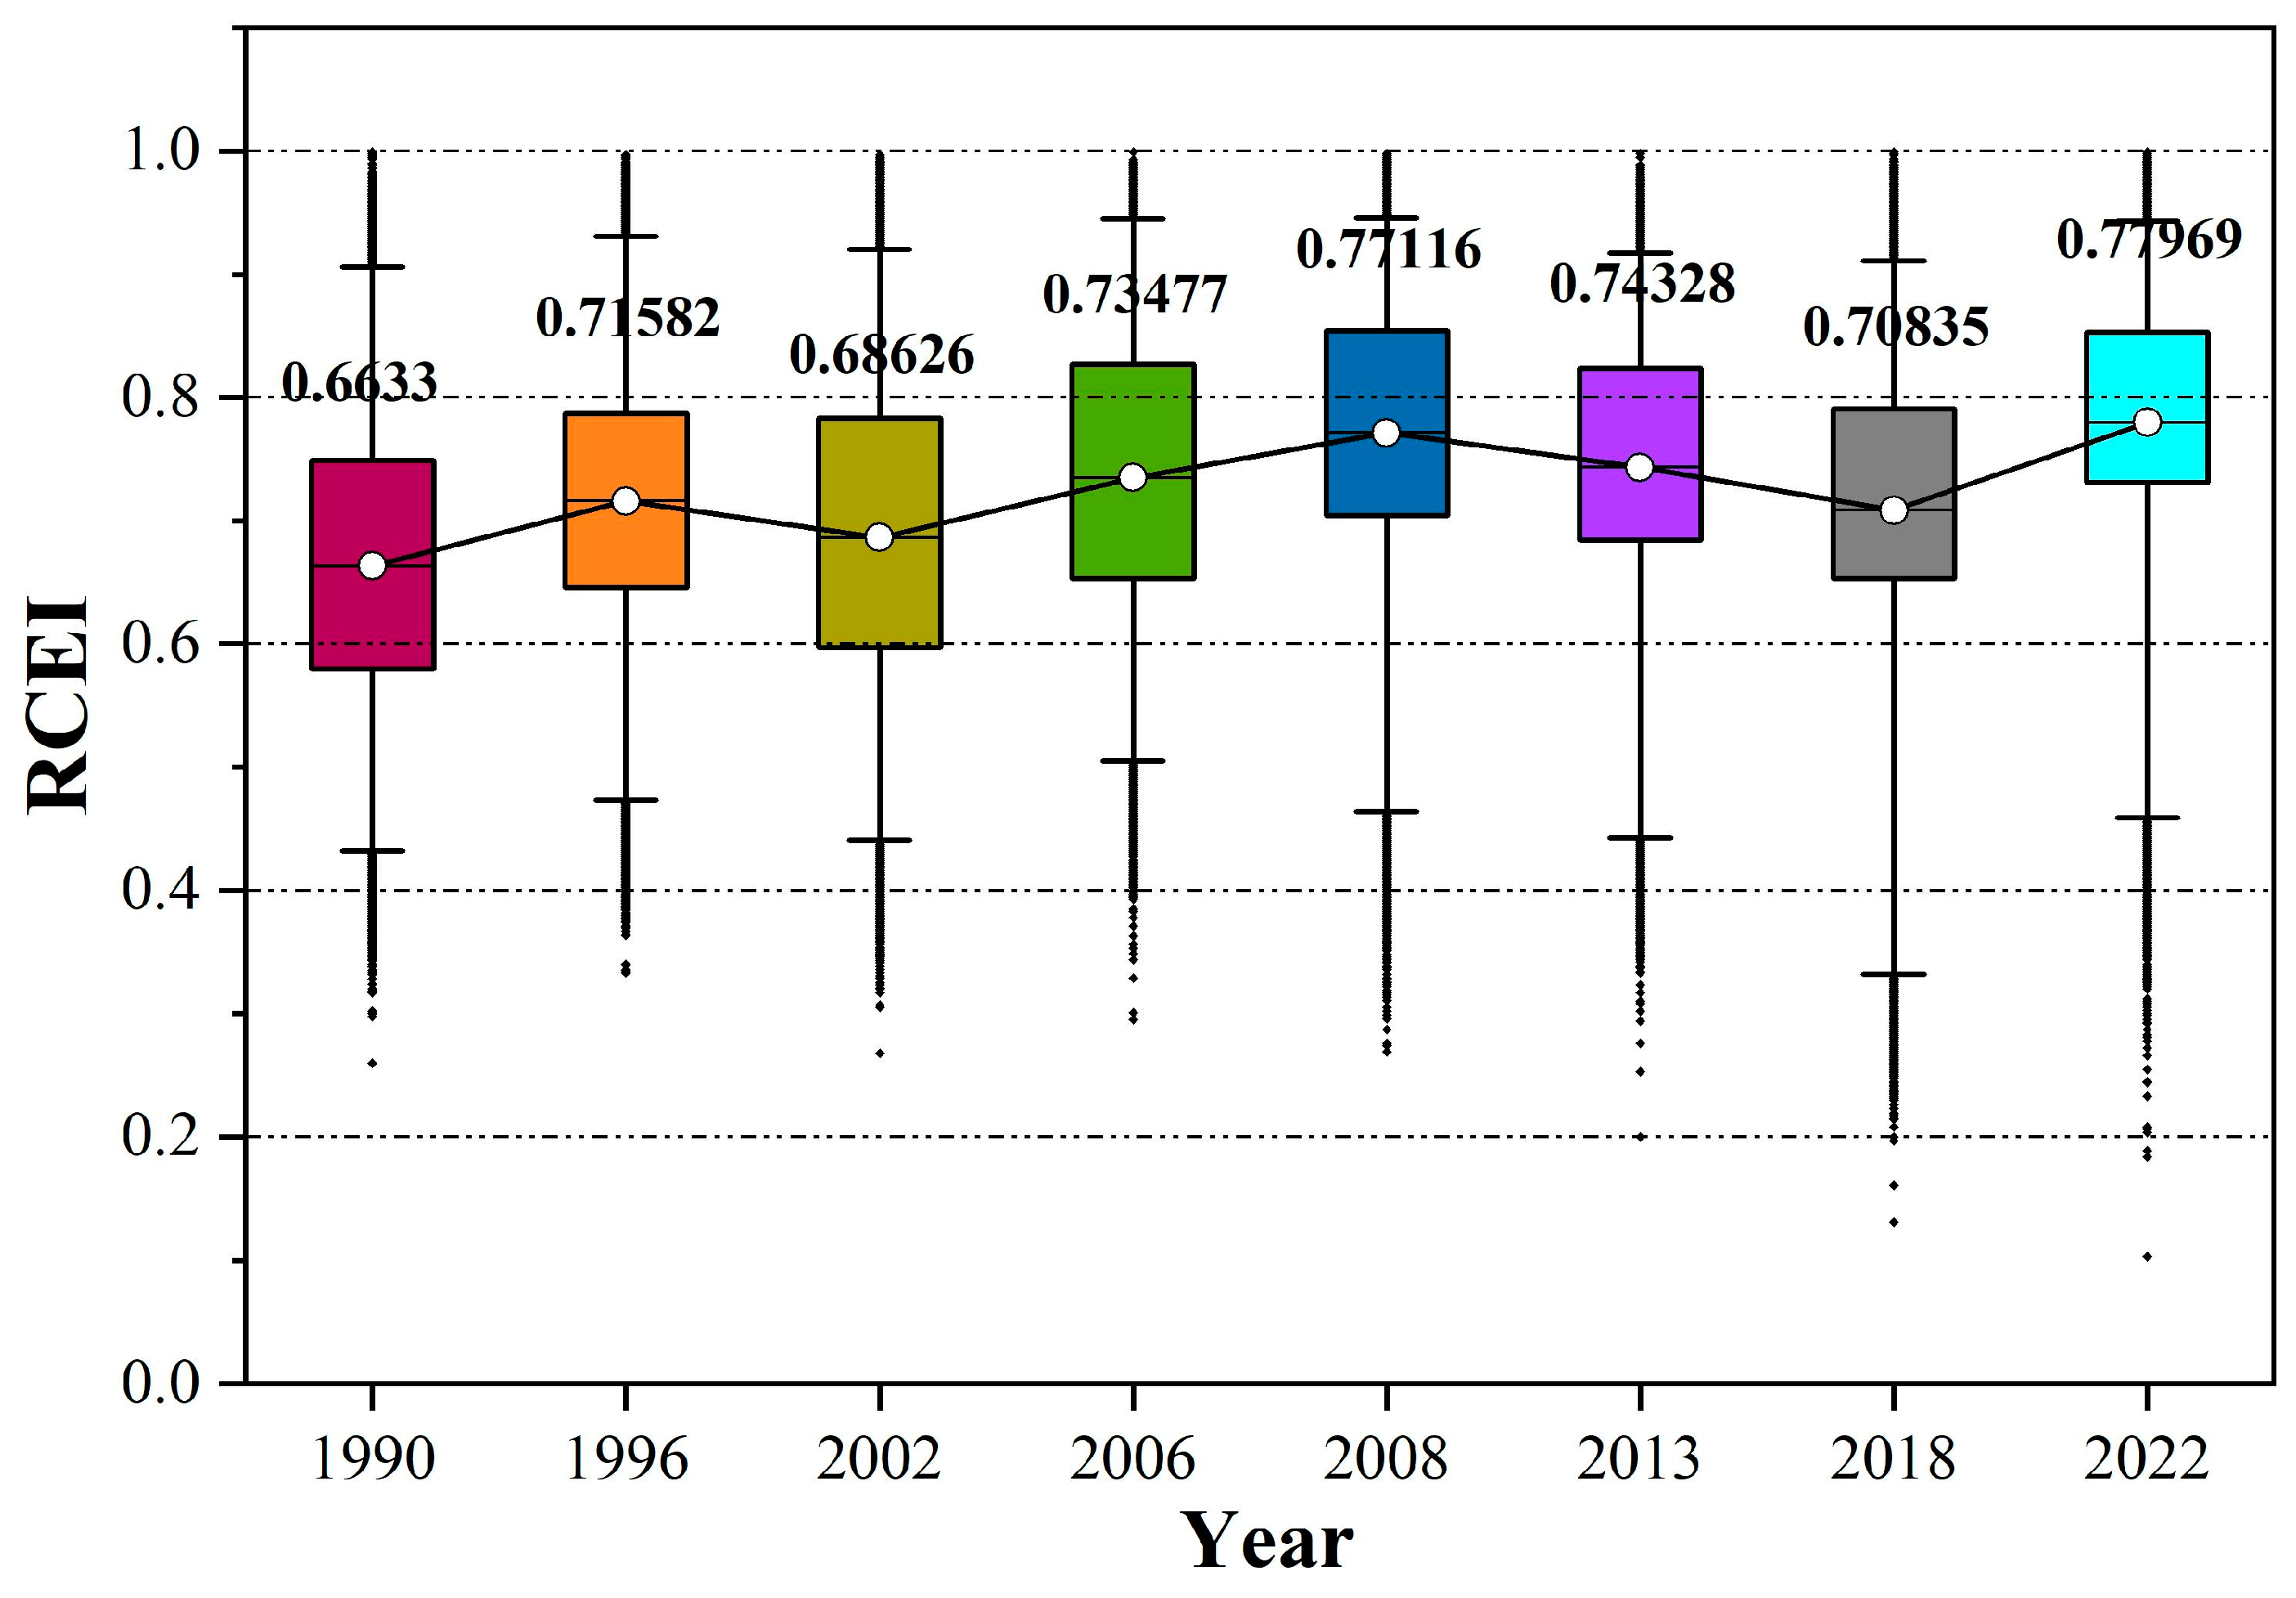
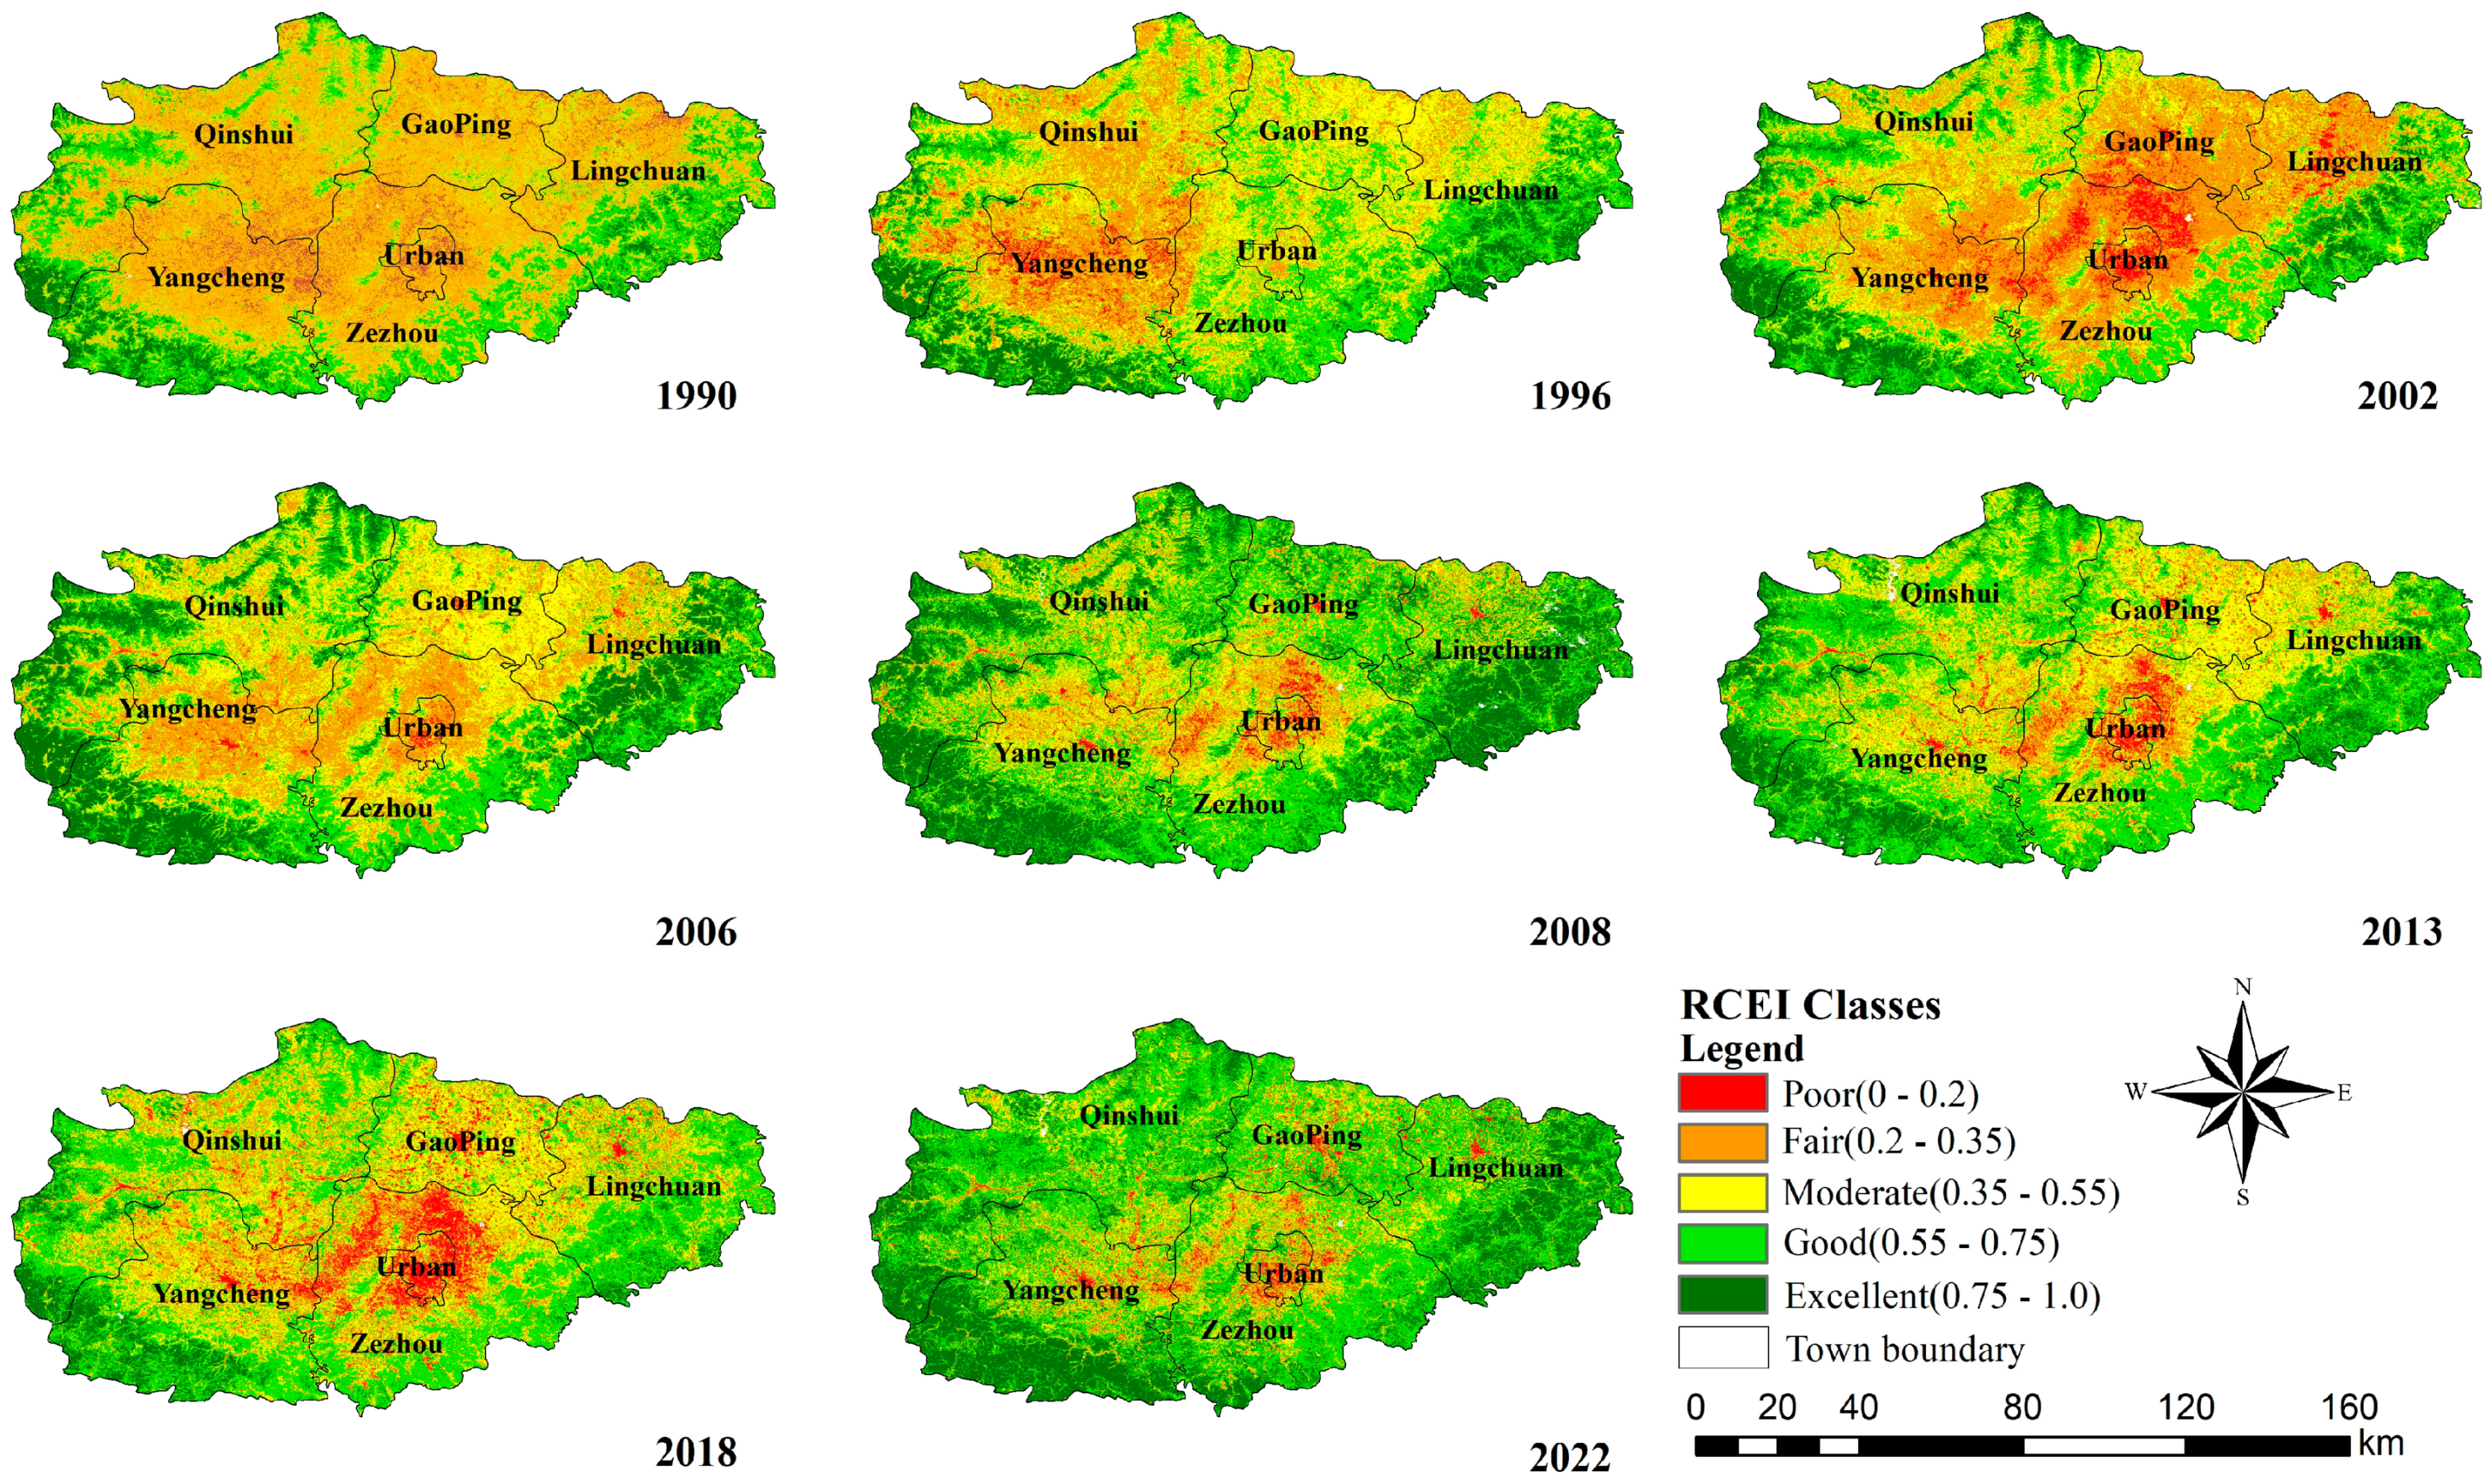
3.2. Comprehensive Evaluation of Ecological Environmental Quality in Jincheng City
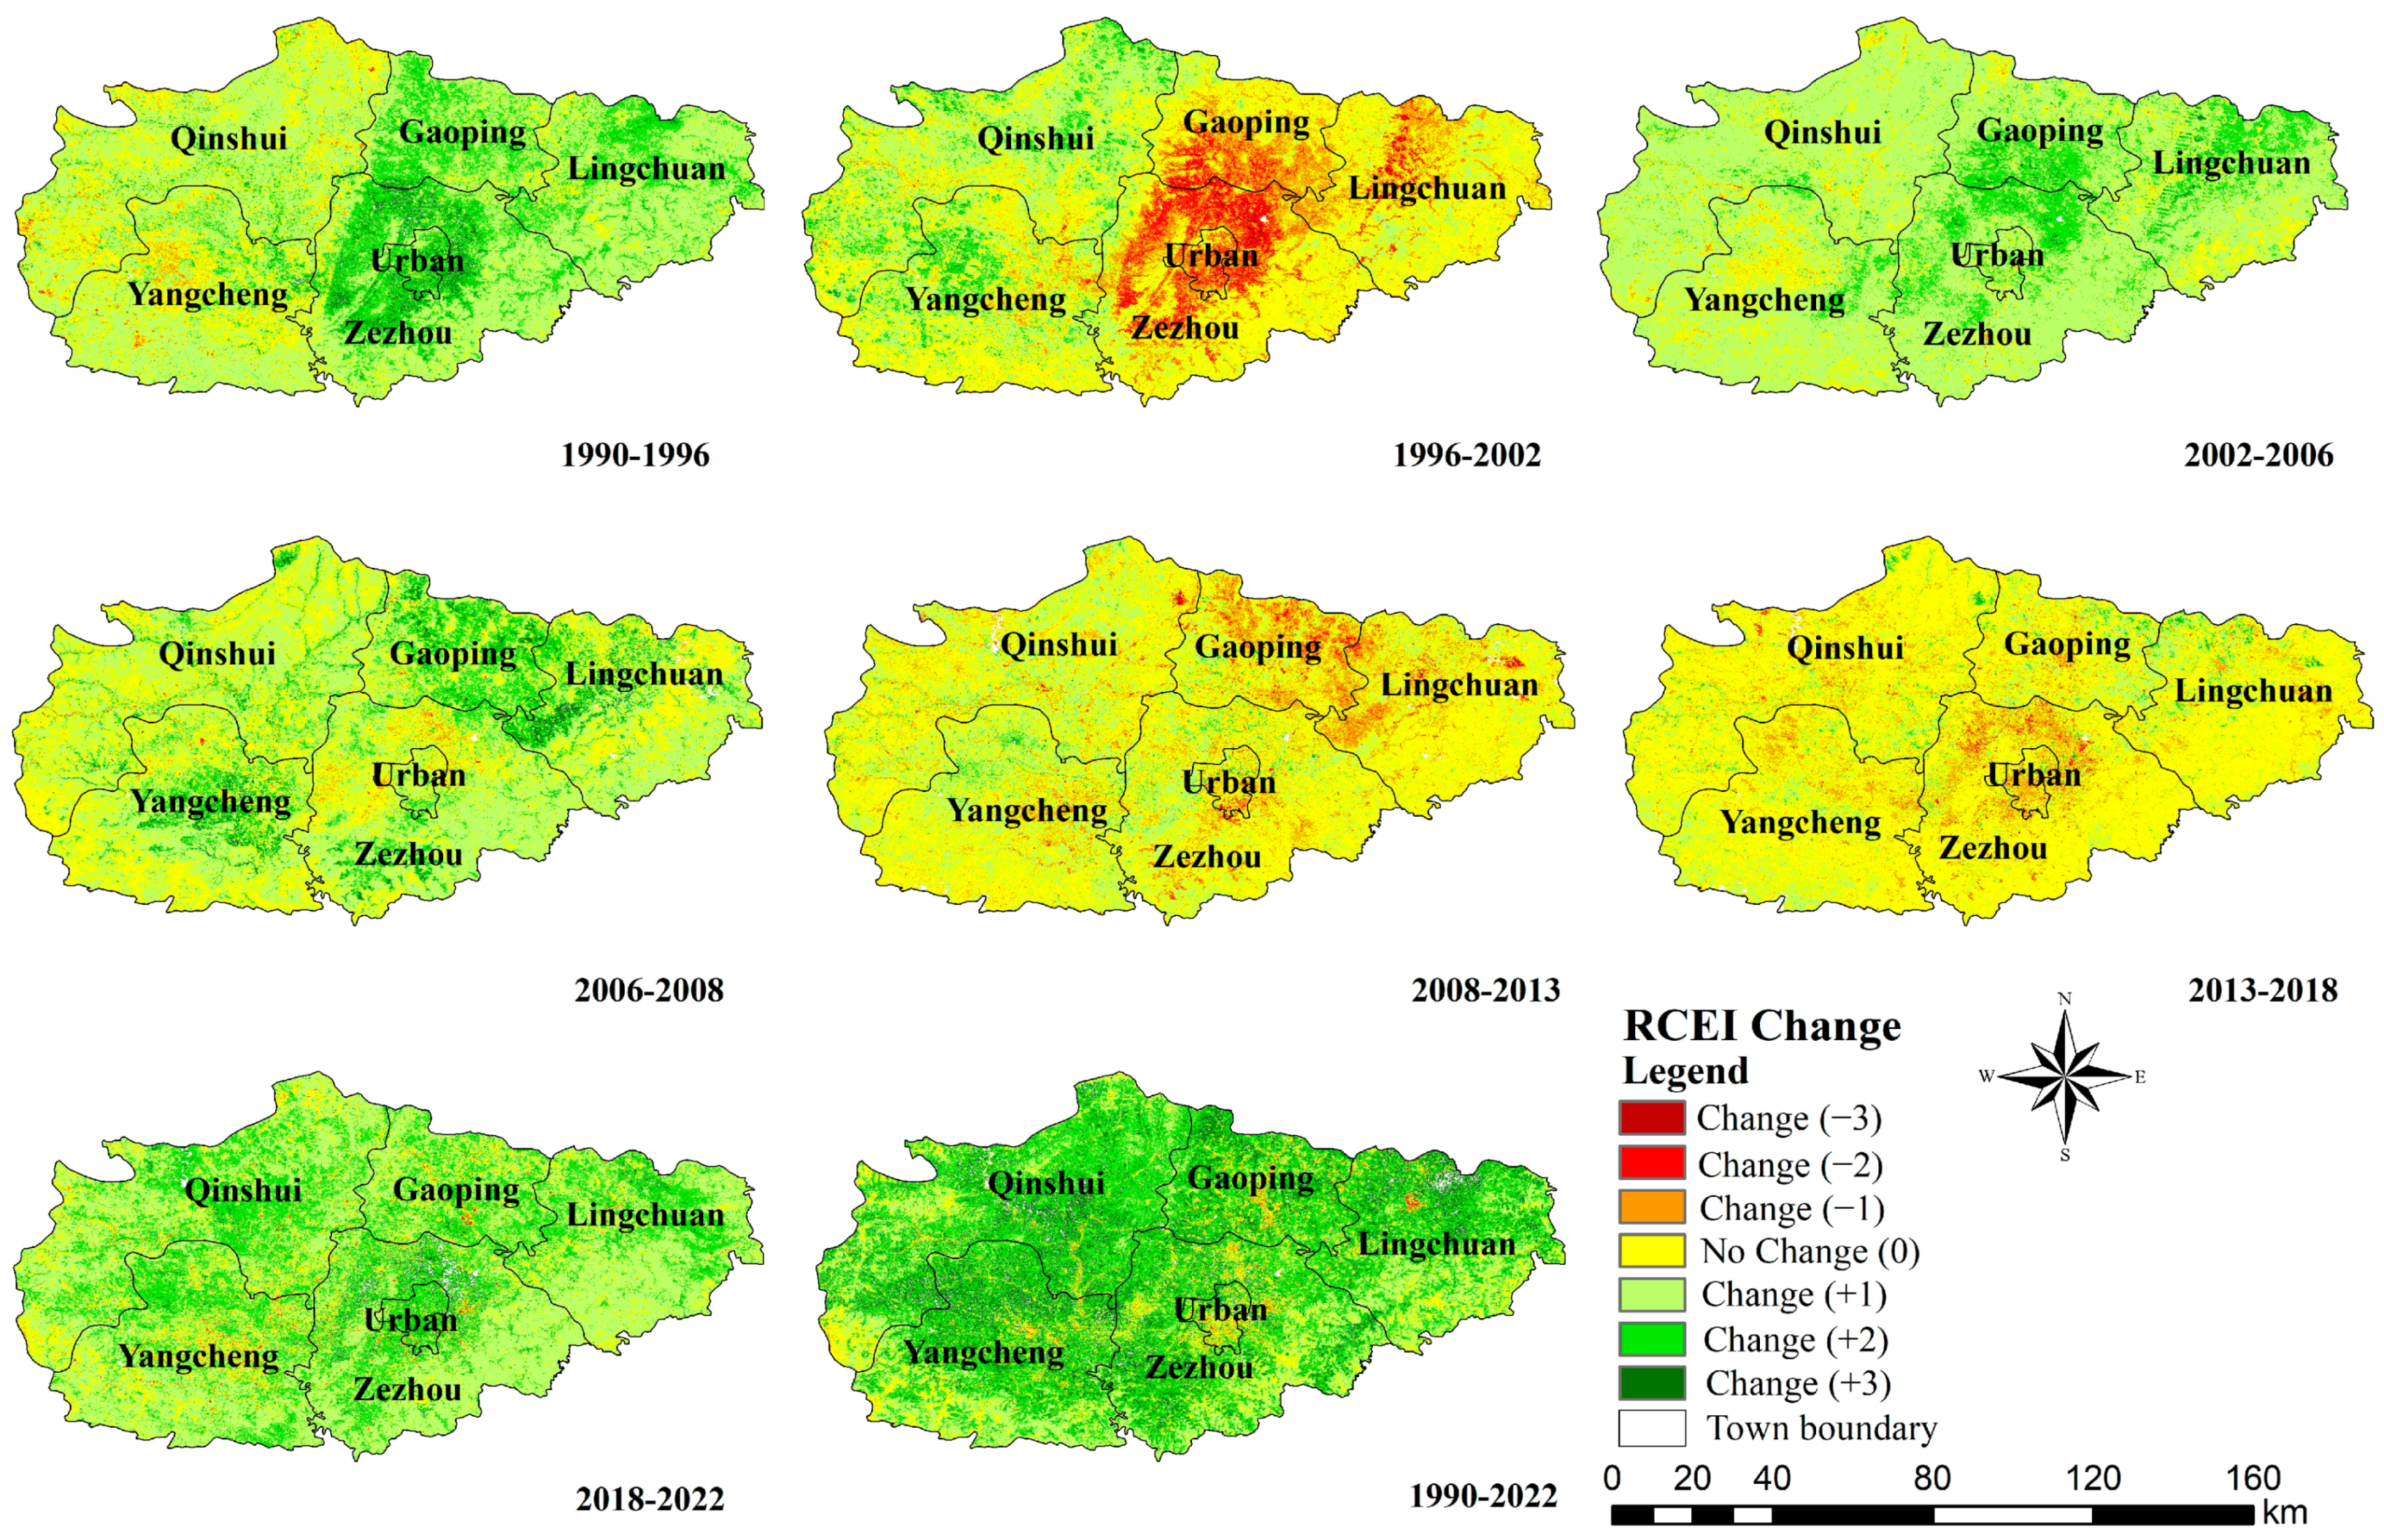
3.3. Dynamic Change in Ecological Environmental Quality in Jincheng City
3.4. Analysis of Ecological Environmental Quality and Land Use Change in Jincheng City
4. Discussion
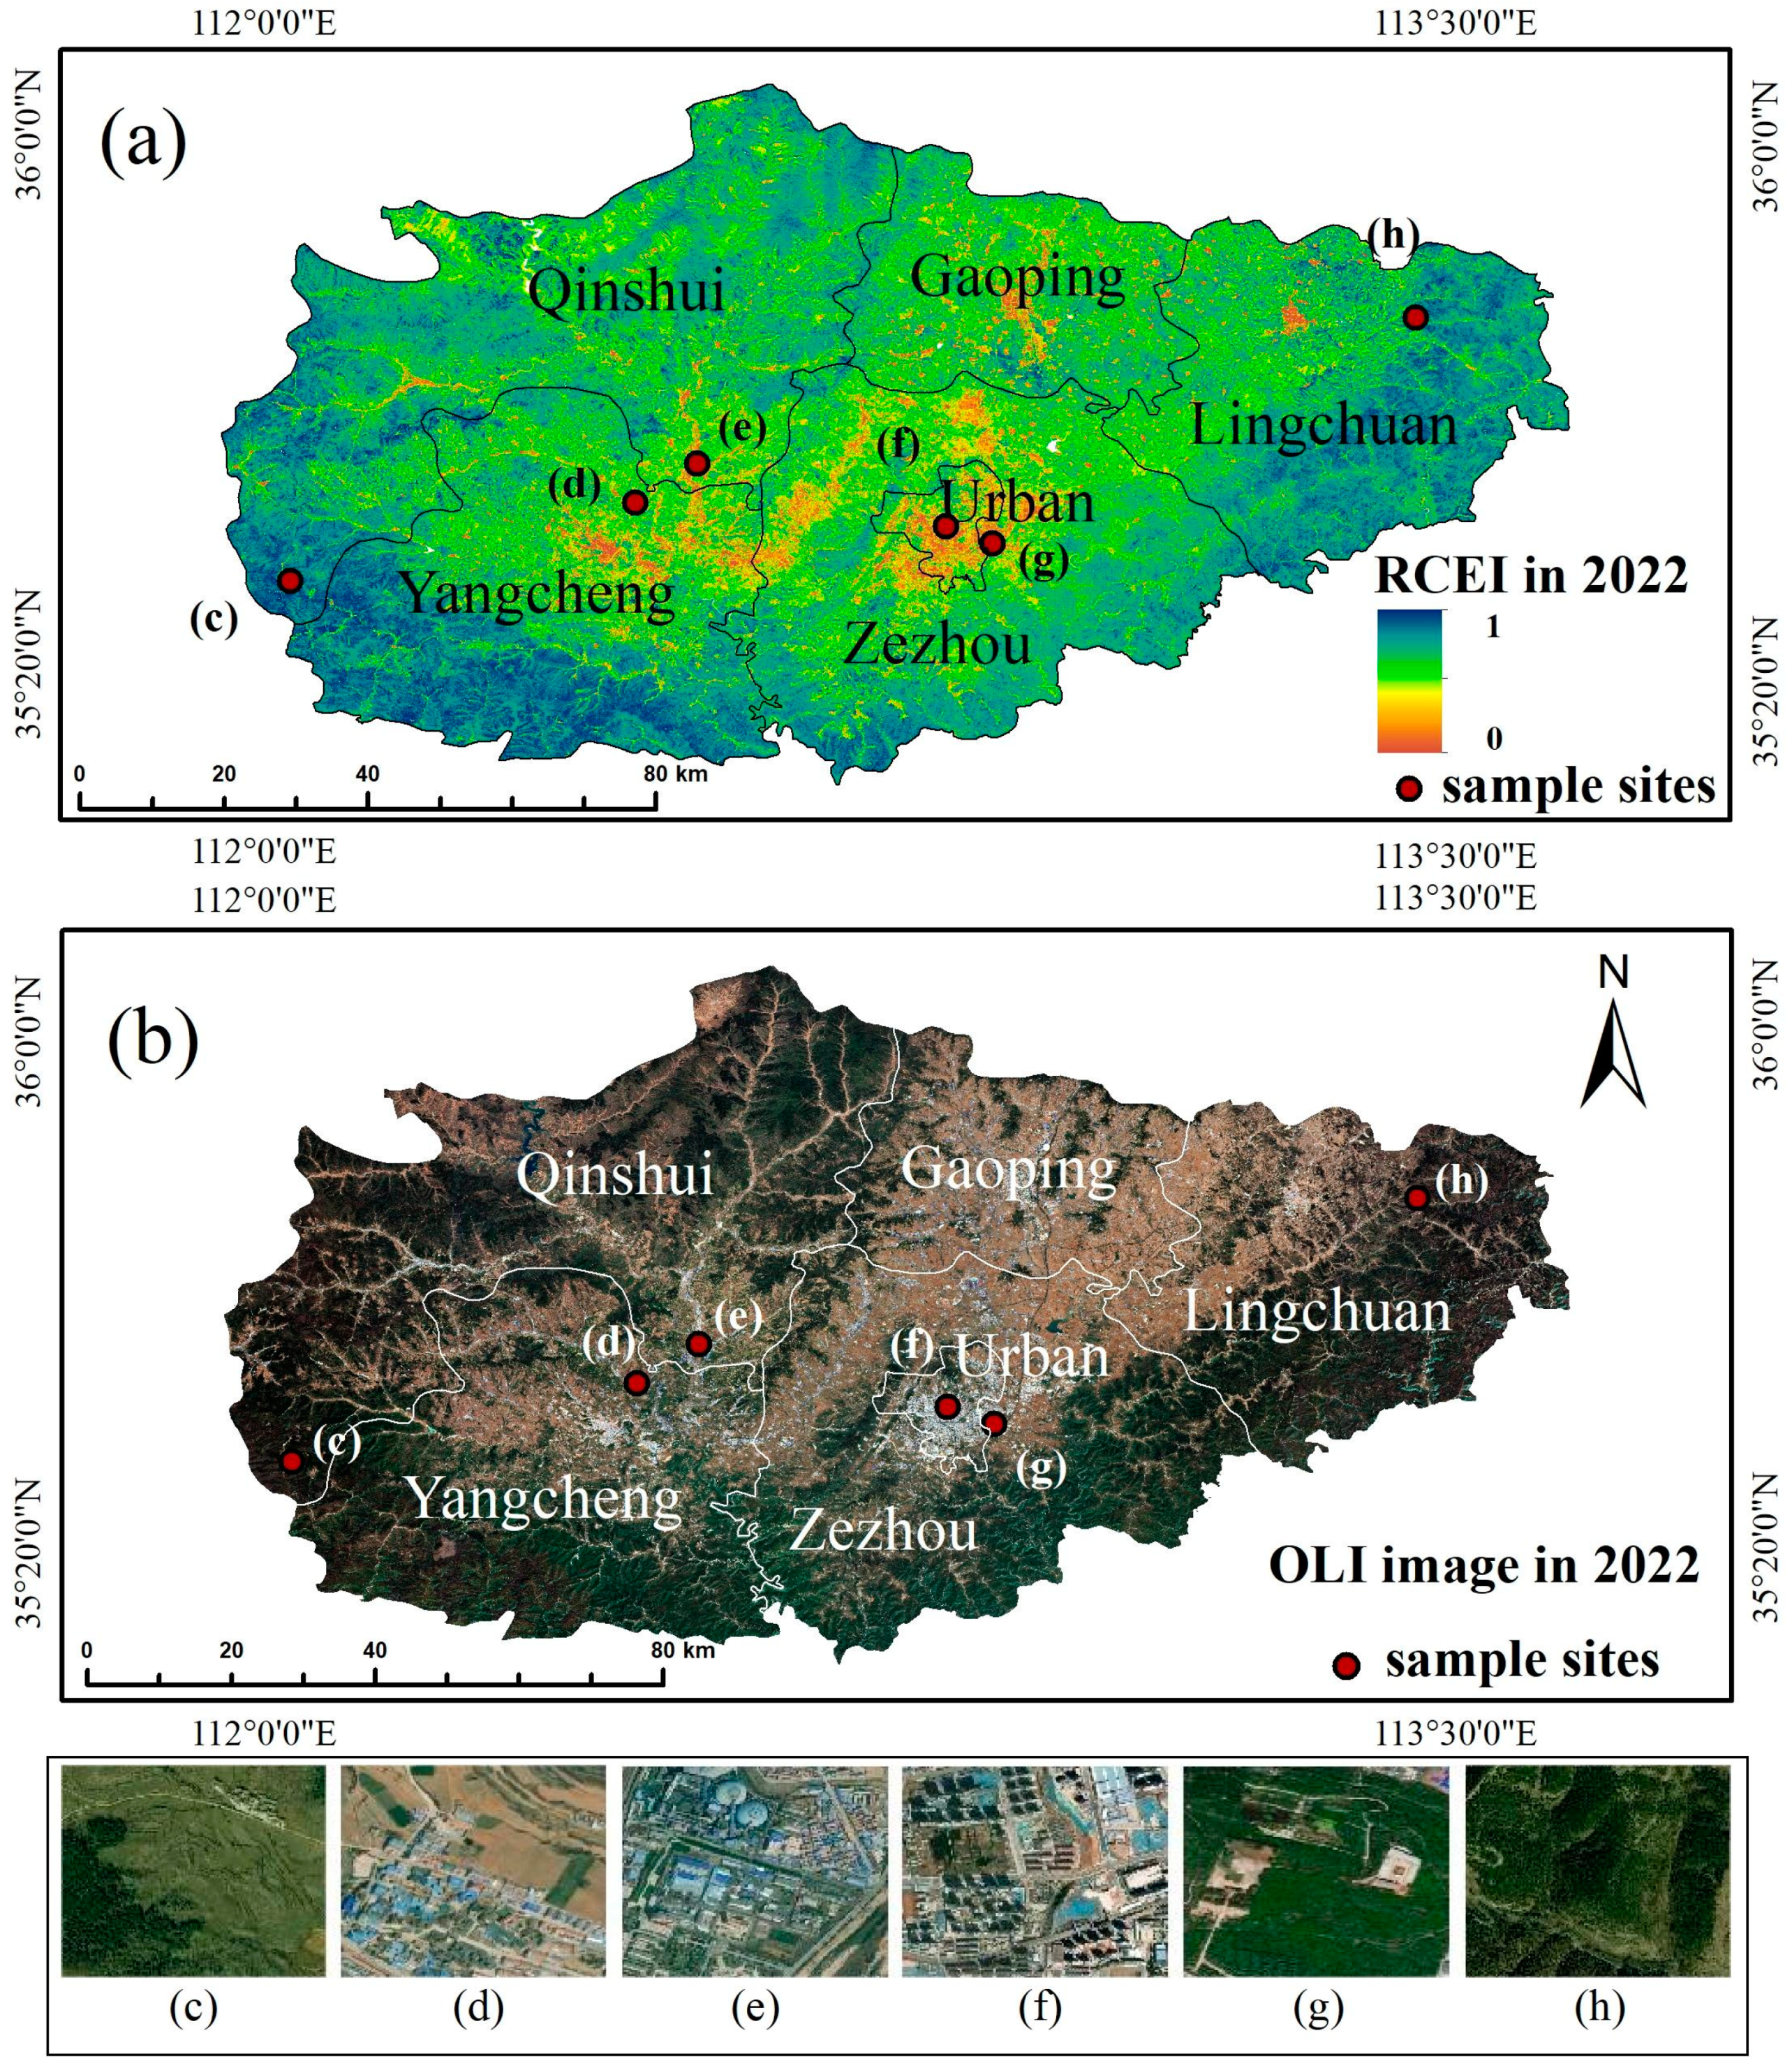
4.1. Evaluation Based on RCEI Sample Images
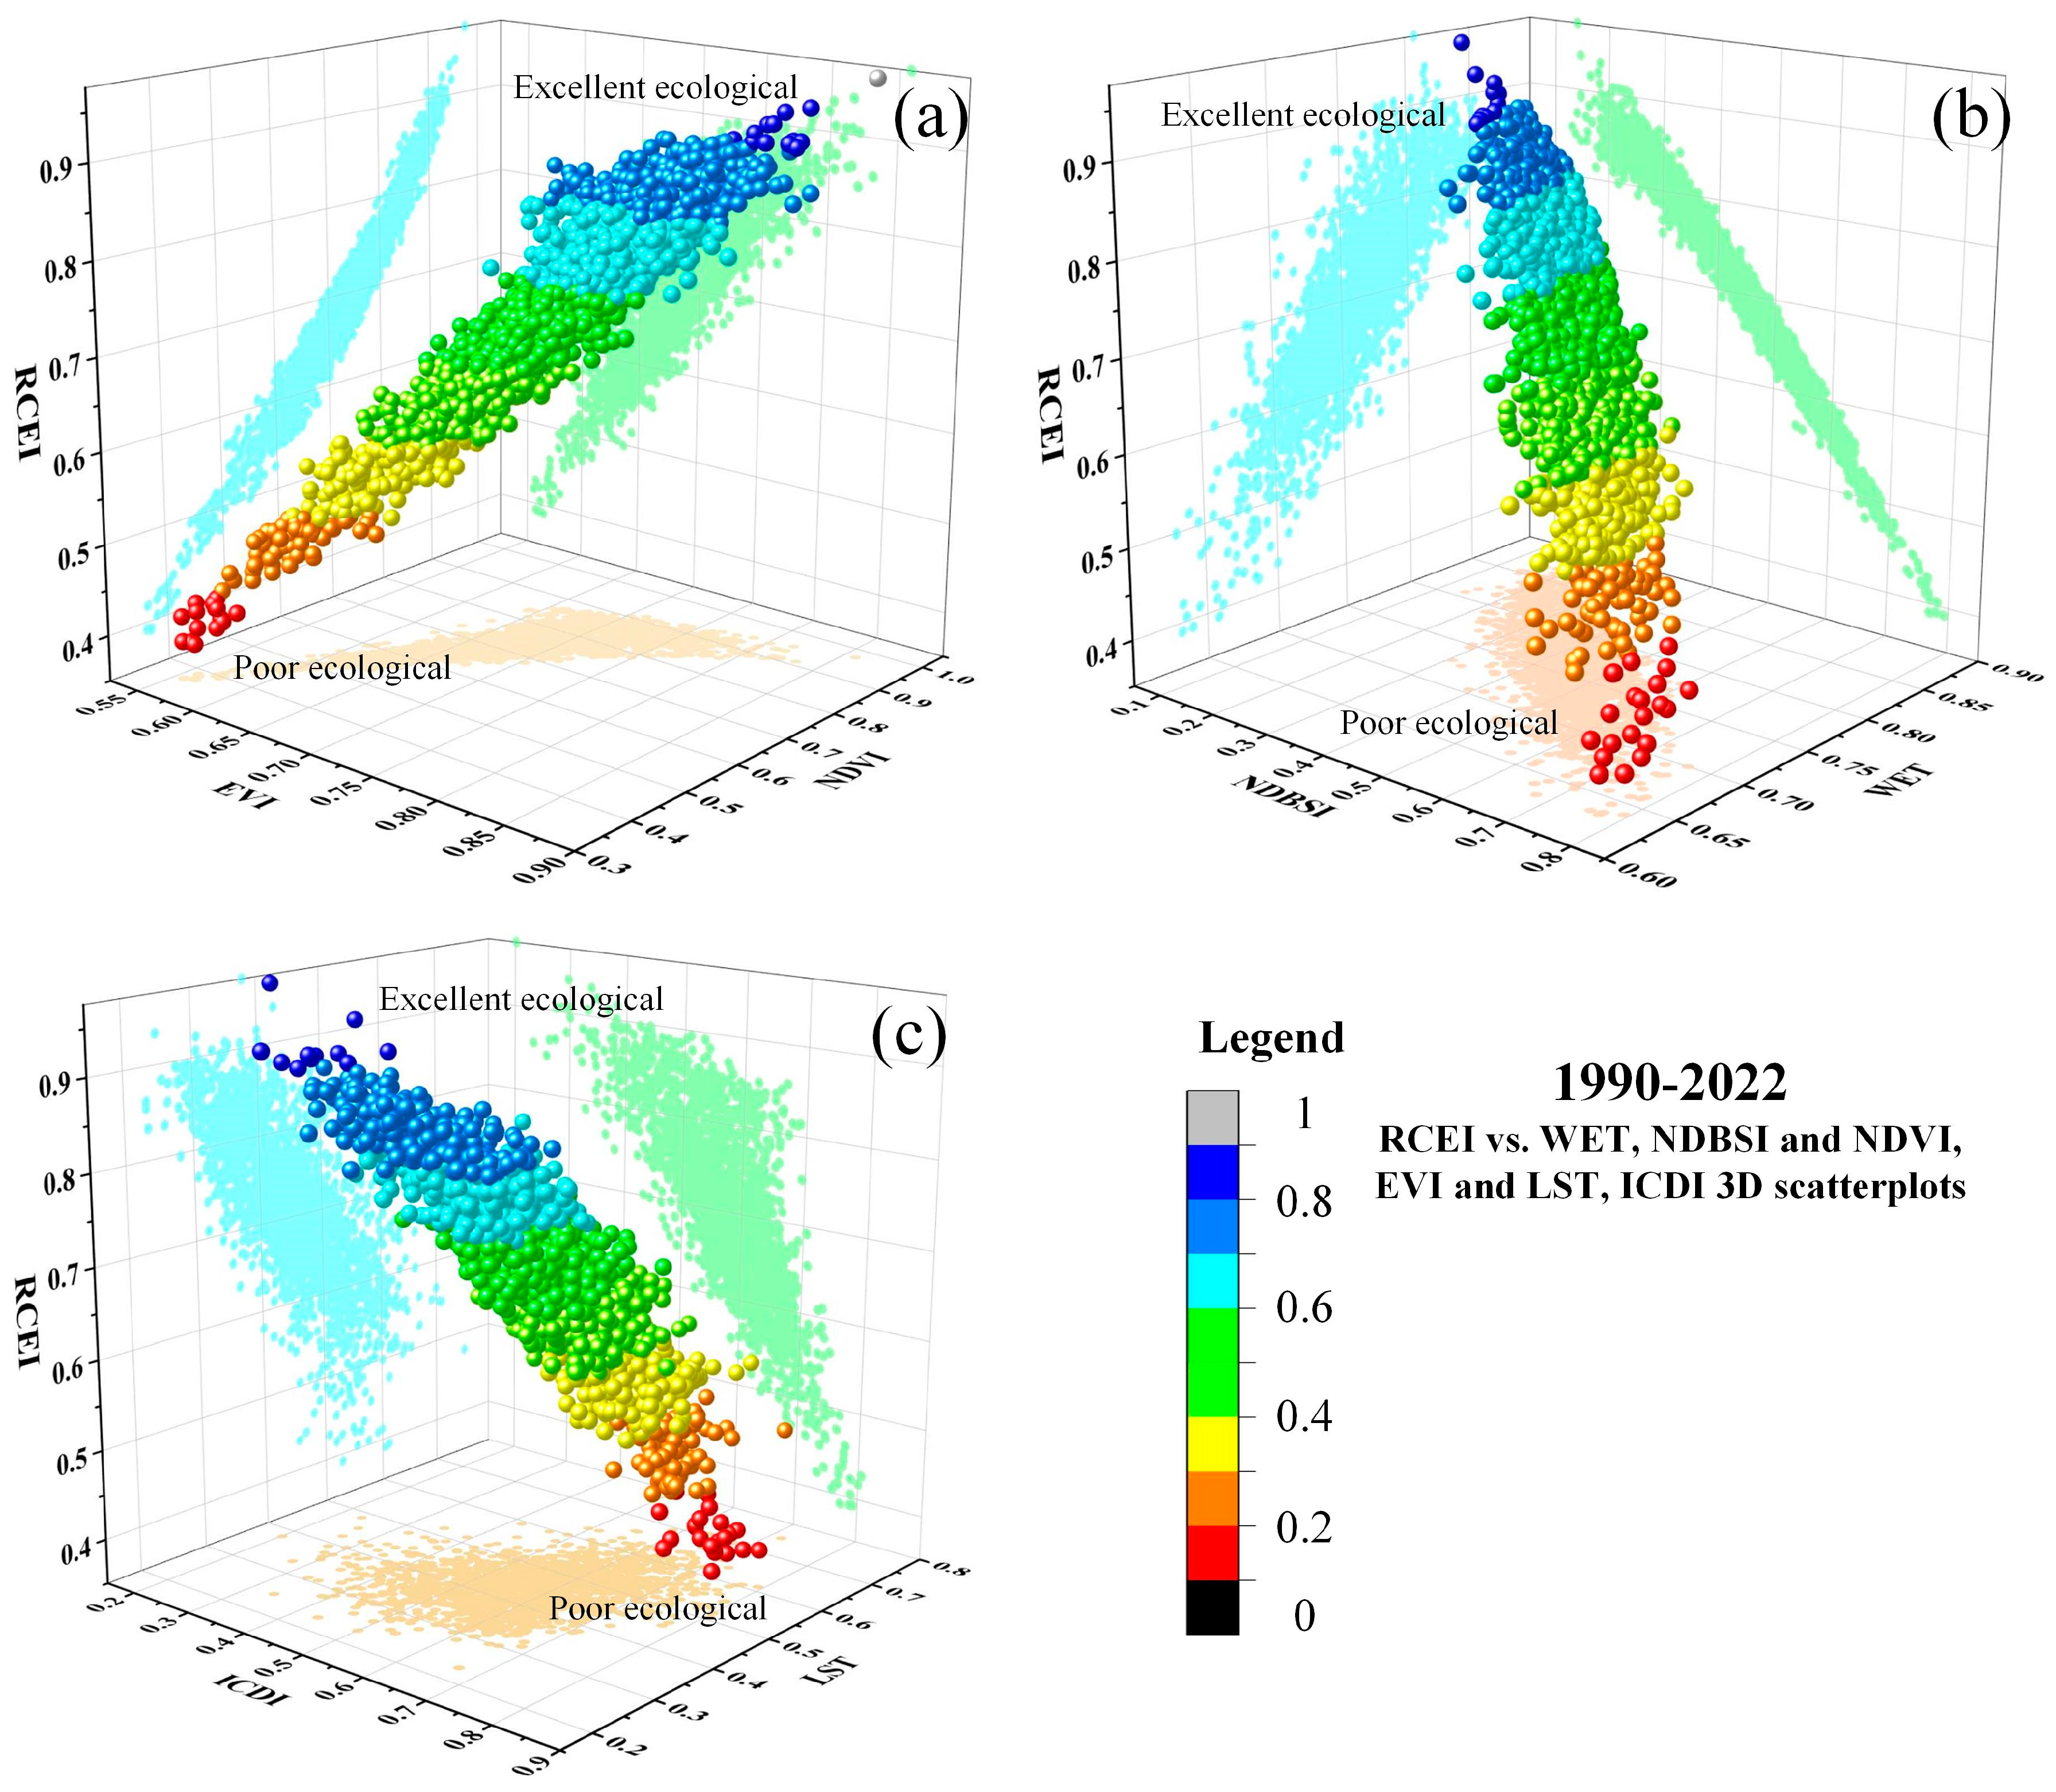
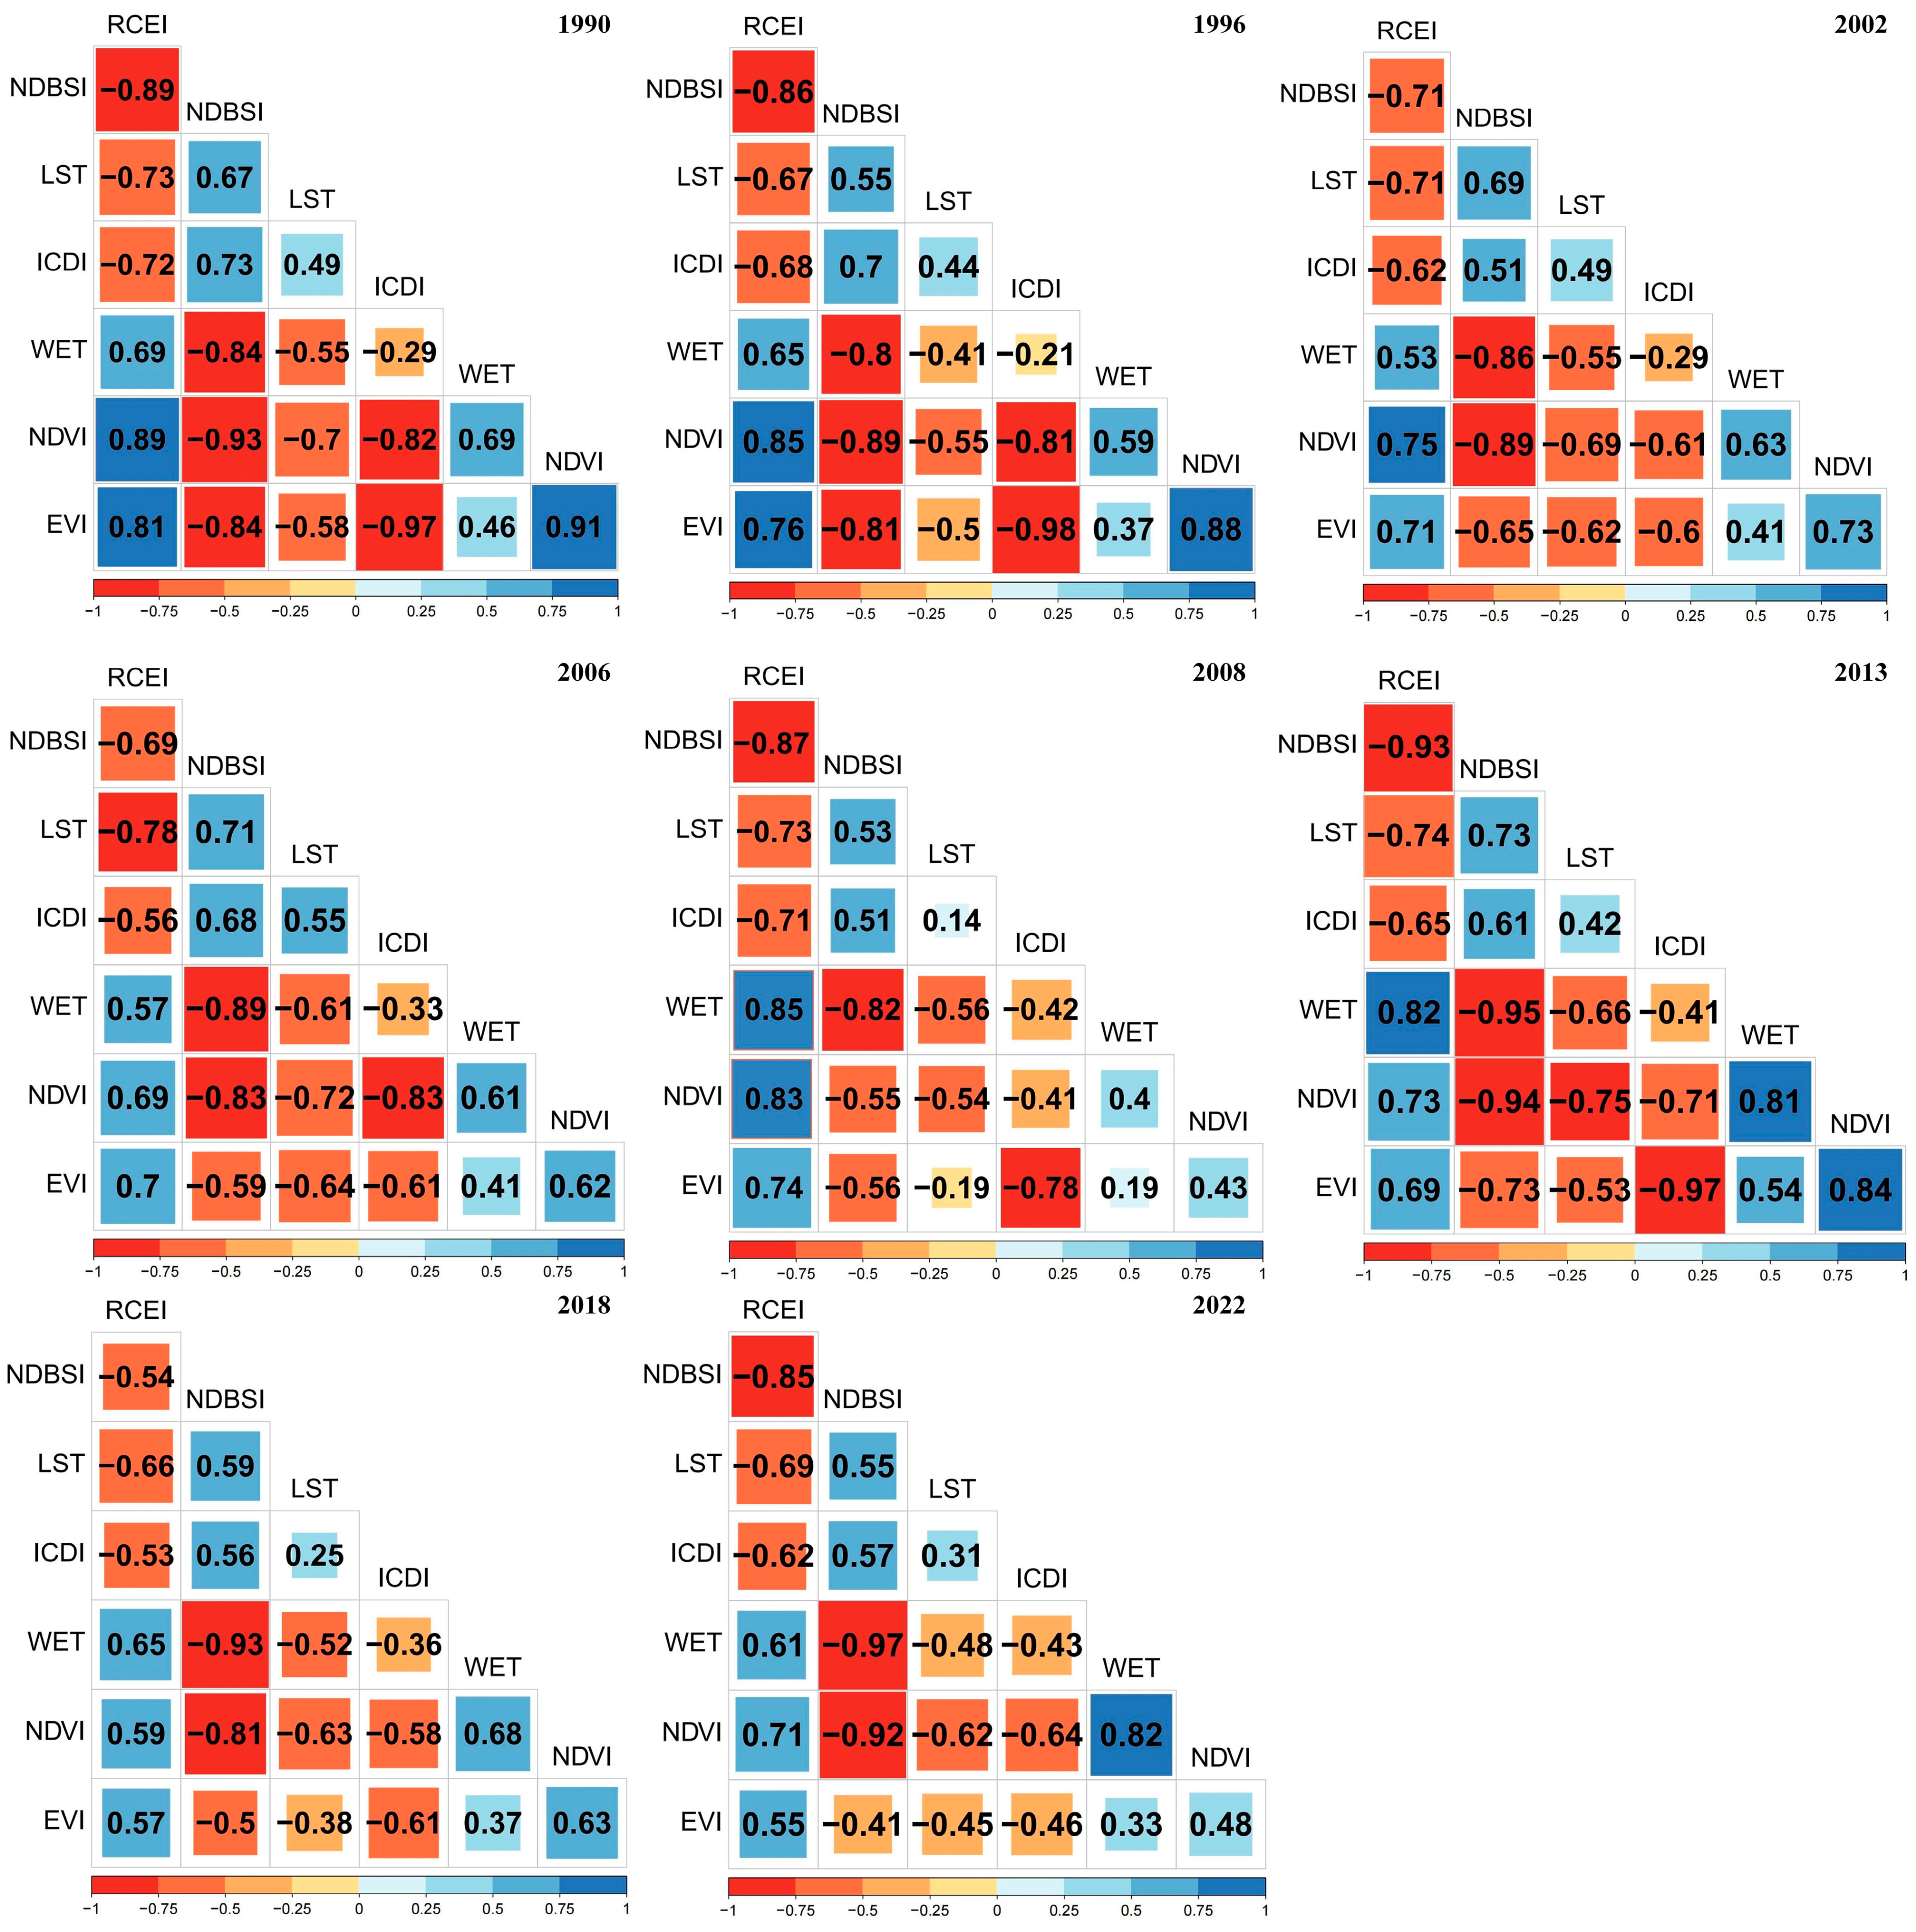
4.2. Analysis of the Correlation between Component Indicators and RCEI
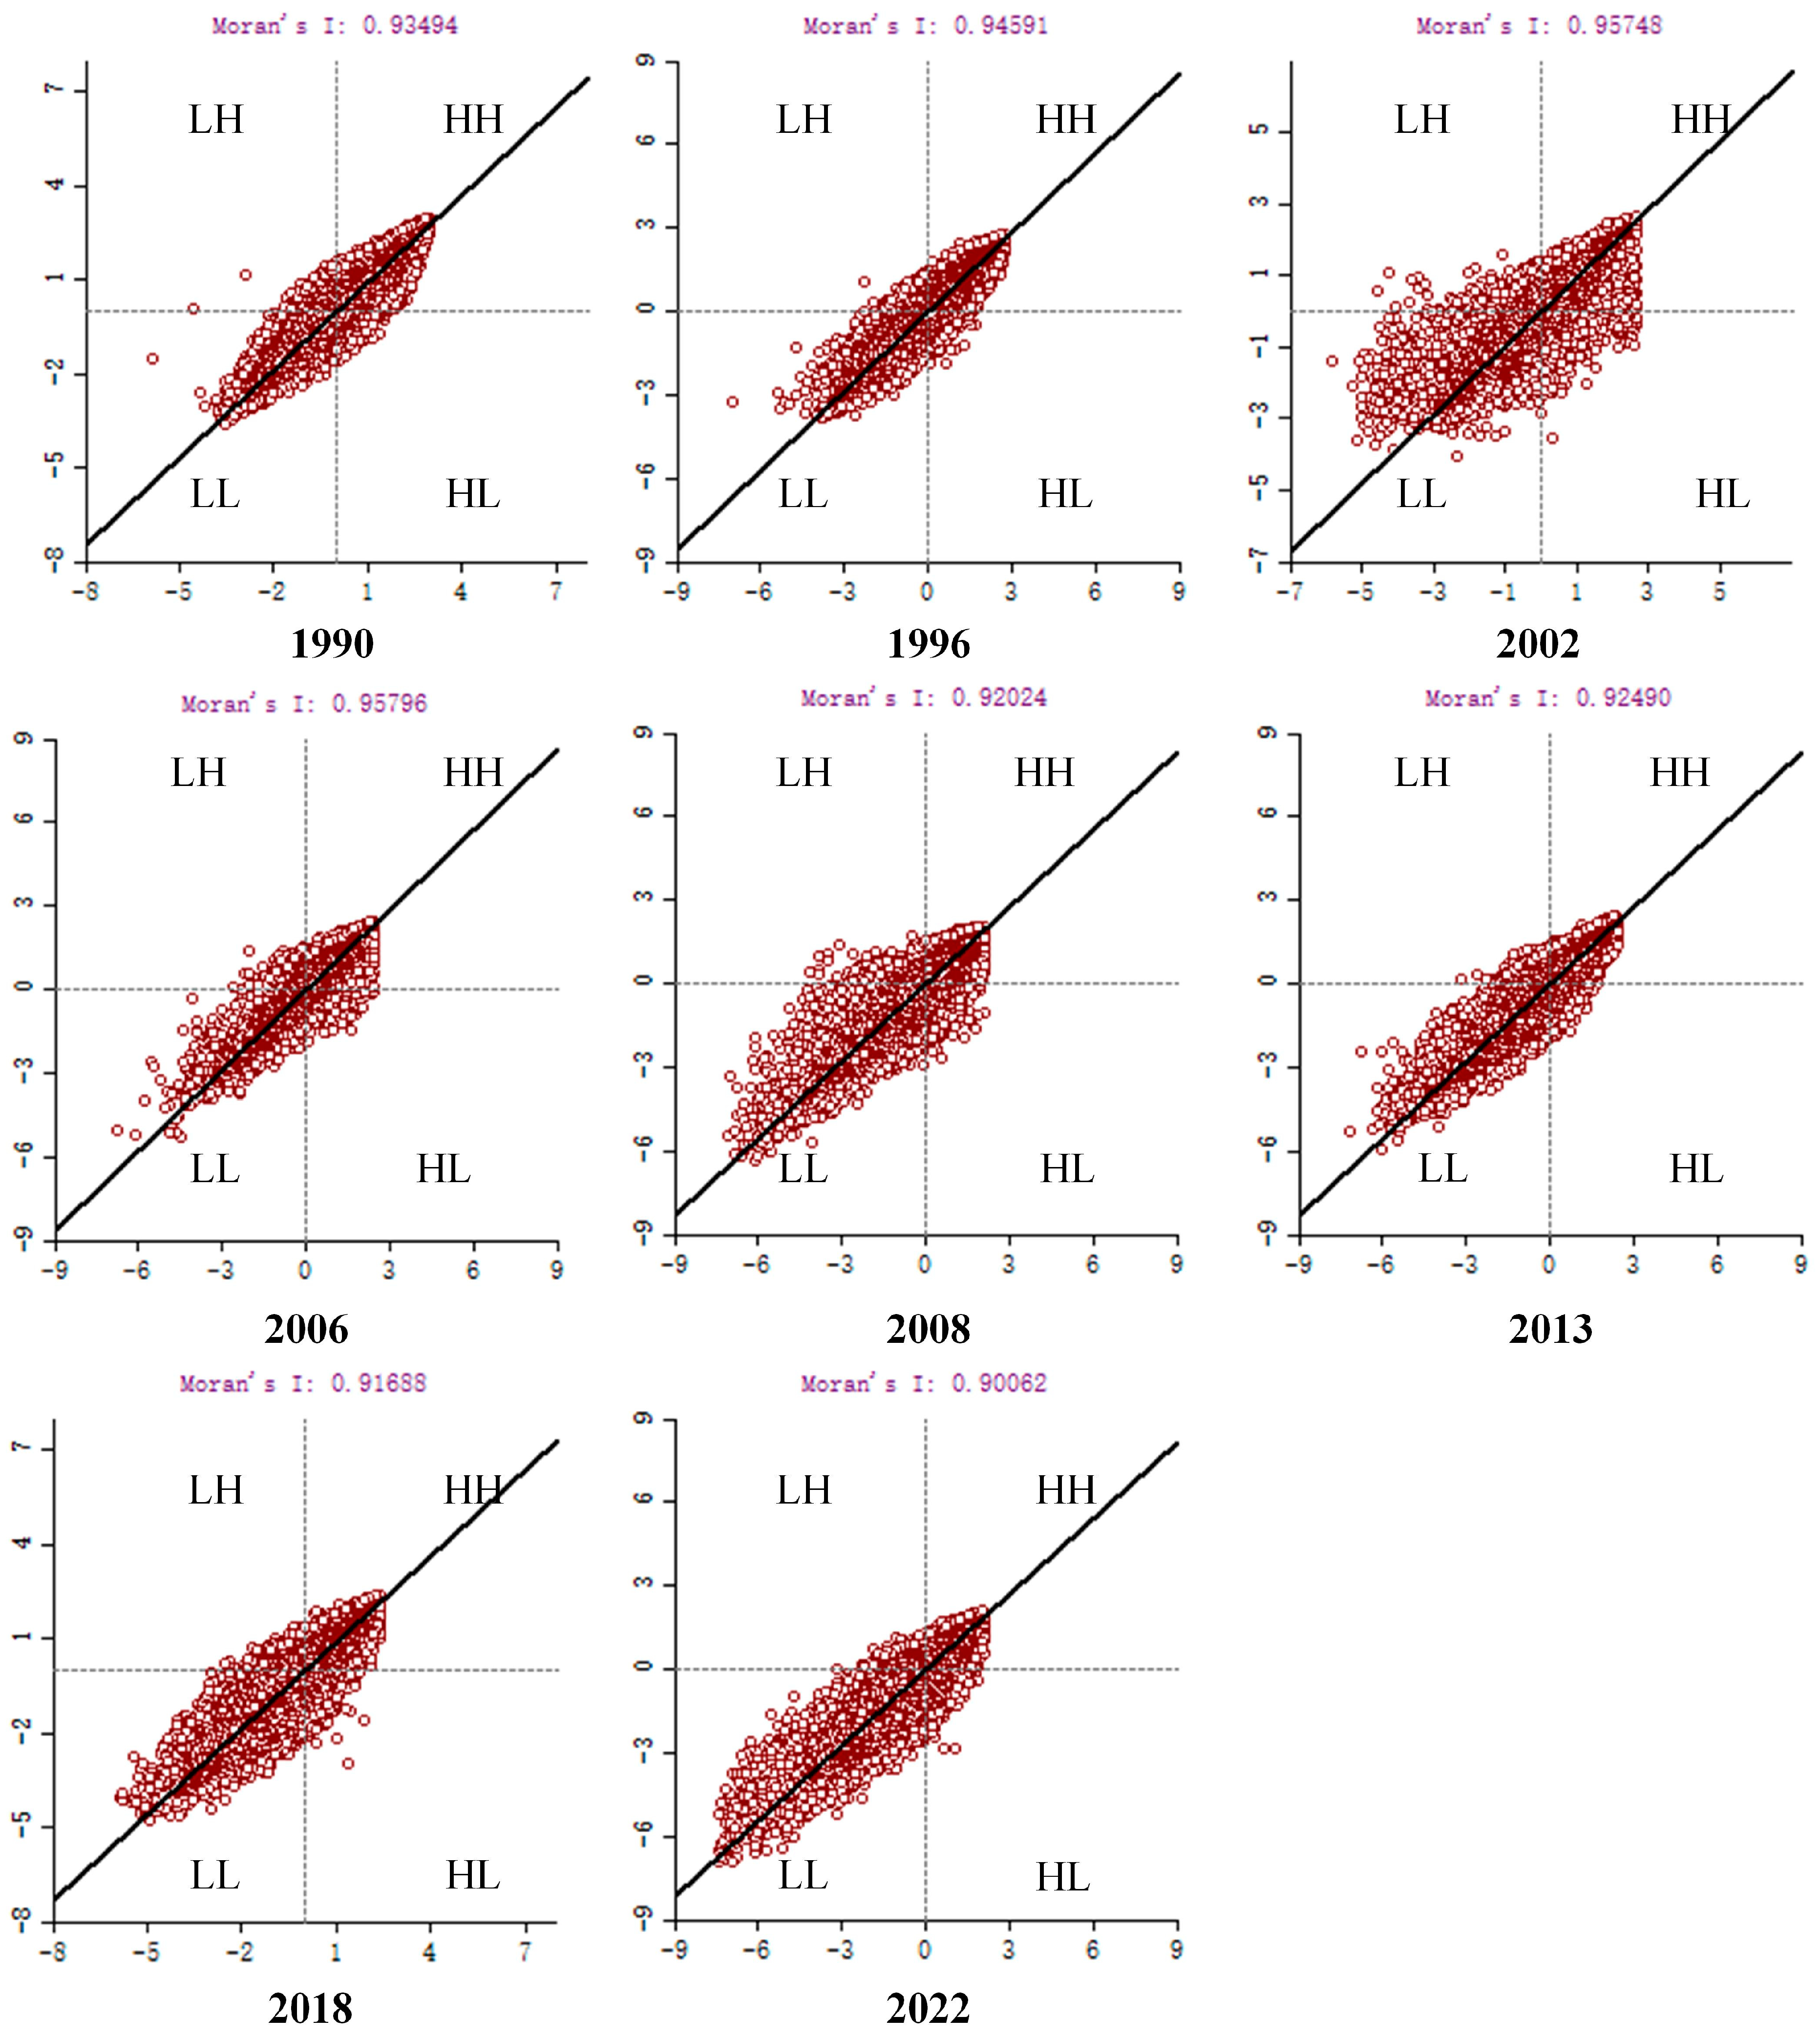
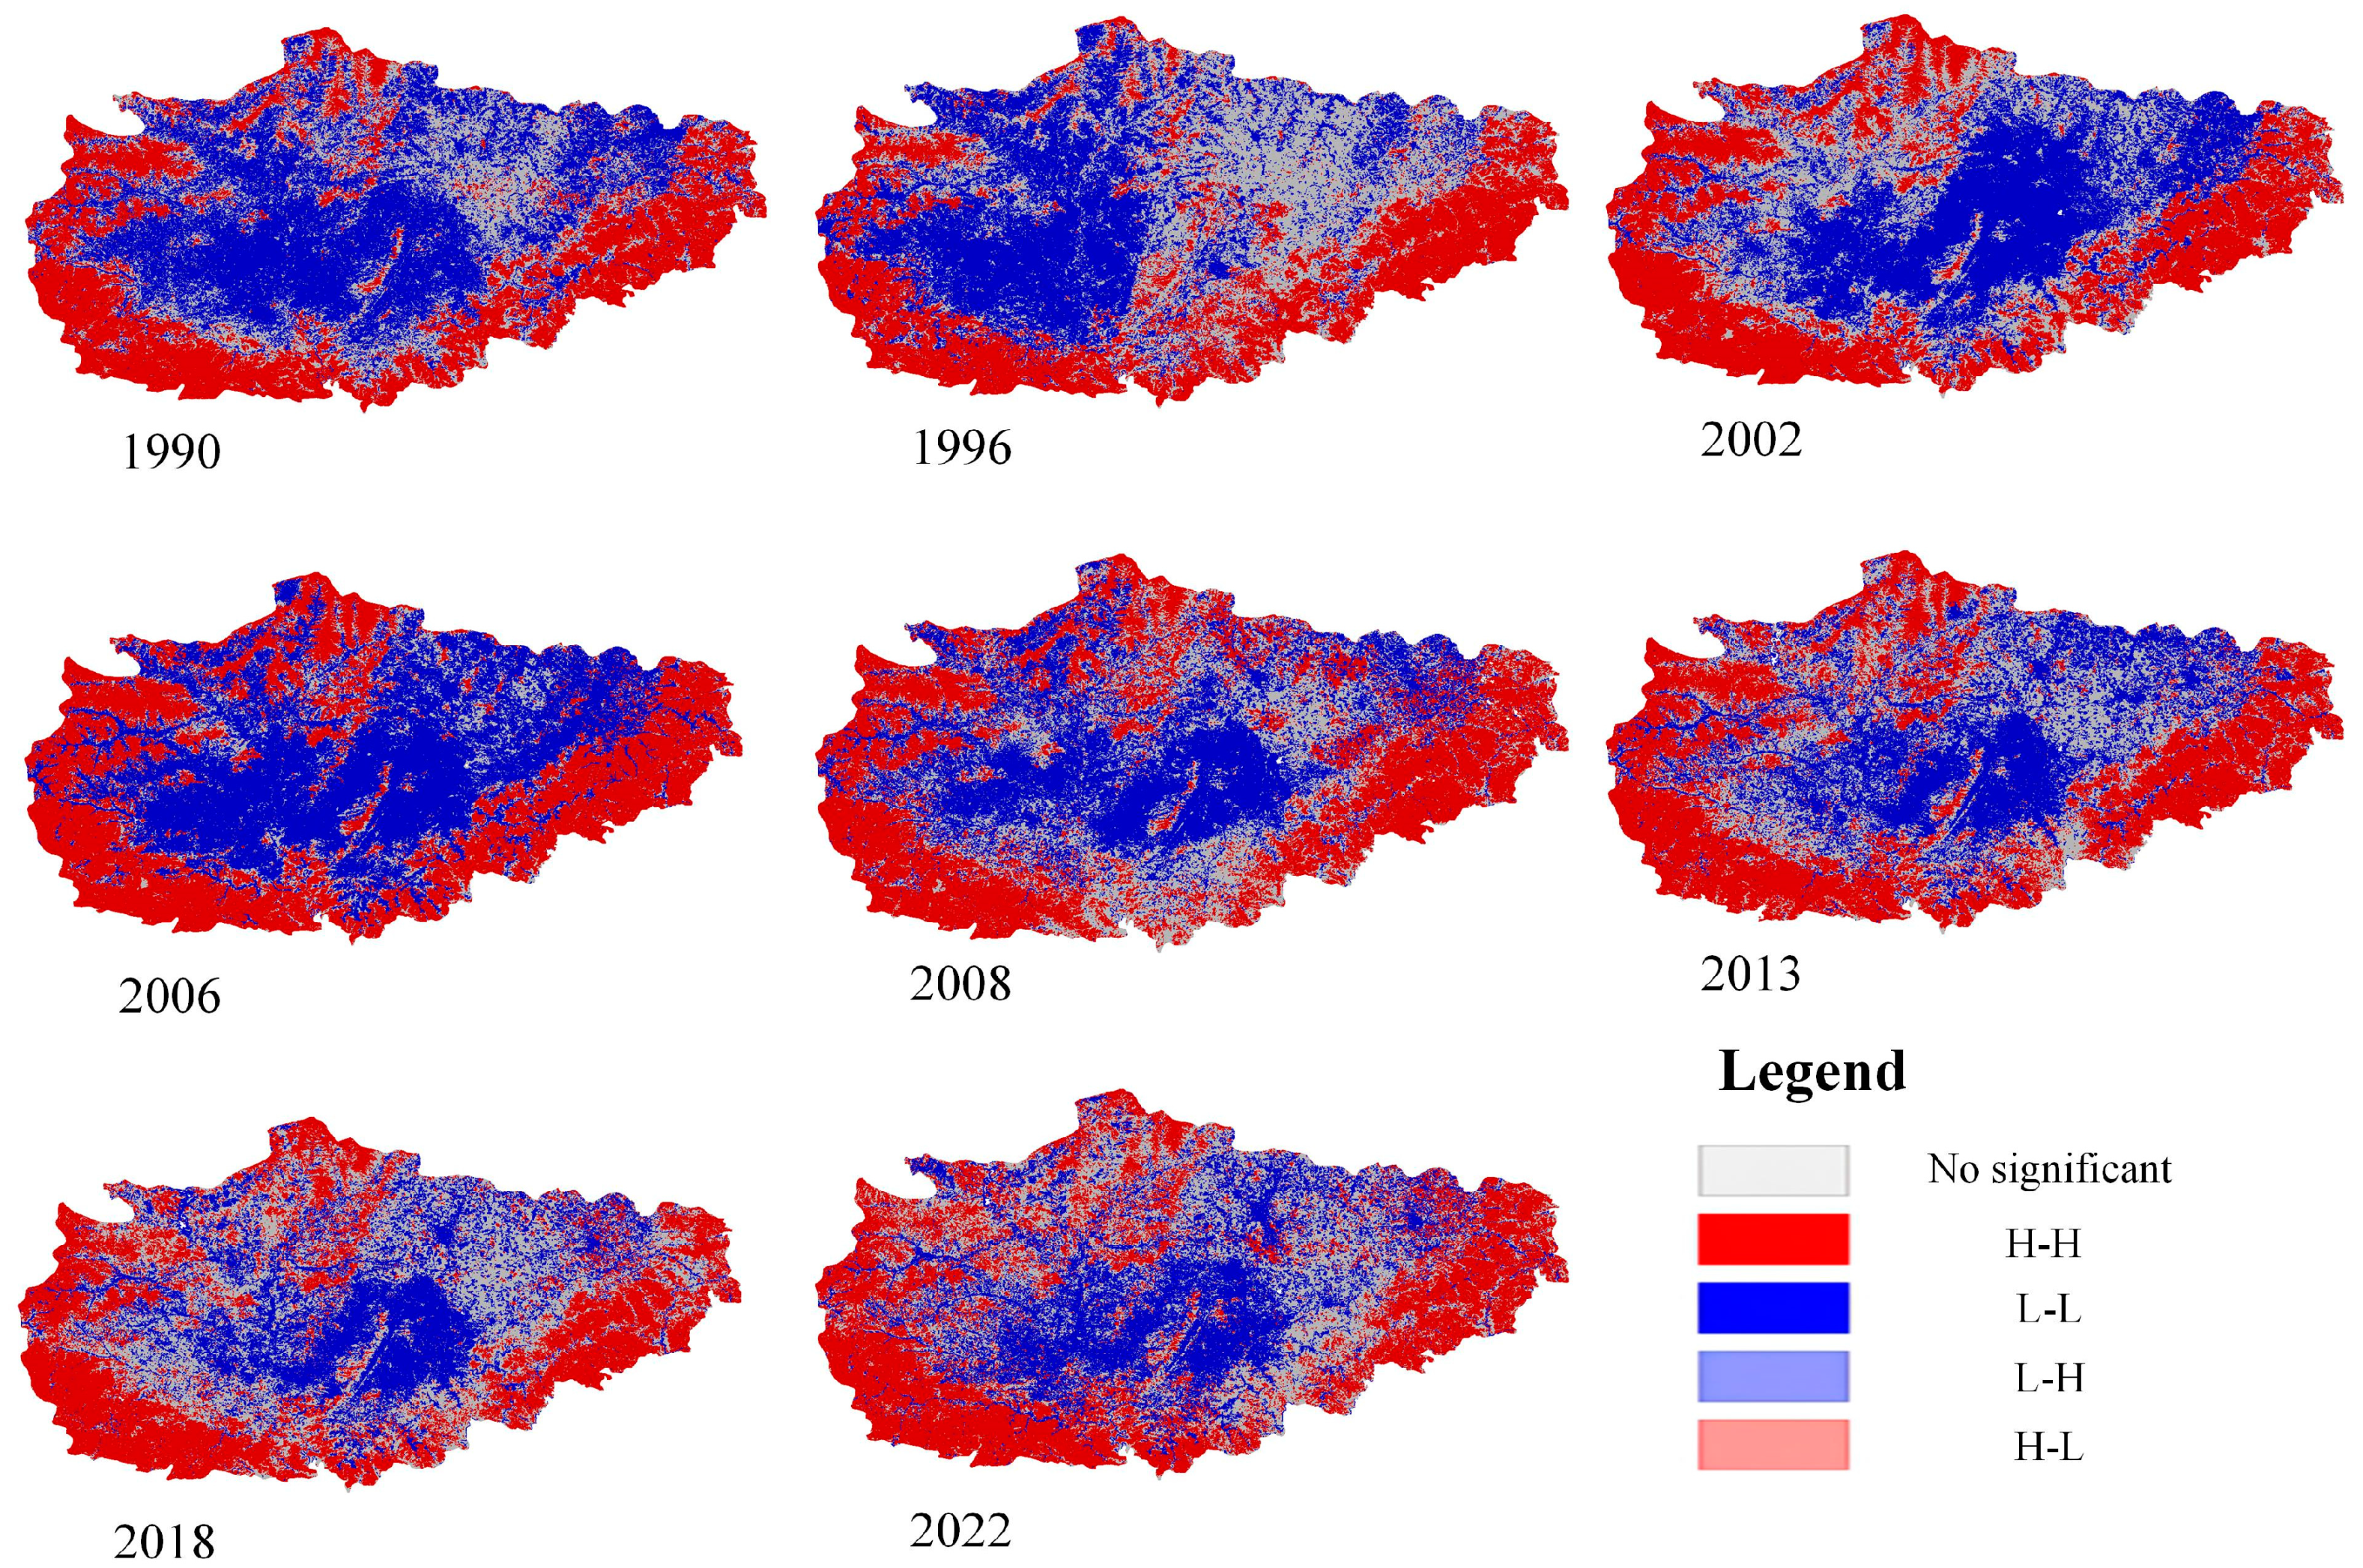
4.3. Spatial Autocorrelation Analysis of Ecosystem Quality
4.4. Buffer Analysis of a Typical Mine Sites
4.5. Limitations and Future Work
- Limitations of Remote Sensing Imagery—The establishment of the RCEI was entirely based on remote sensing imagery, which is inevitably affected by cloud cover, resulting in missing images for some months. Although interpolation and multi-source data fusion techniques can supplement these images, they are not original data and may introduce small errors in subsequent operations. While these errors were within acceptable limits, they still imposed certain limitations on the research results.
- Complexity of the Ecological Environment—The ecological environment of resource-based cities is complex and variable, with frequent human activities and intricate surface biophysical features. The RCEI consists of six ecological indicators, including the Indexed Coal Dust Index (ICDI) and the Enhanced Vegetation Index (EVI), which were added to represent the impact of coal mining on the atmosphere and vegetation establishment, respectively. However, the lack of socioeconomic factors (e.g., population density, economic activities, and policy changes) in these indicators limits their comprehensive description of resource-based cities.
- Limitations of Model Validation—Although this study validated the reliability of the RCEI through the spatiotemporal correlation, coefficient correlation, and buffer zone analysis of two typical coal mines, complex large-scale coal mining and rapid urban expansion raised questions about whether the RCEI could adequately describe the temporal and spatial changes in the ecological environment of resource-based cities. Further research and validation are needed.
- Deficiencies in the Analysis of Driving Factors—While we obtained data on the spatial and temporal changes in the ecological environmental quality of Jincheng City from 1990 to 2022, we did not deeply analyze the driving factors, such as climatic, anthropogenic, and topographical influences.
- In future studies, we plan to incorporate more socioeconomic factors (e.g., population density, economic activities, and policy changes) and coal mining data that are accurate in terms of working surfaces into the Resource City Ecological Index (RCEI) to more comprehensively assess spatial and temporal changes in ecological quality in resource cities. In addition, we plan to place ground-based field monitoring equipment, such as ecosticks, in different ecological change areas to obtain field-based ecological change data. These data will be processed and analyzed in parallel with remote sensing satellite data to effectively verify the accuracy and reliability of the ecological index of resource cities.
- The RCEI could be applied to other coal resource cities for more detailed and reliable validation analyses.
- The application potential of the RCEI on satellite sensors such as MODIS, ASTER, AVHRR, IRS, Sentinel, and Gaofen-5 should be explored. This could lead to enhancing the temporal, spatial, and spectral resolutions of remote sensing images through multi-source data fusion to establish a long-term, high-precision RCEI dataset for typical resource-based cities.
- The analysis of the driving forces behind changes in the ecological environmental quality of resource-based cities should be strengthened and the impact of climate change and human activities on their ecological environmental quality should be quantified.
- In subsequent studies, we will verify the reliability and validity of the PCA results using regression analyses, support vector machines (SVMs), decision trees, and neural networks. Future research will focus more on these nonlinear relationships and interactions to further enhance the accuracy of our analyses.
5. Conclusions
- (1)
- The Resource Cities Ecological Index (RCEI) is a comprehensive evaluation index based on remote sensing information. It integrates the majority of the information from six ecological environmental indicators, the NDVI, EVI, WET, NDBSI, LST, and ICDI, through principal component analysis. This index enables an objective and quantitative assessment and monitoring of the spatial and temporal distributions and change characteristics of the ecological environmental quality in mining areas.
- (2)
- Based on an analysis spanning from 1990 to 2022, the RCEI of Jincheng City ranged between 0.6 and 0.8, indicating that the city maintained an overall ecological quality at the upper–middle level. During this period, the city’s ecological environmental quality exhibited a general trend of improvement.
- (3)
- At the county-level scale, significant disparities in ecological quality were observed among various districts within Jincheng City. In particular, the central urban area and Gaoping County exhibited relatively lower ecological levels compared to other regions, with average RCEI values ranging from 0.4 to 0.5. This phenomenon was directly attributed to the dense distribution of coal mines and the high degree of urbanization in these areas.
- (4)
- The Moran’s I values were all over 0.9, suggesting a positive spatial autocorrelation in the distribution of ecological quality within the study area. This implied that the spatial distribution of ecological quality exhibited a clustered pattern, deviating from a random distribution. Specifically, the high–high (H–H) clusters were primarily located in the high-altitude regions surrounding the study area, characterized by dense ecological vegetation and fewer mining areas. Conversely, the low–low (L–L) clusters were primarily situated in urban construction areas and regions with large-scale mining distributions, where human production and living activities were frequent.
- (5)
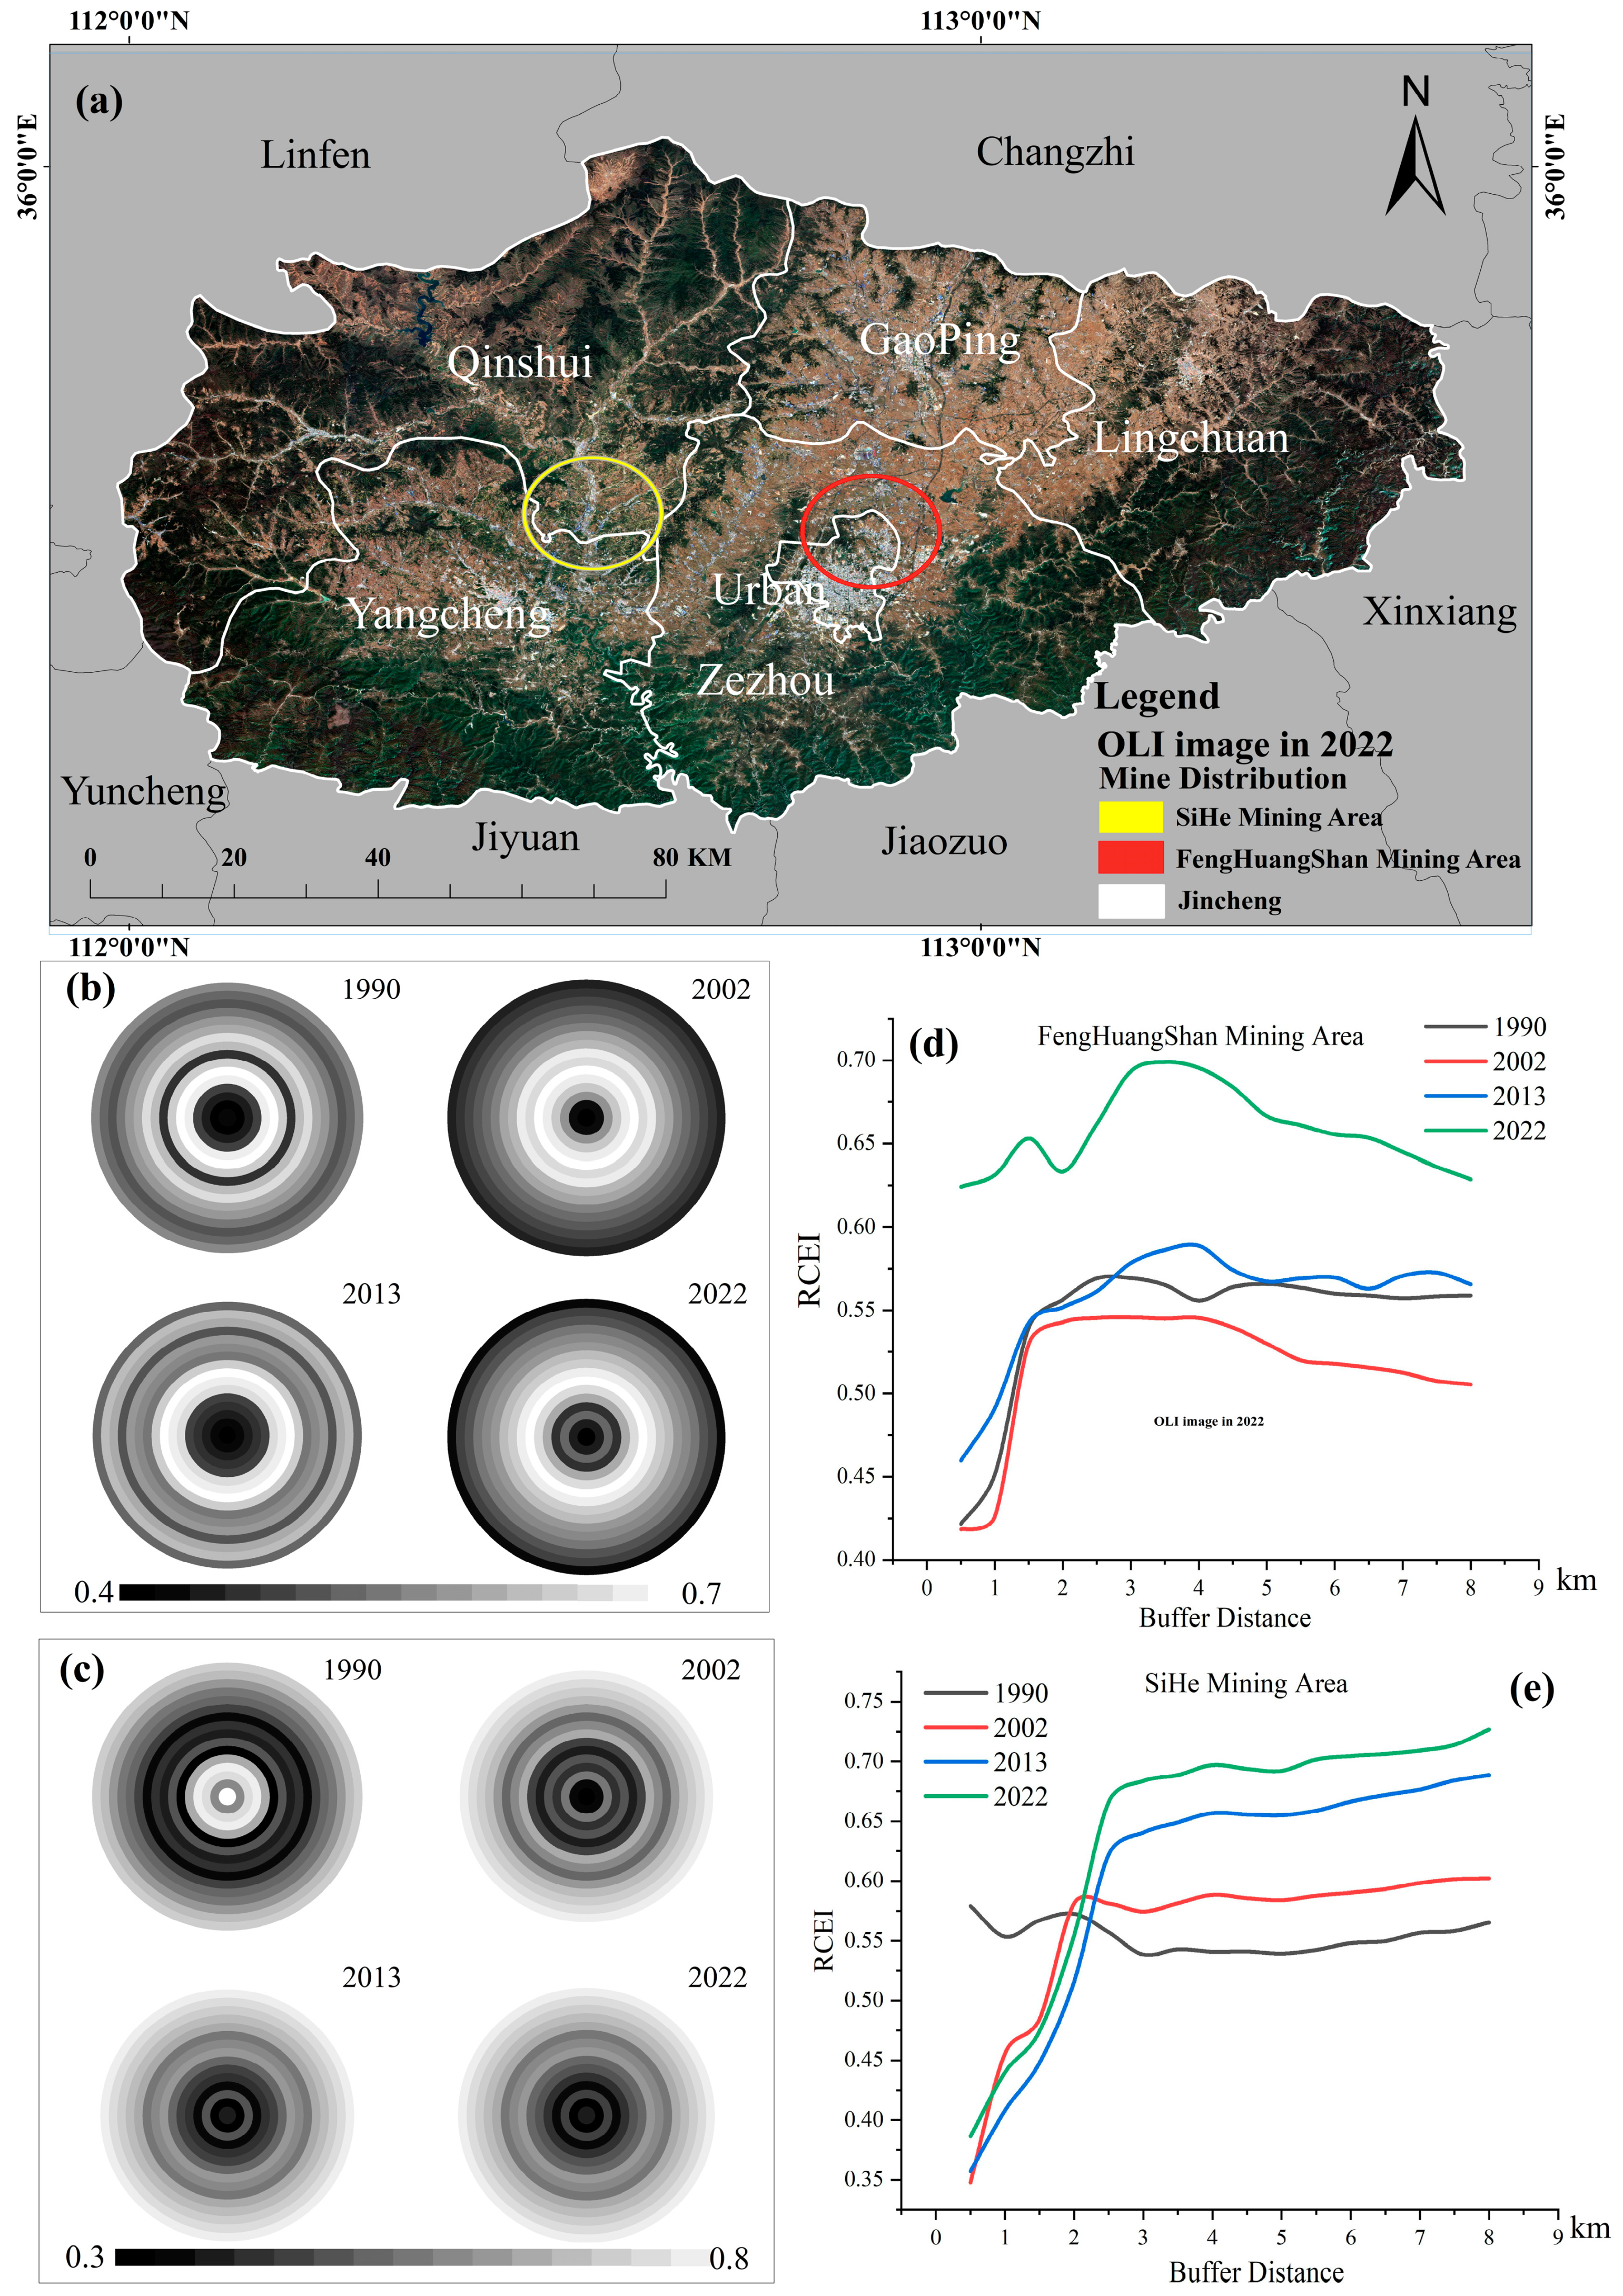
- This study revealed the close link between coal production and ecological quality by analyzing the buffer zones of the Sihe and Fenghuangshan mining areas. The high production in the Sihe Mine Area caused a significant decrease in the mean RCEI value within the core mining area (0–1 km), a phenomenon that highlights the profound impact of mining activities on the surrounding ecological environment. Meanwhile, the Fenghuangshan Mine Area ceased production and underwent ecological restoration in 2018, and by 2022, the mean RCEI value of the area significantly increased from 0.4–0.45 to 0.65. Although urban development led to a decline in the ecological quality of the area 5 km away, the ecological quality of the environment within the city still showed a trend of improvement year by year.
Author Contributions
Funding
Institutional Review Board Statement
Informed Consent Statement
Data Availability Statement
Acknowledgments
Conflicts of Interest
References
- Liu, B.; Wang, J.; Jing, Z.; Tang, Q. Measurement of sustainable transformation capability of resource-based cities based on fuzzy membership function: A case study of Shanxi Province, China. Resour. Policy 2020, 68, 101739. [Google Scholar] [CrossRef]
- Yang, M.; Wang, J.; Jing, Z.; Liu, B.; Niu, H. Evaluation and regulation of resource-based city resilience: Evidence from Shanxi Province, China. Int. J. Disaster Risk Reduct. 2022, 81, 103256. [Google Scholar] [CrossRef]
- Zheng, L.; Zhu, L.; Wang, W.; Guo, L.; Chen, B. Land subsidence related to coal mining in China revealed by L-band InSAR analysis. Int. J. Environ. Res. Public Health 2020, 17, 1170. [Google Scholar] [CrossRef]
- Liu, H.; Wang, Y.; Zhao, S.; Hu, H.; Cao, C.; Li, A.; Yu, Y.; Yao, H. Review on the current status of the co-combustion technology of organic solid waste (OSW) and coal in China. Energy Fuels 2020, 34, 15448–15487. [Google Scholar] [CrossRef]
- Masood, N.; Hudson-Edwards, K.; Farooqi, A. True cost of coal: Coal mining industry and its associated environmental impacts on water resource development. J. Sustain. Min. 2020, 19, 1. [Google Scholar] [CrossRef]
- Betz, M.R.; Partridge, M.D.; Farren, M.; Lobao, L. Coal mining, economic development, and the natural resources curse. Energy Econ. 2015, 50, 105–116. [Google Scholar] [CrossRef]
- Hendryx, M. The public health impacts of surface coal mining. Extr. Ind. Soc. 2015, 2, 820–826. [Google Scholar] [CrossRef]
- Hendryx, M.; Zullig, K.J.; Luo, J. Impacts of coal use on health. Annu. Rev. Public Health 2020, 41, 397–415. [Google Scholar] [CrossRef]
- Jixi, G.; Huawei, W.; Yongcai, W.; Peng, H.; Peirong, S.; Chenxi, S. New framework for large-scale ecological quality evaluation and application research using remote sensing data. Natl. Remote Sens. Bull. 2024, 27, 2860–2872. [Google Scholar]
- Tapas, M.R.; Etheridge, R.; Finlay, C.G.; Peralta, A.L.; Bell, N.; Xu, Y.; Lakshmi, V. A methodological framework for assessing sea level rise impacts on nitrate loading in coastal agricultural watersheds using SWAT+: A case study of the Tar-Pamlico River basin, North Carolina, USA. Sci. Total Environ. 2024, 951, 175523. [Google Scholar] [CrossRef]
- Yang, H.; Zhai, G.; Zhang, Y. Ecological vulnerability assessment and spatial pattern optimization of resource-based cities: A case study of Huaibei City, China. Hum. Ecol. Risk Assess. Int. J. 2021, 27, 606–625. [Google Scholar] [CrossRef]
- Tang, Q.; Wang, J.; Jing, Z.; Yan, Y.; Niu, H. Response of ecological vulnerability to land use change in a resource-based city, China. Resour. Policy 2021, 74, 102324. [Google Scholar] [CrossRef]
- Wang, D.; Huang, Z.; Wang, Y.; Mao, J. Ecological security of mineral resource-based cities in China: Multidimensional measurements, spatiotemporal evolution, and comparisons of classifications. Ecol. Indic. 2021, 132, 108269. [Google Scholar] [CrossRef]
- Li, S.; Zhao, Y.; Xiao, W.; Yue, W.; Wu, T. Optimizing ecological security pattern in the coal resource-based city: A case study in Shuozhou City, China. Ecol. Indic. 2021, 130, 108026. [Google Scholar] [CrossRef]
- Yang, B.; Du, W.; Li, J.; Bao, A.; Ge, W.; Wang, S.; Lyu, X.; Gao, X.; Cheng, X. The Influence of Glacier Mass Balance on River Runoff in the Typical Alpine Basin. Water 2023, 15, 2762. [Google Scholar] [CrossRef]
- Yuan, Y.; Bai, Z.; Zhang, J.; Xu, C. Increasing urban ecological resilience based on ecological security pattern: A case study in a resource-based city. Ecol. Eng. 2022, 175, 106486. [Google Scholar] [CrossRef]
- Zhao, Y.; Zhang, M.; Zhao, D.; Duo, L.; Lu, C. Optimizing the ecological network of resource-based cities to enhance the resilience of regional ecological networks. Environ. Sci. Pollut. Res. 2024, 31, 17182–17205. [Google Scholar] [CrossRef]
- Wang, Z.; Fu, H.; Zhou, L. Multiple urban resilience evaluation of resource-based cities’ sustainable transformation effect. Resour. Conserv. Recycl. 2023, 191, 106912. [Google Scholar] [CrossRef]
- Li, L.; Fu, M.; Zhu, Y.; Kang, H.; Wen, H. The current situation and trend of land ecological security evaluation from the perspective of global change. Ecol. Indic. 2024, 167, 112608. [Google Scholar] [CrossRef]
- Fu, B.; Tian, T.; Liu, Y.; Zhao, W. New developments and perspectives in physical geography in China. Chin. Geogr. Sci. 2019, 29, 363–371. [Google Scholar] [CrossRef]
- Yu, J.; Li, J.; Zhang, W. Identification and classification of resource-based cities in China. J. Geogr. Sci. 2019, 29, 1300–1314. [Google Scholar] [CrossRef]
- Chen, W.; Chen, W.; Ning, S.; Liu, E.-n.; Zhou, X.; Wang, Y.; Zhao, M. Exploring the industrial land use efficiency of China’s resource-based cities. Cities 2019, 93, 215–223. [Google Scholar] [CrossRef]
- He, T.; Song, H.; Chen, W. Recognizing the transformation characteristics of resource-based cities using night-time light remote sensing data: Evidence from 126 cities in China. Resour. Policy 2023, 85, 104013. [Google Scholar] [CrossRef]
- Netzband, M.; Stefanov, W.L.; Redman, C. Applied Remote Sensing for Urban Planning, Governance and Sustainability; Springer: Berlin/Heidelberg, Germany, 2007. [Google Scholar]
- Nizamani, M.M.; Zhang, Q.; Muhae-Ud-Din, G.; Awais, M.; Qayyum, M.; Farhan, M.; Jabran, M.; Wang, Y. Application of GIS and Remote-Sensing Technology in Ecosystem Services and Biodiversity Conservation. In Deep Learning for Multimedia Processing Applications; CRC Press: Boca Raton, FL, USA, 2024; pp. 284–321. [Google Scholar]
- Shan, W.; Jin, X.; Ren, J.; Wang, Y.; Xu, Z.; Fan, Y.; Gu, Z.; Hong, C.; Lin, J.; Zhou, Y. Ecological environment quality assessment based on remote sensing data for land consolidation. J. Clean. Prod. 2019, 239, 118126. [Google Scholar] [CrossRef]
- Lakshmi, V. Enhancing human resilience against climate change: Assessment of hydroclimatic extremes and sea level rise impacts on the Eastern Shore of Virginia, United States. Sci. Total Environ. 2024, 947, 174289. [Google Scholar]
- Le, M.-H.; Zhang, R.; Nguyen, B.Q.; Bolten, J.D.; Lakshmi, V. Robustness of gridded precipitation products for Vietnam basins using the comprehensive assessment framework of rainfall. Atmos. Res. 2023, 293, 106923. [Google Scholar]
- Do, S.K.; Akhtar, F.; Goffin, B.; Aryal, A.; Lipscomb, M.; Lakshmi, V. Assessing terrestrial water storage variations in Afghanistan using GRACE and FLDAS-Central Asia data. J. Hydrol. Reg. Stud. 2024, 55, 101906. [Google Scholar] [CrossRef]
- Nguyen, B.Q.; Vo, N.D.; Le, M.-H.; Nguyen, Q.-D.; Lakshmi, V.; Bolten, J.D. Quantification of global Digital Elevation Model (DEM)–A case study of the newly released NASADEM for a river basin in Central Vietnam. J. Hydrol. Reg. Stud. 2023, 45, 101282. [Google Scholar]
- Zhang, B.; Wu, Y.; Zhao, B.; Chanussot, J.; Hong, D.; Yao, J.; Gao, L. Progress and challenges in intelligent remote sensing satellite systems. IEEE J. Sel. Top. Appl. Earth Obs. Remote Sens. 2022, 15, 1814–1822. [Google Scholar] [CrossRef]
- Li, C.; Ma, L.; Lin, N. Remote sensing monitoring and analysis of ecological environment changes in the southern sandy grassland area of Shenfu coalfield. In Proceedings of the Fifth International Conference on Geoscience and Remote Sensing Mapping (ICGRSM 2023), Lianyungang, China, 13–15 October 2023; pp. 271–276. [Google Scholar]
- Wang, Q.; Zhang, Q.-P.; Zhou, W. Grassland coverage changes and analysis of the driving forces in Maqu County. Phys. Procedia 2012, 33, 1292–1297. [Google Scholar] [CrossRef]
- Jiao, K.; Gao, J.; Wu, S.; Hou, W. Research progress on the response processes of vegetation activity to climate change. Acta Ecol. Sin. 2018, 38, 2229–2238. [Google Scholar]
- Chao, M.; Guo, Z.-Z.; Zhang, X.-K.; Han, R.-M. Annual integral changes of time serial NDVI in mining subsidence area. Trans. Nonferrous Met. Soc. China 2011, 21, s583–s588. [Google Scholar]
- Chao, W.; Shaogang, D.; Zhibin, J.; Manhong, X.; Qingqiu, H. Responses of vegetation to depth to the groundwater table in the grassland open–pit coal mine area. Acta Ecol. Sin. 2020, 40, 6925–6937. [Google Scholar]
- Hu, J.; Ye, B.; Bai, Z.; Hui, J. Comparison of the vegetation index of reclamation mining areas calculated by multi-source remote sensing data. Land 2022, 11, 325. [Google Scholar] [CrossRef]
- Gitelson, A.A.; Gritz, Y.; Merzlyak, M.N. Relationships between leaf chlorophyll content and spectral reflectance and algorithms for non-destructive chlorophyll assessment in higher plant leaves. J. Plant Physiol. 2003, 160, 271–282. [Google Scholar] [CrossRef]
- Gitelson, A.A.; Keydan, G.P.; Merzlyak, M.N. Three-band model for noninvasive estimation of chlorophyll, carotenoids, and anthocyanin contents in higher plant leaves. Geophys. Res. Lett. 2006, 33, 239–247. [Google Scholar] [CrossRef]
- Frampton, W.J.; Dash, J.; Watmough, G.; Milton, E.J. Evaluating the capabilities of Sentinel-2 for quantitative estimation of biophysical variables in vegetation. ISPRS J. Photogramm. Remote Sens. 2013, 82, 83–92. [Google Scholar] [CrossRef]
- Xiao, W.; Chen, J.; Zhao, Y.; Hu, Z.; Lv, X.; Zhang, S. Identify maize chlorophyll impacted by coal mining subsidence in high groundwater table area based on UAV remote sensing. J China Coal Soc 2019, 44, 302–313. [Google Scholar]
- Pericak, A.A.; Thomas, C.J.; Kroodsma, D.A.; Wasson, M.F.; Ross, M.R.; Clinton, N.E.; Campagna, D.J.; Franklin, Y.; Bernhardt, E.S.; Amos, J.F. Mapping the yearly extent of surface coal mining in Central Appalachia using Landsat and Google Earth Engine. PLoS ONE 2018, 13, e0197758. [Google Scholar] [CrossRef]
- Zhu, X.; Wang, X.; Yan, D.; Liu, Z.; Zhou, Y. Analysis of remotely-sensed ecological indexes’ influence on urban thermal environment dynamic using an integrated ecological index: A case study of Xi’an, China. Int. J. Remote Sens. 2019, 40, 3421–3447. [Google Scholar] [CrossRef]
- Yang, W.; Zhou, Y.; Li, C. Assessment of Ecological Environment Quality in Rare Earth Mining Areas Based on Improved RSEI. Sustainability 2023, 15, 2964. [Google Scholar] [CrossRef]
- Song, W.; Gu, H.-H.; Song, W.; Li, F.-P.; Cheng, S.-P.; Zhang, Y.-X.; Ai, Y.-J. Environmental assessments in dense mining areas using remote sensing information over Qian’an and Qianxi regions China. Ecol. Indic. 2023, 146, 109814. [Google Scholar] [CrossRef]
- Xu, H.; Song, Y.; Tian, Y. Simulation of land-use pattern evolution in hilly mountainous areas of North China: A case study in Jincheng. Land Use Policy 2022, 112, 105826. [Google Scholar] [CrossRef]
- Haibin, L.; Zhenling, L. Recycling utilization patterns of coal mining waste in China. Resour. Conserv. Recycl. 2010, 54, 1331–1340. [Google Scholar] [CrossRef]
- Wu, W.; Zhou, J.; Niu, J.; Lv, H. Study on coupling between mineral resources exploitation and the mining ecological environment in Shanxi Province. Environ. Dev. Sustain. 2021, 23, 13261–13283. [Google Scholar] [CrossRef]
- Gorelick, N.; Hancher, M.; Dixon, M.; Ilyushchenko, S.; Thau, D.; Moore, R. Google Earth Engine: Planetary-scale geospatial analysis for everyone. Remote Sens. Environ. 2017, 202, 18–27. [Google Scholar] [CrossRef]
- Masek, J.G.; Vermote, E.F.; Saleous, N.E.; Wolfe, R.; Hall, F.G.; Huemmrich, K.F.; Gao, F.; Kutler, J.; Lim, T.-K. A Landsat surface reflectance dataset for North America, 1990–2000. IEEE Geosci. Remote Sens. Lett. 2006, 3, 68–72. [Google Scholar] [CrossRef]
- Vermote, E.; Roger, J.-C.; Franch, B.; Skakun, S. LaSRC (Land Surface Reflectance Code): Overview, application and validation using MODIS, VIIRS, LANDSAT and Sentinel 2 data’s. In Proceedings of the IGARSS 2018-2018 IEEE International Geoscience and Remote Sensing Symposium, Valencia, Spain, 22–27 July 2018; pp. 8173–8176. [Google Scholar]
- Foga, S.; Scaramuzza, P.L.; Guo, S.; Zhu, Z.; Dilley, R.D., Jr.; Beckmann, T.; Schmidt, G.L.; Dwyer, J.L.; Hughes, M.J.; Laue, B. Cloud detection algorithm comparison and validation for operational Landsat data products. Remote Sens. Environ. 2017, 194, 379–390. [Google Scholar] [CrossRef]
- Parastatidis, D.; Mitraka, Z.; Chrysoulakis, N.; Abrams, M. Online global land surface temperature estimation from Landsat. Remote Sens. 2017, 9, 1208. [Google Scholar] [CrossRef]
- Yang, J.; Huang, X. 30 m annual land cover and its dynamics in China from 1990 to 2019. Earth Syst. Sci. Data Discuss. 2021, 2021, 1–29. [Google Scholar]
- Nie, X.; Hu, Z.; Ruan, M.; Zhu, Q.; Sun, H. Remote-sensing evaluation and temporal and spatial change detection of ecological environment quality in coal-mining areas. Remote Sens. 2022, 14, 345. [Google Scholar] [CrossRef]
- Jiang, Z.; Huete, A.R.; Chen, J.; Chen, Y.; Li, J.; Yan, G.; Zhang, X. Analysis of NDVI and scaled difference vegetation index retrievals of vegetation fraction. Remote Sens. Environ. 2006, 101, 366–378. [Google Scholar] [CrossRef]
- Jiang, Z.; Huete, A.R.; Didan, K.; Miura, T. Development of a two-band enhanced vegetation index without a blue band. Remote Sens. Environ. 2008, 112, 3833–3845. [Google Scholar] [CrossRef]
- Weiers, S.; Bock, M.; Wissen, M.; Rossner, G. Mapping and indicator approaches for the assessment of habitats at different scales using remote sensing and GIS methods. Landsc. Urban Plan. 2004, 67, 43–65. [Google Scholar] [CrossRef]
- Li, Z.-L.; Tang, B.-H.; Wu, H.; Ren, H.; Yan, G.; Wan, Z.; Trigo, I.F.; Sobrino, J.A. Satellite-derived land surface temperature: Current status and perspectives. Remote Sens. Environ. 2013, 131, 14–37. [Google Scholar] [CrossRef]
- Xu, H. A study on information extraction of water body with the modified normalized difference water index (MNDWI). J. Remote Sens. 2005, 9, 595. [Google Scholar]
- Jing, Y.; Zhang, F.; He, Y.; Johnson, V.C.; Arikena, M. Assessment of spatial and temporal variation of ecological environment quality in Ebinur Lake Wetland National Nature Reserve, Xinjiang, China. Ecol. Indic. 2020, 110, 105874. [Google Scholar] [CrossRef]
- Xu, Q. Research on extracting water information using improved normalized difference water index (MNDWI). J. Remote Sens. 2005, 9, 589–595. [Google Scholar]
- Benmecheta, A.; Abdellaoui, A.; Hamou, A. A comparative study of land surface temperature retrieval methods from remote sensing data. Can. J. Remote Sens. 2013, 39, 59–73. [Google Scholar] [CrossRef]
- Zhu, X.-M.; Song, X.-N.; Leng, P.; Guo, D.; Cai, S.-H. Impact of atmospheric correction on spatial heterogeneity relations between land surface temperature and biophysical compositions. IEEE Trans. Geosci. Remote Sens. 2020, 59, 2680–2697. [Google Scholar] [CrossRef]
- Bivand, R.S.; Wong, D.W. Comparing implementations of global and local indicators of spatial association. Test 2018, 27, 716–748. [Google Scholar] [CrossRef]
- Xiong, Y.; Xu, W.; Lu, N.; Huang, S.; Wu, C.; Wang, L.; Dai, F.; Kou, W. Assessment of spatial–temporal changes of ecological environment quality based on RSEI and GEE: A case study in Erhai Lake Basin, Yunnan province, China. Ecol. Indic. 2021, 125, 107518. [Google Scholar] [CrossRef]
- Griffith, D. Spatial Autocorrelation: A Primer Association of American Geographers. In Resource Publications in Geography; Assn of Amer Geographers: Washington, DC, USA, 1987. [Google Scholar]
- Wan, L.; Wang, S.; Chen, X. GeoDA-based spatial correlation analysis of GDP in Hadaqi industrial corridor. Geogr. Res. 2011, 30, 977–984. [Google Scholar]
- Jingxiang, W.; Jiang, C.; Yuanyuan, D.; Yan, L.; Haoran, W. Redevelopment strategy of closed coal mine industrial plaza: A case study of Fenghuangshan Mine in Jincheng, China. Coal Geol. Explor. 2022, 50, 21. [Google Scholar]
- Zhang, J.; Fu, M.; Geng, Y.; Tao, J. Energy saving and emission reduction: A project of coal-resource integration in Shanxi Province, China. Energy Policy 2011, 39, 3029–3032. [Google Scholar] [CrossRef]


| 1990 (Landsat TM) | 1996 (Landsat TM) | 2002 (Landsat TM) | 2006 (Landsat TM) | ||||
|---|---|---|---|---|---|---|---|
| Path/Row | Data Times | Path/Row | Data Times | Path/Row | Data Times | Path/Row | Data Times |
| 124,036 | 7 July 1990 | 124,035 | 13 June 1996 | 124,035 | 8 July 2002 | 124,035 | 1 June 2006 |
| 125,035 | 31 August 1990 | 124,036 | 16 August 1996 | 124,036 | 24 July 2002 | 124,036 | 20 August 2006 |
| 124,036 | 24 August 1990 | 125,036 | 7 August 1996 | 125,036 | 13 June 2002 | 125,035 | 10 July 2006 |
| 125,035 | 28 June 1990 | 124,035 | 29 June 1996 | 125,035 | 16 August 2002 | 125,036 | 24 June 2006 |
| 125,036 | 14 July 1990 | 125,035 | 4 June 1996 | 125,036 | 29 June 2002 | 125,036 | 11 August 2006 |
| 2008 (Landsat TM) | 2013 (OLI/TIRS) | 2018 (OLI/TIRS) | 2022 (OLI/TIRS) | ||||
| Path/Row | Data Times | Path/Row | Data Times | Path/Row | Data Times | Path/Row | Data Times |
| 125,036 | 29 June 2008 | 124,035 | 4 June 2013 | 124,035 | 12 June 2018 | 125,036 | 23 June 2022 |
| 125,036 | 31 July 2008 | 124,035 | 7 August 2013 | 124,035 | 30 July 2018 | 125,035 | 16 June 2022 |
| 124,035 | 25 August 2008 | 124,035 | 6 July 2013 | 124,035 | 31 August 2018 | 124,035 | 19 August 2022 |
| 124,036 | 24 July 2008 | 124,036 | 23 August 2013 | 124,036 | 28 June 2018 | 125,035 | 25 July 2022 |
| 124,035 | 22 June 2008 | 125,036 | 27 June 2013 | 125,035 | 22 August 2018 | 125,036 | 9 July 2022 |
| Index | Equation | |
|---|---|---|
| WET | (5) | |
| (6) | ||
| NDVI | (7) | |
| EVI | (8) | |
| (9) | ||
| (10) | ||
| (11) | ||
| (12) | ||
| NDBSI | (13) | |
| (14) | ||
| (15) | ||
| LST | (16) | |
| ICDI | (17) | |
| mNDWI | (18) |
| Level | Excellent | Good | Moderate | Fair | Poor |
|---|---|---|---|---|---|
| Index | 0.75–1 | 0.55–0.75 | 0.35–0.55 | 0.2–0.35 | 0–0.2 |
| Date | Results of PCA | |||
|---|---|---|---|---|
| Eigenvalue | Contribution Rate (%) | |||
| RSEI | RCEI | RSEI | RCEI | |
| 1990 | 0.0837 | 0.1317 | 70.92 | 88.62 |
| 1996 | 0.0786 | 0.1459 | 70.05 | 81.07 |
| 2002 | 0.0354 | 0.0876 | 60.45 | 85.35 |
| 2006 | 0.0491 | 0.0924 | 79.42 | 84.31 |
| 2008 | 0.0783 | 0.1045 | 68.23 | 73.13 |
| 2013 | 0.0786 | 0.1407 | 80.32 | 89.36 |
| 2018 | 0.1127 | 0.1815 | 73.81 | 79.51 |
| 2022 | 0.0882 | 0.1367 | 79.69 | 87.22 |
| Date | WET | NDVI | EVI | NDBSI | LST | DI |
|---|---|---|---|---|---|---|
| 1990 | 0.3651 | 0.5251 | 0.3560 | −0.5081 | −0.3017 | −0.3388 |
| 1996 | 0.3573 | 0.4635 | 0.0166 | −0.5468 | −0.4640 | −0.3781 |
| 2002 | 0.2704 | 0.5437 | 0.2834 | −0.5907 | −0.3519 | −0.3891 |
| 2006 | 0.3860 | 0.5092 | 0.0159 | −0.5498 | −0.4185 | −0.3377 |
| 2008 | 0.4080 | 0.5462 | 0.0181 | −0.6164 | −0.2300 | −0.3197 |
| 2013 | 0.3461 | 0.4953 | 0.3898 | −0.5347 | −0.3210 | −0.3062 |
| 2018 | 0.2951 | 0.4992 | 0.3670 | −0.5438 | −0.3872 | −0.2883 |
| 2022 | 0.4631 | 0.4847 | 0.3706 | −0.4958 | −0.2840 | −0.2943 |
| Year | Form | Poor | Fair | Moderate | Good | Excellent | Total |
|---|---|---|---|---|---|---|---|
| 1990 | Area (km2) | 667.42 | 4126.9 | 2354.36 | 1772.38 | 568.94 | 9490 |
| Pct. (%) | 7.03 | 43.48 | 24.81 | 18.66 | 6.02 | 100 | |
| 1996 | Area (km2) | 297.98 | 2269.12 | 3440.82 | 2477.06 | 1005.02 | 9490 |
| Pct. (%) | 3.14 | 23.91 | 36.25 | 26.11 | 10.59 | 100 | |
| 2002 | Area (km2) | 595.35 | 3433.23 | 2367.28 | 2183.18 | 910.96 | 9490 |
| Pct. (%) | 6.27 | 36.17 | 24.94 | 23.01 | 9.61 | 100 | |
| 2006 | Area (km2) | 195.09 | 2156.05 | 3063.2 | 2334.11 | 1741.55 | 9490 |
| Pct. (%) | 2.05 | 22.71 | 32.27 | 24.59 | 18.38 | 100 | |
| 2008 | Area (km2) | 312.61 | 1103.77 | 2210.31 | 3323.15 | 2540.86 | 9490 |
| Pct. (%) | 3.28 | 11.63 | 23.29 | 35.02 | 26.78 | 100 | |
| 2013 | Area (km2) | 422.19 | 1214.65 | 2986.5 | 3537.3 | 1329.36 | 9490 |
| Pct. (%) | 4.44 | 12.80 | 31.46 | 37.27 | 14.03 | 100 | |
| 2018 | Area (km2) | 782.39 | 1606.02 | 3147.34 | 3239.36 | 714.29 | 9490 |
| Pct. (%) | 8.24 | 16.92 | 33.17 | 34.13 | 7.54 | 100 | |
| 2022 | Area (km2) | 341.88 | 839.9 | 1767.02 | 4067.83 | 2473.37 | 9490 |
| Pct. (%) | 3.60 | 8.85 | 18.61 | 42.86 | 26.08 | 100 |
| Year | Form | −3 | −2 | −1 | 0 | 1 | 2 | 3 | Total |
|---|---|---|---|---|---|---|---|---|---|
| 1990 to 1996 | Area (km2) | 77.98 | 72.47 | 123.22 | 1466.88 | 5898.76 | 1608.46 | 242.23 | 9490 |
| Pct. (%) | 0.8 | 0.8 | 1.3 | 15.5 | 62.2 | 16.8 | 2.6 | 100 | |
| 1996 to 2002 | Area (km2) | 111.25 | 455.95 | 1258.65 | 3871.34 | 3177.99 | 484.97 | 129.85 | 9490 |
| Pct. (%) | 1.2 | 4.8 | 13.3 | 40.7 | 33.5 | 5.1 | 1.4 | 100 | |
| 2002 to 2006 | Area (km2) | 50.34 | 45.71 | 55.74 | 1059.37 | 7120.34 | 1077.85 | 80.65 | 9490 |
| Pct. (%) | 0.5 | 0.5 | 0.6 | 11.2 | 75 | 11.4 | 0.8 | 100 | |
| 2006 to 2008 | Area (km2) | 73.08 | 85.14 | 109.15 | 2469.43 | 5319.74 | 1177.79 | 255.67 | 9490 |
| Pct. (%) | 0.8 | 0.9 | 1.2 | 26 | 56.1 | 12.3 | 2.7 | 100 | |
| 2008 to 2013 | Area (km2) | 84.98 | 136.45 | 1002.46 | 4969.59 | 3037.56 | 151.78 | 107.18 | 9490 |
| Pct. (%) | 0.9 | 1.4 | 10.6 | 52.4 | 32 | 1.6 | 1.1 | 100 | |
| 2013 to 2018 | Area (km2) | 81.89 | 102.54 | 736.13 | 6543.48 | 1799.06 | 156.55 | 70.35 | 9490 |
| Pct. (%) | 0.9 | 1.1 | 7.7 | 69 | 19 | 1.6 | 0.7 | 100 | |
| 2018 to 2022 | Area (km2) | 75.31 | 129.28 | 112.01 | 798.59 | 5746.48 | 2367.69 | 260.64 | 9490 |
| Pct. (%) | 0.8 | 1.4 | 1.2 | 8.4 | 60.6 | 24.9 | 2.7 | 100 | |
| 1990 to 2022 | Area (km2) | 82.73 | 111.83 | 245.75 | 849.63 | 3032.64 | 3657.09 | 1510.33 | 9490 |
| Pct. (%) | 0.9 | 1.2 | 2.6 | 9 | 32 | 38.5 | 15.8 | 100 |
Disclaimer/Publisher’s Note: The statements, opinions and data contained in all publications are solely those of the individual author(s) and contributor(s) and not of MDPI and/or the editor(s). MDPI and/or the editor(s) disclaim responsibility for any injury to people or property resulting from any ideas, methods, instructions or products referred to in the content. |
© 2024 by the authors. Licensee MDPI, Basel, Switzerland. This article is an open access article distributed under the terms and conditions of the Creative Commons Attribution (CC BY) license (https://creativecommons.org/licenses/by/4.0/).
Share and Cite
Huo, Q.; Cheng, X.; Du, W.; Zhang, H.; Han, R. Remote Sensing Evaluation and Monitoring of Spatial and Temporal Changes in Ecological Environmental Quality in Coal Mining-Intensive Cities. Appl. Sci. 2024, 14, 8814. https://doi.org/10.3390/app14198814
Huo Q, Cheng X, Du W, Zhang H, Han R. Remote Sensing Evaluation and Monitoring of Spatial and Temporal Changes in Ecological Environmental Quality in Coal Mining-Intensive Cities. Applied Sciences. 2024; 14(19):8814. https://doi.org/10.3390/app14198814
Chicago/Turabian StyleHuo, Qiqi, Xiaoqian Cheng, Weibing Du, Hao Zhang, and Ruimei Han. 2024. "Remote Sensing Evaluation and Monitoring of Spatial and Temporal Changes in Ecological Environmental Quality in Coal Mining-Intensive Cities" Applied Sciences 14, no. 19: 8814. https://doi.org/10.3390/app14198814