Abstract
To explore the advantages in the flexibility of ternary pumped storage units (T-PSUs) compared with fixed-speed pumped storage units (FS-PSUs) and variable-speed pumped storage units (VS-PSUs) in the day-ahead optimal scheduling of power systems, this paper firstly establishes the mathematical model of T-PSUs which is suitable for the target application, and establishes a new hybrid pumped storage model combining both FS-PSUs and T-PSUs for the purpose of improving existing FS-PSUs. Secondly, a day-ahead optimal scheduling model used for a wind-thermal-pumped storage bundled transmission system with the goal of obtaining the lowest operating cost is established. Additionally, various indicators are proposed to comprehensively evaluate the flexibility of different pumped storage unit types on day-ahead optimal scheduling. Finally, a sensitivity analysis is conducted from three aspects: covering the wind power capacity, load rate, and pumped storage capacity. The results indicate that T-PSUs are superior to FS-PSUs and VS-PSUs in maintaining the smooth, economic, and robust operation of thermal power units, as well as in promoting wind power consumption. This provides a significant reference for evaluating the technical and economic benefits of the different types of pumped storage units in applications of future power grids.
1. Introduction
When confronted with the increasingly serious energy crisis, wind energy, as a renewable and clean energy, has been extensively developed and utilized in power systems [1,2]. However, the significant volatility [3] and the inverse peak regulation characteristics [4] of such wind power impose considerable pressure on both the smooth and economic operation of the power system and the integration of wind power [5]. Therefore, it is necessary to provide a flexible power supply for wind power transmission.
Pumped storage (PS) is a kind of low-carbon and clean flexible power supply, with the characteristics of pumping water during high wind conditions and releasing it to generate electricity during low wind conditions [6]. In the future, thermal power will gradually transition from supplying base loads to serving as adjustable power sources [7]. For large-scale wind power delivery systems, studies on the output strategies of pumped storage units (PSUs) and thermal power units can scientifically guide the daily operational arrangement of the system, which plays a crucial role in improving the smoothness and economy of system operations [8]. Therefore, it is necessary to carry out research on the optimization scheduling of the power system equipped with wind power, pumped storage, and thermal power. According to different speed regulation types, pumped storage units can be divided into three types: fixed-speed pumped storage units (FS-PSUs), variable-speed pumped storage units (VS-PSUs), and ternary pumped storage units (T-PSUs) [9,10]. Given the influence of the different speed regulation characteristics of the PSUs participating in power system optimization scheduling [11], the academic community has conducted some studies.
As for FS-PSUs, their characteristic is that the power cannot be adjusted during operation in the pump mode [12]. Ref. [13] conducted the short-term optimization scheduling of a wind-pumped storage complementary system, intending to maximize the total revenue of the whole system. The results show that PS effectively compensates for the volatility of the wind power output and significantly enhances the total power generation revenue of the complementary system. However, when the wind power output is high, and if the excess wind power does not reach the integer multiple of the maximum pumped power of the FS-PSUs, pumping at this time will lead to “over-peak regulation”. Conversely, refraining from pumping to store the excess wind power may lead to wind curtailment. Ref. [14] compared the cost-effectiveness of the combined operation of FS-PSUs and VS-PSUs with renewable energy sources. The results show that compared with VS-PSUs, FS-PSUs exhibit weaker load adaptability, leading to the frequent start-up and shutdown of thermal power units, which increases the fuel consumption and CO2 emissions. Therefore, it can be found that when the FS-PSUs are involved in the optimal scheduling of the power system, the pumping power remains inflexible and cannot be adjusted. This will increase the pressure of peak regulation operations for thermal power units, which does not satisfy the requirements for the low-carbon operations of the new power system.
As for VS-PSUs, their characteristic is that the power can be adjusted within a certain range in the pump mode [15]. Currently, the research on VS-PSUs primarily focus on unit dynamics modeling, control strategies, and stability evaluation [16,17], with quite limited investigation in power system optimization scheduling. In Refs. [18,19], a joint dispatching model including VS-PSUs and other power units is established, and it can be found that VS-PSUs cannot only improve the levels of new energy consumption but also reduce the pressure of thermal power peak regulation. However, the aforementioned references suffer from the assumption of a minimum pumping power of zero for VS-PSUs during their pumping phase, which does not match well with practical scenarios. In reality, VS-PSUs can be divided into two types: doubly fed units and full-power variable frequency units. The doubly fed units can regulate speed from 80% to 100% of their rated power, while the full-power variable frequency units have a wider range, operating from 60% to 100% of their rated power [20]. Furthermore, the PSUs in the pumped storage of the aforementioned references all belong to VS-PSUs. In fact, there is no full variable-speed pumped storage (VS-PS). Consequently, research on the optimal scheduling for pure VS-PS is deemed impractical.
As for T-PSUs, their disadvantage lies in that the cost per kilowatt is relatively high; however, it has unique technical advantages in many aspects [10,11]. One of the main advantages of T-PSUs is that their capability to operate not only in modes where the turbine and pump operate independently (i.e., the conventional mode), but also simultaneously. Therefore, when the pump operates at its maximum pumping power, the turbine can still adjust its output simultaneously. By adjusting the output of the turbine, the overall pumping power of the unit is changed, which can be dynamically varied from zero to its maximum [21]. Since T-PSUs have a wider range of regulation in the pump mode, they can pump at a more precise power when the wind power is high, without pumping more or less. This advantage can be applied to the combined operation of a PS and wind farm, thus achieving the effect of mitigating wind power fluctuations and enhancing the integration ability of wind power. However, the current academic research on the ternary pumped storage (T-PS) remain primarily in the technical demonstration stage [10,22], which mainly focuses on the transition performance between the pump and turbine modes, as well as the steady-state and dynamic regulation characteristics of the power regulation of units in the pump mode, with few systematic studies analyzing and demonstrating the effect of T-PSUs on improving the integration effect of new energy. Therefore, to explore the impact of T-PSUs in solving new energy integration, it is necessary to study the optimization scheduling of the power system including T-PSUs. Furthermore, the comparative analysis and comprehensive benefit assessment of optimal scheduling among FS-PSUs, VS-PSUs, and T-PSUs are notably absent.
At present, most pumped storage plants in the world are installed with only FS-PSUs [21]. However, with the continuous development of variable-speed technology, the pure fixed-speed pumped storage (FS-PS) will be gradually upgraded in the future, leading to the coexistence of FS-PSUs and VS-PSUs [23]. Refs. [20,24] forms a hybrid pumped storage with FS-PSUs and VS-PSUs by upgrading and transforming some units of a pure FS-PS into VS-PSUs. The results show that after the transformation, the wind and solar power curtailment rate of the system decreases, and the peak regulation pressure of the thermal power can be reduced to a certain extent. The above reference studies the participation of PS with both FS-PSUs and VS-PSUs in power system optimization scheduling. Compared to pure FS-PS, a hybrid PS with both FS-PSUs and VS-PSUs has stronger regulation capabilities. Given the flexibility advantage of T-PSUs, it is also very meaningful to upgrade the FS-PSUs to T-PSUs. Nevertheless, there remains a scarcity of references studying a hybrid PS with FS-PSUs and T-PSUs.
In conclusion, VS-PSUs offer distinct advantages over FS-PSUs, including the enhanced utilization of new energy sources, decreased reliance on peak regulation by thermal power plants, and lowered carbon emissions. Furthermore, compared to VS-PSUs, T-PSUs possess superior flexibility and full-range power modulation capabilities in the hydraulic short-circuit modes. Given these benefits, the harmonious integration of both FS-PSUs and VS-PSUs is anticipated to lead the evolution of PS. Moreover, given the significant advantages of T-PSUs, it is necessary to establish the optimal scheduling model of T-PSUs and explore the integration of both FS-PSUs and T-PSUs in PS to effectively participate in the day-ahead optimal power system scheduling. The main contributions of this paper are threefold:
(1) The mathematical model of T-PSUs participating in the day-ahead optimization scheduling of a power system is constructed for the first time. On this basis, the hybrid pumped storage model which combines FS-PSUs and T-PSUs is further developed.
(2) A set of comprehensive indicators, which are utilized for the flexibility assessment of the pumped storage, are proposed to quantify the wind power curtailment rates, the operational costs of thermal power plants, the depth of thermal power peak regulation, and the levels of thermal power output volatility, thus better satisfying the requirements of environmental protection, economic efficiency, and operational smoothness.
(3) Sensitivity analysis conducted from three aspects, which are wind power capacity, load rate, and pumped storage capacity, thoroughly investigates the flexibility of various pumped storage types in day-ahead optimization scheduling.
The rest of this paper is organized as follows: In Section 2, the models for various types of pumped storage plants to participate in optimization scheduling are constructed. In Section 3, a day-ahead optimization scheduling model of the wind-thermal-pumped storage bundled transmission system is formulated. In Section 4, a set of comprehensive evaluation indicators are defined. In Section 5, extensive experiments are conducted to validate the flexibility of the T-PSUs model presented in this paper. In Section 6, some important conclusions are drawn.
2. Models for Various Types of Pumped Storage
This paper formulates mathematical models for the five distinct categories of PS, characterized as follows: with only FS-PSUs [25], with only VS-PSUs [26], with only T-PSUs, FS-PSUs combined with VS-PSUs, and FS-PSUs combined with T-PSUs. This establishes a model basis for subsequent research on various types of pumped storage participation in day-ahead optimization scheduling.
2.1. Constraints on Pump Mode of Pumped Storage
In the pump mode, FS-PSUs and T-PSUs are restricted to operating at their maximum pumping power. It should be noted that there will be losses during the pumping process, which mainly include the efficiency loss of the pump, the friction loss in the pipeline, and the loss of electrical energy transmission. These losses mean that the actual pumping power needs to be slightly higher than the theoretically calculated demand power. Therefore, the actual maximum pumping power is generally set to a multiple of the rated maximum pumping power [12]. Therefore,
The VS-PSUs can pump water within a certain range of their maximum pumping power [15]:
where PPump,t represents the pumped power of the PS at time t; N is the number of units in a PS; PPump,t,n represents the pumping power of the n-th pumped storage unit (PSU) at time t; PStorage,n denotes the rated maximum pumping power of the n-th PSU; Xt,n is a Boolean value, which can only take the values 0 or 1, indicating the pumping status of the n-th PSU at time t, where 1 represents pumping, and 0 represents not pumping; μ denotes a multiple of the rated maximum pumping power; and α is a multiplier utilized to calculate the lower limit of the pumping power of the VS-PSUs.
For the hybrid PS that includes both FS-PSUs and VS-PSUs, the state of pumping needs to be constrained separately. Assuming there are nfixed FS-PSUs and nvariable VS-PSUs, then there are the following:
For the hybrid PS that include both FS-PSUs and T-PSUs, the pump mode constraints also follow Equations (1) and (2) since their pump mode constraints are the same.
2.2. Constraints on Turbine Mode of Pumped Storage
FS-PSUs, VS-PSUs, and T-PSUs can all adjust their power output within the range of 0 to their rated power in the turbine mode [2]. That is presented in the following:
where PGen,t represents the power generation of the PS at time t; PGen,t,n represents the power generation of the n-th PSU at time t; and Yt,n is a Boolean value, which can only take the values 0 or 1, indicating the power generation status of the n-th PSU at time t, where 1 represents the power generation and 0 represents no power generation.
Therefore, for the hybrid PS that includes both FS-PSUs and VS-PSUs as well as those that include both FS-PSUs and T-PSUs, the turbine mode constraints also follow Equations (6) and (7).
2.3. Constraints on the Operational State of Pumped Storage
Both FS-PSUs and VS-PSUs belong to the reversible PSUs, indicating that they cannot simultaneously operate in the pump and turbine modes. Furthermore, when the units are pumping, no other units can generate, and vice versa [14]. Therefore, Xt,n and Yt,n cannot equal 1 at the same time, of which the relationship can be expressed by the following formula:
For the hybrid PS that includes both FS-PSUs and VS-PSUs, the operational state constraints can be represented by Equation (8), since the operational state constraints of FS-PSUs and VS-PSUs are the same.
The T-PSUs incorporate three operational modes: pump operation only, turbine operation only, or both turbine and pump operation [27]. The relationship between the pump and turbine of the T-PSUs mentioned above can be summarized as follows:
When Xt,n = 1, Yt,n = 0, T-PSUs are in the pump mode; when Xt,n = 0, Yt,n = 1, T-PSUs are in the turbine mode; when Xt,n = 1, Yt,n = 1, T-PSUs are in both the pump and turbine operation mode.
For the hybrid PS that includes both FS-PSUs and T-PSUs, the state relationships for pumping and power generation must be constrained separately. Assuming there are nfixed FS-PSUs and nternary T-PSUs, then there are the following:
2.4. Constraints on Reservoir Capacity of Pumped Storage
During practical operation, PS must adhere to reservoir capacity constraints, which are addressed in this paper through electric energy balance [21]. For the PS of the daily regulation mode, to ensure the normal operation of pumped storage in the next scheduling cycle, the initial reservoir capacity and final reservoir capacity of the PS shall be equal [28]. In other words, the daily pumping and generation electric energies should be equal.
where ηPump,n represents the pumping efficiency of the n-th PSU, and T represents the total time period of the day-ahead optimization scheduling. In this paper, the day is segmented into T = 24 periods, with each period lasting for 1 h.
The energy in a PS is continuous and depends on the pumping and generating powers from previous moments [2].
where Et represents the level of the electric energy of a PS at time t; E1 represents the initial electric energy of a PS; Emax represents the maximum electric energy of a PS; β represents the ratio of the initial electric energy E1 to the maximum electric energy Emax; and TGenmax represents the maximum power generation hours of a PS, that is, for a full water pumped storage, the maximum hours it can generate electricity if it generates electricity at its maximum power.
Any type of PS must satisfy the above constraints of Equation (12) to Equation (15).
At any time, the electric energy level of a PS must be between its maximum and minimum values. For pure FS-PS or pure VS-PS, the pumping electric energy must not exceed the remaining electric energy of the PS, and the generation electric energy must not exceed the available electric energy of the PS [21].
where Emin represents the minimum value of the electric energy of PS, which can be taken as a value greater than 0 and less than Emax.
For the hybrid PS that includes both FS-PSUs and VS-PSUs, the pumping electric energy and the generation electric energy also need to satisfy Equations (16) and (17) since the electric energy constraints of FS-PSUs and VS-PSUs are the same.
For pure T-PS, since the PSUs can pump and generate electricity simultaneously, the upper and lower limits of the energy constraints can be expressed as the following:
For the hybrid PS that includes both FS-PSUs and T-PSUs, the electric energy must be constrained separately. Assuming there are nfixed FS-PSUs and nternary T-PSUs, then there are the following:
3. A Hierarchical Optimization Scheduling Model for the Wind-Thermal-Pumped Storage Bundled Transmission System
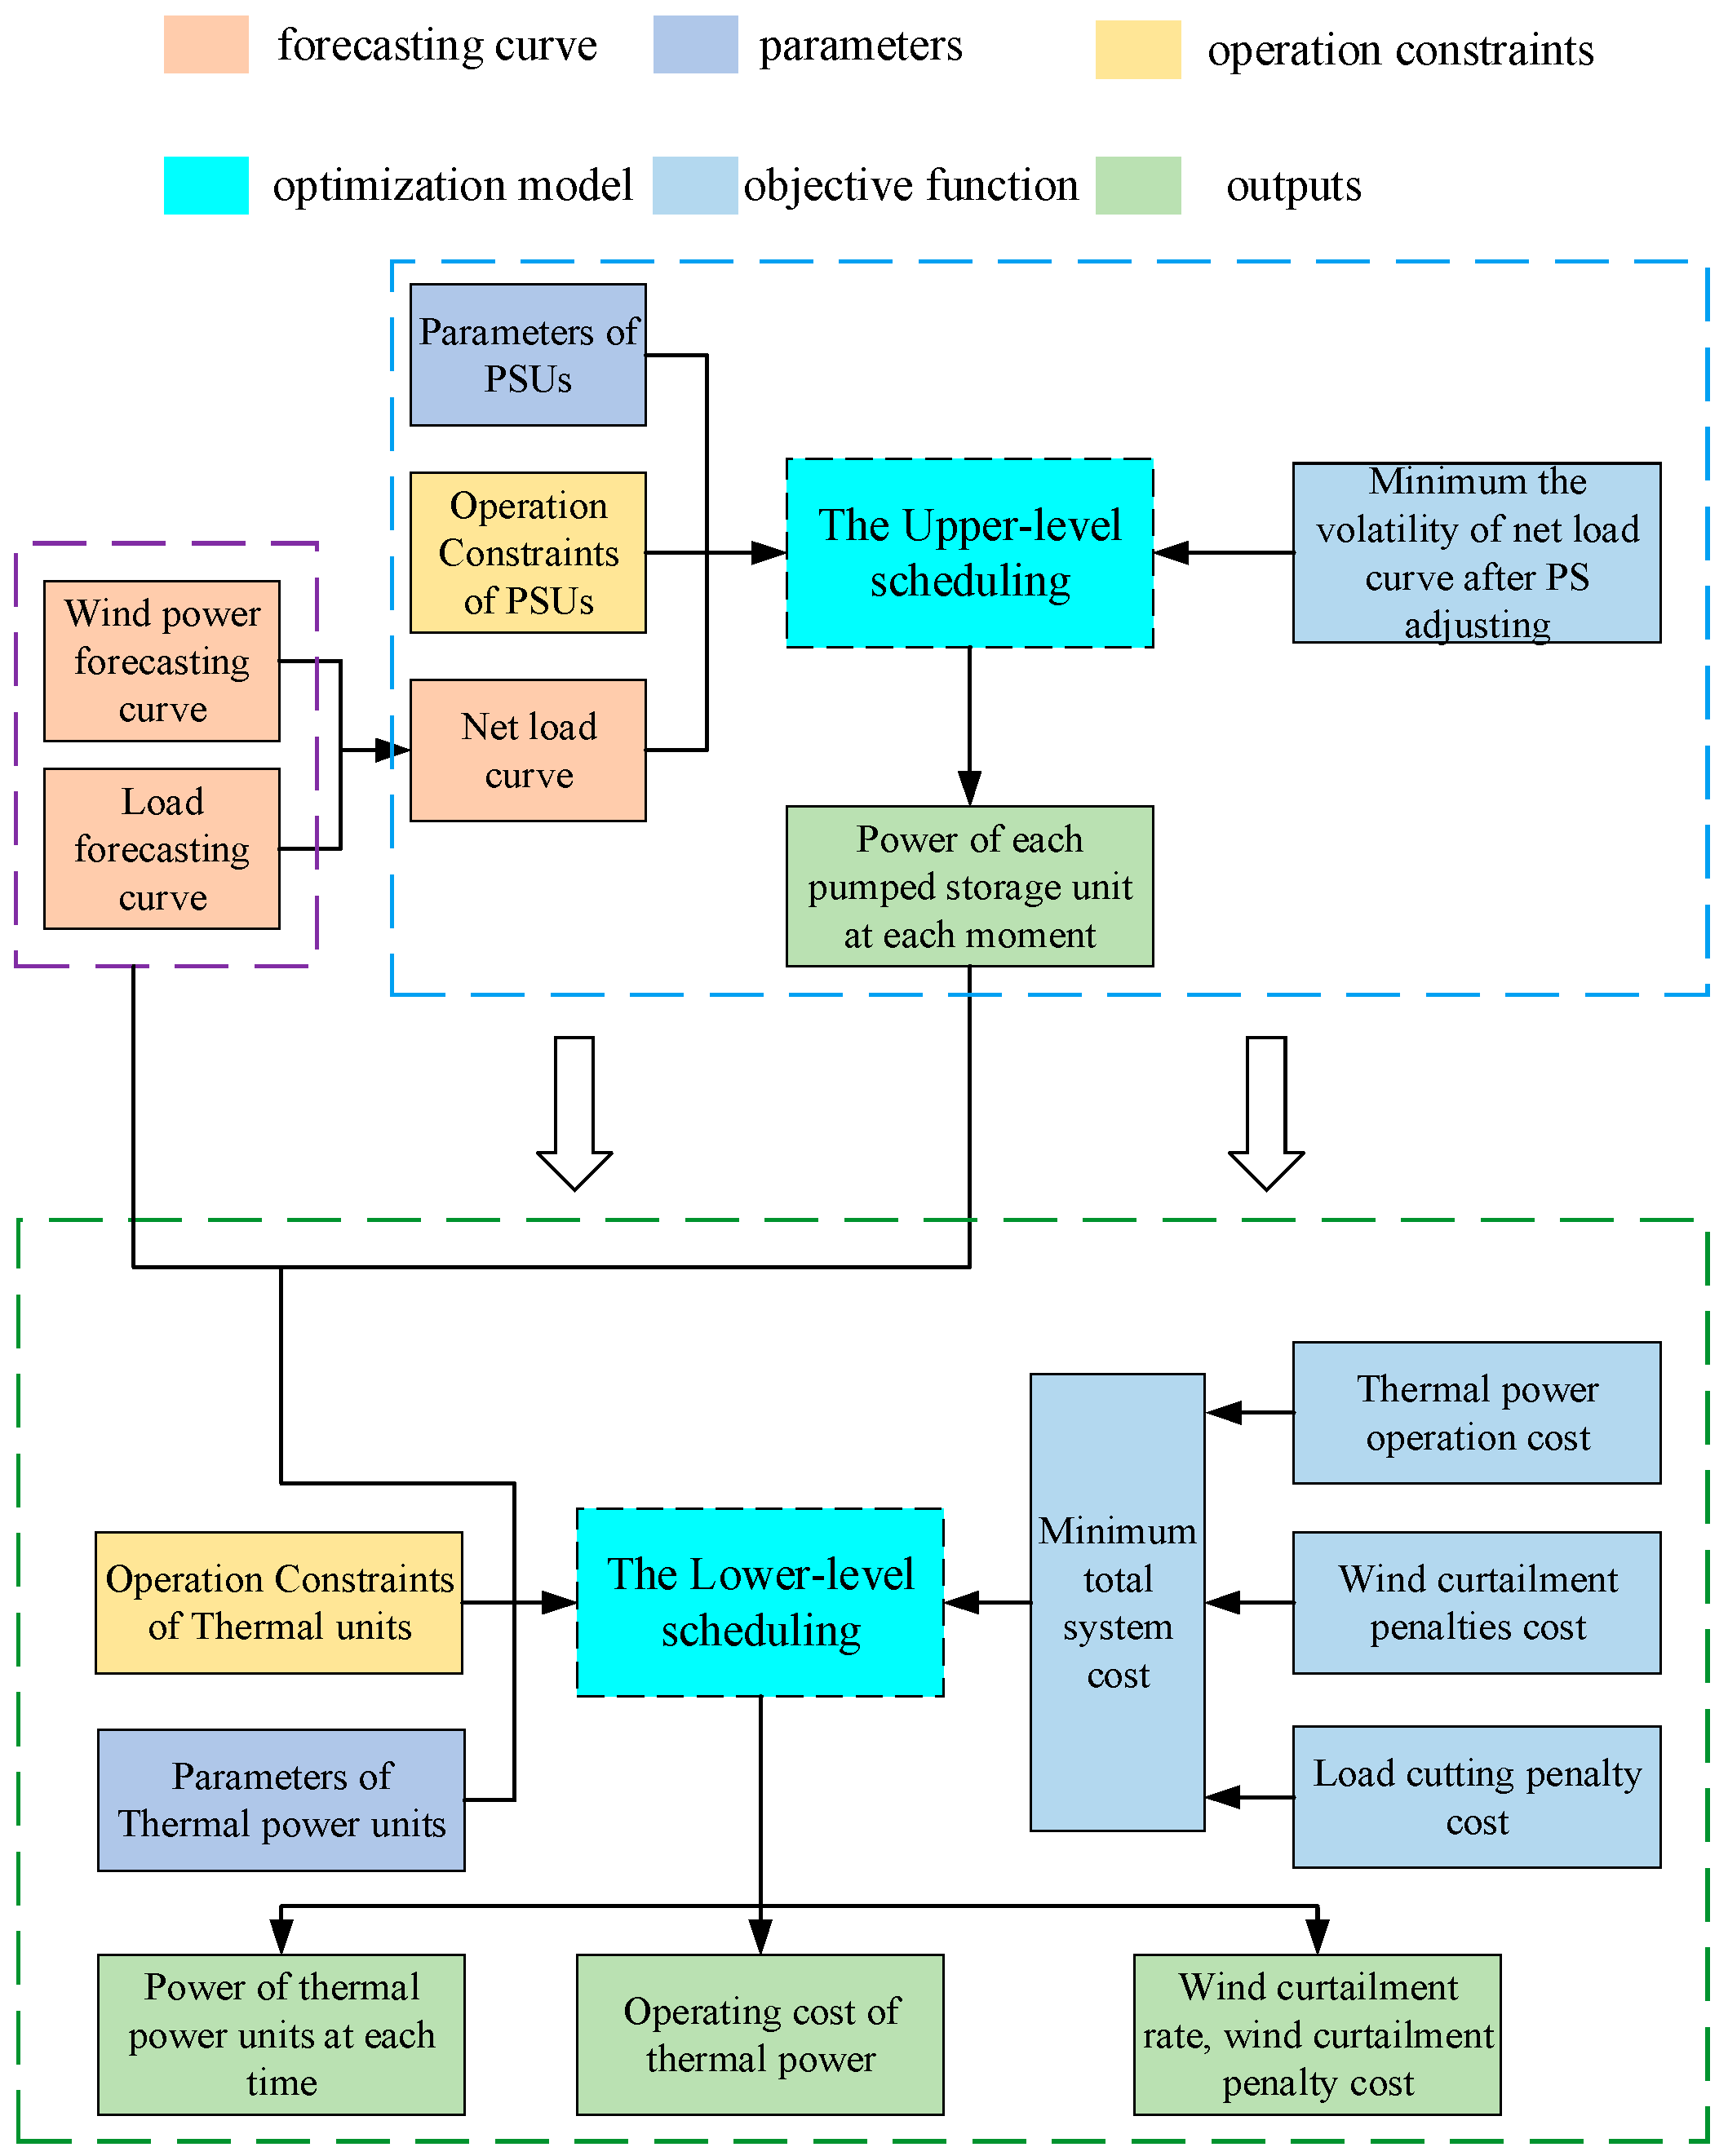
To leverage the regulatory capabilities of PS in reducing the peak shaving burden on thermal power and enhancing wind power consumption, this paper constructs a hierarchical day-ahead optimization scheduling model [29] for the joint operation of wind power, load, pumped storage, and thermal power. The model structure is shown in Figure 1. The upper-level model makes the wind power follow the load as much as possible through the regulation of PS, and the lower-level model satisfies the supply and demand balance of the system through the further regulation of thermal power.

Figure 1.
Hierarchical optimal scheduling model structure.
3.1. Upper-Level Scheduling Model
3.1.1. Upper-Level Objective Function
The total load minus the contribution of wind energy turns to be the remaining load, which is defined as the net load [30]. The upper-level model aims to minimize the volatility (i.e., variance) of the net load curve after the PS adjustment, formulated as the following:
where and , respectively, represent the forecast power of the load and wind power at time t, and Pavg represents the average value of the net load curve over the period T.
3.1.2. Upper-Level Constraints
For the PS with only FS-PSUs, the constraints are defined in Equations (1), (2), (6)–(8) and (12)–(17). For those with only VS-PSUs, Equation (2) in the constraints for pure FS-PS is replaced by Equation (3). For PS with only T-PSUs, Equations (8), (16) and (17) in the constraints for pure FS-PS are replaced by Equations (9), (18) and (19). For a hybrid PS that includes both FS-PSUs and VS-PSUs, Equation (2) in the constraints for pure FS-PS is replaced by Equations (4) and (5). For a hybrid PS with both FS-PSUs and T-PSUs, the operational state constraints are applied using Equations (10) and (11) and reservoir capacity constraints are applied using Equations (12)–(15), (20) and (21), while other constraints are consistent with those for pure FS-PS.
3.2. Lower-Level Scheduling Model
The lower-level model takes the power of PS at each moment from the upper-level model as known quantities and adjusts the output of thermal power units to balance supply and demand, considering wind curtailment and load shedding.
3.2.1. Lower-Level Objective Function
The lower-level model aims to minimize the total operating cost of the system [2], including the thermal power operating cost, wind curtailment penalty, and load-cutting penalty.
where CCOAL, CWIND, and CLOAD represent the operating costs of thermal power, penalties for wind power curtailment, and penalties for load shedding, respectively; M represents the number of thermal power units; the operating cost of the thermal power is represented by a quadratic function, where am, bm, and cm represent the quadratic, linear, and constant term coefficients of the operating cost function for the m-th thermal power unit, respectively; PCoal,t,m represents the output power of the m-th thermal power unit at time t; θ and λ represent the wind curtailment penalty coefficient and load shedding penalty coefficient, respectively, with the unit: CNY/MW·h; PWind,t represents the actual output power of the wind power at time t; and PLoad,t represents the actual demand power of the load at time t.
3.2.2. Lower-Level Constraints
The constraints of the lower-level model include wind power output limitations, load demand constraints, thermal power generation, restrictions on the minimum start and stop times for thermal units, thermal power ramping constraints, and system power balance.
(1) Constraints on wind power output.
The predicted wind power is taken as the theoretical maximum output of wind power [24]. Therefore, the actual wind power output must satisfy the following constraints.
(2) Constraints on load demand.
The actual load demand is not allowable to exceed the predicted load demand at any time.
(3) Constraints on thermal power generation.
Thermal power unit output must be within its minimum and maximum operational limits at any time.
where PCoalmin,m and PCoalmax,m represent the minimum and maximum output of the m-th thermal power unit, respectively; Ut,m is a Boolean value, which can only take 0 or 1, indicating the operational state of the m-th thermal power unit at time t, where 1 represents an operation and 0 represents shutdown.
(4) Constraints on the minimum start and stop times for thermal units.
Thermal power must adhere to minimum on–off time constraints [2], encompassing both minimum startup and shutdown times. The formulas are as follows:
where τ represents the time interval; Ton,m and Toff,m represent the minimum startup time and minimum shutdown time for the m-th thermal power unit, respectively.
(5) Constraints on thermal power ramping.
where and represent the upward and downward ramping capabilities of the m-th thermal power unit, respectively.
(6) Constraints on system power balance.
The total power generation of the power system must equal the actual load demand at any time.
4. Definition of Evaluation Indicators
(1) Wind power curtailment rate (WPCR).
The wind power curtailment rate is calculated as the total curtailed wind power over T hours divided by the predicted total wind power [31].
(2) Net load curve standard deviation (STD).
Standard deviation reflects the data dispersion and can be used to evaluate the volatility of the data. The standard deviation of the net load curve is calculated as follows:
(3) Thermal power average peak regulation depth [23] (APRD).
The average peak regulation depth of thermal power is the total change in thermal power output divided by the total time of day-ahead optimization scheduling.
(4) Thermal power output volatility (TPOV).
(5) Power generation output indictors.
This paper uses the pumping and generating energies of PS, along with the generation energy of thermal power, as indicators of power source output. The formulas for PS energies are detailed in Equation (12). The formula for thermal power generation denoted as ECoal is provided below.
5. Case Study
5.1. Basic Data
This paper studies the flexibility of the different types of PS using a wind-thermal-pumped storage transmission system in a certain area of the China Southern Power Grid as a case study.
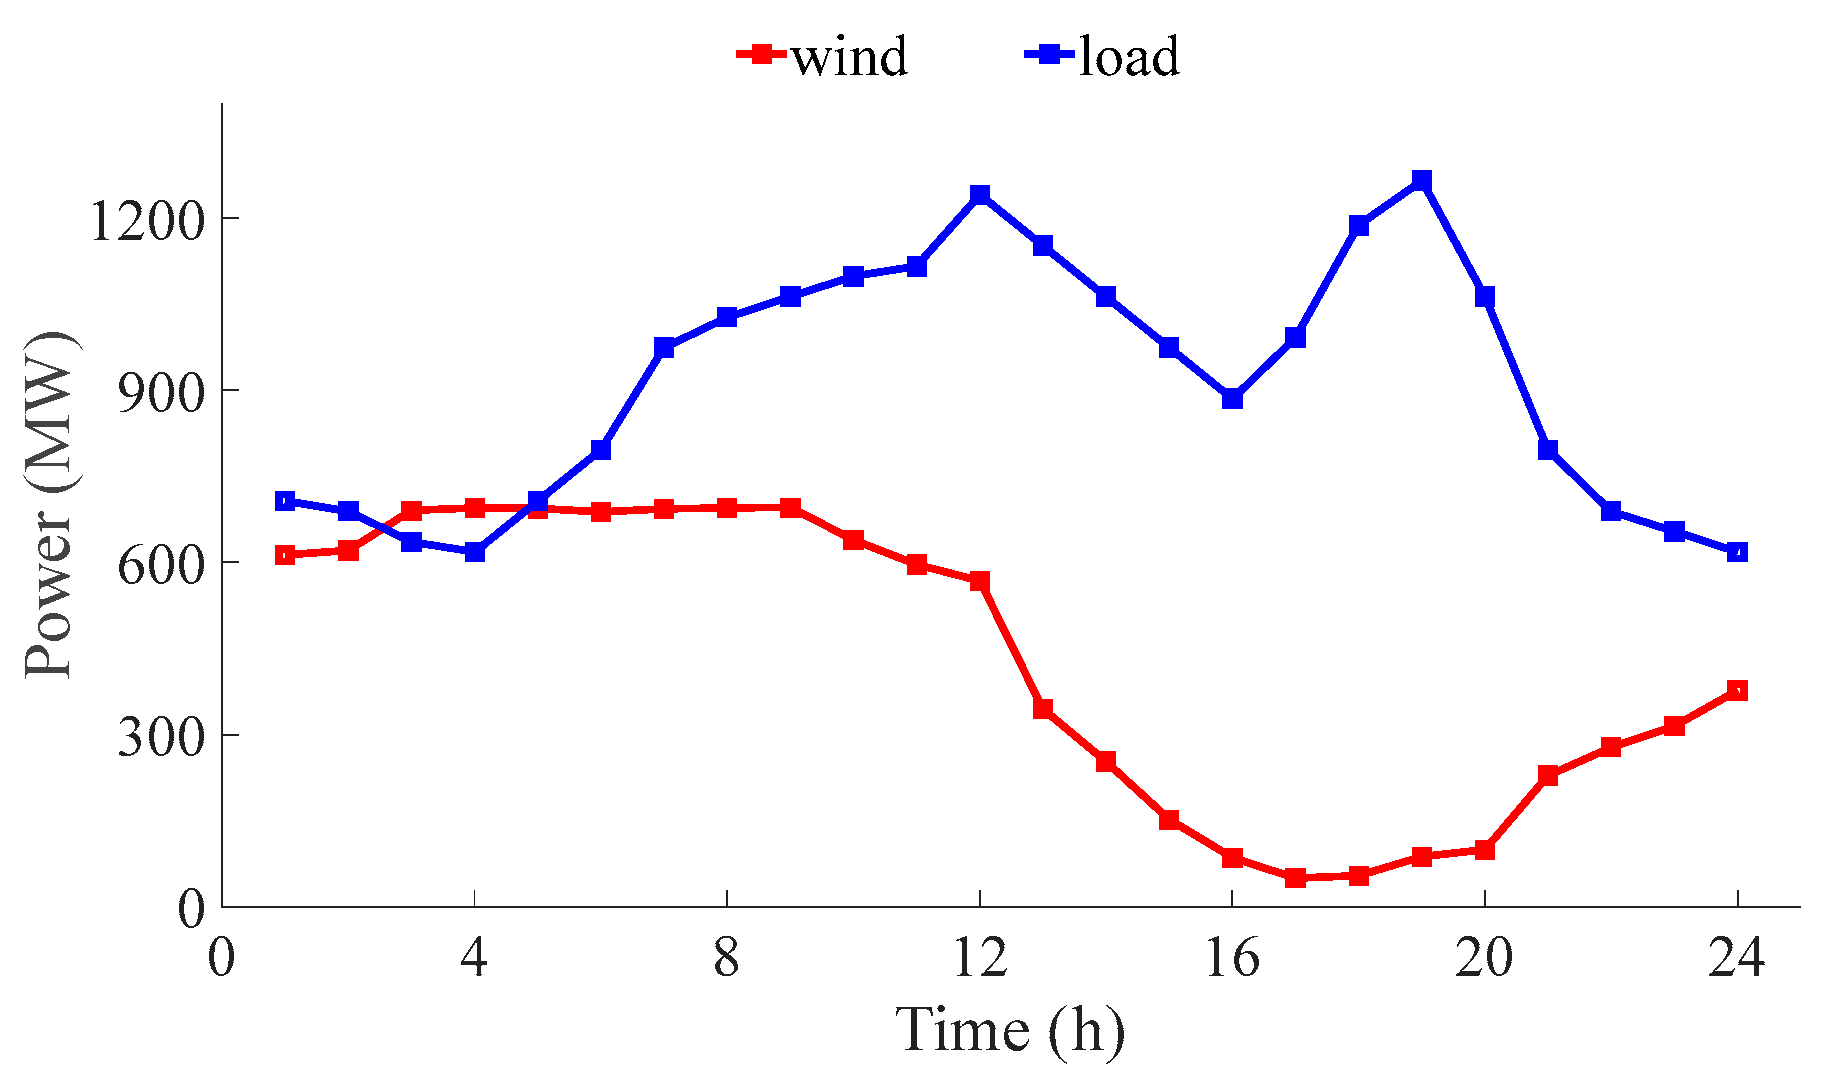
The wind farm has a capacity of 1000 MW, and it is complemented by a thermal power plant with four units [2], namely T1, T2, T3, and T4, as detailed in Table 1. The PS comprises four units, with specifications listed in Table 2. Among them, the parameters of wind power, thermal power, and pumped storage are selected based on real data. The 24 h forecasted power curves for wind energy and load in a certain area of the China Southern Power Grid are depicted in Figure 2. The penalties are set as 210 CNY/MW·h for wind curtailment and 1.5 times the time-of-use electricity prices of the local area for load shedding, with the time-of-use electricity prices [29] of the local area detailed in Table 3. The day-ahead optimization scheduling model is solved with GUROBI [32] via MATLAB YALMIP [33].

Table 1.
Parameters of thermal power units.
Table 2.
Parameters of pumped storage units.
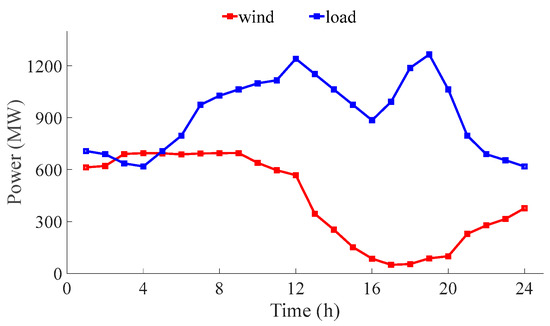
Figure 2.
The 24 h power forecast curves of wind power and load in a certain area of the China Southern Power Grid.
Table 3.
Time-of-use electricity prices in a certain area.
5.2. Analysis of Day-Ahead Optimization Scheduling Strategies for Different Types of Pumped Storage
To assess the flexibility of ternary pumped storage and explore the effects of the various types of PS on the day-ahead optimization scheduling of the power system, this paper considers different combinations of FS-PSUs, VS-PSUs, and T-PSUs, detailed in eight configuration schemes as outlined in Table 4. Among them, schemes 2 to 5 are the various combinations of FS-PSUs and VS-PSUs, which belong to the previous studies. Schemes 6 to 8 are the various combinations of T-PSUs proposed in this paper. Under different configuration schemes, the total capacity of the pumped storage remains the same (i.e., 360 MW).
Table 4.
Pumped storage configuration schemes.
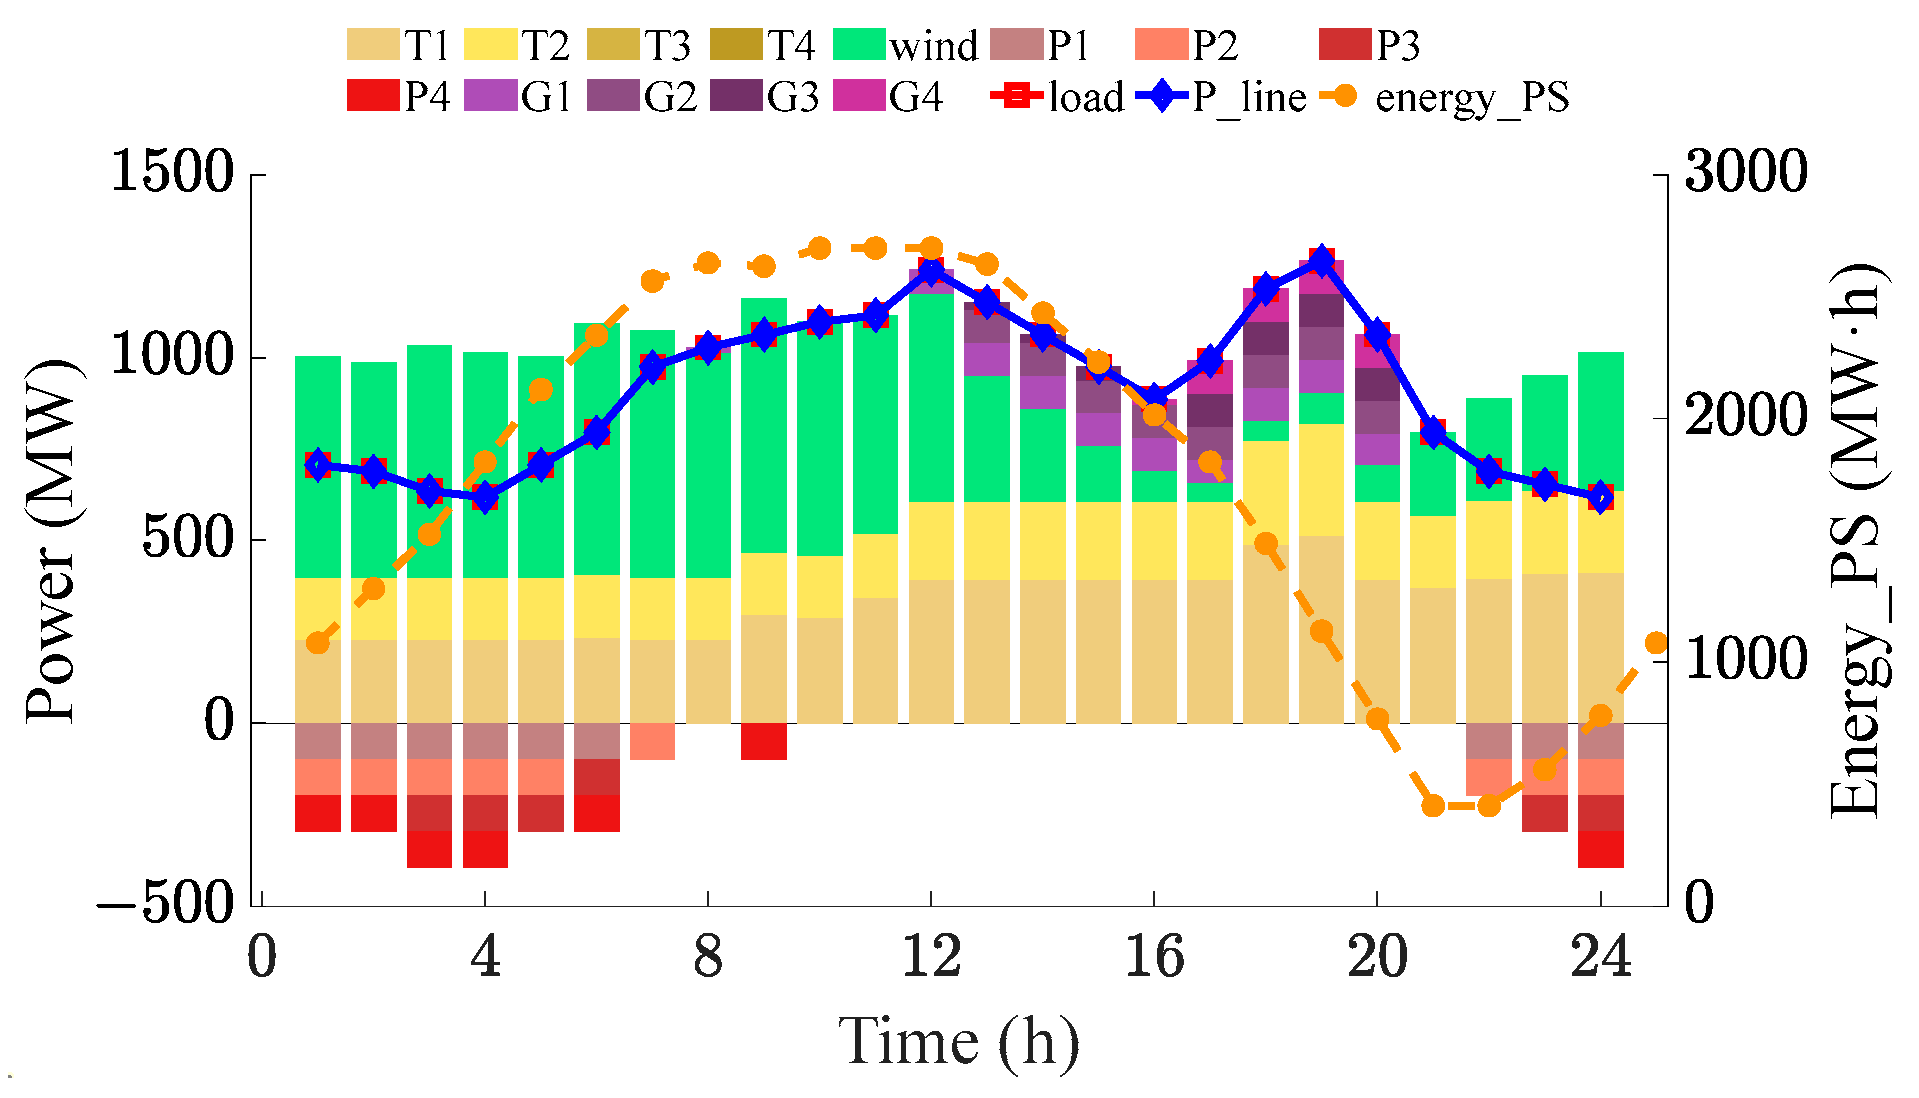
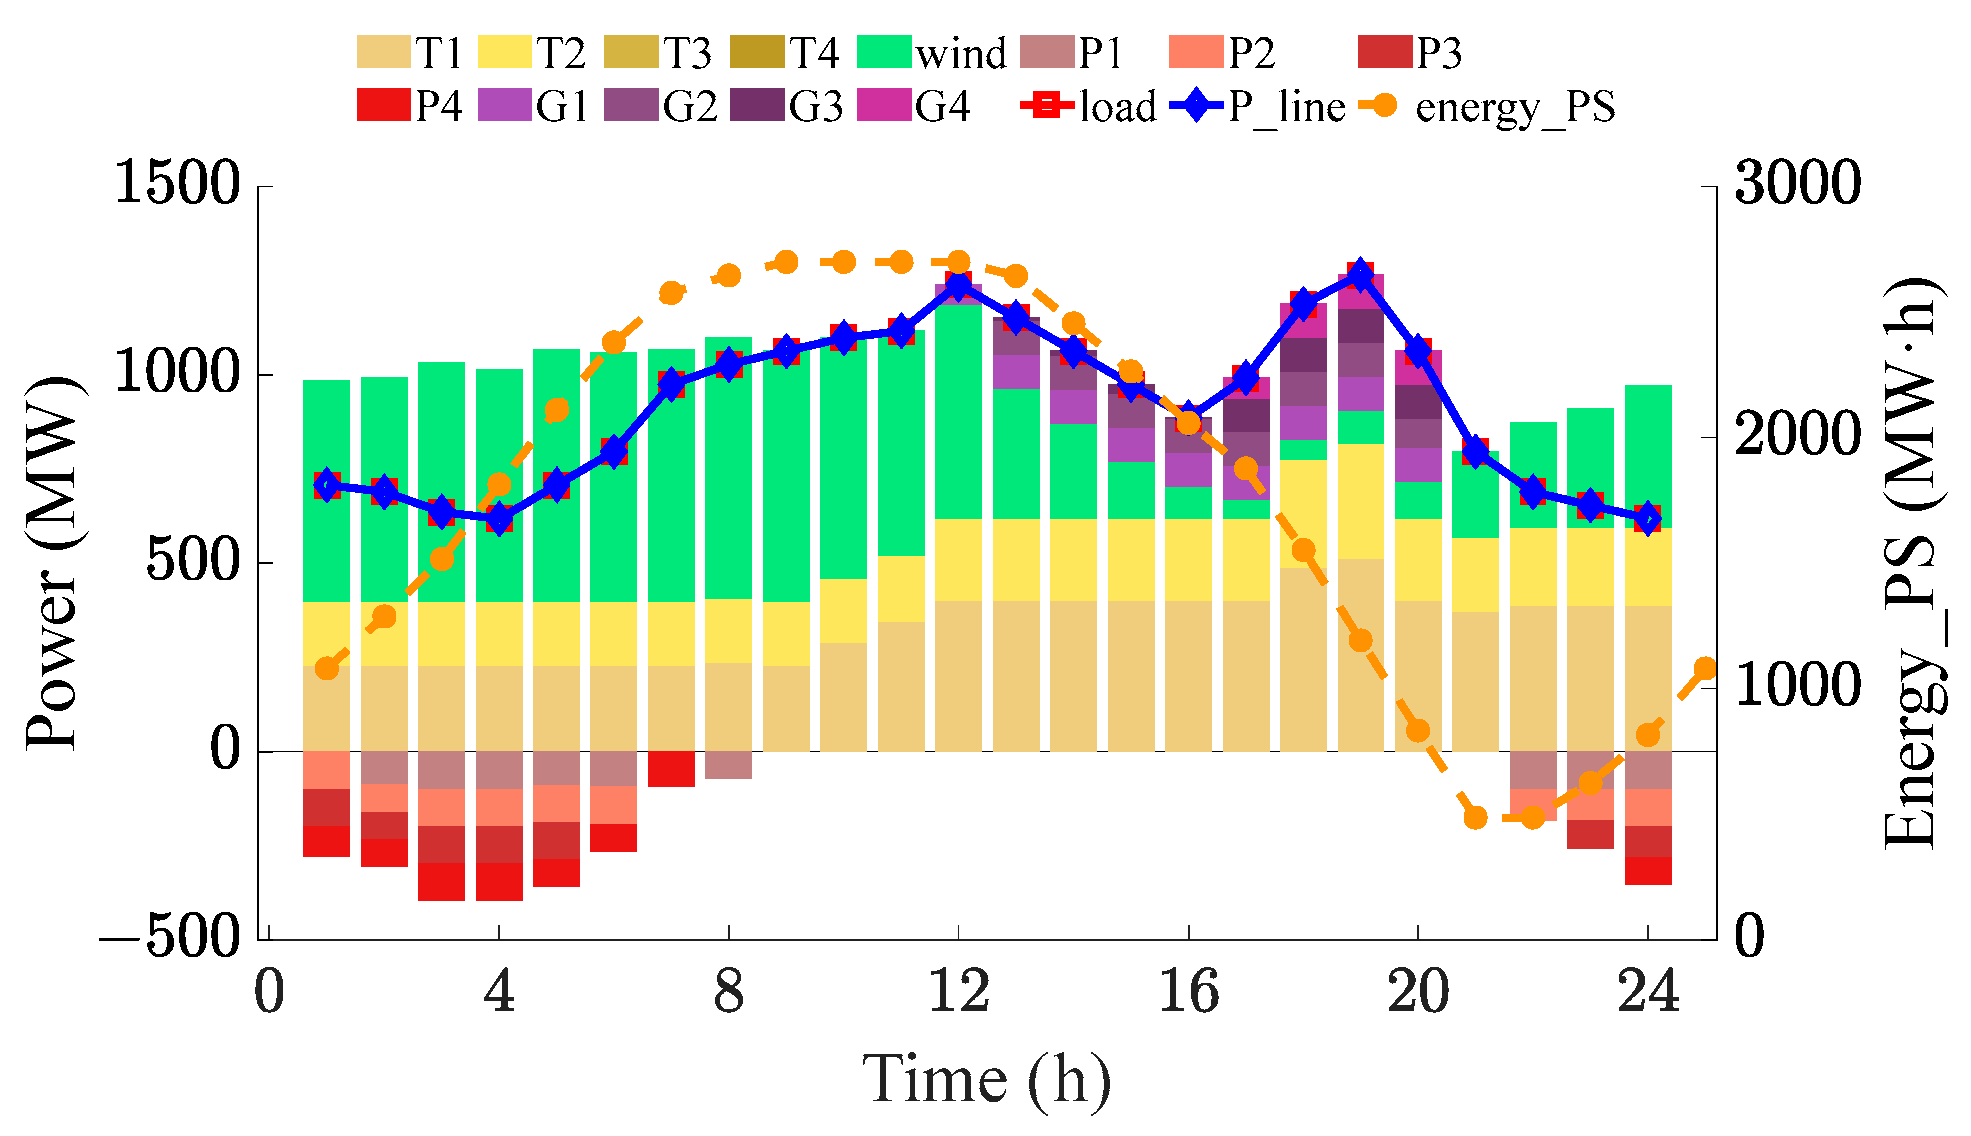
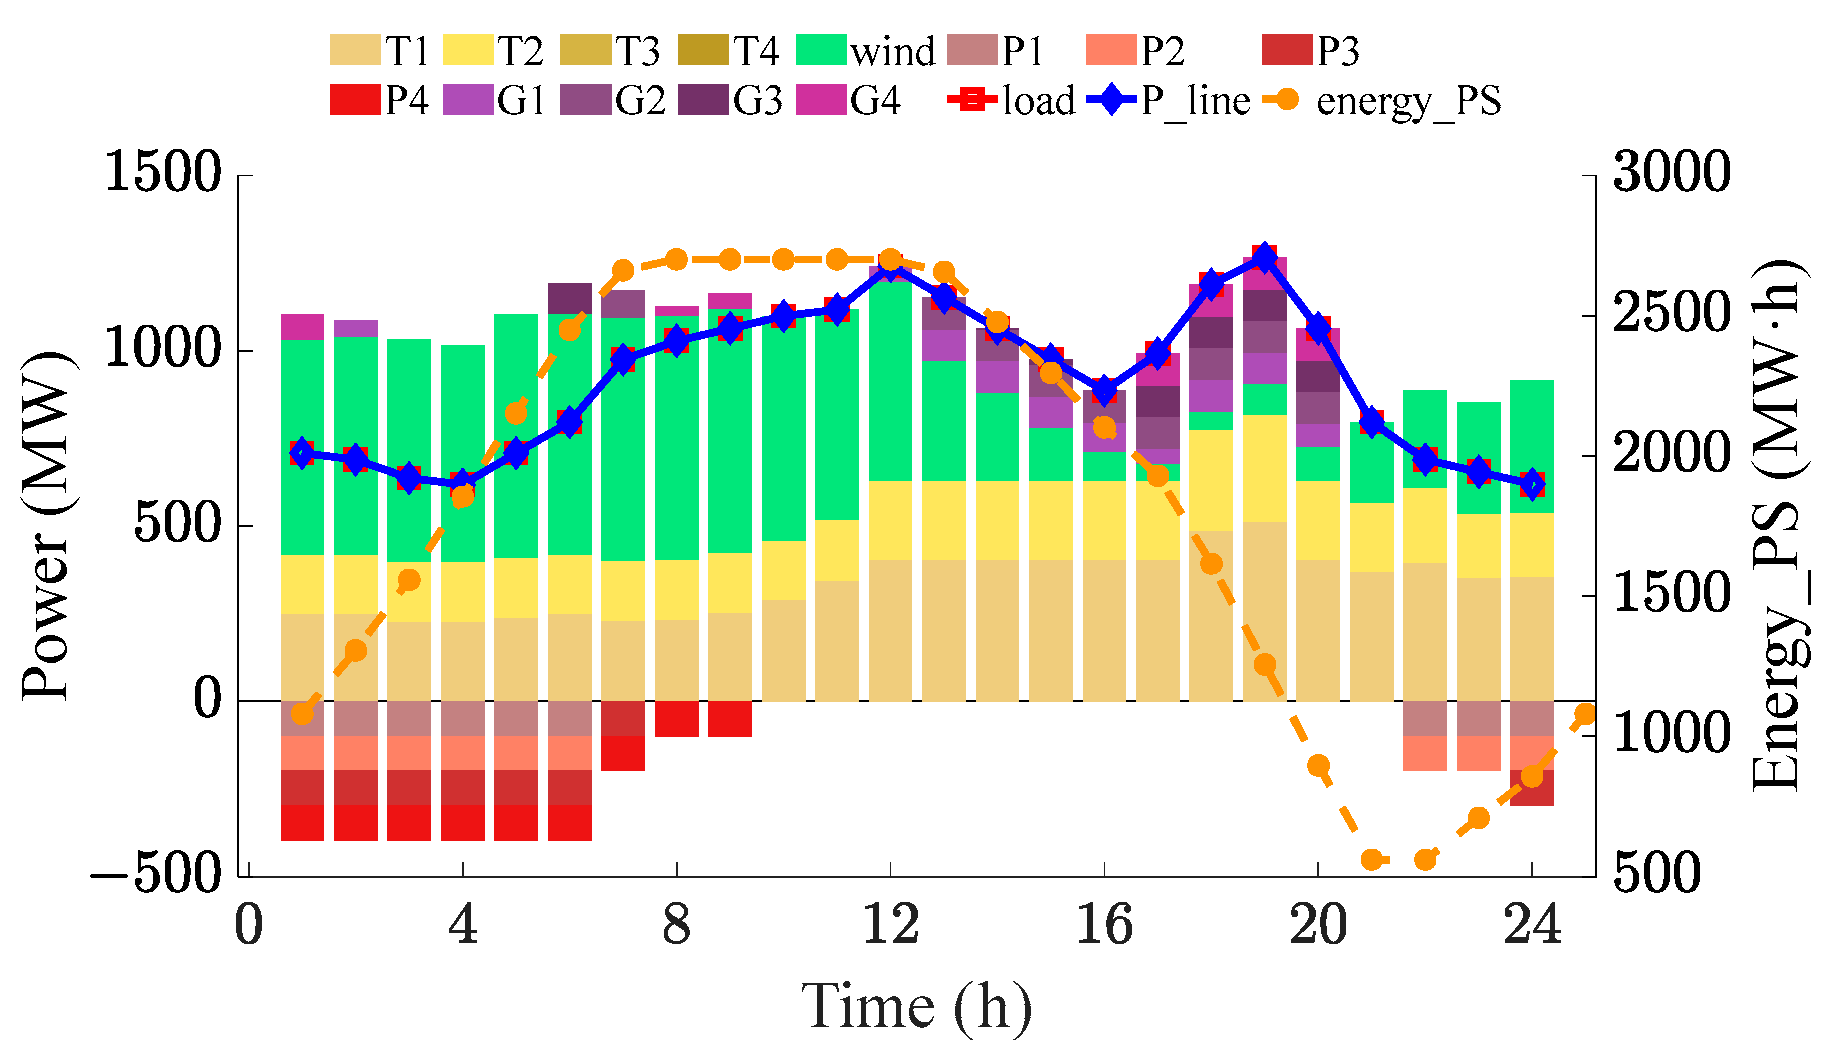
The day-ahead optimization dispatch outcomes for such wind-thermal-pumped storage bundled systems (under various configurations: without pumped storage, with only FS-PSUs, with only VS-PSUs, and with only T-PSUs) are shown in Figure 3, Figure 4, Figure 5 and Figure 6. Among them, “P1”, “P2”, “P3”, and “P4” represent the pumps of the four units in the PS, while “G1”, “G2”, “G3”, and “G4” represent their turbines. “P_line” represents the power of the transmission channel, and “energy_PS” refers to the electricity energy stored by the PS.
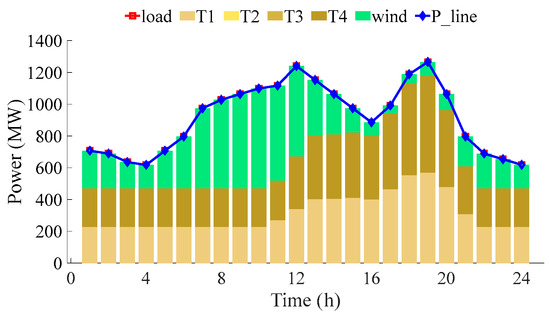
Figure 3.
Day-ahead optimization scheduling results of wind-thermal bundled system.

Figure 4.
Day-ahead optimization scheduling results of wind-thermal-pumped storage bundled system with only FS-PSUs.

Figure 5.
Day-ahead optimization scheduling results of wind-thermal-pumped storage bundled system with only VS-PSUs.

Figure 6.
Day-ahead optimization scheduling results of wind-thermal-pumped storage bundled system with only T-PSUs.
(1) Scheduling strategies analysis in configuration scheme 1.
Figure 2 shows that wind power has an evident anti-peaking characteristic, rising when the load falls in 2:00–4:00 and 19:00–24:00, and falling when the load rises in 9:00–12:00. This characteristic can intensify the peak-to-valley difference of the net load curve. Figure 3 demonstrates that T1 undergoes large volatilities, ranging from a minimum of 228 MW to a maximum of 570 MW, and then dropping back to 228 MW. The peak-valley difference of thermal power output in a day is as high as 342 MW. T4 has similar characteristics. While the peak regulation of thermal power satisfies the balance requirements of system, it also subjects the thermal power to significant adjustment pressures, thus affecting its smooth operation.
(2) Scheduling strategies analysis in configuration schemes 2, 5 and 8.
Figure 4, Figure 5 and Figure 6 show that with PS in the system, it pumps during low-load hours from 1:00 to 9:00, storing excess wind power, and generates during peak hours from 12:00 to 20:00. The dispatch results in Figure 6 show that the power output of T1 increases from 231 MW to 513 MW and then drops to 355 MW throughout the whole day. The peak-valley difference of thermal power output in a day is 282MW, which indicates a significant reduction in the peak regulation pressure of thermal power compared to the system without PS. The dispatch results in Figure 4 and Figure 5 exhibit similar characteristics.
Figure 4 reveals that P1, P2, P3, and P4 belonging to FS-PSUs can only pump at their maximum pumping power of 99 MW. However, Figure 5 shows that at certain times, they can operate below this maximum, for example, at the 8th hour, the pumping power of P1 belonging to VS-PSUs is 72 MW, reflecting the limitations of FS-PSUs in accurately absorbing surplus wind power. VS-PSUs, with the capability to pump at any rate between 80% and 100% of their maximum pumping power, provide enhanced flexibility and relatively accurate control over the absorption of surplus wind energy.
Figure 6 demonstrates that during some specific hours, T-PSUs operate in a simultaneous pumping and generating mode. In the first hour, P4 pumps at 99 MW and G4 generates at 71 MW, so the actual pumped power of PS is 28 MW. This approach accurately matches the actual pumped amount with the surplus wind power to prevent issues related to over-pumping or under-pumping.
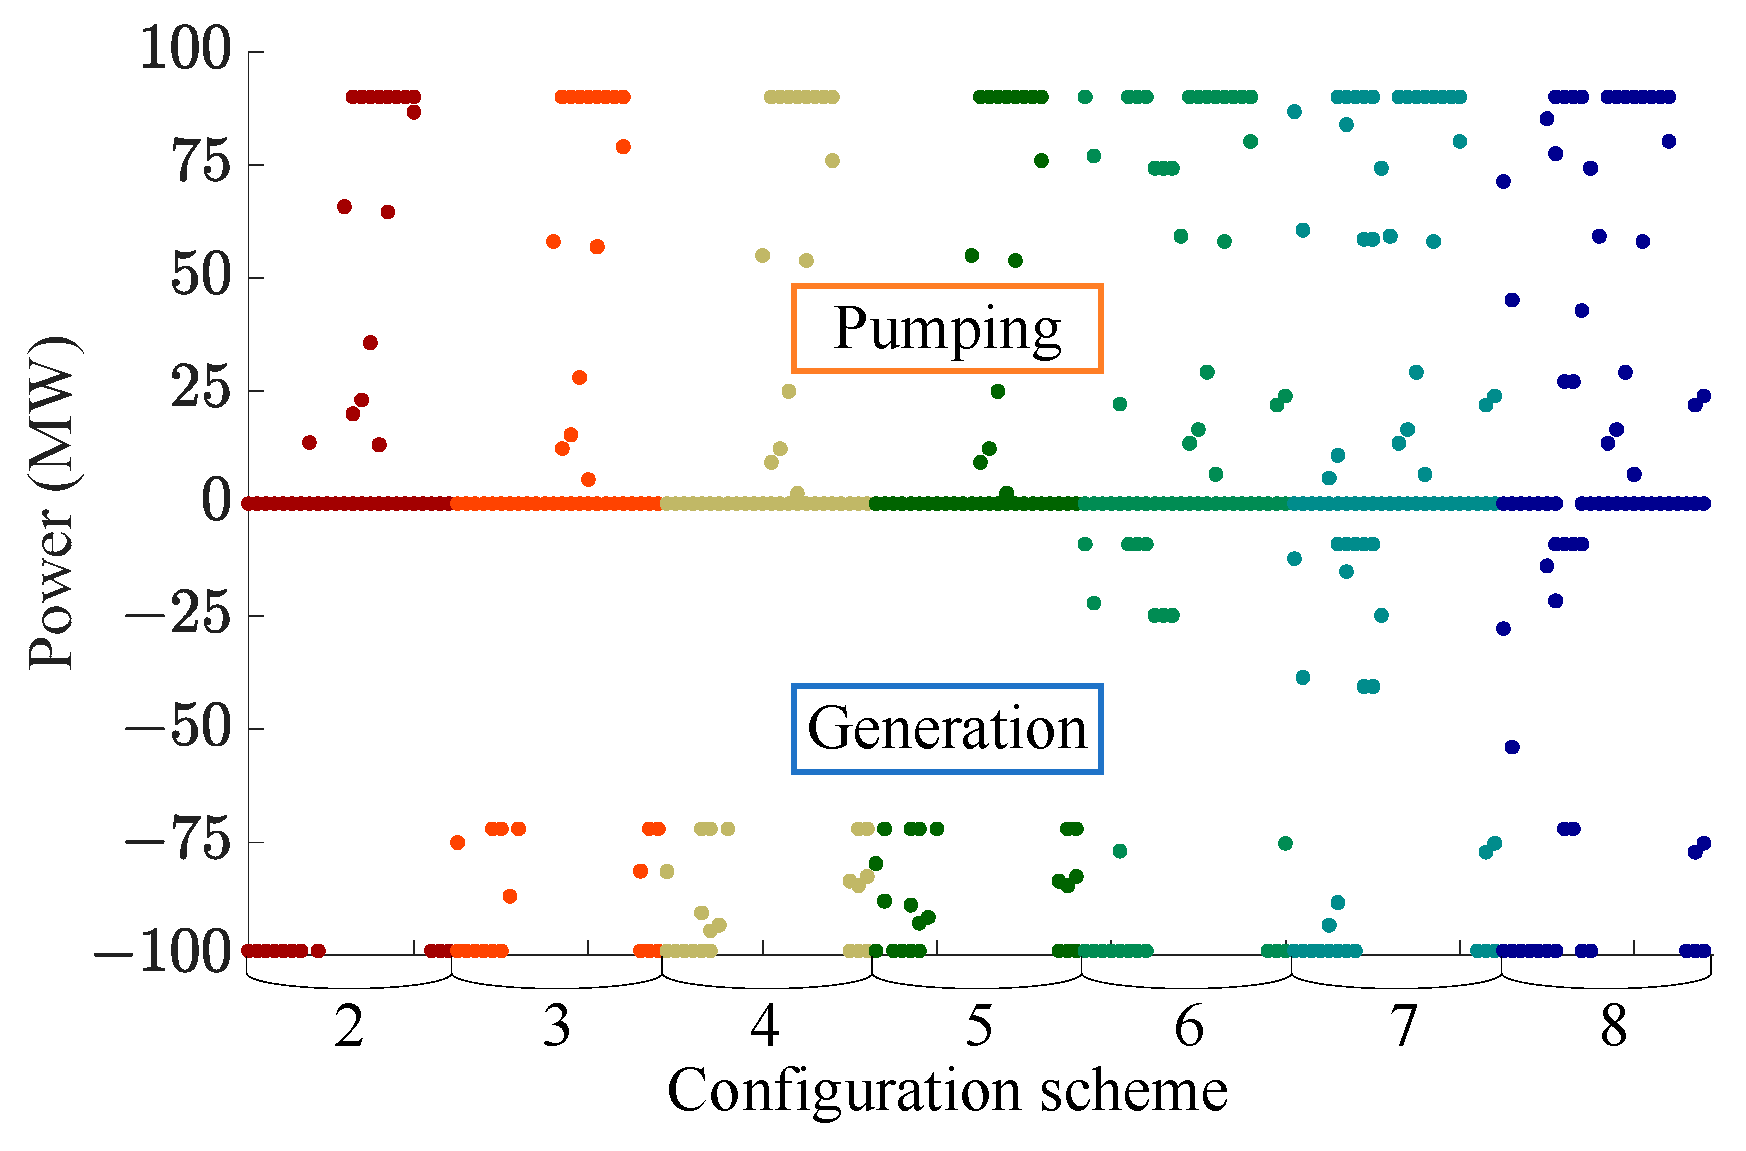
(3) The distribution of pumped storage output in configuration schemes 2 to 8.
Figure 7 visually compares the pumping and generating outcomes of different pumped storage types in configuration schemes 2 to 8. Among them, each configuration scheme shows the pumping and generating results of all pumped storage units obtained from the 24 h optimal scheduling. It is evident that configuration schemes 6, 7, and 8 (equipped with T-PSUs) offer broad output range in the pump mode, ranging from 0 MW to 99 MW, as T-PSUs can regulate the rotation of the water turbine in the pump mode to adjust pumping capacity extensively. Configuration schemes 2 to 5 (equipped with FS-PSUs or VS-PSUs, without T-PSUs), however, have more limited output distribution due to their technical constraints. Among them, FS-PSUs can only pump at 99 MW, and the VS-PSUs can pump from 72 MW to 99 MW. The dispatching results of the different types of pumped storage in Figure 7 show that the T-PSUs have the widest adjustment range in the pump mode, followed by VS-PSUs, and the narrowest adjustment range is of FS-PSUs. The larger adjustment range also makes it possible for the T-PSUs to achieve the optimal dispatch output.
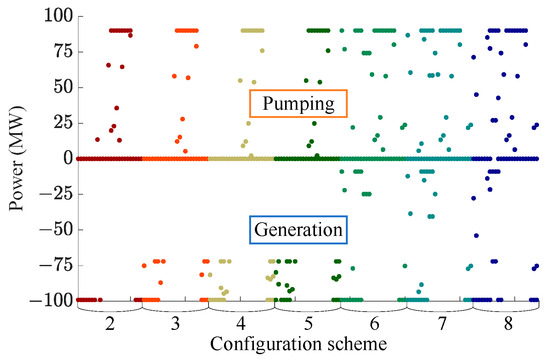
Figure 7.
The distribution of pumped storage output under different configuration schemes.
5.3. Analysis of Optimization Scheduling Indicators for Different Types of Pumped Storage
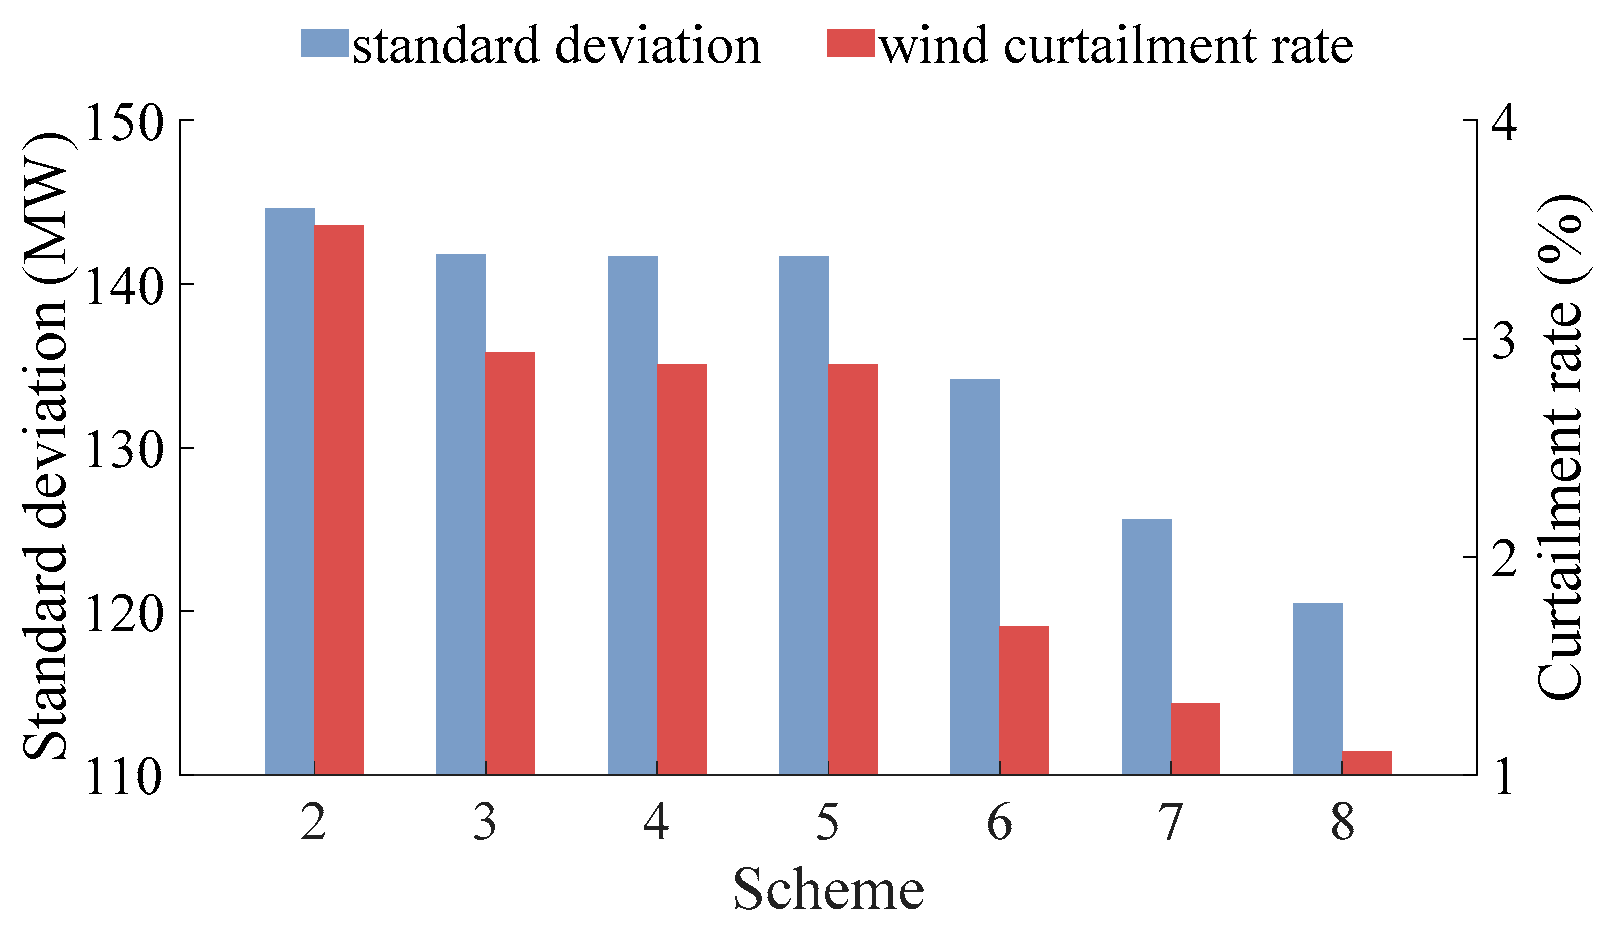
5.3.1. Analysis of Net Load Curve Standard Deviation and Wind Power Curtailment Rate under Different Pumped Storage Configuration Schemes
As depicted in Figure 8, the standard deviation of the net load curve in schemes 3 to 5 is lower than that in scheme 2, while schemes 6 to 8 is lower than that in schemes 3 to 5. Among them, the standard deviation of the net load curve decreases from 144.59 MW in scheme 2 to 141.66 MW in scheme 5, and further to 120.49 MW in scheme 8. The correlation between wind power curtailment rates and the standard deviation of the net load curve is evident across pumped storage configuration schemes. Among them, the wind curtailment rate of scheme 8 is the smallest, and the wind curtailment rate of scheme 2 is the largest. This is because the upper-level model optimizes scheduling on the premise of fully utilizing wind power. When the pumped storage has strong regulatory capabilities, the volatility of the net load curve after upper-level optimization is not significant, and thus, the thermal power adjustment in the lower-level model is smoother. In this case, the actual output power of the wind power will be closer to the forecasted power, resulting in a lower wind power curtailment rate.

Figure 8.
The net load curve standard deviation and wind power curtailment rate under different pumped storage configuration schemes.
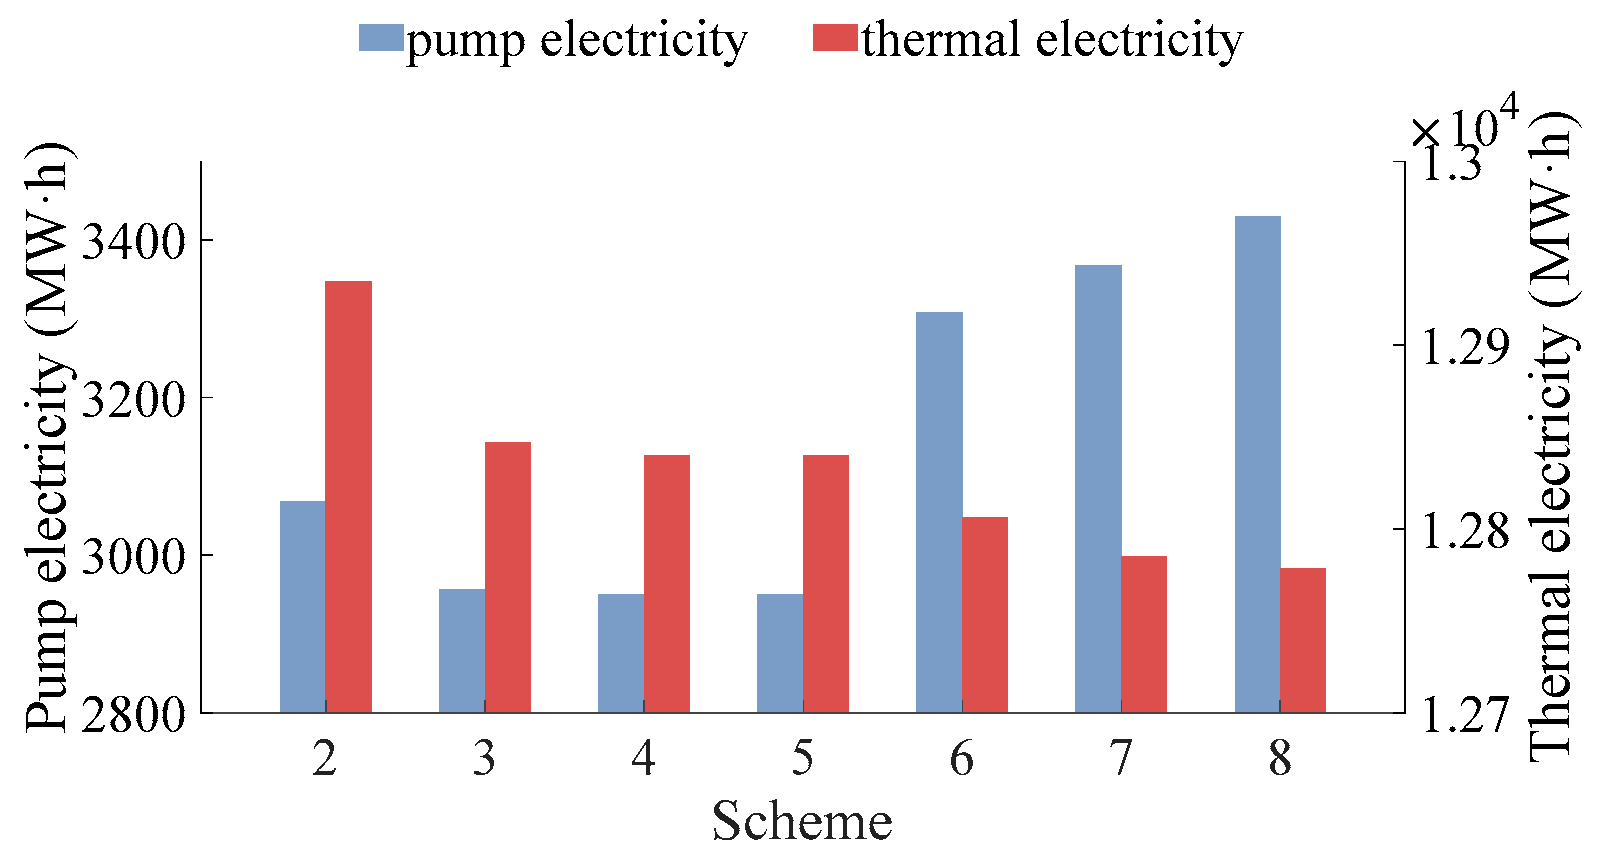
5.3.2. Analysis of Pump Electricity and Thermal Power Electricity under Different Pumped Storage Configuration Schemes
In terms of pumping electricity, as shown in Figure 9, the pumping electricity of schemes 3, 4, and 5 is less than that of scheme 2, with 3069 MW·h in scheme 2 and approximately 2950 MW·h in schemes 3, 4, and 5, indicating that the pumping electric energy of pure FS-PS is higher than that of those with VS-PSUs. This is because FS-PSUs can only pump at maximum power, while VS-PSUs can adjust within a range near to the maximum pumping power, thus having more opportunities to pump according to actual demand, which results in less pumping energy.
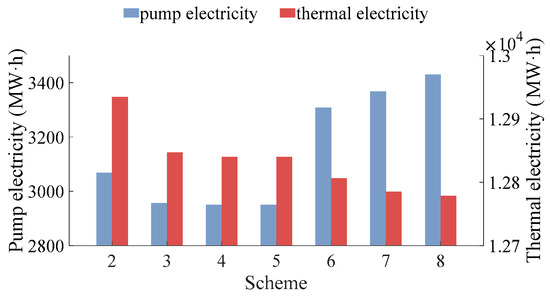
Figure 9.
The pump electricity and thermal electricity under different pumped storage configuration schemes.
The pumping electric energy of schemes 6, 7, and 8 is higher than that of scheme 2. Among them, the pumped electricity of schemes 6, 7, and 8 is as high as 3307.2 MW·h, 3367.2 MW·h, and 3429 MW·h, respectively. This is because T-PSUs also pump at a maximum power of 99 MW during pumping conditions and generate electricity simultaneously, allowing them to pump across the full power range according to actual demand, which can be seen from Figure 4 and Figure 6. However, in scheme 2 (all PSUs are fixed-speed), when the actual pumping demand (e.g., 110 MW) is less than an integer multiple of the maximum pumping power of 99 MW, opening an additional unit could lead to increased thermal power output and affect the total system cost. In such cases, pure FS-PS may abandon the excess 11 MW. Therefore, the pumping energy of scheme 2 is less than that of schemes 6, 7, and 8. Similarly, the increase in pumping energy from schemes 6 to 8 can be explained by the growing proportion of T-PSUs, which enhance the flexibility and accuracy of pumped storage in satisfying actual demand.
As for thermal power electricity, there is a downward trend in thermal power output from schemes 2 to 8 in Figure 9. Among them, the thermal power electricity of scheme 8 is the smallest, and the thermal power electricity of scheme 2 is the largest. Combined with Figure 8, this is because the wind power curtailment rate is also decreasing, meaning that the actual wind power electricity is increasing. With the total load demand remaining constant, the thermal power electricity will continue to decrease.
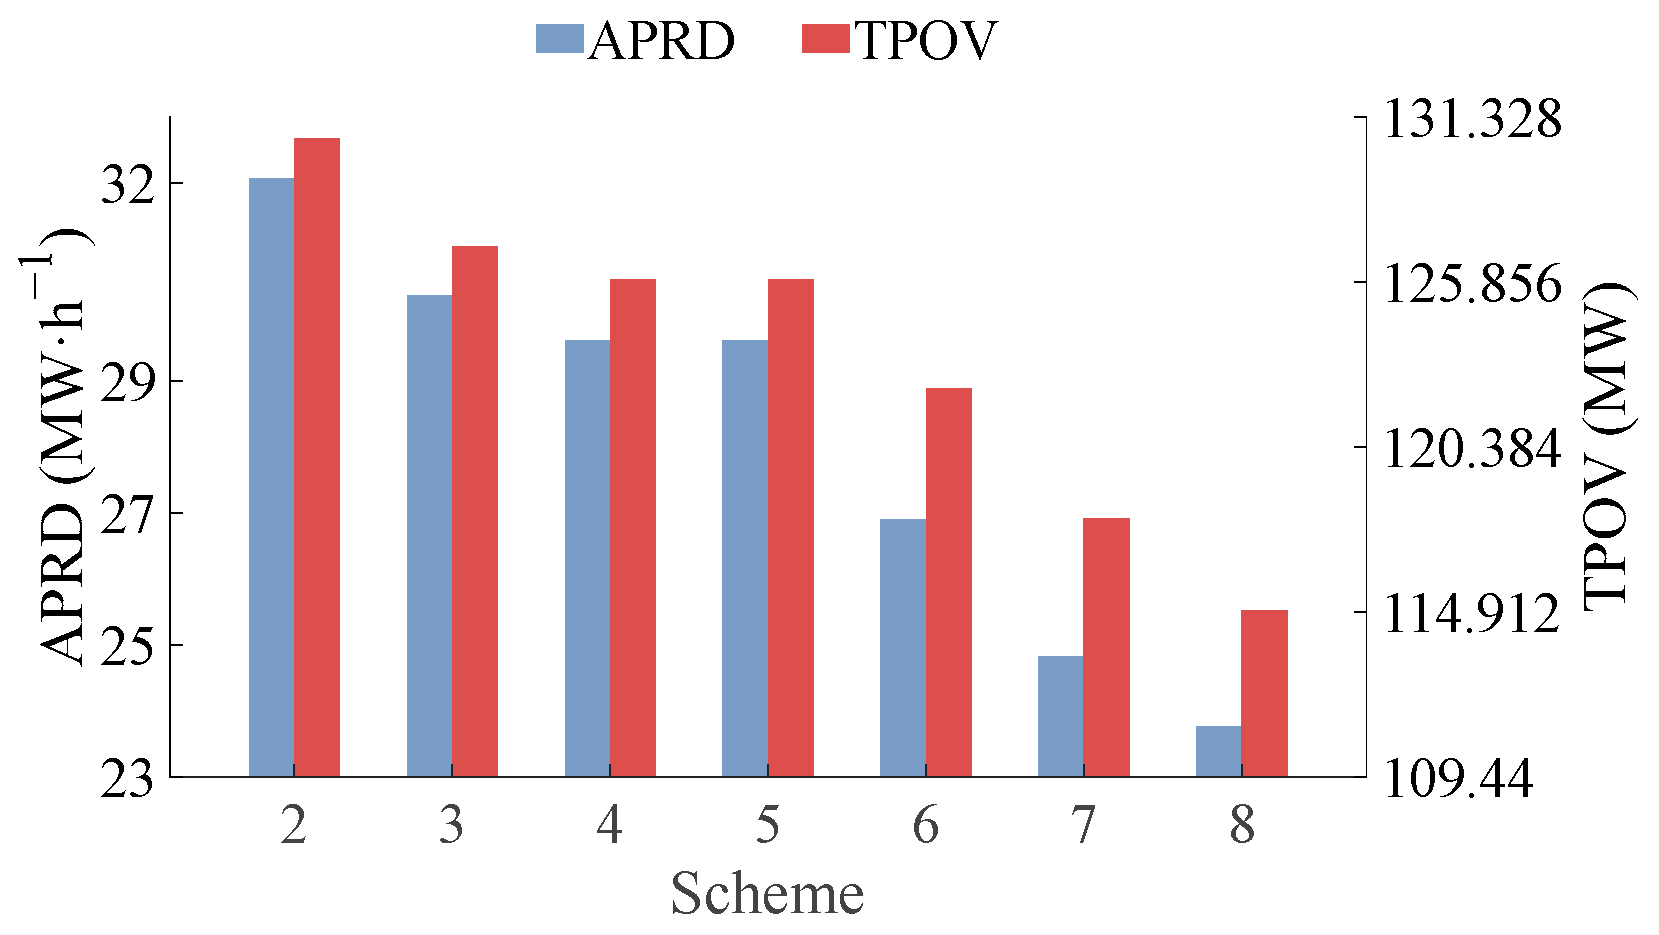
5.3.3. Analysis of APRD and TPOV under Different Pumped Storage Configuration Schemes
Figure 10 illustrates the thermal power average peak regulation depth (APRD) and the thermal power output volatility (TPOV) under different pumped storage configuration schemes. From schemes 2 to 8, both indicators show a downward trend. Among them, both the indicators of scheme 8 are the smallest, and both the indicators of scheme 2 are the largest. Combined with Figure 8, this is because as the flexibility of the pumped storage plants increases, the standard deviation of the net load curve gradually decreases after the upper-level optimization. Consequently, during the lower-level optimization, the adjustment of thermal power becomes smoother. The data reveal that from schemes 2 to 5, the APRD for thermal power drops from 32.07 MW·h−1 to 29.61 MW·h−1, and its TPOV decreases from 130.62 MW to 125.95 MW. Further, during the transition from schemes 5 to 8, the APRD of thermal power drops to 23.77 MW·h−1, and TPOV drops to 114.98 MW. This demonstrates that the T-PSUs are the most effective in enhancing the smoothness of thermal power output.
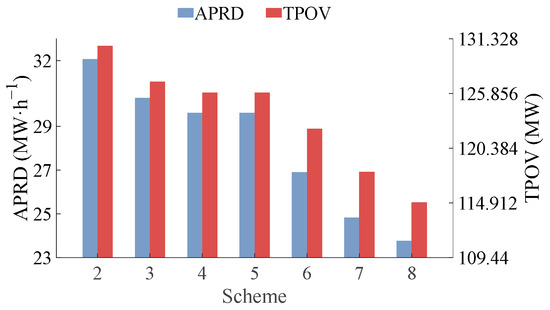
Figure 10.
The APRD and TPOV under different pumped storage configuration schemes.
5.3.4. Analysis of Costs under Different Pumped Storage Configuration Schemes
Table 5 lists the operational cost indicators under different pumped storage configuration schemes. It is evident that from configuration schemes 1 to 8, both thermal power operation cost and total system cost show a downward trend. Among them, the operational cost indicators of scheme 8 are the smallest, and the operational cost indicators of scheme 1 are the largest. Specifically, without pumped storage, the total cost of the system reaches CNY 757,500. Equipped with only FS-PSUs, the cost drops to CNY 78,200. Equipped with only VS-PSUs, the cost further drops to CNY 64,600. Equipped with only T-PSUs, the costs are minimized to CNY 26,500. As indicated in Figure 8 and Figure 9, the increased flexibility of pumped storage plants leads to a reduction in both wind power curtailment rate and thermal power electricity.
Table 5.
Cost indicators under different configuration schemes.
5.4. Sensivity Analysis
To further verify the consistent performance of the pumped storage model in diverse scenarios, a sensitivity analysis is performed considering the variations in wind farm capacity, load rates, and pumped storage capacity. The outcomes of these analyses are then assessed statistically.
5.4.1. Scenario Introduction
This paper conducts a sensitivity analysis for wind power, load, and pumped storage sides, considering nine scenarios listed in Table 6 for each aspect.
Table 6.
Sensitivity analysis scenarios.
5.4.2. Sensitivity Analysis under Different Wind Power Capacities
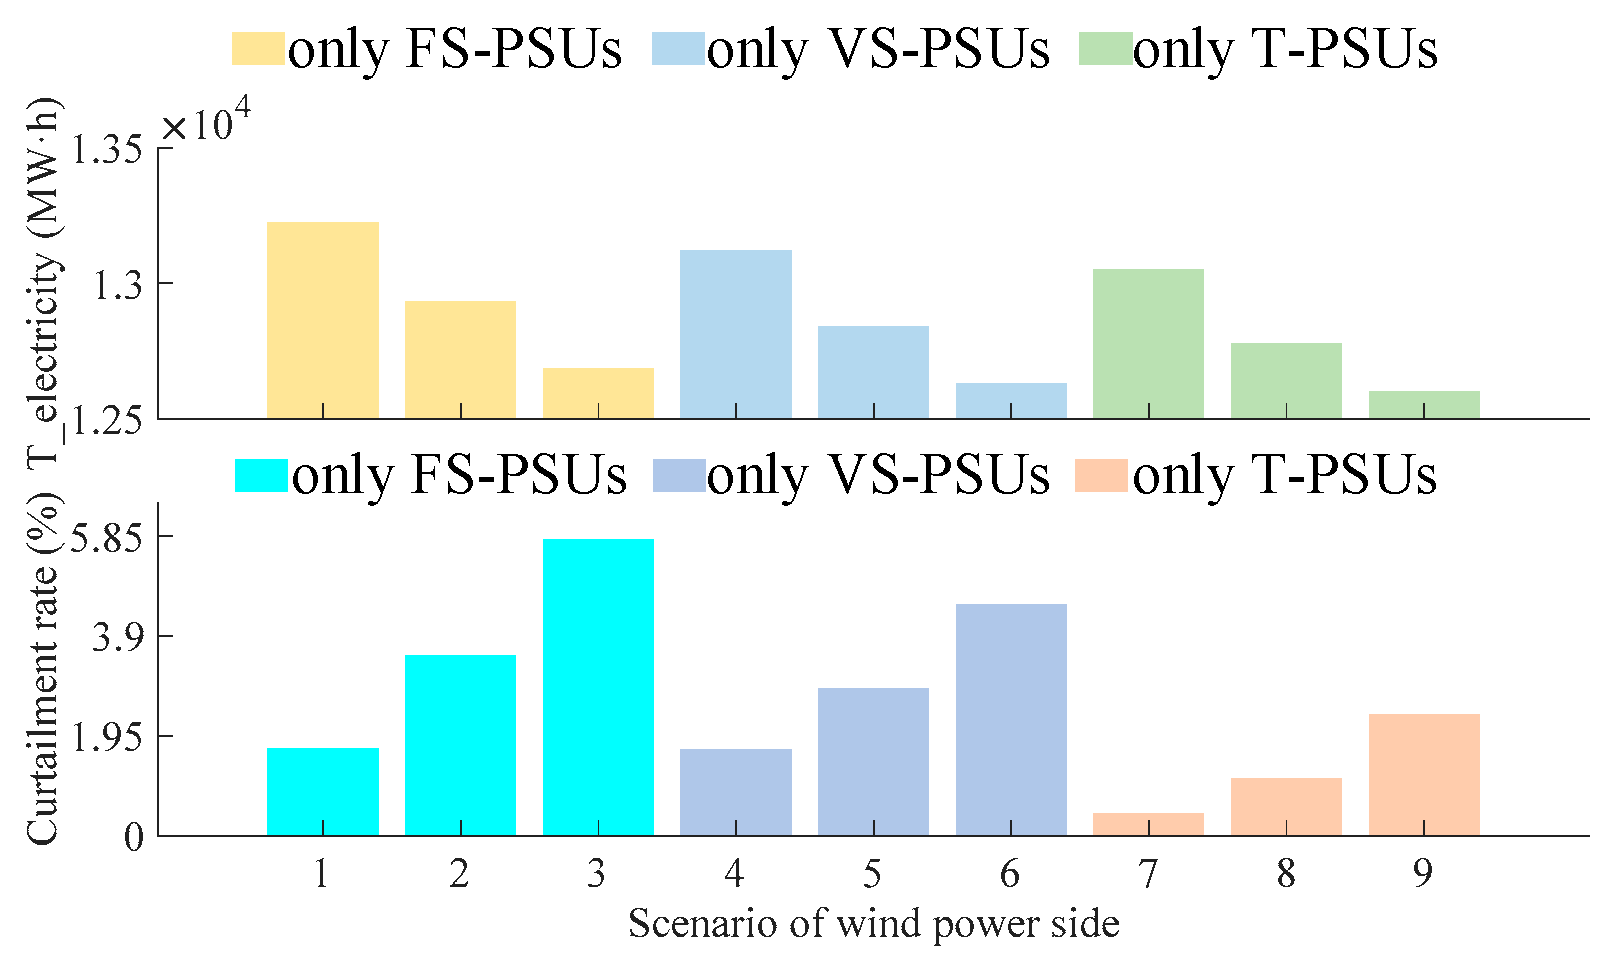
Figure 11 illustrates the impact of different wind power capacities (950 MW, 1000 MW, and 1050 MW) on thermal power electricity and wind power curtailment rates for systems equipped with only FS-PSUs, only VS-PSUs, and only T-PSUs. The results show that an increase in wind power integration leads to a decline in thermal generation and a rise in wind power curtailment rate. Notably, when the wind power capacity changes, the ternary pumped storage demonstrates greater robustness in thermal electricity and wind power curtailment rate compared to variable-speed systems, which in turn show more robustness than fixed-speed systems. For instance, as wind power capacity changes from 950 MW to 1050 MW, the wind power curtailment rate rises from 1.70% to 5.80% with only FS-PSUs, from 1.68% to 4.52% with only VS-PSUs, and from 0.43% to 2.36% with only T-PSUs. This suggests that a higher flexibility in pumped storage regulation enhances the robustness of the system to different wind power capacities. Furthermore, regardless of wind power capacity, the system with only T-PSUs consistently exhibits the lowest thermal power electricity and wind power curtailment rate. This verifies that the models of T-PSUs established in this paper have consistent performance under different wind power capacities.

Figure 11.
Thermal power electricity (T_electricity) and wind power curtailment rate under nine scenarios of wind power side.
5.4.3. Sensitivity Analysis under Different Load Rates
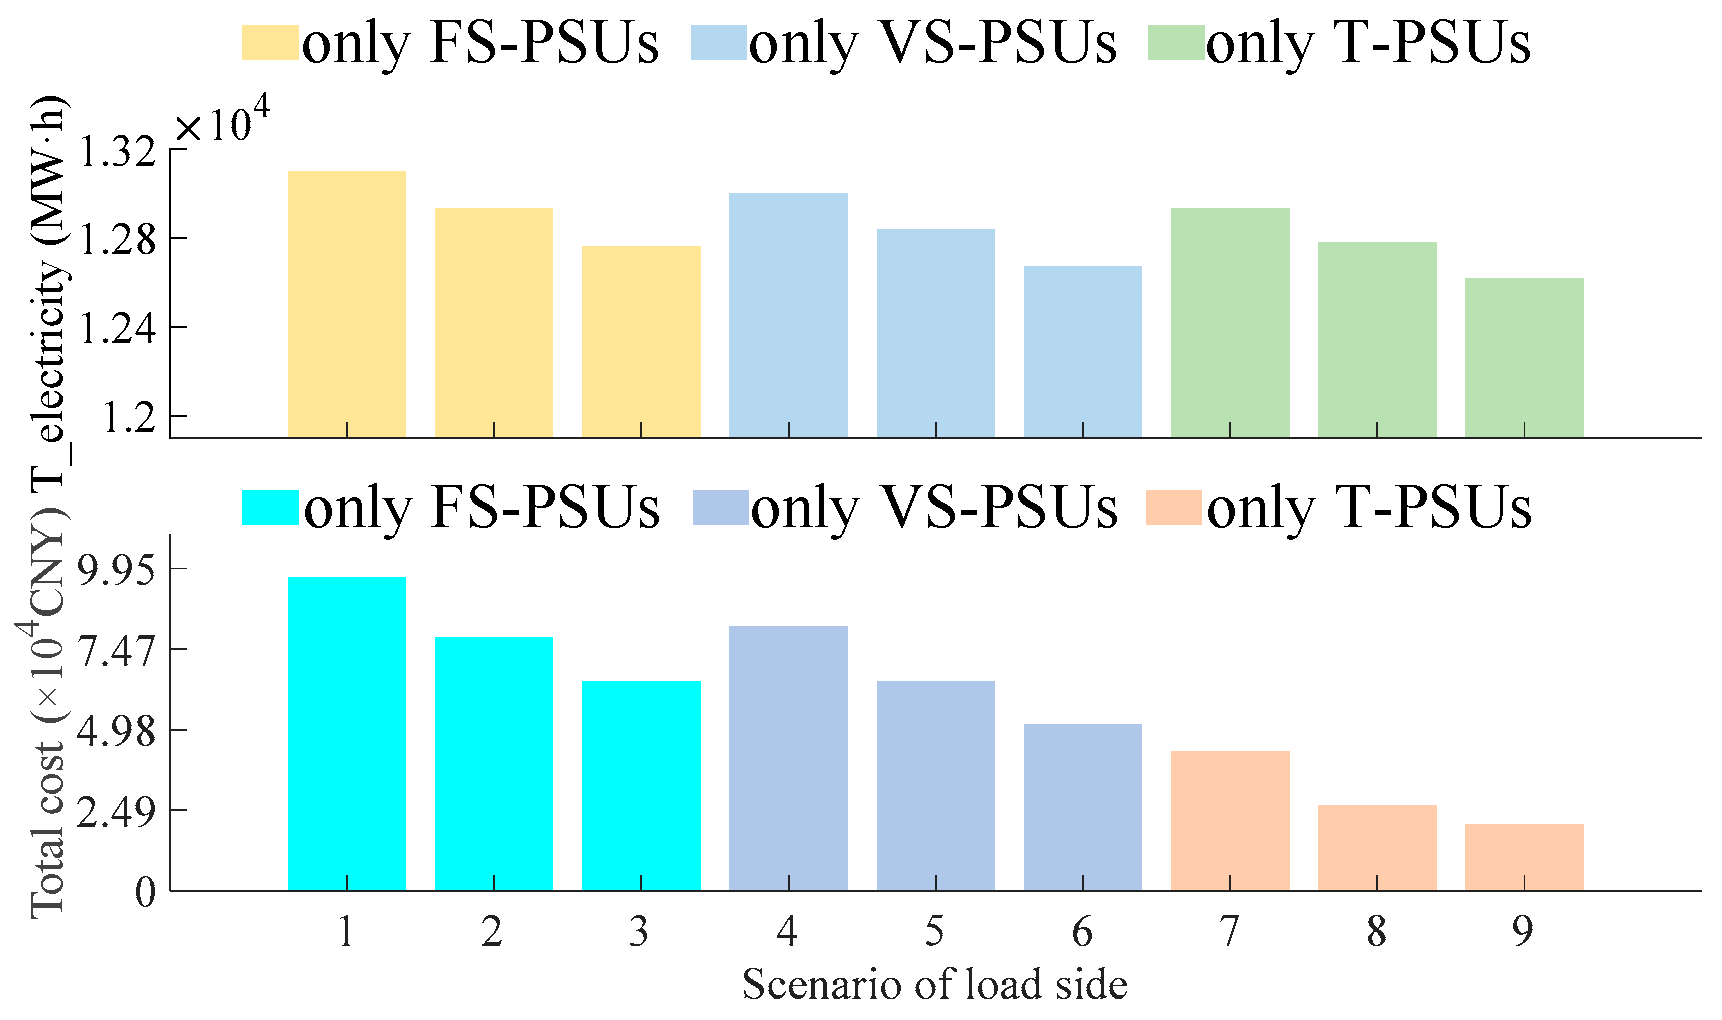
Figure 12 shows the thermal power electricity and total cost for systems respectively equipped with only FS-PSUs, only VS-PSUs, and only T-PSUs under three load rates (0.71, 0.725, and 0.73). It is evident that as the load rate increases, the thermal power electricity trends downward. This is because a higher load rate indicates a smaller peak-to-valley difference in the load curve, resulting in the reduced standard deviation of the net load curve obtained from the upper-level optimization. As analyzed previously in Figure 8 and Figure 9, a lower standard deviation of the net load curve leads to a lower wind power curtailment rate and decreased thermal power electricity. Similar to the findings in Figure 11, the system equipped with only T-PSUs still exhibits superior robustness in response to load rate variations compared to systems with only FS-PSUs. The systems equipped with only VS-PSUs provide better robustness than the systems equipped with only FS-PSUs. For instance, as the load rate changes from 0.73 to 0.71, the total system cost (×104 CNY) rises from 6.47 to 9.68 with only FS-PSUs, from 5.16 to 8.16 with only VS-PSUs, and from 2.05 to 4.31 with only T-PSUs. This also indicates that a higher flexibility in pumped storage regulation can enhance the robustness of the system to different load rates. Furthermore, regardless of load rates, the system with only T-PSUs consistently exhibits the lowest thermal power electricity and total system cost. This verifies that the models of the T-PSUs established in this paper have consistent performance under different load rates.
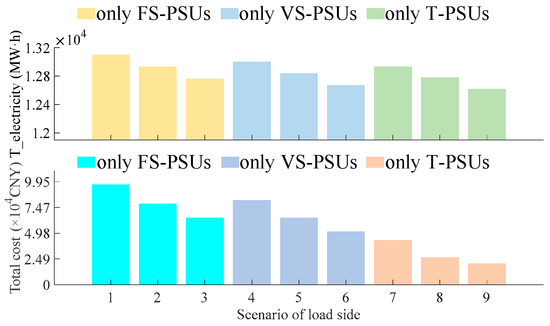
Figure 12.
Thermal power electricity (T_electricity) and total system cost under nine scenarios of load side.
5.4.4. Sensitivity Analysis under Different Pumped Storage Capacities
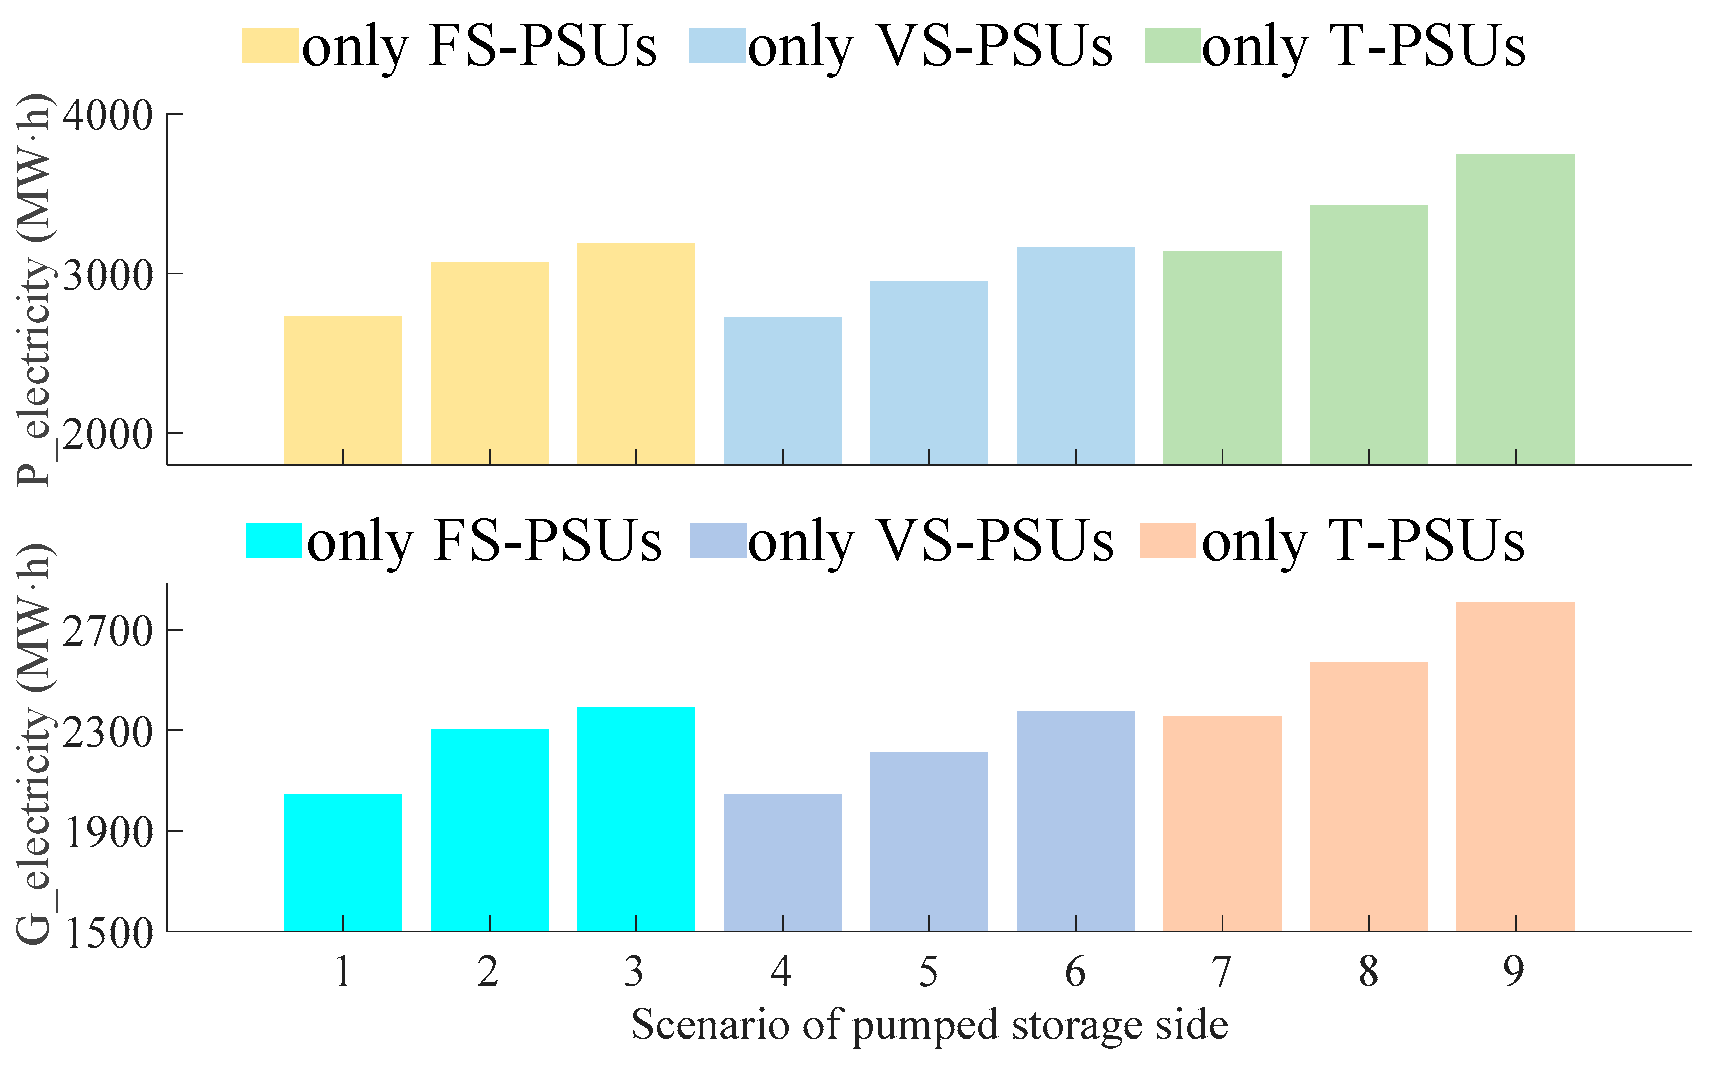
Figure 13 illustrates the pump and generation electricity for the systems, respectively, equipped with only FS-PSUs, only VS-PSUs, and only T-PSUs under three pumped storage capacities (80 MW, 90 MW, and 100 MW), where the pumped storage capacity refers to the capacity of a single unit. It is observable that as the pumped storage capacity increases, the electric energy of the pump and generation for all three types of pumped storage also increase, indicating that larger-capacity pumped storage can provide stronger peak shaving capabilities for the power system. Furthermore, regardless of the pumped storage capacity, the system with only T-PSUs consistently exhibits the highest pump electricity, which is consistent with the results in Figure 9. This indicates that the models of T-PSUs established in this paper can achieve consistent performance under different pumped storage capacities.
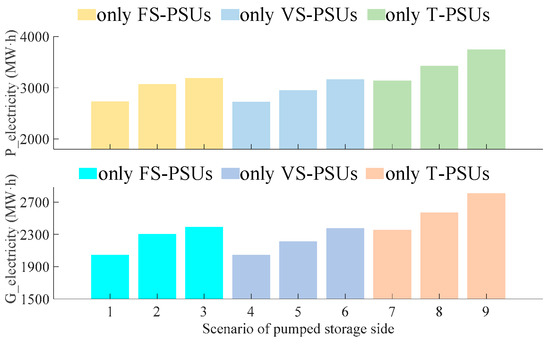
Figure 13.
The pump (P_electricity) and generation (G_electricity) electricity under nine scenarios of pumped storage side.
6. Conclusions
To explore the flexibility advantages of T-PSUs compared to FS-PSUs and VS-PSUs in day-ahead optimization scheduling, this paper firstly establishes a mathematical model for the participation of T-PSUs in day-ahead optimization scheduling. On this basis, the hybrid pumped storage model, which combines FS-PSUs and T-PSUs, is further developed. Furthermore, it develops a day-ahead optimization scheduling model for the wind-thermal-pumped storage system considering FS-PSUs, VS-PSUs, and T-PSUs. Finally, the day-ahead dispatch arrangements for each type of unit are determined, and based on this, various performance indicators that can reflect the flexibility of the power system, such as the wind power curtailment rate, net load curve standard deviation, thermal power average peak regulation depth, thermal power output volatility, and power generation, are all calculated.
The experimental results show that the T-PSUs, due to their ability to pump and generate electricity simultaneously, possess a larger adjustment range and stronger flexibility compared to FS-PSUs and VS-PSUs under pumping modes. This is specifically manifested in the advantages of reducing wind power curtailment rates, decreasing thermal power peak regulation pressure, reducing thermal power generation, and saving system operation costs. Therefore, for power system operators, the T-PSUs are flexible, economical, and environmentally friendly regulatory power supplies, which have the opportunity to occupy a larger market share in the new power system. In addition, the sensitivity analysis results indicate that T-PS have higher robustness in responding to changes in wind power capacity, pumped storage capacity, and load rates, and it also shows that the models of T-PSUs established in this paper have consistent performance under different wind power capacities, pumped storage capacities, and load rates. This paper not only verifies the advantages of T-PSUs in improving the flexibility of the power system but, more importantly, also provides significant technical and economic references for the configuration of pumped storage in the power system. In the future, we will continue to explore the impact of uncertainty in wind power and load forecasting on the regulatory effect of pumped storage, and we will also conduct a more detailed exploration of the practical implementation of T-PSUs in different energy markets.
Author Contributions
Conceptualization, Z.W. and J.T.; methodology, Z.W., J.W. and S.P.; software, Z.W.; validation, J.W., Y.Z. and W.P.; formal analysis, Y.Z. and W.P.; investigation, Z.W., J.T. and J.W.; resources, S.P. and Y.Z.; writing—original draft preparation, Z.W.; writing—review and editing, Z.W., J.W. and J.T.; visualization, Z.W. and W.P.; funding acquisition, J.T. and S.P. All authors have read and agreed to the published version of the manuscript.
Funding
This research was funded by the Key Planning and Special Projects of China Southern Power Grid (031000QQ00230019).
Institutional Review Board Statement
Not applicable.
Informed Consent Statement
Not applicable.
Data Availability Statement
Data are available on reasonable request.
Conflicts of Interest
Authors Sui Peng and Yining Zhang were employed by the company Guangdong Power Grid Corporation. The remaining authors declare that the research was conducted in the absence of any commercial or financial relationships that could be construed as a potential conflict of interest.
References
- Zhao, Y.; Xia, S.; Zhang, J.; Hu, Y.; Wu, M. Effect of the Digital Transformation of Power System on Renewable Energy Utilization in China. IEEE Access 2021, 9, 96201–96209. [Google Scholar] [CrossRef]
- Luo, Y.; Wang, Y.; Liu, C.; Fan, L. Two-stage Robust Optimal Scheduling of Wind Power-Photovoltaic-Thermal Power-Pumped Storage Combined System. IET Renew. Power Gener. 2022, 16, 2881–2891. [Google Scholar] [CrossRef]
- Yang, M.; Dai, B.; Wang, J.; Chen, X.; Sun, Y.; Li, B. Day-ahead Wind Power Combination Forecasting Based on Corrected Numerical Weather Prediction and Entropy Method. IET Renew. Power Gener. 2021, 15, 1358–1368. [Google Scholar] [CrossRef]
- Li, J.; Wang, S.; Ye, L.; Fang, J. A Coordinated Dispatch Method with Pumped-Storage and Battery-Storage for Compensating the Variation of Wind Power. Prot. Control Mod. Power Syst. 2018, 3, 2. [Google Scholar] [CrossRef]
- Ren, G.; Liu, J.; Wan, J.; Wang, W.; Fang, F.; Hong, F.; Yu, D. Investigating the Complementarity Characteristics of Wind and Solar Power for Load Matching Based on the Typical Load Demand in China. IEEE Trans. Sustain. Energy 2022, 13, 778–790. [Google Scholar] [CrossRef]
- Wang, R.; Yang, W.; Ji, L.; Li, X.; Zhang, S.; Jing, X. Regulation Intensity Assessment of Pumped Storage Units in Daily Scheduling for Renewable Energy Consumption. Sustain. Energy Technol. Assess 2023, 56, 103027. [Google Scholar] [CrossRef]
- Yang, B.; Cao, X.; Cai, Z.; Yang, T.; Chen, D.; Gao, X.; Zhang, J. Unit Commitment Comprehensive Optimal Model Considering the Cost of Wind Power Curtailment and Deep Peak Regulation of Thermal Unit. IEEE Access 2020, 8, 71318–71325. [Google Scholar] [CrossRef]
- Wu, W.; Zhu, J.; Chen, Y.; Luo, T.; Shi, P.; Guo, W.; Shi, P.; Jiang, C. Modified Shapley Value-Based Profit Allocation Method for Wind Power Accommodation and Deep Peak Regulation of Thermal Power. IEEE Trans. Ind. Appl. 2023, 59, 276–288. [Google Scholar] [CrossRef]
- Cao, M.; Hu, Z.; Cai, J. Optimal Scheduling of Pumped Storage Hydropower Plants with Multi-Type of Units in Day-Ahead Electricity Market Considering Water Head Effects. Front. Energy Res. 2023, 11, 1326068. [Google Scholar] [CrossRef]
- Nag, S.; Lee, K.Y.; Suchitra, D. A Comparison of the Dynamic Performance of Conventional and Ternary Pumped Storage Hydro. Energies 2019, 12, 3513. [Google Scholar] [CrossRef]
- Dong, Z.; Tan, J.; St-Hilaire, A.; Muljadi, E.; Corbus, D.; Nelms, R.; Jacobson, M. Modelling and Simulation of Ternary Pumped Storage Hydropower for Power System Studies. IET Gener. Transm. Distrib. 2019, 13, 4382–4390. [Google Scholar] [CrossRef]
- Li, Y.; Li, O.; Wu, F.; Ma, S.; Shi, L.; Hong, F. Multi-Objective Capacity Optimization of Grid-Connected Wind–Pumped Hydro Storage Hybrid Systems Considering Variable-Speed Operation. Energies 2023, 16, 8113. [Google Scholar] [CrossRef]
- Yao, W.; Li, W.; Liu, R.; Sun, Y. Optimal Capacity of Variable-Speed Pumped Storage for Wind Power Consumption Based on Double-Layer Stochastic Programming. J. Renew. Sustain. Energy 2023, 15, 024103. [Google Scholar] [CrossRef]
- Feng, C.; Zheng, Y.; Li, C.; Mai, Z.; Wu, W.; Chen, H. Cost Advantage of Adjustable-Speed Pumped Storage Unit for Daily Operation in Distributed Hybrid System. Renew. Energy 2021, 176, 1–10. [Google Scholar] [CrossRef]
- Bruninx, K.; Dvorkin, Y.; Delarue, E.; Pandžić, H.; D’haeseleer, W.; Kirschen, D.S. Coupling Pumped Hydro Energy Storage With Unit Commitment. IEEE Trans. Sustain. Energy 2016, 7, 786–796. [Google Scholar] [CrossRef]
- Chen, Y.; Xu, W.; Liu, Y.; Bao, Z.; Mao, Z.; Rashad, E.M. Modeling and Transient Response Analysis of Doubly-Fed Variable Speed Pumped Storage Unit in Pumping Mode. IEEE Trans. Ind. Electron. 2023, 70, 9935–9947. [Google Scholar] [CrossRef]
- Hu, K.; Deng, Y.; Chen, D. Advantages of Variable-Speed Pumped Storage Plants in Generating Phase-Modulation Mode: Rapidity and Stability. IET Renew. Power Gener. 2020, 14, 3732–3740. [Google Scholar] [CrossRef]
- Jena, C.; Guerrero, J.M.; Abusorrah, A.; Al-Turki, Y.; Khan, B. Multi-Objective Generation Scheduling of Hydro-Thermal System Incorporating Energy Storage with Demand Side Management Considering Renewable Energy Uncertainties. IEEE Access 2022, 10, 52343–52357. [Google Scholar] [CrossRef]
- Chen, L.; Wang, J.; Sun, Z.; Huang, T.; Wu, F. Smoothing Photovoltaic Power Fluctuations for Cascade Hydro-PV-Pumped Storage Generation System Based on a Fuzzy CEEMDAN. IEEE Access 2019, 7, 172718–172727. [Google Scholar] [CrossRef]
- Lan, Z.; Gu, J.; Liu, J.; Hu, J.; Liu, S.; Xie, H. Benefits of Variable Speed Pumped Hydro Storage Technology for Increasing Renewable Integration in Regional Power Grids. In Proceedings of the 2021 IEEE 5th Conference on Energy Internet and Energy System Integration (EI2), Taiyuan, China, 22–24 October 2021; pp. 660–664. [Google Scholar] [CrossRef]
- Zhao, Z.; Chen, D.; Li, J.; Wei, S.; Sun, H. Flexibility Assessment of Regional Energy Systems Considering Five Types of Pumped Storage with Different Operational Characteristics. Proc. Chin. Soc. Electr. Eng. 2023, 43, 7103–7114. [Google Scholar] [CrossRef]
- Nag, S.; Lee, K.Y. Neural Network-Based Control for Hybrid PV and Ternary Pumped-Storage Hydro Plants. Energies 2021, 14, 4397. [Google Scholar] [CrossRef]
- Yokoyama, Y.; Yamamoto, K.; Tani, K. Renovation of the Pumped-Storage System from Fixed Speed to Adjustable Speed at Okutataragi Power Station. IOP Conf. Ser. Earth Environ. Sci. 2019, 240, 082004. [Google Scholar] [CrossRef]
- Cao, M.; Hu, Z.; Meng, Y.; Cai, F.; Duan, X. Day-Ahead Optimal Dispatch Method for Flexible DC System with Pumped Storage Hydropower Plant and New Energy Power Generation. Autom. Electr. Power Syst. 2021, 45, 36–44. [Google Scholar] [CrossRef]
- Li, N.; Hedman, K.W. Evaluation of the Adjustable-Speed Pumped Hydro Storage in Systems with Renewable Resources. In Proceedings of the 2016 IEEE/PES Transmission and Distribution Conference and Exposition (T&D), Dallas, TX, USA, 3–5 May 2016; pp. 1–5. [Google Scholar] [CrossRef]
- Fernández-Muñoz, D.; Pérez-Díaz, J.I. Unit Commitment in a Hybrid Diesel/Wind/Pumped-Storage Isolated Power System Considering the Net Demand Intra-Hourly Variability. IET Renew. Power Gener. 2021, 15, 30–42. [Google Scholar] [CrossRef]
- Koritarov, V.; Veselka, T.D.; Gasper, J.; Bethke, B.M.; Botterud, A.; Wang, J.; Mahalik, M.; Zhou, Z.; Milostan, C.; Feltes, J.; et al. Modeling and Analysis of Value of Advanced Pumped Storage Hydropower in the United States; Argonne National Laboratory (ANL): Oak Ridge, TN, USA, 2014. [Google Scholar] [CrossRef]
- Li, X.; Yang, W.; Zhao, Z.; Wang, R.; Yin, X. Advantage of Priority Regulation of Pumped Storage for Carbon-Emission-Oriented Co-Scheduling of Hybrid Energy System. J. Energy Storage 2023, 58, 106400. [Google Scholar] [CrossRef]
- Lin, L.; Yue, X.; Xu, B.; Sun, Y.; Wei, M. Sequence and Strategy of Pumped Storage-Thermal Combined Peak Shaving Considering Benefits of Pumped Storage and Deep Regulation of Thermal Power. Power Syst. Technol. 2021, 45, 20–29. [Google Scholar] [CrossRef]
- Guo, J.; Xue, X.; Li, L.; Cheng, Y.; Li, Y. Peak-Valley Time Division Model Based on Net Load Curve. IOP Conf. Ser. Earth Environ. Sci. 2020, 467, 012037. [Google Scholar] [CrossRef]
- Qiao, Y.; Liu, Y.; Chen, Y.; Han, S.; Wang, L. Power Generation Performance Indicators of Wind Farms Including the Influence of Wind Energy Resource Differences. Energies 2022, 15, 1797. [Google Scholar] [CrossRef]
- Gurobi Optimization, LLC. Gurobi Optimizer Reference Manual. 2023. Available online: https://www.gurobi.com (accessed on 25 August 2024).
- Lofberg, J. YALMIP: A Toolbox for Modeling and Optimization in MATLAB. In Proceedings of the 2004 IEEE International Conference on Robotics and Automation (IEEE Cat. No.04CH37508), Taipei, Taiwan, 2–4 September 2004; pp. 284–289. [Google Scholar] [CrossRef]

Disclaimer/Publisher’s Note: The statements, opinions and data contained in all publications are solely those of the individual author(s) and contributor(s) and not of MDPI and/or the editor(s). MDPI and/or the editor(s) disclaim responsibility for any injury to people or property resulting from any ideas, methods, instructions or products referred to in the content. |
© 2024 by the authors. Licensee MDPI, Basel, Switzerland. This article is an open access article distributed under the terms and conditions of the Creative Commons Attribution (CC BY) license (https://creativecommons.org/licenses/by/4.0/).