Article

Design and Validation of a Long-Range Streak-Tube Imaging Lidar System with High Ranging Accuracy

1
National Key Laboratory of Laser Spatial Information, Harbin 150080, China
2
Research Center for Space Optical Engineering, School of Astronautics, Harbin Institute of Technology, Harbin 150001, China
3
Military Representative Office of the Military Representative Bureau of the Space System Non-Armament Department, Changchun 130000, China
*
Authors to whom correspondence should be addressed.
Appl. Sci. 2024, 14(19), 8835; https://doi.org/10.3390/app14198835
Submission received: 3 September 2024 / Revised: 23 September 2024 / Accepted: 26 September 2024 / Published: 1 October 2024
(This article belongs to the Special Issue Advances of Laser Technologies and Their Applications)

Abstract

:
The Streak-Tube Imaging Lidar (STIL) has been widely used in high-precision measurement systems due to its ability to capture detailed spatial and temporal information. In this paper, we proposed a ranging measurement method that integrates a Time-to-Digital Converter (TDC) with a streak camera in a remote STIL system. In this method, the TDC accurately measures the trigger pulse time, while the streak camera captures high time-resolution images of the laser echo, thereby enhancing both measurement accuracy and range. A corresponding ranging model is developed for this method. To validate the system’s performance, an outdoor experiment covering a distance of up to 6 km was conducted. The results demonstrate that the system achieved a distance measurement accuracy of 0.1 m, highlighting its effectiveness in long-range applications. The experiment further confirms that the combination of STIL and TDC significantly enhances accuracy and range, making it suitable for various long-range, high-precision measurement tasks.

1. Introduction

Lidar technology demonstrates significant potential in high-precision distance measurement by virtue of its high-precision ranging capability [1,2,3,4]. Among various lidar systems, streak-tube imaging lidar stands out for its exceptional temporal resolution and 2D imaging high efficiency [5]. This feature makes STIL particularly effective in capturing dynamic scenes, which is crucial for applications that require precise range measurements, such as underwater target imaging [6,7]. The ability of STIL to provide high-resolution temporal data ensures accurate target tracking and detailed analysis, making it highly advantageous in sea wave detection, where both precision and speed are critical.
To enhance the performance of STIL systems, optimizing both system design and data processing techniques has become a significant research focus. For instance, Gao et al. introduced 4D imaging of ocean waves using STIL, demonstrating its potential in dynamic environmental monitoring [8]. Similarly, Cui et al. explored real-time 3D imaging with streak tube Lidar using LabVIEW, providing important insights into real-time data processing and software integration [9].
Further developments by Tian et al. and Hui et al. focused on improving the physical design of streak tubes, both through numerical simulations and experimental verification, enhancing the compactness and functionality of streak tube cameras [10,11]. Fang et al. extended this by integrating kilohertz laser pulses with STIL for few-photon detection, which is crucial for low-light applications [12].
Researchers have proposed various improvements in system architecture [13,14,15] and data processing methodologies [16,17] to increase both accuracy and efficiency. The current state of the art is also characterized by innovations in signal processing and image optimization. For example, Yuan et al. applied Gaussian fitting for 3D reconstruction, which is a critical technique for enhancing measurement accuracy [18]. Similarly, Dong et al. and Shen et al. contributed to the improvement of point cloud data homogenization and the application of machine learning techniques like OSA-YOLOv5s for automatic feature extraction from lidar images [19,20]. Previous studies have extensively explored system parameter optimization [21,22,23,24] and advanced data processing techniques [25,26] to enhance measurement accuracy. Originally developed for underwater measurements, STIL has been extended to ground target measurements, where ranging accuracy is a critical factor in determining the system’s detection performance, particularly in long-range ground measurements. However, there remains a notable gap in the precise design and verification of ranging accuracy, especially in the context of long-distance ground measurements.
In this study, we present a self-developed STIL system specifically designed for long-range target detection. To achieve enhanced ranging accuracy, we meticulously optimized both the laser emitter and receiver components. Central to the receiver design is a custom streak camera, which not only effectively addresses the challenges posed by the far-field characteristics of the detection laser but also ensures high gain and an improved signal-to-noise ratio (SNR) during streak image echo recording. Following these optimizations, we conducted a quantitative evaluation of the system’s ranging model. Subsequently, we performed a long-range ground experiment to validate the system’s ranging accuracy, thereby demonstrating the effectiveness of our design improvements.

2. Materials and Methods

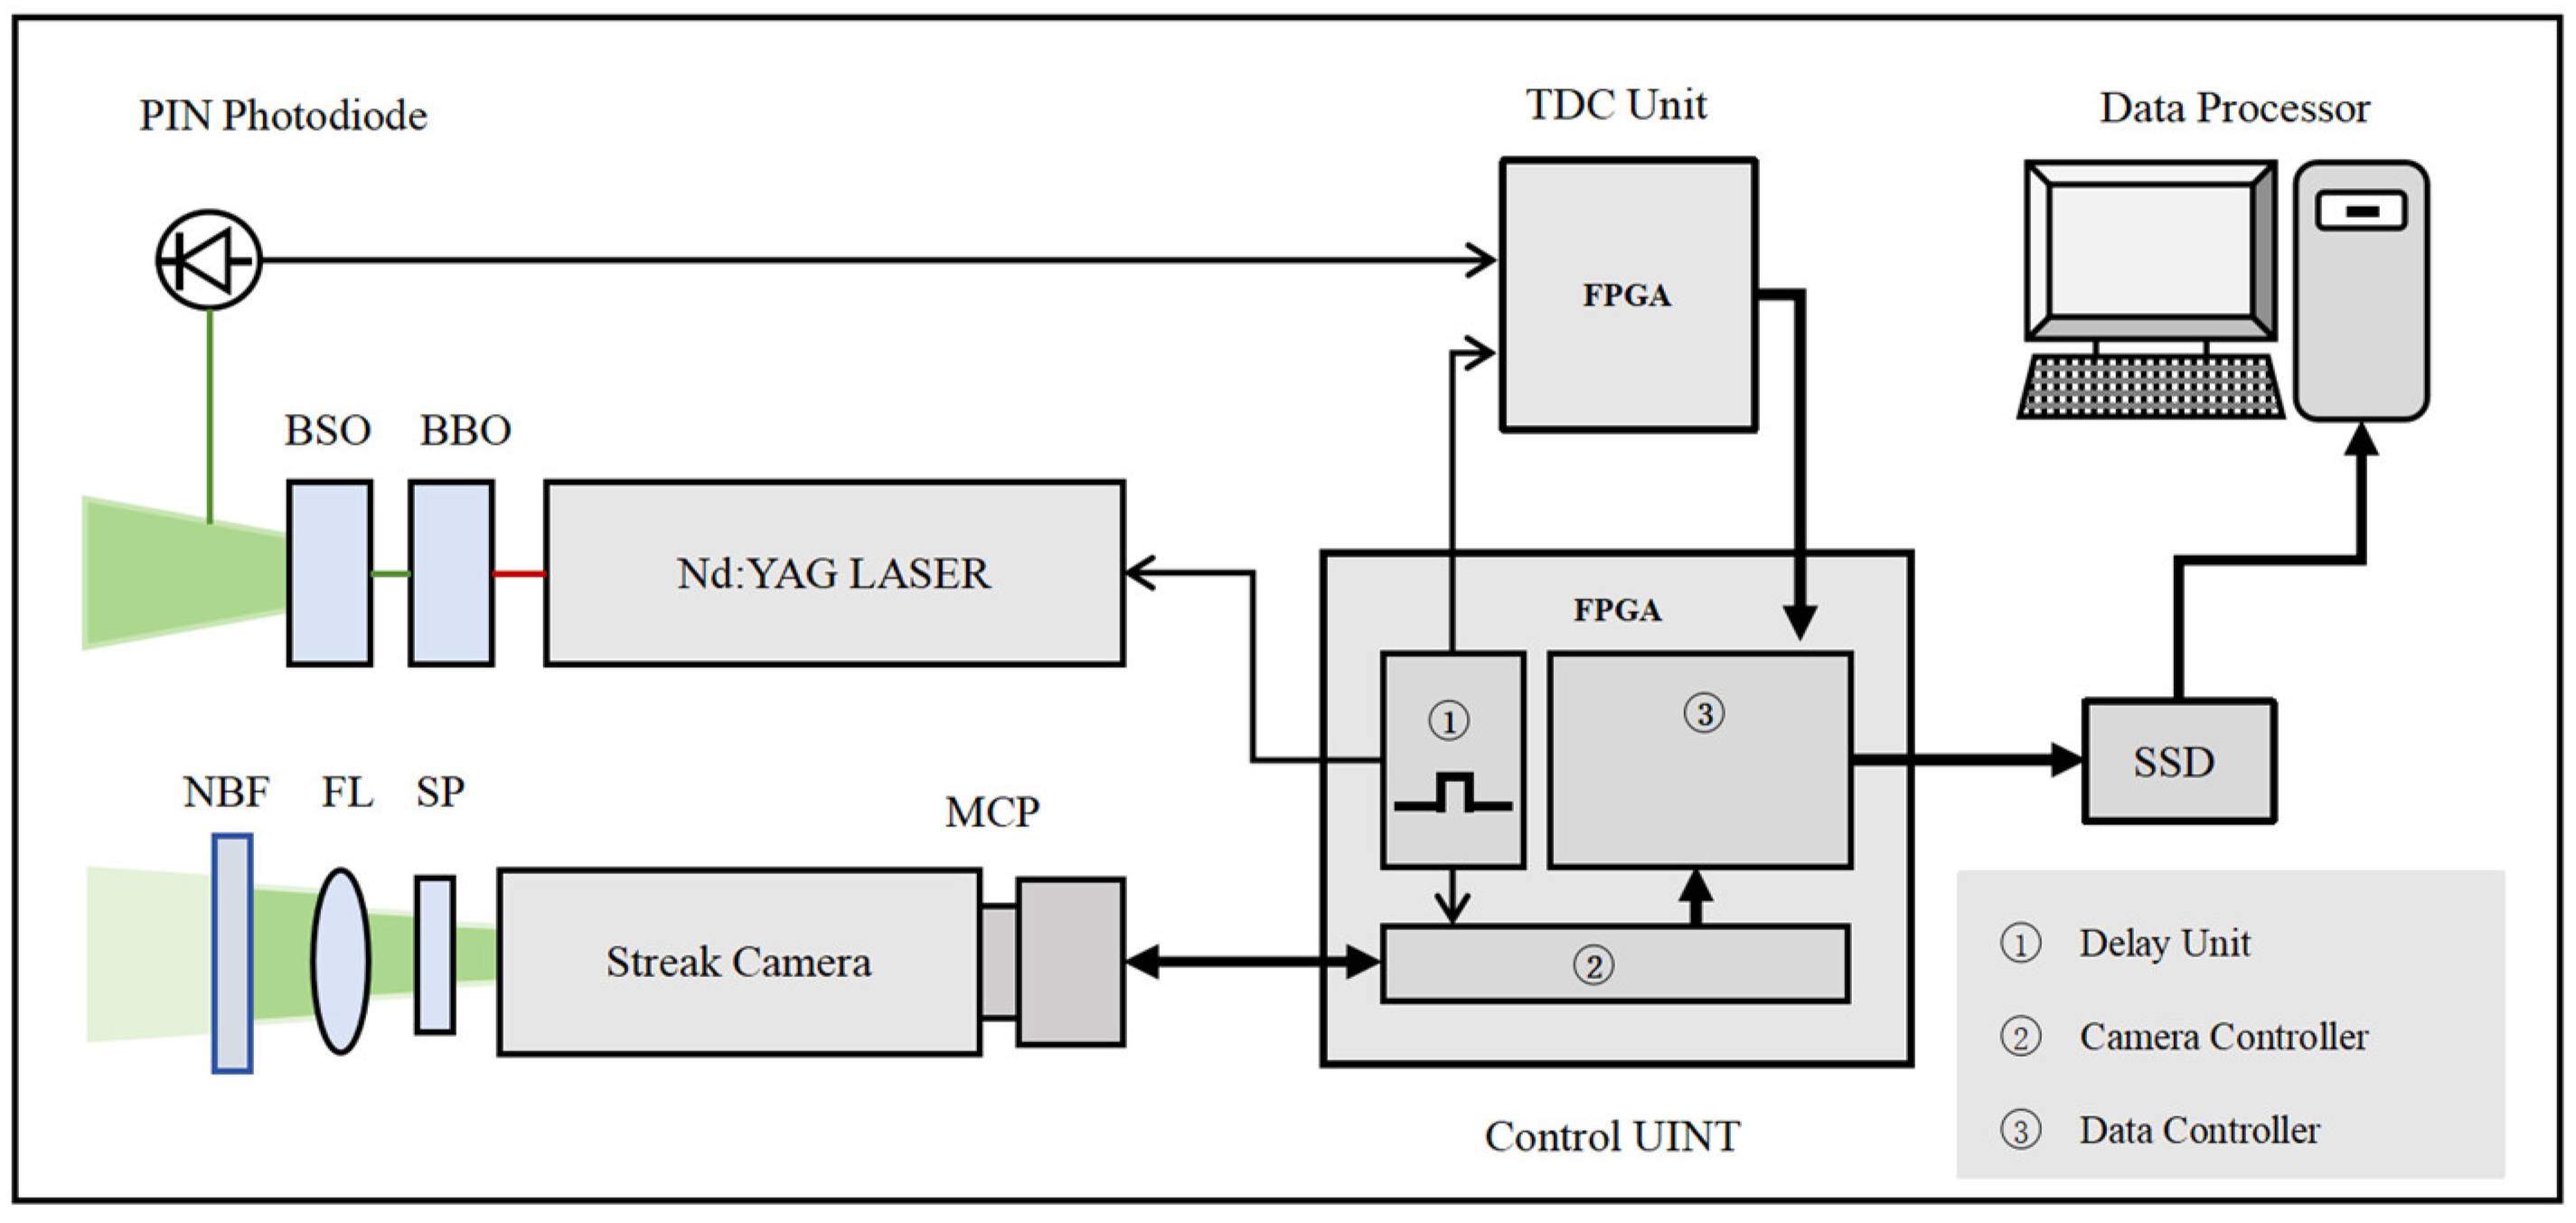
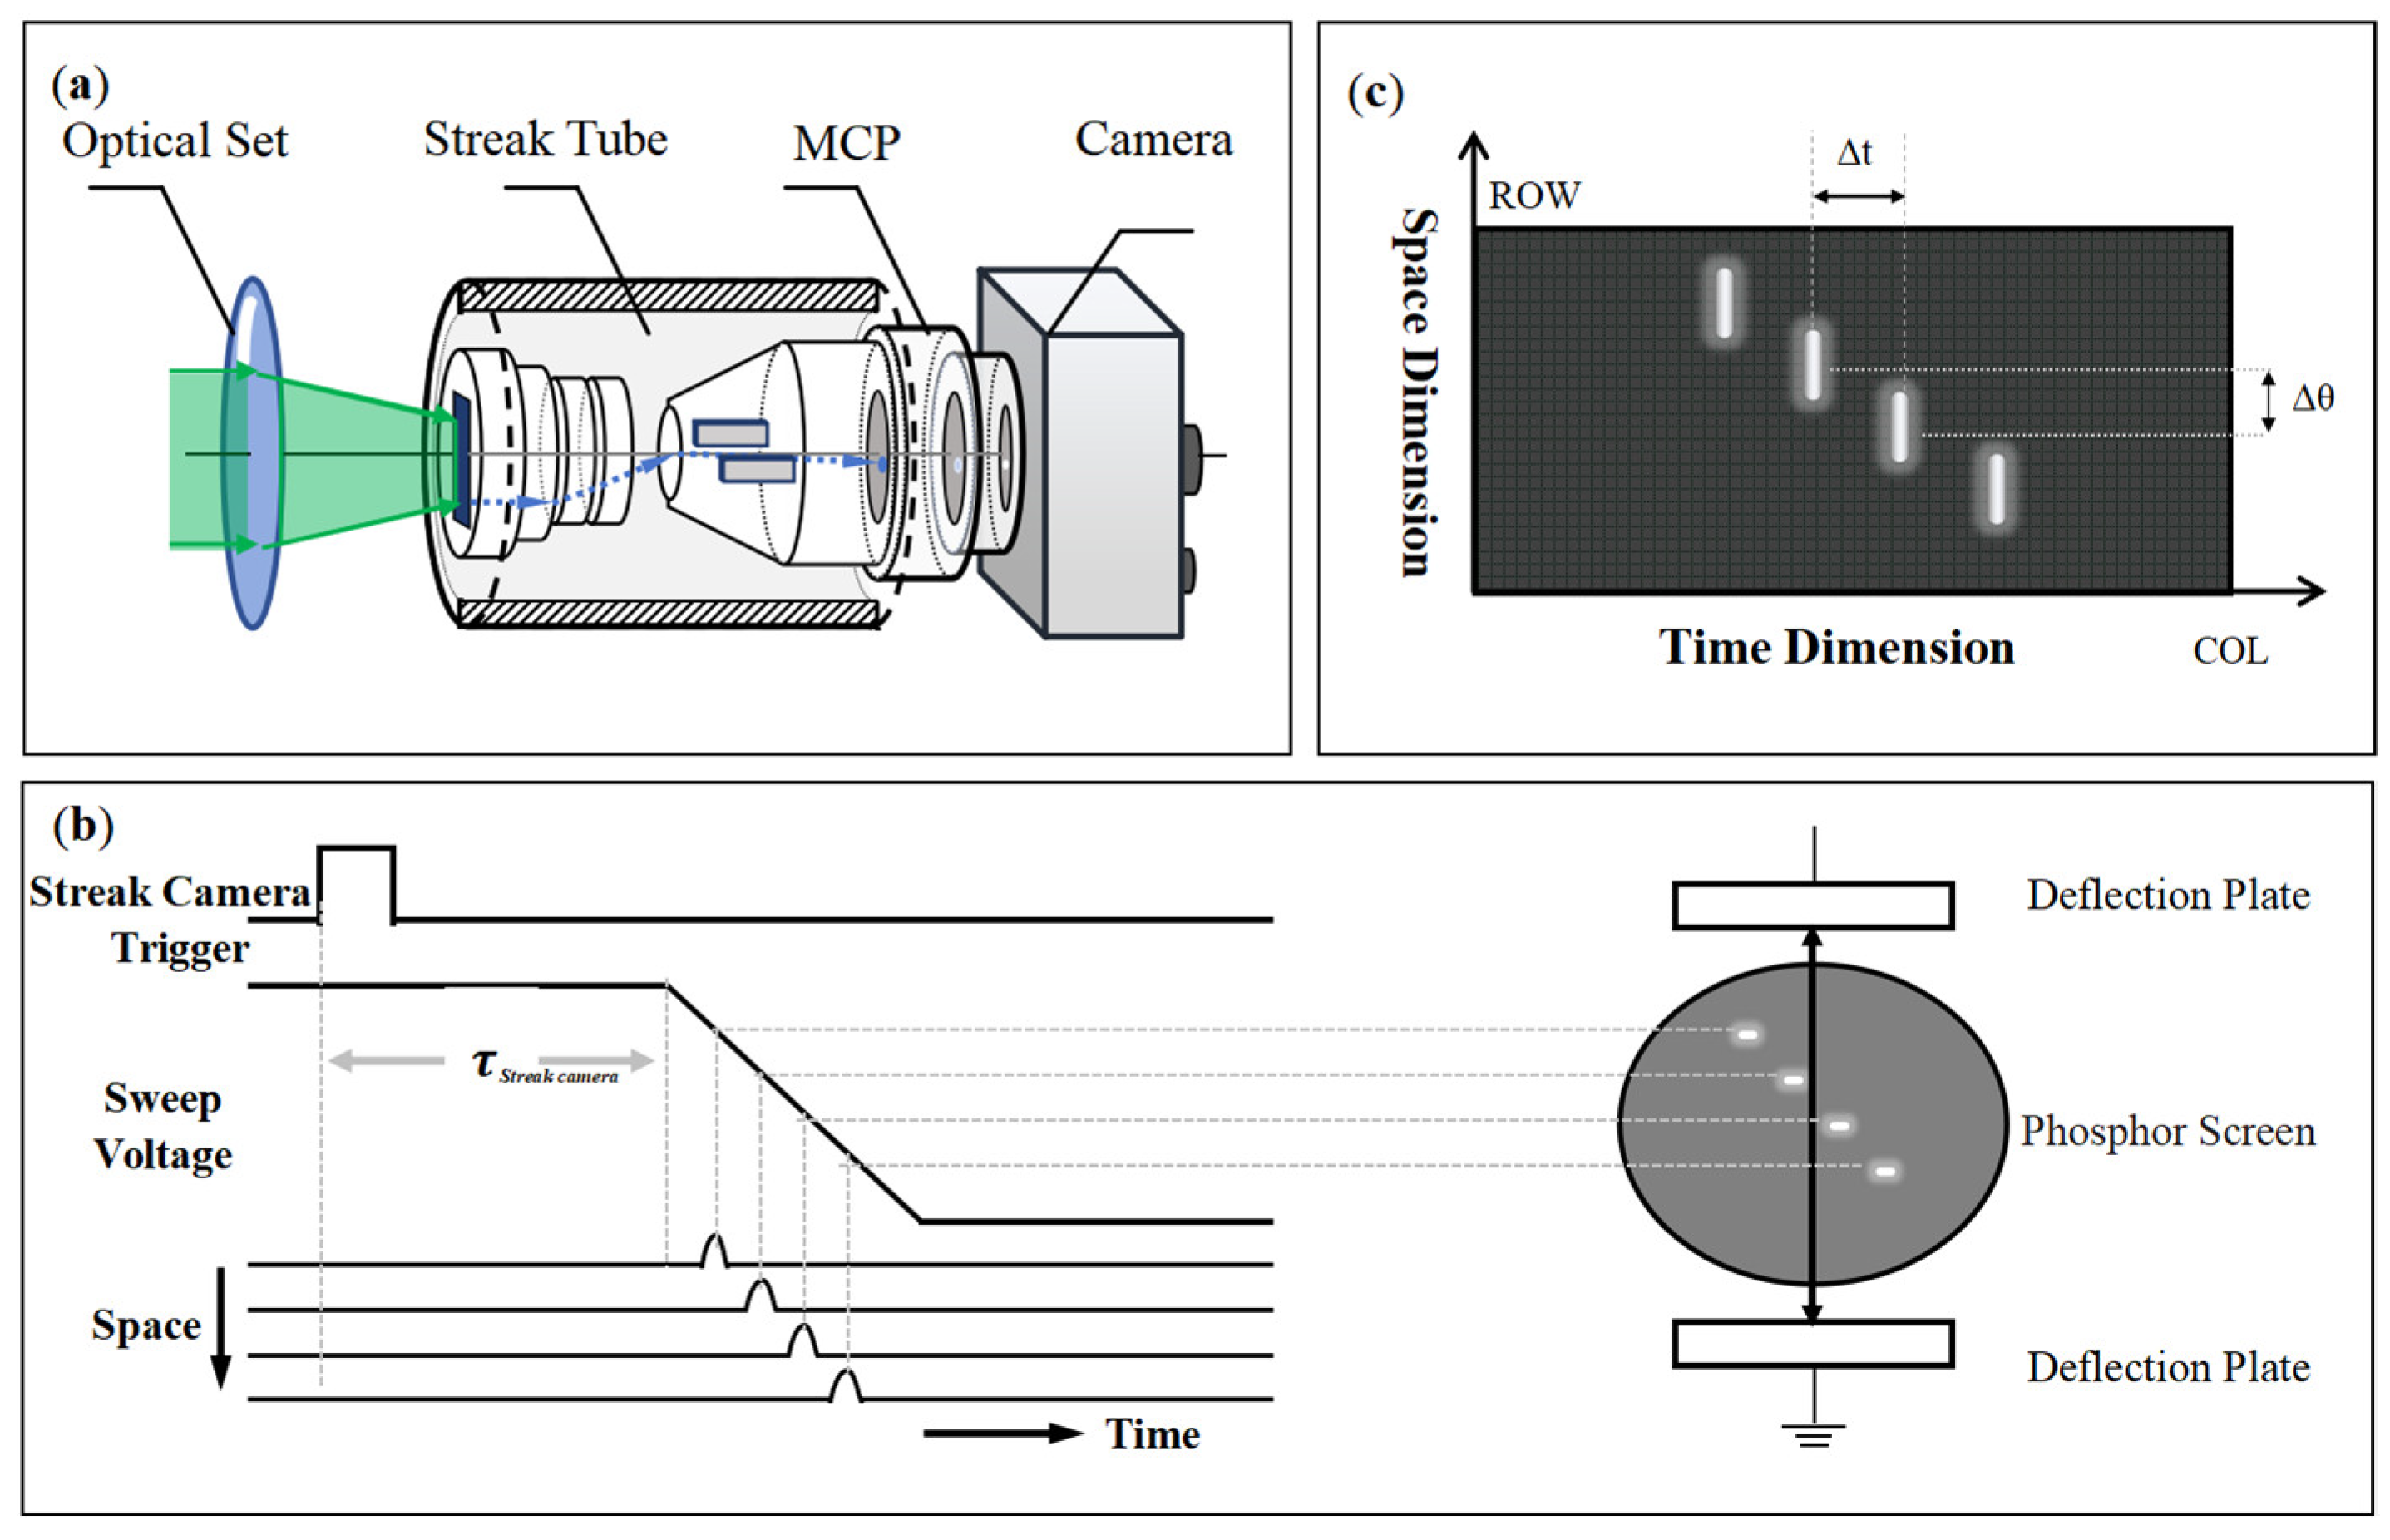
2.1. STIL System Structure

Figure 1 illustrates the configuration of the developed STIL system, which is composed of four primary components: a control unit, a laser emitter, a laser receiver, and a TDC unit. During the detection process, the control unit is pivotal to the system’s operation, orchestrating the generation of trigger signals that activate both the laser and the streak camera, thereby ensuring precise synchronization between the laser pulse emission and the streak camera’s recording. Furthermore, the control unit oversees the streak camera’s timing and image format, guaranteeing that streak images are captured accurately. It also maintains system synchronization and manages the storage of ranging data, which is critical for precise time-of-flight (ToF) measurements and target analysis.
The laser emitter generates fan-shaped laser pulses and detects the optical trigger signal via a positive-intrinsic-negative (PIN) photodiode. The laser emitter utilizes an Nd-YAG laser and beta barium borate (BBO) crystal to emit a 532 nm laser with minimal divergence. These pulses, shaped by beam shaping optics (BSO) into a fan beam, are detected by a high-response PIN photodiode. It detects the diffuse reflection of the laser signal near the laser emission path and generates an optical trigger signal. The optical trigger signal is subsequently fed into the TDC to accurately timestamp the laser pulse emission.
The laser receiver captures the laser spot reflected from the target. The streak camera within the receiver then converts the temporal and spatial information of the return signal into a two-dimensional streak image. This streak image provides a detailed representation of the time-resolved intensity distribution of the reflected laser pulse, allowing for precise analysis of the distance of the target. The front end of the receiving unit employs a narrow-band filter and a spatial diaphragm to eliminate background and stray light, thereby enhancing the signal-to-noise ratio of the received signal. As the core component of the receiving unit, a streak camera equipped with an MCP image intensifier records the laser echoes with exceptional time and spatial resolution. The pulse synchronized with the trigger signal of the streak camera is input into the TDC to mark the time of laser pulse reception.
An 8-channel TDC unit precisely measures the time delay between the optical trigger and streak camera trigger pulses via internal field programmable gate array (FPGA) routing delays, thereby determining the exact timing of the laser pulse. By accurately capturing this time delay, the TDC ensures precise synchronization between the laser emission and the streak camera imaging, allowing for accurate ToF measurements or high-speed laser imaging.

2.2. STIL Ranging Data Processing

According to the ToF ranging principle, the ranging distance d is expressed as:
d = c × t r a n g e 2 n
where c is the speed of light, and n is the refractive index of the atmospheric medium. The ranging time t r a n g e in the proposed STIL system refers to the duration between emitting and receiving a laser pulse. This ranging time can be described as follows:
t r a n g e = ( t s t r e a k _ c a m e r a _ t r i g g e r + t s t r e a k _ e c h o + τ s t r e a k _ c a m e r a ) ( t o p t i c a l _ t r i g g e r τ P I N ) τ e n v
The designed STIL measures the time delay of the optical trigger t o p t i c a l _ t r i g g e r and the streak camera trigger t s t r e a k _ c a m e r a _ t r i g g e r using two independent channels of TDC and records the echo intensity changes with time t s t r e a k _ e c h o through the streak camera.
τ s t r e a k _ c a m e r a represents the intrinsic delay between the trigger of the streak camera and the generation of the output image. This delay is determined by the inherent characteristics and design of the streak camera. τ P I N refers to the inherent delay in the optical path between the PIN diode trigger pulse and the emission of the fan-shaped laser pulse. This delay is influenced by the laser emitter’s components and configuration. τ e n v is the propagation delay of the laser pulse during atmospheric transmission, which is influenced by environmental factors such as visibility. For short-term measurements, this delay is treated as a constant.
Based on this ranging principle, the system ranging time is described by the model:
t r a n g e = Δ t t r i g g e r + Δ t s t r e a k _ e c h o + τ
The ranging accuracy of the system is influenced by several factors: the temporal characteristics of the laser output pulse, TDC time measurement errors, the temporal calibration accuracy of streak camera, and the accuracy of echo time feature extraction from streak images. To improve ranging precision, it is essential to use high-stability and high-resolution lasers and TDC units, precisely calibrate the temporal characteristics of the streak camera, and employ efficient streak image processing algorithms to extract echo temporal features.
Above all, the objective of STIL ranging data processing is to extract precise echo time information from streak images and combine it with TDC ranging data and inherent delay calibration data to ultimately obtain accurate target distance information. The processing flow of the ranging data is described in next steps:
  • Streak camera temporal information calibration
For a streak tube with a high linear sweep field, the relative value of the echo time in the streak image can be expressed as follows:
Δ t s t r e a k _ e c h o = k × ( n e c h o n z e r o )
k is the time interval the streak image. n e c h o is the column coordinate of echo spot. n z e r o is the coordinate of the ranging time zero. In theory, n z e r o = 0 in each row. However, due to the installation error of the streak camera and the nonlinear imaging of the streak tube, the n z e r o of each row changes, and there is also an error in k. It is necessary to calibrate the temporal dimension in the streak camera.
The time calibration of the streak camera is to select the appropriate laser source, and then adjust the laser pulse (time delay and angle). The sample light pulse travels through the imaging surface of the streak camera, and several groups of streak images are collected to extract feature points. Finally, by interpolating sampling feature points with known temporal and spatial information, precise time and spatial angles for each pixel in the streak image are determined. In our previous work, we designed and verified the calibration of the streak camera, and obtained a high-precision temporal matrix M t using this method.
2.
Extraction of Echo Feature Points
Unlike regular 2D intensity images, the streak images have a vertical axis for spatial dimension and a horizontal axis for temporal dimension. The echo spots contain the semantic information of target distance and spatial distribution. The structure and principle of streak camera imaging are illustrated in Figure 2.
In the processing of streak images, the centroid point of the echo is extracted by row as the time axis coordinate of the echo at that spatial angle:
n e c h o ( m ) = n c e n ( m ) = n I m n I ( m , n ) n I m I ( m , n )
3.
Streak echo temporal information extraction
Δ t s t r e a k e c h o ( m , n e c h o ( m ) ) = M t ( m , n e c h o ( m ) ) × ( 1 b ) + M t ( m , n e c h o ( m ) + 1 ) × b
Combining the calibration time matrix M t and the coordinates of the echo centroid points ( m , n e c h o ( m ) ) , we interpolate and extract the temporal information to determine the temporal relative values Δ t s t r e a k _ e c h o of the echo lasers recorded in the streak image, where b = n e c h o ( m ) - n e c h o ( m ) , the time values Δ t s t r e a k _ e c h o of the echoes are obtained by linearly interpolating the column directions of the calibration matrix M t .
4.
Ranging Data Fusion
The STIL system operates by conducting pulse measurements at a specific repetition frequency. For the detection pulse k, the fusion of ranging pulse time Δ t T D C from the TDC with echo time information Δ t s t r e a k _ e c h o extracted from multiple streak images is essential. This calculation depends on the high synchronization between the TDC data and the streak images, ensuring precise determination of the relative time t r a n g e * for the current pulse:
t r a n g e * ( k , m ) = Δ t t r i g g e r ( k ) + Δ t s t r e a k _ e c h o ( k , m , n e c h o ( m )
5.
Intrinsic Delay Calibration and Environmental Delay Calibration
To obtain an accurate delay value τ, it is necessary to perform on-site experiments by calibrating detection points at known distances during actual measurements:
t r a n g e ( k , m ) = Δ t t r i g g e r ( k ) + Δ t s t r e a k _ e c h o ( k , m , n e c h o ( m ) ) + τ
The calibration of the intrinsic delay τ i n s is performed by imaging a fixed target and measuring the system’s delay parameters, which are solely dependent on the system’s characteristics. Typically, this calibration is required only once. In contrast, the environmental delay τ e n v   must be accurately calibrated during actual detection, based on the specific conditions at the current detection point. The target distance is then calculated by combining these delay parameters with the actual measured echo streak time t s t r e a k _ e c h o and pulse time Δ t p u l s e .
To analyze the ranging accuracy of the system, we introduce the standard deviation of errors to statistically quantify the ranging accuracy:
σ r a n g e = 1 n k = 1 n t r a n g e * ( k , m ) t r a n g e * ¯ 2
where n denotes the number of ranging pulses directed at the same target. By averaging the ranging values for a target at a fixed distance and calculating the standard deviation, the system’s ranging accuracy can be evaluated. This method isolates the effects of delay calibration on measurement accuracy, focusing specifically on the ranging errors associated with the TDC unit and streak image processing.

2.3. Ground Tests

In the ground tests, the STIL system emitted laser pulses horizontally from a window at an elevation of approximately 40 m within the building, aiming at the surface of the target building. The locations of the STIL system and the target building, which is 6 km away, are shown in Figure 3a. Figure 3b illustrates that the STIL system’s laser pulse forms an elliptical Gaussian spot on a building target 1 km away, with the large-angle detection laser reflecting off the unobstructed target to generate a fully reflected echo spot.
To investigate the far-field characteristics of the detection laser and verify the system’s long-range ranging accuracy, the target was set as a building located 6 km away. Due to obstructions and spatial constraints at this distance, the detection beam could only reflect off a portion of the target, specifically the upper section of the building. Figure 3c shows the incomplete reflected laser spot on the surface of the target building.

3. Results

3.1. Laser Far-Field Characteristics Analysis

Before conducting the STIL ranging assessment, we first carried out a field test to capture laser spot images and analyze the far-field characteristics of the laser spot. A high-resolution CCD camera was used, with an exposure time of 500 ms, to obtain 2048 × 2592 pixel 8-bit grayscale images of the laser spot on the target surface. Figure 4a shows the raw image of the laser spot. Due to the limited camera angle during the test, the laser spot images exhibited distortion and aberration, making it challenging to directly derive its intensity distribution. To address this issue, a projection correction is applied to the image coordinates, aligning the optical axis of the rectangular spot with the image coordinate axis. This transformation enables the extraction of the intensity distribution along the scanning direction by reading the pixel grayscale values from a single row of the image.
The correction process utilizes a projection transformation matrix, which maps points from the original image plane to a new projection plane, preserving the linearity of straight lines before and after the transformation. The relationship is given by the equation [x,y,1]′ = H·[x′,y′,1]’, where (x,y) are the row and column coordinates of the corrected image, (x’,y’) are the coordinates in the original image, and H is a homography matrix. This approach effectively compensates for the angular deviation of the camera, thereby aligning the rectangular spot with the image coordinate axis. The matrix is determined by solving a system of equations using four pairs of calibration points. The initial calibration points for the computation of the projection transformation matrix were manually selected by the researchers based on the rectangular features of the bricks in the image. After multiple iterations of selection and optimization, the final calibration matrix was obtained. The calculated projection transformation matrix is [1.4778, −0.0410, −0.0014; −0.0661, 1.1189, 0.0013; 0.0001, 0, 1].
Based on the calculated projection transformation matrix, we performed projection correction on the raw laser spot images, as shown in Figure 4b. After projection correction and actual spatial scale measurement, the spatial resolution of the image in Figure 4c is 4.3 mm/pixel, and the laser spot’s width at a 6 km target distance is measured to be 0.66 m. This indicates a very small divergence angle and confirming the system’s excellent beam characteristics.
The system generates a linear illumination area on ground targets, and the illumination spot width and receiver area width are calculated using the formula r = H·tanθ, where θ is the divergence angle of the laser in the scanning direction. In this study, after configuring the CCD camera and directing the detection laser toward a fixed far-field target, we measured the spot size to be r = 0.33 m, resulting in a calculated laser divergence angle of 5 × 10⁻⁵°. The system’s laser divergence angle of 5 × 10⁻⁵° ensures low beam spread over long distances, which is essential for maintaining measurement accuracy. This small divergence allows efficient laser energy use, improves long-range detection, and lowers the system’s power and sensitivity requirements for distance measurement.

3.2. Streak Images Processing Accuracy

In our previous streak camera calibration works, we obtained the calibration matrix that matches the temporal and spatial resolution of the streak images [24]. From the calibration results, the average temporal resolution of the streak image can reach 1.19 ns/pixel, with a temporal dynamic range exceeding 1.3 µs for a 512 × 1024 streak image.
To validate the extracted temporal accuracy from the streak image echoes, 6000 streak images were captured during a 3 s continuous acquisition at a rate of 2000 Hz. The raw image is depicted in Figure 5a. A fixed 100 × 100 region of interest (ROI), containing the echo laser spot, was extracted, as shown in Figure 5b. We selected a ROI test row, indicated by the dashed line in Figure 5b, with a high laser spot intensity to serve as the detected echo channel for the ranging accuracy verification. We conducted a quantitative comparison of various algorithms for extracting temporal feature points along the image row (time dimension).
Table 1 presents the time complexity of the echo feature point extraction algorithms and the standard deviation of the temporal feature coordinates extracted by these algorithms. The results from streak image processing demonstrate that the centroid algorithm stands out as a more effective method. It achieves more accuracy with a standard deviation of just 0.78 pixels, while also maintaining a low time complexity of O(n). This optimal balance between sub-pixel precision and computational efficiency makes the centroid algorithm particularly well suited for processing streak images that require accurate temporal feature points and can handle large data volumes of 1000 MB per second, with potential for implementation in real-time extraction processes in the future work.

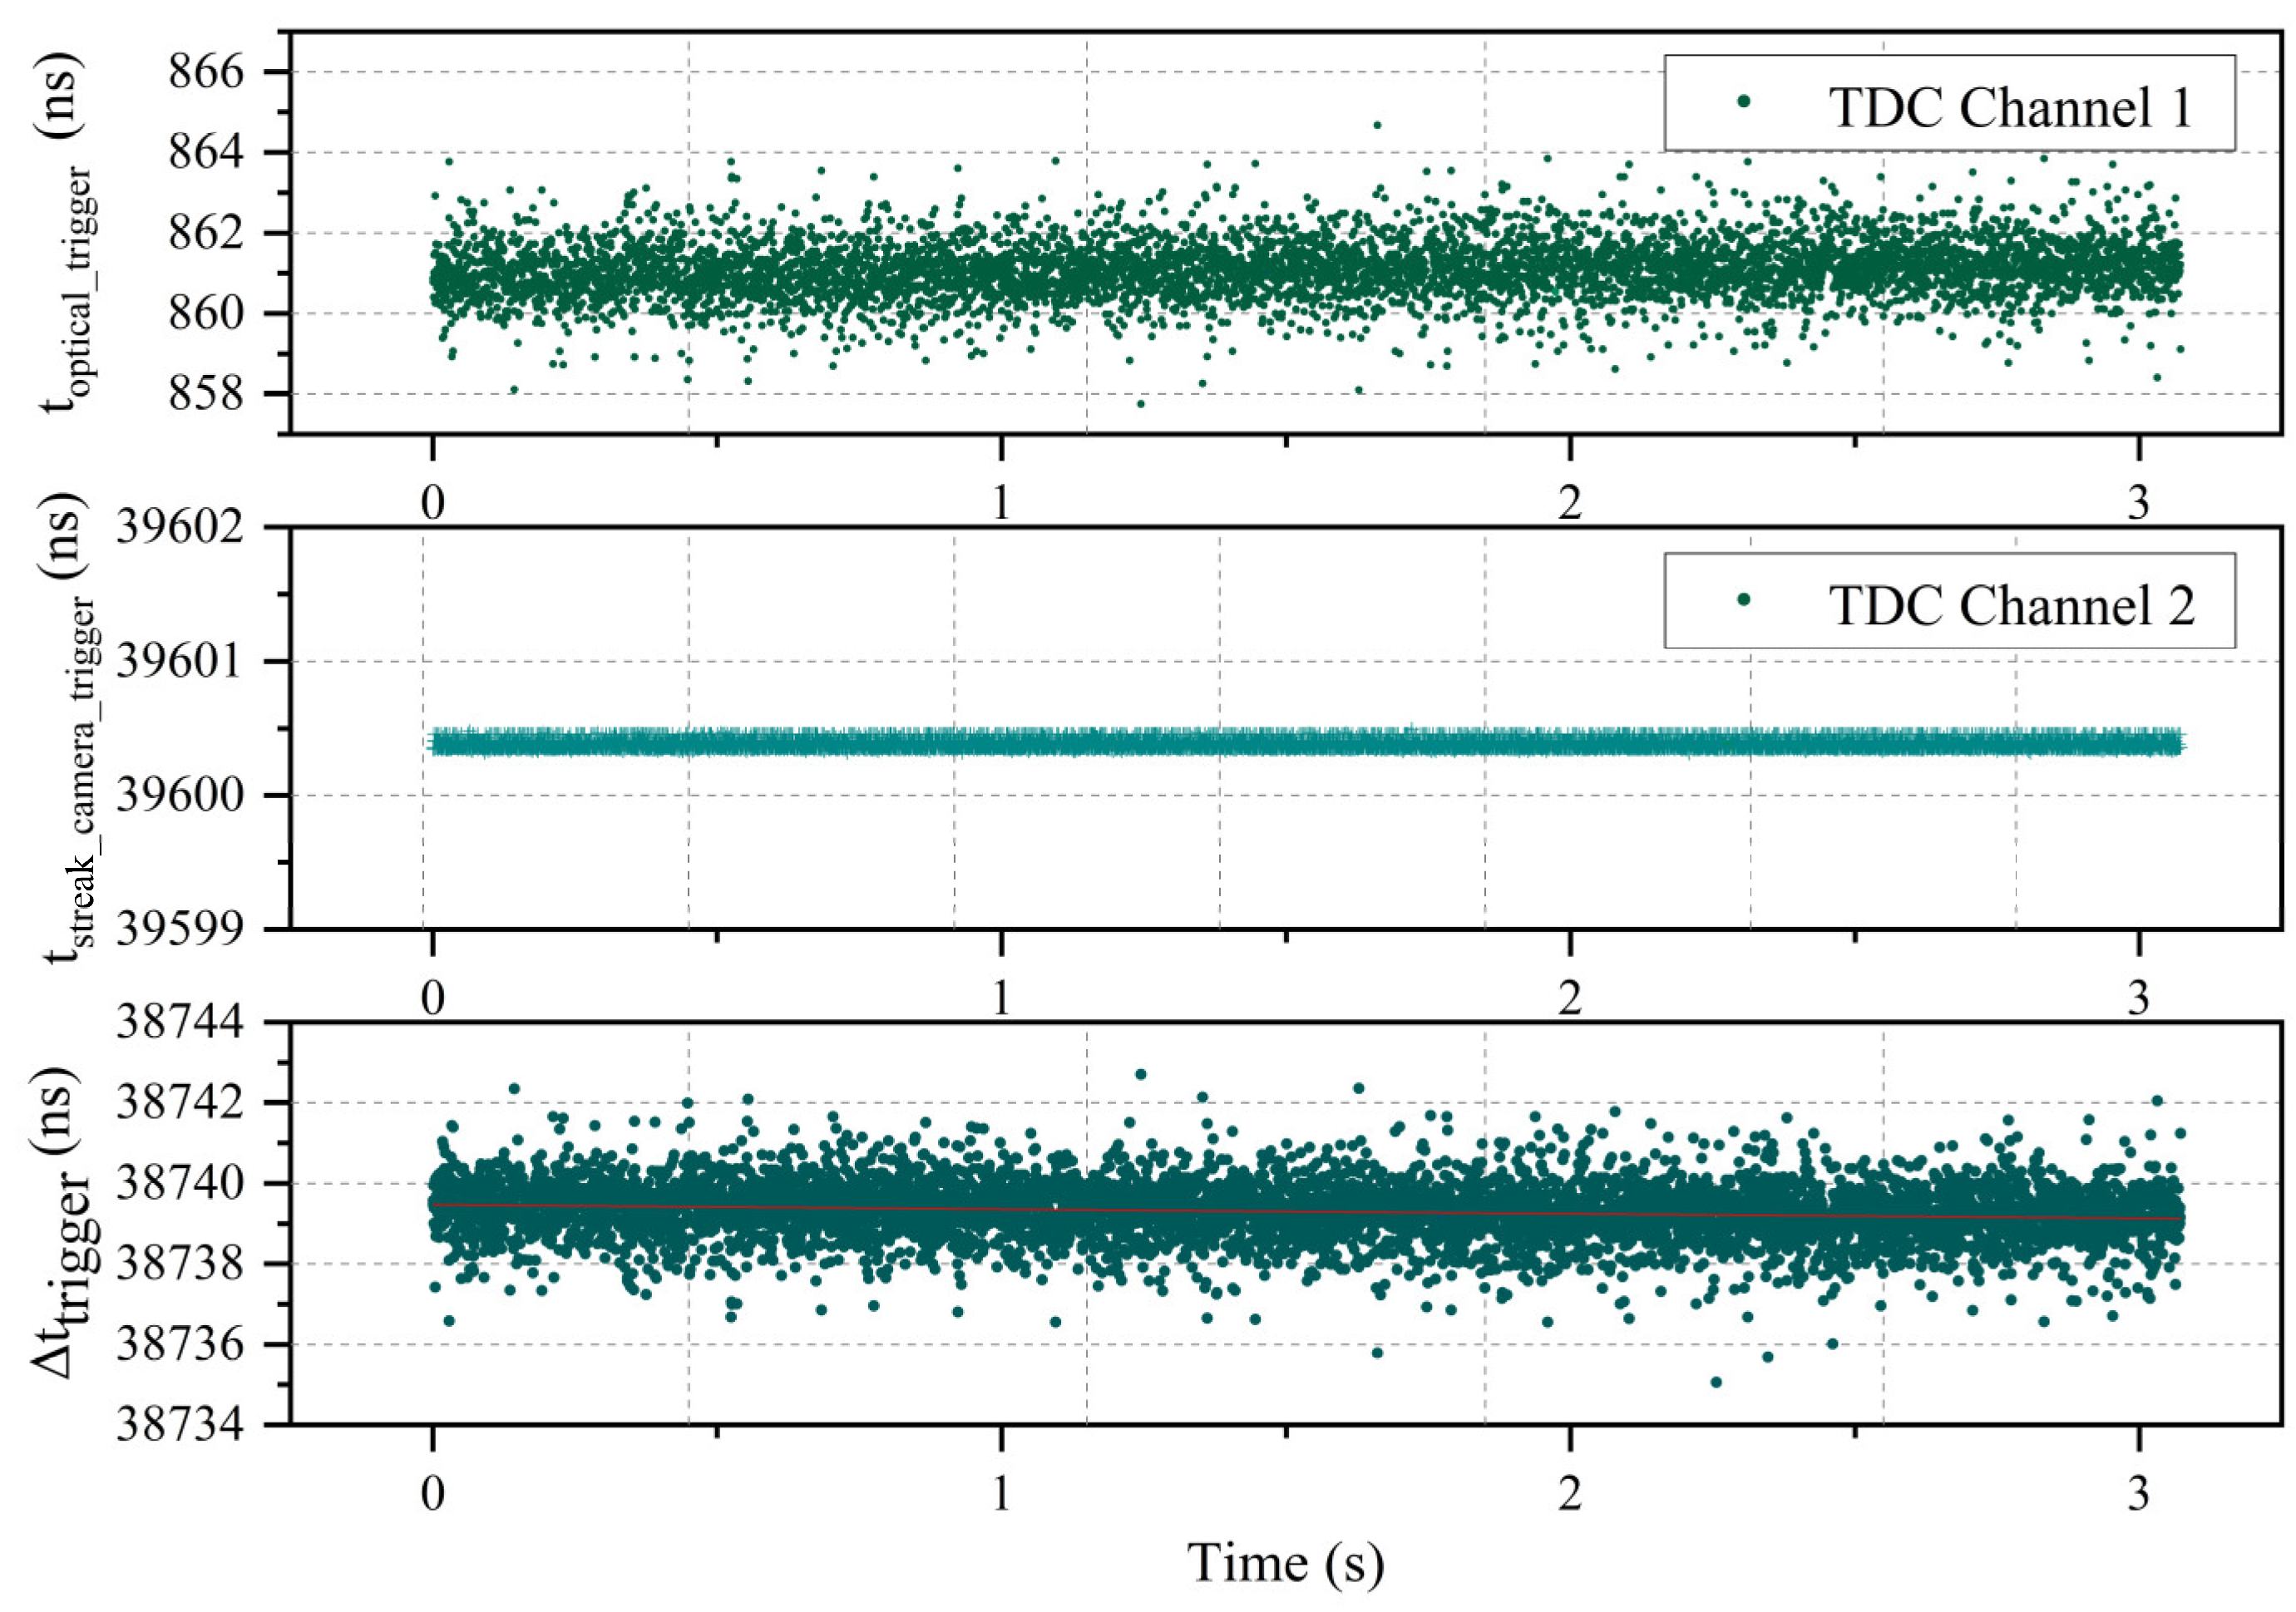
3.3. TDC Measurement Accuracy

The time measured by TDC are shown in Figure 6. TDC channel 1 specifically measured the optical trigger time t o p t i c a l _ t r i g g e r , resulting in an average value of 861.1 ns, with a standard deviation of 0.70 ns. This indicates optical trigger signal has a time jitter of σ1 = 0.70 ns; TDC channel 2 measured the streak camera trigger time t s t r e a k _ c a m e r a _ t r i g g e r , yielding an average value of 39,600.4 ns with a measurement accuracy of σ2 = 48 ps. This high precision at the picosecond level demonstrates that the TDC is capable of achieving high-precision time measurements for pulse signals. Additionally, the measurement accuracy of 48 ps further underscores the control unit’s capability to generate accurate trigger pulses, which is essential for the STIL system. This precision and stability are particularly crucial in future dynamic scanning measurement applications, ensuring more reliable detection performance.
By combining the two TDC channels, the Δ t t r i g g e r was calculated as 38,739.3 ns for the 6 km target, reflecting the 5810 m distance information of the target. Above all, the standard deviation of the measured pulse time was 0.70 ns, with the time measurement accuracy primarily affected by the time jitter of the optical trigger signal. This jitter introduces errors in the final TDC measurement results. The ranging delay τ was approximately 2 µs. But the precise value of this delay requires further calibration and verification. The absolute measurement value requires further calibration and verification.

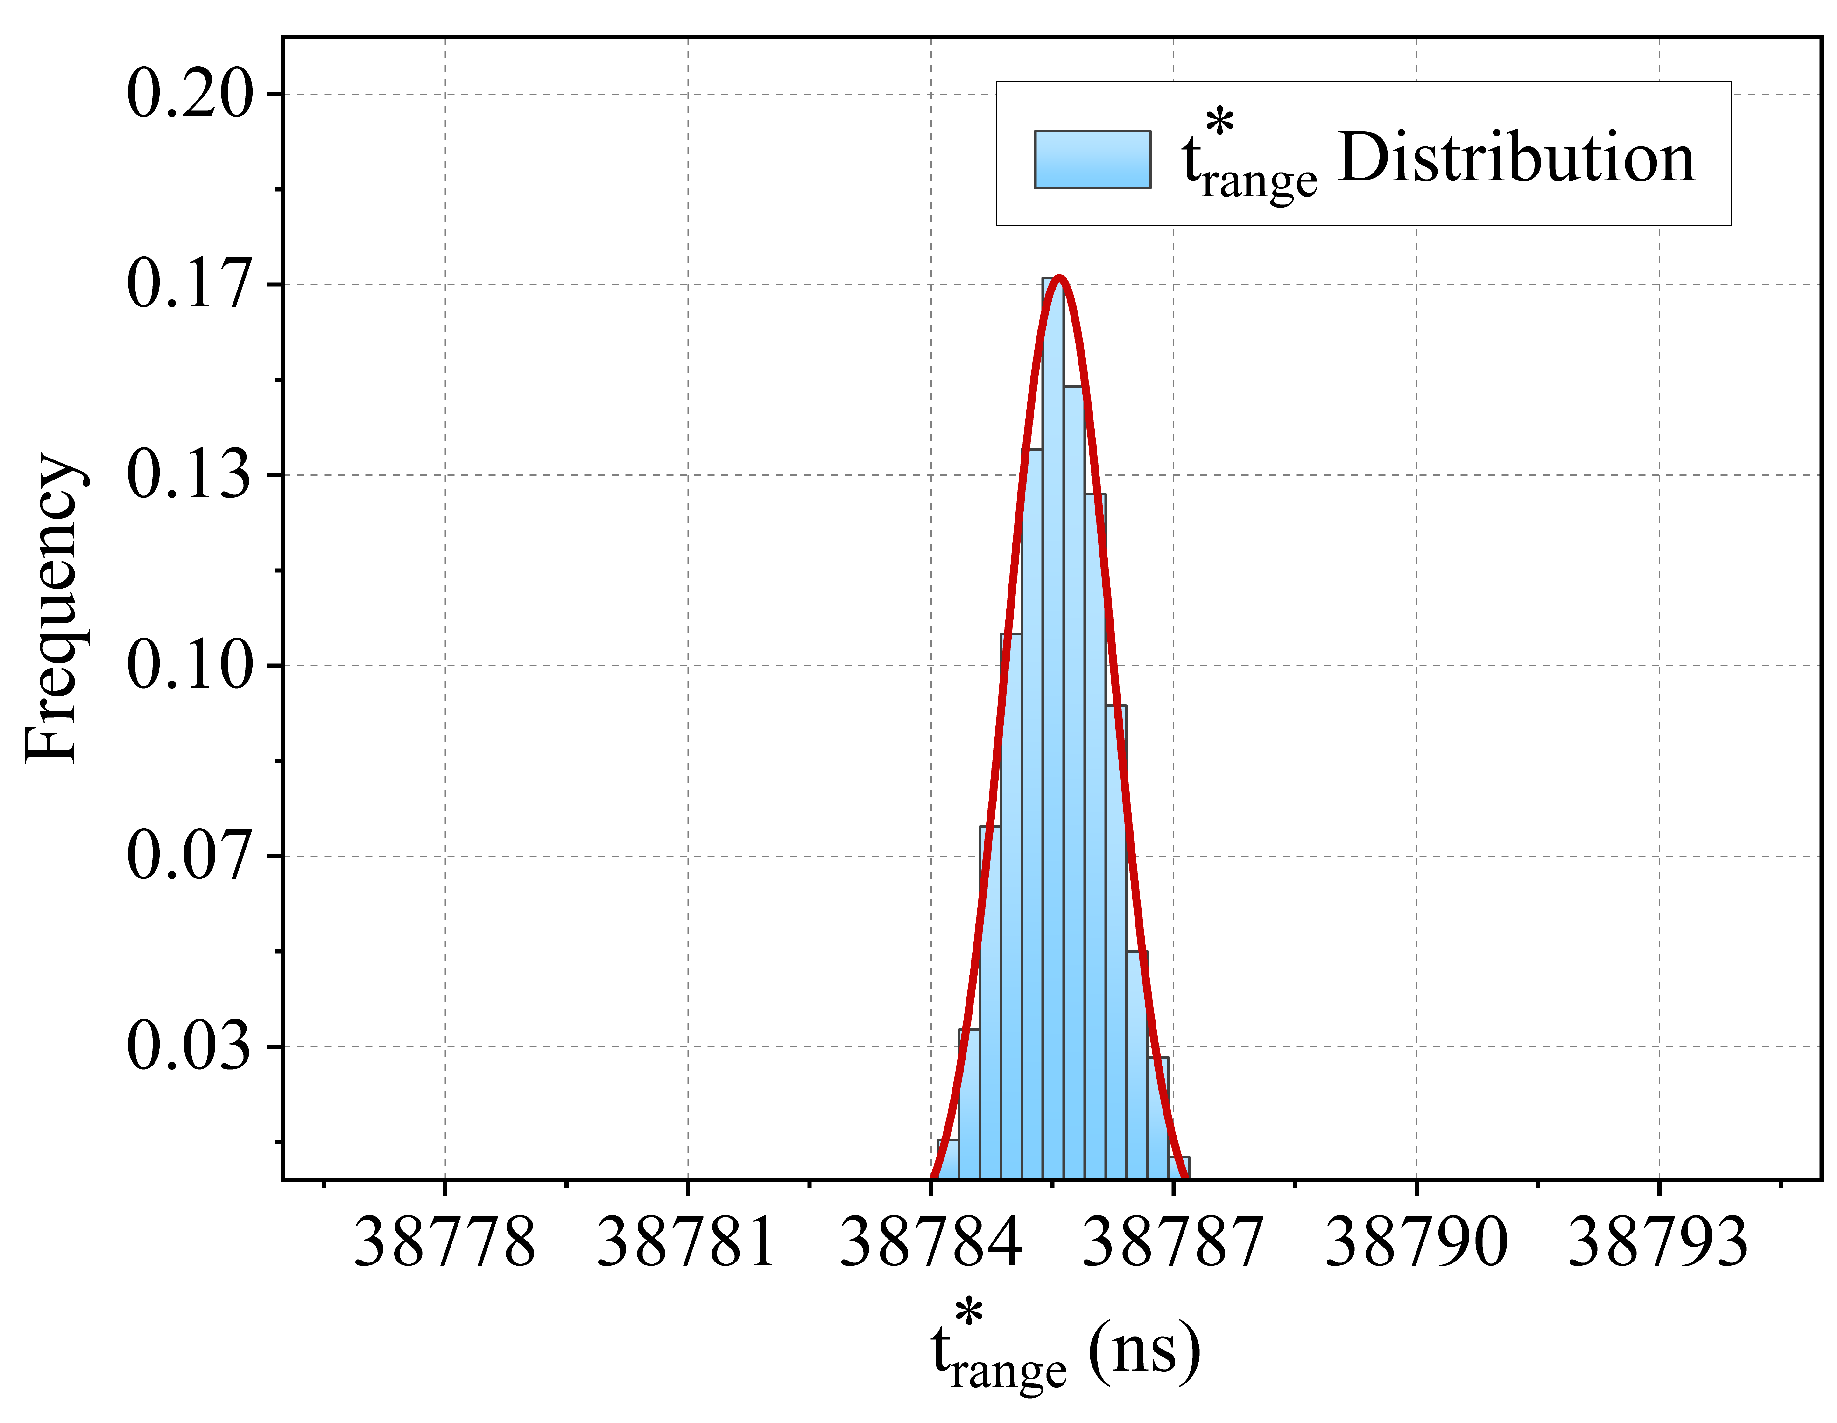
3.4. STIL Ranging Accuracy

Combining the TDC measurement data and the centroid temporal data obtained by streak image processing, we made the comprehensive evaluation of the system ranging accuracy. The data are shown in Table 2. The normalized histogram of 6000 measurement results is shown in Figure 7. Based on the normalized histogram, the system’s average ranging time is 38,785.6 ns, corresponding to a relative distance value of 5817 m. The red solid line represents the Gaussian fit applied to the histogram data. According to the fitting results, the distribution of the system’s measurement time t r a n g e * follows a normal error distribution, and the fitting yields a standard deviation of σ t = 0.65 ns. Clearly, this value is smaller than the standard deviation of the TDC measurement time and the streak echo time. This can be attributed to the TDC capturing the time jitter of the optical trigger signal, which has a significant impact on precision in long-distance measurements. This result indicated that the ranging accuracy in the ranging measurements is 0.65 ns. The results in Figure 7 verify the stability and high precision of the system’s ranging error performance.
In comparison to previous work of STIL ranging accuracy [25], which optimized static blur width and achieved a measurement accuracy of 0.06 m indoors and 0.25 m over kilometer-scale outdoor distances, the current study demonstrates significant advancements. The calculated Pearson correlation coefficient between Δ t t r i g g e r and Δ t s t r e a k _ e c h o is k = 0.7, and integrating system optimizations, the measurement accuracy improved by 30%. The system ultimately achieved a precision of 0.1 m at a distance of 6 km, a substantial improvement over previous results. These advancements showcase the STIL system’s potential for high-precision, long-range measurements, making it highly promising for future applications.
In summary, the TDC provides precise measurements of the trigger pulse time, while the streak images record the timing information of each echo during the detection. By combining these ranging data, the system can correct measurement errors and achieve high-precision ranging. The STIL system not only improves the measurement accuracy but also efficiently acquires multiple echo footprint points, generating more reliable and comprehensive distance spatial distribution information. This demonstrates the powerful and efficient high-precision application potential of streak tube imaging LiDAR. In subsequent applications, the STIL system needs scanning units and GPS units for wide-range, high-efficiency scanning. The precision of these units, along with ranging accuracy, determines the 3D measurement accuracy of the STIL system. Atmospheric conditions can also affect accuracy in long-distance measurements. Nevertheless, high ranging accuracy is essential for the STIL system and critical for its final integrated application.

4. Conclusions

In this paper, a STIL system that combines TDC and streak camera ranging mechanism is proposed. Moreover, a ground test was proposed to assess the ranging accuracy of the developed method. The assessment shows a ranging time accuracy of 0.65 ns for a building target at a horizontal distance of 6 km. The results indicate that the designed STIL system achieves a high ranging accuracy of 0.1 m at 6 km, thereby verifying the system’s long-range ranging capability. In future work, we will analyze and verify the scanning accuracy of the STIL system and further study the streak camera’s imaging characteristics of long-distance laser echoes. Building on the foundation of high ranging accuracy, we aim to further improve the efficiency and precision of the STIL system in long-distance 3D detection.

Author Contributions

Conceptualization, R.F.; Methodology, Z.C.; Software, X.W.; Formal analysis, L.C.; Investigation, Z.F. and Z.D.; Data curation, P.H.; Writing—original draft, C.D.; Supervision, D.C. All authors have read and agreed to the published version of the manuscript.

Funding

This work was supported by the National Natural Science Foundation of China, with No. 62305085 and No. 62192774.

Institutional Review Board Statement

Not applicable.

Informed Consent Statement

Not applicable.

Data Availability Statement

The data presented in this study are available on request from the corresponding author. The data are not publicly available due to confidentiality agreements and concerns regarding data privacy.

Conflicts of Interest

The authors declare no conflicts of interest.

References

  1. Li, Z.P.; Ye, J.T.; Huang, X.; Jiang, P.Y.; Cao, Y.; Hong, Y.; Yu, C.; Zhang, J.; Zhang, Q.; Peng, C.Z.; et al. Single-photon imaging over 200 km. Optica 2021, 8, 344–349. [Google Scholar] [CrossRef]
  2. Jian, W.; Zhi, L.; Wei, W.; Fang, Z.; Jian, C.; Yu, W.; Wei, Z. Long-distance ranging with high precision using a soliton microcomb. Photonics Res. 2020, 8, 1964–1972. [Google Scholar]
  3. Jian, Y.; Bo, Z.; Bin, L. Distance and Velocity Measurement of Coherent Lidar Based on Chirp Pulse Compression. Sensors 2019, 19, 2313. [Google Scholar] [CrossRef] [PubMed]
  4. Yu, Z.; Lu, C.; Liu, G. FMCW LiDAR with an FM nonlinear kernel function for dynamic-distance measurement. Opt. Express 2022, 30, 19582–19596. [Google Scholar]
  5. Asher, G.; Brian, C.R.; Robert, S.L.; Coreen, A.S.; Andrew, J.G. Flash lidar based on multiple-slit streak tube imaging lidar. In Laser Radar Technology and Applications VII; Proceedings Volume 4723; SPIE: Bellingham, WA, USA, 29 July 2002. [Google Scholar]
  6. John, W.M. High-resolution 3D underwater imaging. In Airborne and In-Water Underwater Imaging; Proceedings Volume 3761; SPIE: Bellingham, WA, USA, 28 October 1999. [Google Scholar]
  7. Li, G.; Zhou, Q.; Xu, G.; Wang, X.; Han, W.; Wang, J.; Zhang, G.; Zhang, Y.; Song, S.; Gu, S.; et al. Lidar-radar for underwater target detection using a modulated sub-nanosecond Q-switched laser. Opt. Laser Technol. 2021, 142, 107234. [Google Scholar] [CrossRef]
  8. Gao, J.; Sun, J.; Wang, Q.; Cong, M. 4-D imaging of the short scale ocean waves using a slit streak tube imaging Lidar. Optik 2017, 136, 136–143. [Google Scholar] [CrossRef]
  9. Cui, Z.; Tian, Z.; Zhang, Y.; Bi, Z.; Fu, S. Study on real time 3D imaging of streak tube lidar based on LabVIEW. Optik 2018, 157, 768–773. [Google Scholar] [CrossRef]
  10. Tian, L.; Li, L.; Wen, W.; Xang, X.; Chen, P.; Lu, L.; Wang, J.-F.; Zhao, W.; Tian, J.-S. Numerical calculation and experimental study on the small-size streak tube. Acta Phys. Sin. 2018, 67, 188501. [Google Scholar] [CrossRef]
  11. Hui, D.; Luo, D.; Tian, L.; Lu, Y.; Chen, P.; Wang, J.; Sai, X.; Wen, W.; Wang, X.; Xin, L.; et al. A compact large-format streak tube for imaging lidar. Rev. Sci. Instrum. 2018, 89, 045113. [Google Scholar] [CrossRef]
  12. Fang, M.; Qiao, K.; Yin, F.; Xue, Y.; Chang, Y.; Su, C.; Wang, Z.; Tian, J.; Wang, X. Streak tube imaging lidar with kilohertz laser pulses and few-photons detection capability. Opt. Express 2024, 32, 19042–19056. [Google Scholar] [CrossRef]
  13. Li, H.; Xue, Y.; Tian, J.; Li, S.; Wang, J.; Chen, P.; Tian, L.; He, J.; Zhang, M.; Liu, B. A large-format streak tube for compressed ultrafast photography. Rev. Sci. Instrum. 2022, 93, 113303. [Google Scholar] [CrossRef] [PubMed]
  14. Zhang, Y.; Tian, J.; Xue, Y.; Li, Z.; Li, S.; Wang, J.; Liu, B.; Gao, G.; Chen, P.; Wang, X.; et al. High-gain Ultra-small Streak Camera and Its Integrated Control System. Acta Photonica Sin. 2022, 51, 1032003. [Google Scholar]
  15. Guo, S.; Li, W.; Lai, Z.; Han, S.; Zhai, Y.; Liu, F. Differential optical-path approach to improving the performance of Multiple-Slit Streak Tube Imaging LiDAR. Measurement 2021, 172, 108947. [Google Scholar] [CrossRef]
  16. Li, W.; Guo, S.; Zhai, Y.; Liu, F.; Lai, Z.; Han, S. Denoising of the multi-slit streak tube imaging LiDAR system using a faster non-local mean method. Appl. Opt. 2021, 60, 10520–10528. [Google Scholar] [CrossRef]
  17. Luo, T.; Fan, R.; Chen, Z.; Wang, X.; Dong, C.; Chen, D. Comparison of four deblurring methods for streak image of streak tube imaging lidar. OSA Contin. 2020, 3, 2863–2879. [Google Scholar] [CrossRef]
  18. Yuan, Q.; Niu, L.; Hu, C.; Wu, L.; Yang, H.; Yu, B. Target 3-D reconstruction of streak tube imaging lidar based on Gaussian fitting. In Fourth Seminar on Novel Optoelectronic Detection Technology and Application; Proceedings Volume 10697; SPIE: Bellingham, WA, USA, 2018; p. 106970R. [Google Scholar]
  19. Dong, Z.; Sun, L.; Tan, S.; Xu, T.; Gao, R.; Chen, D. Homogenization research of waveform sampling LiDAR point cloud data. In Three-Dimensional Image Acquisition and Display Technology and Applications; Proceedings Volume 10845; SPIE: Bellingham, WA, USA, 2018; p. 1084502. [Google Scholar]
  20. Shen, H.; Dong, Z.; Yan, Y.; Fan, R.; Jiang, Y.; Chen, Z.; Chen, D. Building roof extraction from ASTIL echo images applying OSA-YOLOv5s. Appl. Opt. 2022, 61, 2923–2928. [Google Scholar] [CrossRef]
  21. Ye, G.; Fan, R.; Lu, W.; Dong, Z.; Li, X.; He, P.; Chen, D. Depth resolution improvement of streak tube imaging lidar using optimal signal width. Opt. Eng. 2016, 55, 103112. [Google Scholar] [CrossRef]
  22. Bi, Z.; Cui, Z.; Zhang, Y.; Tian, Z. Design of precise delay system for streak tube imaging lidar. Opt. Eng. 2018, 57, 124104. [Google Scholar] [CrossRef]
  23. Hui, D.; Tian, J.; Lu, Y.; Wang, J.; Wen, W.; Liang, L.; Chen, L. Temporal distortion analysis of the streak tube. Acta Phys. Sin. 2016, 65, 158502. [Google Scholar]
  24. Chen, Z.; Shao, F.; Fan, Z.; Wang, X.; Dong, C.; Dong, Z.; Fan, R.; Chen, D. A Calibration Method for Time Dimension and Space Dimension of Streak Tube Imaging Lidar. Appl. Sci. 2023, 13, 10042. [Google Scholar] [CrossRef]
  25. Ye, G.; Fan, R.; Chen, Z.; Yuan, W.; Chen, D.; He, P. Range accuracy analysis of streak tube imaging lidar systems. Opt. Commun. 2016, 360, 7–14. [Google Scholar] [CrossRef]
  26. Wang, X.; Chen, Z.; Dong, C.; Dong, Z.; Chen, D.; Fan, R. High Accuracy Reconstruction of Airborne Streak Tube Imaging LiDAR Using Particle Swarm Optimization. Appl. Sci. 2024, 14, 6843. [Google Scholar] [CrossRef]
Figure 1. Structure of the STIL system. The red line represents the 1064 nm laser, and the green line represents the frequency-doubled 532 nm laser.
Applsci 14 08835 g001
Figure 2. Schematic diagram of the streak camera imaging principle: (a) composition of the streak camera; (b) after triggering, the signal is deflected and imaged on the phosphor screen; (c) output of the 2D streak image.
Applsci 14 08835 g002
Figure 3. Reflected spots of laser pulses from targets at different distances: (a) elliptical Gaussian laser spot formation on a target building at 1 km; (b) schematic of target building and STIL system positioning for long-range ranging at 6 km; (c) incomplete reflection of laser spot on test target building at 6 km.
Applsci 14 08835 g003
Figure 4. Laser spot images of a target surface at a 6 km distance captured by a CCD camera (false color): (a) raw image with projection distortion; (b) image after projection correction; (c) image region with a pixel spatial resolution of 4.3 mm/pixel and a calculated spot width of 0.66 m.
Applsci 14 08835 g004
Figure 5. Streak images captured by the STIL system: (a) raw streak image (512 × 1024 pixels) of the target in 6 km; (b) ROI (100 × 100 pixels) of the laser spot: the dashed line indicates the row of the ROI used for range accuracy verification, with red dots marking the centroid feature point extracted.
Applsci 14 08835 g005
Figure 6. TDC measured timing: Channel 1 measures the t o p t i c a l _ t r i g g e r 1 = 0.70 ns); Channel 2 measures the t s t r e a k _ c a m e r a _ t r i g g e r 2 = 48 ps); the time difference representing the Δ t t r i g g e r (σ = 0.70 ns).
Applsci 14 08835 g006
Figure 7. Normalized histogram of t r a n g e * , with an average measurement time of 38,785.6 ns (d* = 5817 m) and a standard deviation of 0.65 ns (σd = 0.1 m).
Applsci 14 08835 g007
Table 1. Waveform time dimension feature point extraction results.
AlgorithmExtreme
Value
Threshold
Averaging
Gaussian
Fitting
Centeroid
Time ComplexityO(n)O(n) O ( n log n )~O(n2)O(n)
Standard deviation (pixels)2.921.641.420.78
Table 2. The STIL 6 km target ranging results (6000 frames).
Ranging Data Δ t s t r e a k _ e c h o Δ t t r i g g e r t r a n g e *
Mean value (ns)46.338,739.338,785.6
Standard deviation (ns)0.930.700.65
Disclaimer/Publisher’s Note: The statements, opinions and data contained in all publications are solely those of the individual author(s) and contributor(s) and not of MDPI and/or the editor(s). MDPI and/or the editor(s) disclaim responsibility for any injury to people or property resulting from any ideas, methods, instructions or products referred to in the content.

