Abstract
Smart meters monitor hourly water consumption patterns while reducing the cost and inconvenience of traditional meters. This study comprehensively analyzes 1871 households that previously used traditional meters from the distribution point to the distribution area. All the households were equipped with smart meters and the data collected were used for analysis. On the basis of the total estimated water consumption, 227 households were classified as single households. These households were further classified into single-worker and -nonworker households. This study analyzed smart meter data to evaluate the timings and amounts of water consumption peaks. The results indicate that worker households peaked at 8:00, with 29 L/h of consumption on weekdays, and peaked again on evenings at 20:00–21:00, averaging 32 L/h. For nonworker households, the peak occurred at 9:00, with 20 L/h, with no major changes in the afternoon, and a second peak occurred at 19:00–20:00 in evening, with an average of 19 L/h. Moreover, worker households peaked at 8:00 and 20:00 on weekdays, and at 9:00 and 19:00 on weekends. It was revealed that worker households consume 10% more on weekends than on weekdays, and 262% more from 13:00 to 16:00. These findings may assist in water supply planning by supporting distribution schedules on the basis of peak household consumption, leading to more helpful resource management.
1. Introduction
Water consumption has become important in urban areas in recent years because of efforts to conserve water resources [1]. Water meters are used to measure water consumption efficiently; however, manual meters require users to travel periodically and manually record water consumption, which can be costly and inconvenient [2]. This technique contrasts with periodic metering, where daily water consumption is approximated for calculating consumption rates or planning purposes. Automated technology for monitoring and reviewing water consumption offers advantages to both water authorities and consumers while also enabling the implementation of demand management plants [3,4,5].
The widespread adoption of smart water meters represents a notable research opportunity and management tool. These meters serve as visual shows for household water consumption, allow homeowners to take control of their water consumption, and facilitate the implementation of a wider display of planning mechanisms [6,7]. Extensive research has been undertaken to obtain a deeper understanding of residential water consumption [8,9,10]. Research has shown significant variations in water consumption among households. It is imperative to consider this change in household water consumption to make precise water demand predictions and conduct effective assessments of supply and demand balance across various physical scales, particularly at the individual household level [11]. As household water consumption has gradually increased over the past decade, it is necessary to examine trends, patterns, and statistical metrics related to water consumption, and to identify potential influencing factors, such as housing types. To promote sustainable urbanization, water supply facilities must be matched to the continuously updated water demands [12,13].
This study provides the basis for the progress of smart water meter technology, allowing for the instant transmission of recorded water consumption data via real-time communication [14,15]. Furthermore, the introduction of smart water meters has enabled households to monitor their water consumption. These meters allow for the automatic acquisition, collection, and communication of real-time water consumption readings [4,16]. By offering high-resolution and regular data on water consumption, smart water meters can measure the volume of water consumed during a given time period [17]. Additionally, with IoTs rapidly advancing, numerous smart demand meters now monitor water consumption and other relevant parameters [18]. Smart water meters monitor water flow, distribution, and consumption, provide real-time access to water consumption data, and improve water efficiency [19,20]. A comprehensive analysis identified 75 benefits linked with smart water meters, 57 of which benefit water utilities, 40 of which benefit customers, and 22 of which are cross-benefits [21]. Smart water meters are a vital method for water utilities to advance a comprehensive understanding of urban water consumption; they record water consumption data every 30 min [22,23]. By using a smart water meter, we can analyze household water consumption patterns during water events, revealing that households respond more strongly to the threat of water restrictions [24].
Most smart water meters are installed in regions such as Australia, North America, Europe, the Middle East, and Asia [21,25,26]. Research by Cominola et al. used smart meter data from 327 households in Southeast Queensland and Melbourne, Australia, to identify specific water consumption behaviors such as showering, laundry, and irrigation. The analysis revealed notable differences in both the timing and intensity of water consumption across households [27]. This provides utilities with valuable insights into consumption patterns. These findings can be used in the development of tailored demand management and the promotion of more effective water conservation efforts. Moreover, several factors are linked to household water consumption, as studies conducted over the past decade indicate that the number of residents in a household influences water consumption [28,29,30,31]. Several studies have specifically examined the effects of calendar factors on the water consumption of households [32,33,34,35,36].
The study city managed water consumption by reading water meters at each household every two months. To obtain more updates on residential water demand, the district with the provision of smart water metering for electricity has installed smart water meters at all households; hence, the metering values are more updated than the 2-month data. This study analyzes variations in water consumption through households, consumers, and periods in which smart water meters are used and influence water consumption patterns. In addition, it provides useful information for water utilities, and they can be more understandable in terms of residential water consumption patterns.
This research focuses on the impact of water consumption within single households, with a particular focus on how smart water meters are integrated into the daily lives of households, how residents interact with these meters, and their impact on water consumption services at the district scale. Therefore, the integration of smart water meter data into distribution systems provides valuable evidence for advancing digital water technologies and improving consumption management. In addition, these findings may contribute to enhancing resource management by distributing schedules around peak household consumption to support water supply planning. The primary objective of this study is to evaluate water consumption on the basis of smart water meter data to understand household water consumption behavior.
2. Materials and Methods
2.1. Study Area
This study focused on the Chibata district in the northern part of Kosai city in Shizuka Prefecture, Japan. According to a report by the Japan Meteorological Agency, Kosai city’s climate at the beginning of autumn in September has temperatures ranging from 22.9 to 29.8 °C, with an average of 25.9 °C, suggesting a moderately hot climate. While August is the warmest month with an average temperature of 32.3 °C, January is the coolest month with an average temperature of 5.6 °C. According to the 2019 census, Chibata district has a population of 5200 across approximately 1900 households. However, the population declined by 4% between 2010 and 2019, decreasing the demand for water consumption. The Chibata water distribution plant boasts a capacity of 2000 m3/day.
The water supply in this area was obtained from the amount of water used in each household every two months. After the smart water meters were installed, the water supply was recorded hourly, providing data throughout the 24 h. Water meters are installed in front of each house in the Chibata district. Each water meter includes a sensor that can record hourly water consumption. The meters transmit the water consumption data to the electricity network. The meters were designed to collect and transmit data wirelessly, enabling efficient automatic monitoring in this area. The application of smart water meters aligns with IoT-based infrastructure management, enabling real-time data collection and efficient monitoring [37]. The implementation of smart water meters in all households within the water distribution area of the Chibata district represents a pioneering initiative aimed at automating meter readings and proposing helpful monitoring systems for the water consumption of each household.
2.2. Data Collection
The Chibata district water distribution plant provided 1871 households with data from smart water meters for this study, including hourly and daily water readings. The data covered a monthly period from 1 to 30 September 2022. Furthermore, additional details, such as the ID numbers related to each household, were shared, facilitating the analysis of smart water meter data and hourly water consumption volume. However, information on the number of households and types per household is unavailable.
2.3. Data Analysis
By analyzing the water consumption of households during the target periods, we can obtain an understanding of the differences in water consumption patterns among different households. These data are important for understanding the various water consumption patterns and behaviors displayed by various types of households. To evaluate water consumption, one-way ANOVA, and t-test analysis were used [38,39]. The probability (p) is compared by the following metrics: p < 0.05, p < 0.01, and p < 0.001. These ratings indicate whether consumption data are robust or highly significant.
3. Results
3.1. Temporal Trends in Water Consumption among All Households
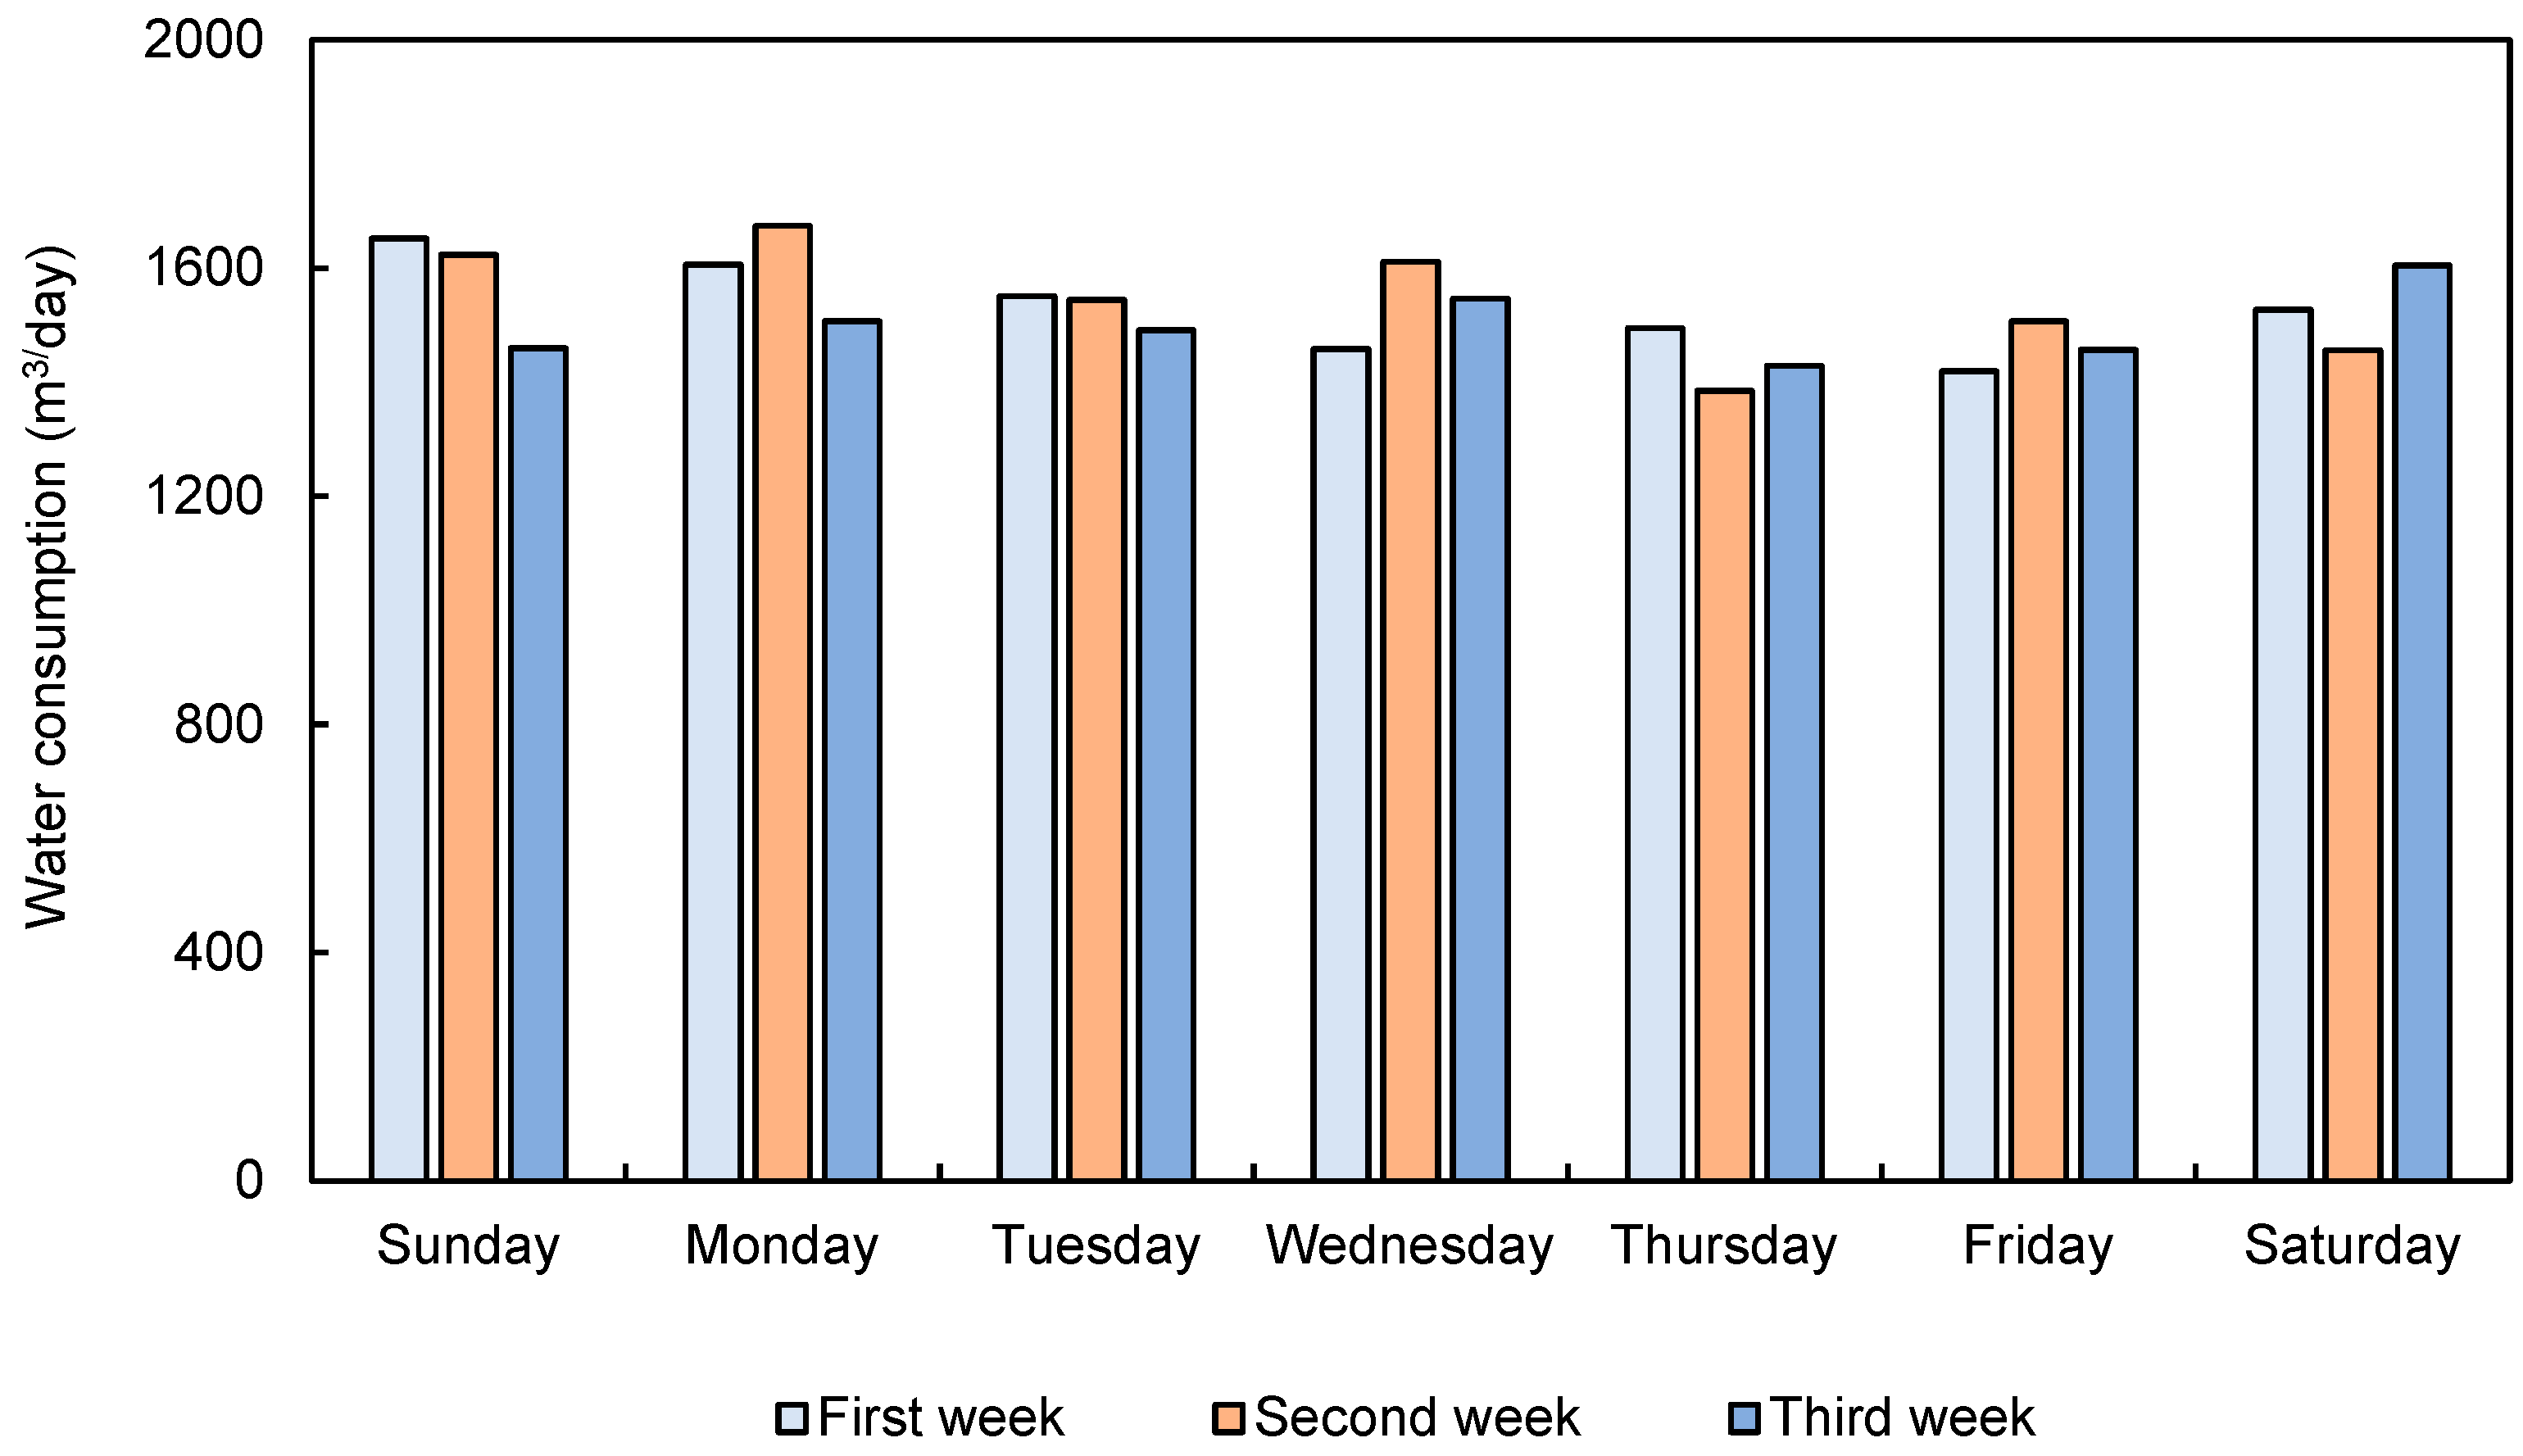
Smart water meter data were chosen for three weeks (Monday through Sunday) in September 2022, the first week from the 5th to 11th, the second week from the 12th to 18th, and the third week from the 19th to 25th. A duration of three weeks was chosen to obtain water consumption patterns on weekdays and weekends. This duration also allowed this study to observe fluctuations in household routines and determine the categorization of each household. Figure 1 shows the average daily consumption of all 1871 households in the district for seven days of three weeks. The highest consumption was an average of 1596 m3/day for Monday, whereas the lowest consumption was approximately 1436 m3/day for Thursday. Both the highest and the lowest consumption rates occurred on weekdays, but the average daily water consumption was higher on weekends than on weekdays. On weekends, Sundays had a higher value than Saturdays and were closer to the average. A one-way ANOVA test was run over three weeks. ANOVA confirmed that there was no significant difference in daily water consumption among the first, second, and third weeks (F = 1.88, p = 0.53 > 0.05).
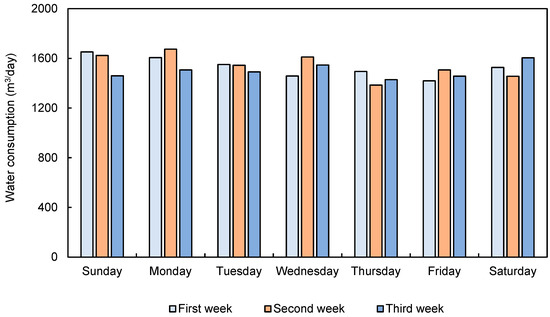
Figure 1.
Total weekly water consumption in the Chibata district of 1871 households in September 2022.
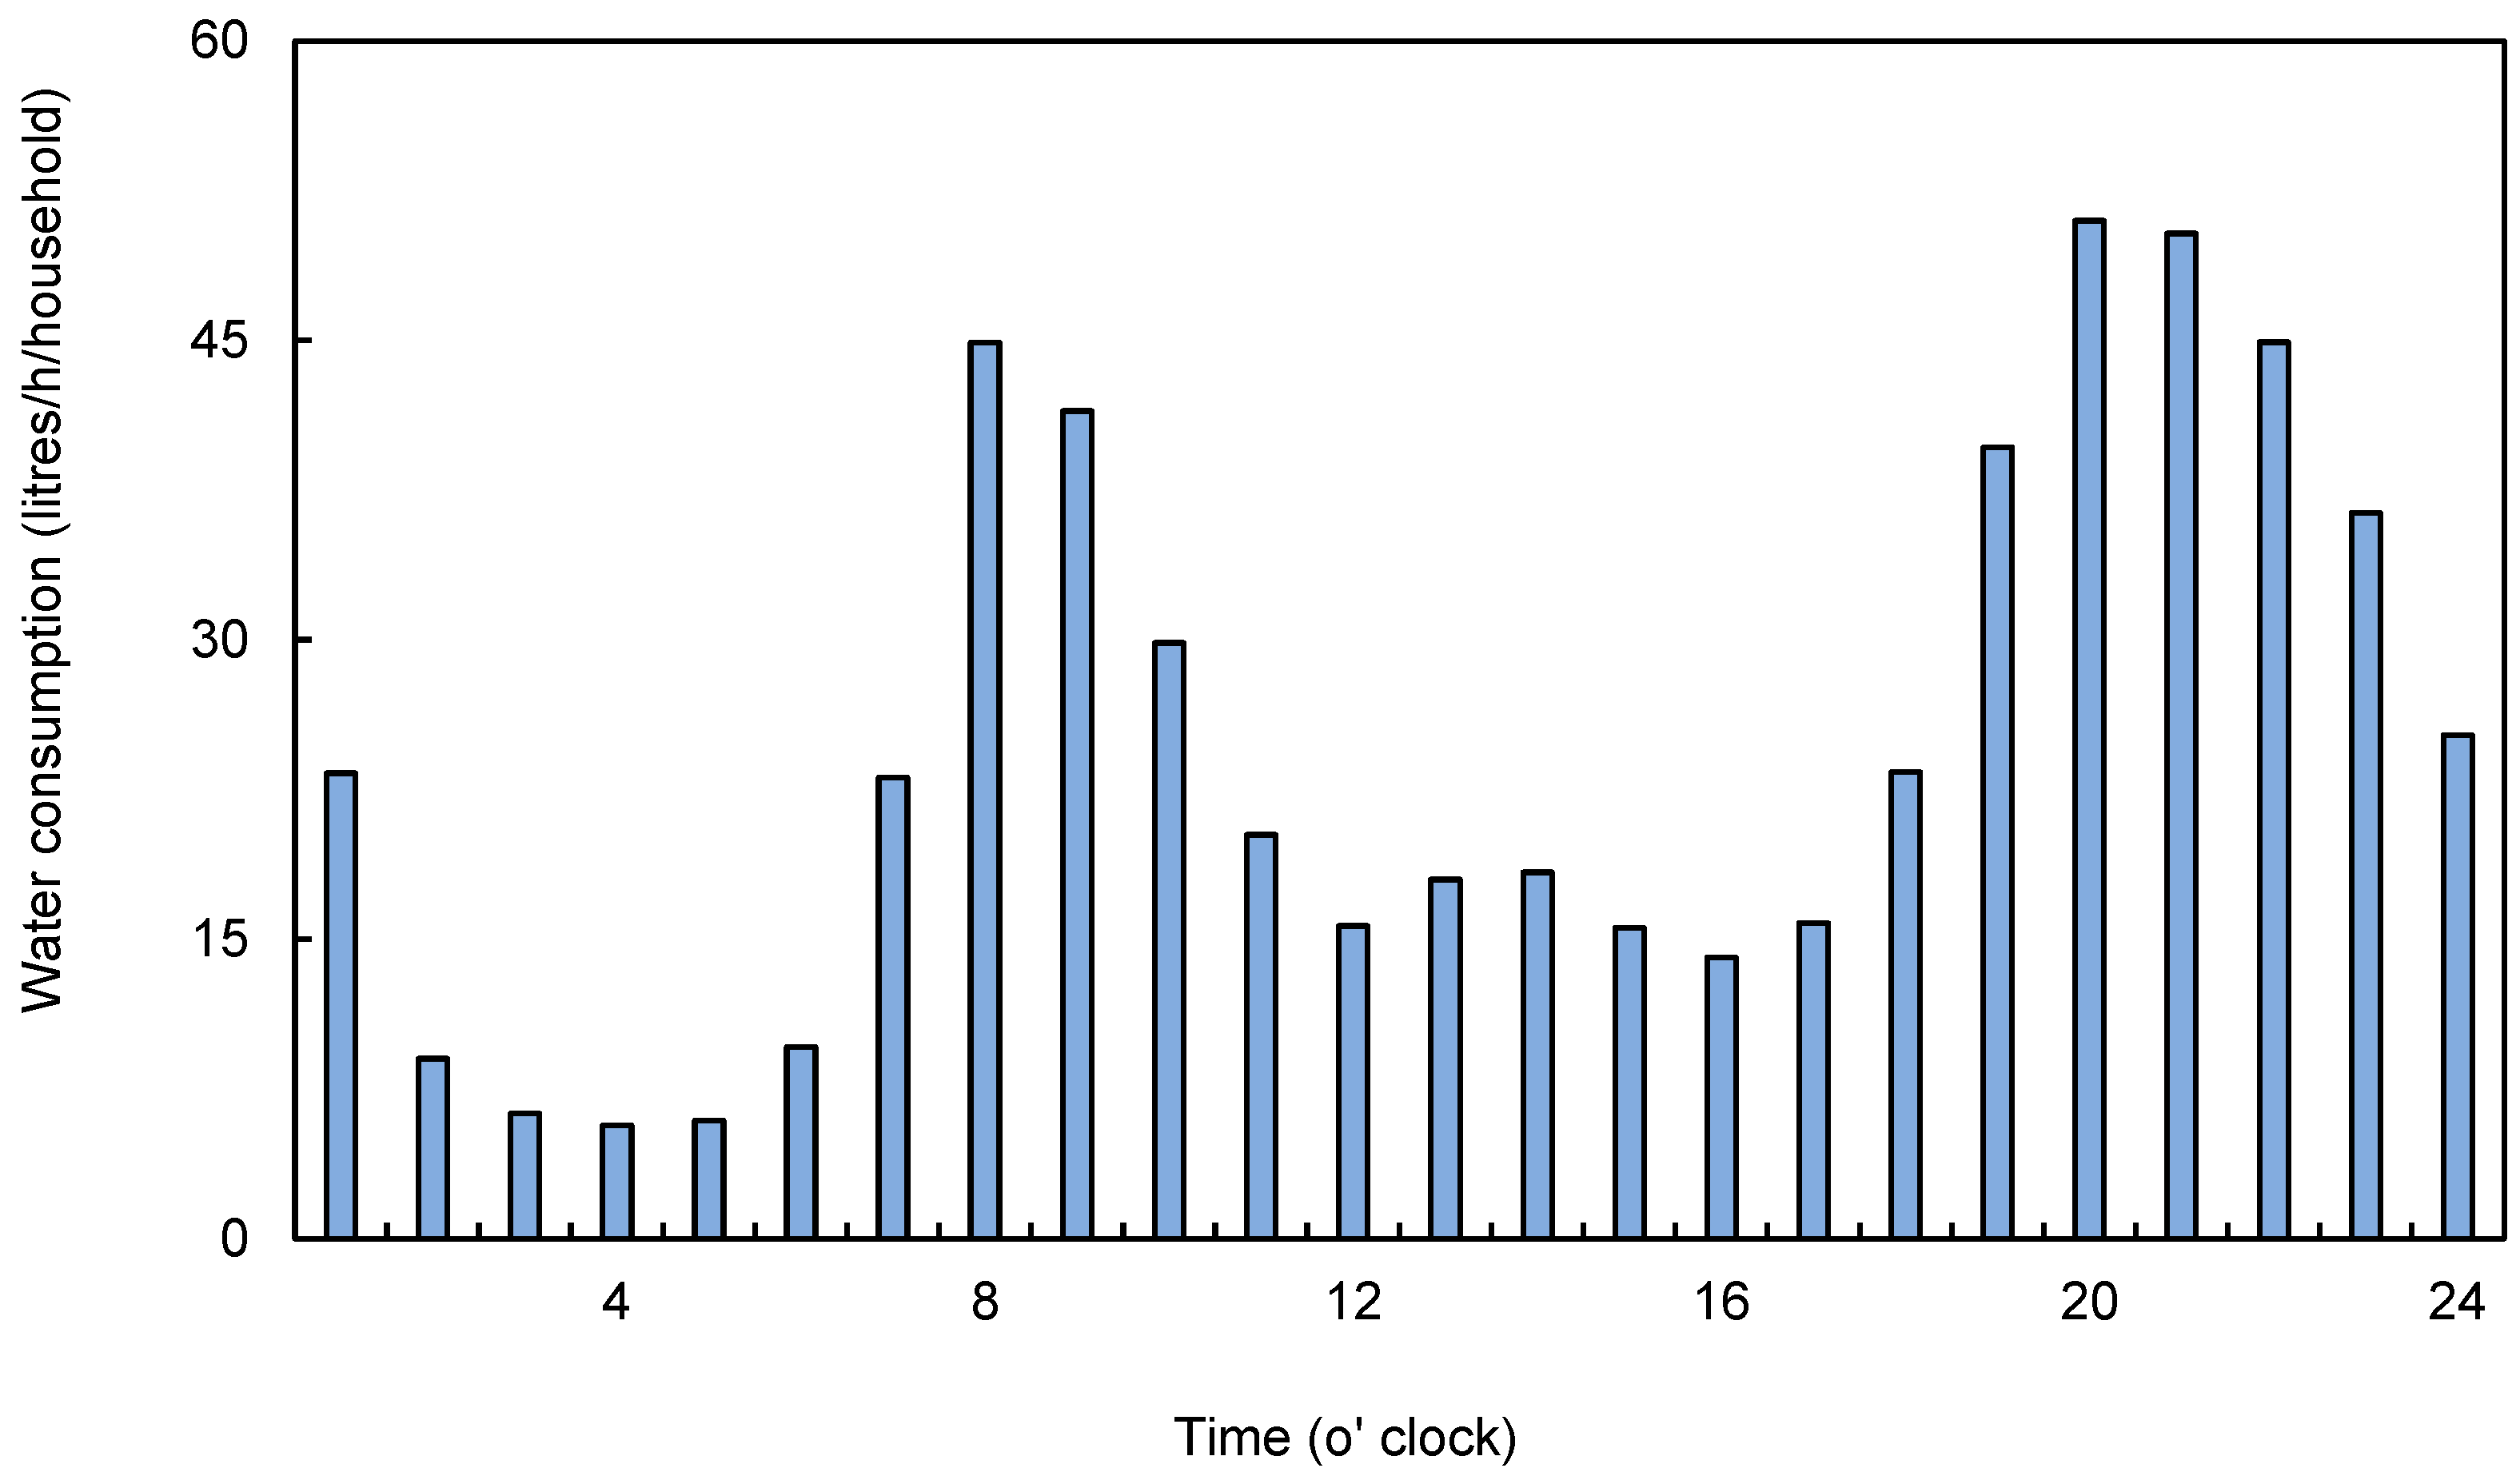
Water consumption levels typically vary among households on weekdays (Figure 2). Water consumption was monitored on Tuesdays and exhibited a fluctuating pattern, often associated with users’ daily routines. The peak water consumption was within an average of 36 L/h from 7:00 to 9:00 in the morning hours. Typically, water consumption for 3 h increases in the morning due to individual activities, as people often begin their day with general hydration by preparing breakfast, a common part of their daily routine. Water consumption decreases during the day until the late afternoon at 17:00, averaging 16 L/h; consumption then starts to increase again due to individuals’ activities in the evening at approximately 19:00–22:00, averaging 46 L/h. The average daily water consumed over 24 h was 587 L/day. The difference in the consumed water between the evening and morning hours was approximately 10 L/h. The peak water consumption in the evening instead of the morning peaks occurs because daily activities, such as showering, cooking, and other routines, typically occur during evening hours. Additionally, the time spent consuming water in the morning is typically much shorter than that in the evening. In the morning, households are usually busy preparing for the day, which limits the available time for consumption. Additionally, many households engage in similar activities during this time, leading to almost concurrent water consumption. In contrast, various activities compete for water consumption during the evening, leading to longer and more varied individual activities that consume water. The evening peaks might also be related to Japanese evening bathing culture.

Figure 2.
Hourly water consumption of 1871 households in the Chibata district on weekdays.
3.2. Categorization of Single Households by Smart Water Meter Data
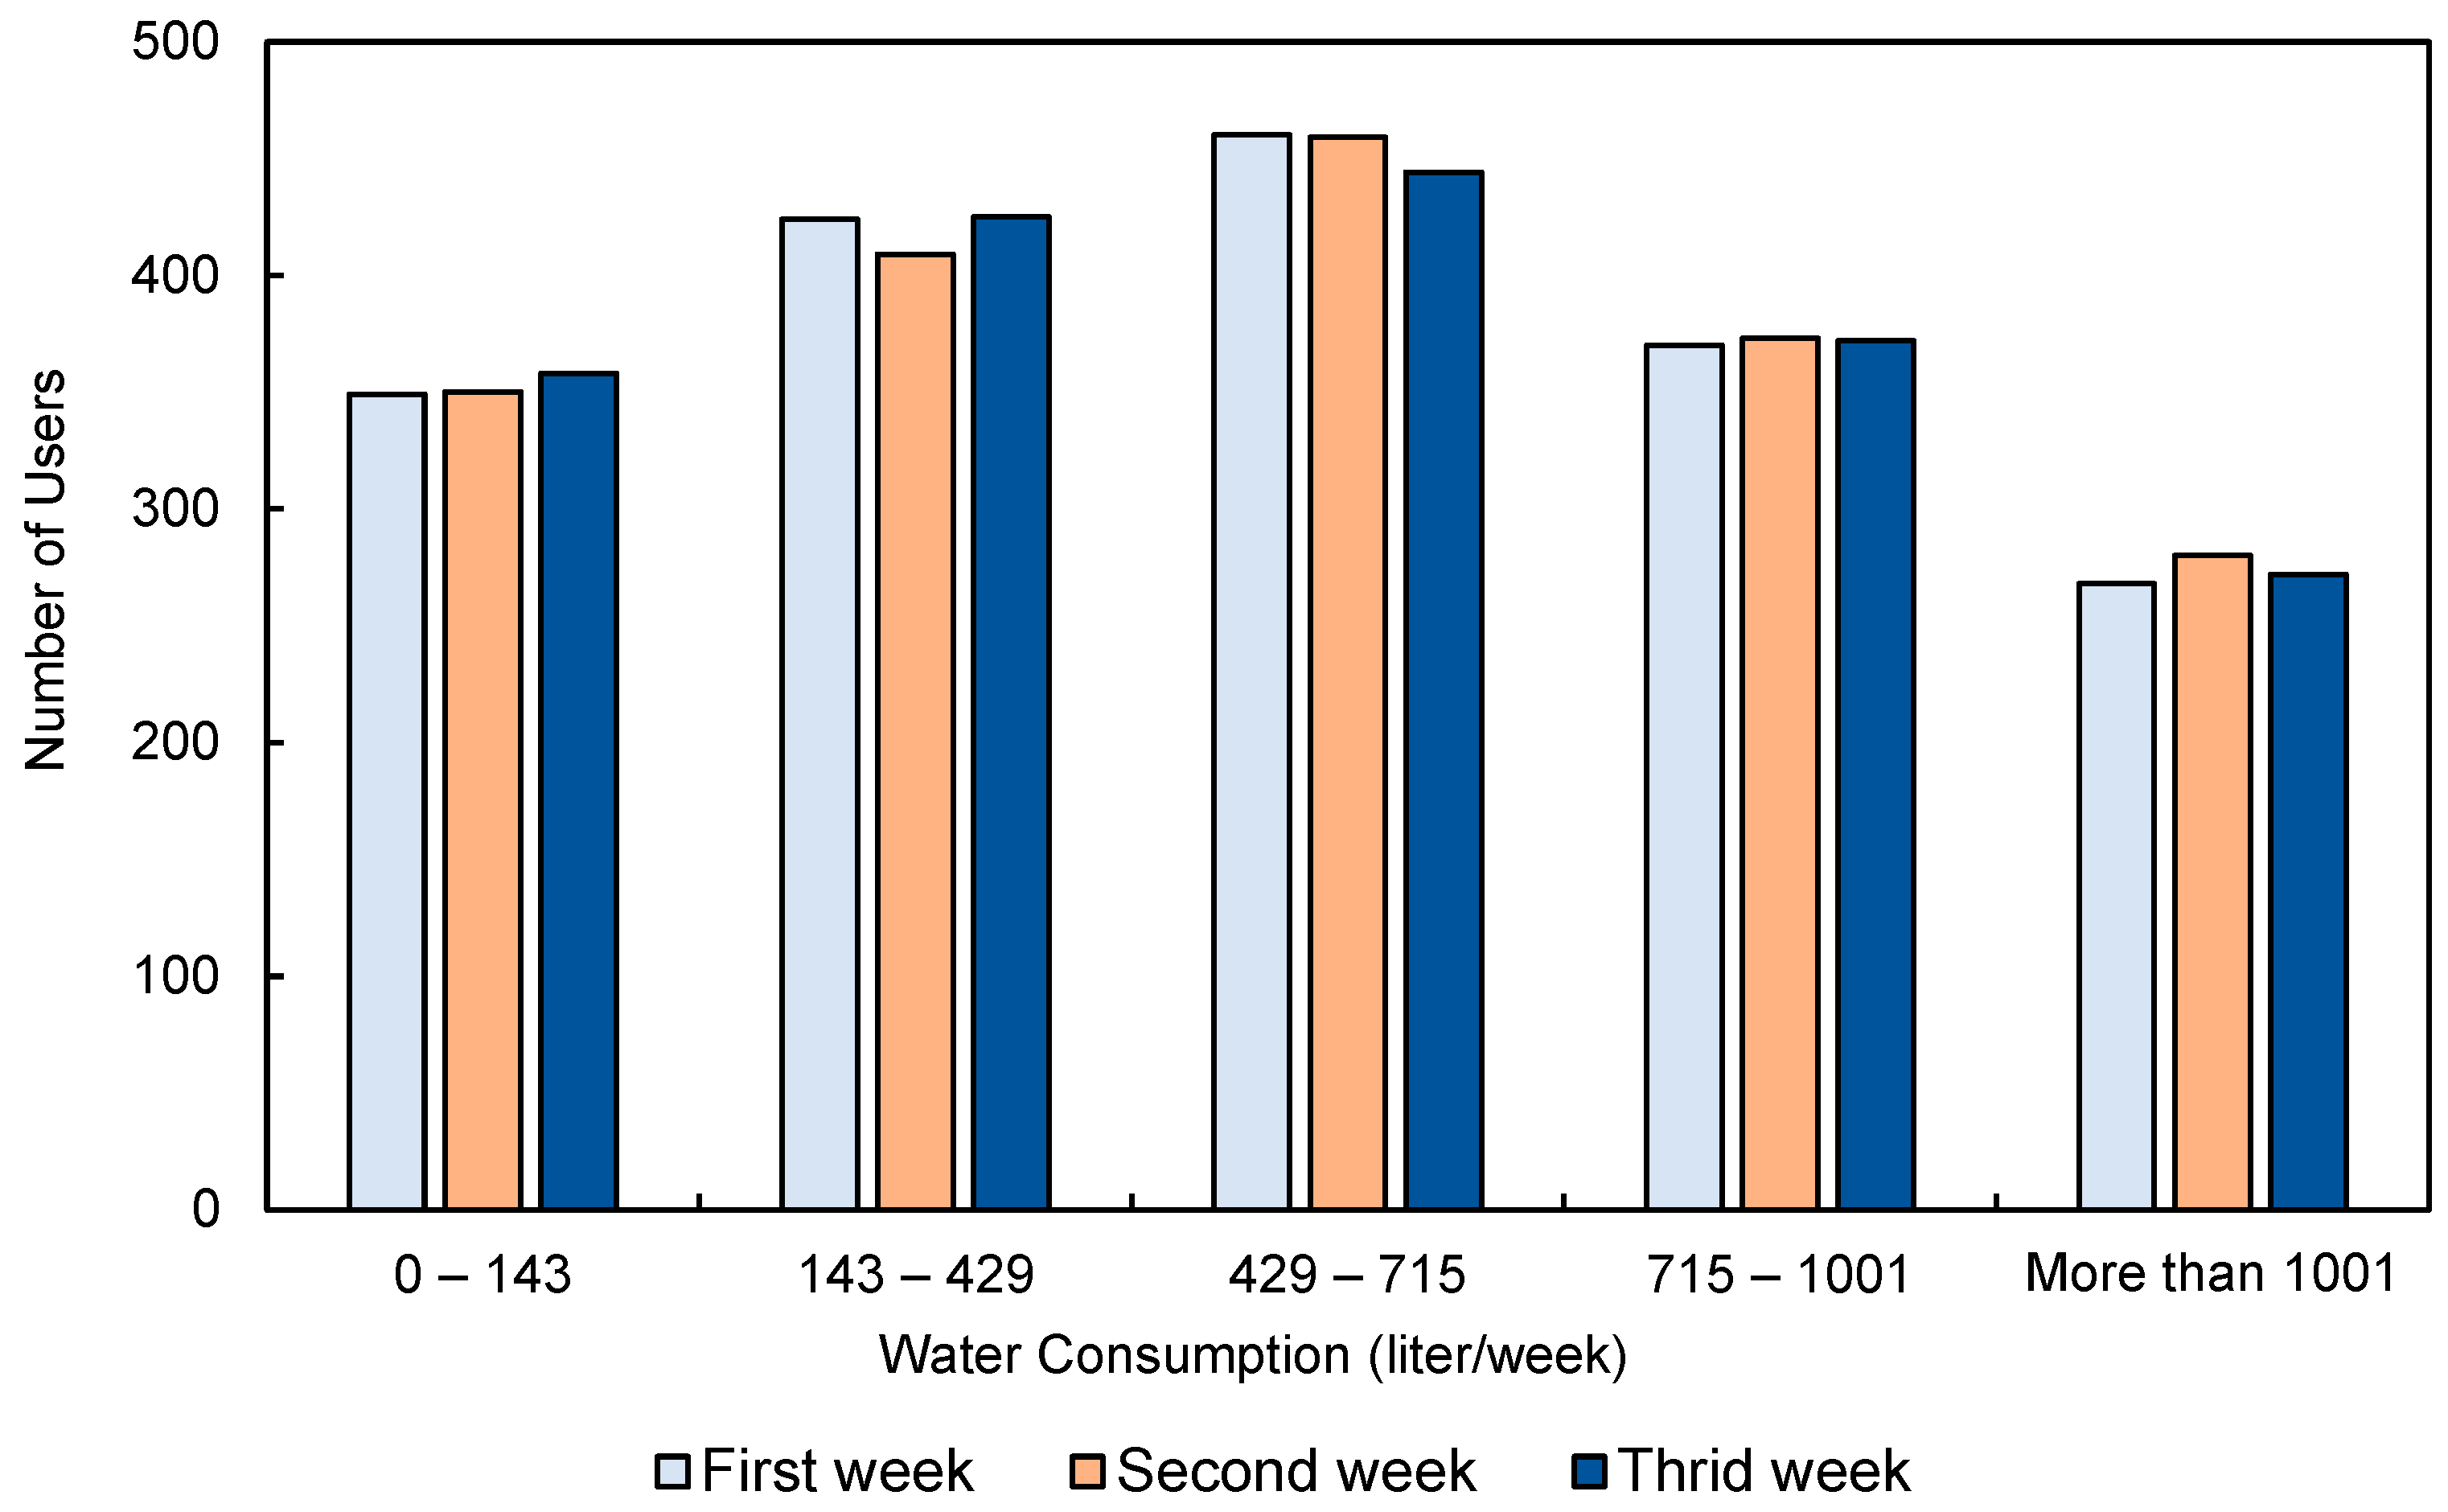
According to the Tokyo Metropolitan Waterworks Bureau, a single person’s daily water consumption in Japan in 2002 was 245 L/day [40]. On the basis of a report by Statista 2019 [41], the amount of water consumed per person, including potable and nonportable water, was 286 L/day. A two-member household’s average daily water consumption was calculated as 286 L/day and doubled to 572 L/day. To distinguish between single- and two-member households, a level of 429 L, which was used, was calculated by averaging their respective average water consumption values. A ±143-L margin was applied to the average consumption to create an equitable range of water consumption. Consequently, for a single person, the minimum limit was 143 L and the maximum was 429 L, and for a household with two members, the minimum was 429 L and the maximum was 715 L. Therefore, the selection method may include a few two-member households, from 143–429 L/day, but most households are single households. Water consumption data were selected to differentiate between single households and total household data during the three weeks of September 2022. The smart water meter data were classified into five groups on the basis of household water consumption: 0–143, 143–429, 429–715, 715–100 L, and over 1001 L/day, as shown in Figure 3. This research exclusively concentrates on single households with a range of 143–429 L/day. This categorization helps determine the number of households with daily users on the basis of their water consumption over three weeks.
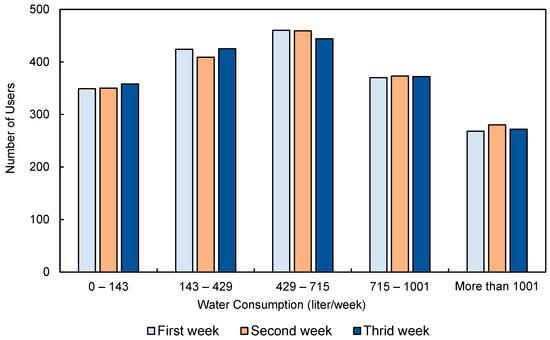
Figure 3.
Number of users in water consumption categories over three weeks.
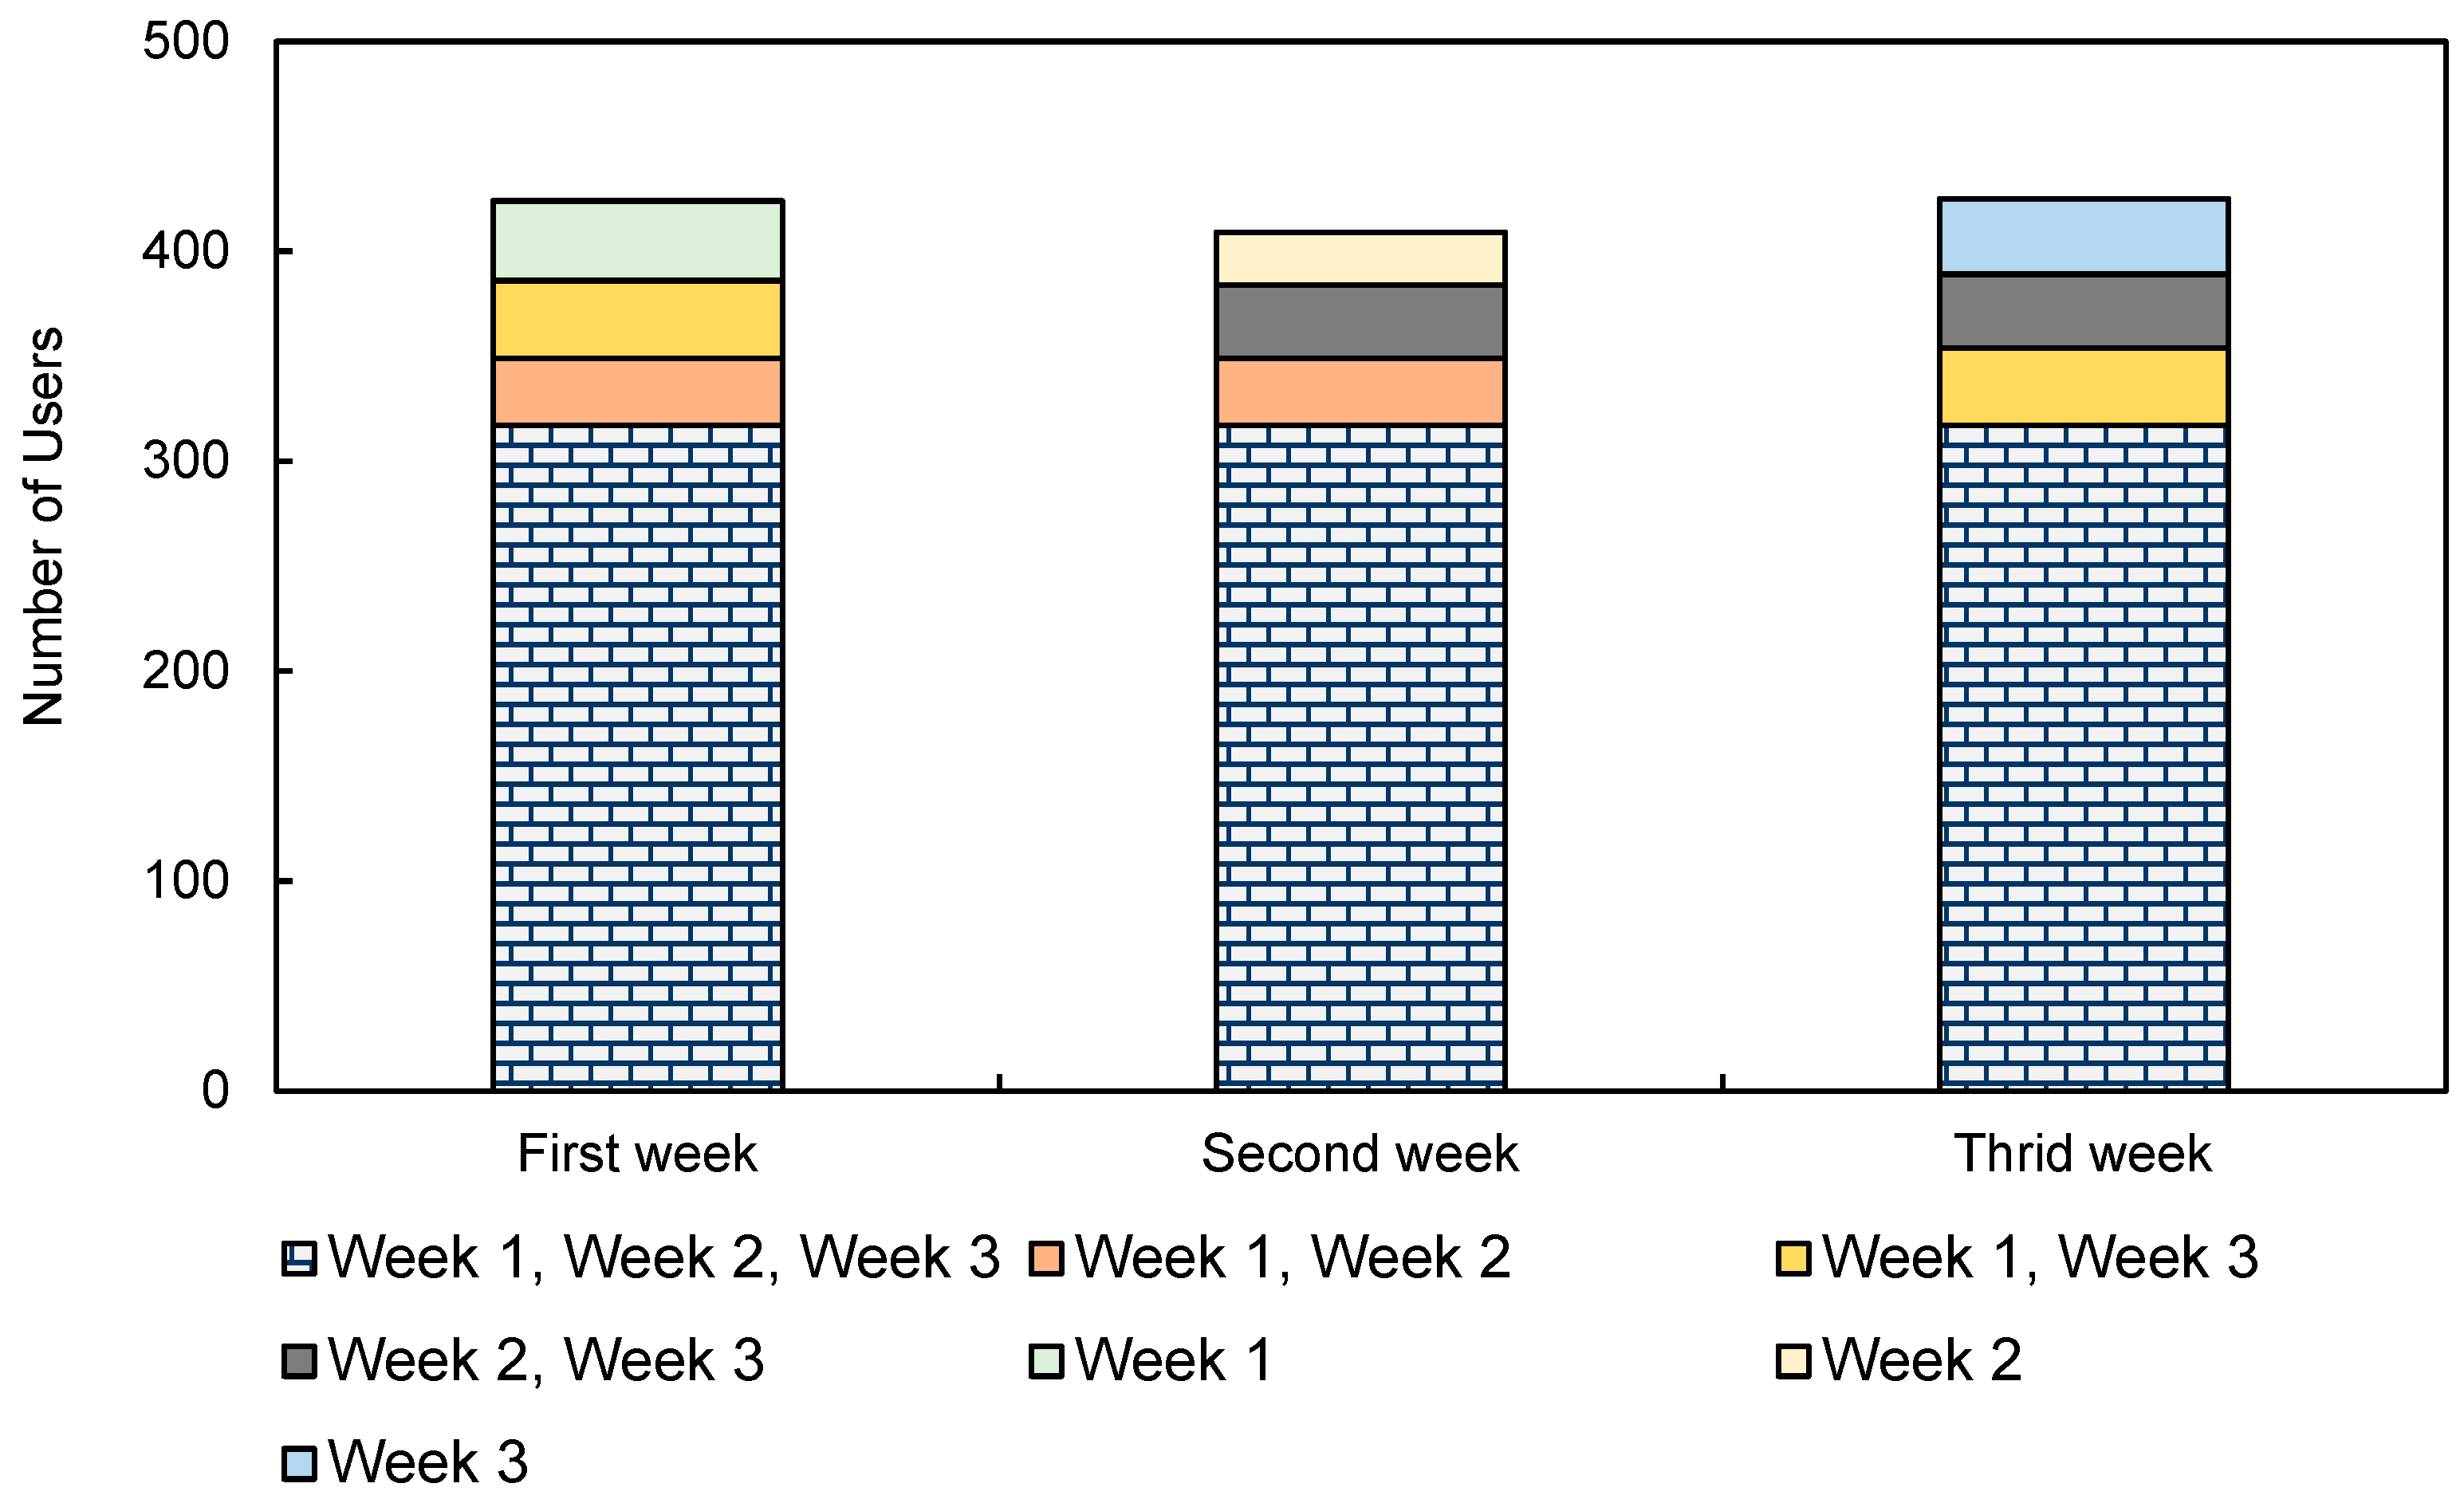
The total average water consumption over the three weeks exhibited significant variation, as shown in Figure 4. The lowest average consumption, totaling 1523 m3/day with 1% total water consumption, was observed among users in the 0–143 L/day range. The consumption reached 53,392 m3/day, 35%, which was recorded for users who consumed more than 1001 L/day. In contrast, the total water consumption of single households was 17,728 m3/day, accounting for 11% of the total water consumption. These findings emphasized the considerable differences in water consumption patterns among users during the three weeks. However, when comparing the three-week ranges of 143–429 L/day water consumption, it was observed that some household IDs did not include all three weeks. To analyze the water consumption behavior of single households as shown in Figure 5, the total number of single households and those that did not meet the target criteria during the observed weeks are depicted. In the dataset, three sections represent different weeks, each comprising a varying number of households. Across all three weeks, 317 households consistently participated. In the first section, consisting of 424 households, additional patterns emerged. In the second part, representing 409 households, 32 house-holds were present in the first and second weeks but not in the third week. Twenty-five households were absent during the first and third weeks and in the third part, which included all 425 households for the third week. Thirty-six households followed a similar pattern to those in the third week, and 37 households were present in the first and third weeks but not during the second week. Additionally, 36 households were present only in the third week. These patterns illustrate the varying levels of household participation across the three weeks of data collection. Therefore, 317 single households were selected after three weeks, all of which consistently consumed water within the range of 143–429 L/day. Then, we focused on our selection of single households that displayed this pattern over a maximum of three days from five weekdays (Monday–Friday). Hence, an analysis of single household water consumption during weekdays (Mondays–Fridays) relative to all households revealed that 227 households fell within the range (143–429 L/day) of single households during the target weekdays.
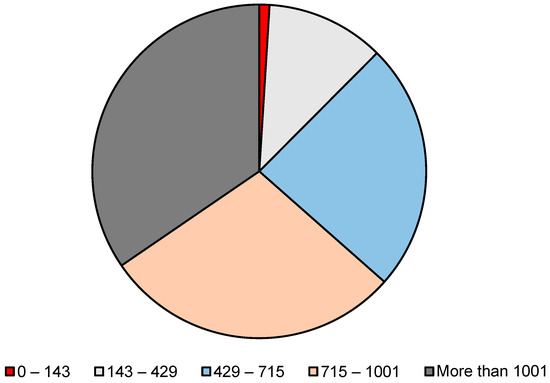
Figure 4.
Total water consumption by users over the three weeks.
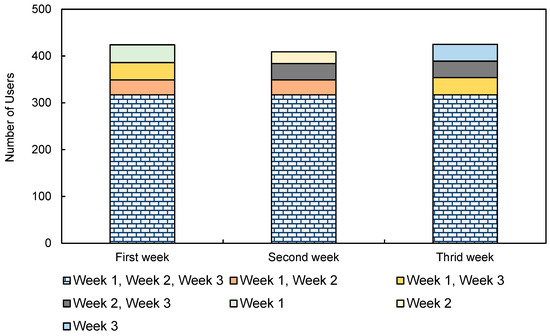
Figure 5.
Number of users who consumed between 143 and 429 L/day of water.
To better understand the behaviors of single-household water consumption, consumption patterns during weekdays (Monday–Friday) and weekends (Saturday–Sunday) were examined. The variation in water consumption behavior between weekdays and weekends is essential in water consumption behavior analysis. Tuesday was selected as a representative of weekdays because average daily water consumption closely approximates the weekday average (Mondays–Fridays), as shown in Figure 1. Fewer people work on Saturdays because some companies are often open on Saturdays in Japan; thus, Sundays were chosen to represent weekends. Hence, daily water consumption for each household was assessed over an extended timeframe, including four Tuesdays (6th, 13th, 20th, and 27th weekdays) and four Sundays (4th, 11th, 18th, and 25th weekends) in September 2022.
3.3. Analyzing Hourly Water Consumption, Demand Timings, and Behavior Activities between Single Households: Worker vs. Nonworker
The variations in water consumption among 227 single households on weekdays are shown in Figure 6. The peak occurred in the morning, at approximately 8:00–9:00, with an average of 25 L/h throughout the 2 h. Thus, the consumption rate gradually decreased until the late afternoon at 17:00, when the rate was 9 L/h. It then increased again until 22:00, at 20 L/h, and the total daily average consumption for 24 h periods was 295 L/day on Tuesdays. The water consumption of single households was examined. Identifying households with stable and predictable consumption patterns made it possible to analyze and make decisions on the basis of water consumption patterns and household types of single-worker and -nonworker households. Moreover, this categorization was performed separately for weekdays and weekends to account for potential variations in water consumption patterns, and these categories were established by identifying patterns and features that separate them.
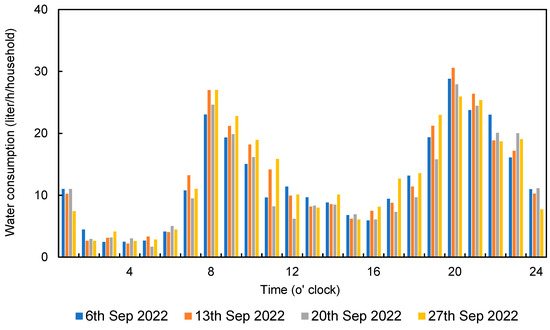
Figure 6.
Hourly water consumption among 227 single households on weekdays (6th, 13th, 20th, and 27th) in September 2022.
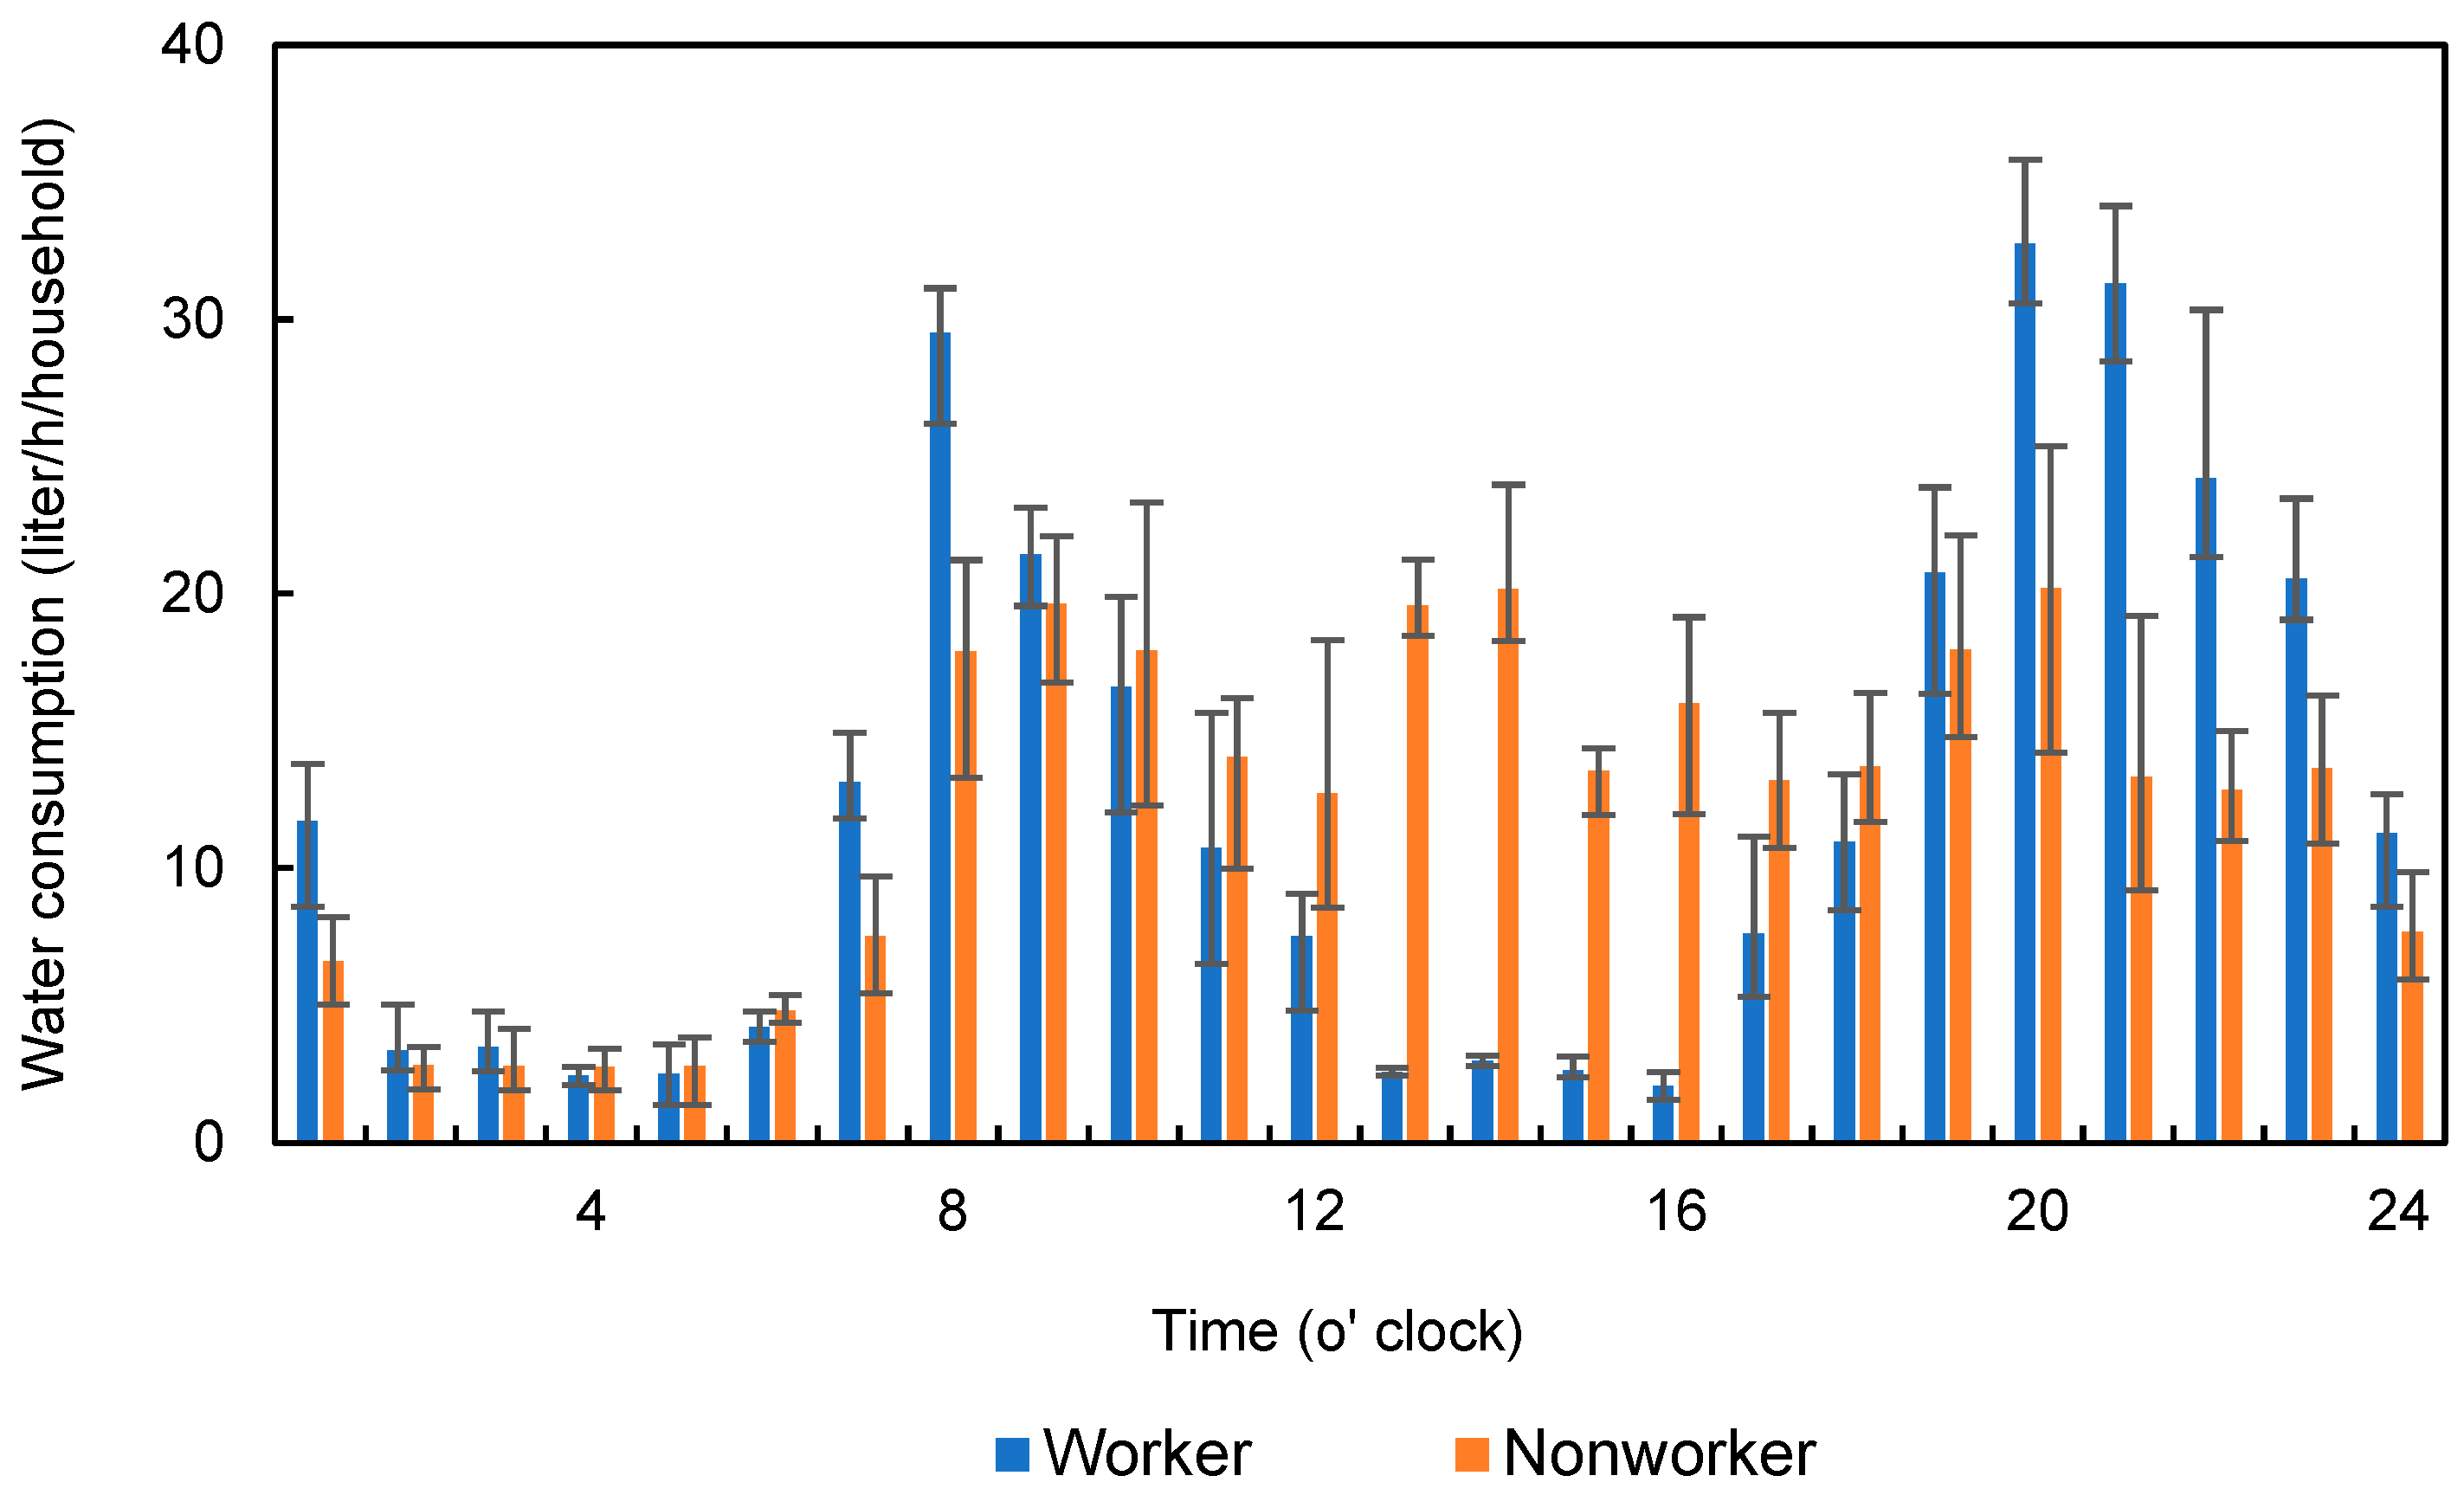
Indeed, single-worker households typically consume water during specific hours, such as early morning hours and evenings, when they are preparing for work or returning home on weekdays. Additionally, while working, the worker consumes no water during the week. Single-nonworker households consume water on the basis of leisure time during the day. Hence, by investigating over 24 h of data for each household and separating households, particularly on weekdays, the afternoon hours ranged from 13:00 to 16:00. During these hours, consumption is significantly lower, constituting less than 10% of the total daily water consumption of single-worker households. The results of this categorization revealed that for 227 single households in the Chibata district, comparisons were conducted by monitoring on Tuesdays (weekdays) with the number of workers in the households ranging from 141 to 153. Moreover, nonworker households consumed 10% more water in the afternoon than worker households did. Single-nonworker households included retirees, stay-at-home parents, and individuals not engaged in the workforce. These households’ water consumption routines and daily schedules exhibited considerable diversity and were influenced by their unique situations. The water consumption patterns observed in single-worker and -nonworker household types on weekdays are shown in Figure 7.

Figure 7.
Comparison of hourly water consumption among single-worker and -nonworker households on weekdays.
These patterns exhibit notable variations throughout the day, reflecting the influence of workers’ daily routines. Water consumption starts peaking at 7:00, with a consumption rate of 13 L/h, and the peak during the morning is at 8:00, when it reaches 29 L/day. In addition, a discernible peak period initiates at 7:00–10:00 in the morning, corresponding with the morning routine during these 4 h, and the average daily water consumption reaches 20 L/h. These peaks could be attributed to activities such as breakfast preparation, and other personal tasks that typically occur before individuals head to work. As workdays progress in single-worker households, there is a significant decrease in water consumption, which decreases to the early afternoon at 13:00, with an average of 2 L/h. In contrast, a notable increase in water consumption occurs again during the evening and night hours. These peaks begin at 19:00 and continue until 23:00, which are the evening and nightly peaks in consumption, with an average consumption of 26 L/h. Notably, the peaks occur during the evening hours at 20:00–21:00, averaging 32 L/day, primarily due to the resumption of household activities after work. These activities may include evening showers, dinner preparation, dishwashing, and other personal activities and domestic tasks. However, the water consumption patterns of nonworker households exhibit a slightly delayed increase in consumption, beginning at 8:00 in the morning with a water consumption rate of 18 L/h, and a peak in the morning at 9:00 with 20 L/day. Throughout the morning and into the early afternoon, water consumption in nonworker households remains relatively consistent because the occupants are actively present at home during these hours, engaging in activities such as preparing lunch, using the toilet, and personal tasks. Nonworker households tend to spend more time at home during weekdays since they do not have professional commitments that require them to leave, contributing to increased water consumption during these daytime hours. The peak during the evening period is from 19:00 to 20:00 with an average rate of 19 L/h. Interestingly, water consumption decreases during the evening, from 21:00, with 13 L/h. Conversely, their earlier bedtime habits contribute to reduced water consumption during the late evening hours. A t-test was run during the weekdays of worker and nonworker households. The statistical test confirmed that the periods in the afternoon from 13:00 to 16:00 (t = 2.35, p = 0.002 < 0.01) and in the evening from 20:00 to 23:00 (t = 1.71, p = 0.012 < 0.05) were highly significant.
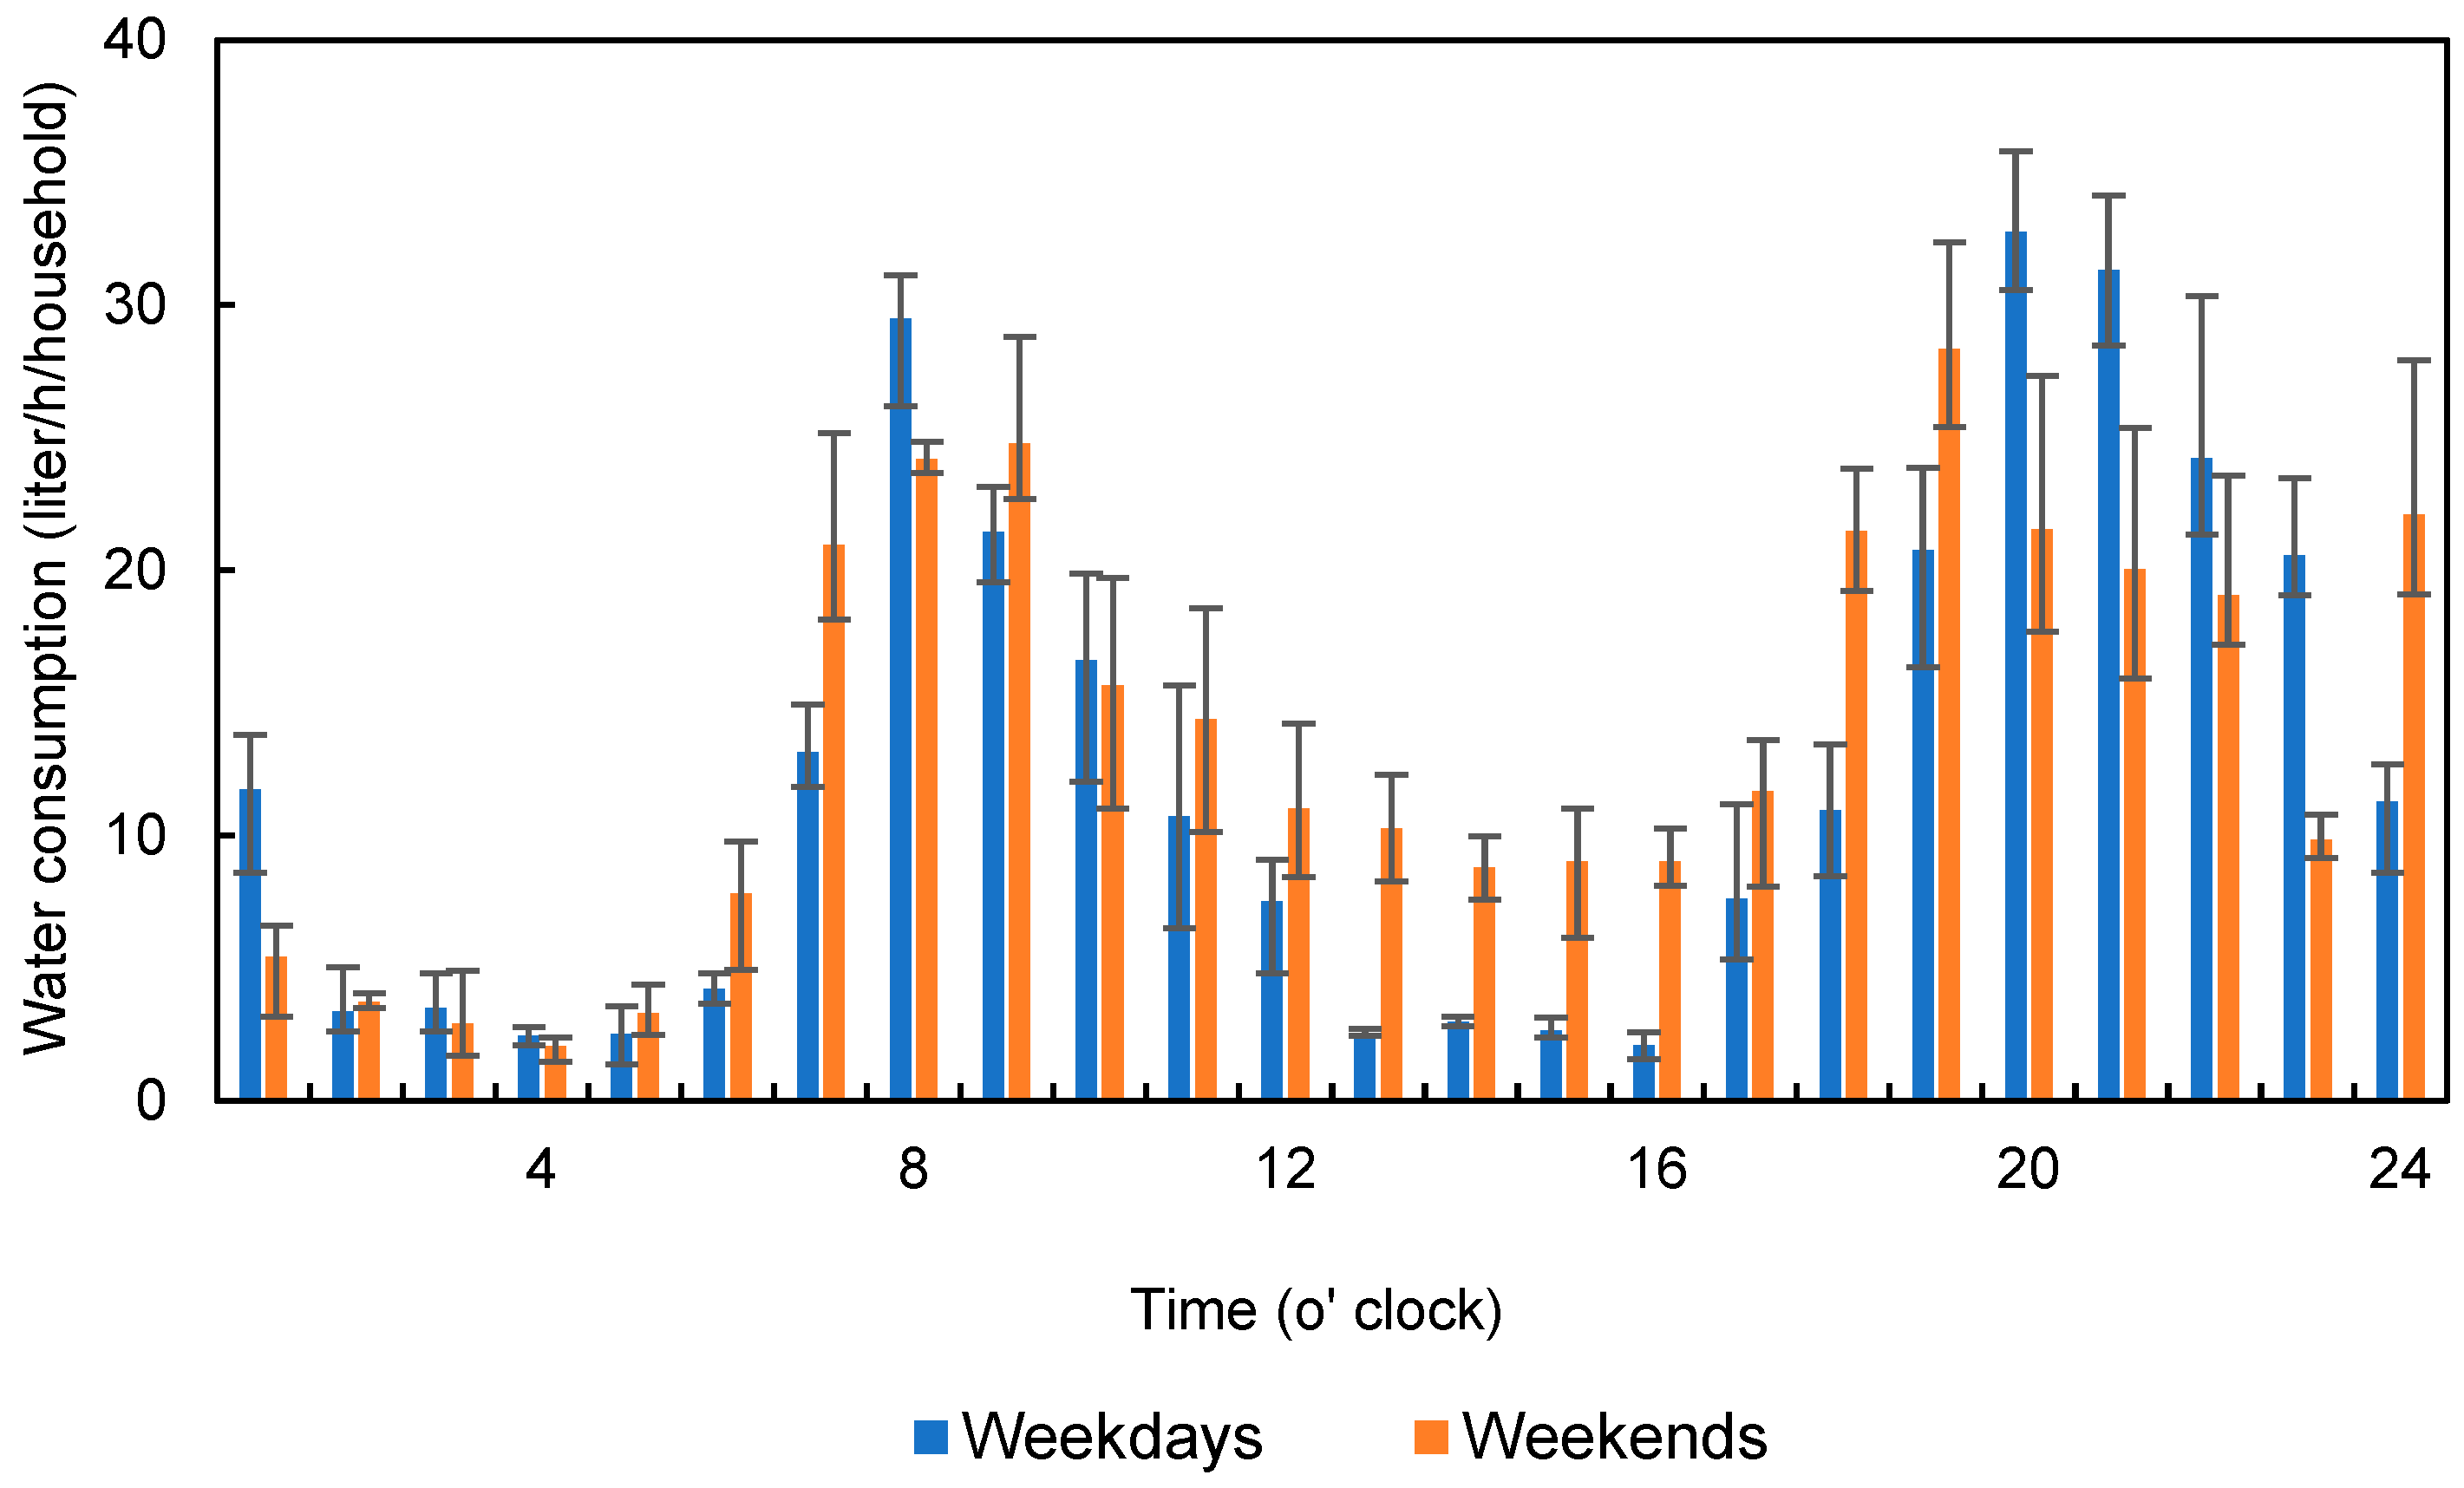
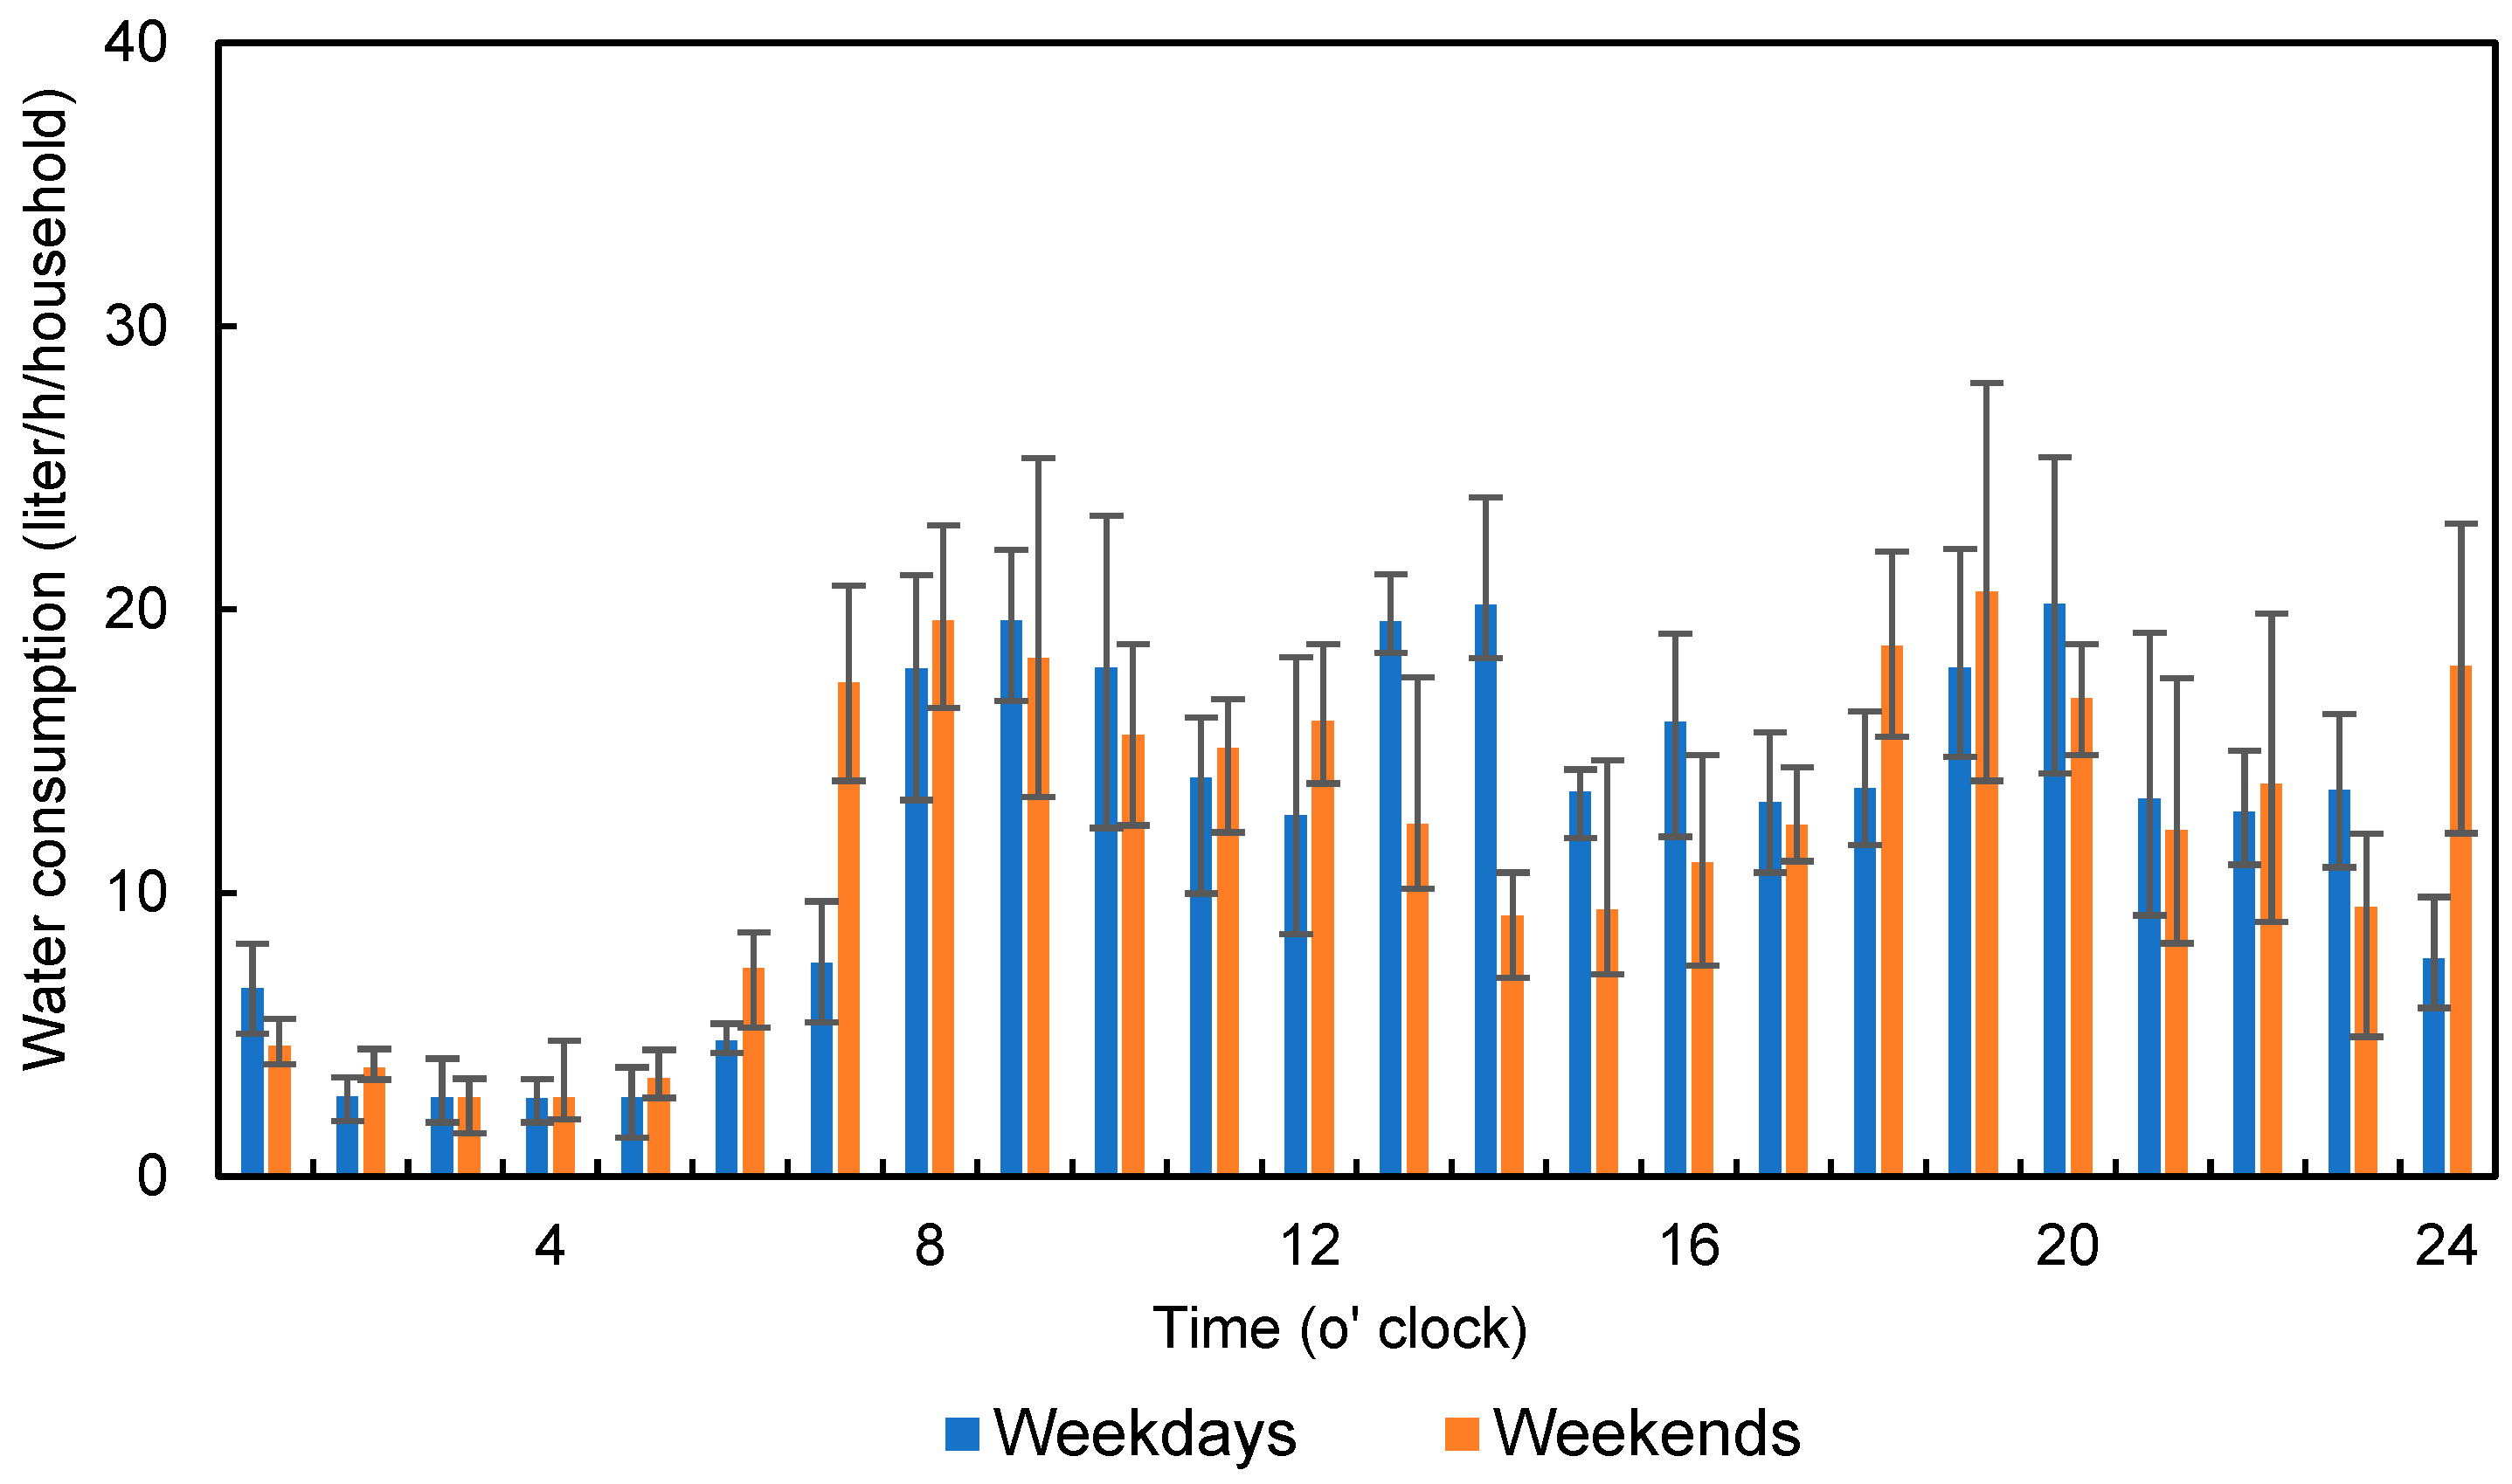
The hourly water consumption patterns for single-worker households on weekends and weekdays are shown in Figure 8. On weekends, when residents dedicate more hours to being at home, water consumption increases by an average of 327 L/day. Conversely, worker households with working individuals experienced a decrease in daily water consumption during weekdays, with an average of 296 L/day. The factor behind this decline is the limited time spent outside of the home during working hours. The water consumption peak starts early at approximately 7:00, with a consumption of 13 L/h, and the peak occurs at approximately 8:00 on weekdays. In contrast, on weekends, this peak is postponed until 9:00, whereas consumption remains relatively low throughout the afternoon between 13:00 and 16:00 on both weekdays and weekends with averages of 2 L/day and 9 L/day, respectively. However, water consumption on weekends during the evening hours as opposed to the morning hours starts early, at approximately 18:00, with peaks at 19:00 and 28 L/h. On weekdays, peak consumption occurs at 20:00, averaging 33 L/h. These variations highlight the significant differences in water consumption between weekdays and weekends, mainly due to daily routines, with peaks occurring during the morning and evening. A t-test between worker households on weekdays and weekends confirmed that consumption differs between 13:00 and 16:00 h (t = 2.35, p = 0.00048 < 0.001). However, insignificant differences were observed during the 24 h period (t = 1.71, p = 0.35 > 0.05). Water consumption during weekdays and weekends in nonworker households, as shown in Figure 9, begins at approximately 6:00 on weekends, with an average of 7 L/h. However, on weekdays, it starts at approximately 7:00, when it reaches 8 L/h.

Figure 8.
Comparison of the hourly water consumption of single-worker households on weekdays and weekends.
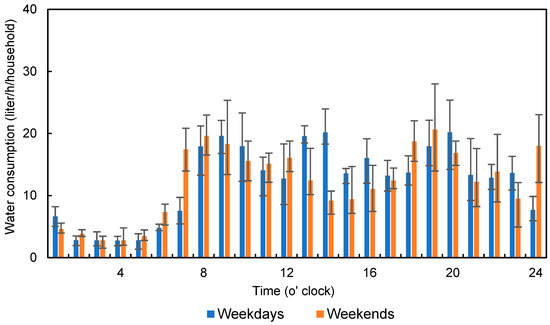
Figure 9.
Comparison of the hourly water consumption of single-nonworker households on weekdays and weekends.
Moreover, nonworker households consumed water throughout the day on both weekdays and weekends, with average total daily water consumption rates of 294 L/day and 291 L/day, respectively. A t-test was carried out to compare nonworker households during weekdays and weekends, confirming that differences were observed only from 13:00 to 16:00 h (t = 2.35, p = 0.02 < 0.05). The average total daily water consumption from the observed results on weekends, divided by the number of households, compared to that on weekdays, is of 110%, as shown in Table 1. However, this percentage increased from 13:00 to 16:00 for both single-worker and -nonworker households by approximately 362%. This percentage is lower than that of nonworker households, reaching 99% of daily water consumption and 60% from 13:00 to 16:00 h.

Table 1.
Percentages of average water consumption during the weekends/weekdays.
Single-worker households reported that daily consumption on weekends increased by 31 L/day compared with that on weekdays, whereas single-nonworker household water consumption decreased 4 L/day. The decrease in water consumption by nonworker households could be attributed to weekday consumption when household members are inclined to stay at home and consume water but within the target range; in contrast, on weekends, they may be outside the home or at work. Throughout the target period hours, worker household water consumption increased by 27 L from 13:00 to 16:00, and nonworker water consumption decreased by 28 L. This difference occurs because workers stay at home during afternoon hours on weekends. Even so, nonworkers decreased their water consumption due to individual activities. A t-test was performed to check the difference in the percentage of consumption in workers’ and nonworkers’ households. The statistical test confirmed that the percentages during weekdays and weekends were the same (t = 0.35; p = 0.35 > 0.05), (t = 0.1.71; p = 0.0.85 > 0.05). However, from 13:00 to 16:00, the percentages were different (t = 2.35; p= 0.0004 < 0.001), (t = 2.35; p = 0.023 < 0.05).
4. Discussion
Water consumption patterns can be instrumental in categorizing water demand on the basis of household size and activities. By estimating peak timings and amounts of water consumption within the study district and comparing these with experiences from residual areas, we can develop a more comprehensive understanding of water demand [42,43]. The analysis of 1871 households’ water consumption patterns of single-worker and -nonworker households provides insights into the impact of daily routines on water consumption. Single-worker households showed definite consumption peaks at 8:00 and between 20:00 and 21:00 on weekdays, reflecting typical workday schedules where water consumption is concentrated before and after work hours. In contrast, single-nonworker households presented a more even distribution of water consumption throughout the day, with peak consumption at 9:00 and a secondary peak at 19:00. The observed differences indicate that work-related schedules significantly influence water demand patterns, with worker households showing higher evening consumption that might come from Japanese evening bathing culture or from activities performed after work. Weekend data further highlight behavior differences, with worker households increasing their water consumption by 10% compared with that on weekdays. Notably, a significant increase of 262% in consumption between 13:00 and 16:00 on weekends indicates a shift concerning more intensive water consumption during leisure periods. These fluctuations show how nonworking days can have a significant effect on water consumption, featuring the need for flexible water management plans. Additionally, seasonal differences in water consumption might offer valuable insights. Warmer seasons may lead to increased water consumption due to activities related to household needs, whereas colder months could lead to a decrease in overall water demand [44]. The slight variation in single household water consumption at the end of September compared with that at the beginning may be indicative of seasonal changes or external factors such as public holidays, where shifts in routines or temperature could result in increased water consumption.
Despite these insights, this study has limitations that need to be recognized. A primary limitation is the inability to confirm specific household features, such as the number of residents, due to privacy restrictions. For example, while consumption data might suggest that households using between 143 and 429 L/day could be single households, such theories remain theoretical without access to detailed personal information. Additionally, single-worker and -nonworker households may limit the generalizability of the findings to other household types or regions with different demographic and socioeconomic profiles. However, the strength of this study is that it influences real-time data from smart water meters for an in-depth look at household water consumption patterns, which may assist in more accurate demand forecasting and informed water supply planning.
The application of smart water meter data in this study shows the data’s ability to enhance water resource management by providing hourly consumption patterns. This approach can be beneficial for water providers planning operations and improving service approaches. For example, upgrading water supply facilities necessitates an evaluation of residential water demand to gather essential data for planning reliable and sustainable water management and developing appropriately sized facilities [45].
Water demand can fluctuate due to factors such as population changes, lifestyle variations, weather conditions, and socioeconomic influences, making accurate future predictions challenging. To estimate water demand accurately, understanding the current patterns of water consumption is crucial [45]. The IoT system supports real-time comprehensive water consumption measurements, which can be pivotal for optimal decision-making and management [46,47]. The availability of real-time data at high temporal frequency can help water utilities identify issues, schedule timely maintenance or upgrades, and ultimately meet goals for sustainable water demand [48]. To estimate the water demand from smart water meter data, we can plan timeframes for better water distribution and supply management. These findings can be extended to other regions and countries, providing insights into local consumption patterns and infrastructure conditions. Implementing similar data-driven strategies in diverse contexts can lead to more efficient and sustainable water management practices globally. Overall, this study highlights the importance of understanding water consumption patterns to inform better management. By considering both daily and seasonal variations in water consumption, suppliers can develop more helpful approaches to maintaining water quality via smart water meter data.
5. Conclusions
This paper presents an advanced methodology that uses data from smart water meters to calculate water consumption patterns, enabling the identification of the number and types of households. Smart water meter data enabled the assessment of hourly water consumption for all 1871 households, providing insights into demand patterns in the Chibata district of Kosai city. The results revealed that on weekdays in single-worker households, consumption peaks occurred in the morning hours at 8:00, with an average rate of 29 L/h. In contrast, single-nonworker households peaked 1 h later at 9:00 with 20 L/h. Consumption in worker households decreased until the late afternoon because residents were absent from the home for work. During this same period, nonworker households continued to consume water consistently. The peaks of worker households continued in the evening at 20:00–21:00, with an average water consumption of 32 L/h corresponding to evening activities in households. The evening peaks were higher than the morning peaks, which might be due to the Japanese evening bathing culture in single-worker households. In contrast, single-nonworker households had peaks at 19:00–20:00 with an average of 19 L/h. However, worker household daily water consumption peaked at 8:00 and 20:00 on weekdays, but on weekends, it peaked at 9:00 and 19:00. Moreover, compared with worker and nonworker household water consumption throughout the day, the changes in water consumption were gradual. Compared with that on weekdays, worker household water consumption on weekends increased by 10%, with an average of 262% from 13:00 to 16:00. These disparities indicate how household composition can influence water consumption patterns on different days of the week, with this information being obtained via smart water meters. Moreover, these findings may be helpful for water supply management and scheduling distribution planning more effectively.
Author Contributions
Conceptualization, T.I. and S.O.; methodology, T.I. and S.O.; validation, S.O. and K.H.; formal analysis, S.O. and K.H.; investigation, T.I., K.Y. and N.M.N.; resources, T.I., K.Y. and N.M.N.; data curation, S.O. and K.H.; writing—original draft preparation, S.O.; writing—review and editing, S.O. and N.M.N.; visualization, S.O.; supervision, T.I., K.Y. and N.M.N.; project administration, T.I.; funding acquisition, T.I. All authors have read and agreed to the published version of the manuscript.
Funding
This work was funded by Kosai City for a Joint Research project titled “Application of water smart meter to analyze water supply pipelines, and residual chlorine concentration changes in distribution network” between Kosai City and Toyohashi University of Technology.
Institutional Review Board Statement
Not applicable.
Informed Consent Statement
Not applicable.
Data Availability Statement
The original contributions presented in this study are included in this article; further inquiries can be directed to the corresponding author.
Acknowledgments
The authors extend their sincere gratitude to the Kosai City Water Supply Division for providing the smart water meter data.
Conflicts of Interest
The authors have no conflicts of interest to declare.
References
- Farah, E.; Shahrour, I. Leakage Detection Using Smart Water System: Combination of Water Balance and Automated Minimum Night Flow. Water Resour. Manag. 2017, 31, 4821–4833. [Google Scholar] [CrossRef]
- Depuru, S.S.S.R.; Wang, L.; Devabhaktuni, V. Smart Meters for Power Grid: Challenges, Issues, Advantages and Status. Renew. Sustain. Energy Rev. 2011, 15, 2736–2742. [Google Scholar] [CrossRef]
- Stewart, R.A.; Willis, R.; Giurco, D.; Panuwatwanich, K.; Capati, G. Web-Based Knowledge Management System: Linking Smart Metering to the Future of Urban Water Planning. Aust. Plan. 2010, 47, 66–74. [Google Scholar] [CrossRef]
- Cole, G.; O’Halloran, K.; Stewart, R.A. Time of Use Tariffs: Implications for Water Efficiency. Water Supply 2012, 12, 90–100. [Google Scholar] [CrossRef]
- Parker, J.M.; Wilby, R.L. Quantifying Household Water Demand: A Review of Theory and Practice in the UK. Water Resour. Manag. 2013, 27, 981–1011. [Google Scholar] [CrossRef]
- Clarke, A.; Grant, N.; Thornton, J. Quantifying the Energy and Carbon Effects of Water Saving; Full Technical Report; Elemental Solutions: Towcester, UK, 2009; Available online: https://www.waterwise.org.uk/wp-content/uploads/2018/02/Energy-Saving-Trust-2009_Quantifying-the-Energy-and-Carbon-Effects-of-Water-Saving_Full-Technical-Report.pdf (accessed on 30 August 2024).
- Thumim, J.; White, V.; Redgrove, Z.; Roberts, S. Energy Tariffs for Sustainability. In Waste Not, Want Not Energy Tariffs for Sustainability; Centre for Sustainable Energy: Bristol, UK, 2007; Available online: https://assets.wwf.org.uk/downloads/energy_tariffs_report_1.pdf (accessed on 30 August 2024).
- Roberts, P. Yarra Valley Water 2004 Residential End Use Measurement Study; California Energy Commission: Sacramento, CA, USA, 2005. Available online: https://efiling.energy.ca.gov/GetDocument.aspx?tn=71104& (accessed on 30 August 2024).
- Sivakumaran, S.; Aramaki, T. Estimation of Household Water End Use in Trincomalee, Sri Lanka. Water Int. 2010, 35, 94–99. [Google Scholar] [CrossRef]
- Beal, C.D.; Stewart, R.A. South East Queensland Residential End Use Study: Final Report; Reports; Griffith University: Queensland, Australia, 2011; Available online: https://research-repository.griffith.edu.au/bitstream/handle/10072/46802/80687_2.pdf (accessed on 30 August 2024).
- Deoreo, W.B.; Mayer, P.W. Insights into Declining Single-Family Residential Water Demands. J. Am. Water Works Assoc. 2012, 104, E383–E394. [Google Scholar] [CrossRef]
- Chen, H.; Zhang, Y.; Ma, L.; Liu, F.; Zheng, W.; Shen, Q.; Zhang, H. Change of Water Consumption and Its Potential Influential Factors in Shanghai: A Cross-Sectional Study. BMC Public Health 2012, 12, 450. [Google Scholar] [CrossRef]
- Xie, Y.; Dai, W.; Xiang, S.; Deng, H.; Wang, Z.; Li, Y.; Wang, Z.; Zhou, M.; Gao, M. Supply and Demand of Ecosystem Services and Their Interaction with Urbanization: The Case of Chengdu-Chongqing Urban Agglomeration. Urban Clim. 2024, 55, 101978. [Google Scholar] [CrossRef]
- Anandhavalli, D.; Sangeetha, K.S.; Priya Dharshini, V.; Lukshana Fathima, B. Smart Meter for Water Utilization using IoT. Int. Res. J. Eng. Technol. 2018, 5, 1002–1005. Available online: https://www.irjet.net/archives/V5/i4/IRJET-V5I4221.pdf (accessed on 30 August 2024).
- Slaný, V.; Lučanský, A.; Koudelka, P.; Mareček, J.; Krčálová, E.; Martínek, R. An Integrated IoT Architecture for Smart Metering Using Next Generation Sensor for Water Management Based on LoRaWAN Technology: A Pilot Study. Sensors 2020, 20, 4712. [Google Scholar] [CrossRef] [PubMed]
- Boyle, T.; Giurco, D.; Mukheibir, P.; Liu, A.; Moy, C.; White, S.; Stewart, R. Intelligent Metering for Urban Water: A Review. Water 2013, 5, 1052–1081. [Google Scholar] [CrossRef]
- Stewart, R.A.; Nguyen, K.; Beal, C.; Zhang, H.; Sahin, O.; Bertone, E.; Vieira, A.S.; Castelletti, A.; Cominola, A.; Giuliani, M.; et al. Integrated Intelligent Water-Energy Metering Systems and Informatics: Visioning a Digital Multi-Utility Service Provider. Environ. Model. Softw. 2018, 105, 94–117. [Google Scholar] [CrossRef]
- Creaco, E.; Campisano, A.; Fontana, N.; Marini, G.; Page, P.R.; Walski, T. Real Time Control of Water Distribution Networks: A State-of-the-Art Review. Water Res. 2019, 161, 517–530. [Google Scholar] [CrossRef]
- Giurco, D.P.; White, S.B.; Stewart, R.A. Smart Metering and Water End-Use Data: Conservation Benefits and Privacy Risks. Water 2010, 2, 461–467. [Google Scholar] [CrossRef]
- Antzoulatos, G.; Mourtzios, C.; Stournara, P.; Kouloglou, I.O.; Papadimitriou, N.; Spyrou, D.; Mentes, A.; Nikolaidis, E.; Karakostas, A.; Kourtesis, D.; et al. Making Urban Water Smart: The SMART-WATER Solution. Water Sci. Technol. 2020, 82, 2691–2710. [Google Scholar] [CrossRef] [PubMed]
- Monks, I.; Stewart, R.A.; Sahin, O.; Keller, R. Revealing Unreported Benefits of Digital Water Metering: Literature Review and Expert Opinions. Water 2019, 11, 838. [Google Scholar] [CrossRef]
- March, H.; Morote, Á.-F.; Rico, A.-M.; Saurí, D. Household Smart Water Metering in Spain: Insights from the Experience of Remote Meter Reading in Alicante. Sustainability 2017, 9, 582. [Google Scholar] [CrossRef]
- Homma, Y.; Iizuka, N. Japan’s First Large Scale Efforts on the Model Project of Smart Water Meter; Bureau of Waterworks, Tokyo Metropolitan Government: Tokyo, Japan, 2018. Available online: https://www.waterworks.metro.tokyo.lg.jp/files/items/30203/File/o4-1.pdf (accessed on 30 August 2024).
- Booysen, M.J.; Visser, M.; Burger, R. Temporal Case Study of Household Behavioural Response to Cape Town’s “Day Zero” Using Smart Meter Data. Water Res. 2019, 149, 414–420. [Google Scholar] [CrossRef]
- JWRC. Smart Water Metering in Japan; Japan Water Research Center: Tokyo, Japan, 2016; Available online: https://www.jwrc-net.or.jp/english/docs/english/research/smart_water_metering.pdf (accessed on 30 August 2024).
- Msamadya, S.; Joo, J.C.; Lee, J.M.; Choi, J.S.; Lee, S.; Lee, D.J.; Go, H.W.; Jang, S.Y.; Lee, D.H. Role of Water Policies in the Adoption of Smart Water Metering and the Future Market. Water 2022, 14, 826. [Google Scholar] [CrossRef]
- Cominola, A.; Nguyen, K.; Giuliani, M.; Stewart, R.A.; Maier, H.R.; Castelletti, A. Data Mining to Uncover Heterogeneous Water Use Behaviors from Smart Meter Data. Water Resour. Res. 2019, 55, 9315–9333. [Google Scholar] [CrossRef]
- Zhang, H.H.; Brown, D.F. Understanding Urban Residential Water Use in Beijing and Tianjin, China. Habitat. Int. 2005, 29, 469–491. [Google Scholar] [CrossRef]
- Domene, E.; Saurí, D. Urbanisation and Water Consumption: Influencing Factors in the Metropolitan Region of Barcelona. Urban Stud. 2006, 43, 1605–1623. [Google Scholar] [CrossRef]
- Harlan, S.L.; Yabiku, S.T.; Larsen, L.; Brazel, A.J. Household Water Consumption in an Arid City: Affluence, Affordance, and Attitudes. Soc. Nat. Resour. 2009, 22, 691–709. [Google Scholar] [CrossRef]
- House-Peters, L.A.; Chang, H. Urban Water Demand Modeling: Review of Concepts, Methods, and Organizing Principles. Water Resour. Res. 2011, 47, W05401. [Google Scholar] [CrossRef]
- Ouyang, Y.; Wentz, E.A.; Ruddell, B.L.; Harlan, S.L. A Multi-Scale Analysis of Single-Family Residential Water Use in the Phoenix Metropolitan Area. J. Am. Water Resour. Assoc. 2014, 50, 448–467. [Google Scholar] [CrossRef]
- Antunes, A.; Andrade-Campos, A.; Sardinha-Lourenço, A.; Oliveira, M.S. Short-Term Water Demand Forecasting Using Machine Learning Techniques. J. Hydroinform. 2018, 20, 1343–1366. [Google Scholar] [CrossRef]
- Benítez, R.; Ortiz-Caraballo, C.; Preciado, J.C.; Conejero, J.M.; Sánchez Figueroa, F.; Rubio-Largo, A. A Short-Term Data Based Water Consumption Prediction Approach. Energies 2019, 12, 2359. [Google Scholar] [CrossRef]
- Maruyama, Y.; Yamamoto, H. A Study of Statistical Forecasting Method Concerning Water Demand. Procedia Manuf. 2019, 39, 1801–1808. [Google Scholar] [CrossRef]
- Niknam, A.; Zare, H.K.; Hosseininasab, H.; Mostafaeipour, A.; Herrera, M. A Critical Review of Short-Term Water Demand Forecasting Tools—What Method Should I Use? Sustainability 2022, 14, 5412. [Google Scholar] [CrossRef]
- Villar Miguelez, C.; Monzon Baeza, V.; Parada, R.; Monzo, C. Guidelines for Renewal and Securitization of a Critical Infrastructure Based on IoT Networks. Smart Cities 2023, 6, 728–743. [Google Scholar] [CrossRef]
- Keselman, H.J.; Huberty, C.J.; Lix, L.M.; Olejnik, S.; Cribbie, R.A.; Donahue, B.; Kowalchuk, R.K.; Lowman, L.L.; Petoskey, M.D.; Keselman, J.C.; et al. Statistical Practices of Educational Researchers: An Analysis of Their ANOVA, MANOVA, and ANCOVA Analyses. Rev. Educ. Res. 1998, 68, 350–386. [Google Scholar] [CrossRef]
- Beal, C.D.; Stewart, R.A.; Fielding, K. A Novel Mixed Method Smart Metering Approach to Reconciling Differences between Perceived and Actual Residential End Use Water Consumption. J. Clean. Prod. 2013, 60, 116–128. [Google Scholar] [CrossRef]
- JWWA. The Present Condition of the Water Service in Japan; Japan Water Supply Data Report 2003; Japan Water Works Association: Tokyo, Japan, 2003; Available online: http://www.jwwa.or.jp/english/water_en/water-e02.html (accessed on 30 August 2024).
- Klein, C. Average Daily Consumption Volume of Domestic Water per Person in Japan from Fiscal Year 2010 to 2019. Available online: https://www.statista.com/statistics/1193527/japan-average-daily-consumption-volume-domestic-water-per-person/ (accessed on 30 August 2024).
- Obringer, R.; Nateghi, R.; Knee, J.; Madani, K.; Kumar, R. Urban Water and Electricity Demand Data for Understanding Climate Change Impacts on the Water-Energy Nexus. Sci. Data 2024, 11, 108. [Google Scholar] [CrossRef] [PubMed]
- Wang, R.; Zhao, X.; Qiu, H.; Cheng, X.; Liu, X. Uncovering Urban Water Consumption Patterns through Time Series Clustering and Entropy Analysis. Water Res. 2024, 262, 122085. [Google Scholar] [CrossRef] [PubMed]
- Abu-Bakar, H.; Williams, L.; Hallett, S.H. A Review of Household Water Demand Management and Consumption Measurement. J. Clean. Prod. 2021, 292, 125872. [Google Scholar] [CrossRef]
- Hosoi, N.; Horii, K.; Sato, K. Clarification of the actual condition of water use classified by purpose at home in Tokyo by water amount measurement. In Proceedings of the IWA World Water Congress & Exhibition, Tokyo, Japan, 16–21 September 2018; Available online: https://iwa-network.org/wp-content/uploads/2019/10/2018_IWA_WWCE-Tokyo_Report.pdf (accessed on 26 September 2024).
- Syrmos, E.; Sidiropoulos, V.; Bechtsis, D.; Stergiopoulos, F.; Aivazidou, E.; Vrakas, D.; Vezinias, P.; Vlahavas, I. An Intelligent Modular Water Monitoring IoT System for Real-Time Quantitative and Qualitative Measurements. Sustainability 2023, 15, 2127. [Google Scholar] [CrossRef]
- Gautam, G.; Sharma, G.; Magar, B.T.; Shrestha, B.; Cho, S.; Seo, C. Usage of IoT Framework in Water Supply Management for Smart City in Nepal. Appl. Sci. 2021, 11, 5662. [Google Scholar] [CrossRef]
- Horsburgh, J.S.; Leonardo, M.E.; Abdallah, A.M.; Rosenberg, D.E. Measuring water use, conservation, and differences by gender using an inexpensive, high frequency metering system. Environ. Model. Softw. 2017, 96, 83–94. [Google Scholar] [CrossRef]


Disclaimer/Publisher’s Note: The statements, opinions and data contained in all publications are solely those of the individual author(s) and contributor(s) and not of MDPI and/or the editor(s). MDPI and/or the editor(s) disclaim responsibility for any injury to people or property resulting from any ideas, methods, instructions or products referred to in the content. |
© 2024 by the authors. Licensee MDPI, Basel, Switzerland. This article is an open access article distributed under the terms and conditions of the Creative Commons Attribution (CC BY) license (https://creativecommons.org/licenses/by/4.0/).