Article

Corrosion Susceptibility and Microhardness of Al-Ni Alloys with Different Grain Structures

by
Alejandra Silvina Román
,
Edgar Rolando Ibañez
,
Natalia Silvina Zadorozne
,
Claudia Marcela Méndez
and
Alicia Esther Ares
*
Programa de Materiales y Fisicoquímica (ProMyF), Instituto de Materiales de Misiones (IMAM), Facultad de Ciencias Exactas, Químicas y Naturales (FCEQyN), Universidad Nacional de Misiones (UNaM), 1552 Félix de Azara Street, Posadas 3300, Misiones, Argentina
*
Author to whom correspondence should be addressed.
These authors have contributed equally to this work and share first authorship.
Appl. Sci. 2024, 14(19), 8862; https://doi.org/10.3390/app14198862
Submission received: 7 December 2023 / Revised: 26 December 2023 / Accepted: 29 September 2024 / Published: 2 October 2024
(This article belongs to the Special Issue Metals and Materials: Science, Processes and Applications)

Abstract

:
The development of Al-Ni alloys with a controlled microstructure has had a great impact on the field of study of aluminum-based alloys. In the present research, the influence of thermal parameters on the grain structures resulting from the directional solidification process of Al-Ni alloys with different alloy content has been studied. It has also been evaluated how different structures and the distribution of second phases influence the corrosion behavior and microhardness of alloys. The columnar-to-equiaxed transition (CET) was observed to occur when the temperature gradient in the melt decreased to values between 1.3 and 2.9 °C/cm. In addition, a small increase in the microhardness values was observed as a function of the Ni content. When the Ni content increases, the resistance to polarization decreases for samples with equiaxed grain structure throughout the range of compositions studied. Furthermore, the equiaxed grain structure presents higher resistance to polarization values than the columnar grain zone for alloys with a composition equal to or lower than the eutectic composition.

1. Introduction

The importance of aluminum-based alloys in the field of materials is associated with the great relevance that these systems have in the automotive industry. This is mainly a consequence of their low density, which, associated with the wide range of other properties of technological relevance that they present, make them very versatile systems suitable for use in a variety of applications. However, it has been found that many of these alloys used to make engine parts suffer a decrease in performance when used at elevated temperatures [1]. Therefore, in recent years, interest in aluminum-based alloys that have good properties at high temperatures has grown. It has been established that suitable alloys could be those that present the eutectic transformation at temperatures above 600 °C [2,3] and whose second-phase precipitates are stable at these temperatures.
Al-Ni alloys, which present a eutectic at 639.9 °C, are currently considered suitable candidates for use in high-temperature services [4,5,6]. The adequate performance of the Al-Ni system at high temperatures has been associated with the presence of Al3Ni intermetallic particles resistant in high-temperature environments [2,3,5,7]. It is also expected that the presence of such particles improves the mechanical resistance of alloys.
The development of Al-Ni alloys with a controlled microstructure is a relevant topic [1,2,4,5,7,8,9,10,11,12,13,14]. However, studies that relate macro- and microstructures with the electrochemical behavior of Al-Ni alloys are scarce [15,16,17]. It is vitally important to consider that the development and optimization of new alloy systems also require studies that evaluate the compatibility of the materials with the environment with which they will be in contact. Corrosion, that is, the degradation of metallic materials, is an inevitable problem that must be faced in almost all industrial and technological environments.
In general, the electrochemical response of the systems will be the result of the combination of the different structures and compositions of the alloys. It has been shown that the corrosion behavior of aluminum-based alloys will depend on the nature of the secondary phases, their distribution as a result of the different microstructures, their electrochemical behavior and their interaction with the matrix [12,18,19].
With the aim of obtaining a complete overview regarding the performance of Al-Ni alloys, in the present work, the influence of thermal parameters on the structures resulting from the directional solidification process of Al-Ni alloys with different alloy content has been studied. It has also been evaluated how the resulting macrostructures and microstructures and the distribution of second phases affect the microhardness and corrosion behavior of the alloys.

2. Materials and Methods
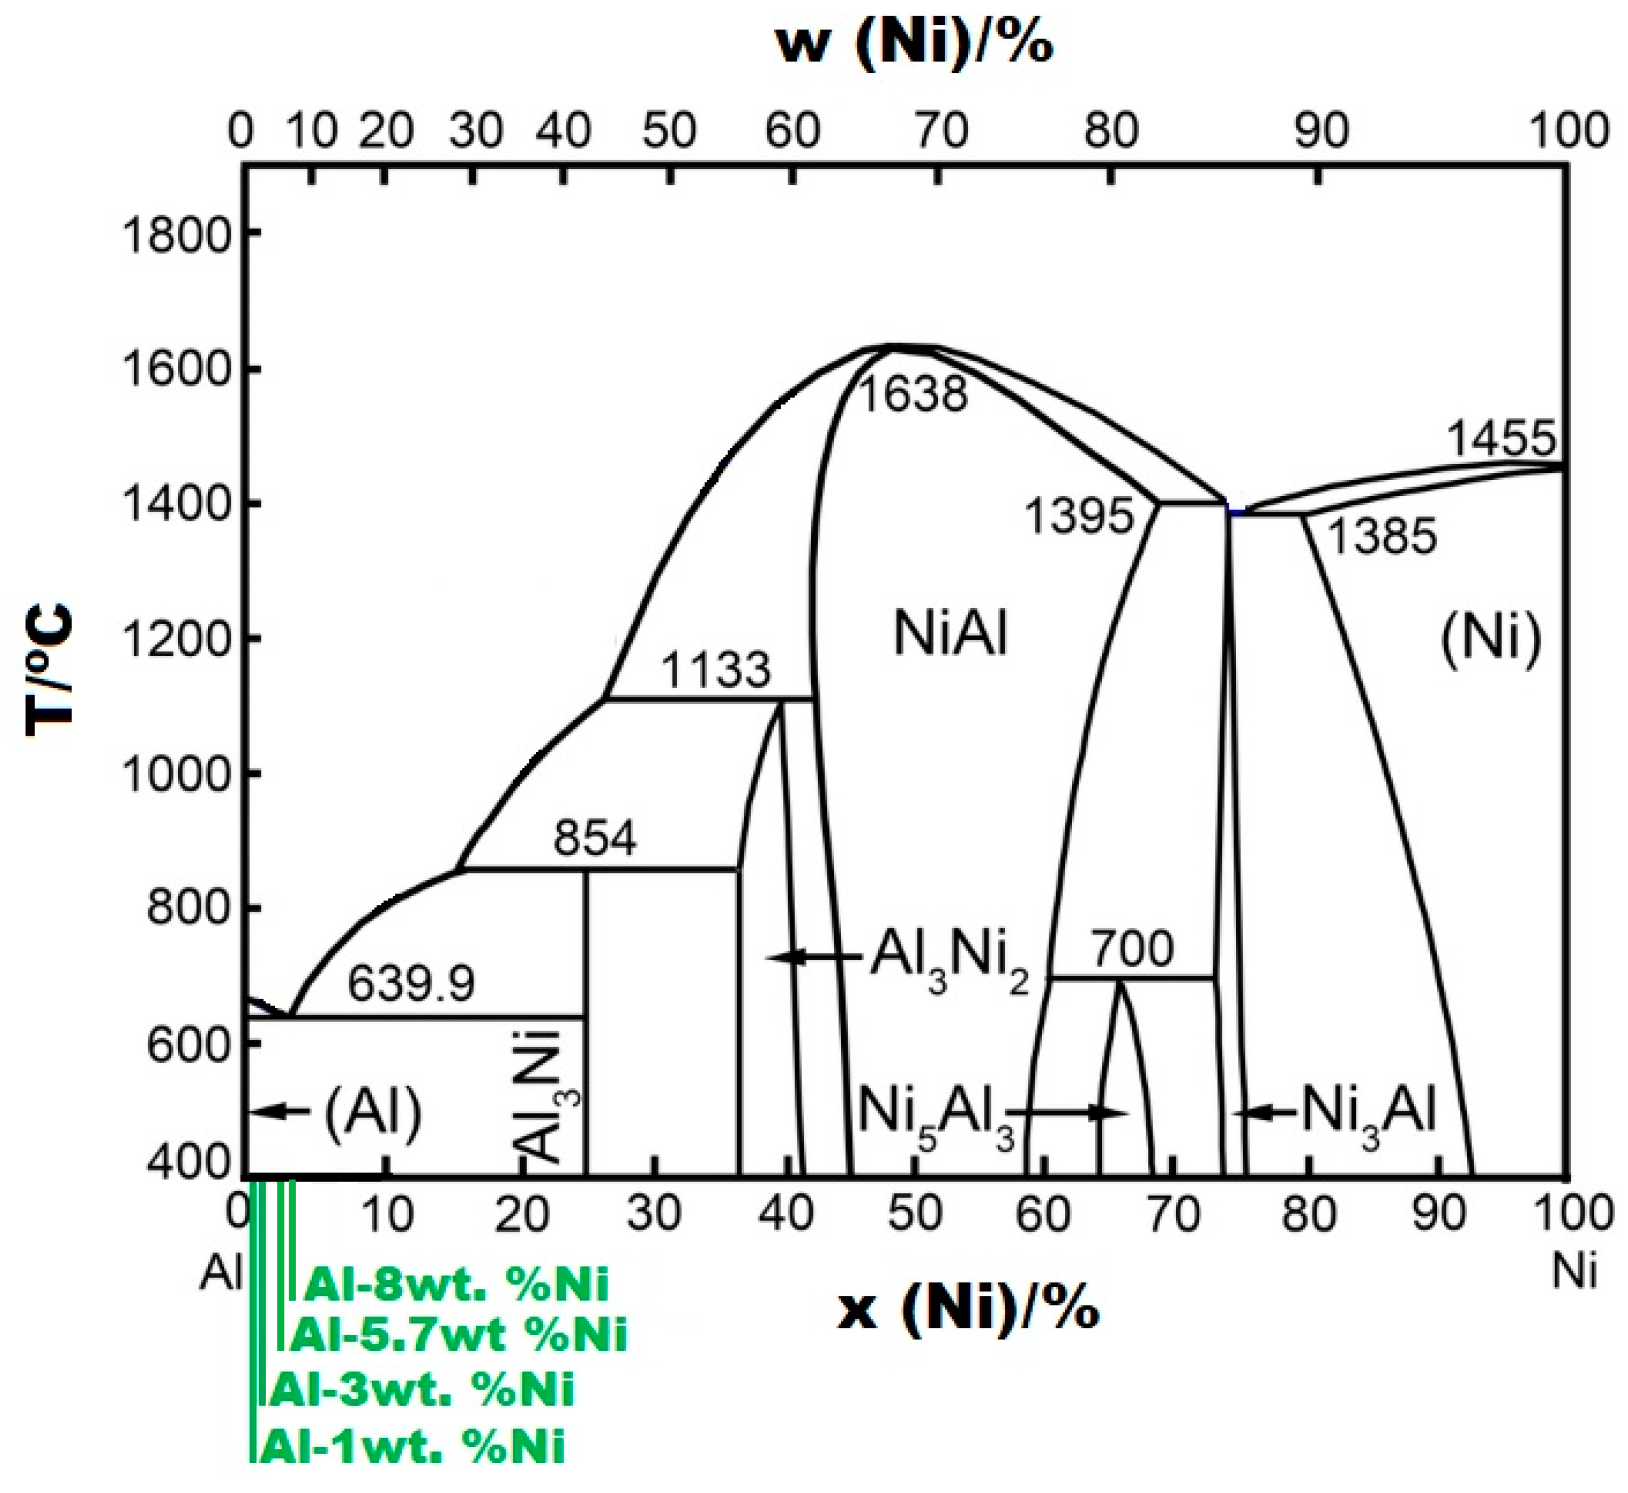
2.1. Materials

The Al-Ni alloys were prepared by using commercially pure metals (Chemical composition of Al: 99.93 Al, 0.038 Fe, < 0.001 Pb, 0.033 Si and < 0.001 others. Chemical composition of Ni: 99.97 Ni, 0.013 Fe, 0.014 Pb, 0.003 Si and < 0.001 others).
The solidification set-up was designed in such a way that heat was extracted only through the water-cooled bottom, promoting vertical upward directional solidification. More details concerning this solidification set-up can be obtained in previous articles [19].

2.2. Directional Solidification Process and Metallographic Characterization

The experiments were carried out with four concentrations of Al-Ni alloys (Al-1wt. %Ni, Al-3wt. %Ni, Al-5.7wt. %Ni and Al-8wt. %Ni). The directional solidification process began by pouring the molten metal at a temperature of 800–850 °C (approximately 200 °C above the fusion temperature of pure aluminum [20]) into the furnace previously heated to the same temperature. The furnace had a heat extraction system that circulated water at a temperature of 5 °C. It also had a temperature acquisition system through 6 type K thermocouples coated with refractory ceramics located inside the metal in different positions (that is, every 2 cm from the bottom of the mold) that allowed the recording of the thermal evolution during the entire solidification process. Cooling was initiated by activating the cooling water at the bottom of the mold (cold base). Consequently, the directional solidification took place in a vertically ascending manner.
Processing the acquired thermal data allowed for obtaining the characteristic temperature versus time curves and the analysis of the thermal parameters involved.
The solidified samples were cut longitudinally in half and roughened in water with emery papers (#60 to #1200) and then polished with 6 µm diamond paste (Prazis®, Buenos Aires, Argentina) for 1 h on a cloth by using ethylene glycol as a lubricant. To reveal the macrostructure, the samples were immersed in a solution of 50 mL of HCl and 500 mL of water for 10–15 min until the appearance of grains was observed [21,22]. Visual observation of the macrostructures of the samples allowed us to identify the different grain structures obtained in a directional solidification process. That is, columnar at the base of the specimen and equiaxial at the top. Between both structures, there is a transition zone from columnar-to-equiaxed (CET) grain structure. The position of the CET zone was measured with a ruler from the base of the sample [23,24,25,26,27].
From the images obtained from the development of the macrostructure, the width of the average columnar grains was measured, as explained in previous work [28]. The size of the equiaxed grains of the equiaxed zone close to the CET and zones close above it was determined.
Each sample was divided into equal surfaces, and the size of the equiaxed grains was determined at each interval of approximately 10 mm, according to the ASTM 112-96 standard [29]. With these values, the average equiaxed grain diameter, DGe, was calculated.
The development of the microstructure was carried out using a solution of 1.5 mL HCl, 1 mL of HF, 2.5 mL of HNO3 and 95 mL of H2O [21,22]. The chemical attack times were 10 s for Al-1wt. %Ni, 8 s for Al-3wt. %Ni, and 7 s for the other alloys. After chemical attack, the samples were rinsed with plenty of water and dried with hot air flow.
The characterization of the surface of Al-Ni alloys was carried out using an FEI Quanta 200® Scanning Electron Microscope (SEM) with an energy dispersive spectroscopy (EDS) detector of the Electron Microscopy and Microanalysis Service (SemFi-LIMF, Faculty of Engineering, UNLP, La Plata, Buenos Aires, Argentina). Microhardness measurements were carried out using a Future Tech FM800® microvickers durometer, Future Tech Corporation, Tokio, Japón, with a load of 50 gf and a residence time of 10 s [30]. Ten measurements were carried out in each of the phases of each alloy.

2.3. Electrochemical Tests

To carry out the electrochemical tests, the specimens were cut to obtain 1 cm2 working electrodes with different grain structures. One electrode with columnar grains and one with equiaxed grains was obtained for each alloy composition.
Cyclic potentiodynamic curves were carried out using a velocity of 10 mV/min. The sweep of the curves was initiated about 300 mV below the open circuit potential towards the anodic zone and was reversed upon reaching a current of 1 mA/cm2. After the tests, the affected areas were analyzed using an FEI Quanta200 SEM, FEI Company, NE Dawson Creek Drive Hillsboro, New York, United States of America, with an EDS detector of the Electron Microscopy and Microanalysis Service (SeMFi-LIMF)—Faculty of Engineering, UNLP, Argentina (of the Electronic Microscopy and Microanalysis Service (SeMFi-LIMF)—Faculty of Engineering, UNLP, Argentina). The open circuit potential of the alloys was also measured, Eoc, for a period of 3 h.
Electrochemical Impedance Spectroscopy spectra were acquired in a frequency range of 105–10−1 Hz. The potential amplitude was set to 10 mVrms around the OCP. All the EIS data was fitted by the Gamry Echem Analyst®.
The electrochemical tests were carried out in a 3-electrode cell, according to ASTM G-5 Standard [31], with a platinum counter electrode, a saturated calomel reference electrode and alloy-working electrodes.
All the potentials mentioned in the present research are vs. SCE (saturated calomel electrode). Measurements were carried out in 0.5 M NaCl solution deaerated by bubbling with nitrogen at room temperature. The equipment used is a Gamry Reference 600® potentiostat.

3. Results and Discussion

3.1. Solidification Process

In Figure 1a–d, the cooling curves obtained during the solidification of Al-1wt. %Ni, Al-3 wt. %Ni, Al-5.7 wt. %Ni and Al-8 wt. %Ni alloys are shown. The alloys begin to solidify at a temperature range of 665 °C and 670 °C; this is observed in Figure 1a–d due to a change in the slope of curves, which corresponds to the liquidus temperature (TL). On the other hand, after the completion of solidification, the slope of the cooling curve alters again, allowing the solidus temperature (TS) to be determined.
The data obtained from the acquirer during directional solidifications were used to obtain values of the thermal parameters (cooling rate (Ve), thermal gradient (GT), solidification rate (Vs)), which can be observed in Table 1. The values next to the isotherms show good agreement with the equilibrium temperatures [20].

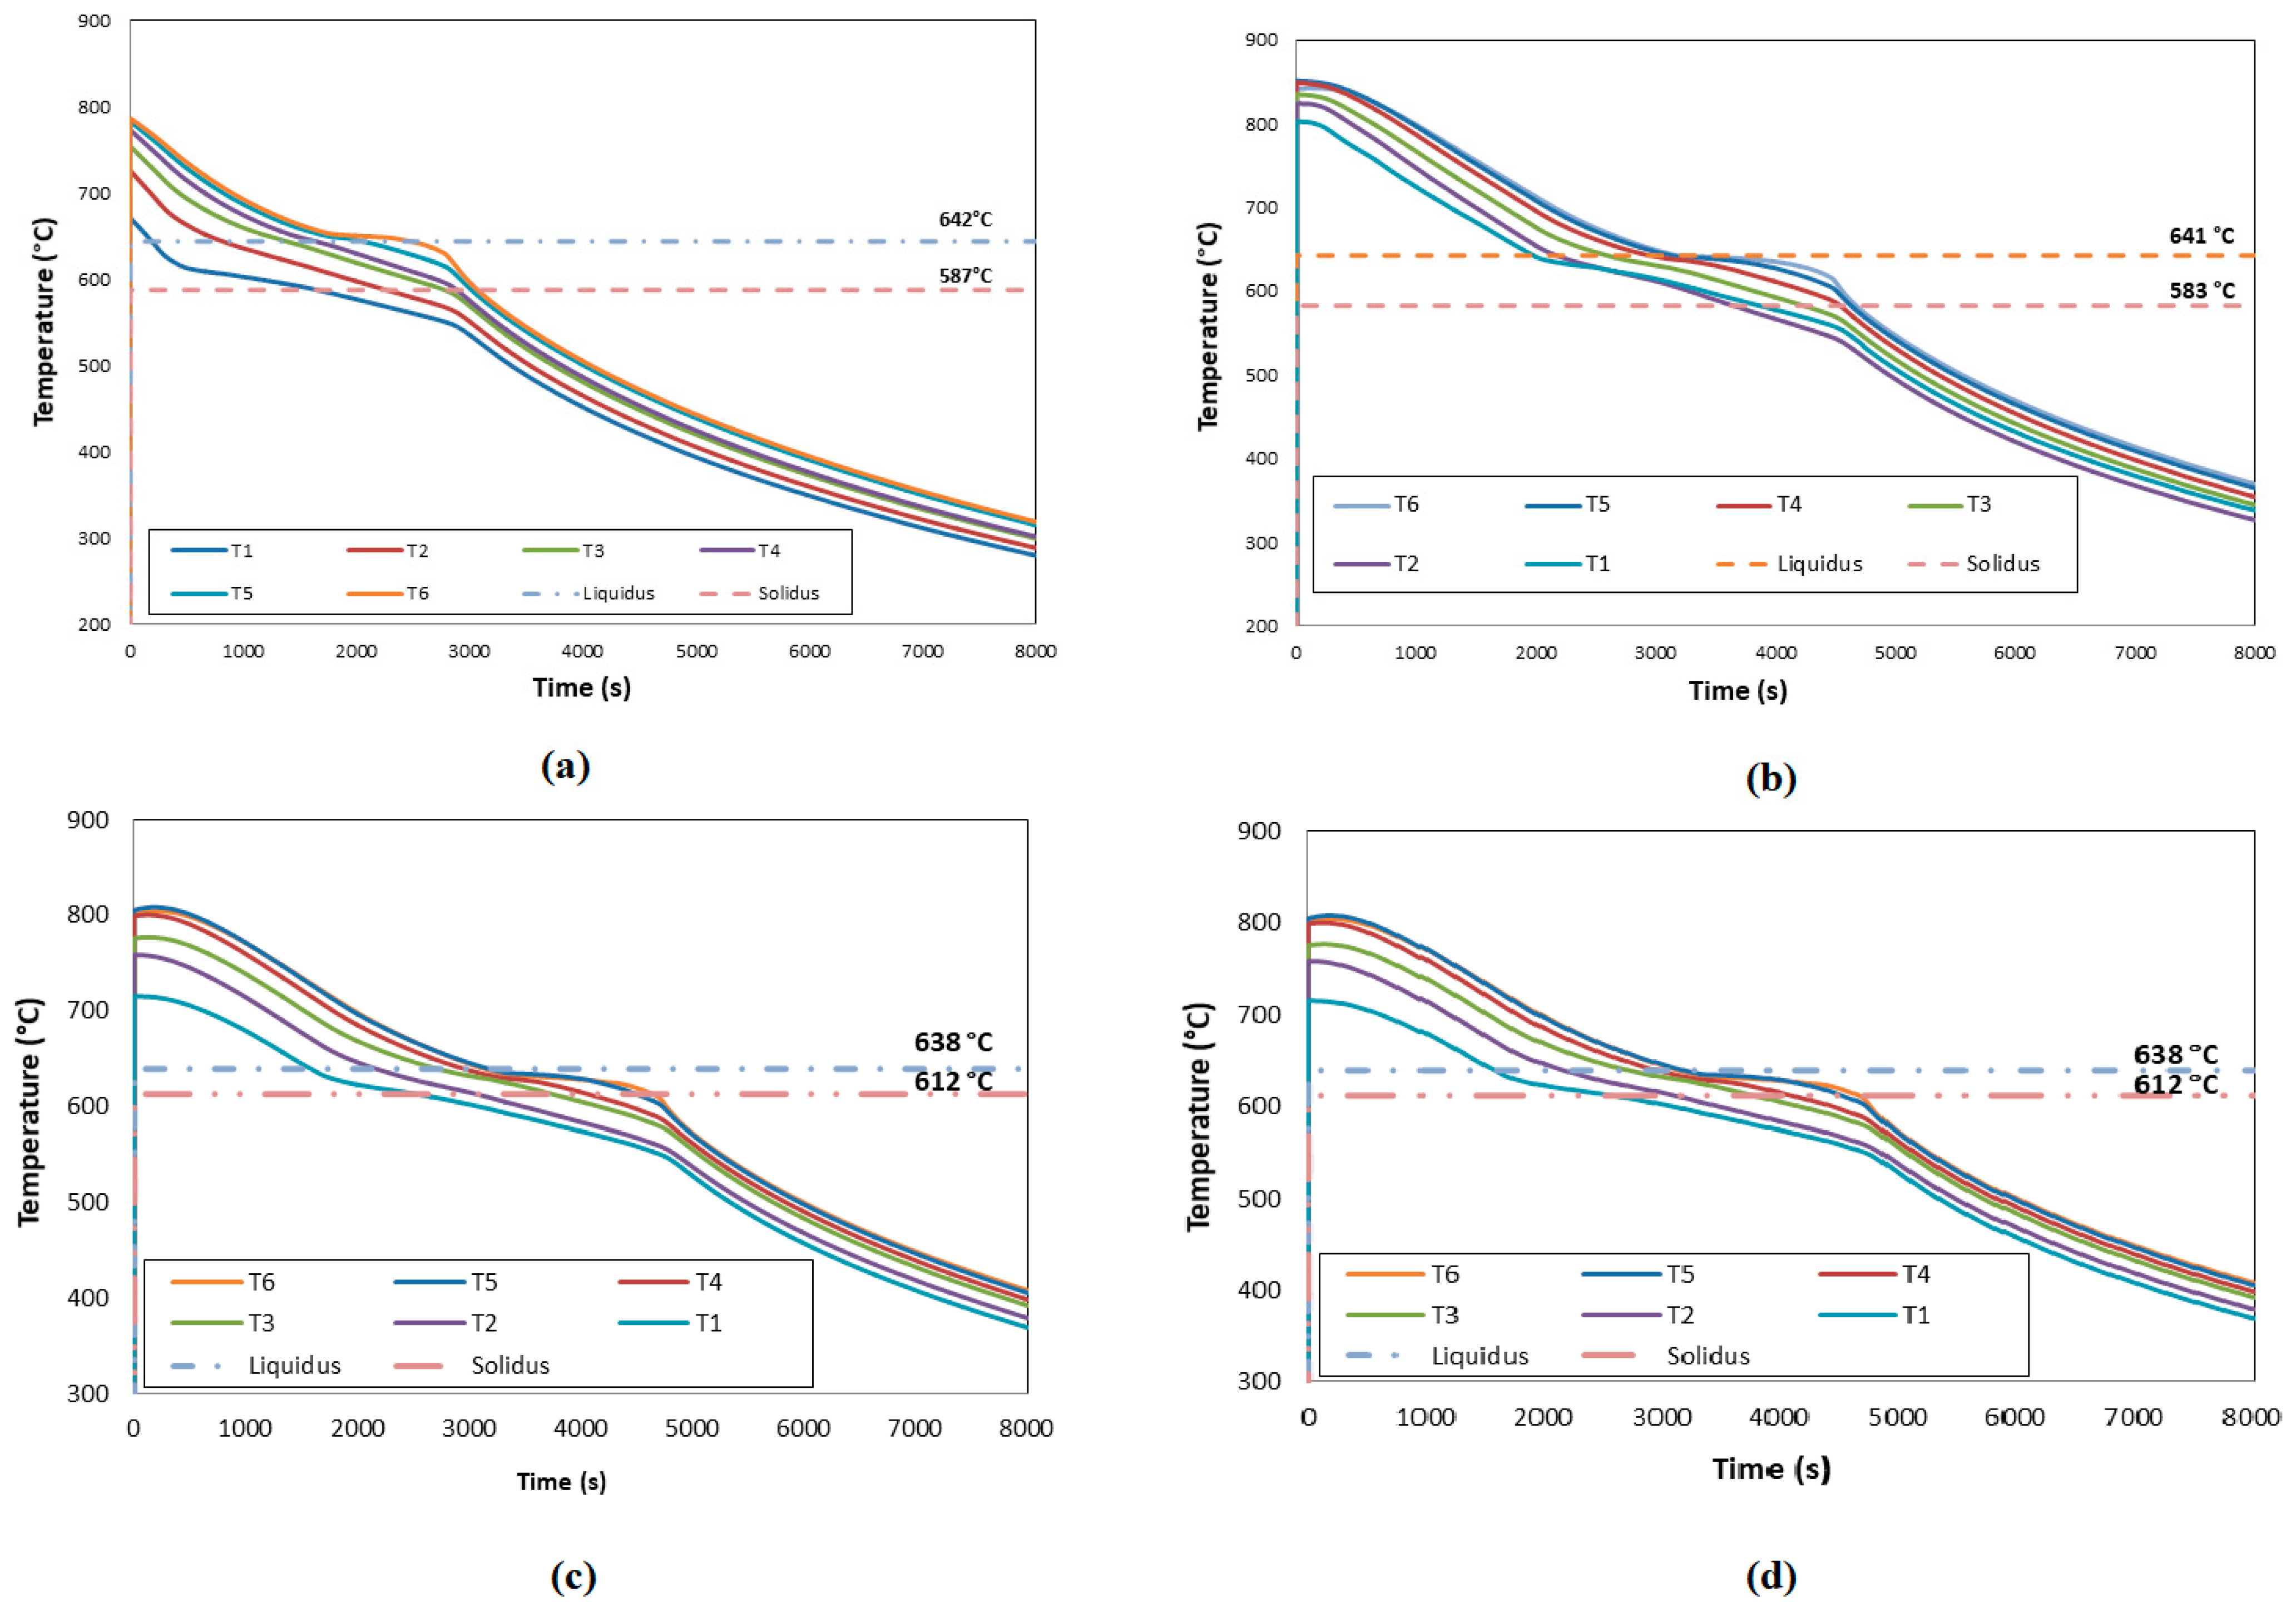
3.2. Thermal Gradients as a Function of Time

The thermal gradients for each adjacent thermocouple were calculated as a quotient between the difference in temperatures and the difference in distance between the two. In Figure 2, the graph of gradients can be observed as a function of time for Al-3.wt %Ni alloy.
It is observed in the graph that the gradients at the beginning take higher values, both at the base and at the upper zone of the samples. Later, as the cooling progresses, it can be observed that in the zone where the CET occurs, the gradient takes a minimum value and gives way to the subsequent growth of the equiaxed grains, hence the formation of the CET zone. From this graph, what is observed and given as a constant behavior in the different tests is that where we see a minimum of the thermal gradient, Gc, the CET occurs. It can also be seen in Figure 2 that CET does not occur in a line but in a transition zone of the order of 1 cm or greater, as was reported before [23,24,25,26,27]. The values of the critical temperature gradients, Gc, are listed in Table 1.
To verify what is shown in the thermal gradient graph, the zone where the CET takes place in the macrograph of Figure 2 was compared (corresponding to Al-3wt. %Ni) and related to the gradient graph. It is observed that when the CET occurs, the gradient takes a minimum corresponding to the thermocouple located at this position. For example, in the case of Figure 2, the minimums are displayed between thermocouples #3 and #4, and in the macrograph, the CET occurs right at this height of the sample.

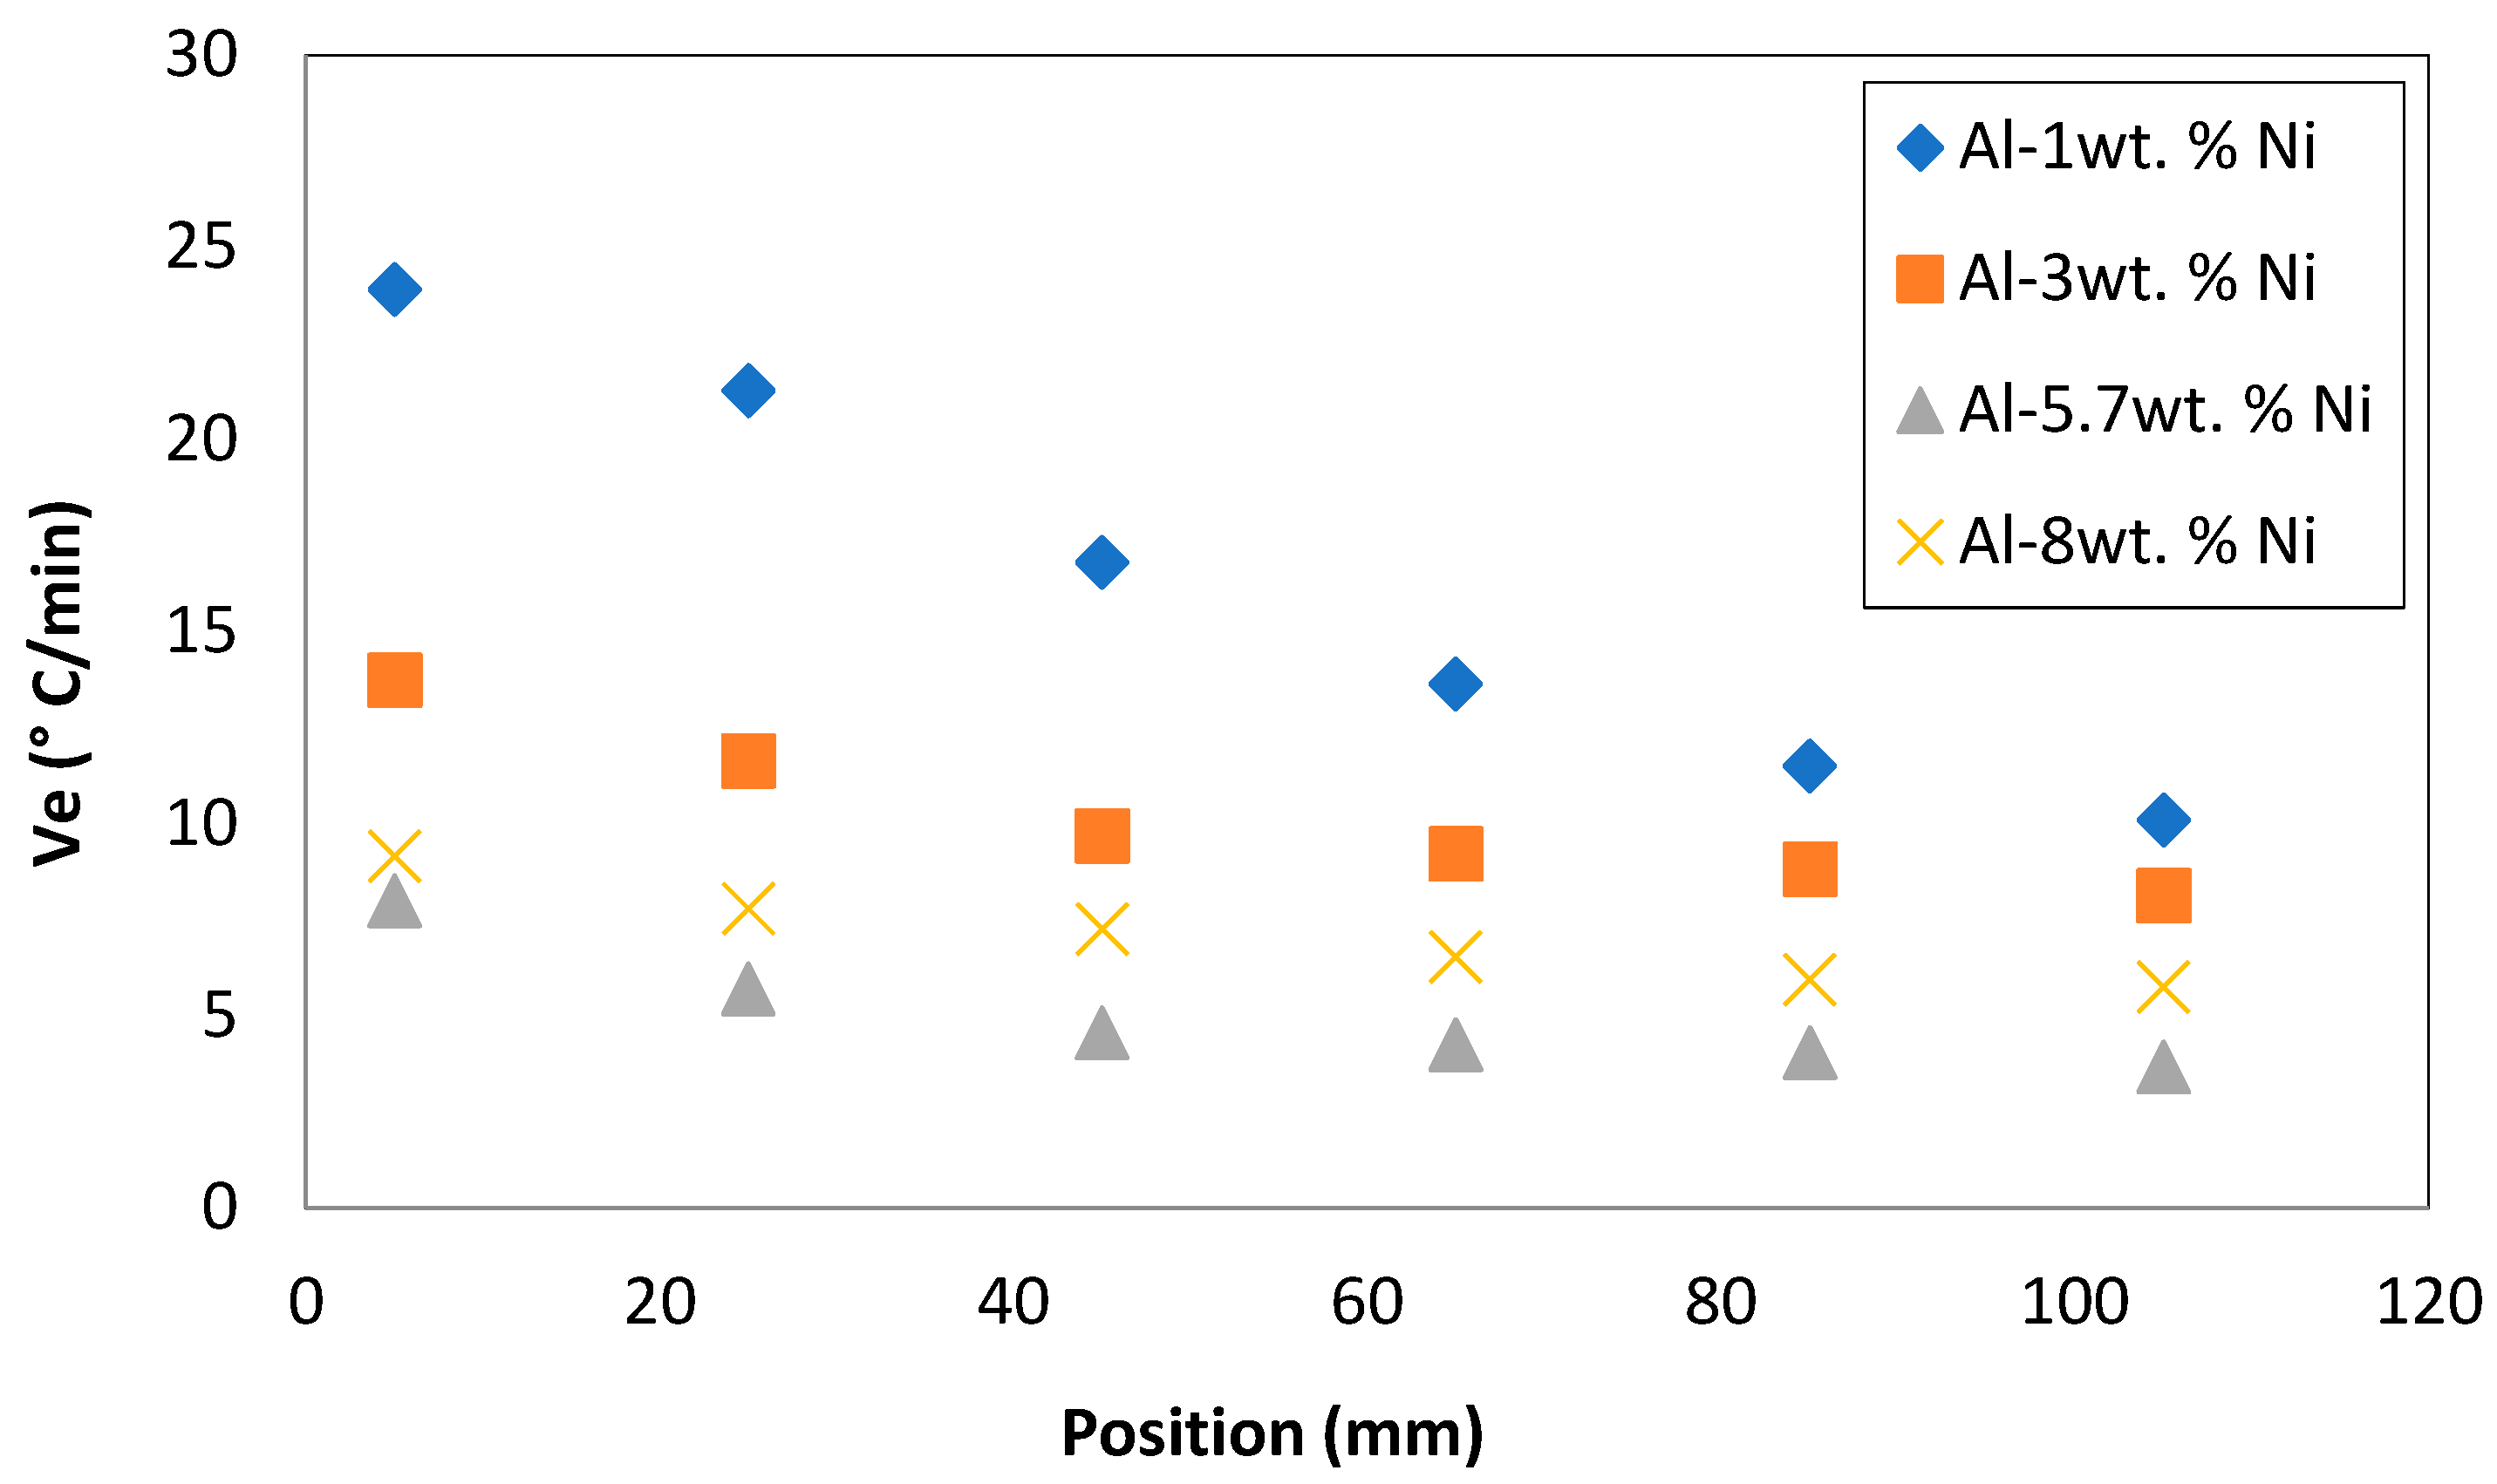
3.3. Cooling Rates and Macrostructure

The cooling rates, Ve, in the liquid were determined by taking the average values of the slopes of the temperature versus time curves in the zone before the plateau for each thermocouple position. On the other hand, the solidification rates were obtained as the average value of the temperatures within the plateau in the cooling curves. These thermal parameters are presented in Table 1.
The temperatures decrease faster in the regions closest to the bottom of the water-cooled furnace. This caused the cooling rates to gradually decrease towards the completion of local solidification located in the upper zone of the sample; see Figure 3.
The analysis of macrostructures obtained allowed us to determine the width of columnar grains, the height in the sample at which the CET zone occurred (positions of the CETMin and CETMax) and the average diameter of equiaxed grains, DGe (Table 1). The CET transition zone is characterized due to the columnar grains coexisting with the equiaxed grains [23,24,25,26,27].
Figure 4a,b represent the CET position in the sample and the columnar grain width, respectively, with respect to the cooling rate. In this work, a proportional relationship of the cooling rate with respect to the position in which the CET occurs was observed. At a higher cooling rate, the CET moves away from the base of the sample (considering the base the only point of heat extraction). It should be noted that this quasi-linear relationship is not fulfilled when the solute content comes into play so that for a higher Ve, the CET changes its behavior; that is to say, the value of the distance with respect to the base decreases. This behavior could be attributed to the fact that there are more solute particles; these could generate greater solidification sites and favor the nucleation of the equiaxed grains despite the fact that the Ve is higher. This behavior was observed for the Al-8wt. %Ni alloy.
On the other hand, it is also evident that, at higher Ve values, a columnar grain refinement effect is generated. That is, higher cooling rates produce more refined columnar grains. A non-linear adjustment was made for this relationship because it was observed that at very low velocities, very wide columns tend to form.
According to the data presented in Table 1, it is possible to observe the effect of solidification velocity with respect to the DGe. It is observed that, at a lower solidification velocity, the equiaxed grains presented a higher DGe value. This is expected because a lower Vs generates longer solidification times, allowing the grains to increase their average size. As seen in Figure 2, the heat extraction rate is lower in the areas furthest from the base of the sample. Consequently, it is expected that being in a position further from the base, the DGe will increase. This behavior can be seen in Figure 5, where the DGe values for the four alloys studied are shown, depending on the distance from the base of the samples.

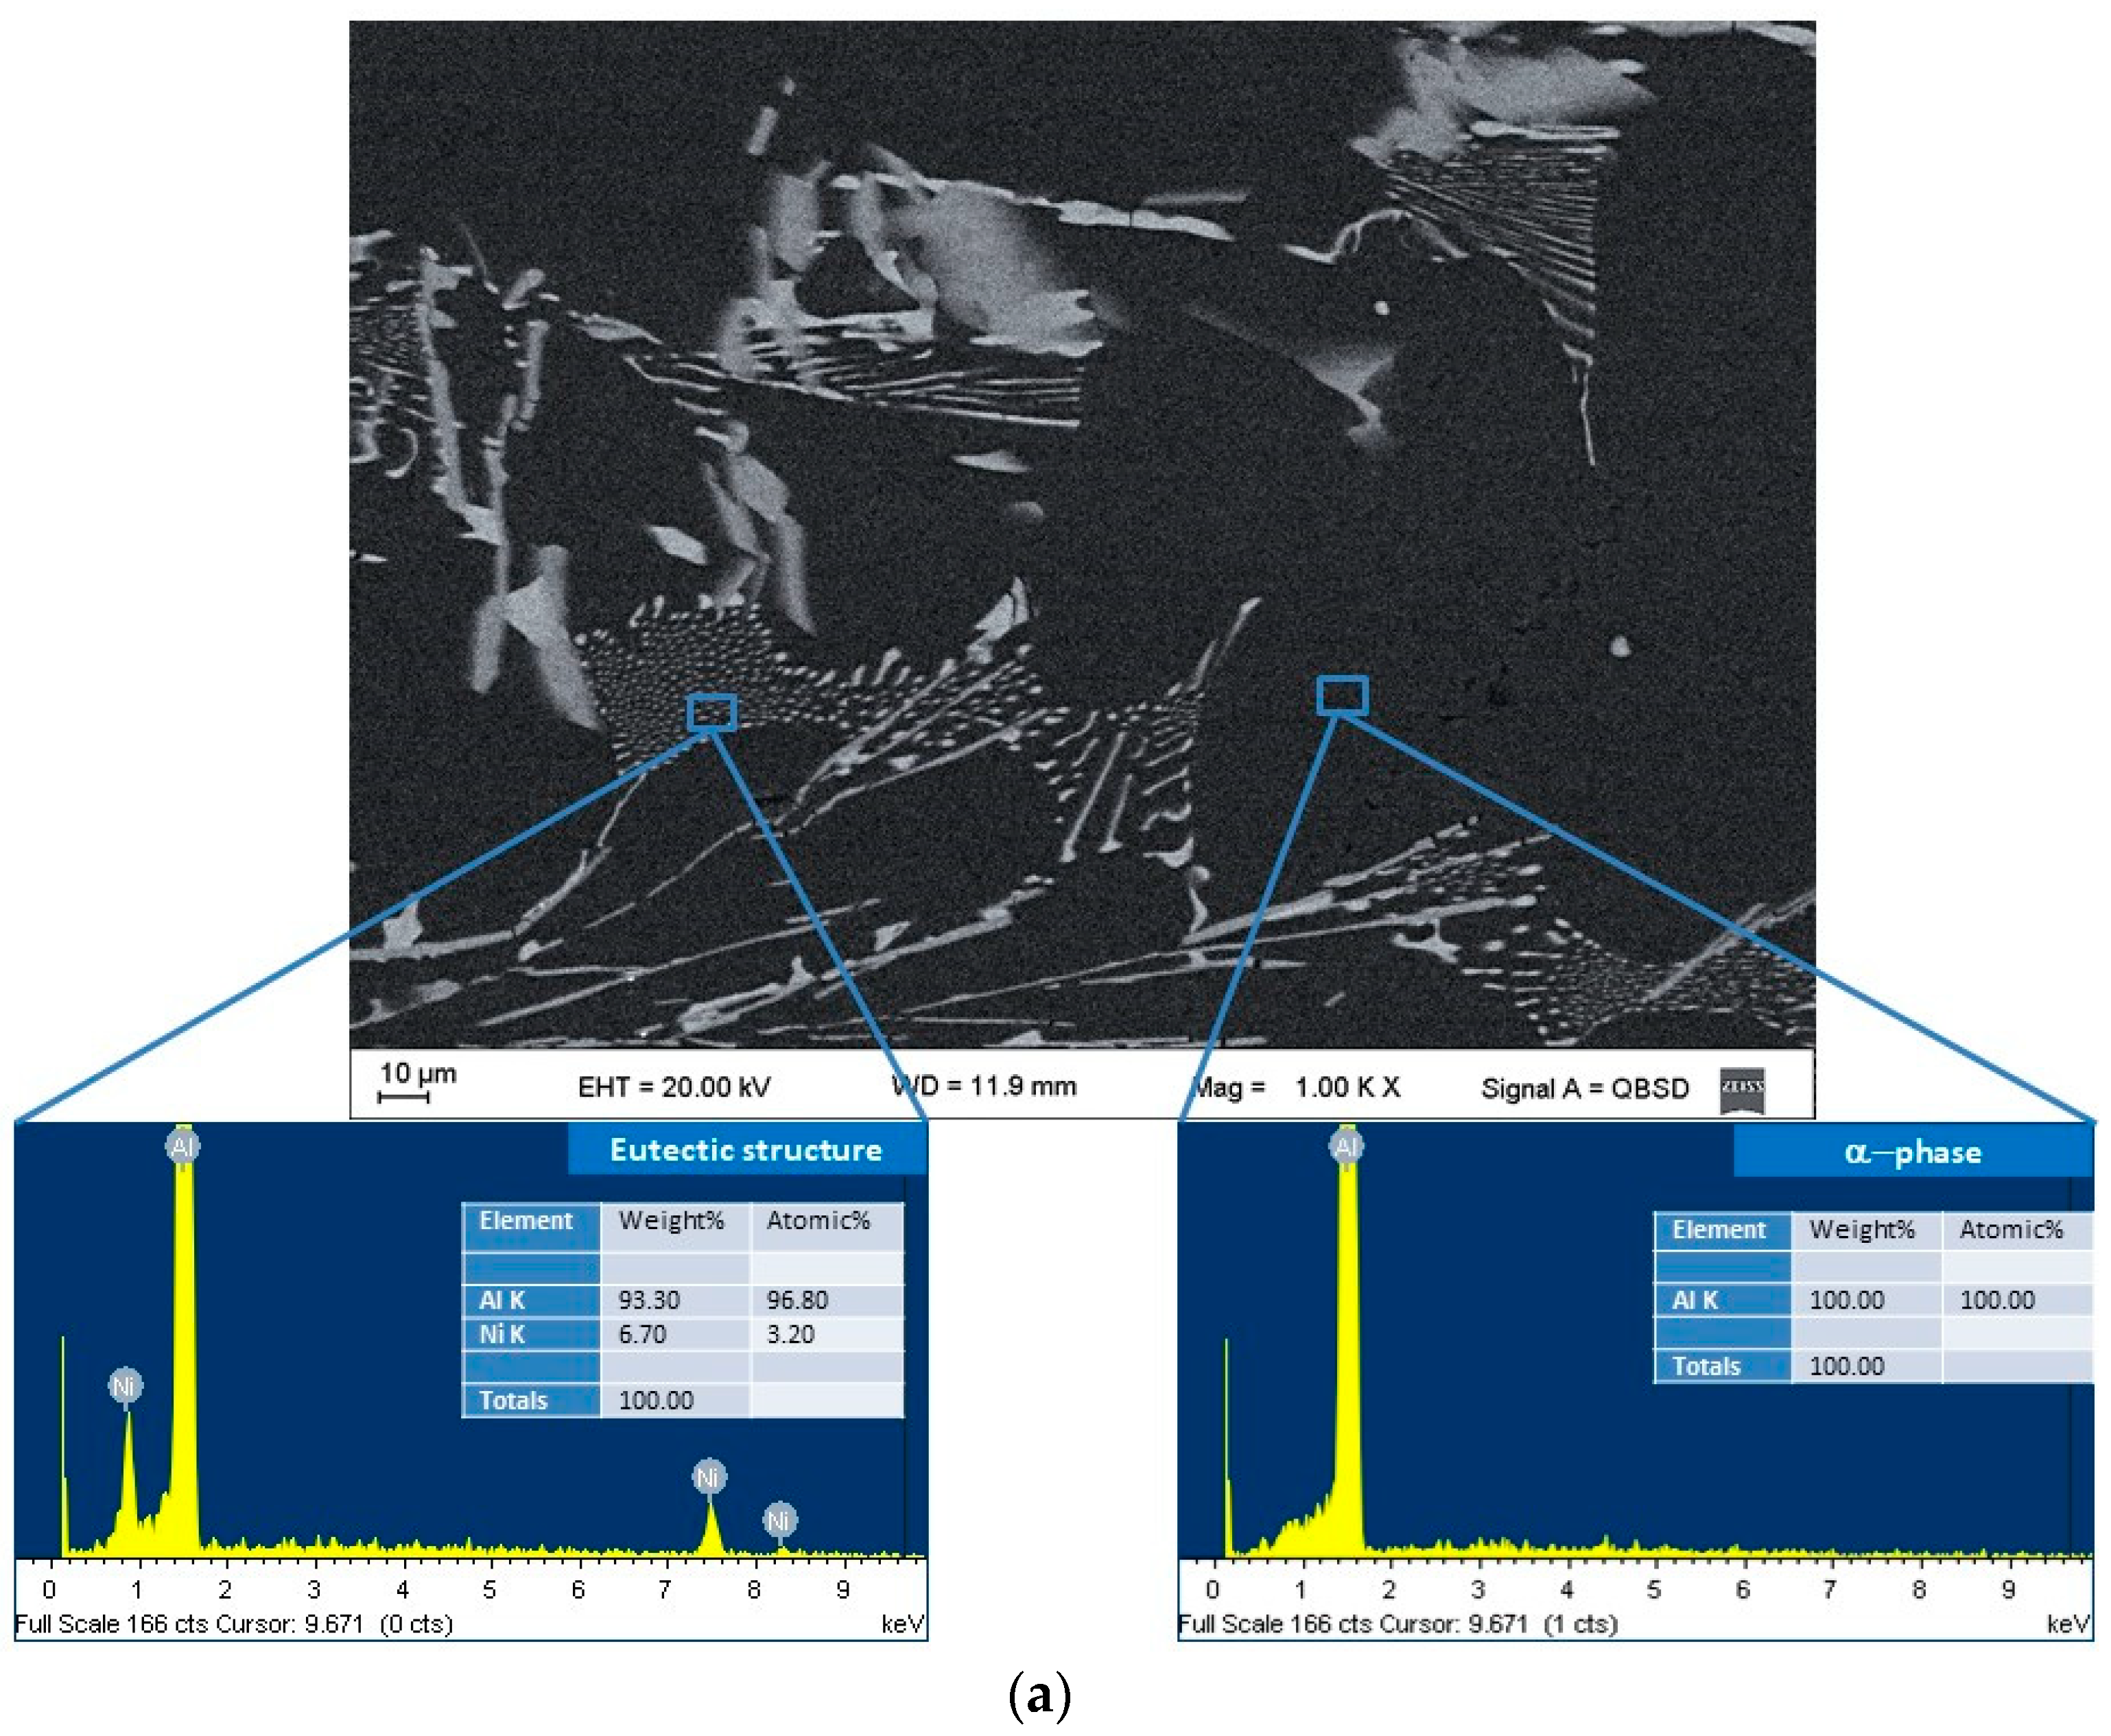
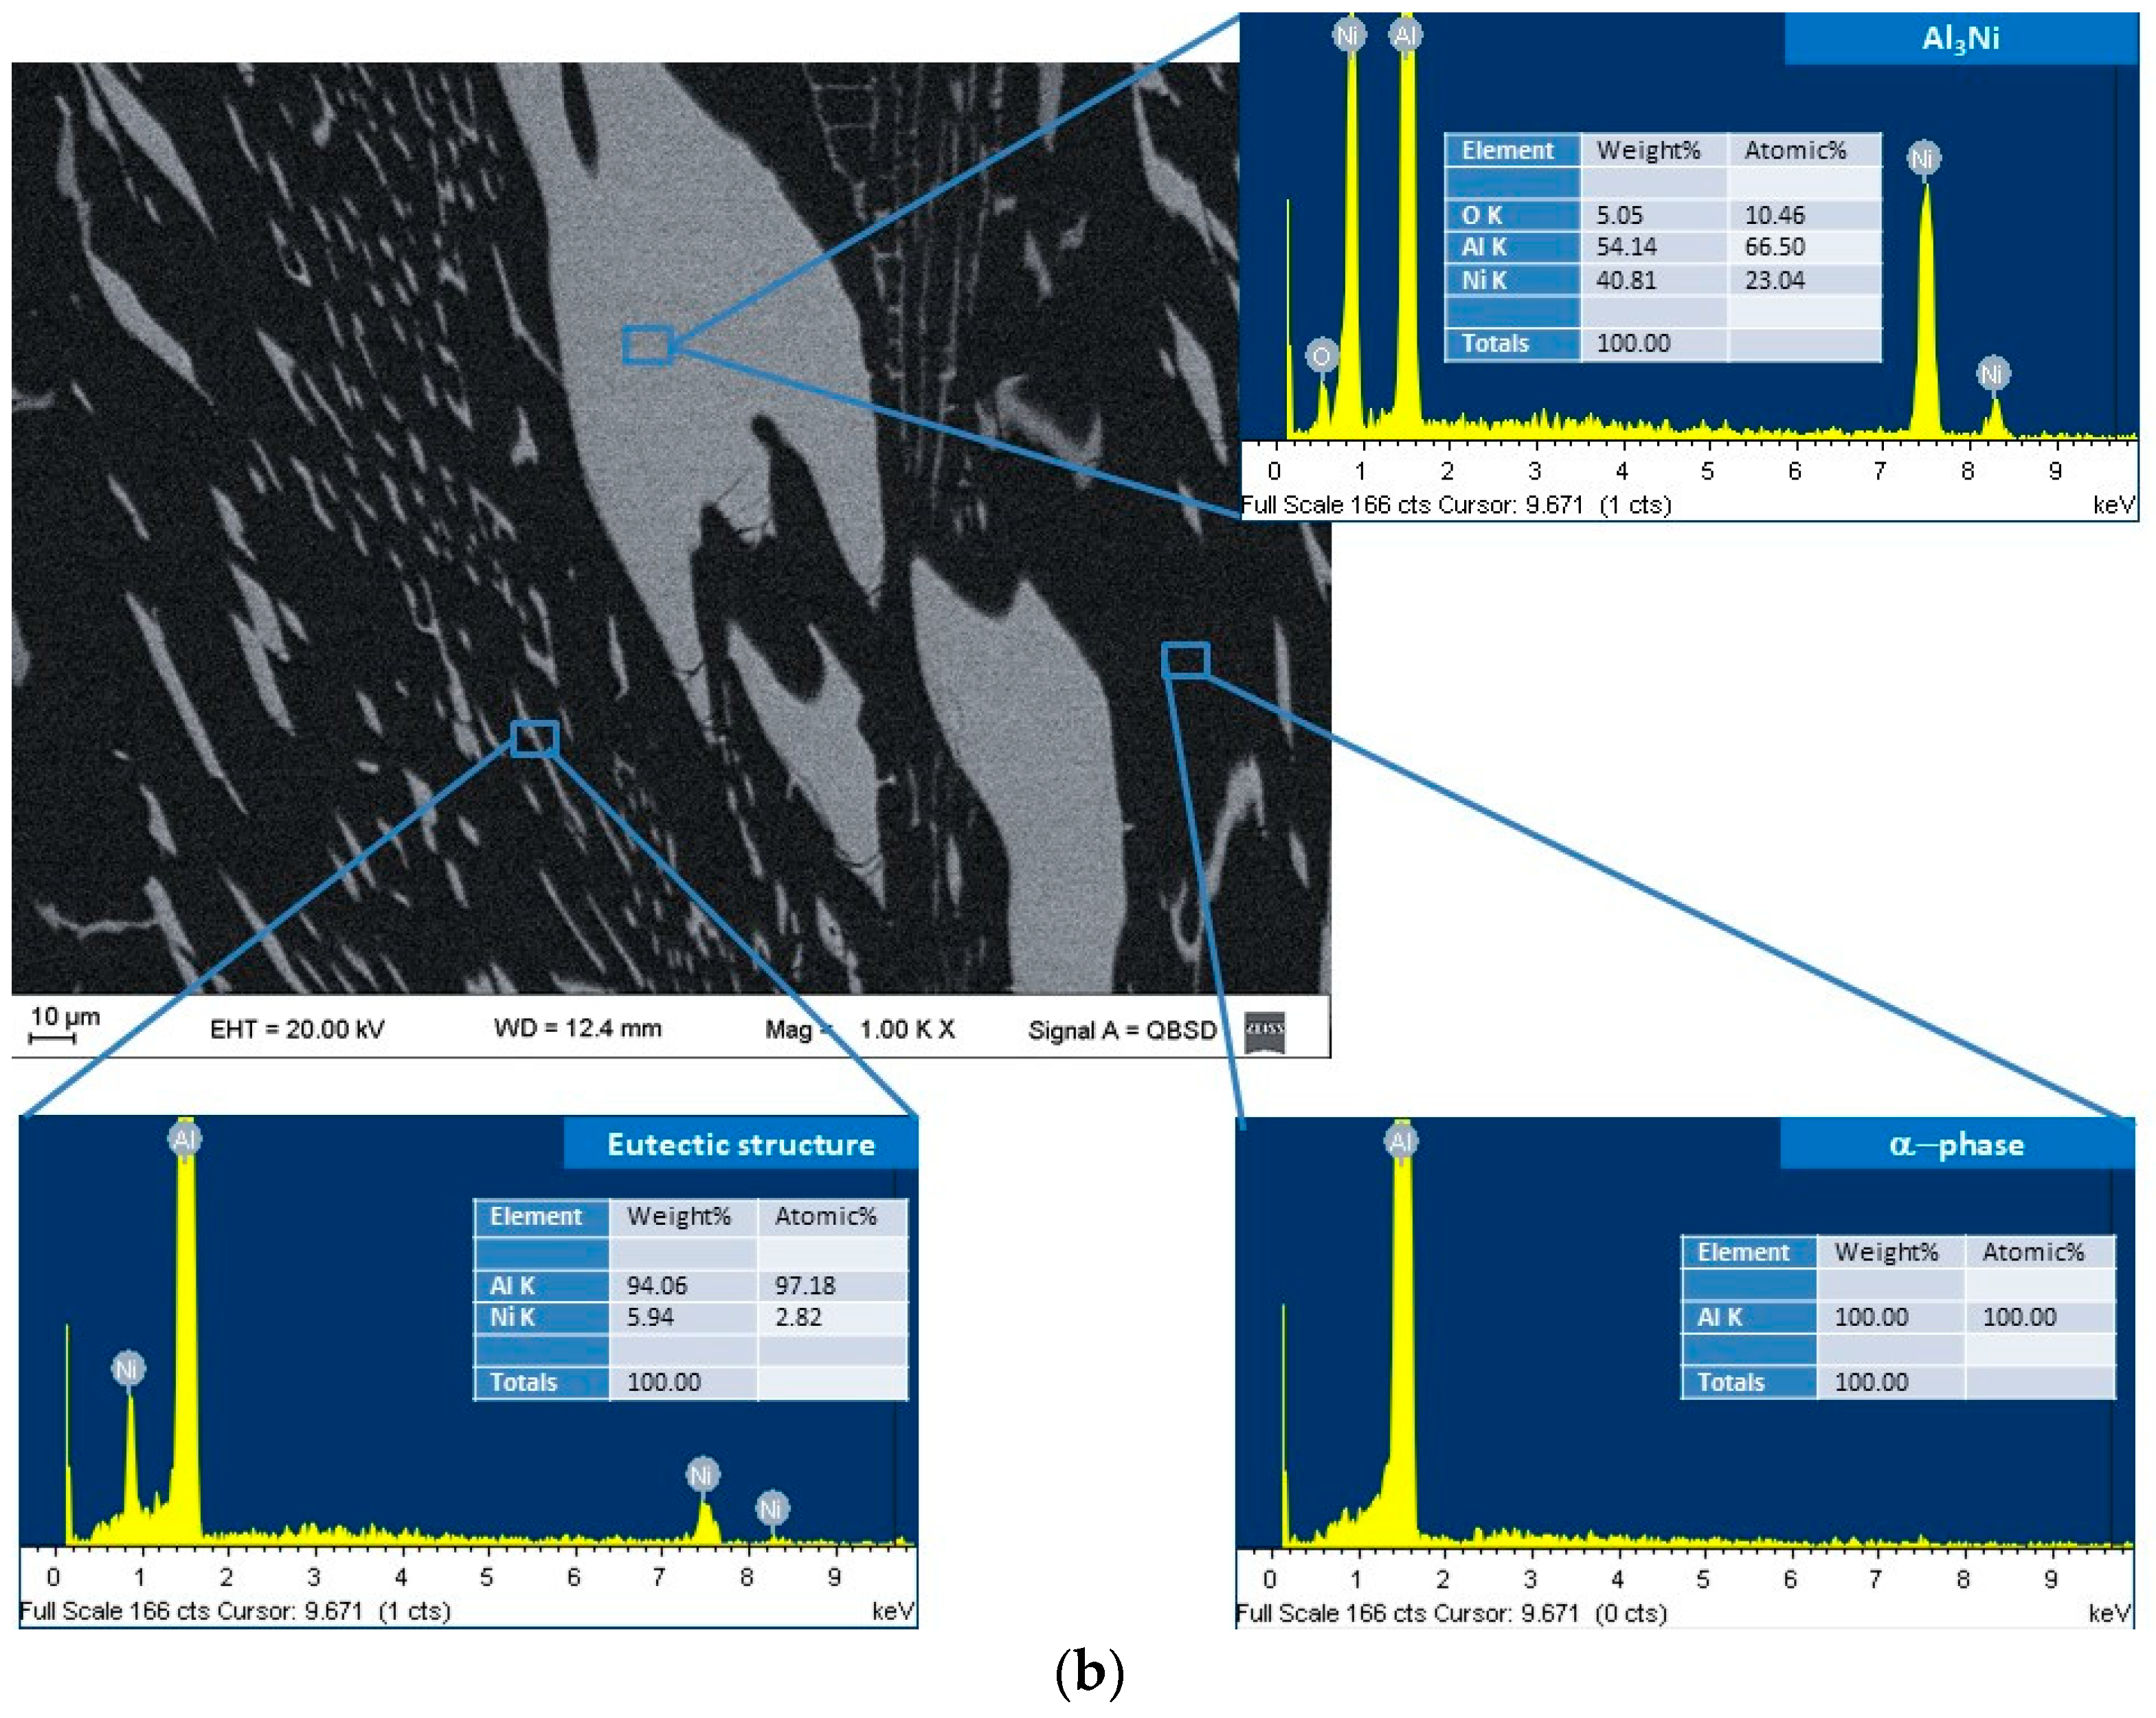
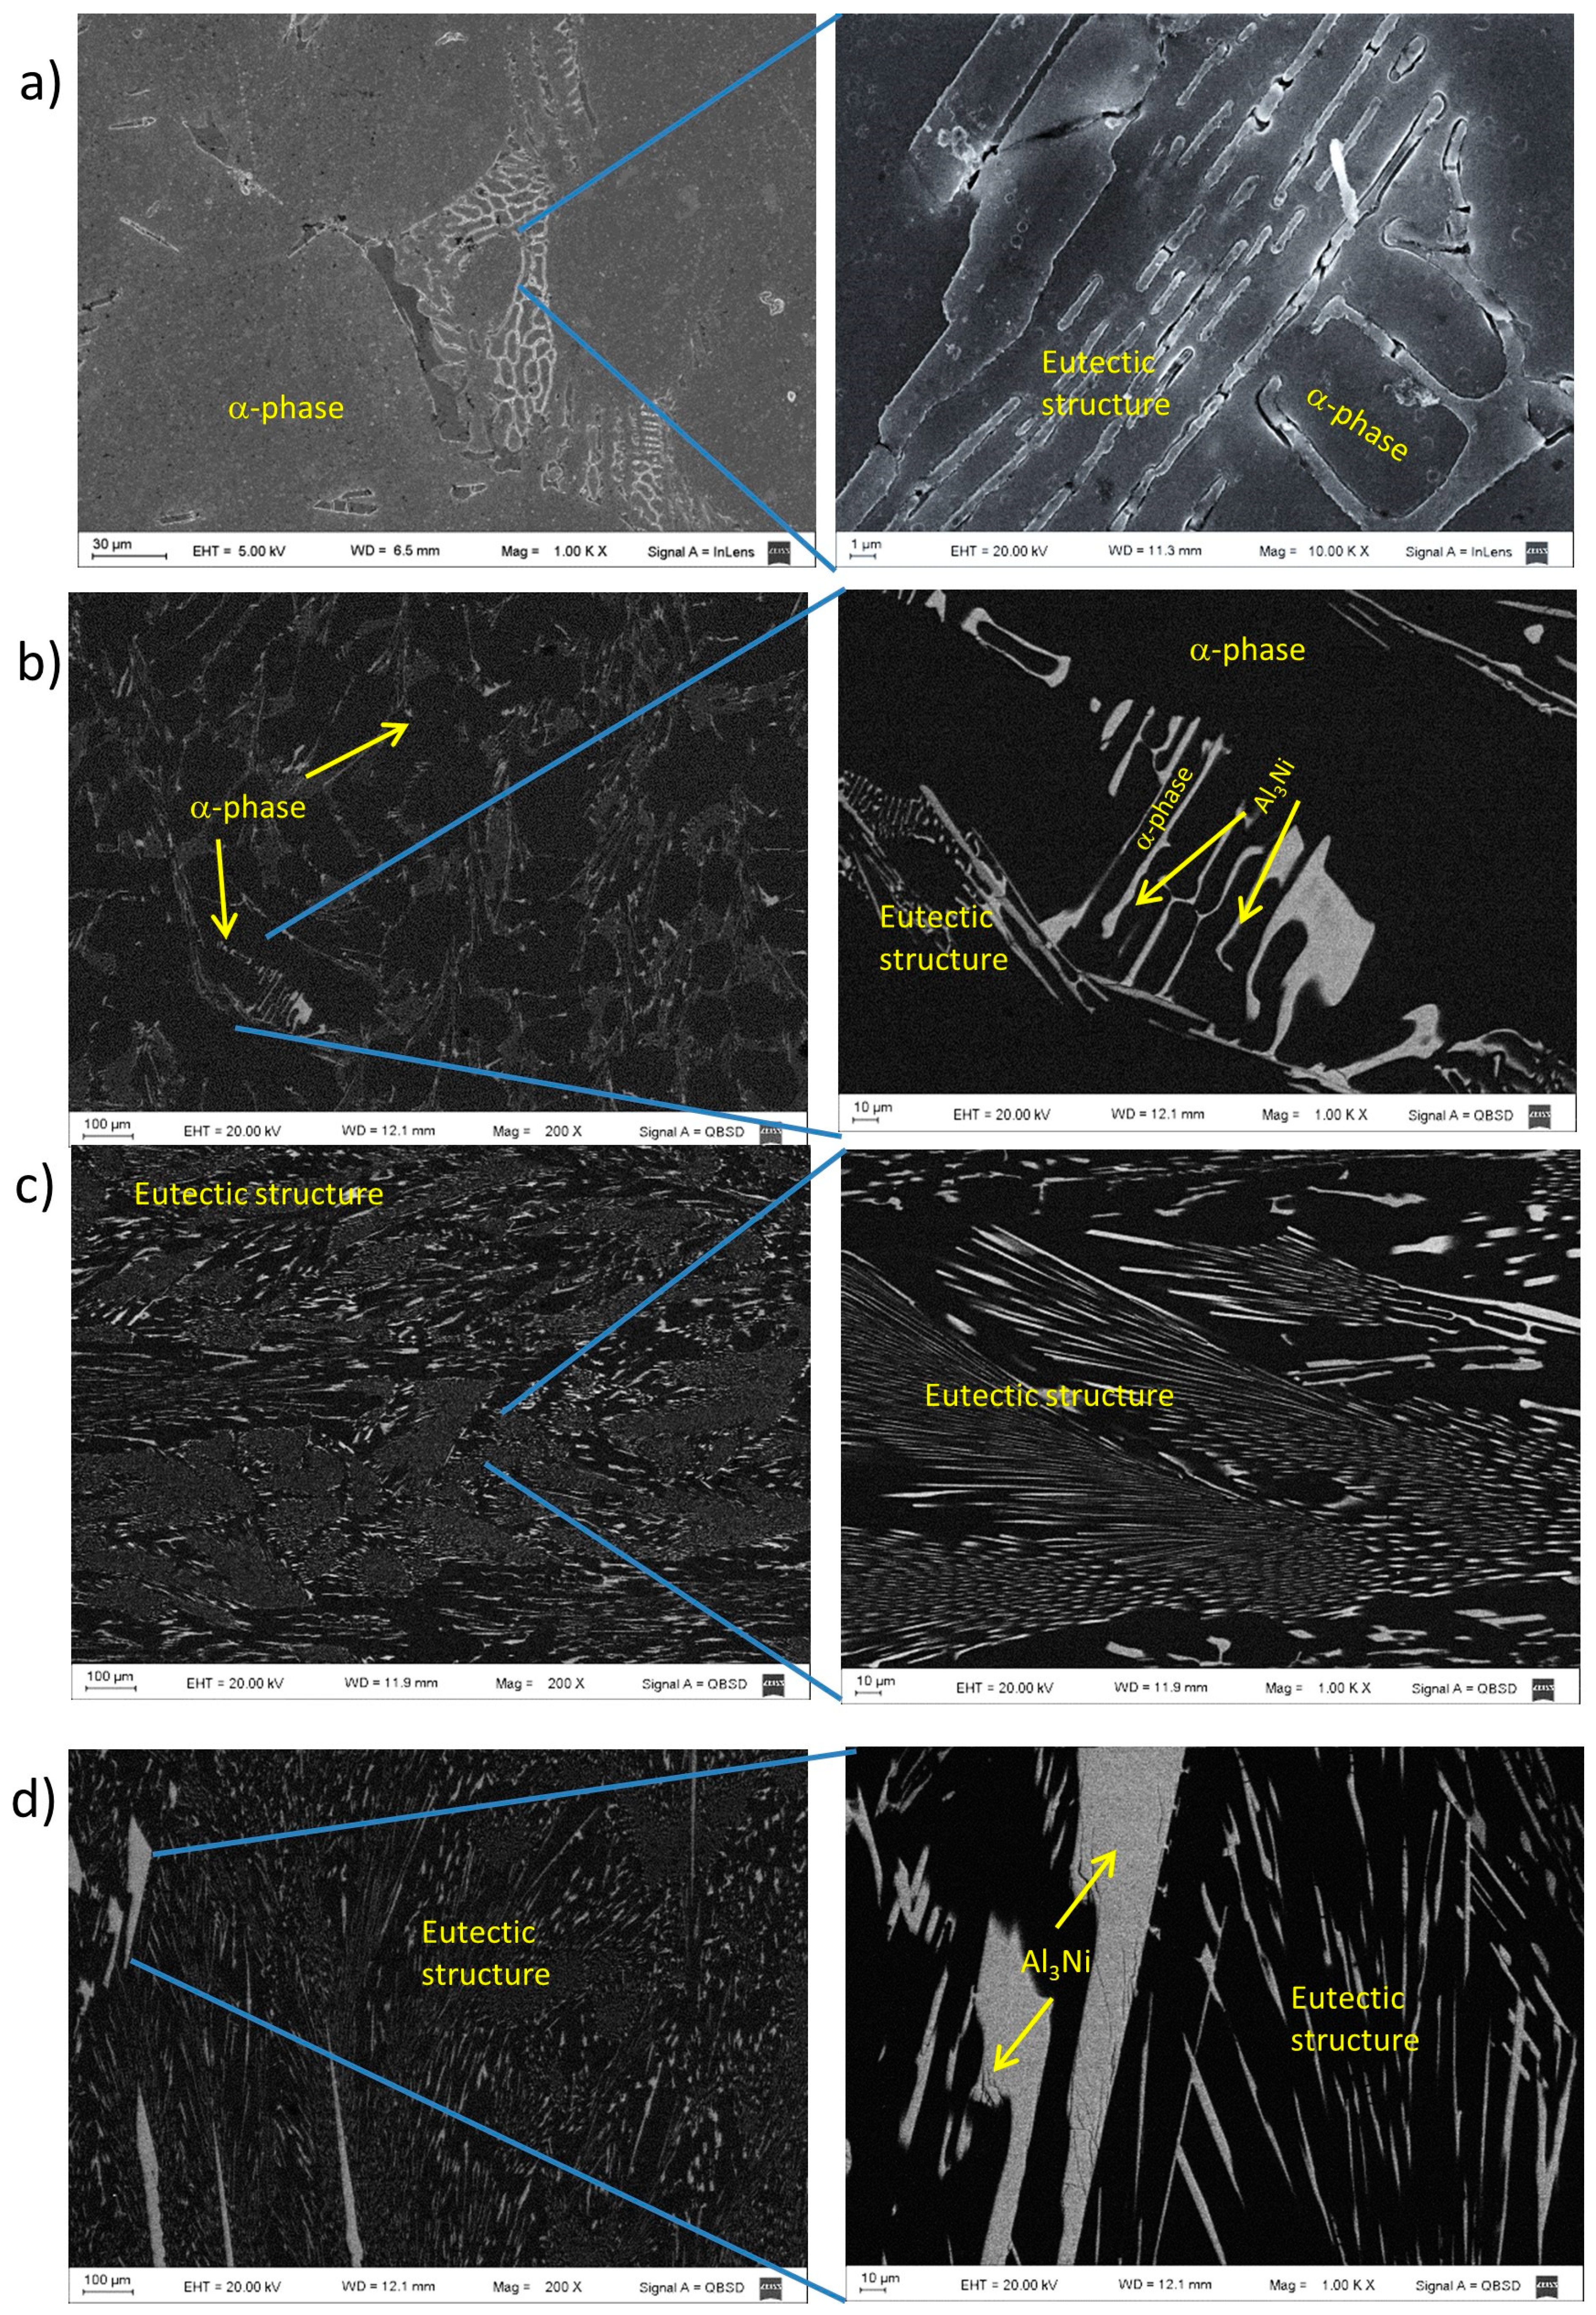
3.4. Microstructure and Microhardness

Figure 6 shows a portion of the phase diagram of the Al-Ni system (up to approximately 60 wt. %Ni) that is of interest depending on the composition of the alloys studied [20]. It is possible to identify a eutectic transformation that occurs at 629.9 °C for a composition of Al-5.7wt. % Ni. Consequently, the microstructures of the Al-Ni alloys in the range of compositions studied are made up of three phases: the α-phase, rich in aluminum (with a nickel content of up to 0.24% [20]), the intermetallic compound Al3Ni, and the eutectic structure consisting of thin Al3Ni needles surrounded by the alpha phase [32]. The compositions of these phases were determined by EDS and can be seen in Figure 7 for (a) Al-3wt. %Ni hypoeutectic alloy and (b) for Al-8wt. %Ni hypereutectic alloy.
The distribution of the phases in the microstructure depends on the nickel content of the alloy. In the hypoeutectic alloys, Al-1wt. %Ni and Al-3wt. %Ni, the microstructure is characterized by an α-phase (dendritic matrix) and the eutectic structure constituting the interdendritic region (Figure 8a,b). The Al-5.7wt. %Ni alloy presents the typical eutectic microstructure, as can be seen in Figure 8c. The microstructure of the hypereutectic alloy, Al-8wt. %Ni is shown in Figure 8d. It presents thick particles of Al3Ni intermetallic surrounded by the eutectic structure.
In Figure 9, the microhardness values measured for each of the phases of the Al-Ni alloys are presented. It was found that the eutectic region has greater microhardness than the α-phase, logically associated with the higher Ni-content. It is also observed that the microhardness values increase in each region as the Ni content increases until the eutectic composition is reached.
In order to obtain a relationship between the solidification parameters like cooling rate, Ve, and the microhardness (HV) for the directionally solidified Al-Ni alloys, a comparison of the HV obtained in the different grain zones of the samples was carried out.
In Figure 10, it is observed that the HV values are smaller in the areas furthest from the base. This is attributed to the fact that in further areas, the heat extraction rate is lower and the grains are less refined; similar values were found by other authors [29].
The highest values of cooling rate, Ve, generate refinement in the secondary dendritic spacing, λ2, and lamellar spacing, S2, obtaining greater microstructural refinement in the zones of the samples close to the base, as seen in Figure 11a–d.
Figure 9 presents a comparison of the HV values obtained in different positions of the sample for the eutectic phase. In this figure, an increase in HV values was observed in the zone close to the base of the sample where there are columnar grains. These values decrease linearly as we move away from the zone close to the heat extraction device (base of the furnace). This behavior is attributed to the fact that in zones further away from the base of the furnace, the Ve values are lower, as observed in Figure 3. This decreasing behavior of the Ve generated a refinement of the grain size, distribution and morphology of the intermetallic compound, thus improving the mechanical property (HV).
The improvement in the HV values can be observed in Figure 12a, where the variation of HV with respect to the secondary dendritic spacing, λ2, is observed for Al-1wt. %Ni and Al-3wt. %Ni hypoeutectic alloys. Figure 12b shows the variation in HV with respect to the lamellar spacing, S2, for Al-5.7wt. %Ni and Al-8wt. %Ni eutectic and hypereutectic alloys, respectively. In both cases, it was observed that the decrease in the values of λ2 and S2 leads to an increase in the HV values. Finally, it is important to note that in all cases, a small increase in the HV values was observed as a function of the Ni-content and also, for each concentration, it was found that as the cooling rates increased, the values of HV also increased linearly because the mechanical properties are linked to microstructural refinement (the values of λ2 and S2 were decreasing) and higher Ve.
Similarly, Martínez-Villalobos et al. [32] found that by increasing the Ni-content in Al-Ni as cast alloys, a small increase in the hardness of the alloys was evident from a hypoeutectic to a hypereutectic composition. It should be noted that the aforementioned authors did not carry out differentiated microhardness measurements for the different phases of the alloys.
In the present study, for the alloy with a hypereutectic composition, the HV of the eutectic region in the columnar zone is lower than that for the eutectic alloy. This may be due to the decrease in the Ni-content corresponding to the eutectic region at the expense of the precipitation of the intermetallic compound Al3Ni. The HV values measured for the Al-8wt. %Ni alloy in the phase corresponding to the Al3Ni intermetallic are markedly higher than those measured with respect to the other areas of the alloys (see Figure 9).

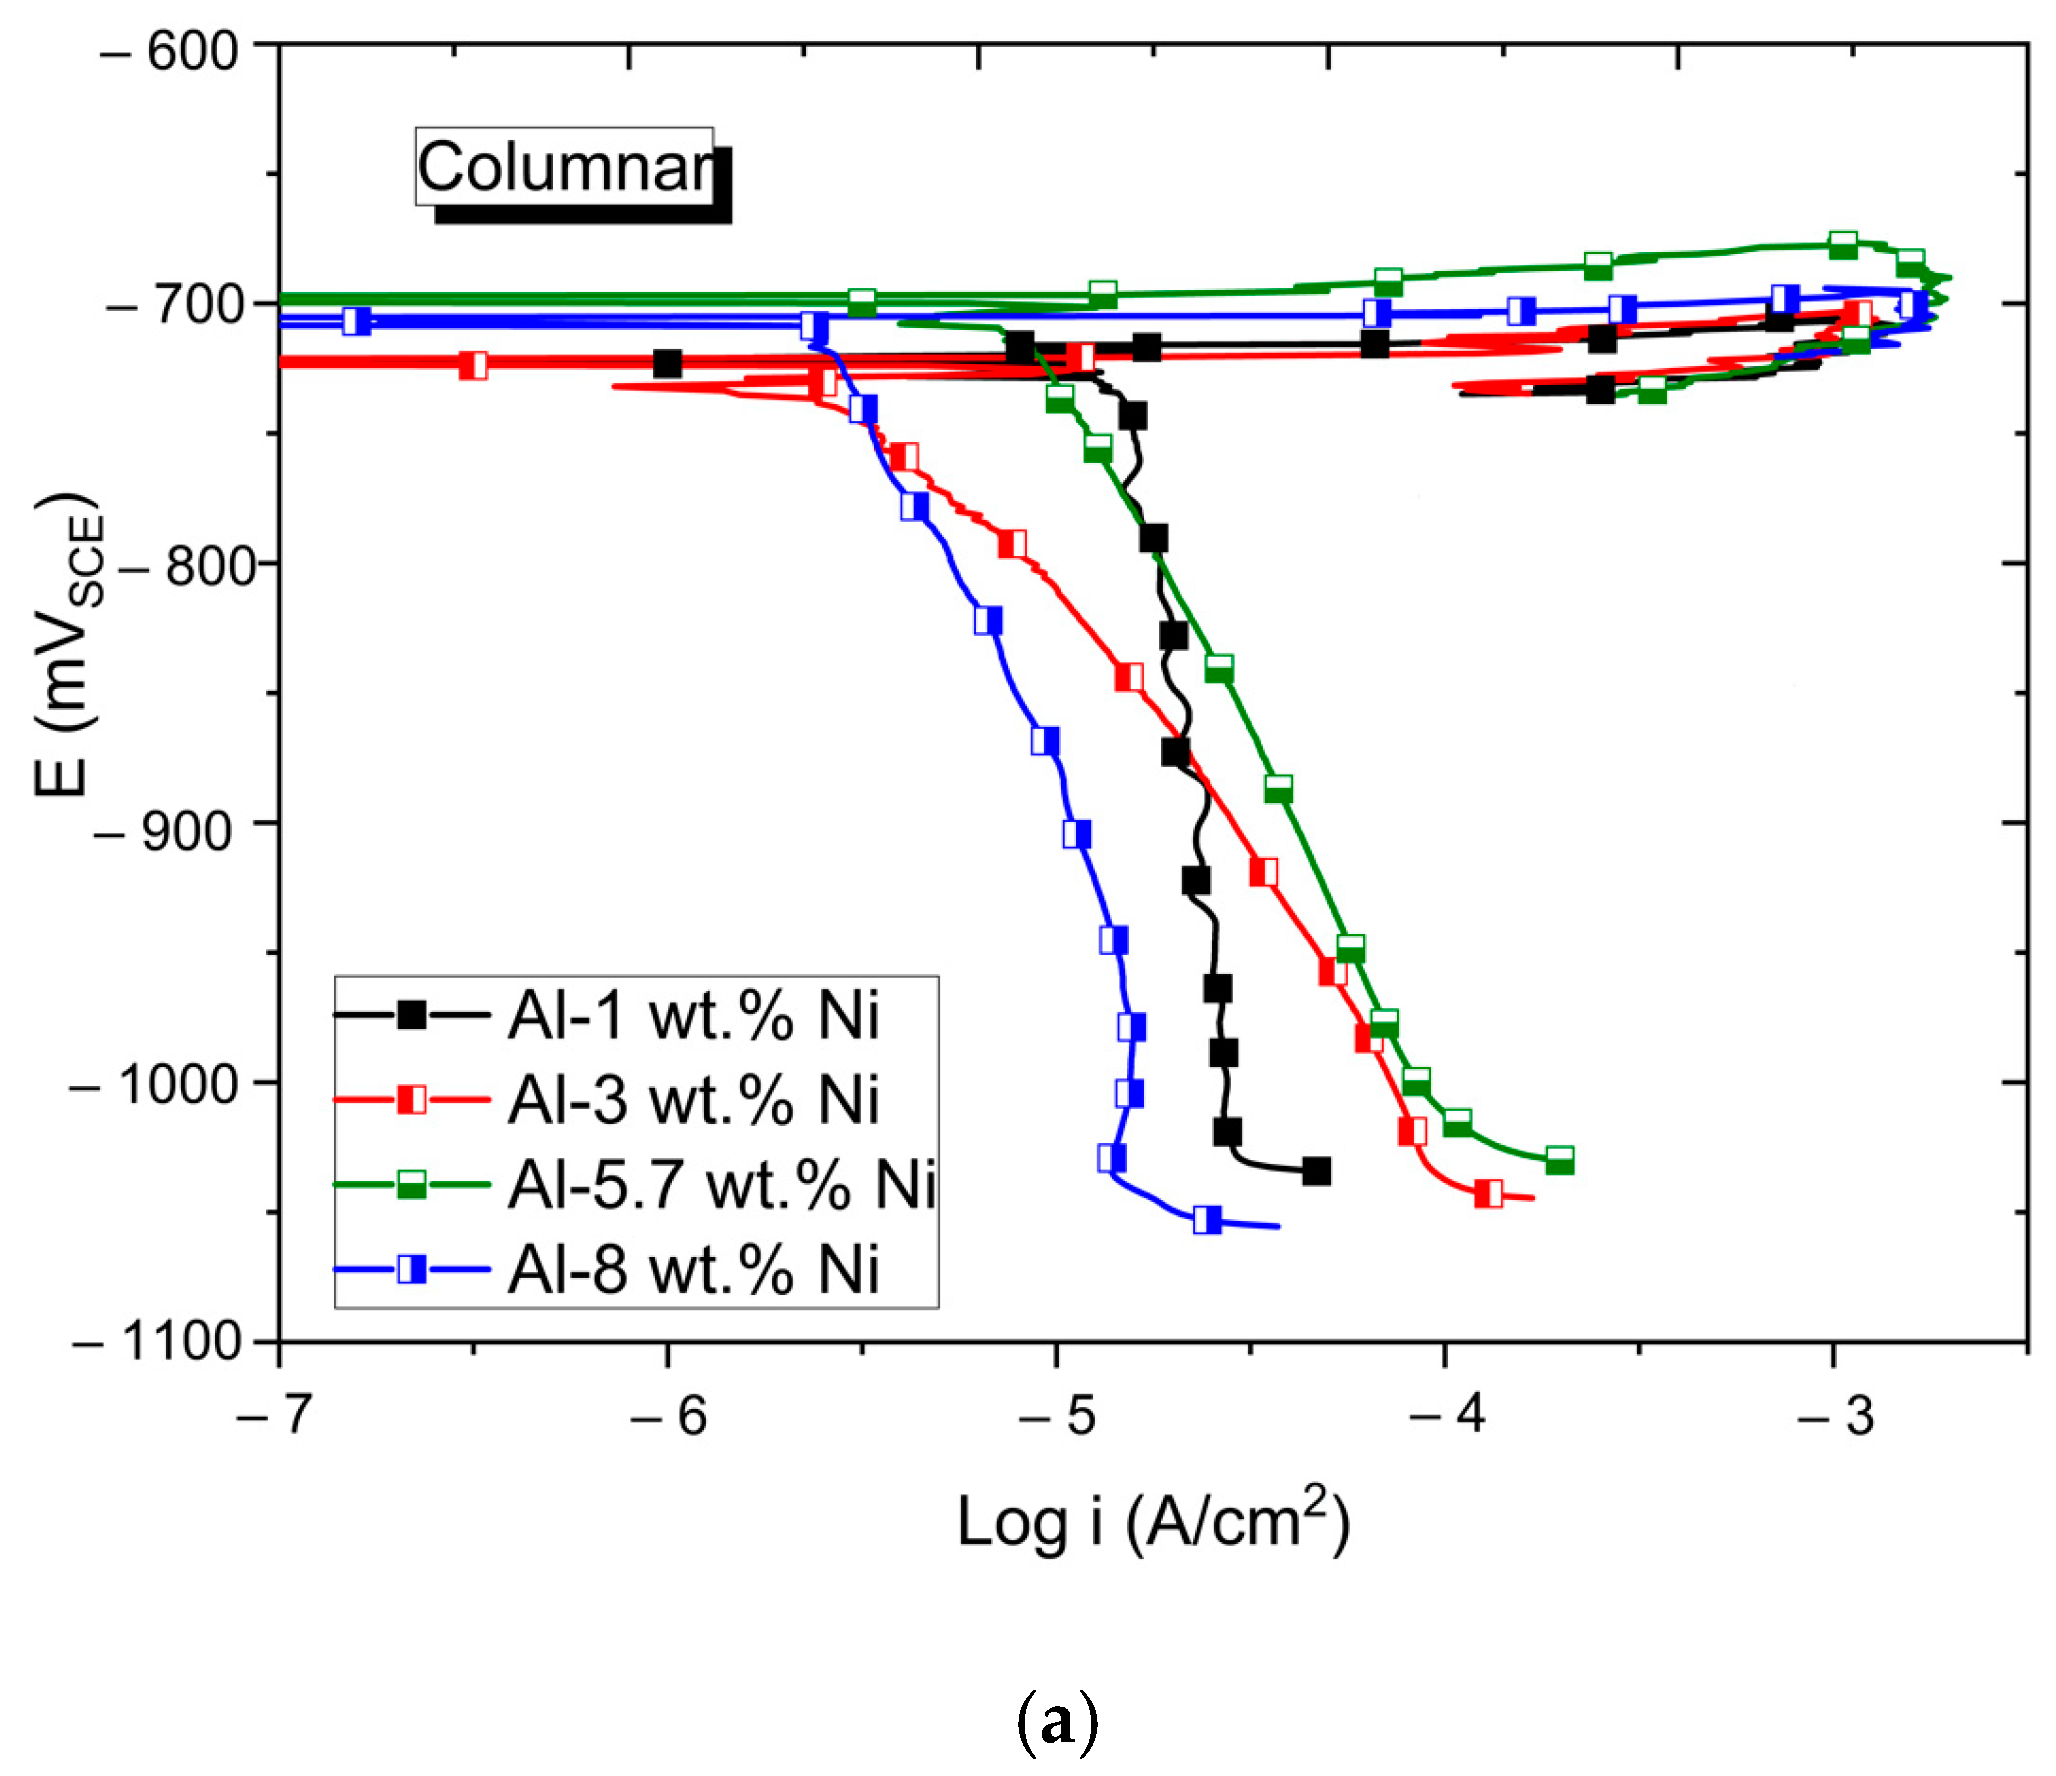
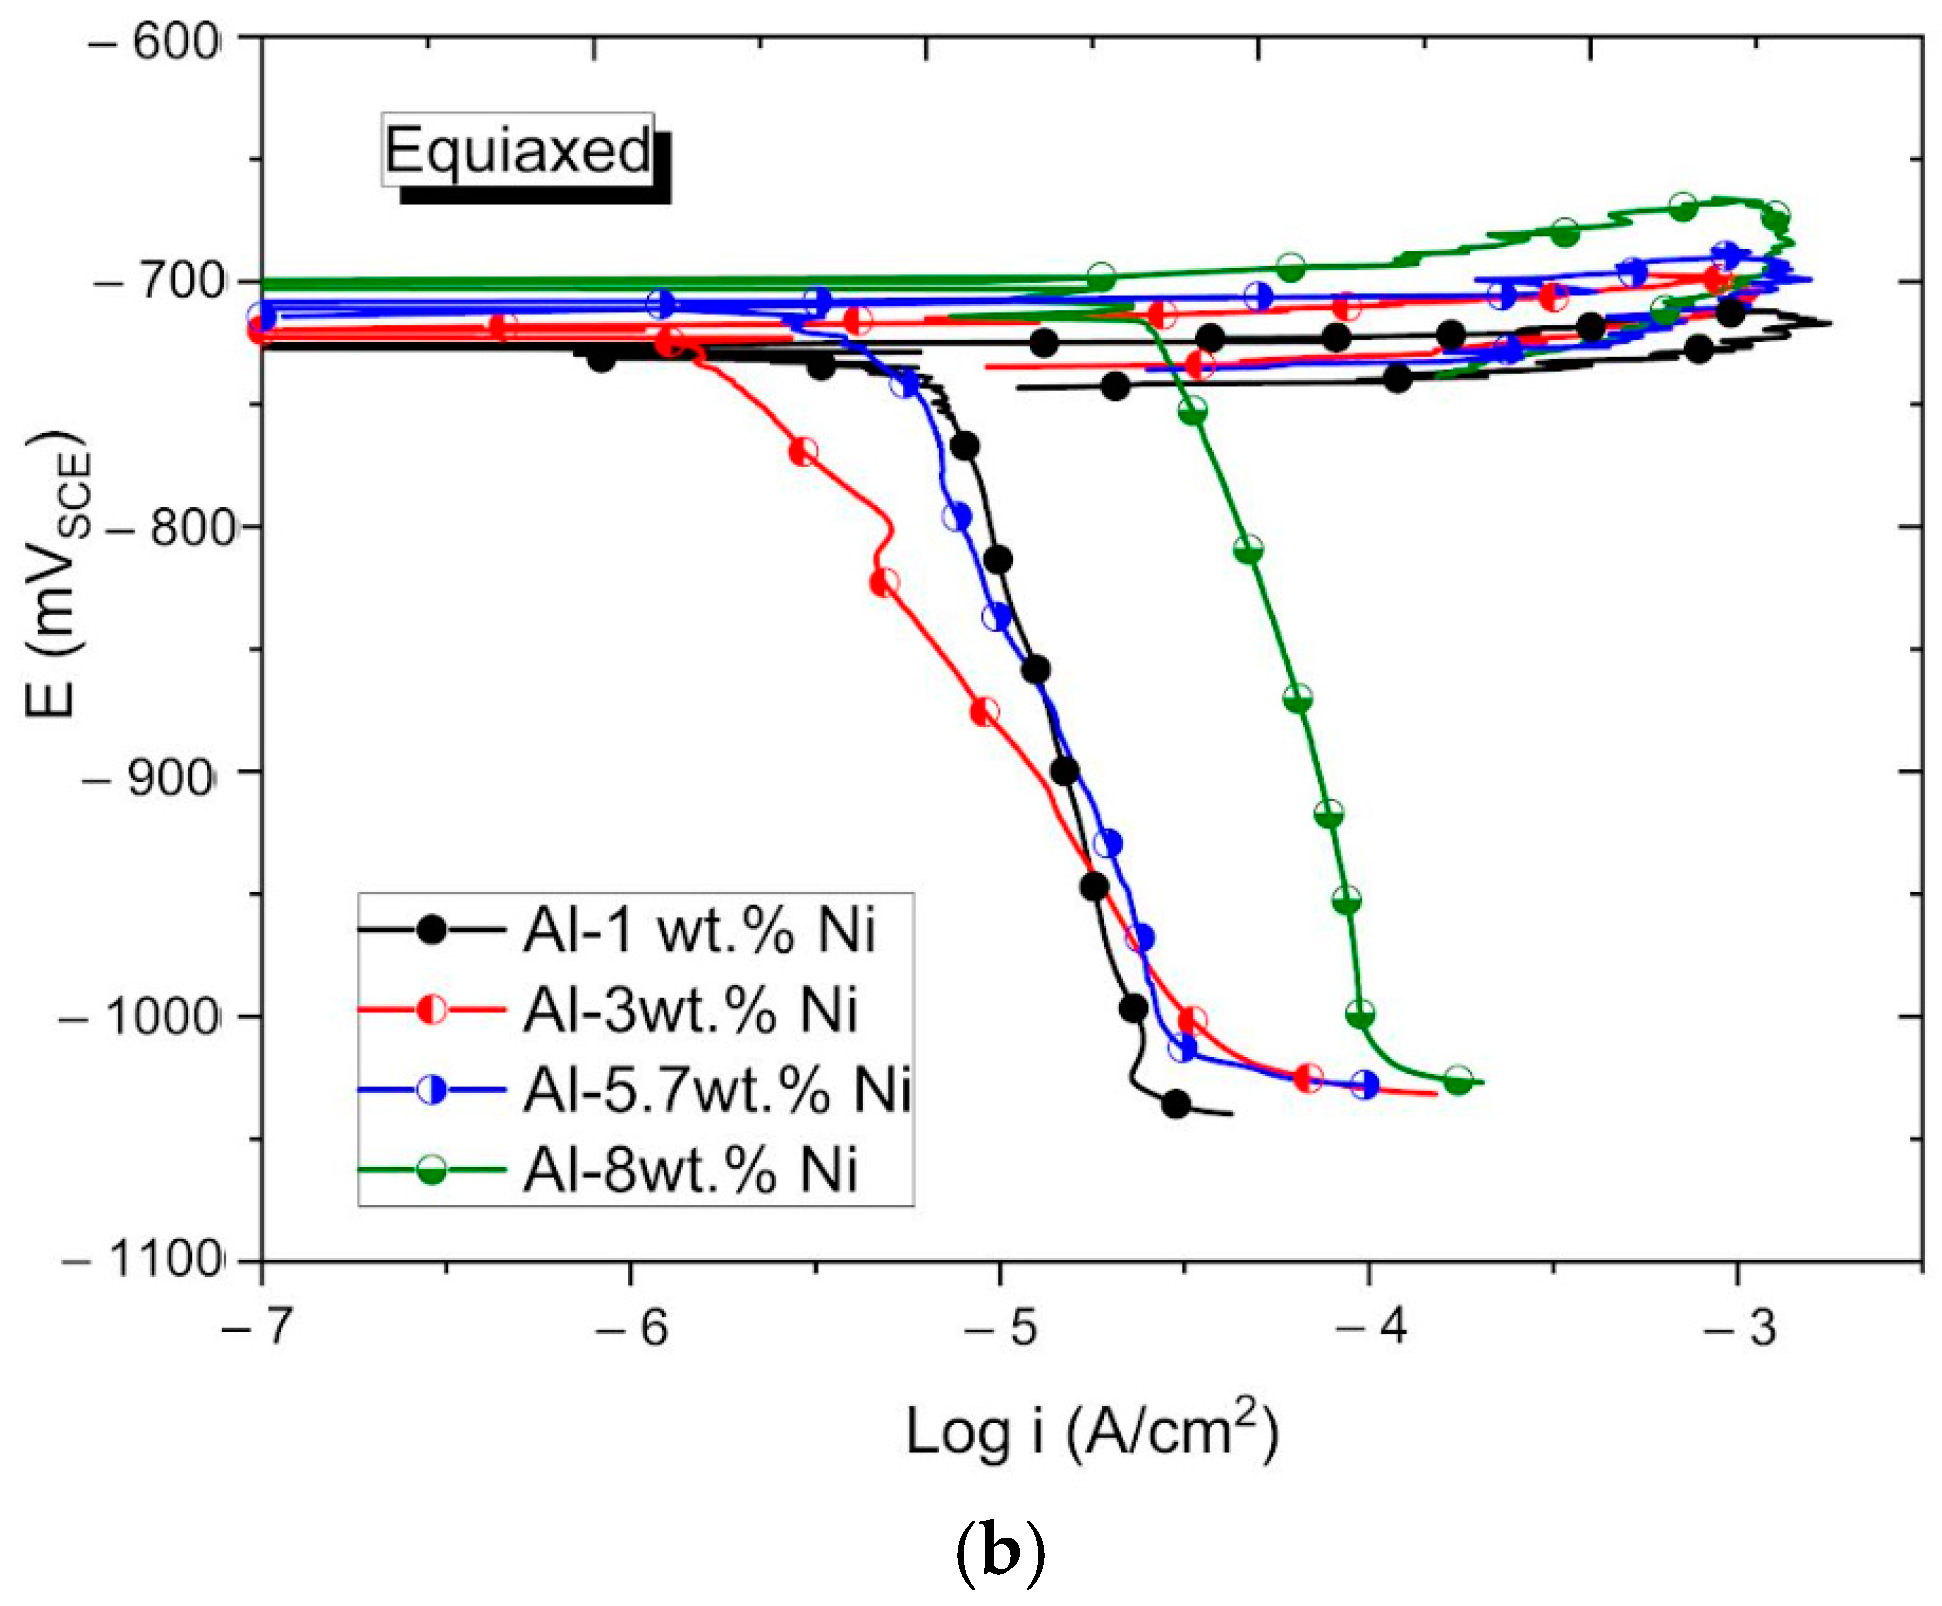
3.5. Potentiodynamic Polarization Curves

Figure 13 shows the cyclic potentiodynamic polarization curves obtained according to the type of grain for all the compositions of Al-Ni alloys studied. In Figure 13a,b, the results obtained for both columnar and equiaxed grains zones are observed. The shape of curves is similar for all compositions and grain zones. The direct dissolution of the material is evident after reaching the corrosion potential. Other authors [16,17] have already reported the beginning of the pitting phenomenon when studying Al-Ni alloys, with a content of around 5%Ni in solutions with much lower NaCl content than that used in this research. In Table 2, the measured corrosion potentials, Ecorr, are presented.
From Figure 13, it is observed that the anodic Tafel slopes of the curves are practically zero. That is, when reaching the Ecorr, the Al-Ni alloys studied are pitted. Consequently, it is possible to establish that the Ecorr values presented in Table 2 correspond to the Epit of the Al-Ni alloys. A similar behavior was reported by Zaid et al. [33] for the commercial alloy AA6061 in acid solutions containing chlorides. The coincidence of the Epit with the Ecorr can also be seen in the potentiodynamic curves for other Al base alloy systems: Al-Mg [18], Al-Cu [19], Al-Co [34,35], Al-Pd [36] in solutions containing chlorides.
The susceptibility to pitting of the Al-Ni alloys studied is evident by observing the evolution of the open circuit potential over time (Figure 14). The oscillatory aspect of the Eoc values observed in Figure 14 is very close to the potentials in Table 2, which we have assimilated with Epit. This would indicate that the Al-Ni alloys would be suffering pitting corrosion during the Eoc measurements. According to Duriška et al. [37], the oscillatory appearance of the curves, characteristic of the pitting process, is a consequence of the differences in current densities inside the pit and on the surrounding surface.
Because sufficiently long linear regions could not be found in the anodic branches of the potentiodynamic curves, the corrosion current density values, icorr, were calculated by Tafel extrapolation of the cathodic polarization branch, according to the procedure proposed by Lekatou et al. [35]. The values obtained are shown in Table 2. The icorr values obtained are in the same order of magnitude as the icorr presented for other aluminum-based binary alloy systems, such as Al-Co and Al-Pa [37]. In the interpretation of these results, it is important to keep in mind that, for alloys that are under the pitting process, the active area of the corrosion phenomenon is unknown, that is, the area inside the pits [38].
In Table 2, it can be seen that the Al-5.7wt. % Ni alloy, which corresponds to the eutectic composition, presents the noblest Epit values, followed by the Al-8wt. %Ni alloy, with a hypereutectic composition. Hypoeutectic alloys have the least noble potential values that are very close to each other.
Osorio et al. [16] found that a higher fraction of the eutectic structure is associated with a nobler pitting potential. Based on the results of Table 3, an analogy could be made to this result considering that the alloy with eutectic composition, Al-5.7wt. % Ni, presented the highest Ecorr value, which we assimilate to Epit, due to the shape of the curves. In line with these results, Zhang et al. [17], studying the effect of the microstructure on the corrosion resistance of an Al-5.4wt. %Ni alloy in NaCl, found that the more homogeneous structures presented higher pitting potential values and lower corrosion densities.
Regarding the influence of grain structures, for the same alloy composition, the zone of columnar grains presents nobler Epit values than the zone of equiaxed grains. However, these differences between Epit values are less than 5 mV, so they are not considered significant differences.
Therefore, it is possible to establish that the grain structure does not influence the Epit. This result is consistent with what was reported for aluminum and other alloy systems [19,39].
After making the potentiodynamic curves, the surface of the samples was analyzed using the SEM microscope. The micrographs obtained can be seen in Figure 15. Corrosion phenomena are evident on the α-phase, rich in aluminum, of the Al-1wt. % Ni alloy (Figure 15a).
In the samples with the highest Ni content, corrosion was also located in the dendritic region, very close to areas with the presence of eutectic phase (Figure 15b,c). In the hypereutectic alloy, the corrosion effect is visible between the Al-3wt. %Ni precipitates (Figure 15d). The presence of pits in the matrix corresponding to the α-phase was already reported by other authors when studying the electrochemical behavior of Al-Ni alloys [17]. In the EDS mapping, the constituent elements of the alloy are identified. Aluminum is present in the dendritic matrix, and Ni is distributed as thin sheets, which correspond to the intermetallic Al3Ni, a constituent of the eutectic phase. Element distribution mapping detected the presence of oxygen, suggesting the formation of an oxide due to the corrosion process. Since the color intensity of the images is greater in the aluminum-rich region, the oxide formed was Al3O2. The surface analysis allowed us to identify the presence of a fraction of Cl distributed uniformly. This would be explained by the adsorption of Cl ions on the oxide surface, a frequent phenomenon during the pitting process [40,41].

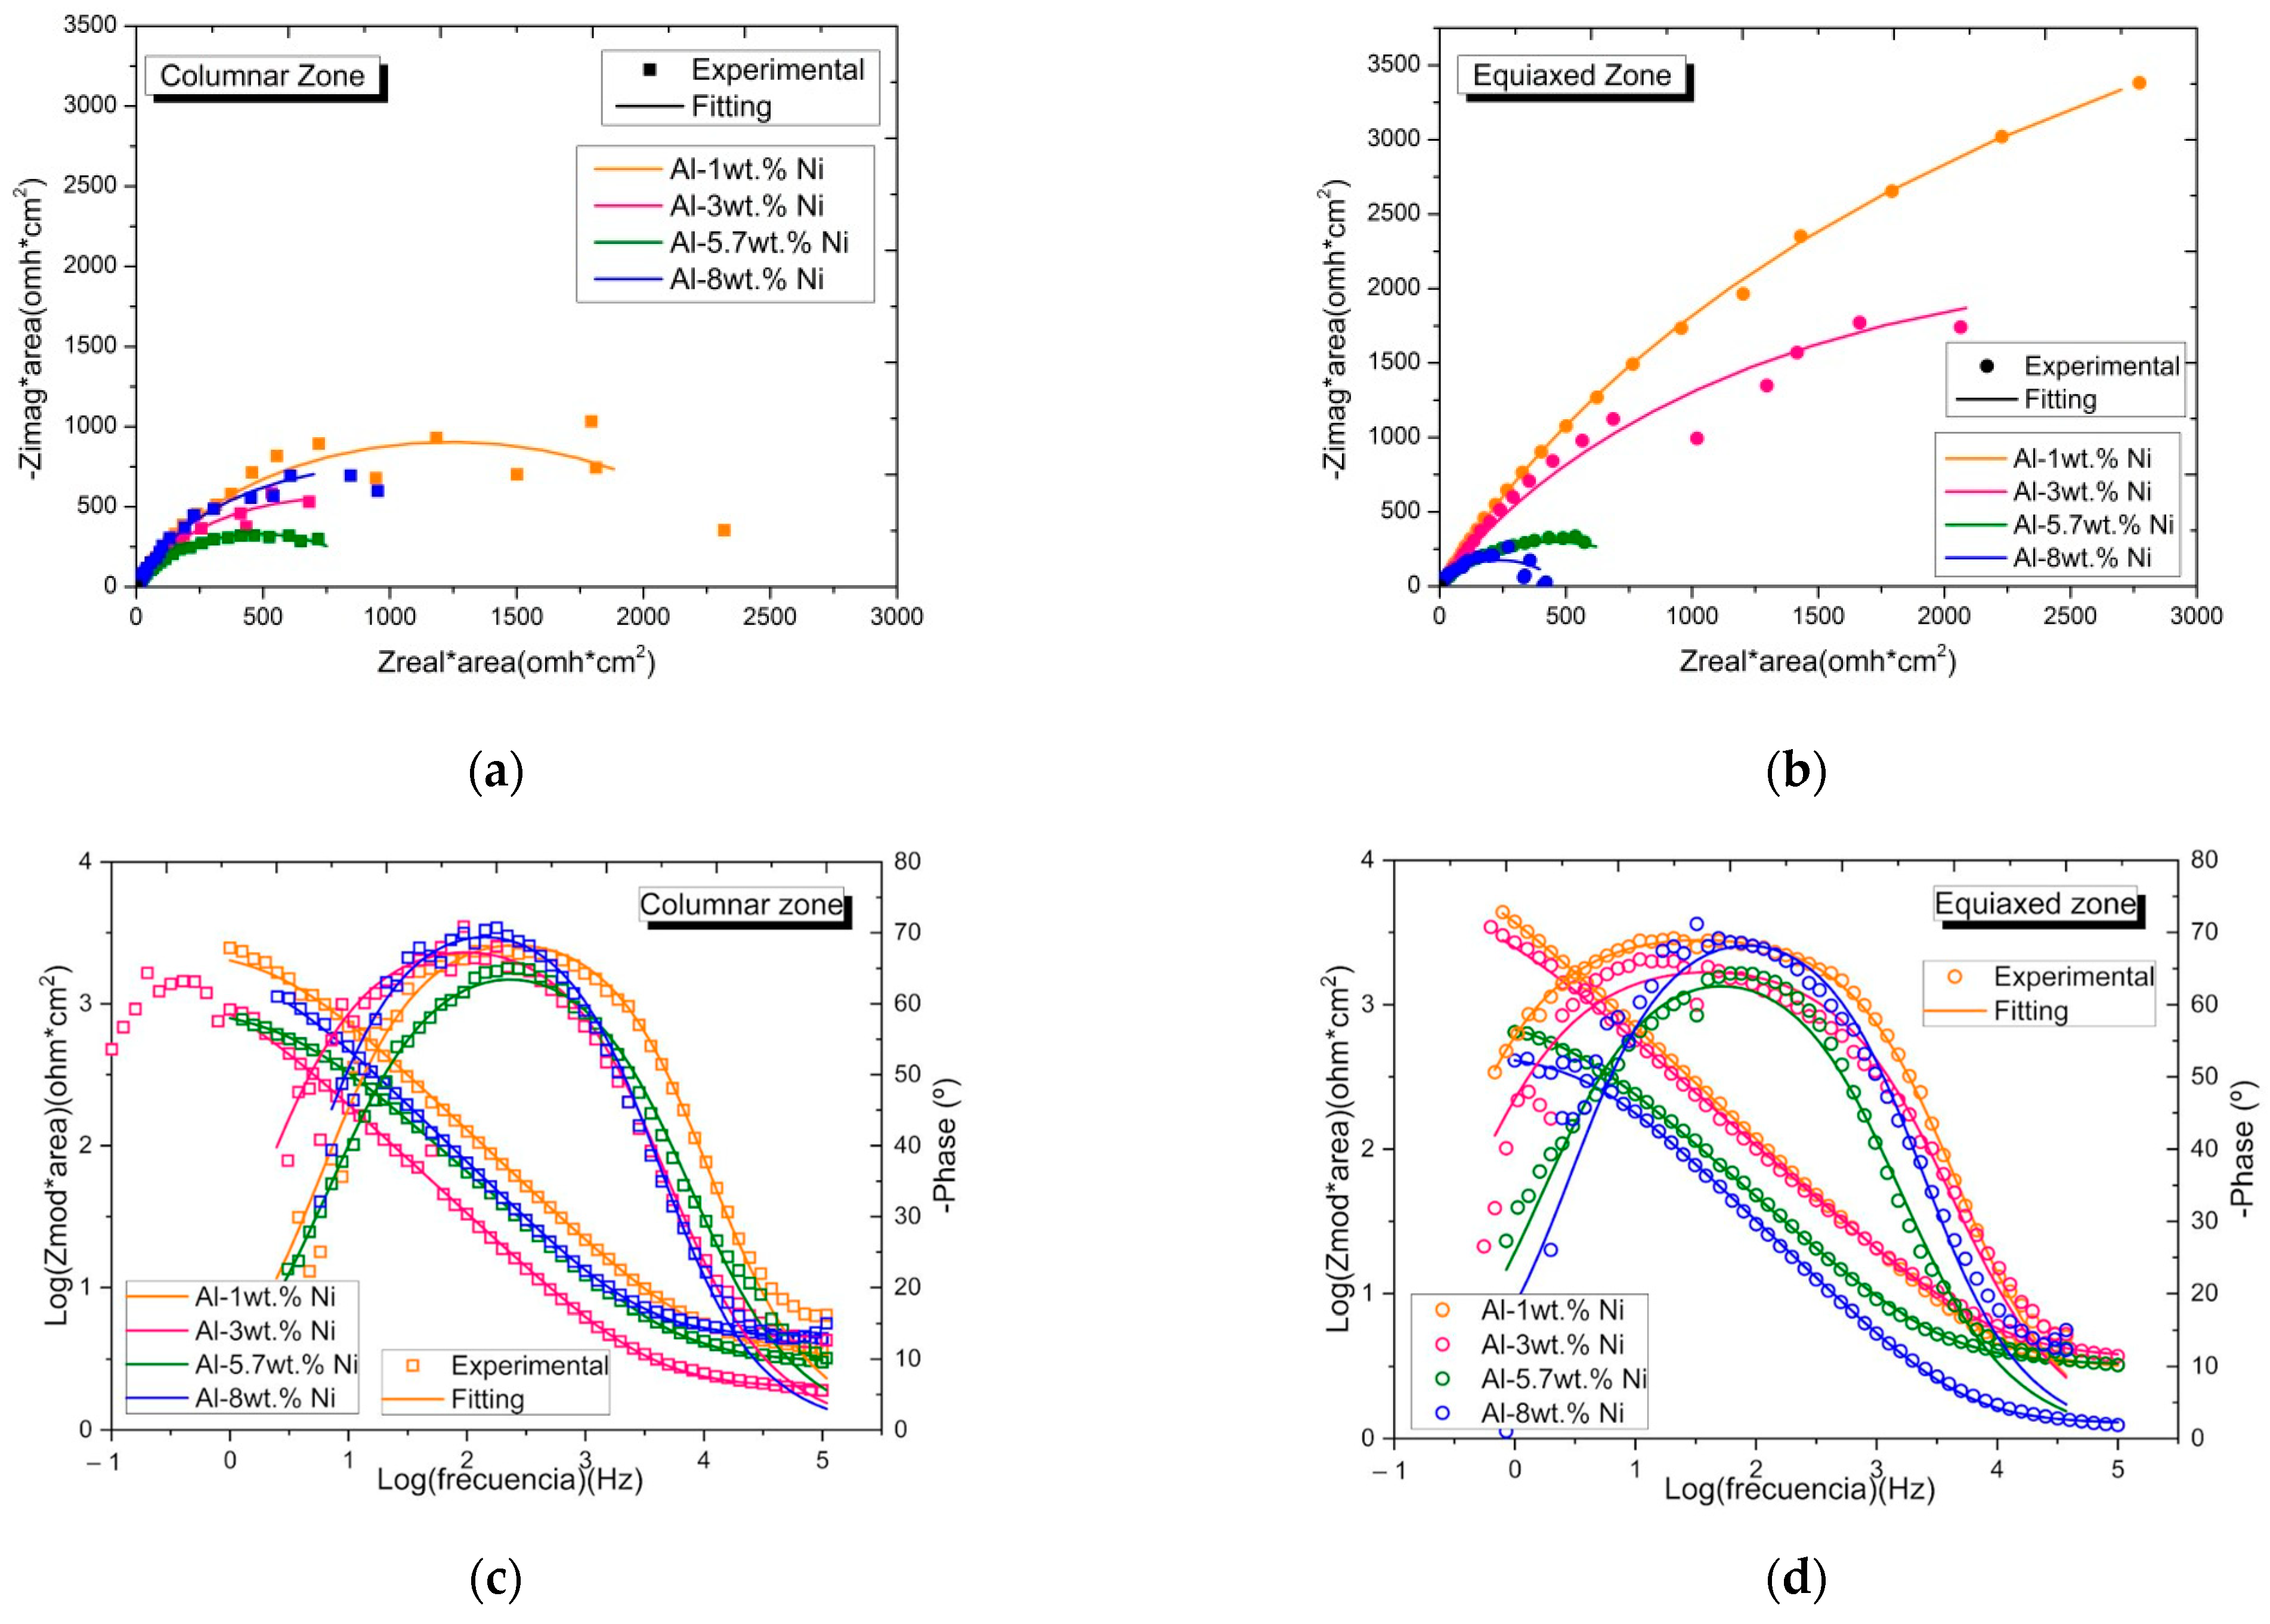
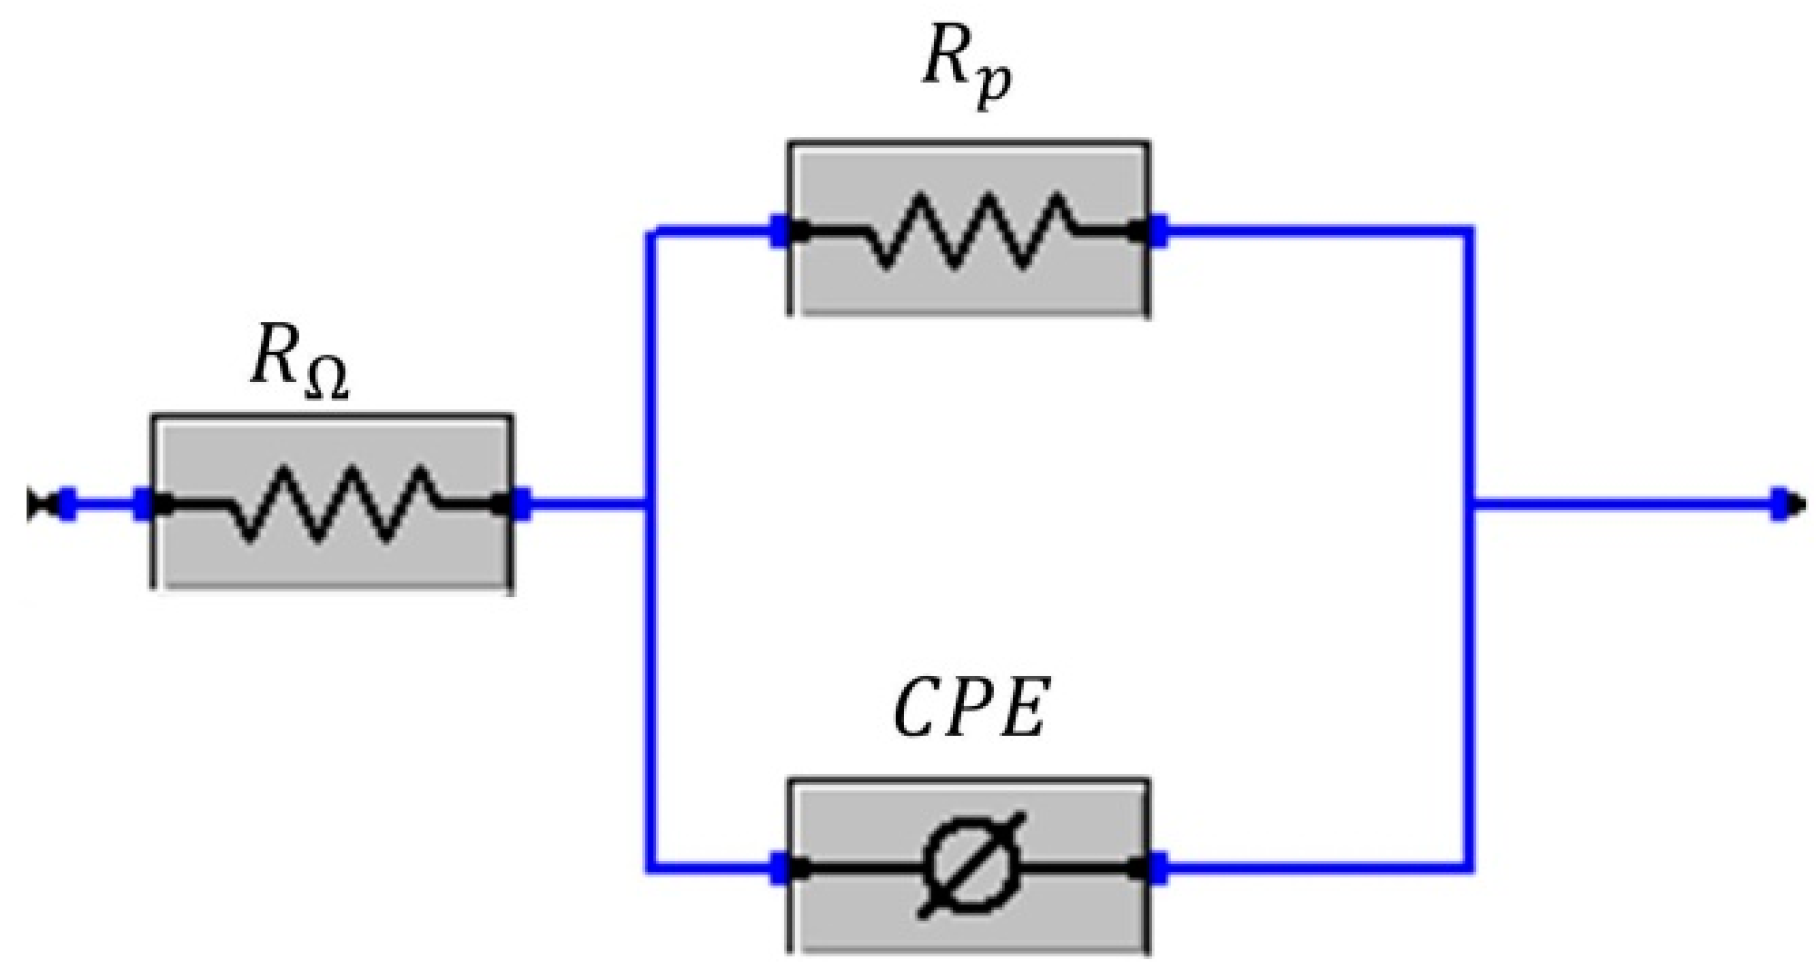
3.6. Electrochemical Impedance Spectroscopy

The electrochemical impedance spectra were obtained for the Al-Ni alloys in order to characterize the electrochemical phenomenon that takes place on the surface of the samples.
In Figure 16a,b, the Nyquist diagrams can be seen, and in Figure 16c,d, the Bode diagrams are presented (Figure 16a,c for columnar grains and Figure 16b,d for equiaxed grains). The presence of a single capacitive contribution is clearly observed. The capacitive diameter observed in the Nyquist diagrams can be associated with the corrosion resistance of the materials. A larger arc diameter indicates greater corrosion resistance [42]. It is then observed that the equiaxed grain zone has greater corrosion resistance than the columnar grain zone for hypoeutectic alloys. On the other hand, for the hypereutectic alloy, Al-8wt. % Ni, the trend reverses.
To adjust the spectra, the Randles equivalent circuit was used (Figure 17), commonly used to describe interfaces that are undergoing the initial stages of the corrosion process [38,43].
The physical meaning of the elements that constitute the equivalent electrical circuit of Figure 17 is described below: RΩ represents the resistance of the electrolyte, Rp is the resistance to polarization related to the charge transfer resistance of the oxide film, and CPE is the capacitive element associated with this oxide layer. The use of a CPE to replace a capacitor is due to the need to represent the non-ideal behavior of the surface due to the lack of uniformity caused by roughness, porosity or other factors [18,19,38,42]. The parameter values obtained from the EIS fit are shown in Table 3.
The parameter used as an indicator of non-ideal behavior is n. According to Kelly et al. [43], for surfaces that are suffering from pitting, this value ranges between 0.7 and 0.95. This is coincident with the values of n measured for the Al-Ni alloys. The values of effective capacitance, Ceff, were calculated using Equation (1) proposed by Fernandes Gomes et al. [44]:
C e f f = C P E 1 / n R s 1 + R p 1 ( 1 n ) / n
The higher the Rp value, the higher the corrosion resistance [18,19,28].
Figure 18 shows the Rp values depending on the composition of Al-Ni alloys for the two grain structures. It is observed that by increasing the Ni content, Rp decreases for samples with equiaxed grain structure throughout the range of compositions studied. Furthermore, the equiaxed grain structure presents higher Rp values than the columnar grain zone for alloys with a composition equal to or lower than the eutectic composition.
It is evident that for Al-Ni alloys containing up to 5.7% Ni, the phase distribution generated by the equiaxed grain structure is more favorable than the phase distribution of the columnar structure. This may be due to the fact that the equiaxed grain structure, associated with higher values of λ2, decreases the contact areas between the α-dendritic matrix and the second phase particles, Al3Ni. The effect of microstructural morphology for alloys consisting of two phases has already been reported by the authors of the Al-Cu system [19]. Zhang et al. [17] reported that a homogeneous distribution of the eutectic mixture is essential to improve corrosion resistance when studying an Al-5.4wt. %Ni alloy. Similarly, Osorio et al. [45] indicated that the distribution of Al3Ni intermetallic particles plays a determining role in the behavior of Al-Ni alloys against corrosion.
For the hypereutectic alloy, Al-8wt. %Ni, the trend is modified, with the zone of columnar grains being the one with the highest Rp. It is important to remember that for hypereutectic alloy, Al3Ni particles constitute the second phase particles precipitated in a eutectic matrix. Therefore, it can be considered that the columnar grain structure is favorable for alloys with a hypereutectic composition.
As mentioned by Fernandez Gomes et al. [44], there is an inverse proportionality between the capacitive response of a film and its thickness. Therefore, the Ceff values presented in Table 3 would indicate that samples with higher Rp have a greater oxide thickness.

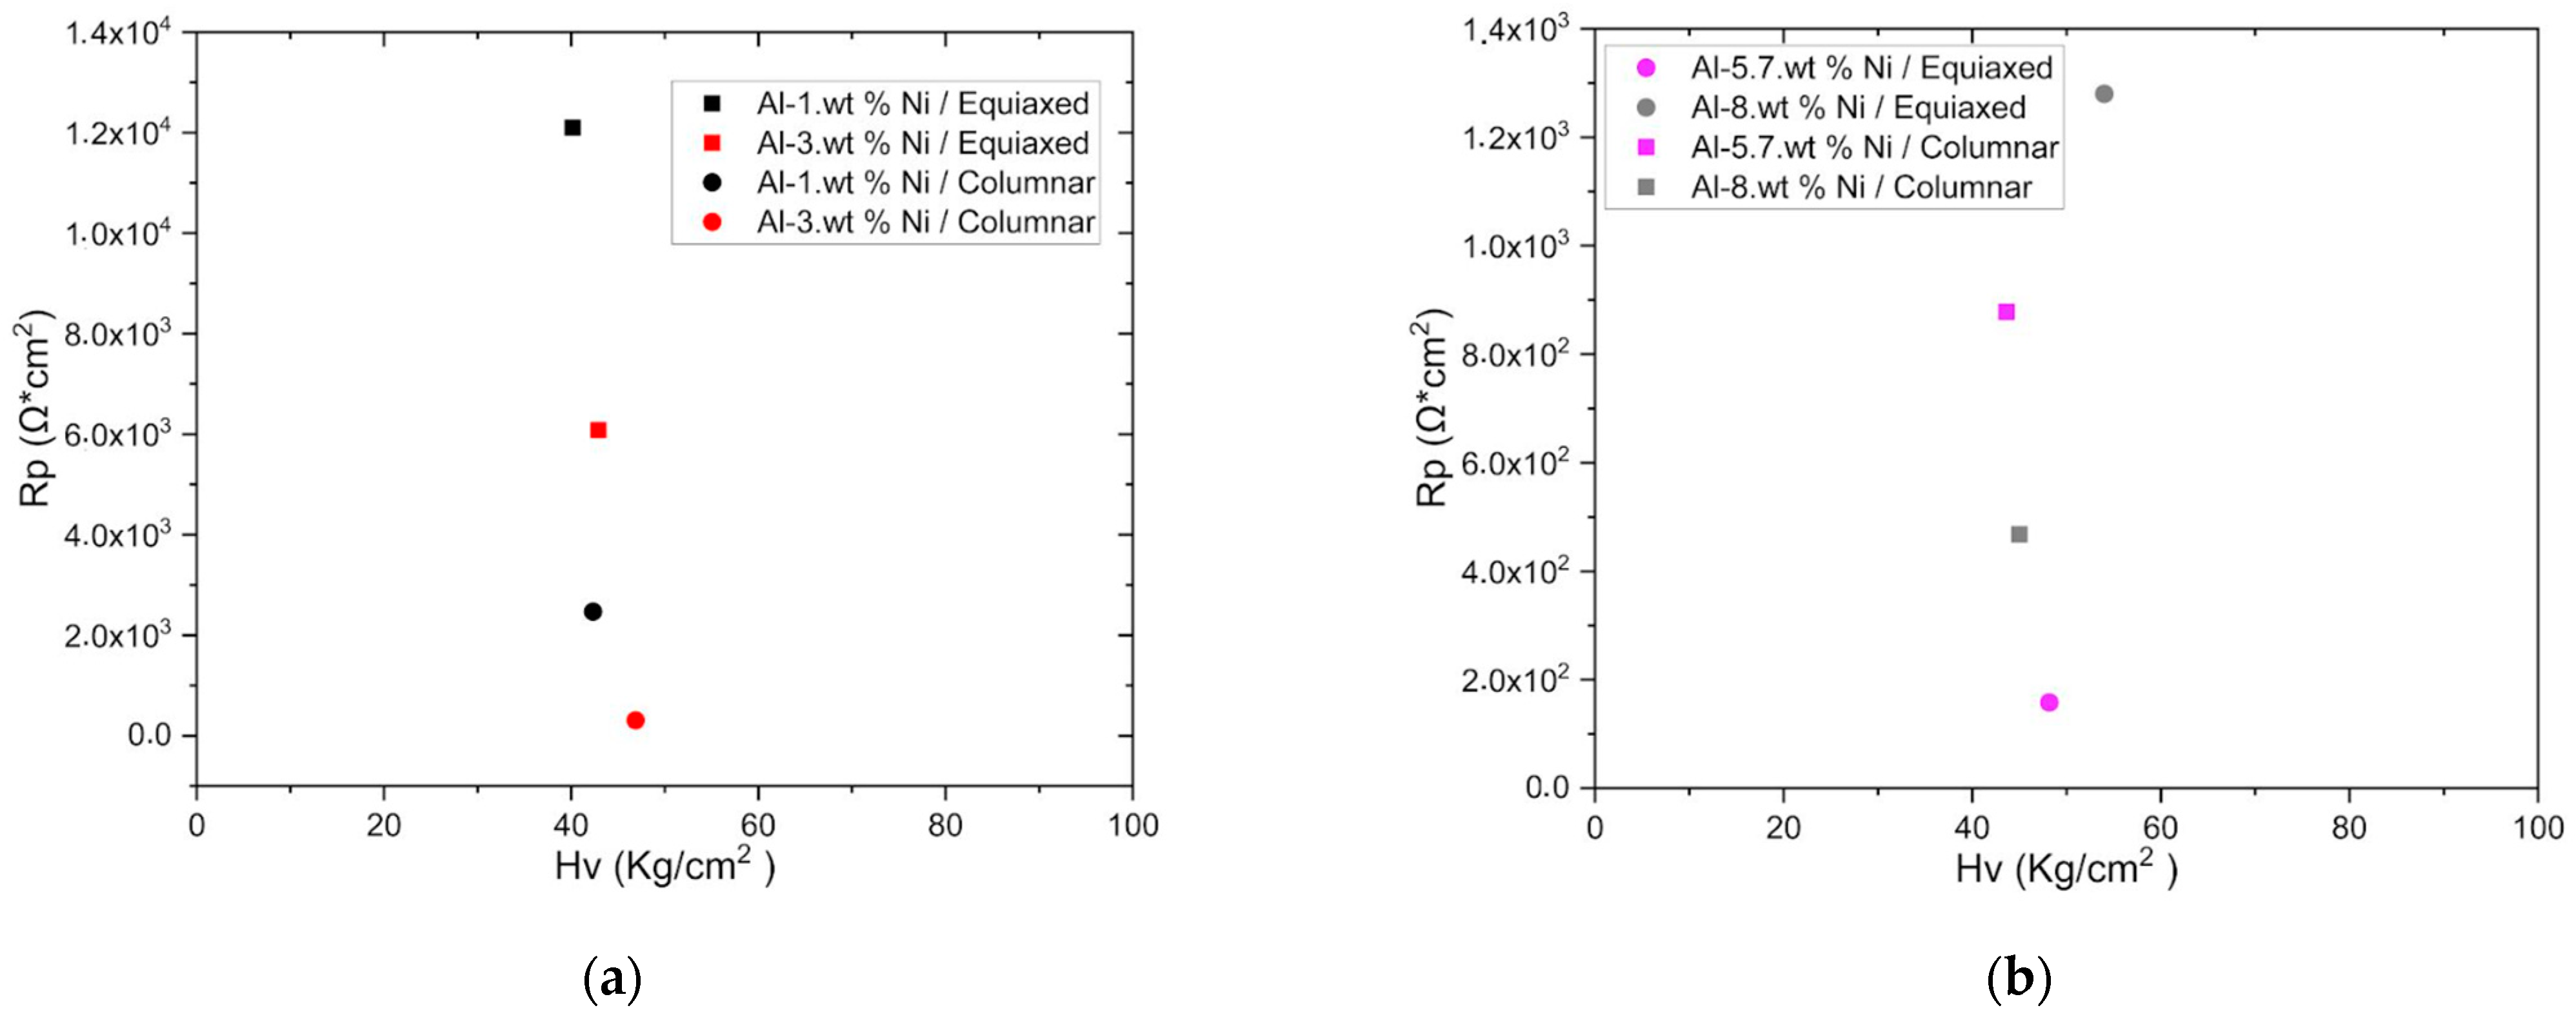
3.7. Correlation between Electrochemical Parameters and Microhardness

Figure 19 correlates the values of polarization resistance, Rp, with microhardness, HV, for both types of grain structures (columnar and equiaxed). It is observed that the higher the HV, the lower the value of Rp for hypoeutectic (Al-1wt. %Ni and Al-3wt. %Ni) and eutectic (Al-5.7wt. %Ni) alloys, and the trend for the hypereutectic (Al-8wt. %Ni) alloy changes.
This different behavior can be justified because the Al3Ni intermetallic could play a dual role in the corrosion of an Al-Ni alloy. It can act as a barrier against corrosion or as a galvanic cathode that accelerates the corrosion process. The role that will dominate the corrosion process will depend largely on the quantity and distribution of intermetallic particles. This is in accordance with what was proposed by Osório et al. [16].

4. Conclusions

From the results and discussion in the previous sections, the main conclusions of this investigation on the directional solidification of Al-Ni alloys are as follows.
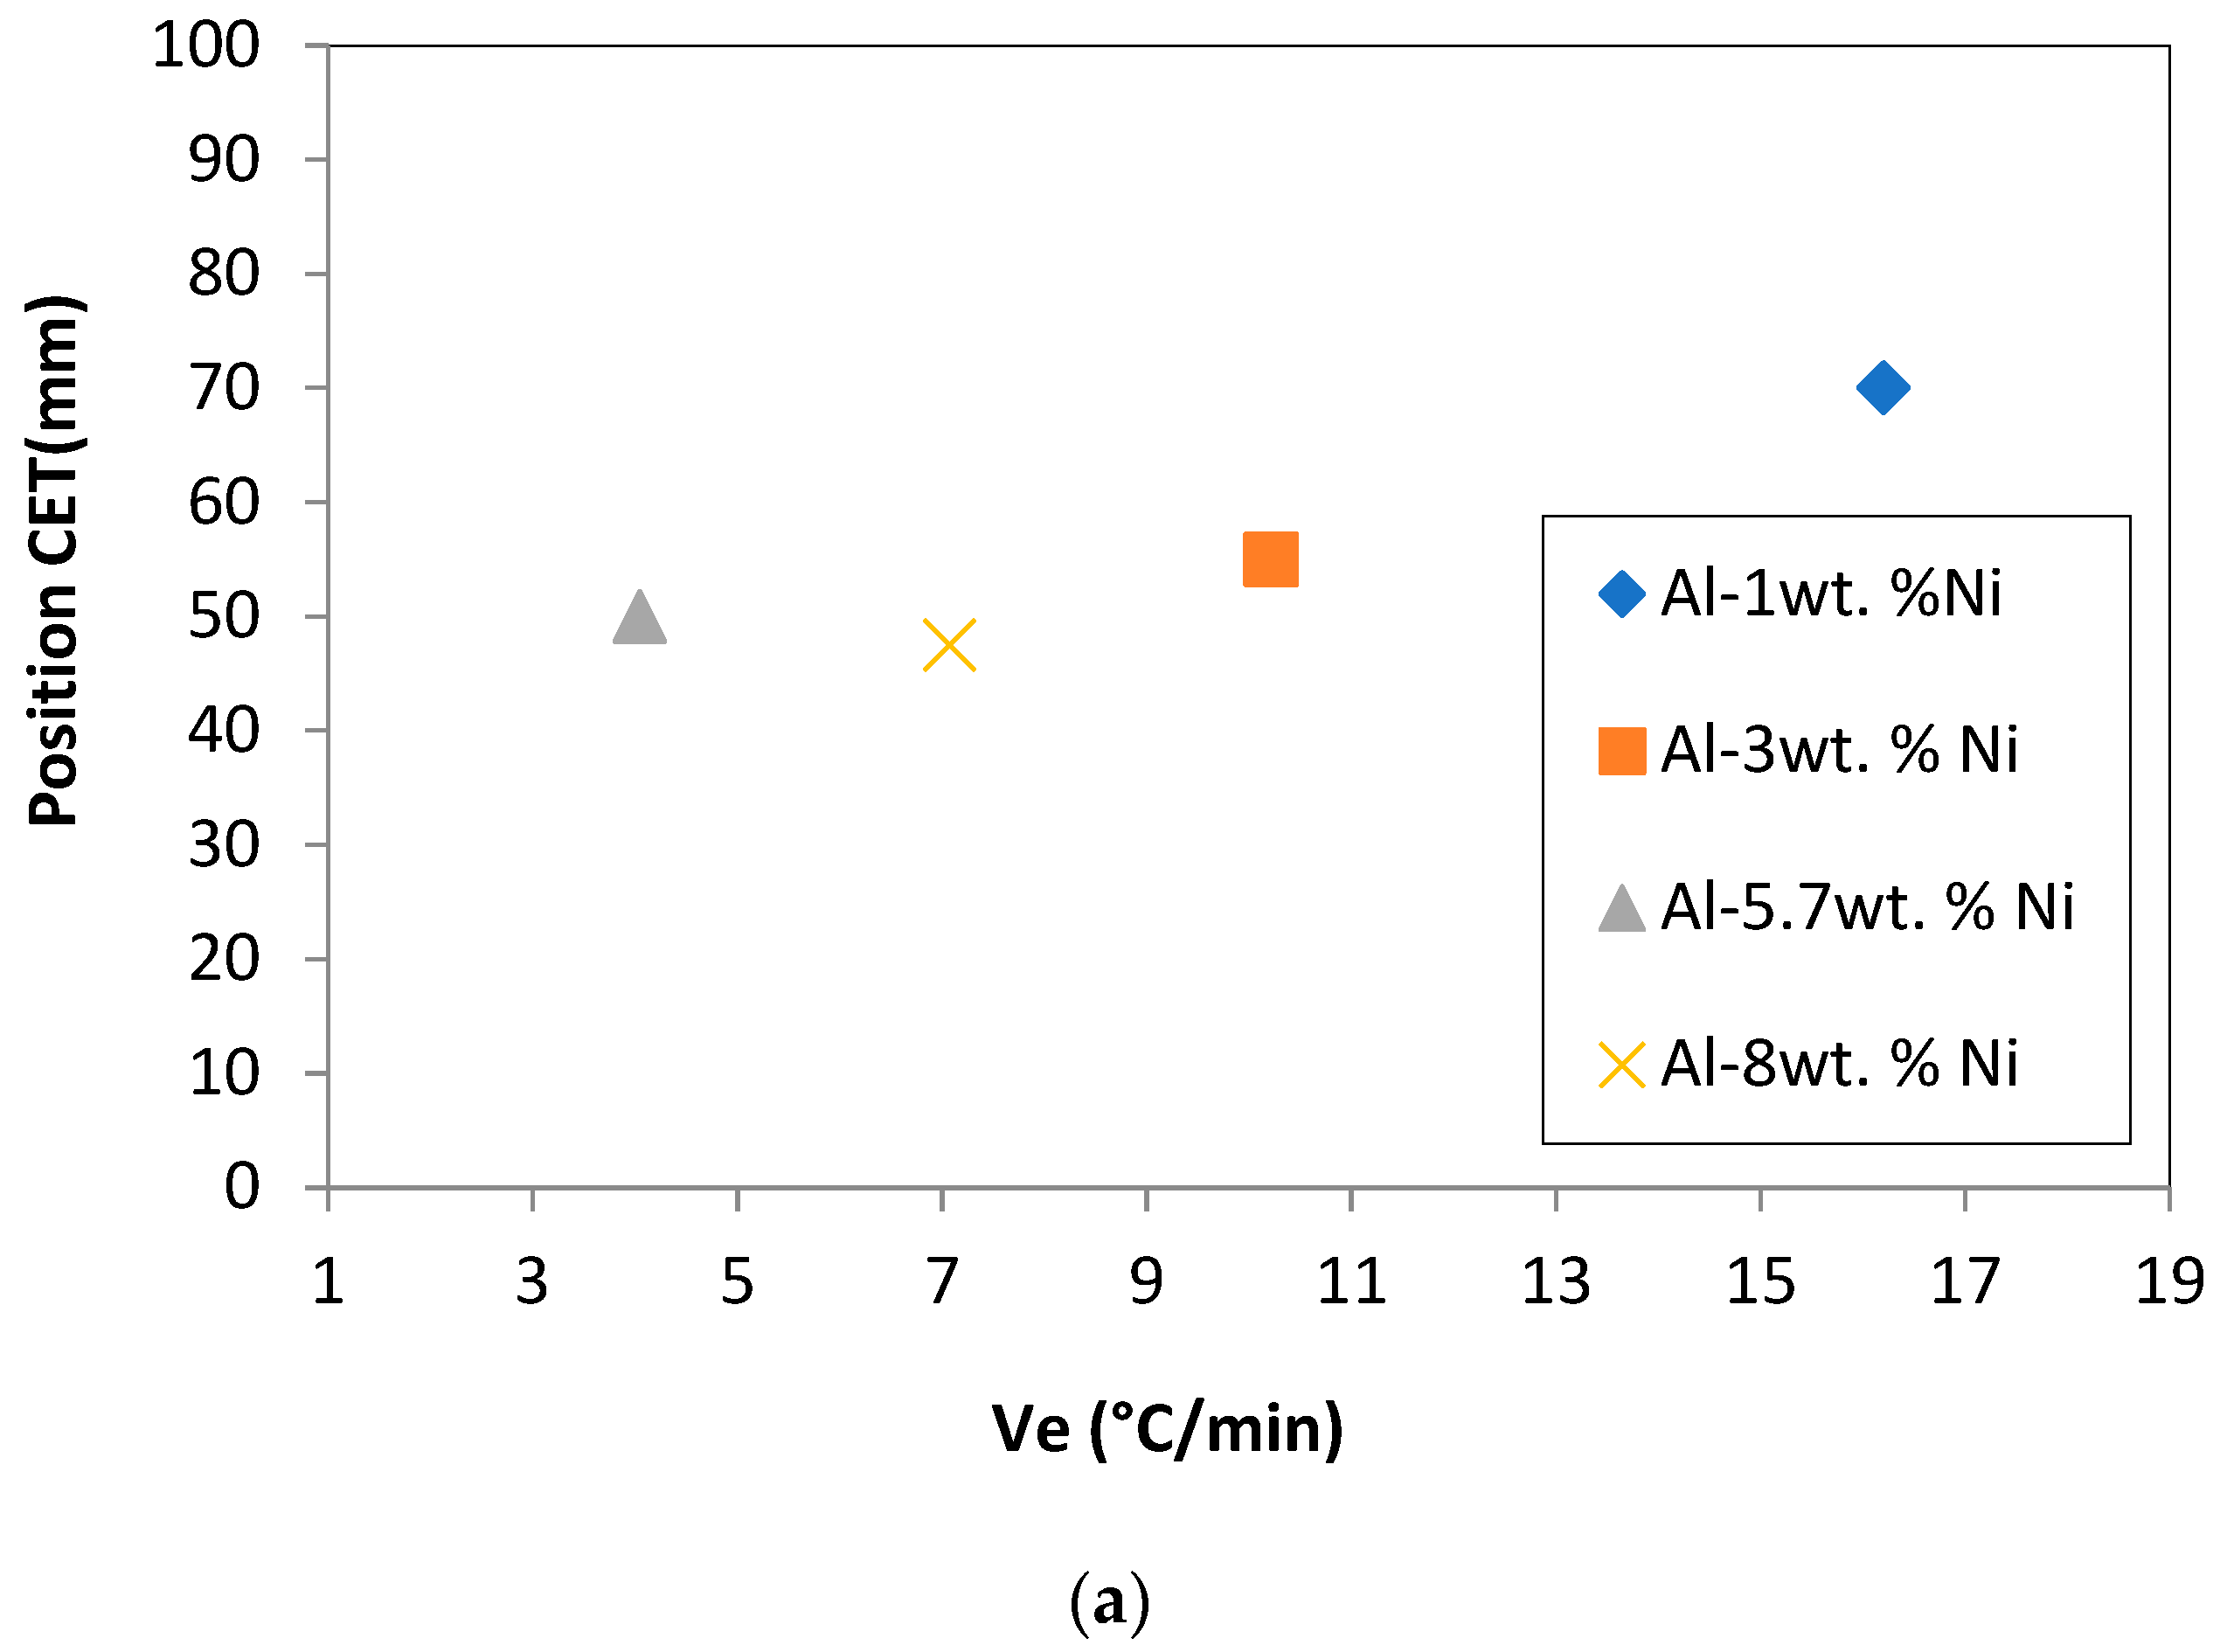
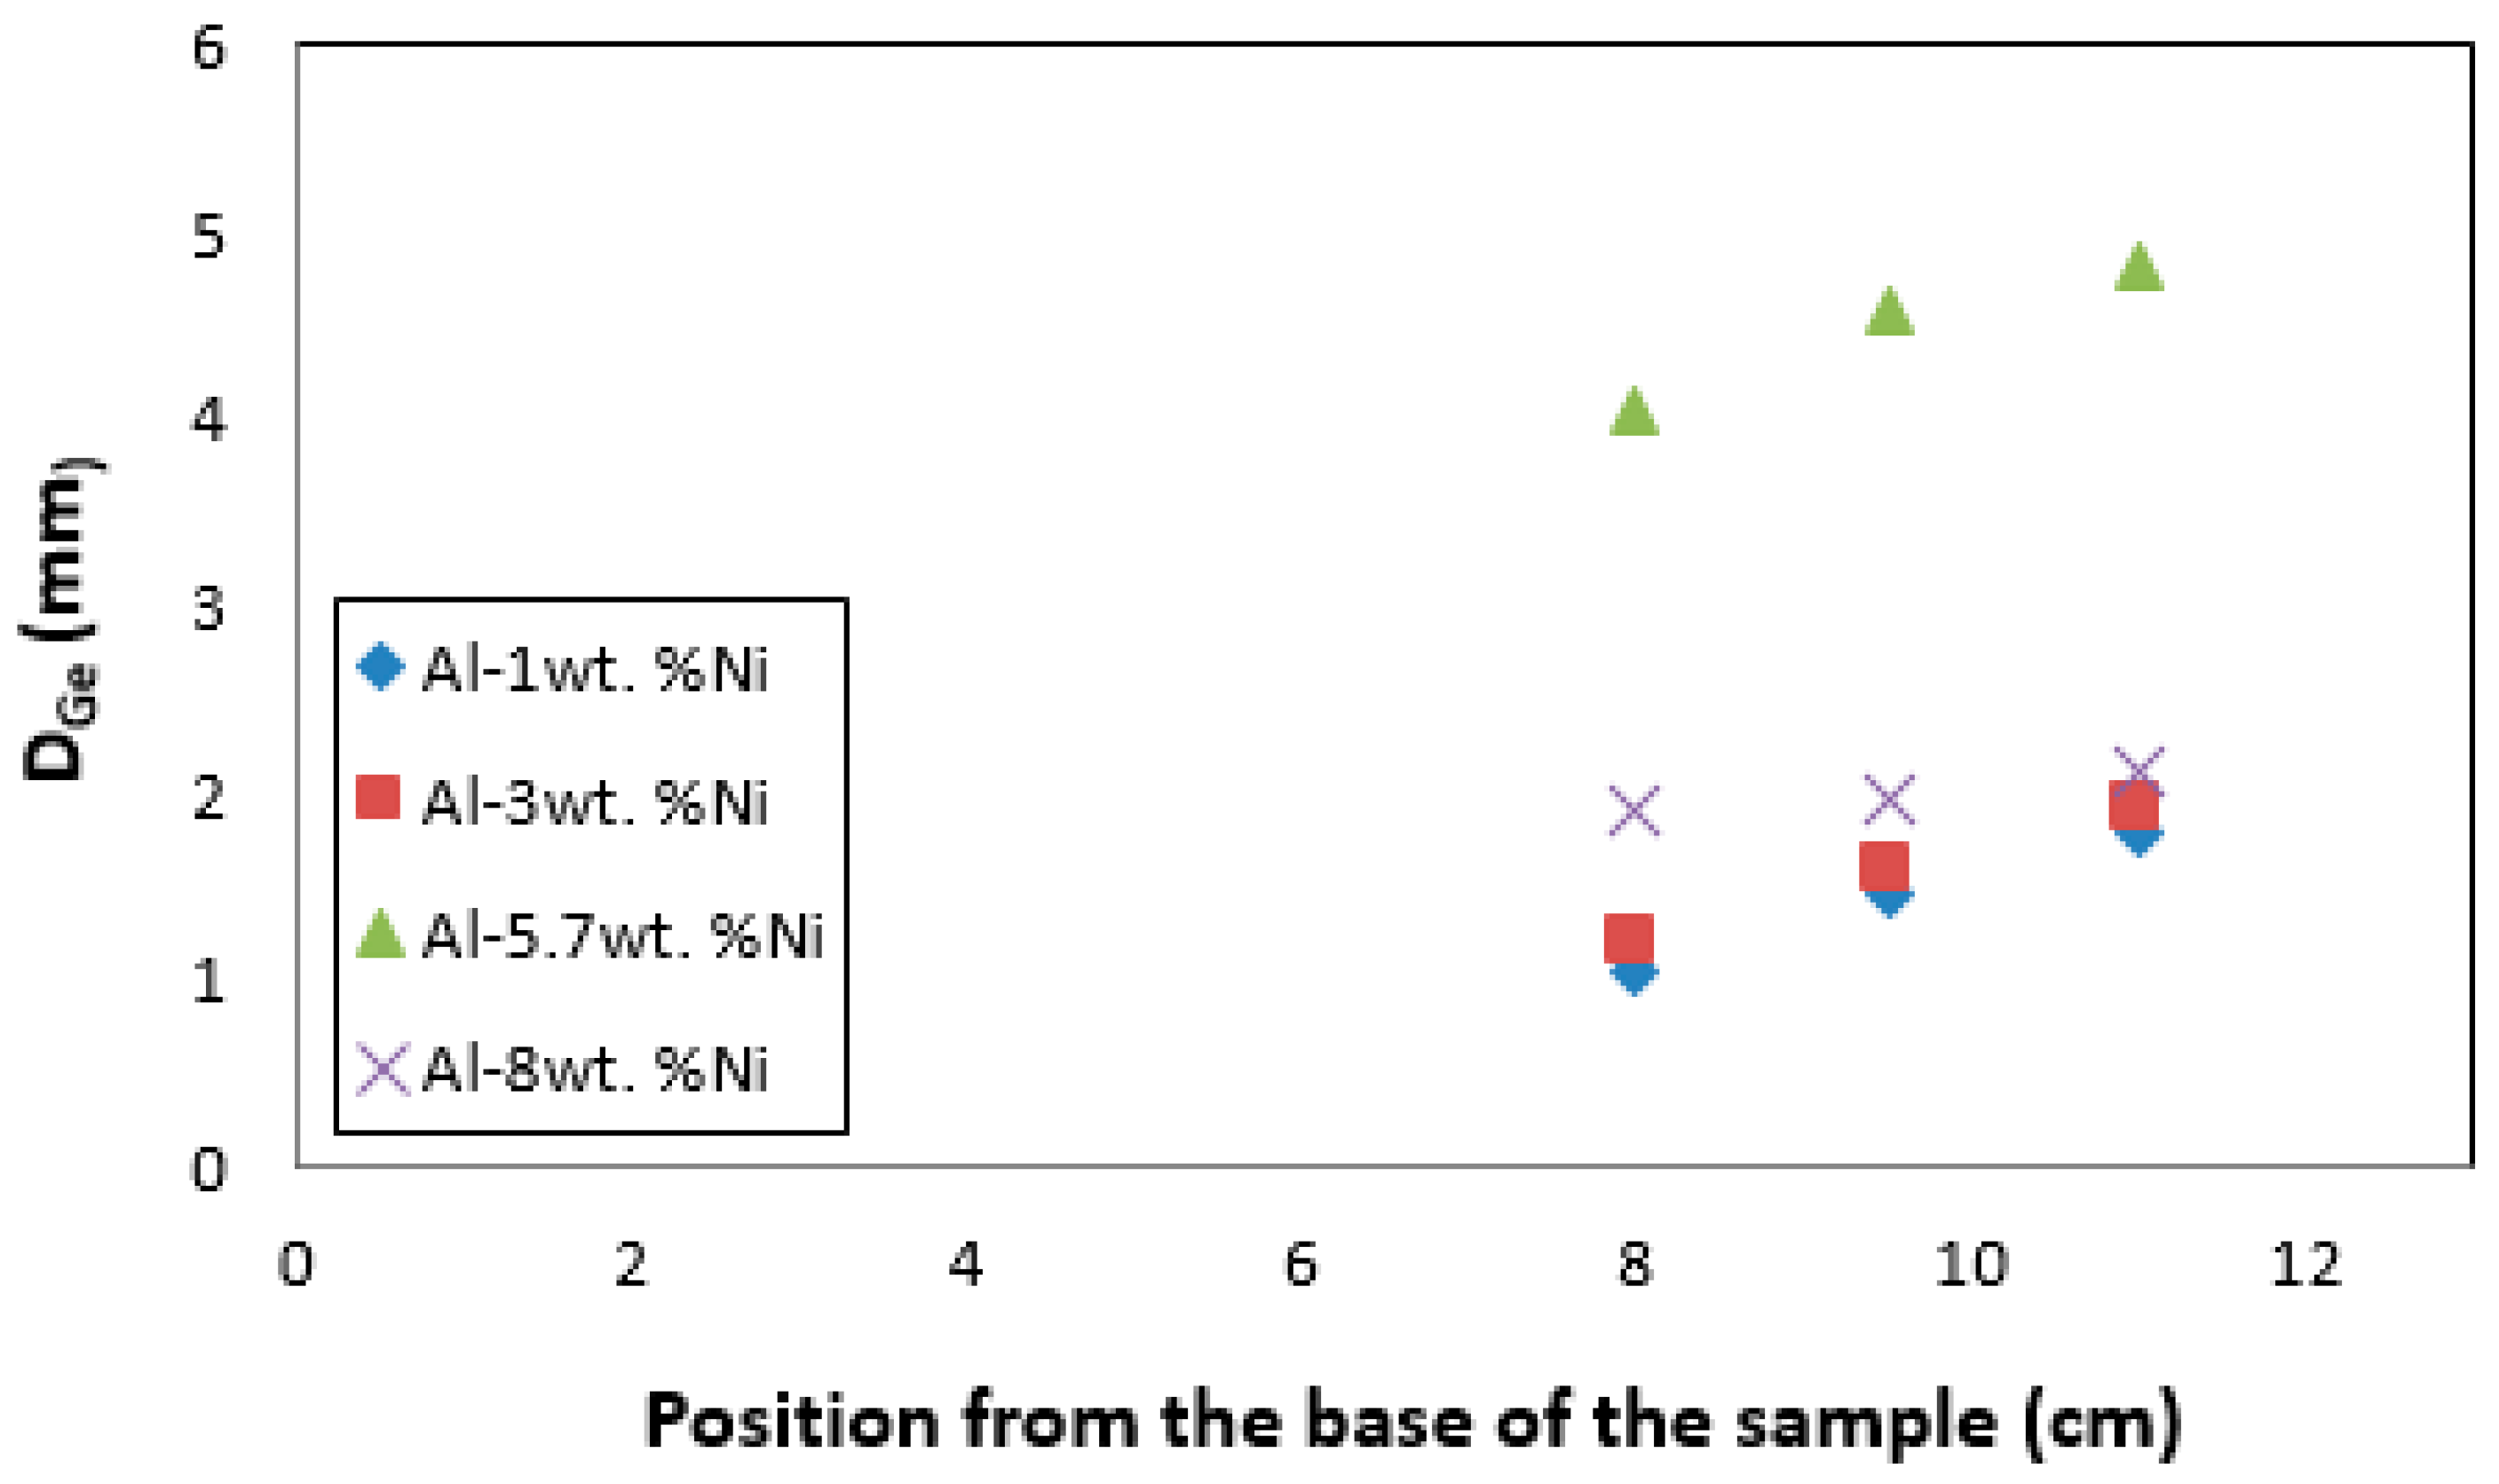
  • The CET occurs in a zone where columnar and equiaxed grains coexist, and the position of the zone in the sample decreases as the Ni content in the alloy increases.
  • The values of critical gradients (at the CET) were determined, and the values are 1.3 to 2.9 °C/cm.
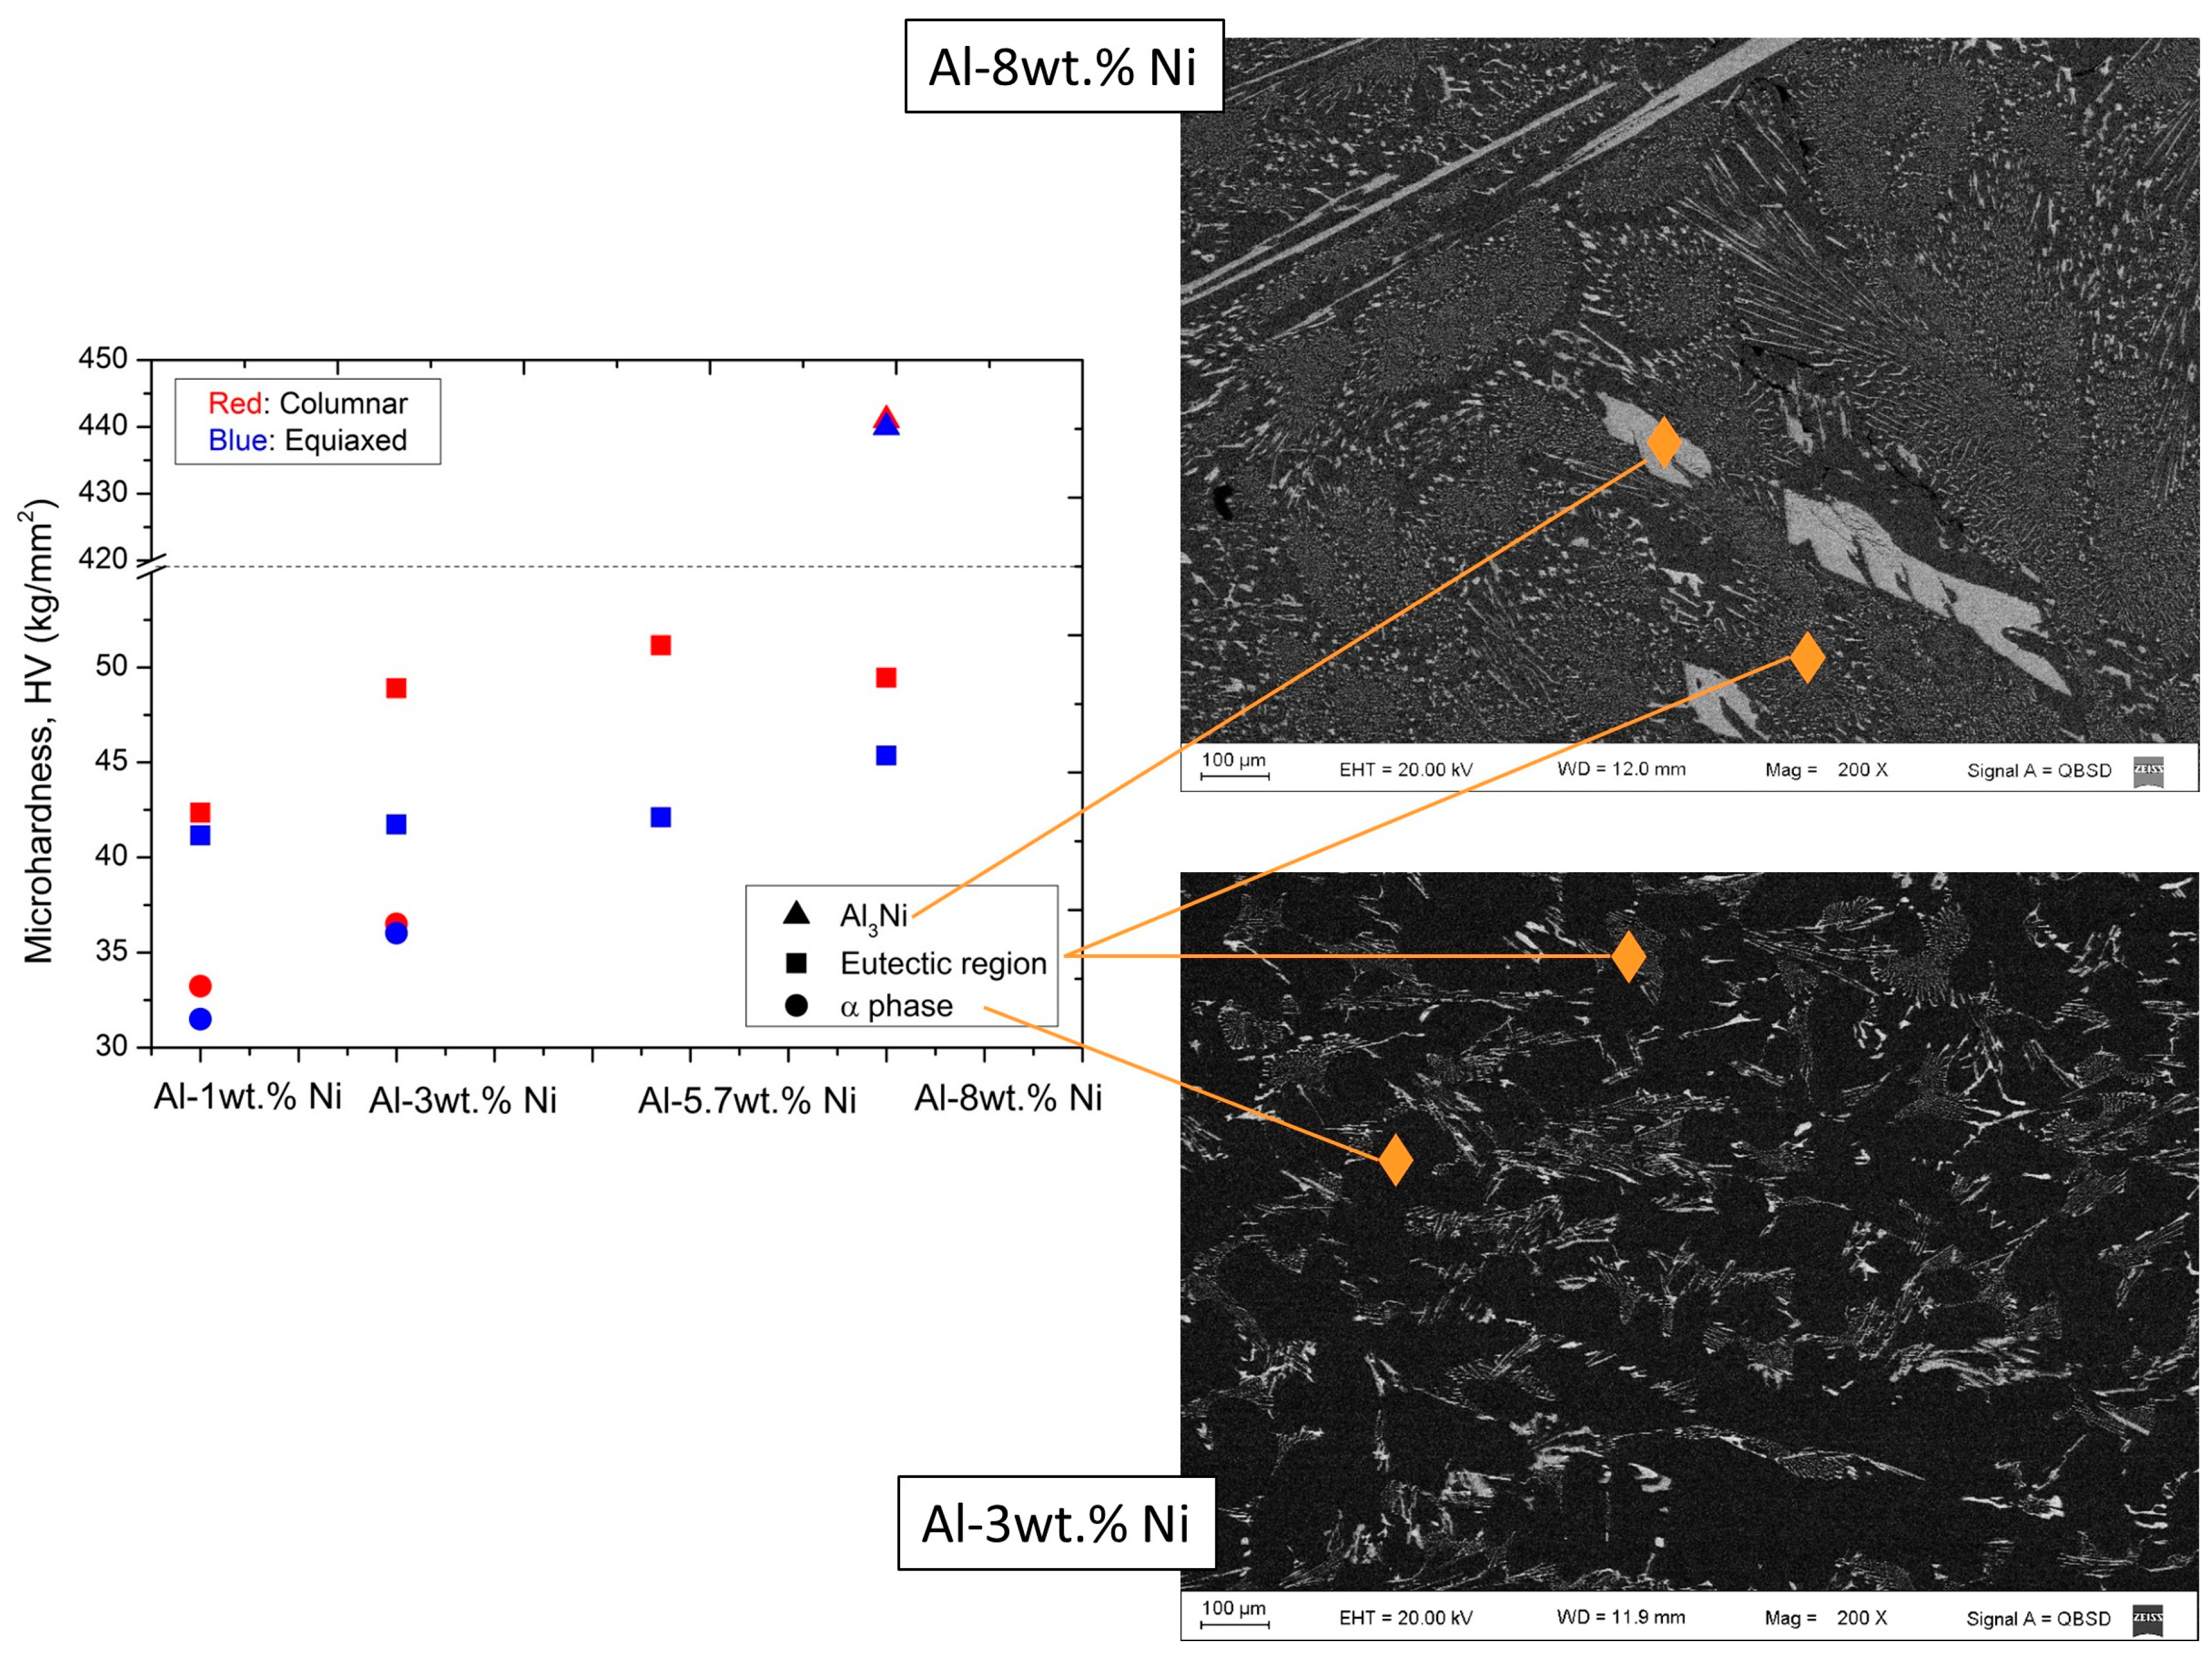
  • The eutectic region has greater microhardness than the α-phase, reasonably associated with the higher Ni-content.
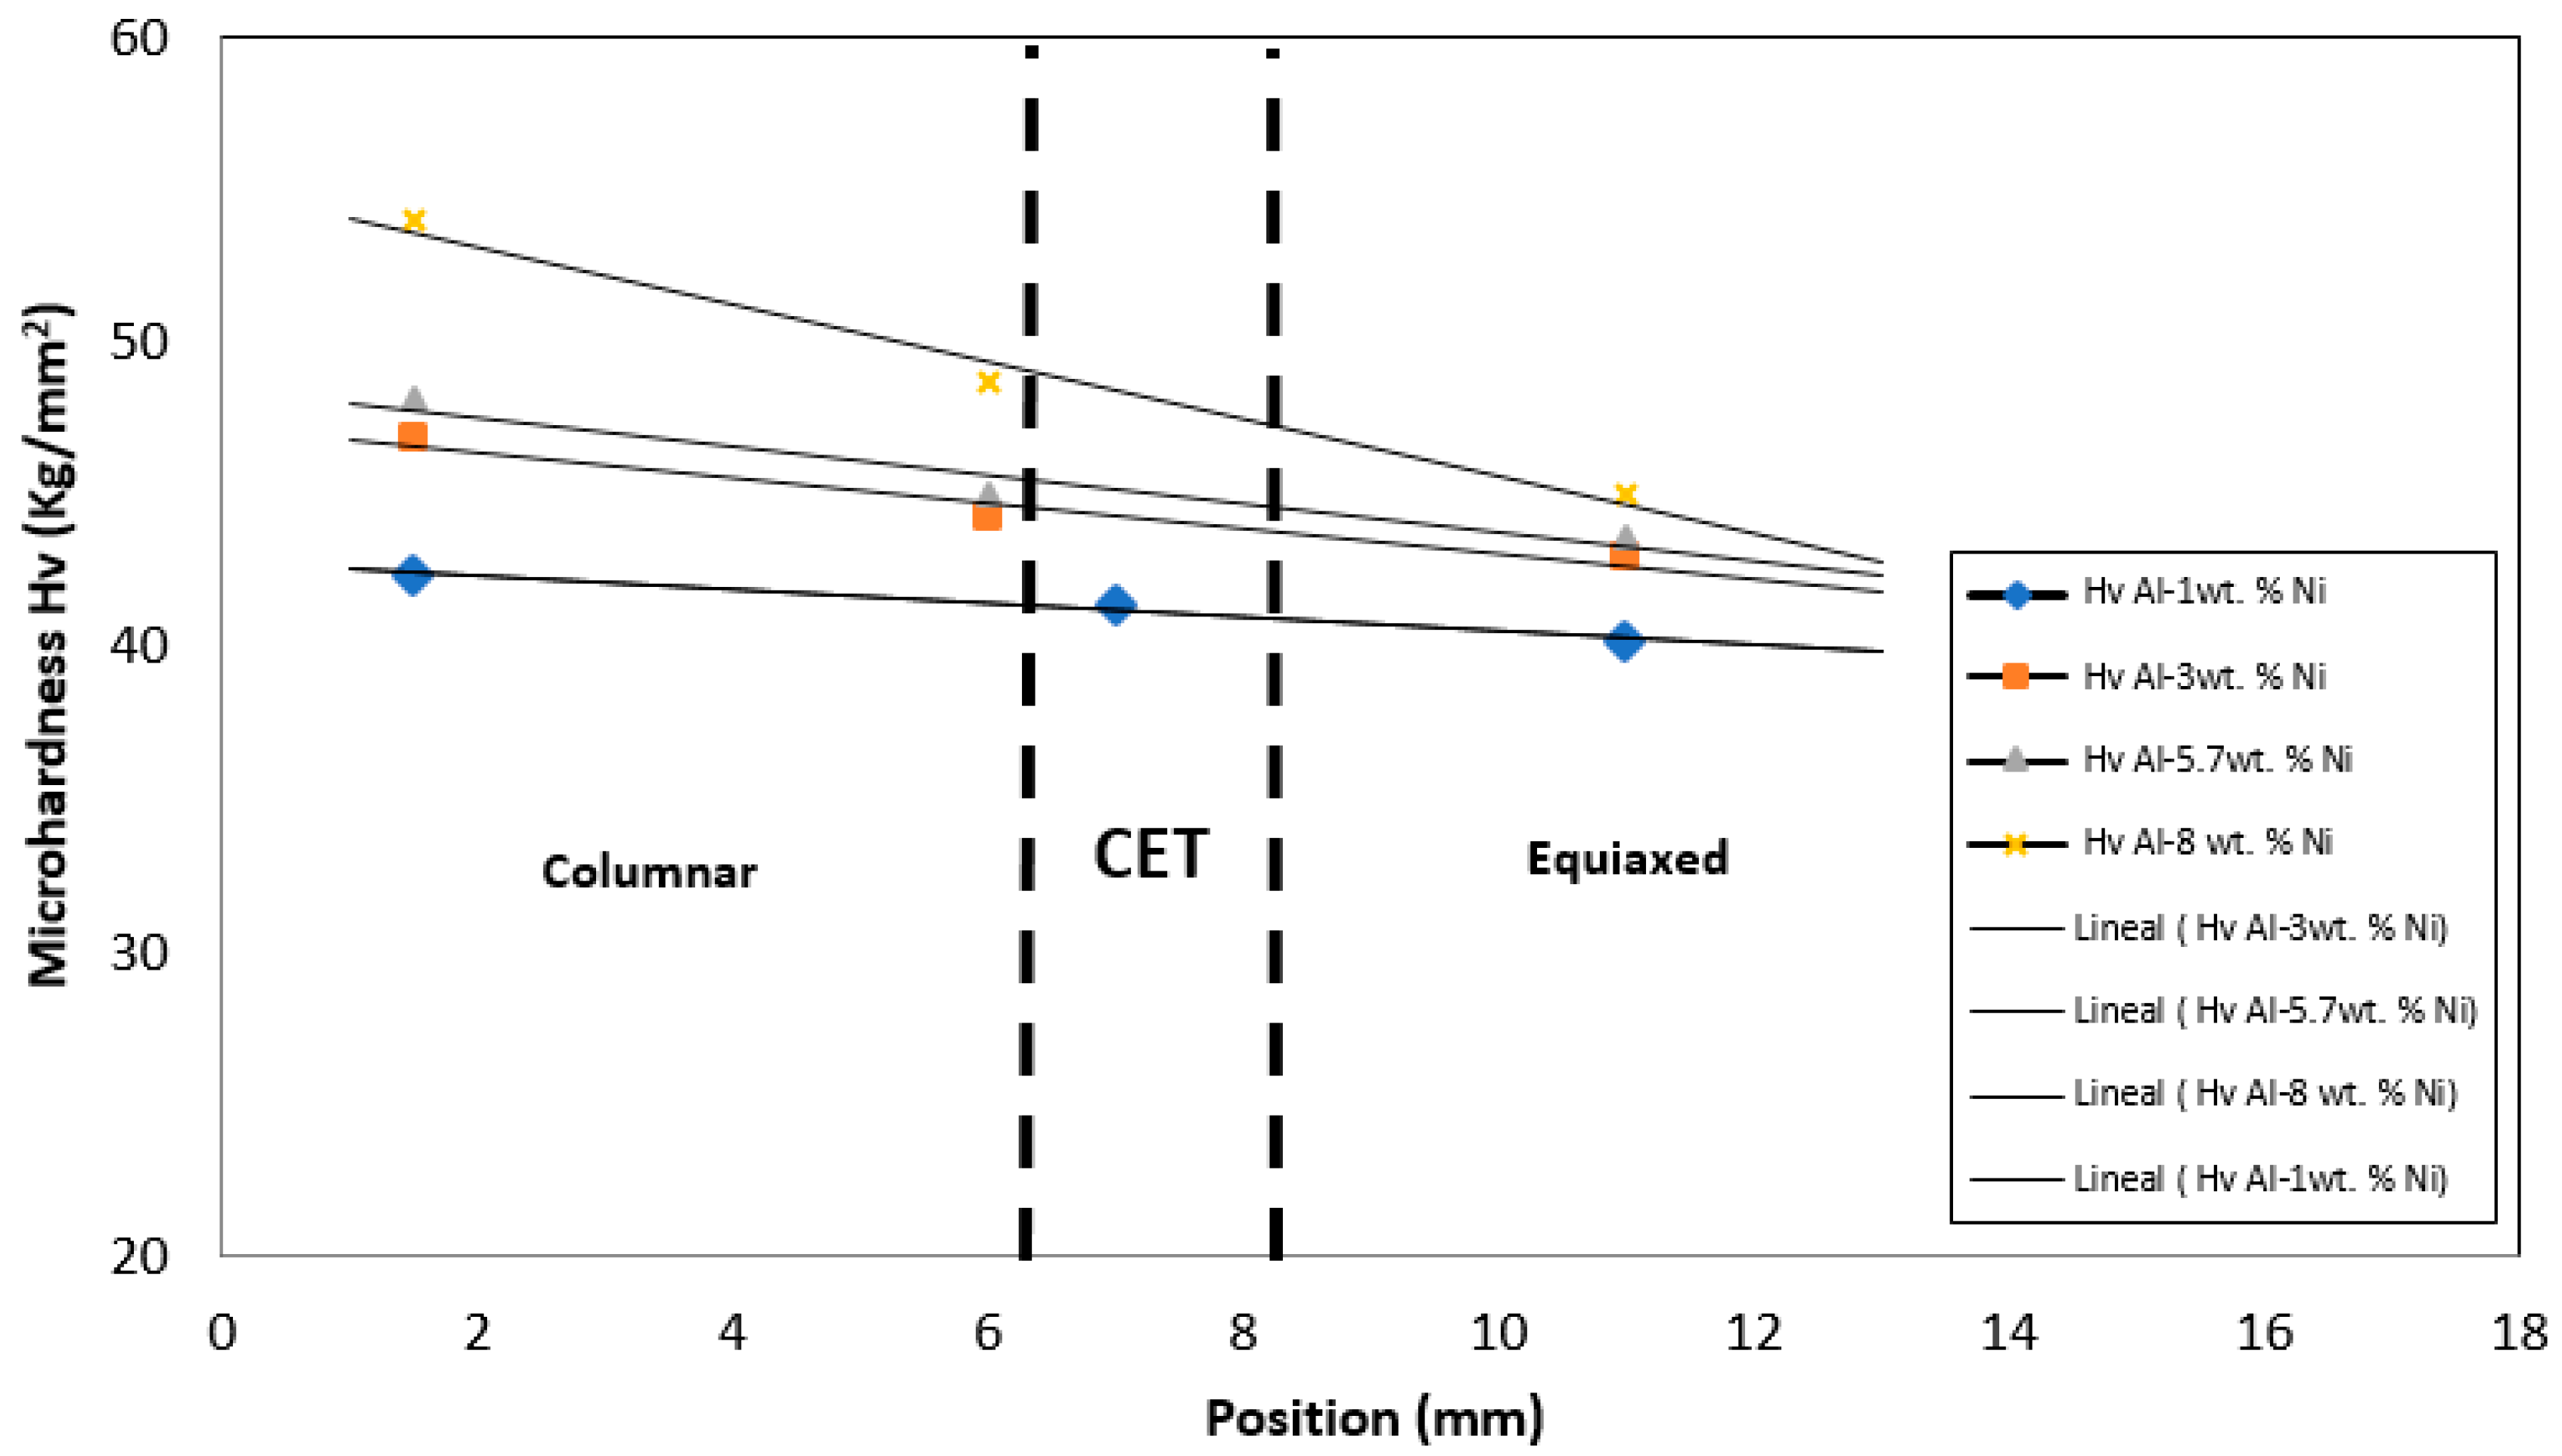
  • The microhardness values are smaller in the areas furthest from the base because, in further areas, the heat extraction rate is lower, and the grains are less refined.
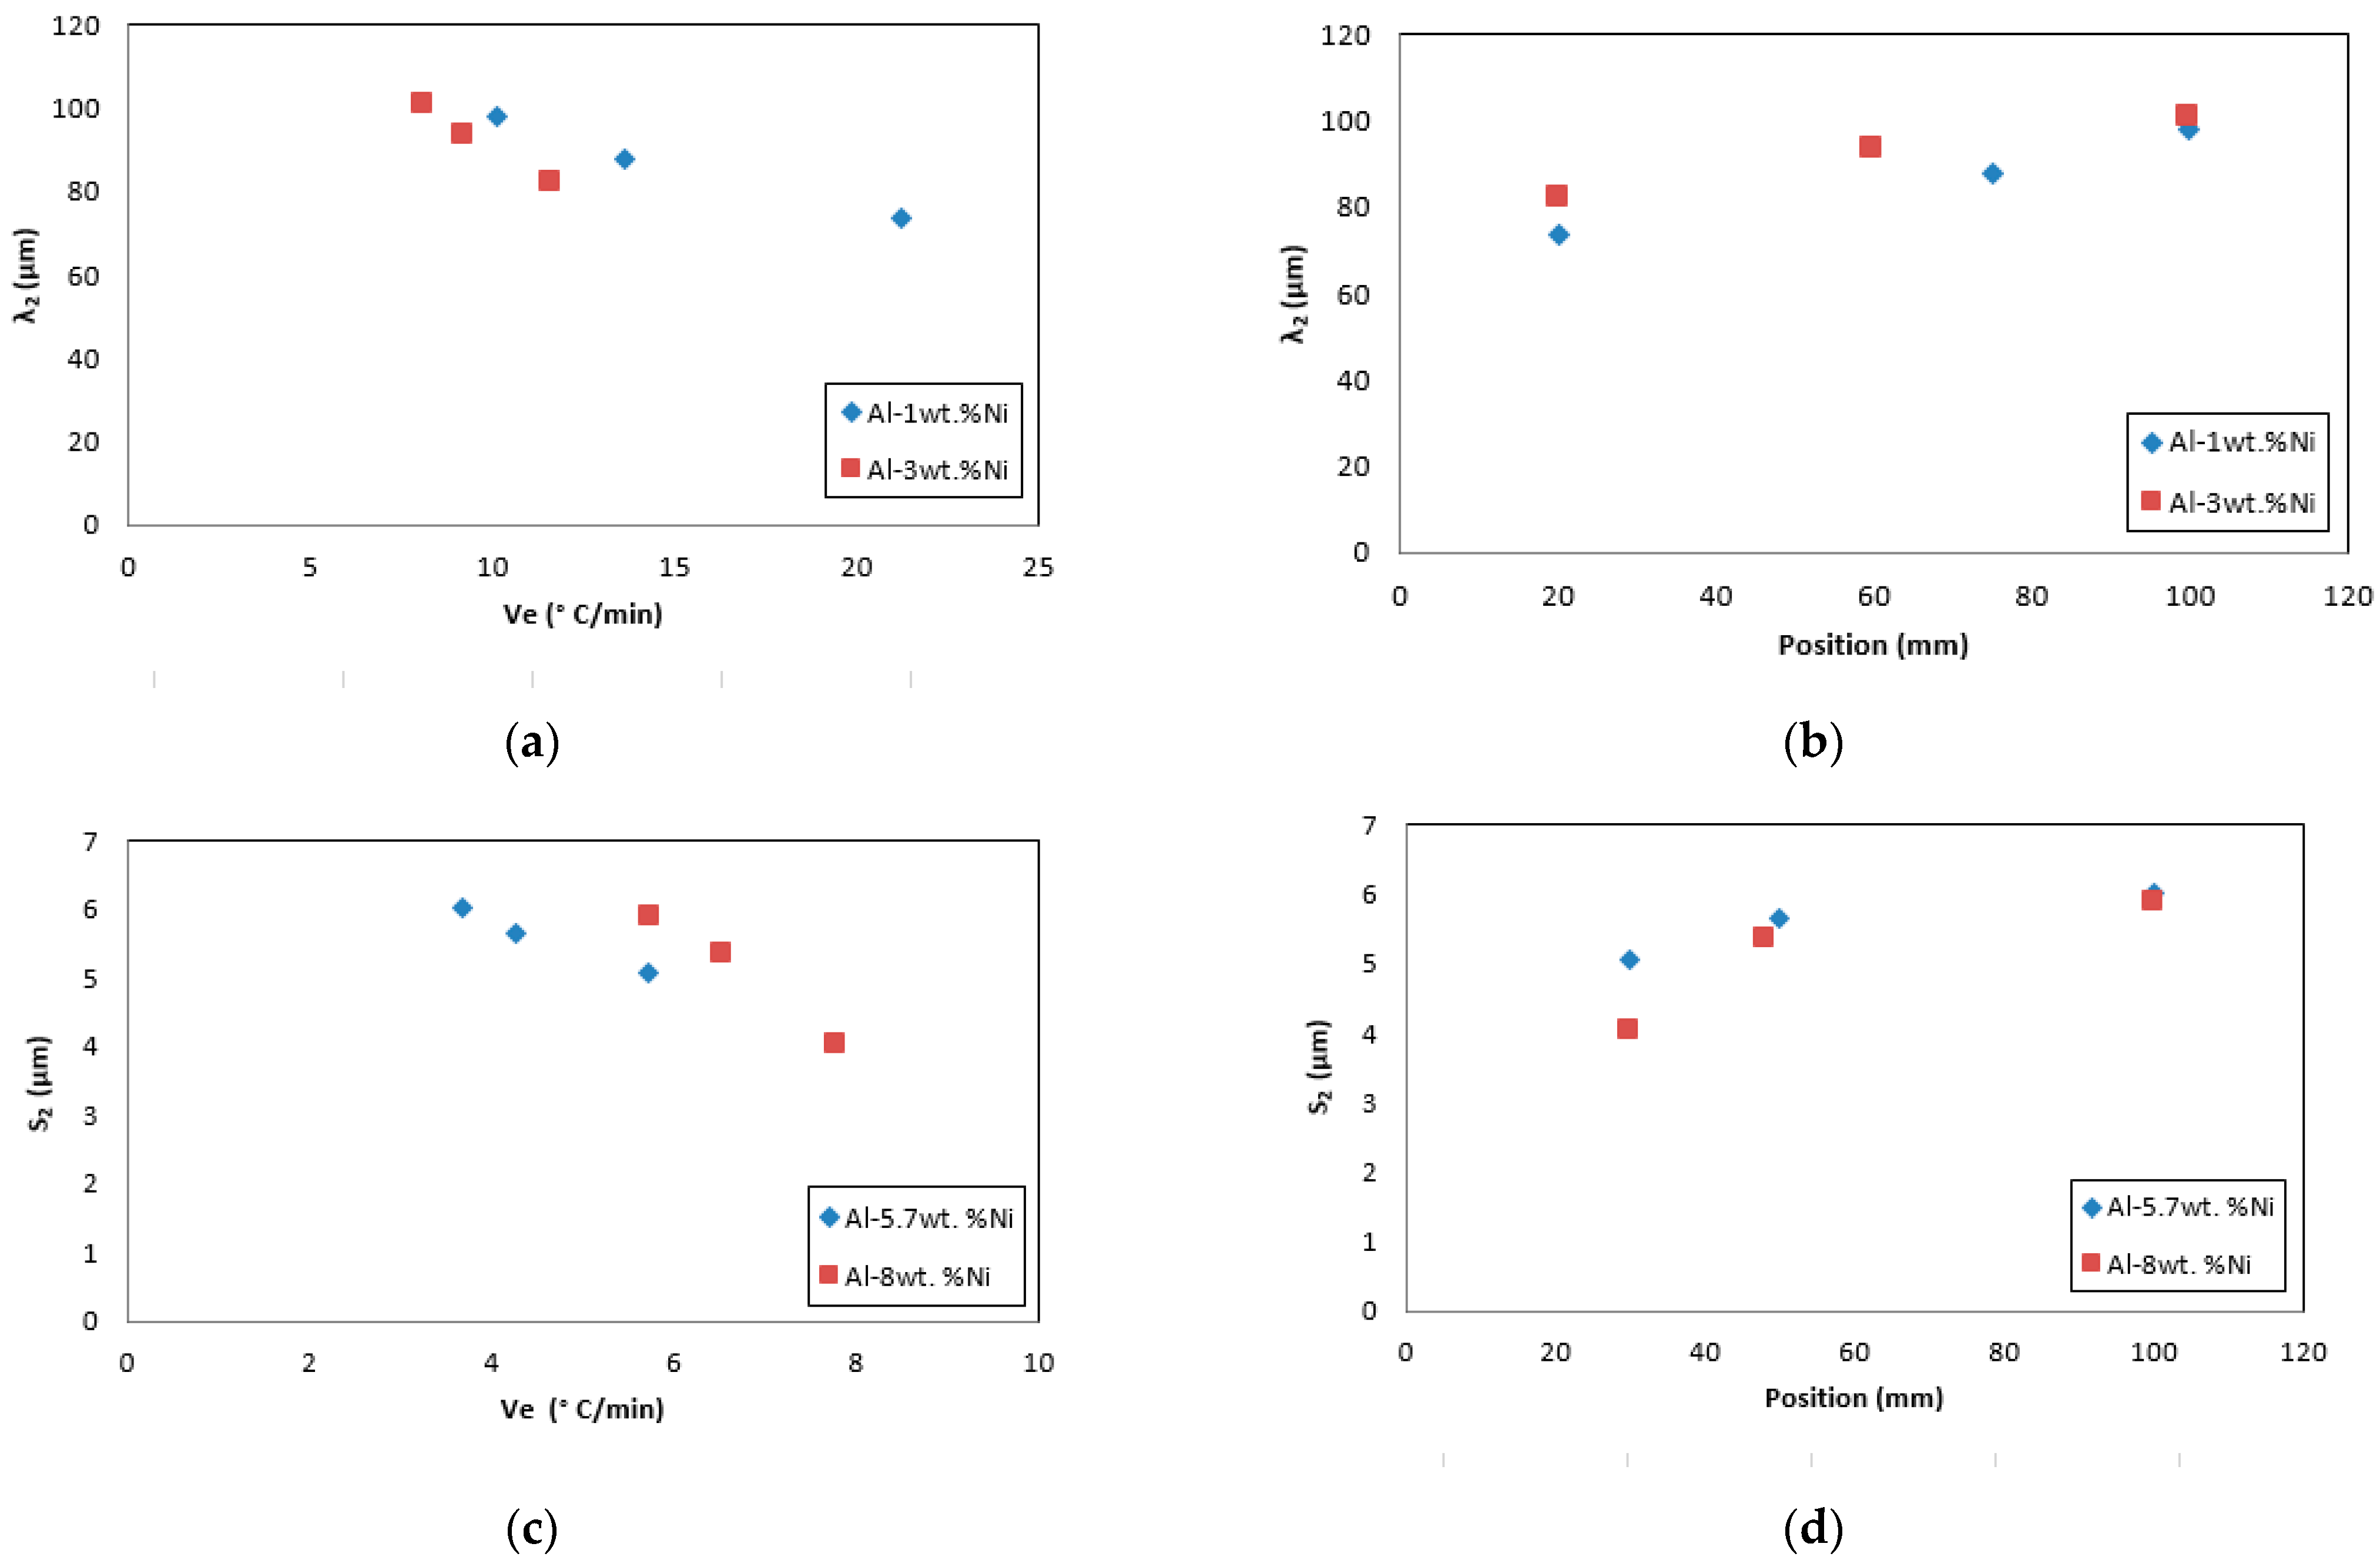
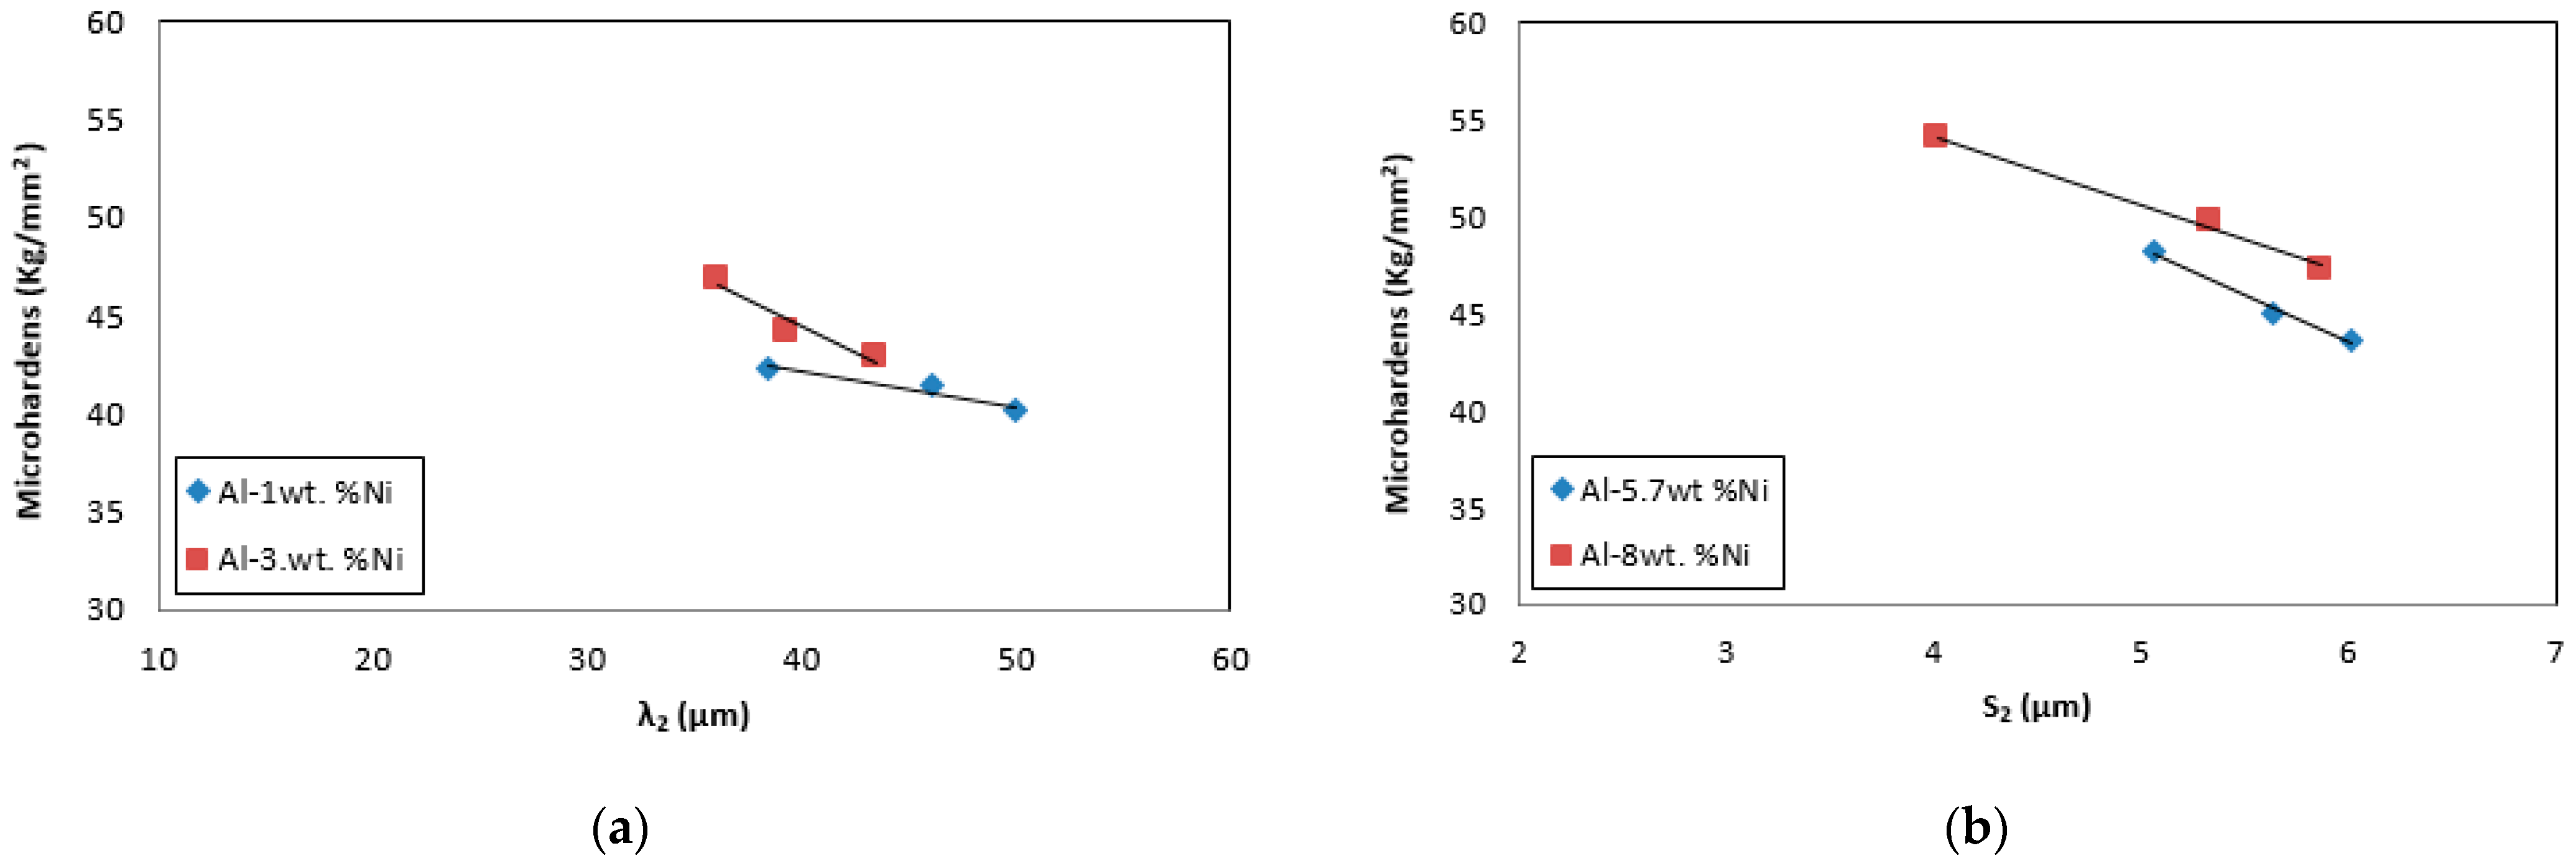
  • The highest cooling rate generates refinement in the secondary dendritic arm spacing and lamellar spacing, obtaining greater microstructural refinement in the zones of the samples close to the base.
  • A small increase in the microhardness was observed as a function of the Ni content. For each concentration, as the cooling rate increases, the values of microhardness increase linearly.
  • The Al-5.7wt. %Ni alloy, which corresponds to the eutectic composition, presents the noblest pitting potential values, followed by the Al-8wt. %Ni alloy, with a hypereutectic composition. Hypoeutectic alloys have the least noble potential values that are very close to each other.
  • For the same alloy composition, the zone of columnar grains presents nobler pitting potential values than the zone of equiaxed grains. However, these differences between values are less than 5 mV, so they are not considered significant differences.
  • When the Ni content increases, the resistance to polarization decreases for samples with equiaxed grain structure throughout the range of compositions studied. Furthermore, the equiaxed grain structure presents higher resistance to polarization values than the columnar grain zone for alloys with a composition equal to or lower than the eutectic composition. For the hypereutectic alloy, Al-8wt. % Ni, the trend is modified, with the area of columnar grains being the one with the highest resistance to polarization.
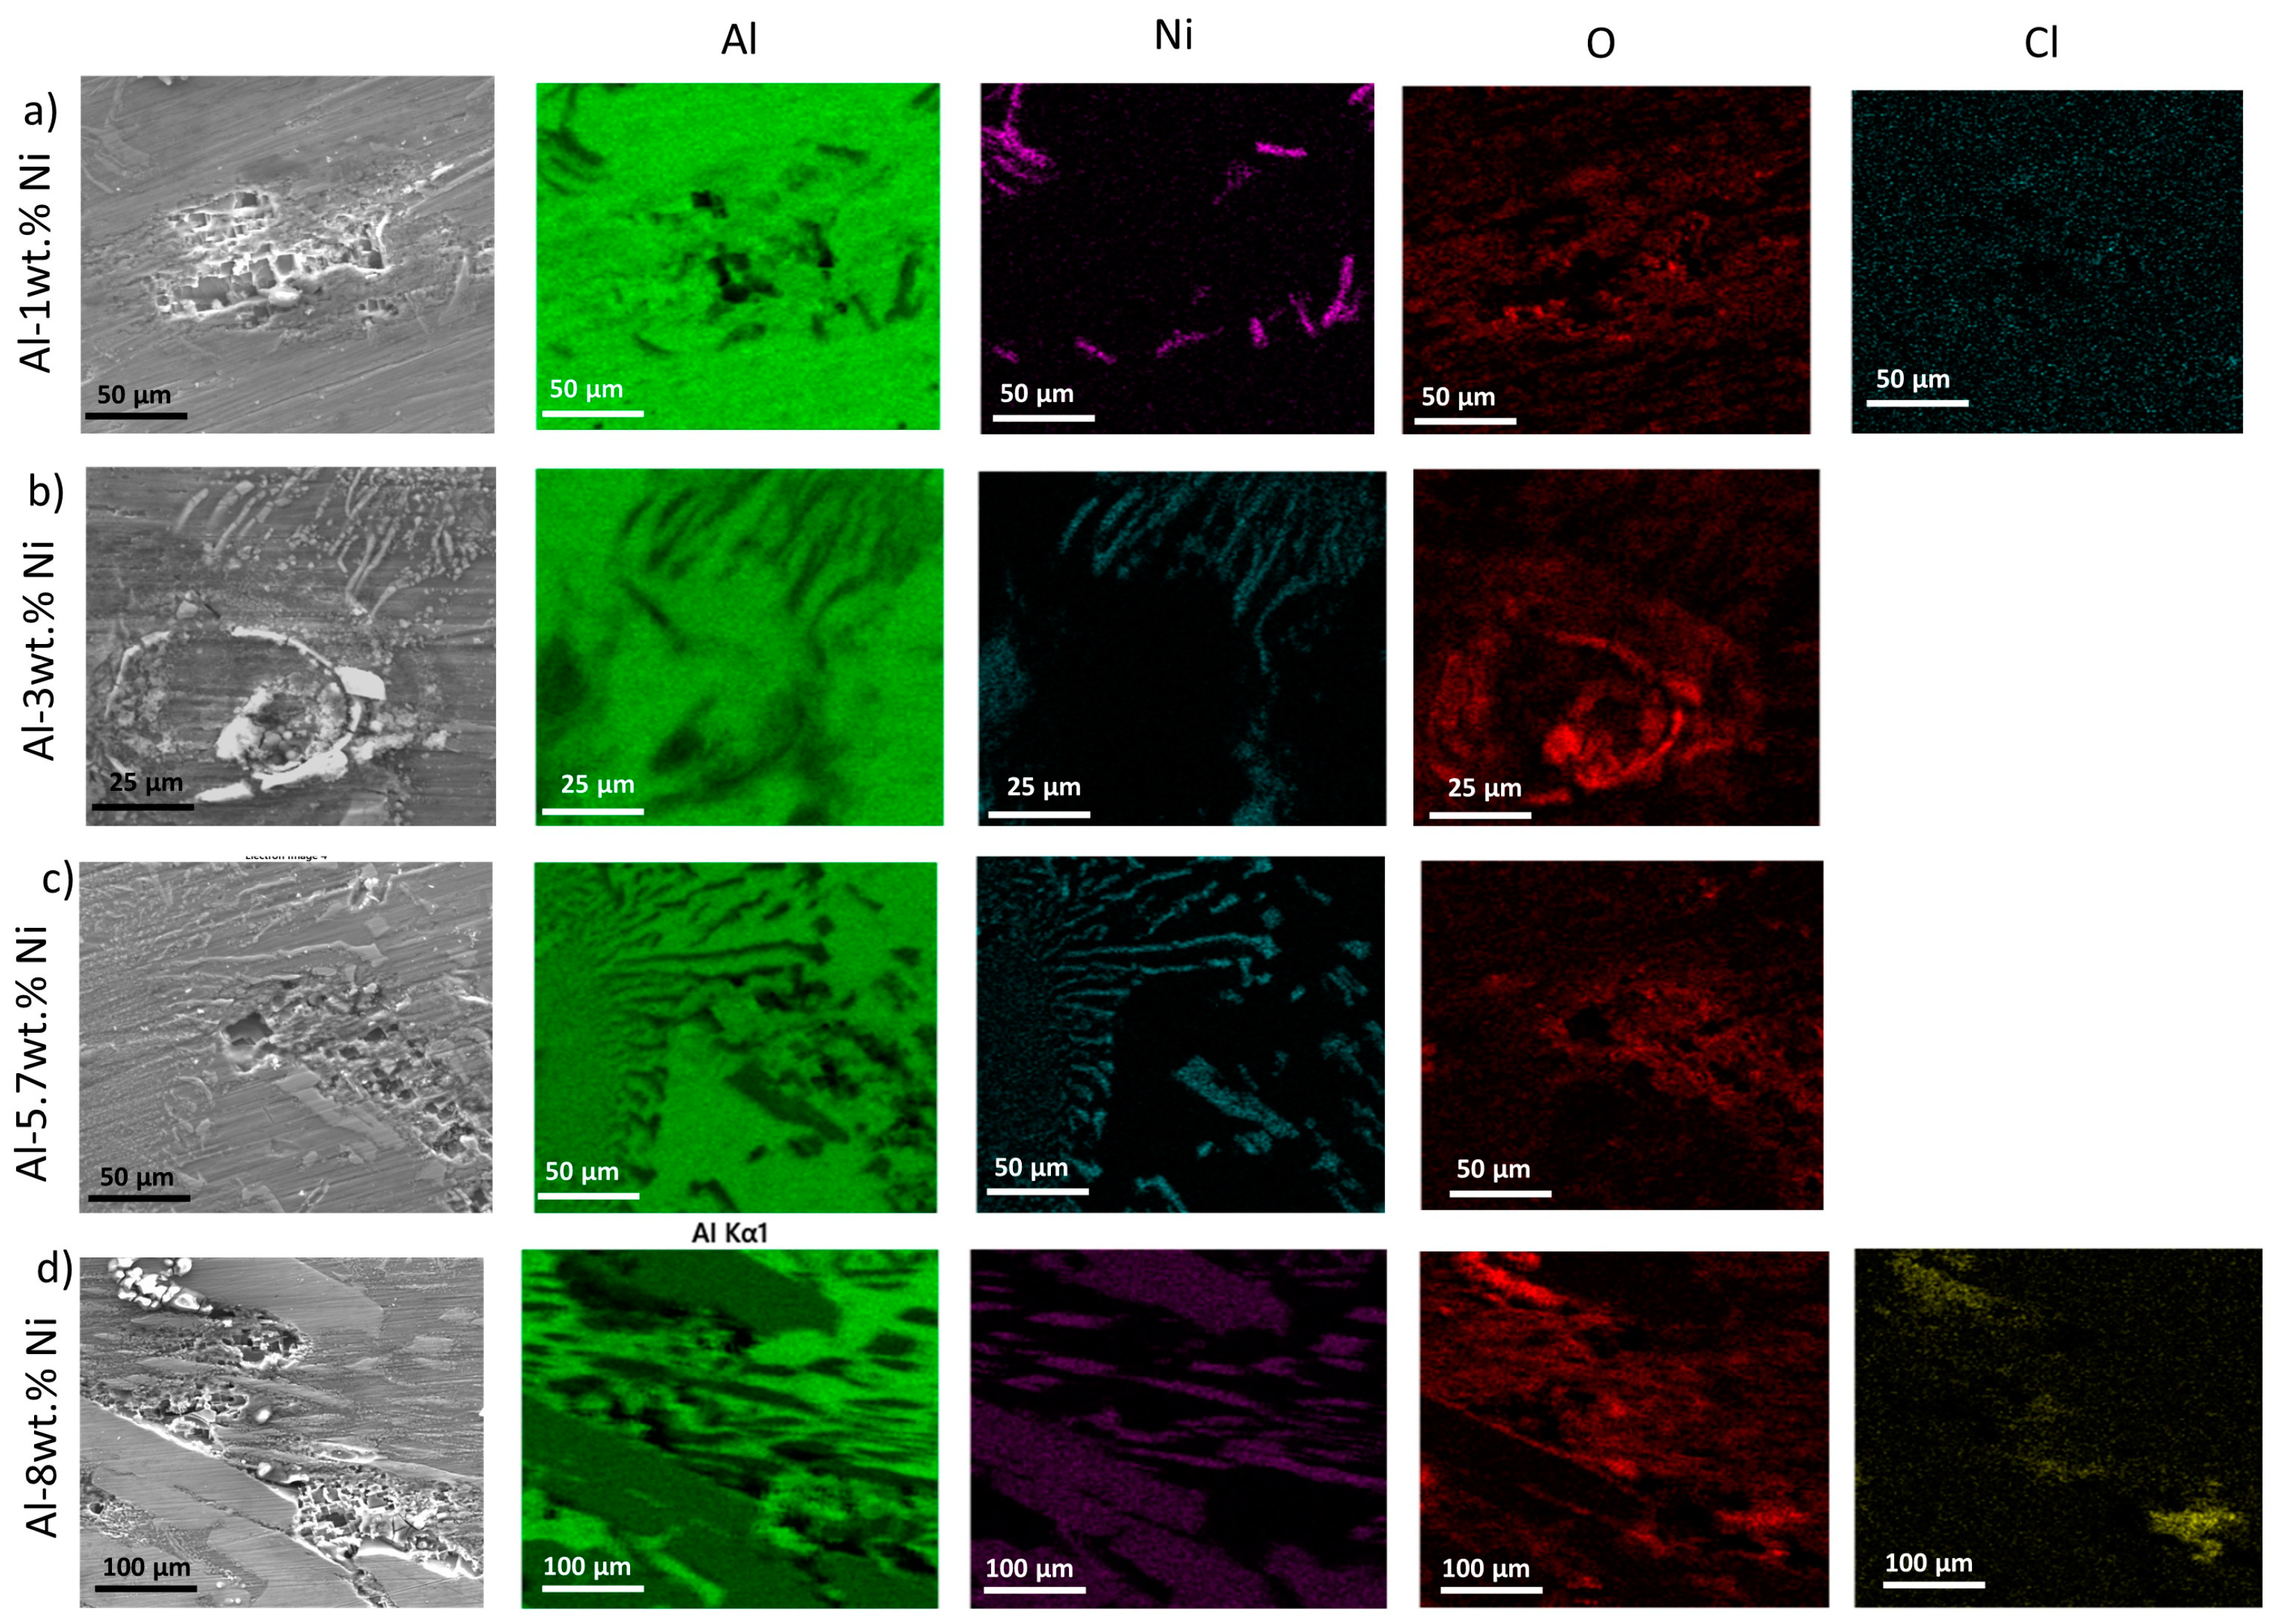
  • With respect to the correlation between resistance to polarization and microhardness for Al-Ni alloys studied, when microhardness increases, the resistance to polarization decreases for hypoeutectic (Al-1wt. %Ni and Al-3wt. %Ni) and eutectic (Al-5.7wt. %Ni) alloys. The trend for the hypereutectic (Al-8wt. %Ni) alloy changes. The different behavior can be justified because the Al3Ni intermetallic could play a dual role in the corrosion of an Al-Ni alloy. It can act as a barrier against corrosion or as a galvanic cathode that accelerates the corrosion process.

Author Contributions

Conceptualization, A.E.A.; methodology, A.E.A.; formal analysis, A.E.A.; investigation, A.S.R., E.R.I., N.S.Z. and C.M.M.; resources, A.E.A.; data curation, A.E.A. and C.M.M.; writing—original draft preparation, A.E.A., A.S.R. and E.R.I.; writing—review and editing, A.E.A.; visualization, A.E.A.; supervision, A.E.A.; project administration, A.E.A. and C.M.M.; funding acquisition, A.E.A. All authors have read and agreed to the published version of the manuscript.

Funding

Consejo Nacional de Investigaciones Científicas y Técnicas (CONICET): RES.2019-574-APN-DIR#CONICET; Agencia Nacional de Promoción Científica y Tecnológica: PICT-2017-0079.

Data Availability Statement

The data used in this study will be provided on request to the corresponding author.

Acknowledgments

All authors gratefully thank the National Scientific CONICET of Argentina (Consejo Nacional de Investigaciones Científicas y Técnicas (CONICET), Argentina). We also appreciate the support provided by the Universidad Nacional de Misiones (UNaM).

Conflicts of Interest

The authors declare no conflicts of interest.

References

  1. Pandey, P.; Kumar, S.; Gault, B. On the origin of a remarkable increase in the strength and stability of an Al rich Al-Ni eutectic alloy by Zr addition. Acta Mater. 2019, 170, 205–217. [Google Scholar] [CrossRef]
  2. Suwanpreecha, C.; Pandee, P.; Patakham, U.; Limmaneevichitr, C. New generation of eutectic Al-Ni casting alloys for elevated temperature services. Mater. Sci. Eng. A 2018, 709, 46–54. [Google Scholar] [CrossRef]
  3. Fan, Y.; Makhlouf, M.M. Castable aluminium alloys for high temperature applications. Mater. Sci. Forum. 2013, 765, 8–12. [Google Scholar] [CrossRef]
  4. Galenko, P.K.; Toropova, L.V.; Alexandrov, D.V.; Phanikumar, G.; Assadi, H.; Reinartz, M.; Paul, P.; Fang, Y.; Lippmann, S. Anomalous kinetics, patterns formation in recalescence, and final microstructure of rapidly solidified Al-rich Al-Ni alloys. Acta Mater. 2022, 241, 118384. [Google Scholar] [CrossRef]
  5. Zhang, S.; Li, Y.; Frederick, A.; Wang, Y.; Wang, Y.; Allard, L., Jr.; Koehler, M.; Shin, S.; Hu, A.; Feng, Z. In-situ formation of Al3Ni nano particles in synthesis of Al 7075 alloy by friction stir processing with Ni powder addition. J. Mater. Process. Technol. 2023, 311, 117803. [Google Scholar] [CrossRef]
  6. Cosan, K.A.; Gunduz, K.O.; Tarakcı, M.; Gencer, Y. Plasma electrolytic oxidation of as-cast and heat-treated binary Al-Ni alloys. Surf. Coat. Technol. 2022, 450, 128998. [Google Scholar] [CrossRef]
  7. Ding, R.; Deng, J.; Liu, X.; Wu, Y.; Geng, Z.; Li, D.; Zhang, T.; Chen, C.; Zhou, K. Enhanced mechanical properties and thermal stability in additively manufactured Al-Ni alloy by Sc addition. J. Alloys Compd. 2023, 934, 167894. [Google Scholar] [CrossRef]
  8. Morando, C.; Fornaro, O. Morphology and phase formation during the solidification of Al-Cu-Si and Al-Ag-Cu ternary eutectic system. Mater. Res. 2018, 21, 1–11. [Google Scholar] [CrossRef]
  9. Wen, Z.; Zhao, Y.; Hou, H.; Tian, J.; Han, P. First-principles study of Ni-Al intermetallic compounds under various temperature and pressure. Superlattices Microstruct. 2017, 103, 9–18. [Google Scholar] [CrossRef]
  10. Babilas, R.; Młynarek, K.; Łoński, W.; Lis, M.; Łukowiec, D.; Kądziołka-Gaweł, M.; Warski, T.; Radoń, A. Analysis of thermodynamic parameters for designing quasicrystalline Al-Ni-Fe alloys with enhanced corrosion resistance. J. Alloys Compd. 2021, 868, 159241. [Google Scholar] [CrossRef]
  11. Miyajima, Y.; Homma, T.; Takenaka, S.; Watanabe, C.; Adachi, H.; Ishikawa, K. High strength and low electrical resistivity of Al-0.1 at%Ni alloys produced by accumulative roll bonding. Mater. Today Commun. 2022, 33, 104587. [Google Scholar] [CrossRef]
  12. Esquivel, J.; Murdoch, H.A.; Darling, K.A.; Gupta, R.K. Excellent corrosion resistance and hardness in Al alloys by extended solid solubility and nanocrystalline structure. Mater. Res. Lett. 2017, 6, 79–83. [Google Scholar] [CrossRef]
  13. Hu, S.S.Q.; Ding, W.L.Z.; Xia, M.X.M. In situ study on the growth behavior of primary Al3Ni phase in solidifying Al–Ni alloy by synchrotron radiography. Acta Metall. Sin. (Engl. Lett.) 2018, 31, 668–672. [Google Scholar]
  14. Akopyan, T.K.; Belov, N.A.; Naumova, E.A.; Letyagin, N.V. New in-situ Al matrix composites based on Al-Ni-La eutectic. Mater. Lett. 2019, 245, 110–113. [Google Scholar] [CrossRef]
  15. Osório, W.R.; Peixoto, L.C.; Canté, M.V.; Garcia, A. Microstructure features affecting mechanical properties and corrosion behavior of a hypoeutectic Al-Ni alloy. Mater. Des. 2010, 31, 4485–4489. [Google Scholar] [CrossRef]
  16. Osório, W.R.; Peixoto, L.C.; Canté, M.V.; Garcia, A. Electrochemical corrosion characterization of Al-Ni alloys in a dilute sodium chloride solution. Electrochim. Acta 2010, 55, 4078–4085. [Google Scholar] [CrossRef]
  17. Zhang, Z.; Akiyama, E.; Watanabe, Y. Effect of α-Al/Al3Ni microstructure on the corrosion behaviour of Al–5.4wt % Ni alloy fabricated by equal-channel angular pressing. Corros. Sci. 2007, 49, 2962–2972. [Google Scholar] [CrossRef]
  18. Román, A.S.; Ibañez, E.R.; Méndez, C.M.; Pedrozo, M.; Kramer, G.R.; Zadorozne, N.S.; Alonso, P.R.; Ares, A.E. Electrochemical Properties of Diluted Al-Mg Alloys with Columnar-To-Equiaxed Transition. Front. Mater. 2022, 9, 1–15. [Google Scholar] [CrossRef]
  19. Roman, A.S.; Mendez, C.M.; Gervasi, C.A.; Rebak, R.B.; Ares, A.E. Corrosion resistance of aluminum-copper alloys with different grain structures. J. Mater. Eng. Perform. 2020, 30, 131–144. [Google Scholar] [CrossRef]
  20. Okamoto, H.; Schlesinger, M.E.; Mueller, E.M. Alloy Phase Diagrams; ASM Handbook; ASM International, ASM Headquarters and Geodesic Dome, Materials Park campus, Russell Township: Geauga County, OH, USA, 2016; Volume 8, pp. 108–146. [Google Scholar]
  21. Petzow, G. Metallographic Etching, 2nd ed.; American Society for Metals: Metals Park, OH, USA, 2008. [Google Scholar]
  22. Vander Voort, G. Metallography and Microstructures; ASM Handbook; ASM International: Metals Park, OH, USA, 2004; Volume 9, #06044G. [Google Scholar]
  23. Gueijman, S.F.; Schvezov, C.E.; Ares, A.E. Vertical and horizontal directional solidification of Zn-Al and Zn-Ag diluted alloys. Mater. Trans. 2010, 51, 1861–1870. [Google Scholar] [CrossRef]
  24. Ares, A.E.; Gueijman, S.F.; Schvezov, C.E. Semi-empirical modeling for columnar and equiaxed growth of alloys. J. Cryst. Growth 2002, 241, 235–240. [Google Scholar] [CrossRef]
  25. Ares, A.E.; Schvezov, C.E. Influence of solidification thermal parameters on the columnar-to-equiaxed transition of aluminum-zinc and zinc-aluminum alloys. Metall. Mater. Trans. A 2007, 38, 1485–1499. [Google Scholar] [CrossRef]
  26. Ares, A.E.; Schvezov, C.E. Solidification parameters during the columnar-to-equiaxed transition in lead-tin alloys. Metall. Mater. Trans. A 2000, 31, 1611–1625. [Google Scholar] [CrossRef]
  27. Kociubzyk, A.I.; Rozicki, R.S.; Ares, A.E. Movement of the interphases during the horizontal solidification of tin-zinc alloys. Rev. Mater. 2018, 23, e-11993. [Google Scholar]
  28. Ares, A.E.; Gassa, L.M. Corrosion susceptibility of Zn–Al alloys with different grains and dendritic microstructures in Nacl solutions. Corros. Sci. 2012, 59, 290–306. [Google Scholar] [CrossRef]
  29. ASTM E 112—96e3; Standard Test Methods for Determining Average Grain Size. ASTM: West Conshohocken, PA, USA, 2004.
  30. Kaya, H.; Böyük, U.; Çadırlı, E.; Maras, N. Measurements of the microhardness, electrical and thermal properties of the Al–Ni eutectic alloy. Mater. Des. 2012, 34, 707–712. [Google Scholar] [CrossRef]
  31. ASTM G5-14; Standard Reference Test Method for Making Potentiodynamic Anodic Polarization Measurements. ASTM: West Conshohocken, PA, USA, 2021.
  32. Martínez Villalobos, M.A.; Figueroa, I.A.; Suarez, M.A.; Angel, G.; Rodríguez, L.; Peralta, O.N.; González Reyes, G.; López, I.A.; Verduzco Martínez, J.; Trujillo, C.D. Microstructural Evolution of Rapid Solidified Al-Ni Alloys. J. Mex. Chem. Soc. 2016, 60, 67–72. [Google Scholar] [CrossRef]
  33. Zaid, B.; Saidi, D.; Benzaid, A.; Hadji, S. Effects of pH and chloride concentration on pitting corrosion of AA6061 aluminum alloy. Corros. Sci. 2008, 50, 1841–1847. [Google Scholar] [CrossRef]
  34. Palcut, M.; Priputen, P.; Kusy, M.; Janovec, J. Corrosion behaviour of Al–29at%Co alloy in aqueous NaCl. Corros. Sci. 2013, 75, 461–466. [Google Scholar] [CrossRef]
  35. Lekatou, A.; Sfikas, A.K.; Karantzalis, A.E.; Sioulas, D. Microstructure and corrosion performance of Al-32%Co alloys. Corros. Sci. 2012, 63, 193–209. [Google Scholar] [CrossRef]
  36. Palcut, M.; Ďuriška, L.; Špoták, M.; Vrbovský, M.; Gerhátová, Z.; Černičková, I.; Janovec, J. Electrochemical Corrosion of Al-Pd alloys in HCl and NaOH solutions. J. Min. Metall. Sect. B-Metall. 2017, 53, 333–340. [Google Scholar] [CrossRef]
  37. Duriška, L.; Cernicková, I.; Priputen, P.; Palcut, M. Aqueous Corrosion of Aluminum-Transition Metal Alloys Composed of Structurally Complex Phases: A Review. Materials 2021, 14, 5418. [Google Scholar] [CrossRef] [PubMed]
  38. Frankel, G.S. Electrochemical Techniques in Corrosion: Status, Limitations, and Needs. Electrochem. Tech. Corros. 2008, 5, 1–27. [Google Scholar] [CrossRef]
  39. Ralston, K.D.; Fabijanic, D.; Birbilis, N. Effect of grain size on corrosion of high purity aluminium. Electrochim. Acta 2011, 56, 1729–1736. [Google Scholar] [CrossRef]
  40. Soltis, J. Passivity breakdown, pit initiation and propagation of pits in metallic materials. Corros. Sci. 2015, 90, 5–22. [Google Scholar] [CrossRef]
  41. Natishan, P.M.; O’Grady, W.E. Chloride Ion Interactions with Oxide-Covered Aluminum Leading to Pitting Corrosion: A Review. J. Electrochem. Soc. 2014, 161, C421–C432. [Google Scholar] [CrossRef]
  42. Ma, Y.; Liu, Y.; Wang, M. Microstructures and corrosion resistances of hypoeutectic Al-6.5Si-0.45Mg casting alloy with addition of Sc and Zr. Mater. Chem. Phys. 2022, 276, 125321. [Google Scholar] [CrossRef]
  43. Kelly, R.G.; Scully, J.R.; Shoesmith, D.W.; Buchheit, R.G. Electrochemical Techniques in Corrosion Science and Engineering; Routledge, Taylor and Francis Group: London, UK, 2003. [Google Scholar]
  44. Fernandes Gomes, L.; Kugelmeier, C.L.; Garcia, A.; Della Rovere, C.A.; Spinelli, J.E. Influences of alloying elements and dendritic spacing on the corrosion behavior of Al-Si-Ag alloys. J. Mater. Res. Technol. 2021, 15, 5880–58930. [Google Scholar] [CrossRef]
  45. Osório, W.R.; Spinelli, J.E.; Afonso, C.R.M.; Peixoto, L.C.; Garcia, A. Electrochemical corrosion behavior of gas atomized Al-Ni alloy powders. Electrochim. Acta 2012, 69, 371–378. [Google Scholar] [CrossRef]
Figure 1. (a) Cooling curves of (a) Al-1wt. %Ni, (b) Al-3wt. %Ni, (c) Al-5.7wt. %Ni and (d) Al-8wt. %Ni alloys.
Applsci 14 08862 g001
Figure 2. (a) Thermal gradients indicating the position of the CET zone. (b) Macrostructure and (c) microstructures corresponding to columnar and equiaxed zones of the samples. Al-3wt. %Ni.
Applsci 14 08862 g002
Figure 3. Cooling rates, Ve, versus position for Al-Ni alloys.
Applsci 14 08862 g003
Figure 4. (a) Position of CET (mm) versus cooling rate (Ve). (b) Width of columnar grains (mm) versus cooling rate (°C/min).
Applsci 14 08862 g004aApplsci 14 08862 g004b
Figure 5. Average diameter of the equiaxed grains, DGe, depending on the position, from the base of the sample.
Applsci 14 08862 g005
Figure 6. Section of the Al-Ni phase diagram showing the alloys studied in the present investigation [20].
Applsci 14 08862 g006
Figure 7. Chemical composition analysis of Al-Ni alloys using SEM-EDX: (a) Al-3wt. %Ni. (b) Al-8wt. %Ni.
Applsci 14 08862 g007aApplsci 14 08862 g007b
Figure 8. Micrographs of the Al-Ni alloys: (a) Al-1wt. % Ni, (b) Al-3wt. % Ni, (c) Al-5.7wt. % Ni, (d) Al-8wt. % Ni.
Applsci 14 08862 g008
Figure 9. Microhardness, HV, values of the different phases of Al-Ni alloys (Al-3wt. %Ni and Al-8wt. %Ni).
Applsci 14 08862 g009
Figure 10. Variation of microhardness, HV, depending on the different positions with respect to the base of the sample.
Applsci 14 08862 g010
Figure 11. Variation of secondary dendritic spacing, λ2, and lamellar spacing, S2, with (a,c) cooling rate, Ve, and (b,d) position.
Applsci 14 08862 g011
Figure 12. (a) Variation in microhardness, HV, as a function of (a) λ2 and (b) S2.
Applsci 14 08862 g012
Figure 13. Cyclic potentiodynamic curves of Al-Ni alloys in 0.5 M NaCl solution: (a) columnar and (b) equiaxed zones.
Applsci 14 08862 g013aApplsci 14 08862 g013b
Figure 14. Values of Eoc of Al-Ni alloys measured over time. (a) Columnar and (b) equiaxed zones.
Applsci 14 08862 g014
Figure 15. EDS mapping of Al-Ni alloys after corrosion tests: (a) Al-1wt. %Ni, (b) Al-3wt. %Ni, (c) Al-5.7wt. %Ni and (d) Al-8wt. %Ni.
Applsci 14 08862 g015
Figure 16. Impedance spectra for Al-Ni alloys in 0.5 M NaCl solution. (a) Nyquist diagram for the columnar zone, (b) Nyquist diagram for the equiaxial zone, (c) Bode diagram for the columnar zone, (d) Bode diagram for the equiaxial zone.
Applsci 14 08862 g016
Figure 17. Equivalent circuit used to fit the experimental data.
Applsci 14 08862 g017
Figure 18. Polarization resistance, Rp, for Al-Ni alloys with columnar and equiaxed structures as a function of compositions.
Applsci 14 08862 g018
Figure 19. Polarization resistance, Rp, versus microhardness, HV, for both types of grain structures (columnar and equiaxed) of Al-Ni alloys. (a) Al-1wt. %Ni and Al-3wt. %Ni. (b) Al-5.7wt. %Ni and Al-8wt. %Ni.
Applsci 14 08862 g019
Table 1. Values of thermal parameters obtained for different Al-Ni alloys.
AlloyVe Liq.
(°C/min)
VS
(mm/s)
Gc
(°C/cm)
Solidification Time
(s)
CETMin
(mm)
CETMax
(mm)
Columnar Grain Width (mm)DGe
(mm)
Al-1wt. %Ni16.201.251.9743657521.45
Al-3wt. %Ni10.260.791.3814506031.60
Al-5.7wt. %Ni5.040.672.990545555.56.86
Al-8wt. %Ni6.521.182.586443524.61.99
Table 2. Electrochemical parameters of Al-Ni alloys in 0.5 M NaCl.
Ecorricorr
(mV)mA/cm2
Al-1wt. %NiColumnar zone−7220.0144
Equiaxed zone−7260.0068
Al-3wt. %NiColumnar zone−7210.0029
Equiaxed zone−7250.0014
Al-5.7wt. %NiColumnar zone−6980.0083
Equiaxed zone−7010.0242
Al-8wt. %NiColumnar zone−7070.0026
Equiaxed zone−7100.0046
Table 3. Electrochemical impedance spectroscopy fitting parameters.
RΩRpCPEnCeff
Ω*cm2Ω*cm2Ω−1s-n*cm−2 F.cm−2
Al-1wt. % NiColumnar zone3.62.47 × 1034.32 × 10−50.813.03 × 10−6
Equiaxed zone31.21 × 1045.45 × 10−50.792.99 × 10−6
Al-3wt. % NiColumnar zone0.393.08 × 1029.40 × 10−40.791.89 × 10−4
Equiaxed zone3.566.08 × 1037.87 × 10−50.741.82 × 10−6
Al-5.7wt. % NiColumnar zone2.671.58 × 1026.94 × 10−40.72.03 × 10−5
Equiaxed zone3.28.78 × 1021.55 × 10−40.777.98 × 10−6
Al-8wt. % NiColumnar zone4.621.28 × 1035.43 × 10−50.857.33 × 10−6
Equiaxed zone1.264.68 × 1021.57 × 10−40.822.18 × 10−5
Disclaimer/Publisher’s Note: The statements, opinions and data contained in all publications are solely those of the individual author(s) and contributor(s) and not of MDPI and/or the editor(s). MDPI and/or the editor(s) disclaim responsibility for any injury to people or property resulting from any ideas, methods, instructions or products referred to in the content.

