Article

Study on Failure Characteristics and Acoustic Emission Laws of Rock-like Specimens under Uniaxial Compression

School of Mechanics and Engineering, Liaoning Technical University, Fuxin 123000, China
*
Authors to whom correspondence should be addressed.
Appl. Sci. 2024, 14(19), 8893; https://doi.org/10.3390/app14198893
Submission received: 1 September 2024 / Revised: 29 September 2024 / Accepted: 30 September 2024 / Published: 2 October 2024

Abstract

:
Complex underground conditions make it challenging to conduct extensive coring, and it is difficult for laboratories to carry out a large number of rock mechanics experiments due to the limited number of cores. Rock-like specimens are commonly used in the laboratory to replace coal-rock specimens. In this paper, rock-like specimens with different proportions are produced to study the mechanical properties, failure characteristics, and acoustic emission laws of rock-like specimens under uniaxial compression. The results show that when the rock-like specimen does not contain gypsum, the stress of the specimen decreases rapidly after reaching the peak stress, which is similar to the mechanical properties of hard brittle rock. When the rock-like specimen contains gypsum, the stress of the specimen decreases slowly after reaching the compressive limit, and the failure of the specimen is gentle, which is similar to the mechanical properties of soft rock. When the specimen lacks gypsum, the strength of the rock-like specimen is larger, and the strength of the specimen is positively correlated with the proportion of cement. When the specimen contains gypsum, the strength of the rock-like specimen decreases sharply, and the strength of the rock-like specimen is negatively correlated with the proportion of gypsum. The maximum acoustic emission ringing count increases with higher cement content but decreases with increased gypsum content. The cumulative count change of acoustic emissions approximately underwent four stages, aligning well with the four stages of uniaxial compression failure observed in typical rock. The research results have important reference value for the selection of rock-like materials to replace the original rock materials for laboratory research.

1. Introduction

Investigating deep coal seams and rock formations typically involves in situ sampling followed by transportation to the laboratory for subsequent processing and the experimental analysis of rock mechanical properties. In the actual sampling, obtaining real cores of all rock formations is difficult and limited in number. Therefore, analogical methods are frequently employed to fabricate rock-like specimens for investigating the mechanical properties of rocks [1,2,3].
The material for making rock-like specimens is cheap and easy to obtain, and the material properties are stable. Consequently, it finds extensive application in the field of geotechnical mechanics [4,5,6,7]. The production materials of rock-like specimens are generally composed of aggregate and cementing agents. Different proportions of aggregate and cementing agents are mixed and cast into standard specimens, and specimens with similar mechanical properties to coal rock are selected to replace coal rock [8,9,10,11]. Currently, extensive experimental research has been conducted by domestic and international experts and scholars on rock-like specimens. Haeri et al. [12] prepared rock-like samples using Portland pozzolana cement, mica sheet, and water. They carried out experimental and numerical studies on the mechanism of the micro-crack merging process of rock-like materials. Sabri et al. [13] studied the influence of particle size on the failure mechanism and fracture toughness of rock-like specimens. Sharafisafa et al. [14] prepared rock-like specimens with different flaw configurations by 3D printing technology. They obtained the bearing capacity of rock-like specimens with single and double flaws and the mechanism of crack initiation and propagation. Feng et al. [15] fabricated rock-like specimens with different proportions and conducted indoor uniaxial compression experiments to investigate the influence of the water–cement ratio and cement–sand ratio on the mechanical properties and failure modes of the specimens. Kang et al. [16] investigated the impact of different thickness ratios of soft and hard interbedded layers, as well as different lithology combinations, on the mechanical properties of specimens subjected to diverse static loading rates. Yin et al. [17] produced two kinds of transversely isotropic rock-like samples and compared the mechanical differences between the two kinds of rock materials by conventional triaxial compression experiments. Many scholars [18,19,20] have also used cement, gypsum, and other basic raw materials to prepare rock-like specimens with similar properties to the original rock by adjusting the ratio of different materials. As a non-destructive testing technology [21], acoustic emission (AE) is widely used to detect concrete, masonry, and rock [22]. Aggelis et al. [23] monitored the acoustic emission signals of different kinds of concrete in the bending process and proposed some AE indices. D’Angela et al. [24] proposed an innovative method for the structural health monitoring of metal components, based on the information entropy evaluation of AE data. Wang et al. [25] studied the energy evolution and AE characteristics of rock under different cyclic loading and unloading paths. Chen et al. [26] and Li et al. [27] carried out cyclic loading and unloading experiments on rock materials and discussed the Kaiser and Felicity effects. Ou et al. [28] conducted uniaxial compression experiments on different types of rocks and conducted AE monitoring simultaneously. It was found that the AE response of rocks is closely related to the damage and fracture process. Rao et al. [29] analyzed the AE generated during the compression fracture process of brittle rocks in detail and calculated the improved b value. Xing et al. [30] combined the digital image correlation (DIC) method and AE technology to study the evolution law of rock deformation localization.
In laboratory studies, it is usually impossible to obtain an unlimited number of rock samples. Rock-like specimens are often used to replace natural rock samples to obtain enough experimental samples. Experts and scholars have carried out a large number of experimental studies on rock specimens or rock-like specimens by using acoustic emission technology. However, there are few systematic studies on how to standardize the production of rock-like specimens and the mechanical properties and failure characteristics of rock-like specimens under different proportions. This paper focuses on rock-like specimens as the subject of investigation, utilizing cement, quartz sand, and gypsum as raw materials to produce 11 sets of standardized rock-like specimens with different proportions. The experimental study on the mechanical properties, failure characteristics, and acoustic emission law of rock-like specimens with different material proportions under uniaxial compression was carried out. The research results can provide a basis for the standard production of rock-like specimens and the selection of rock-like specimens to replace natural rock specimens according to different material proportions.

2. Materials and Methods

2.1. Proportioning Scheme of Rock-like Specimen

The experimental raw materials selected for this study included P.O 42.5 (Eagle Group Co., Fuxin, China) ordinary Portland cement, quartz sand, and gypsum. Set up 2 different combinations: (1) quartz sand, cement; (2) quartz sand, cement, gypsum. The preliminary experiment revealed that the water content had an impact on the material properties. Excessive water content enhanced the fluidity of the material, making it difficult to shape. When the water content was insufficient, an abundance of fine sand particles could be observed on the specimen’s surface after molding. The experiment found that the quality of water accounting for 15% of the total quality of raw materials is the best water consumption. The material proportions of the first group of the combination methods were 1:0.8, 1:1.2, 1:1.6, and 1:2.0, respectively, while the material proportions of the second group of combination methods were 1:0.8:0.1, 1:0.8:0.2, 1:0.8:0.3, 1:0.8:0.4, 1:1.2:0.4, 1:1.6:0.4, and 1:2.0:0.4. Table 1 displays the specimen number, proportioning scheme, and physical parameters of rock-like specimens. It can be seen from Table 1 that when the proportion of quartz sand and gypsum was fixed, the quality and density of the specimen increased with the increase in cement proportion. When the proportion of quartz sand and cement was fixed, the quality and density of the specimen decreased with the increase in gypsum proportion.

2.2. Preparation of Rock-like Specimens

A cylindrical hard plastic mold with a diameter of 50 mm and a height of 100 mm was selected for the experiment. Four specimens were poured in each ratio. The molds and part of the specimens are shown in Figure 1.
Rock-like specimens are poured as follows:
(1)
Disassemble the mold, evenly apply lubricating oil on the inner surface of the mold to facilitate later demolding, and then assemble the mold.
(2)
Weigh the material according to the predetermined material proportion, thoroughly blend it, incorporate a specific quantity of water, and agitate until homogenous.
(3)
The mixed material is divided 5 times into the mold. Each filling requires shaking and compacting the concrete within the mold, followed by a final smoothing of the specimen surface.
(4)
After standing at room temperature for 24 h, the specimen is removed from the mold, assigned a number, and then cured for 28 d.
(5)
Select the specimen with smooth surfaces and a good forming effect, measure the size of the specimen, and grind the end of the specimen to ensure that the non-parallelism between the two ends of the specimen is within 0.05 mm.
(6)
The specimen undergoes ultrasonic testing, and select specimens with small dispersion.

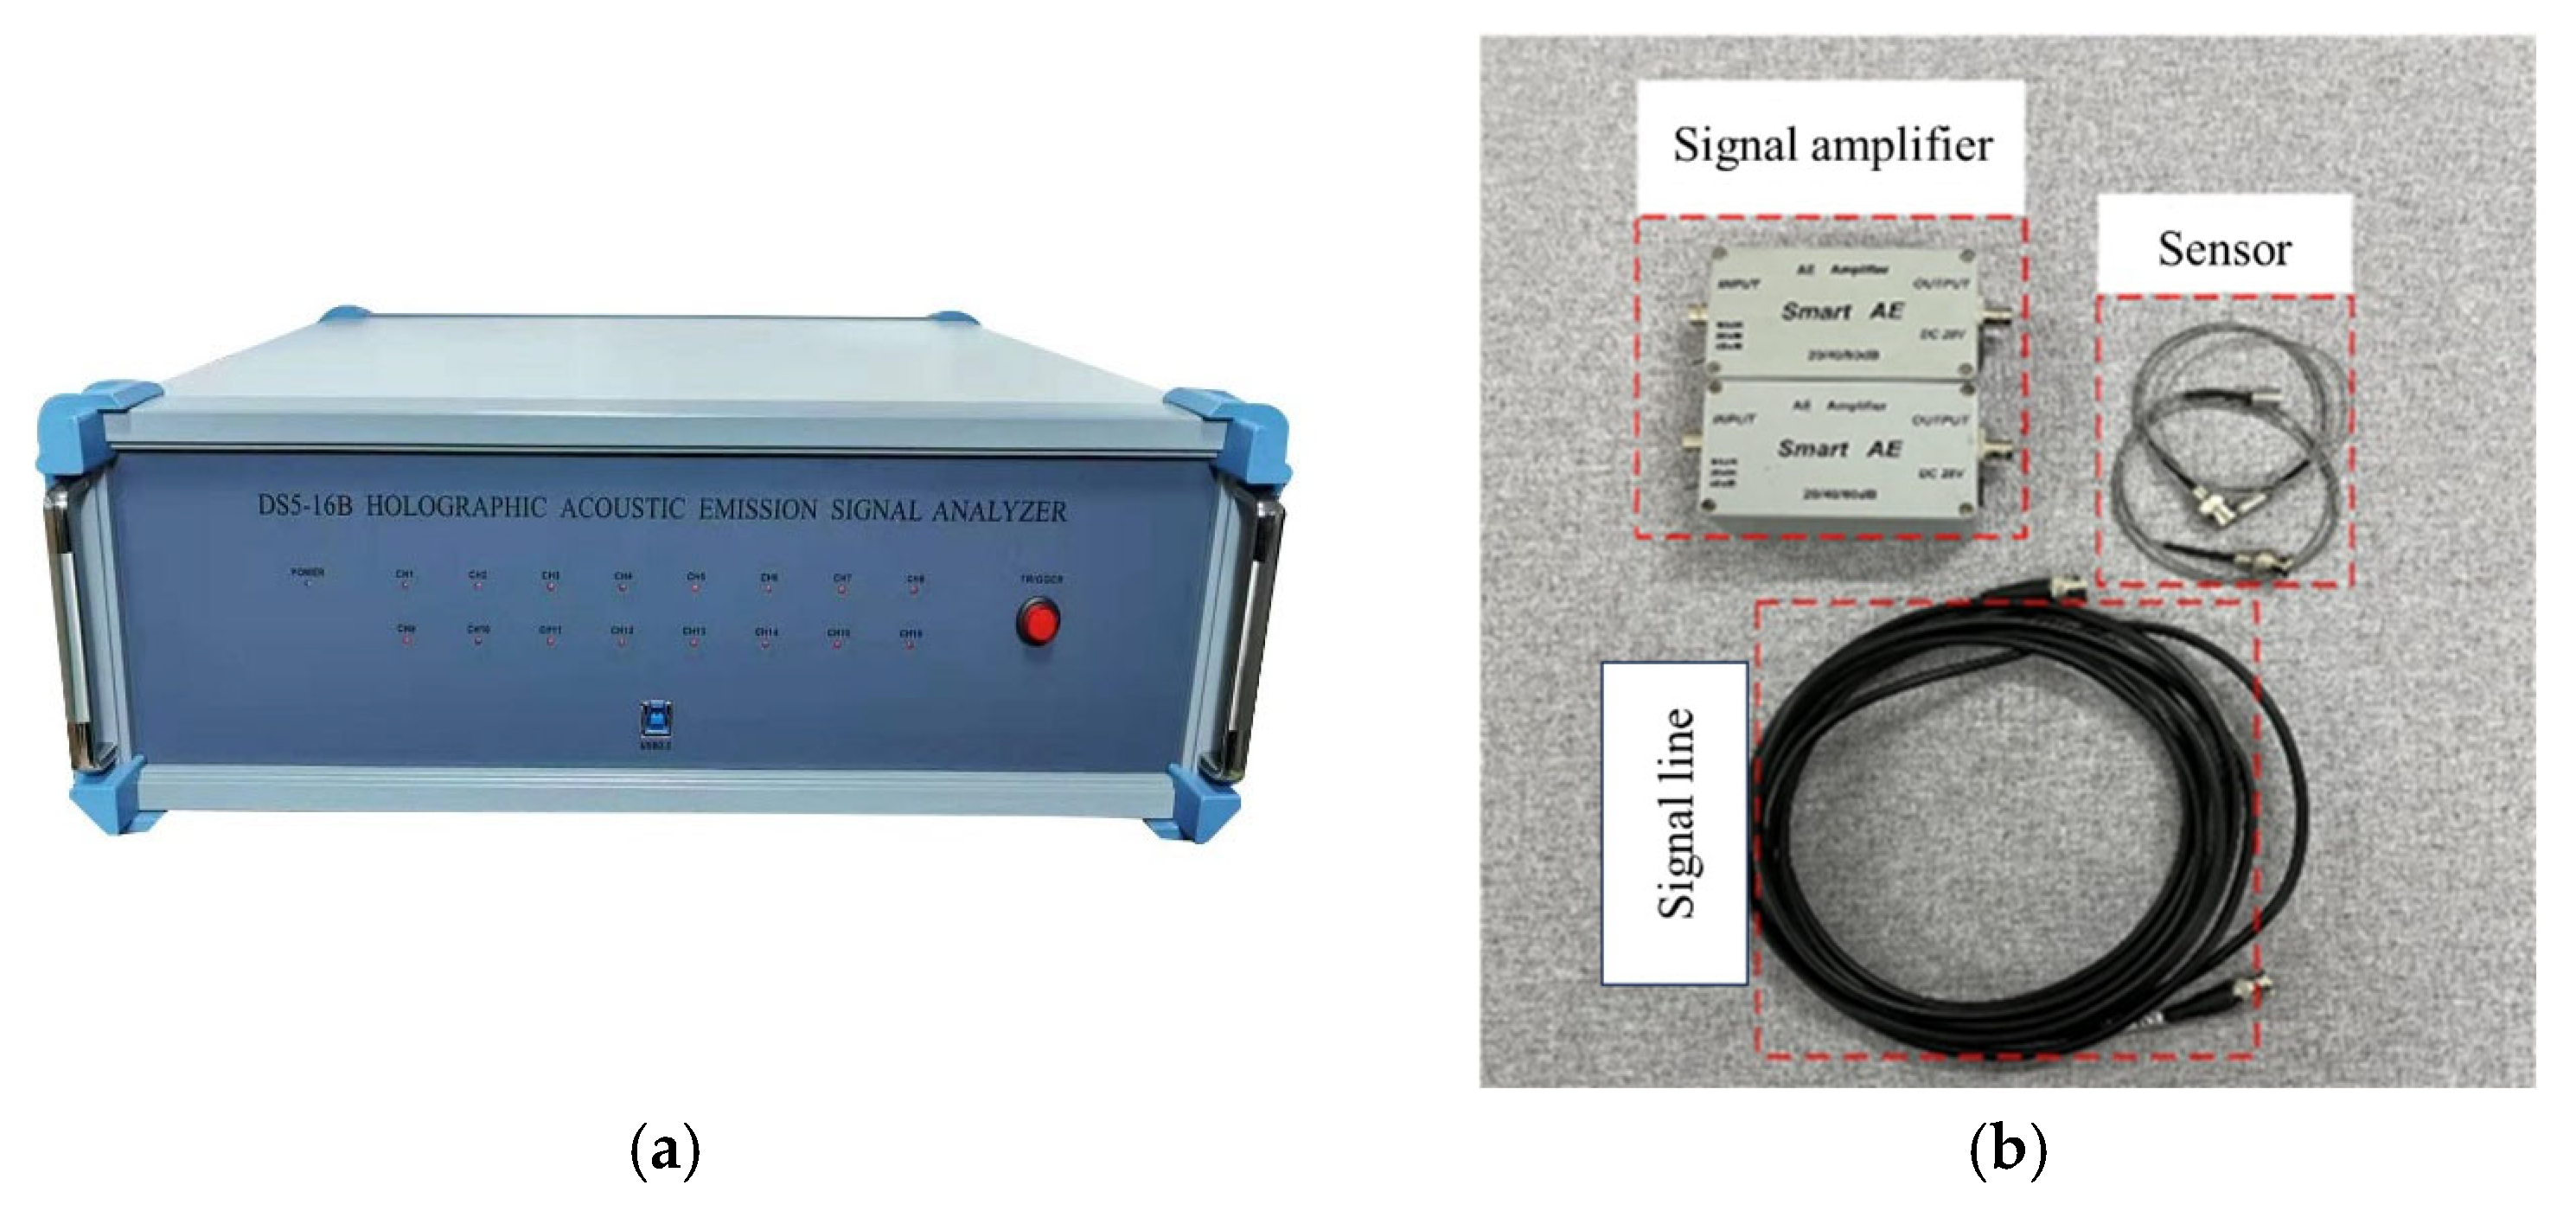
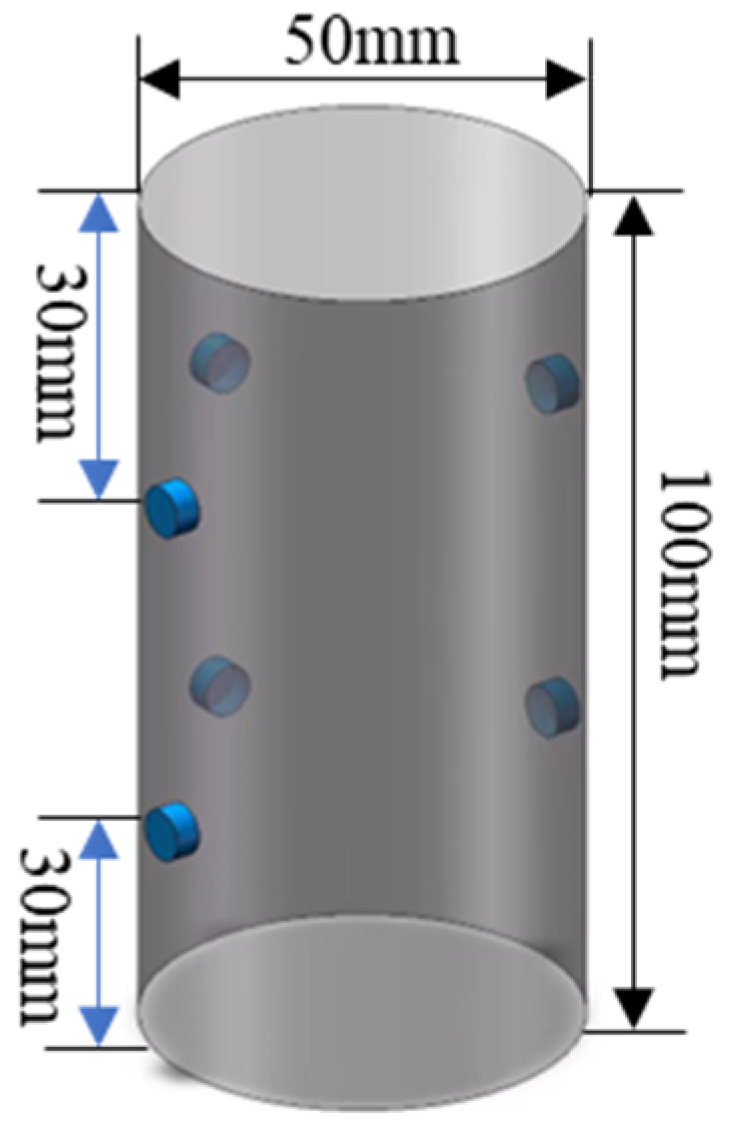
2.3. Experimental System and Loading Method

The experimental system comprised a loading system, an acoustic emission system, and a data acquisition and monitoring system, as depicted in Figure 2.
The MTS electronic universal experimental machine was employed in the loading system, offering a displacement loading speed ranging from 0.001 mm/min to 1000 mm/min, with a maximum load capacity of 100 kN. The experimental accuracy could achieve 0.2%, meeting the relevant requirements of the rock mechanics experiments. The acoustic emission equipment was composed of an acoustic emission instrument, acoustic emission sensors, a preamplifier, and signal lines. The acoustic emission instrument used was a Beijing Soft Island DS5-16B acoustic emission signal analyzer (Beijing Soft Island Technology Co., Ltd., Beijing, China), as shown in Figure 3a. The device has the advantages of a high sampling rate, complete data acquisition, long acquisition time, and easy data export. It can collect and store the acoustic emission waveform in real-time during the experiment. The acoustic emission sensor is shown in Figure 3b. The size of this type of acoustic emission sensor is small, and multiple sensors can be deployed in a limited space. The main advantage of the AE sensor is high sensitivity, which can detect small energy release events inside the material, and the collected acoustic emission signal is rich and comprehensive. The bandwidth is 1 KHz–3 MHz. The Hsu–Nielsen test was performed on the AE sensor to calibrate the sensitivity of the sensor before the formal start of the test. Because there is always ineffective noise interference in the experiment, the wavelet transform method was used to filter the AE signal.
With a sampling frequency of 3 MHz and a threshold value set at 100 mv during the experiment, effective external noise shielding was ensured. Three acoustic emission sensors were uniformly arranged at places 3 cm away from each end-face of the specimen, and a total of 6 acoustic emission sensors were arranged for each specimen. The position diagram of the acoustic emission sensors is shown in Figure 4.
When loading the rock-like specimen, the force control method was used to slowly load the specimen to 10 N, ensuring that the upper indenter of the press made contact with the upper surface of the specimen. Subsequently, displacement control was employed for further loading, with a predetermined loading speed set at 0.5 mm/min. The pressure loading of the experimental machine and acoustic emission monitoring were carried out at the same time. The system automatically collected and recorded the monitoring data such as the time, load, and acoustic emission information of the experiment until the specimen was damaged.

3. Results and Analysis

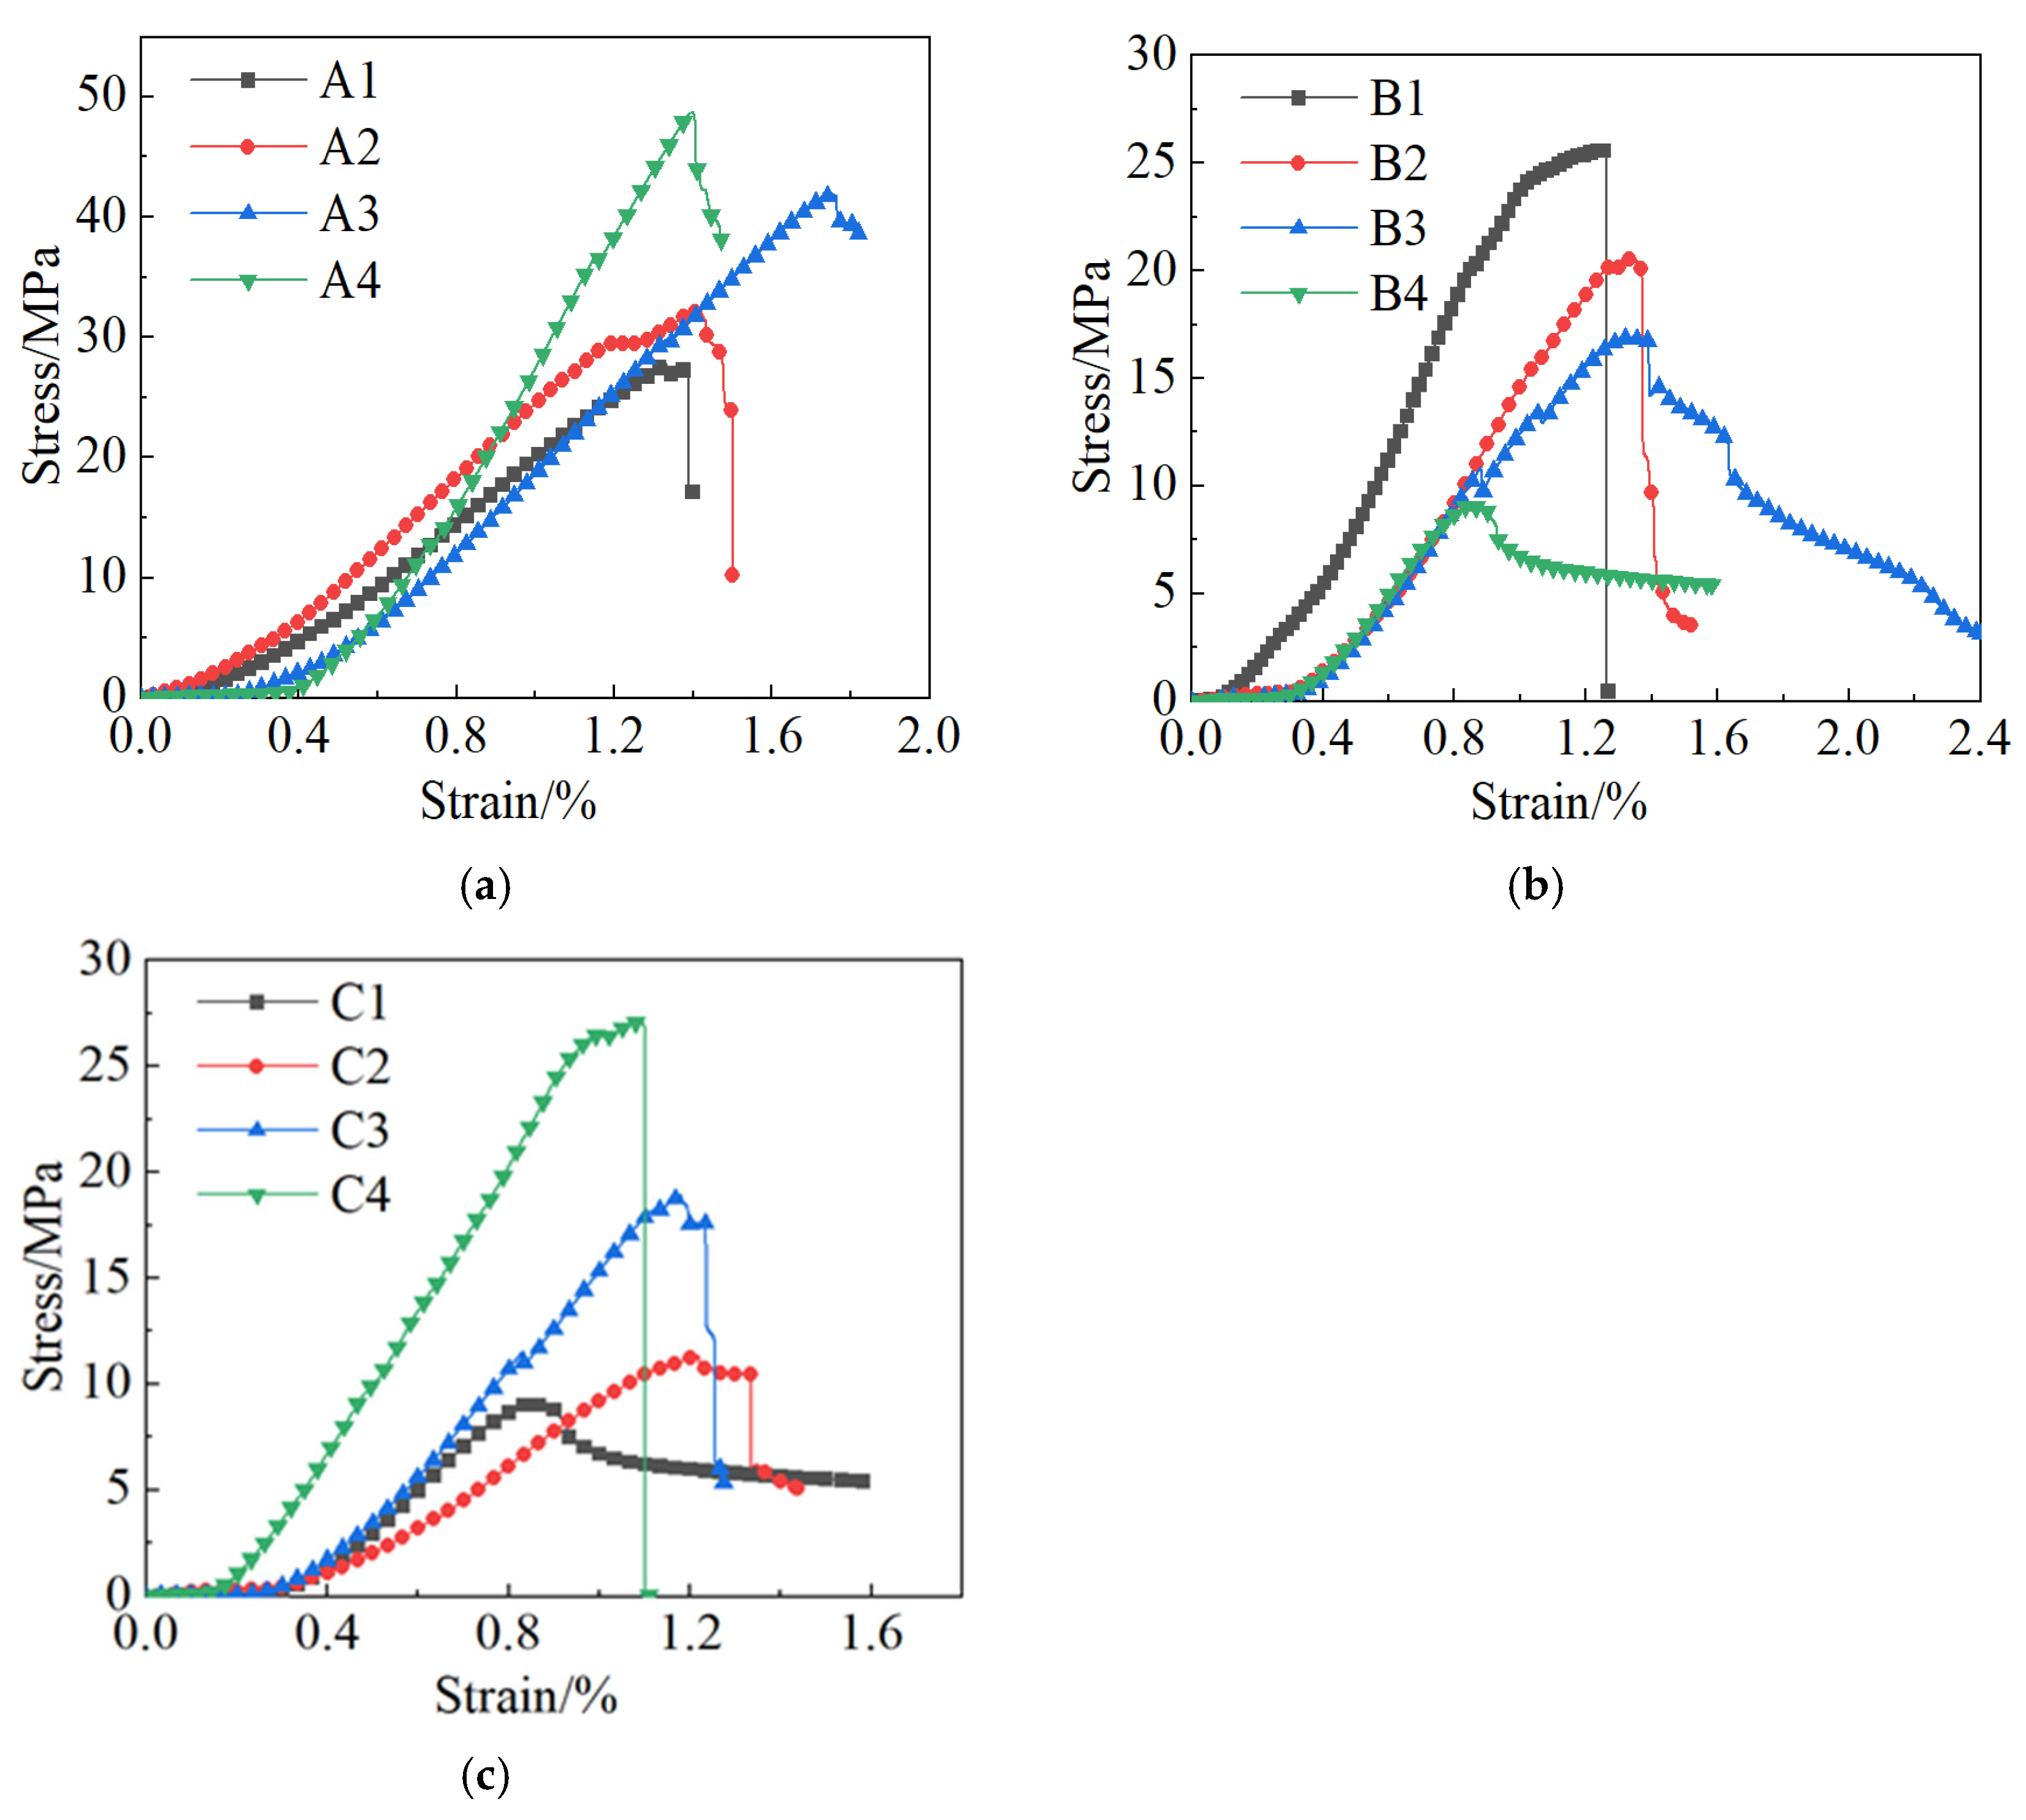
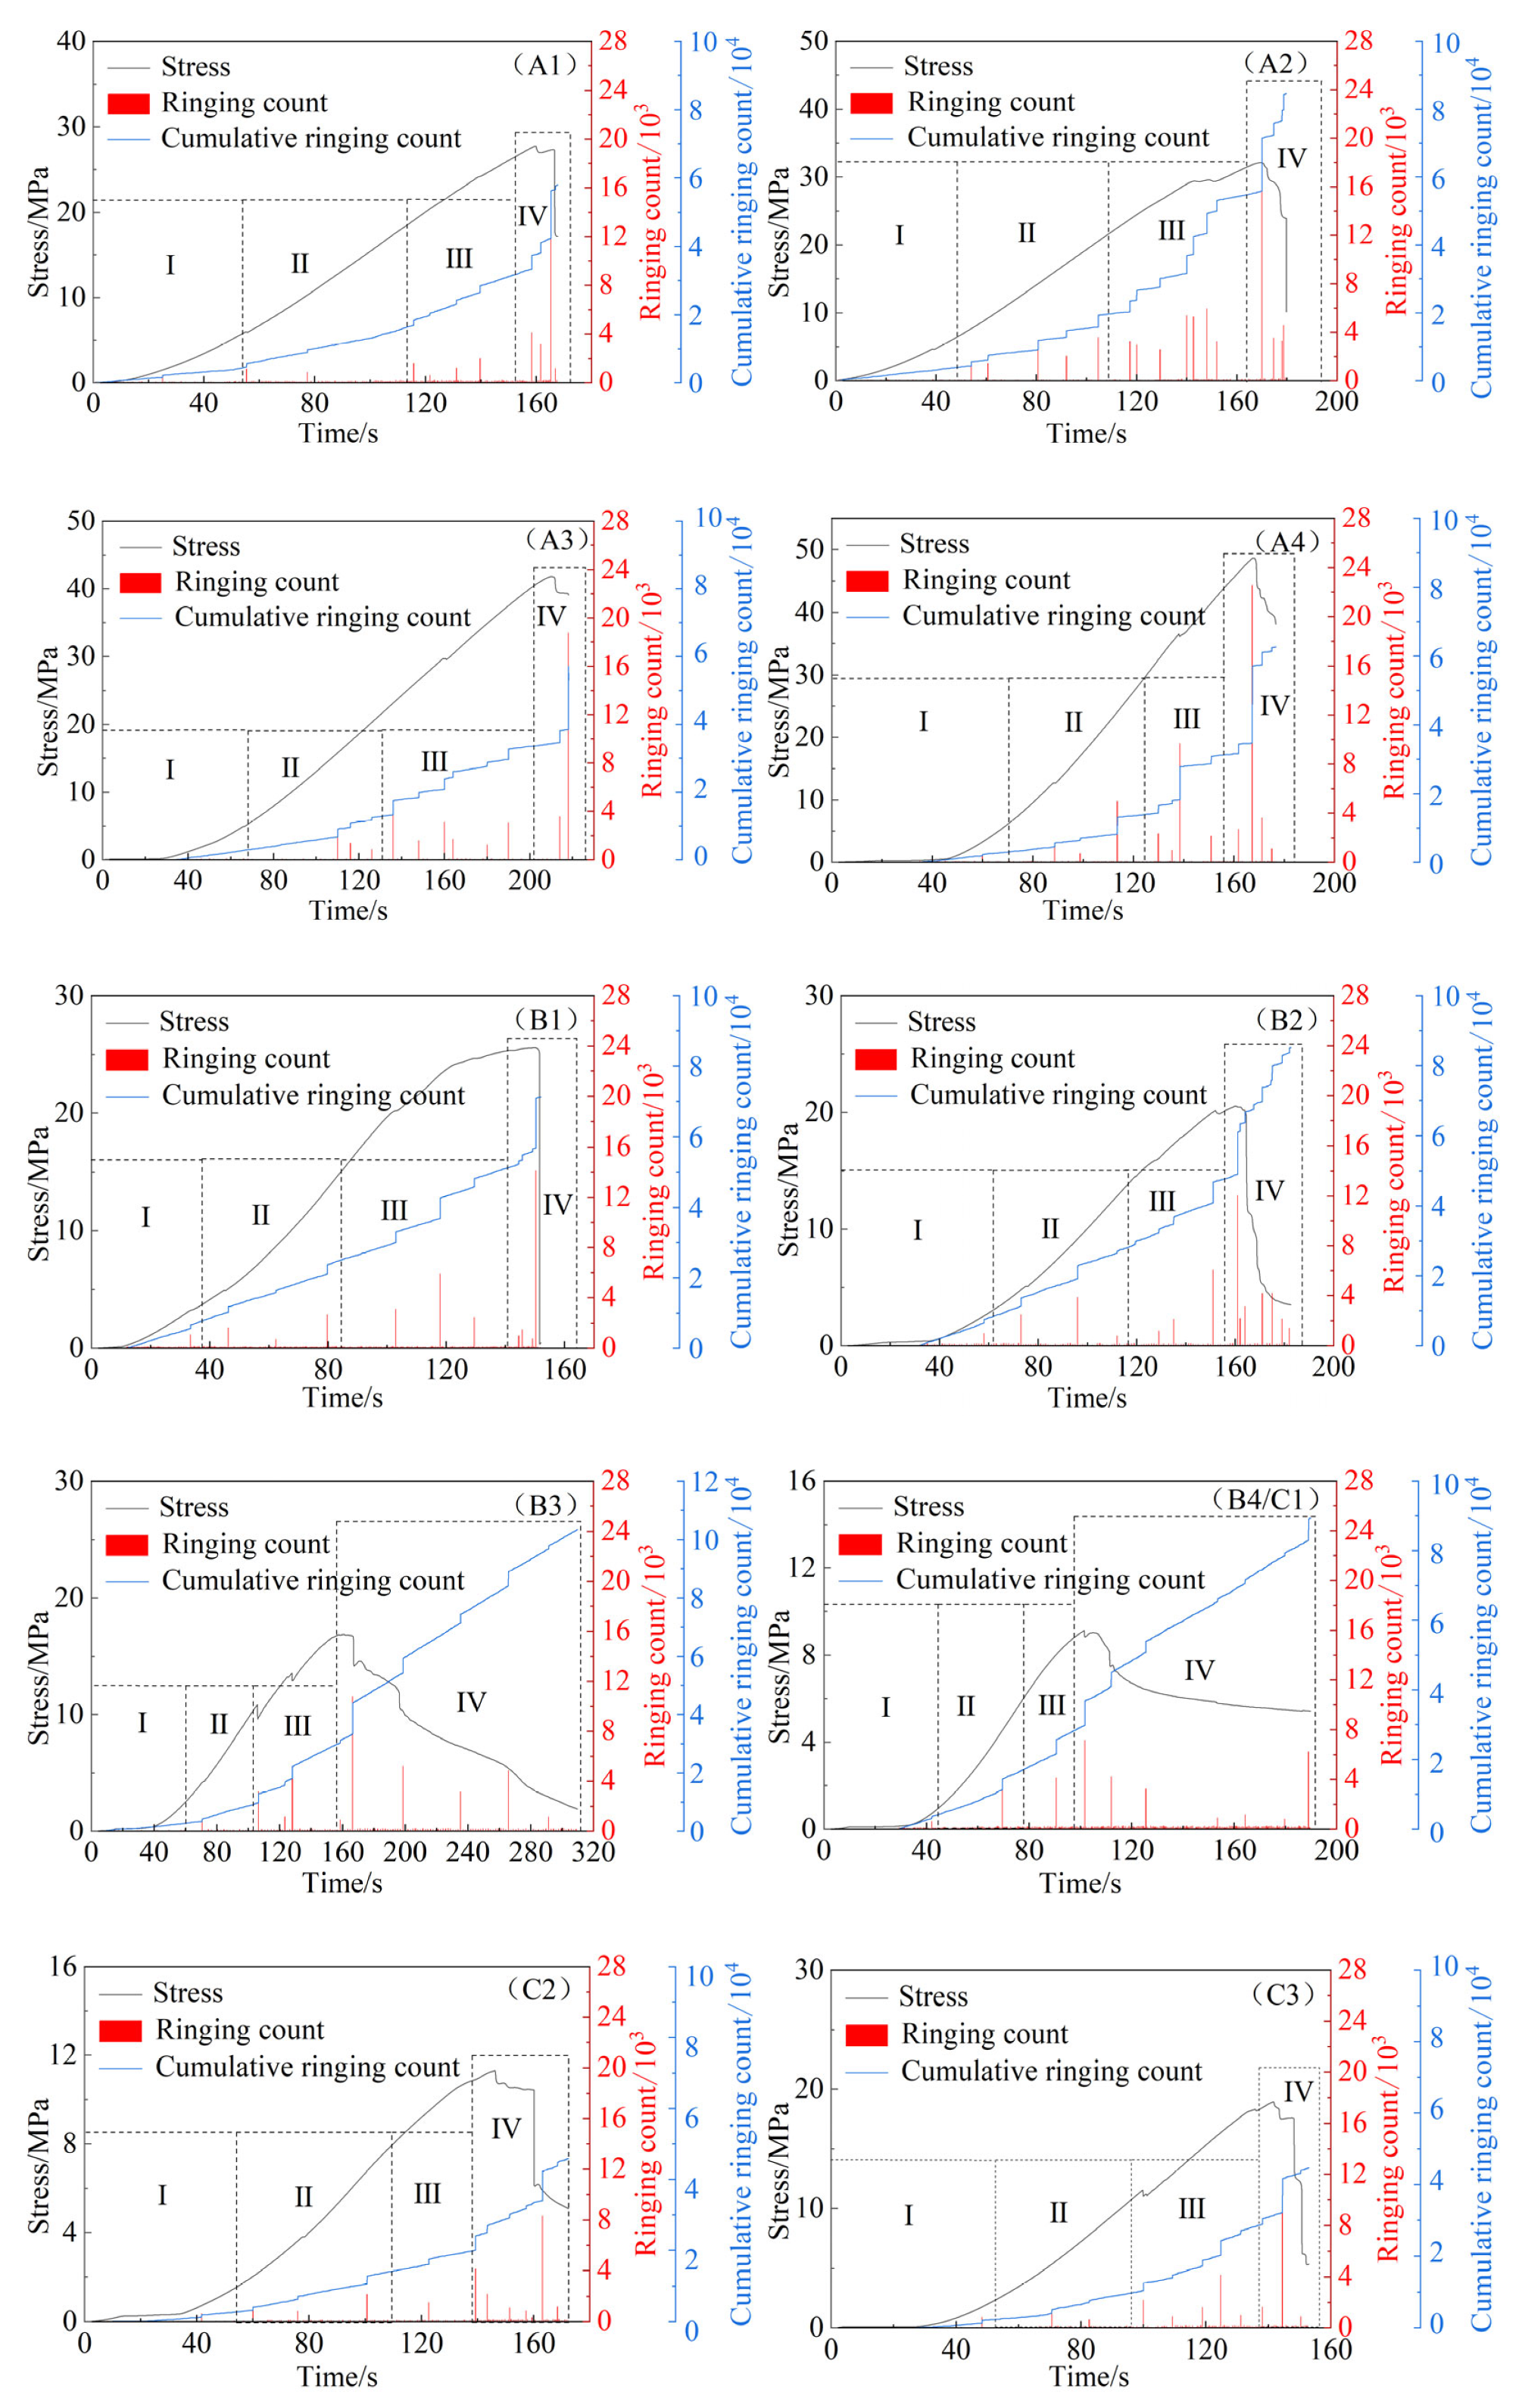
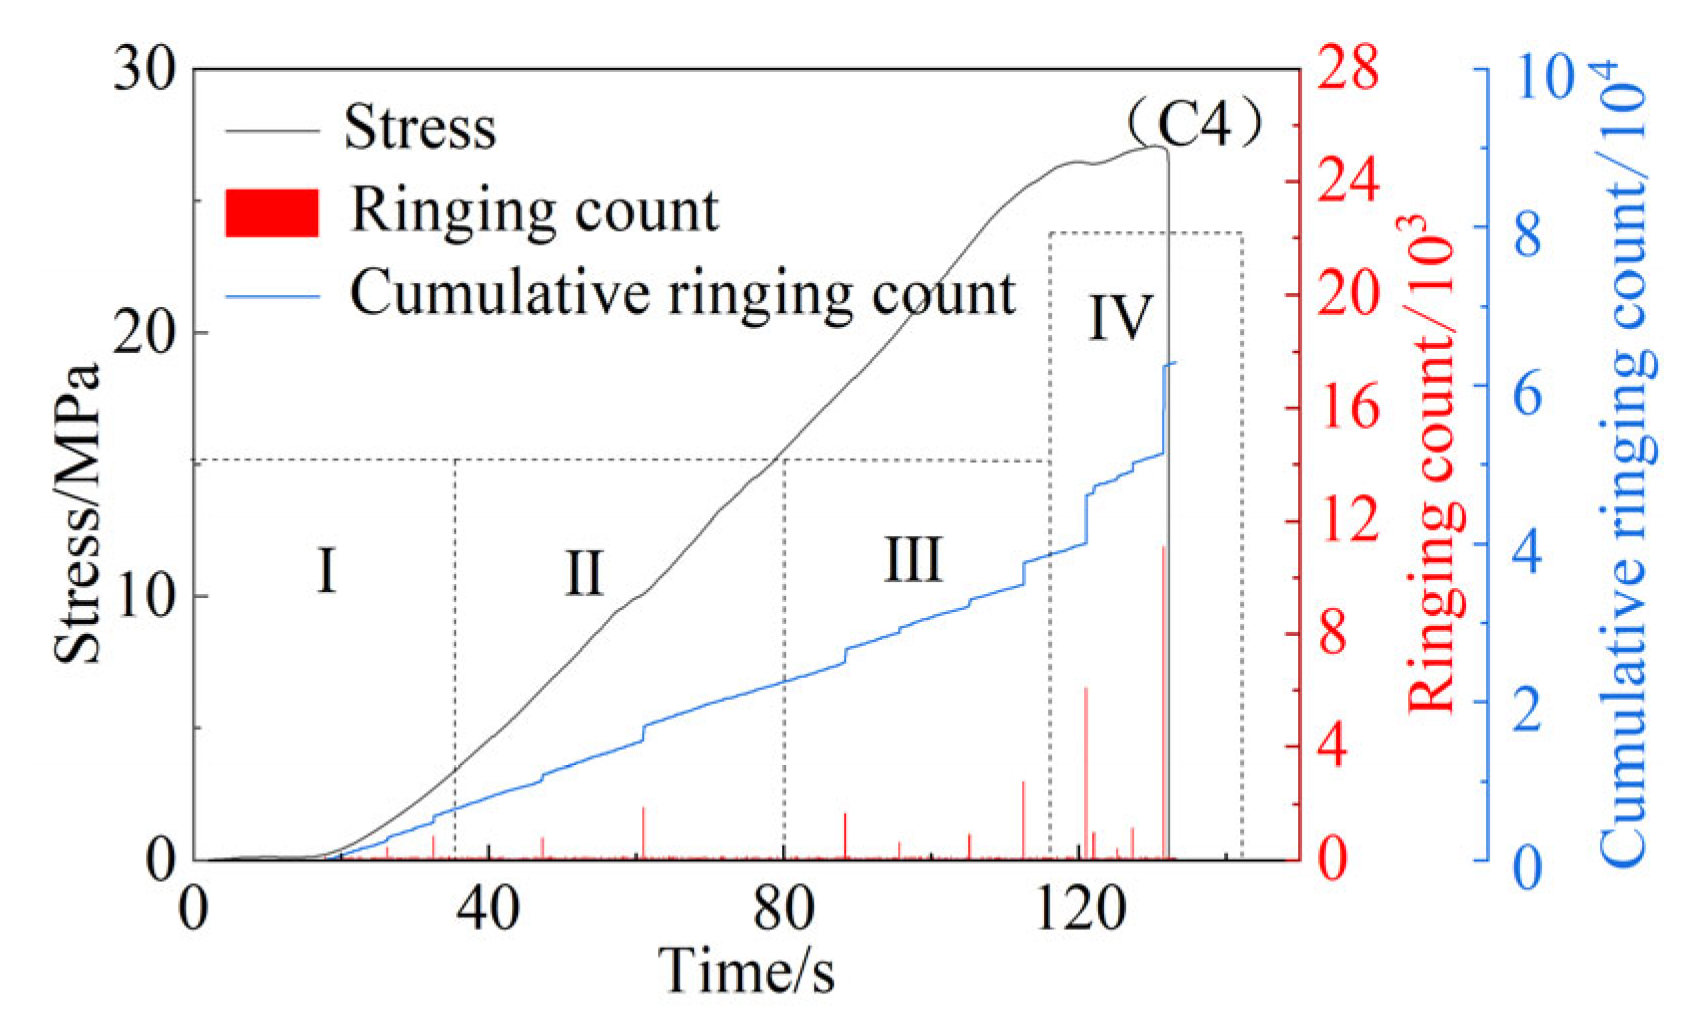
3.1. Stress–Strain Curve Analysis

The stress–strain curves of each specimen under different proportions are shown in Figure 5.
The analysis of Figure 5 reveals that each rock-like specimen underwent stages of pore and crack compaction, elastic deformation, damage, and post-fracture. This was the same as the change rules of the typical original rock stress–strain curve.
(1)
Pore and crack compaction stage: with the increase of axial compression, the original pores and cracks in the specimen were gradually closed, the material was compacted, and the stress–strain curve was concave downwards.
(2)
Elastic deformation stage: the stress–strain curve gradually approached a sloping straight line as the loading process continued. At that time, the slope of the straight line was the elastic modulus of the rock-like materials.
(3)
Damage stage: at this stage, new cracks and fissures were generated inside the rock-like specimens and the specimen produced irreversible deformation. The stress–strain curve was no longer a sloping straight line, and the slope of the curve gradually decreased.
(4)
Post-fracture stage: as the loading continued, the load that the rock-like specimen could withstand reached the peak value. At that time, the stress–strain curve suddenly dropped, and the specimen failure entered the post-fracture stage.
The analysis of Figure 5 revealed that in the absence of gypsum, the stress of the rock-like specimen rapidly decreased after reaching its peak, the specimen immediately failed, and it lost its bearing capacity. This brittle failure characteristic was similar to the mechanical properties exhibited by hard brittle rocks. When the rock-like specimen contained gypsum and reached its compressive limit, the stress of the specimen gradually decreased, and the failure of the specimen was relatively moderate. Beyond the peak strength, the specimen still maintained a certain bearing capacity, which was similar to the mechanical properties of soft rock.

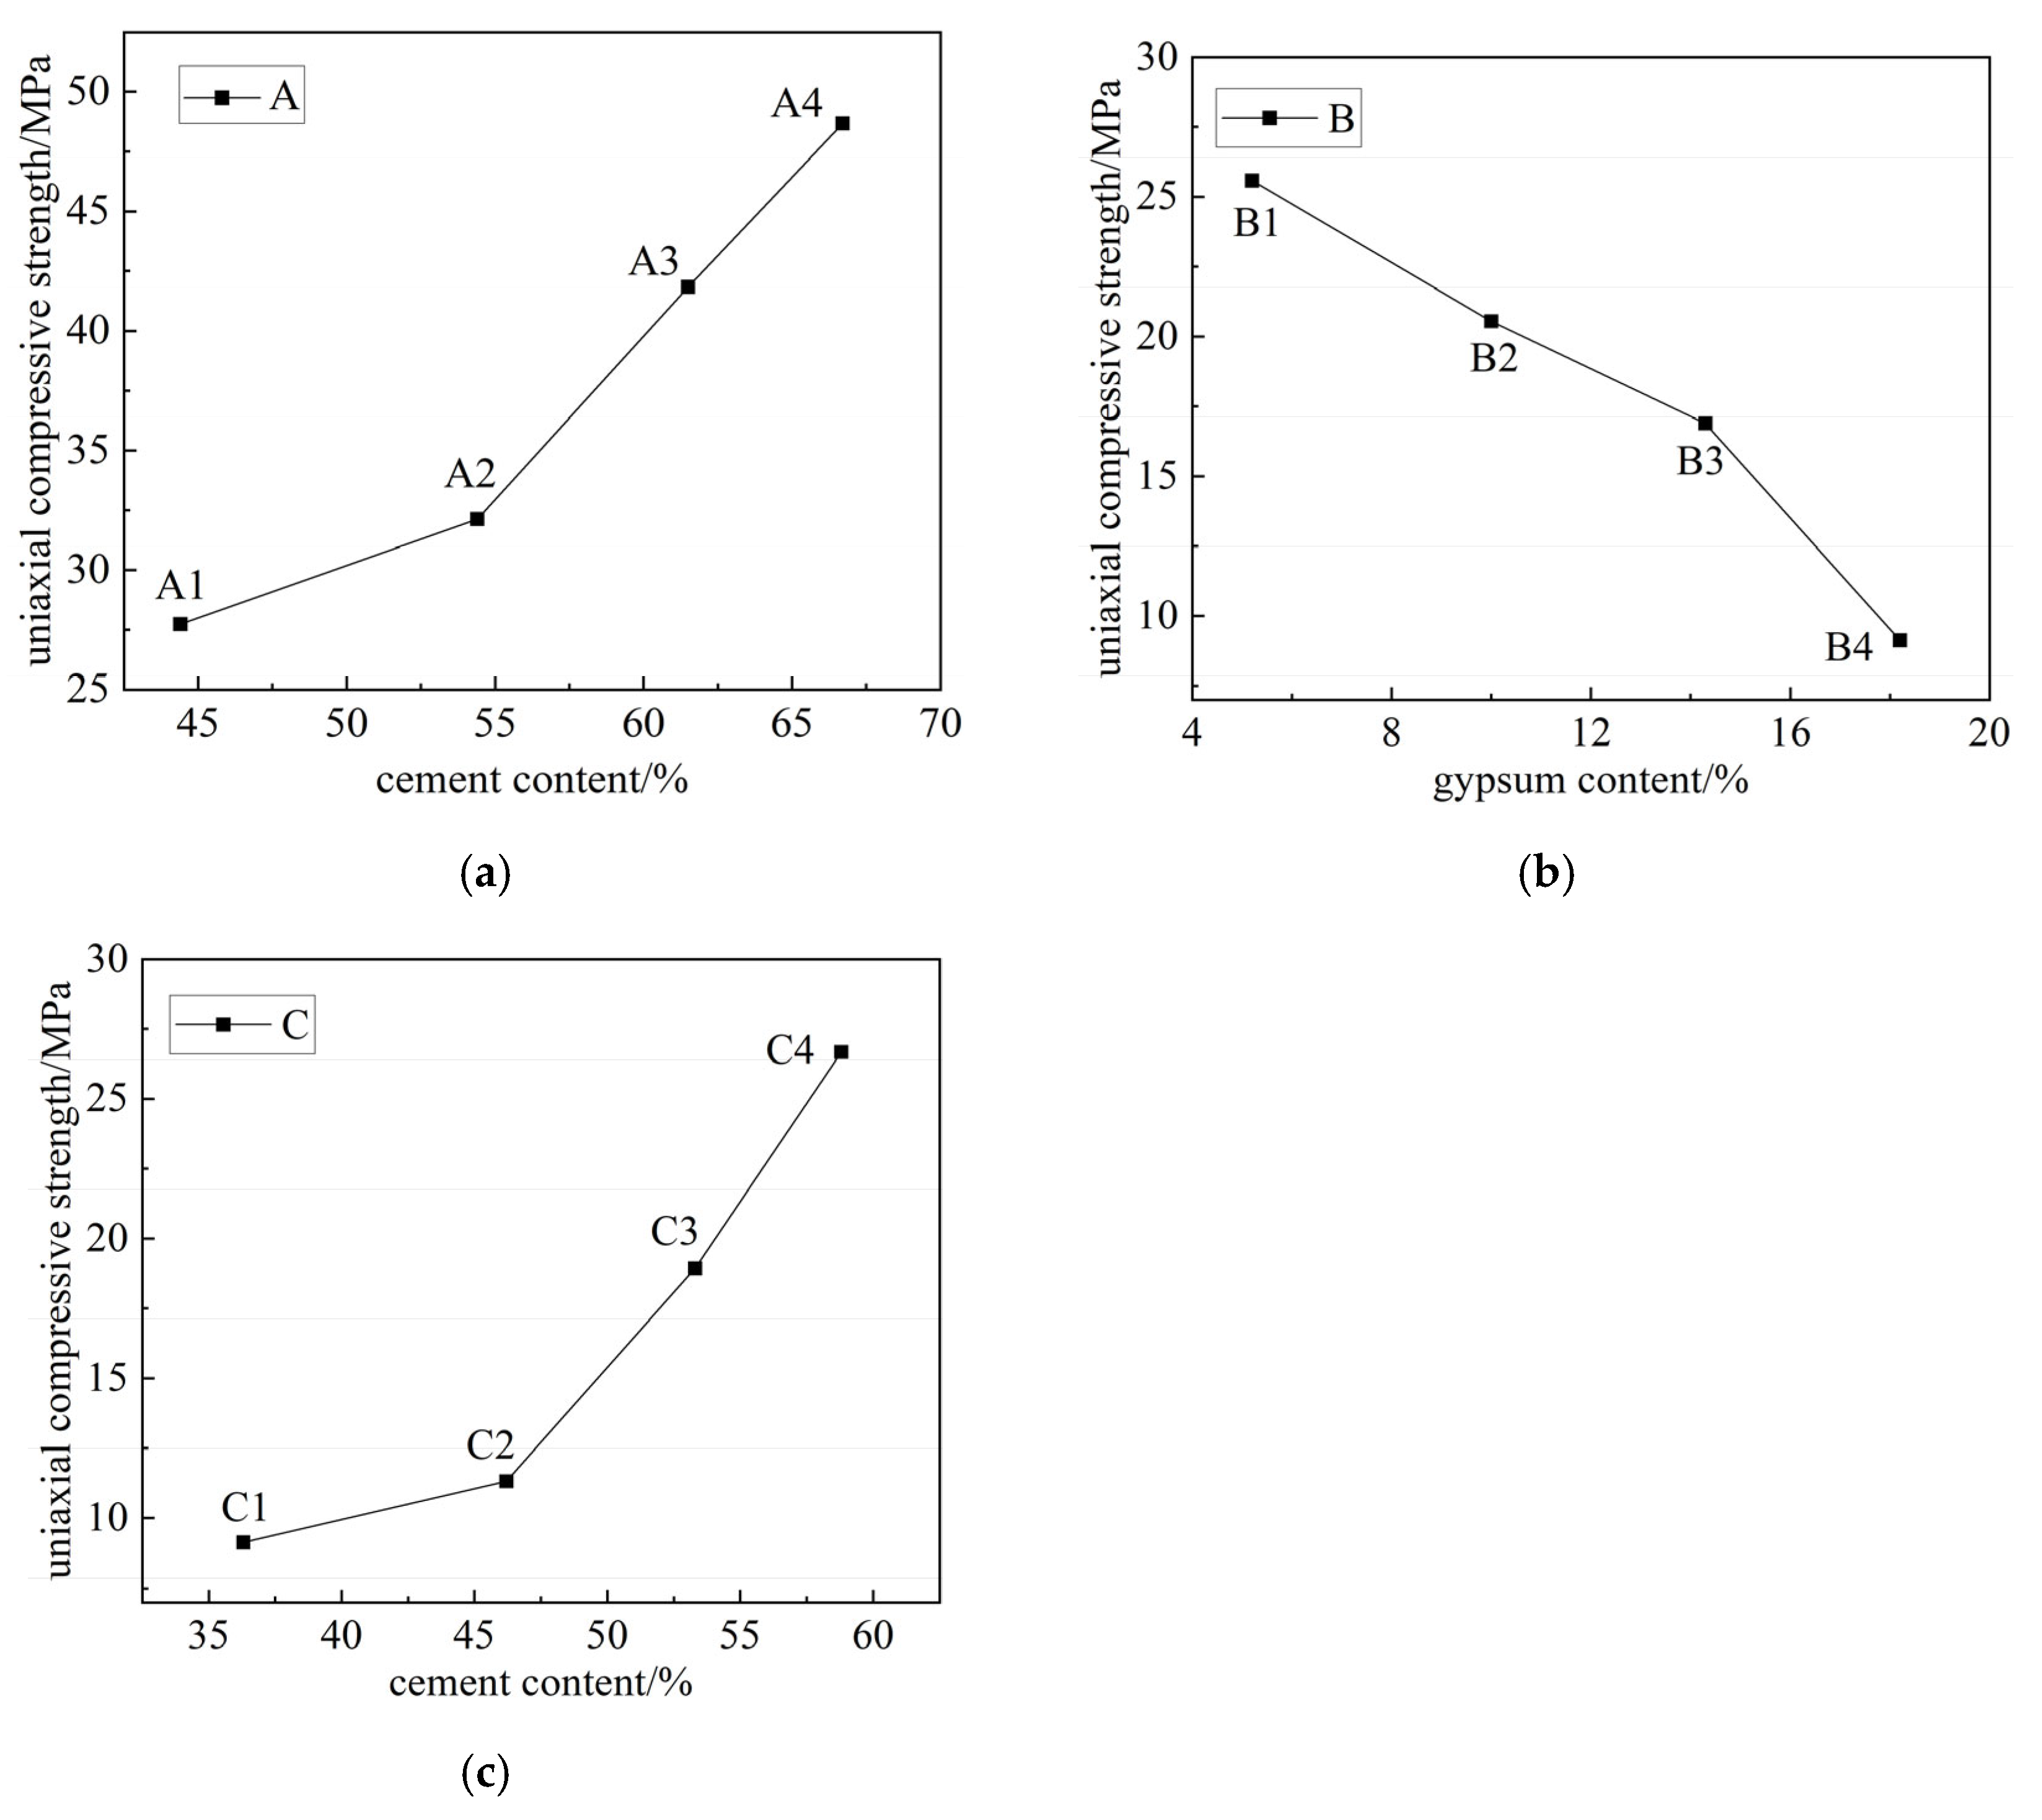
3.2. Analysis of Strength Characteristics

The mechanical parameters of rock-like specimens with different proportions are shown in Table 2, and the uniaxial compressive strength is shown in Figure 6.
As shown in Table 2 and Figure 6, when quartz sand and cement were used as materials, cement accounted for 44.4%, 54.4%, 61.5%, and 66.7% of specimens A1, A2, A3, and A4, and the compressive strength of the specimens was 27.74, 32.13, 41.84, and 48.67 MPa, respectively. The results indicate that as the cement proportion in the material increased, there was a corresponding increase in both the compressive strength and elastic modulus of the rock-like specimens. Furthermore, there existed a positive correlation between the cement proportion in the material and the compressive strength and elastic modulus of the specimens. When the material was quartz sand, cement, and gypsum, the gypsum in specimens B1, B2, B3, and B4 accounted for 5.2%, 10%, 14.3%, and 18.2%, and the compressive strength of the specimen was 25.58, 20.55, 16.89, and 9.13 MPa, respectively. The findings indicate that the incorporation of gypsum led to a reduction in both the compressive strength and elastic modulus of rock-like materials. With the increase in gypsum proportion, the compressive strength of the rock-like specimens decreased, but the influence of the gypsum proportion on the elastic modulus of the specimens was small. The compressive strength of specimens C1, C2, C3, and C4 was 9.13, 11.32, 18.93, and 26.67 MPa, respectively, and the strength of the materials was significantly reduced compared with those without gypsum.
In summary, when using quartz sand and cement as production materials, the rock-like material exhibited relatively high strength, which was positively correlated with the proportion of cement. By increasing the cement content, this material could effectively simulate hard rock material. When gypsum was incorporated into the material, the strength of rock-like specimens exhibited a significant decline, displaying a negative correlation with the proportion of gypsum. The proportion of gypsum can be adjusted to replicate soft rock materials of low compressive strength.

3.3. Failure Characteristic

The final failure form and failure sketches of the rock-like specimens with different proportions are shown in Figure 7.
After conducting a comparison, it was observed that there existed a significant disparity in the failure morphology between the rock specimens devoid of gypsum and those containing gypsum. When the material did not contain gypsum, there was a decrease in the occurrence of cracks after rock sample failure, and penetrating cracks were generated at both ends of the specimen, extending from the end to the bottom. The whole failure of the specimen without gypsum showed the characteristics of splitting, and the specimen produced a huge crisp sound when it was broken, and then the specimen failed. When gypsum was added to the material, the strength of the specimen decreased, and a dull sound was produced when the specimen was destroyed. Due to the addition of gypsum in the production material, the specimen had certain plastic characteristics, and the failure of the specimen was relatively slow. Many secondary cracks were generated between the primary cracks, and the specimen was mainly characterized by shear failure.
The final failure form of the specimen revealed a significantly higher level of damage in the middle section compared to the end section, and this trend became increasingly prominent with the addition of gypsum. Moreover, multiple secondary cracks emerged within the middle part of the gypsum-added specimen. Because the specimens containing only cement-quartz sand had high density, there were fewer pores and cracks inside the specimen, a short failure time, and an insufficient development of cracks inside the specimen, so there were fewer secondary cracks when the specimen was damaged. When gypsum was added to the specimen, the compaction degree of the specimen decreased, there were more pores and cracks inside the specimen, and the failure time of the specimen increased under the same displacement loading rate. The pores and cracks in the specimen were fully developed, and the pores and cracks were interconnected to form through-cracks. Multiple secondary cracks were derived between the through-cracks, and the specimen was fully destroyed.

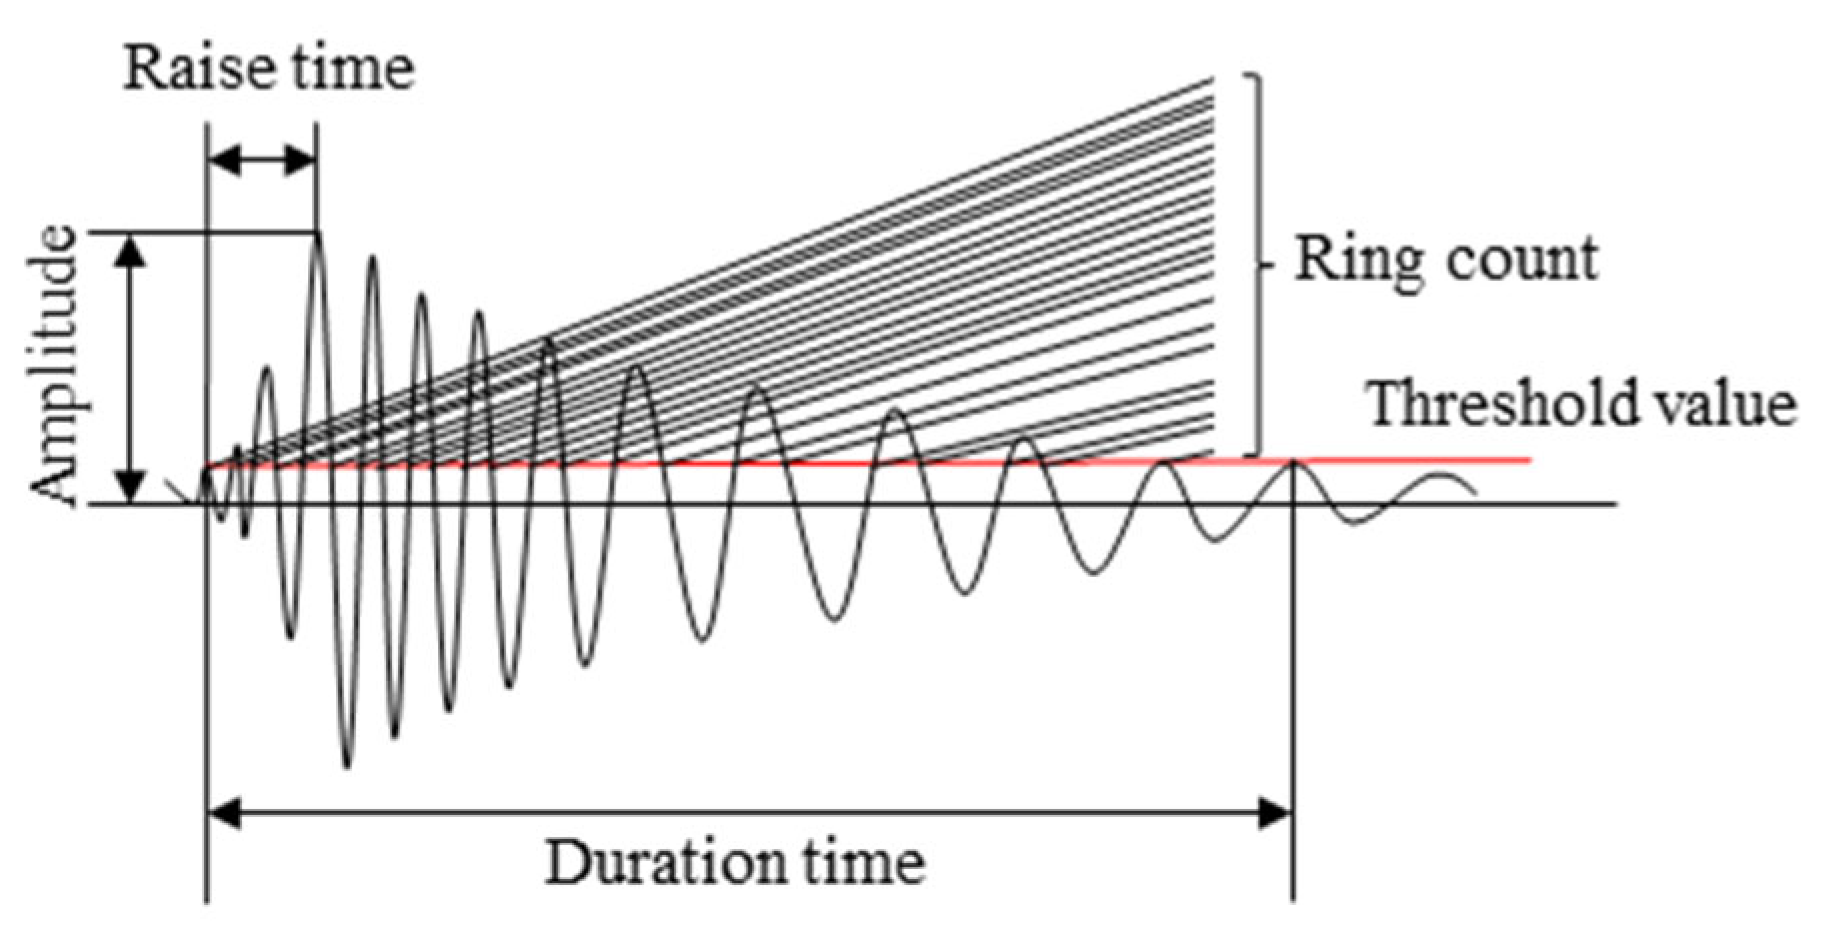
3.4. Acoustic Emission Analysis

During the compression process of rock-like materials, the change in the internal structure of the materials will release elastic waves of different frequencies and different energies, which is called rock-like acoustic emission [31]. By monitoring the acoustic emission parameters of rock-like specimens throughout the compression process, a clearer understanding can be gained regarding the initiation and propagation of cracks within these specimens, thereby enhancing comprehension of the entire rock failure mechanism [32,33,34]. The acoustic emission ringing count refers to the number of oscillations of the acoustic emission signal exceeding the threshold value signal, which can be divided into ringing count and cumulative ringing count. Acoustic emission ringing count can reflect the intensity and frequency of the signal, which is widely used in the evaluation of acoustic emission activity. The schematic diagram of the acoustic emission ringing count principle is shown in Figure 8.
The relationship curves of the acoustic emission ringing count, cumulative ringing count, stress, and time during the loading process of rock-like specimens with different proportions are depicted in Figure 9.
The analysis in Figure 9 revealed that the variation patterns of the acoustic emission ringing count and cumulative ringing count of rock-like specimens with different proportions exhibited certain similarities. In the initial compaction stage, the original pores and cracks in the specimen underwent compaction without any generation of new cracks. Consequently, a minimal number of acoustic emission events were observed during this stage, and no major acoustic emission events occurred. With the continuous increase in stress, the material entered the elastic stage, and new micro-cracks were generated inside the material. At this time, loud emission events occasionally occurred, and the frequency of acoustic emission events in this stage was higher than that in the initial compaction stage. As the loading continued, the rock-like specimen entered the damage stage, and an obvious acoustic emission phenomenon appeared in this stage. During this period, as stress continued to increase, the pores and cracks within the specimen gradually interconnected and merged, leading to frequent occurrences of acoustic emission events. When loaded near the stress peak of the material, a large energy event was generated, and the acoustic emission ringing count reached its maximum. The maximum value of the acoustic emission ringing count usually did not occur at the peak stress point of the specimen, and often lagged behind the peak stress point for a while. The specimen eventually entered the post-failure stage, wherein it retained a certain residual strength, maintained its bearing capacity, and still produced acoustic emission events.
Without the addition of gypsum, the rock-like specimens exhibited rapid failure, followed by a sharp decrease in stress after reaching the peak of the stress–strain curve, and there was a low occurrence rate of large acoustic emission events during the post-failure stage. The maximum acoustic emission ringing counts of specimens A1–A4 were 14,101, 15,672, 18,771, and 22,569 times, respectively. The maximum acoustic emission ringing counts of specimens C1–C4 were 7164, 8329, 9642, and 11,109 times, respectively. It was found that the maximum value of the acoustic emission ringing counts was positively correlated with the cement content in the specimen. The maximum acoustic emission ringing counts of specimens B1–B4 were 14,140, 12,072, 10,800, and 7164 times, respectively. It was shown that the maximum value of the acoustic emission ringing counts was negatively correlated with the gypsum content in specimens.
As depicted in Figure 9, the cumulative acoustic emission count changes roughly experienced four stages. In the first stage, the numerical growth of the cumulative acoustic emission count curve was slow, with no or minimal occurrence of acoustic emission events during this stage. During the second stage, the cumulative count of acoustic emission ringing gradually increased. During this time, the curve demonstrated a gentle slope with sporadic occurrences of several acoustic emission events. This stage corresponded to the elastic deformation stage of the stress–strain curve of the specimen. Due to the continuous action of the load, new cracks appeared inside the specimen, and acoustic emission events were detected at this stage. The cumulative count of acoustic emission in the third stage exhibited a state of rapid growth, with a significantly steeper slope compared to that observed in the second stage. This stage had a good corresponding relationship with the damage stage of the stress–strain curve of the specimen. At this stage, the pores and cracks inside the specimen were connected and interconnected, resulting in more acoustic emission events than in the second stage, and the curve rose faster. In the fourth stage, there was a sudden and significant increase in the cumulative ringing count of acoustic emissions, resulting in a curve that surged almost vertically. This stage signified the failure of the specimen, with the highest ringing count being generated during this phase. The four stages of cumulative acoustic emission ringing count exhibited a strong correspondence with the initial compaction stage, elastic stage, damage stage, and post-failure stage during typical rock uniaxial compression failure.
To better explain the acoustic emission ringing count characteristics of rock-like specimens in different deformation stages, the following Formula (1) gives the calculation formula of the cumulative ringing count change of acoustic emission.
ω = N A N
NA is the value of the cumulative ringing count of the acoustic emission up to a certain moment, and N is the value of the cumulative ringing count of the acoustic emission after the compression failure of rock-like specimens. According to the above Formula (1), the change of the cumulative ringing count of the acoustic emission in different stages of each specimen was calculated, as shown in Table 3.
An analysis of Table 3 shows that the large value of the acoustic emission ringing count was mostly concentrated in the fourth stage of the change of the acoustic emission cumulative ringing count curve, which contained abundant acoustic emission signals. An analysis of A1–A4 shows that when the cumulative ringing count of the acoustic emission of rock-like specimens without gypsum changed by more than 50%, the specimens entered the failure stage. Due to the hard and brittle characteristics of the specimen, the specimen was destroyed rapidly, and the acoustic emission events were less. The analysis of B1–B4 shows that the cumulative ringing count of the acoustic emission of rock-like specimens containing gypsum changed by more than 28%, and the specimens entered the failure stage. Gypsum increased the toughness of rock-like materials, the damage of specimens was slow, and the acoustic emission signal was more than that of specimens A1–A4. Through the analysis of C1–C4, it was found that with the increase in cement content in rock-like specimens, the change value of the acoustic emission cumulative ringing count of rock-like specimens gradually increased, indicating that cement increased the brittleness of the material and accelerated the failure of the rock-like materials.

4. Conclusions

In this study, 11 groups of rock-like specimens with different proportions were prepared by using cement, quartz sand, and gypsum as raw materials. The failure experiment and acoustic emission experiment of rock-like specimens under uniaxial compression were carried out. The following conclusions can be drawn:
(1)
The rock-like specimens made of quartz sand, cement, and gypsum can simulate the rock mass in actual engineering, and the mechanical properties and failure process of the two have high similarity.
(2)
When the material is made of quartz sand–cement, the strength of rock-like specimens is positively correlated with the proportion of cement, the brittleness of the material is obvious, and it can simulate hard rock materials. When gypsum is added, the strength of the rock-like material significantly decreases, exhibiting a strong negative correlation with the proportion of gypsum.
(3)
The rock-like specimens made of quartz sand and cement show splitting failure characteristics after uniaxial compression, and the surface cracks of the specimens are less. When gypsum is added to the rock-like specimen, shear failure is the main failure after uniaxial compression, and there are many secondary cracks between the primary cracks on the specimen surface.
(4)
The maximum value of the acoustic emission ringing count is positively correlated with cement content and negatively correlated with gypsum content. The change in acoustic emission cumulative counts roughly goes through four stages, which have a good correspondence with the initial compaction stage, elastic stage, damage stage, and post-failure stage of typical rock uniaxial compression failure.
Limited by the test cycle, only 11 groups of rock-like specimens with different ratios were studied in this study. In the future, the experimental scheme should be finely divided. Different binders have different effects on the physical and mechanical properties of rock-like materials. In this paper, only water was selected as the binder of materials. At the same time, the amount of water used in the experiment was fixed, and the influence of the amount of water on the physical and mechanical properties of rock-like materials was not studied in this paper. In the next study, the effects of the type and amount of binder on the physical and mechanical properties of rock-like specimens will be studied.

Author Contributions

Validation, S.D. and Q.S.; formal analysis, Q.S.; investigation, R.H.; resources, S.D.; data curation, Q.S. and Y.X.; writing—original draft preparation, Q.S.; writing—review and editing, Q.S. All authors have read and agreed to the published version of the manuscript.

Funding

This study was financially supported by the Key Project of National Natural Science Foundation of China (No. U183920051), the Innovative Talents of Colleges and Universities in Liaoning Province (No. LR2019031), and the Basic Project of Education Department of Liaoning Province (No. LJ2019JL006).

Institutional Review Board Statement

Not applicable.

Informed Consent Statement

Not applicable.

Data Availability Statement

The data used to support the findings of this study are available from the corresponding author upon request.

Acknowledgments

The authors thank the anonymous reviewers for their critical remarks and comments, which greatly helped to improve the manuscript.

Conflicts of Interest

The authors declare that they have no conflicts of interest regarding the publication of this paper.

References

  1. Ma, C.; Yuan, Y.; Zha, J.; Li, H.; Xu, Y. Determine method of effective experimental period of similar material model for improving the simulation results. Energy Sources Part A Recovery Util. Environ. Eff. 2020, 1–10. [Google Scholar] [CrossRef]
  2. Tatone, B.S.A.; Abdelaziz, A.; Grasselli, G. Example framework for evaluation of synthetic rock-like materials as applied to a commercial gypsum cement. Int. J. Rock. Mech. Min. Sci. 2023, 169, 105445. [Google Scholar] [CrossRef]
  3. Li, H.; Guo, G.; Zha, J. Study on time-varying characteristics of similar material model strength and the regulation measures. Environ. Earth. Sci. 2017, 76, 518. [Google Scholar] [CrossRef]
  4. Lee, G.; Ryu, H.; Cho, G.; Kwon, T. Full-scale TBM excavation tests for rock-like materials with different uniaxial compressive strength. Geomech. Eng. 2023, 35, 487–497. [Google Scholar] [CrossRef]
  5. Klammer, A.; Peintner, C.; Gottsbacher, L.; Biermann, J.; Blümel, M.; Schubert, W.; Marcher, T. Investigation of the Influence of Grain-Scale Heterogeneity on Strain burst Proneness Using Rock-Like Material. Rock Mech. Rock Eng. 2023, 56, 407–425. [Google Scholar] [CrossRef]
  6. Shi, J.; Chen, Z.; Zheng, B. Experimental Research on Material and Mechanical Properties of Rock-Like Filling Materials in Disaster Prevention of Underground Engineering. Adv. Mater. Sci. Eng. 2021, 2021, 6691310. [Google Scholar] [CrossRef]
  7. Wu, B.; Huang, W. Uniaxial compression mechanical properties of rock samples in soft and hard composite strata. Adv. Mater. Sci. Eng. 2020, 2020, 5920348. [Google Scholar] [CrossRef]
  8. Shi, Y.; Ye, Y.; Hu, N.; Huang, X.; Wang, X. Experiments on material proportions for similar materials with high similarity ratio and low strength in multilayer shale deposits. Appl. Sci. 2021, 11, 9620. [Google Scholar] [CrossRef]
  9. Zhao, W.; Gao, H.; Chen, W.; Liu, J.; Peng, W.; Zhou, S. Experimental study on similar materials for tunnel lining concrete in geomechanical model tests. Eng. Fail. Anal. 2023, 152, 107456. [Google Scholar] [CrossRef]
  10. Zhan, K.; Xue, J. Development and Properties of a Similar Material to Coal. Energies 2022, 15, 6922. [Google Scholar] [CrossRef]
  11. Gao, P.; Wang, M.; Lei, X.; Zong, Q. Dynamic mechanics and crystal structure fracture characteristics of rock-like materials in Coal Mines. Minerals 2022, 12, 290. [Google Scholar] [CrossRef]
  12. Haeri, H.; Khaloo, A.; Marji, M. Experimental and Numerical Simulation of the Microcrack Coalescence Mechanism in Rock-Like Materials. Strength Mater. 2015, 47, 740–754. [Google Scholar] [CrossRef]
  13. Sabri, M.; Ghazvinian, A.; Nejati, H. Effect of particle size heterogeneity on fracture toughness and failure mechanism of rocks. Int. J. Rock. Mech. Min. Sci. 2016, 81, 79–85. [Google Scholar] [CrossRef]
  14. Sharafisafa, M.; Shen, L.; Xu, Q. Characterisation of mechanical behaviour of 3D printed rock-like material with digital image correlation. Int. J. Rock. Mech. Min. Sci. 2018, 112, 122–138. [Google Scholar] [CrossRef]
  15. Feng, G.; Fan, Y.; Wang, P.; Guo, J.; Wen, X.; Qian, R.; Zhu, L. Analysis of damage and failure process of rock like specimens under uniaxial compression under different material combinations and ratios. Chin. J. Rock Mech. Eng. 2023, 42, 3377–3390. [Google Scholar] [CrossRef]
  16. Kang, Y.; Gu, J.; Wei, M. Mechanical properties and acoustic emission characteristics of soft-hard interbedded rocks under different loading rates. J. Northeast. Univ. 2023, 44, 399–407. [Google Scholar] [CrossRef]
  17. Yin, P.; Yang, S. Experimental study on strength and failure behavior of transversely isotropic rock-like material under uniaxial compression. Geomech. Geophys. Geo-Energy Geo-Resour. 2020, 6, 44. [Google Scholar] [CrossRef]
  18. Kong, Y.; Ruan, H.; Wang, Z. Selection and mechanical properties testy of similar brittle rock-like model materials of basalt. Chin. J. Geotech. Eng. 2023, 45, 2308–2318. [Google Scholar] [CrossRef]
  19. Zhu, C.; An, Y.; Li, D. Research on crack process of similar materials coal sample under uniaxial compression. J. Min. Res. Dev. 2022, 42, 144–148. [Google Scholar] [CrossRef]
  20. Lu, H.; Zhang, K.; Yi, J.; Chao, W. A study on the optimal selection of similar materials for the physical simulation experiment based on rock mineral components. Eng. Fail. Anal. 2022, 140, 106607. [Google Scholar] [CrossRef]
  21. Grosse, C.; Ohtsu, M. (Eds.) Acoustic Emission Testing; Springer: Berlin/Heidelberg, Germany, 2008. [Google Scholar] [CrossRef]
  22. Carpinteri, A.; Lacidogna, G.; Accornero, F.; Mpalaskas, A.C.; Matikas, T.E.; Aggelis, D.G. Influence of damage in the acoustic emission parameters. Cem. Concr. Compos. 2013, 44, 9–16. [Google Scholar] [CrossRef]
  23. Aggelis, D.G. Classification of cracking mode in concrete by acoustic emission parameters. Mech. Res. Commun. 2011, 38, 153–157. [Google Scholar] [CrossRef]
  24. D’Angela, D.; Ercolino, M. Acoustic emission entropy: An innovative approach for structural health monitoring of fracture-critical metallic components subjected to fatigue loading. Fatigue Fract. Eng. Mater. Struct. 2021, 44, 13412. [Google Scholar] [CrossRef]
  25. Wang, Z.; Yang, Y.; Xu, Y.; Xin, C.; Liang, P.; Guo, N. Analysis of Energy Evolution and Acoustic Emission Characteristics of Rocks under Cyclic Loading and Unloading. Appl. Sci. 2023, 13, 10453. [Google Scholar] [CrossRef]
  26. Chen, Y.; Wei, Z.; Zhang, Q. Experimental study on Felicity effect of acoustic emission in rock under cyclic loading and tiered cyclic loading. J. China Coal Soc. 2012, 37, 226–230. [Google Scholar]
  27. Li, D.; Wang, E.; Kong, X.; Jia, H.; Wang, D.; Muhammad, A. Damage precursor of construction rocks under uniaxial cyclic loading tests analyzed by acoustic emission. Constr. Build. Mater. 2019, 206, 169–178. [Google Scholar] [CrossRef]
  28. Ou, J.; Wang, E.; Wang, X.; Wang, B.; Zhu, G. Acoustic emission characteristics and damage evolution of different rocks under uniaxial compression conditions. Sci. Rep. 2024, 14, 4179. [Google Scholar] [CrossRef]
  29. Rao, M.V.M.S.; Prasanna Lakshmi, K.J. Analysis of b-value and improved b-value of acoustic emissions accompanying rock fracture. Curr. Sci. 2005, 89, 1577–1582. [Google Scholar] [CrossRef]
  30. Xing, T.; Zhu, H.; Song, Y. Experimental Study on Rock Deformation Localization Using Digital Image Correlation and Acoustic Emission. Appl. Sci. 2024, 14, 5355. [Google Scholar] [CrossRef]
  31. Chen, A.; Dai, S.; Zhang, Y.; Huang, S.; Ye, Z. Study on size effect of damage evolution of cemented back fill. Chin. J. Rock Mech. Eng. 2019, 38, 3053–3060. [Google Scholar] [CrossRef]
  32. Zuo, J.; Pei, J.; Liu, J.; Peng, R.; Li, Y. Investigation on acoustic emission behavior and its time-space evolution mechanism in failure process of coal-rock combined body. Chin. J. Rock Mech. Eng. 2011, 30, 1564–1570. [Google Scholar]
  33. Long, D.; Wang, Y.; Li, C.; Wu, Y.; Hu, Y. Energy Mechanism and Acoustic Emission Characteristics in Rock-Backfill Composite Structure Specimens under Multi-Level Cyclic Loads: Cement-Tailings Ratio Effect. Minerals 2024, 14, 665. [Google Scholar] [CrossRef]
  34. Pan, J.; Yuan, S.; Jiang, T.; Cui, C. Experimental study on crack characteristics and acoustic emission characteristics in rock-like material with pre-existing cracks. Sci. Rep. 2021, 11, 23790. [Google Scholar] [CrossRef] [PubMed]
Figure 1. Preparation specimens.
Applsci 14 08893 g001
Figure 2. Experimental system.
Applsci 14 08893 g002
Figure 3. The acoustic emission equipment. (a) DS5-16B acoustic emission signal analyzer. (b) Acoustic emission sensor.
Applsci 14 08893 g003
Figure 4. Position diagram of acoustic emission sensors.
Applsci 14 08893 g004
Figure 5. Stress–strain curves of samples with different proportions. (a) A1–A4 stress–strain curve. (b) B1–B4 stress–strain curve. (c) C1–C4 stress–strain curve.
Applsci 14 08893 g005
Figure 6. Uniaxial compressive strength of each specimen. (a) Rock-like specimen A. (b) Rock-like specimen B. (c) Rock-like specimen C.
Applsci 14 08893 g006
Figure 7. The final failure form and failure sketch of the specimen.
Applsci 14 08893 g007
Figure 8. Schematic diagram of the acoustic emission ringing count principle.
Applsci 14 08893 g008
Figure 9. Acoustic emission ringing count, cumulative ringing count, stress, and time curve. A1–C4 are the numbers of rock-like specimens. I–IV is the four stages of changing the cumulative ringing count curve of acoustic emission.
Applsci 14 08893 g009aApplsci 14 08893 g009b
Table 1. Specimen number, proportioning scheme, and physical parameters.
Specimen NumberMaterial Mass ProportionSpecimen MassSpecimen Density
Quartz SandCementGypsumgg/cm3
A110.804122.10
A211.204162.12
A311.604202.14
A412.004262.17
B110.80.14022.05
B210.80.23962.02
B310.80.33831.95
B4(C1)10.80.43381.72
C211.20.43421.74
C311.60.43551.81
C412.00.43761.92
Table 2. Mechanical parameters of each sample under different proportions.
MaterialsSpecimen NumberMass ProportionsCompressive Strength
σ c / MPa
Elastic Modulus
E / G Pa
Quartz sand,
cement
A11:0.827.742.67
A21:1.232.133.03
A31:1.641.843.22
A41:2.048.675.79
Quartz sand, cement,
gypsum
B11:0.8:0.125.583.47
B21:0.8:0.220.552.12
B31:0.8:0.316.892.10
B4/C11:0.8:0.49.132.14
C21:1.2:0.411.321.97
C31:1.6:0.418.932.36
C41:2.0:0.426.673.32
Table 3. The change of cumulative ringing count in each stage.
Specimen NumberMass ProportionsThe Change of Cumulative Ringing Count in Each Stage
IIIIIIIV
A11:0.80–7.5%7.5–28.3%28.3–55.4%55.4–100%
A21:1.20–4.8%4.8–23.3%23.3–64.8%64.8–100%
A31:1.60–5.8%5.8–24.6%24.6–63.3%63.3–100%
A41:2.00–4.9%4.9–22.2%22.2–50.5%50.5–100%
B11:0.8:0.10–10.1%10.1–35.4%35.4–67.9%67.9–100%
B21:0.8:0.20–9.7%9.7–33.1%33.1–56%56–100%
B31:0.8:0.30–3.6%3.6–8.6%8.6–28.8%28.8–100%
B4/C11:0.8:0.40–4.8%4.8–19.2%19.2–31.6%31.6–100%
C21:1.2:0.40–6.3%6.3–30.4%30.4–43.3%43.3–100%
C31:1.6:0.40–5.5%5.5–22.1%22.1–61.8%61.8–100%
C41:2.0:0.40–10.6%10.6–35.8%35.8–62.3%62.3–100%
Disclaimer/Publisher’s Note: The statements, opinions and data contained in all publications are solely those of the individual author(s) and contributor(s) and not of MDPI and/or the editor(s). MDPI and/or the editor(s) disclaim responsibility for any injury to people or property resulting from any ideas, methods, instructions or products referred to in the content.

