
Efficiency and Interference Verification of a HONO Collection System Using an Ultrasonic Nozzle Coupled with a Recirculating Spray Chamber for Ambient Air Monitoring

 , , , and
Abstract
:1. Introduction

| Category | Technique | Reference | |
|---|---|---|---|
| Spectroscopic analytical methods | TLAS | [14] | |
| MAX-DOAS 1 | [15] | ||
| IBBCEAS 2 | [21] | ||
| CRDS 3 | [22] | ||
| LIF 4 | [23] | ||
| TD-CL 5 | [24] | ||
| CIMS 6 | [25] | ||
| sampler | detector | ||
| Wet chemical analytical methods | mist-chamber | ion chromatograph | [26] |
| stripping coil | long path absorption photometer | [10,12,27] | |
| stripping coil | ion chromatograph | [26] | |
| MARGA | ion chromatograph | [28] | |
| annular denuder system | ion chromatograph | [29] | |
2. Methods
2.1. Sampling Site
2.2. Analytical Method for PM2.5 and Gaseous Compounds
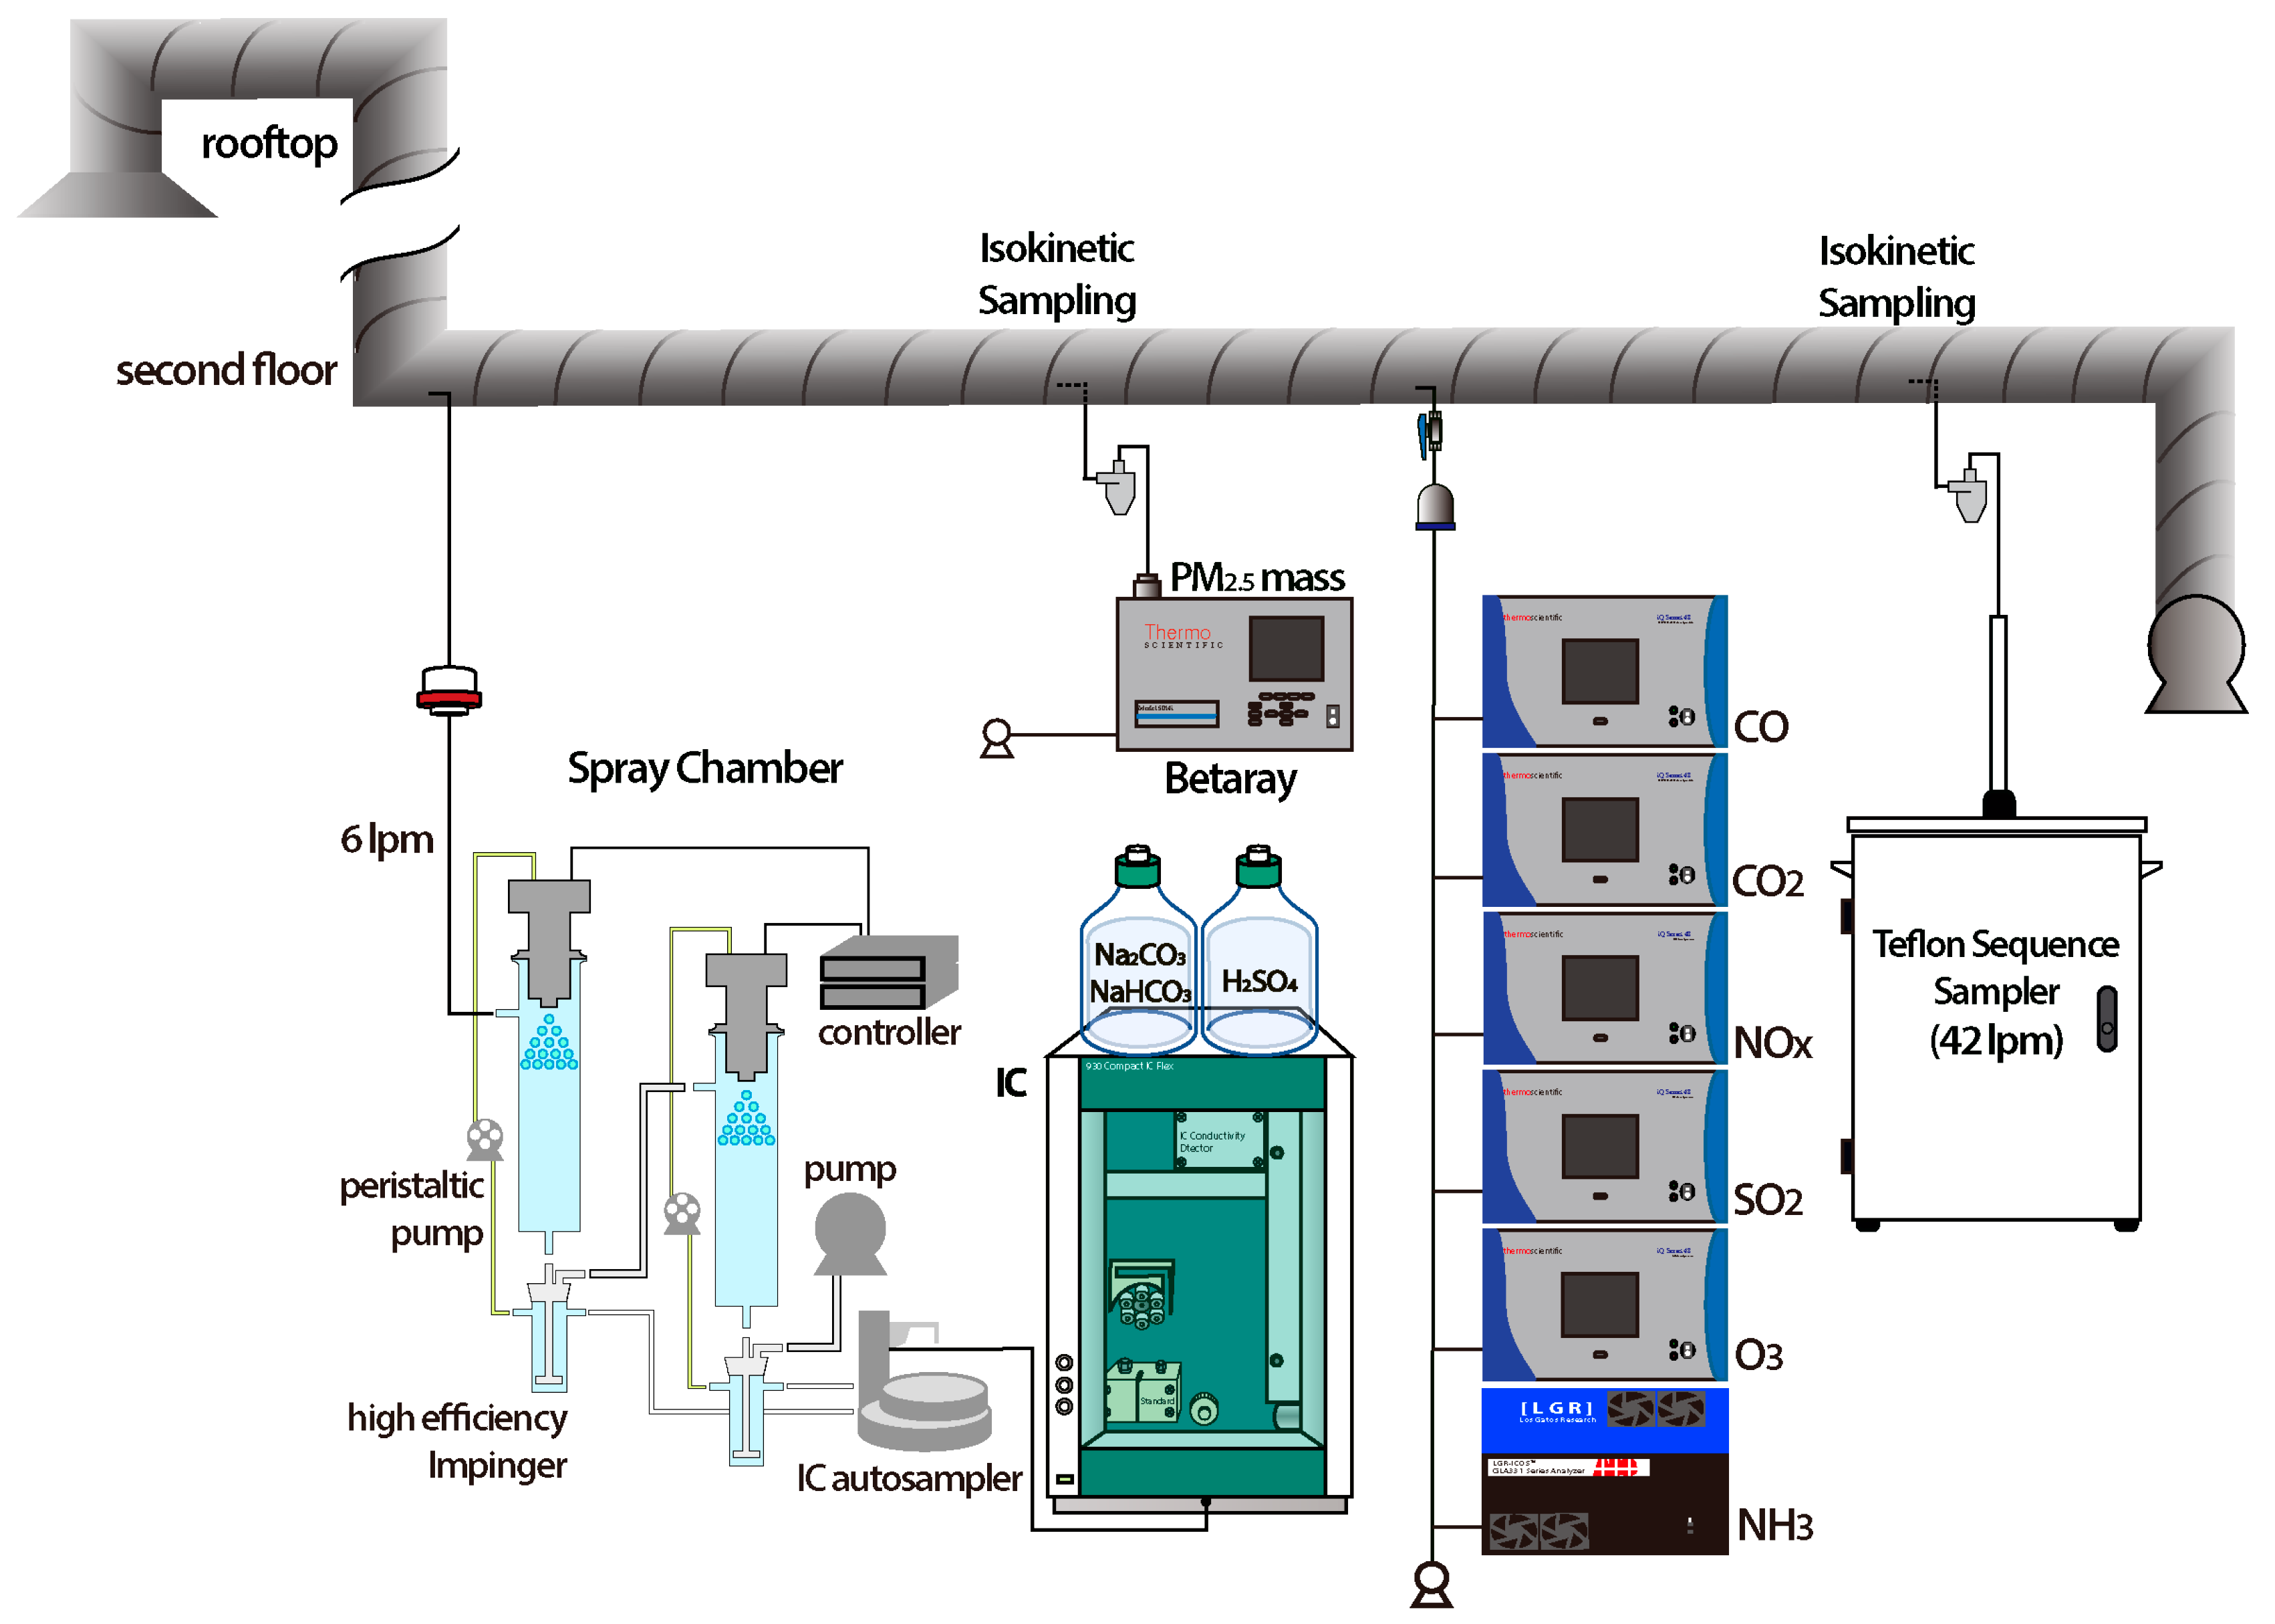
2.3. Configuration and Analytical Methods for HONO Collection Using Ultrasonic Nozzle Coupled with Spray Chamber and Ion Chromatography
3. Results
3.1. Efficiency and Interference Verification of a HONO Collection System
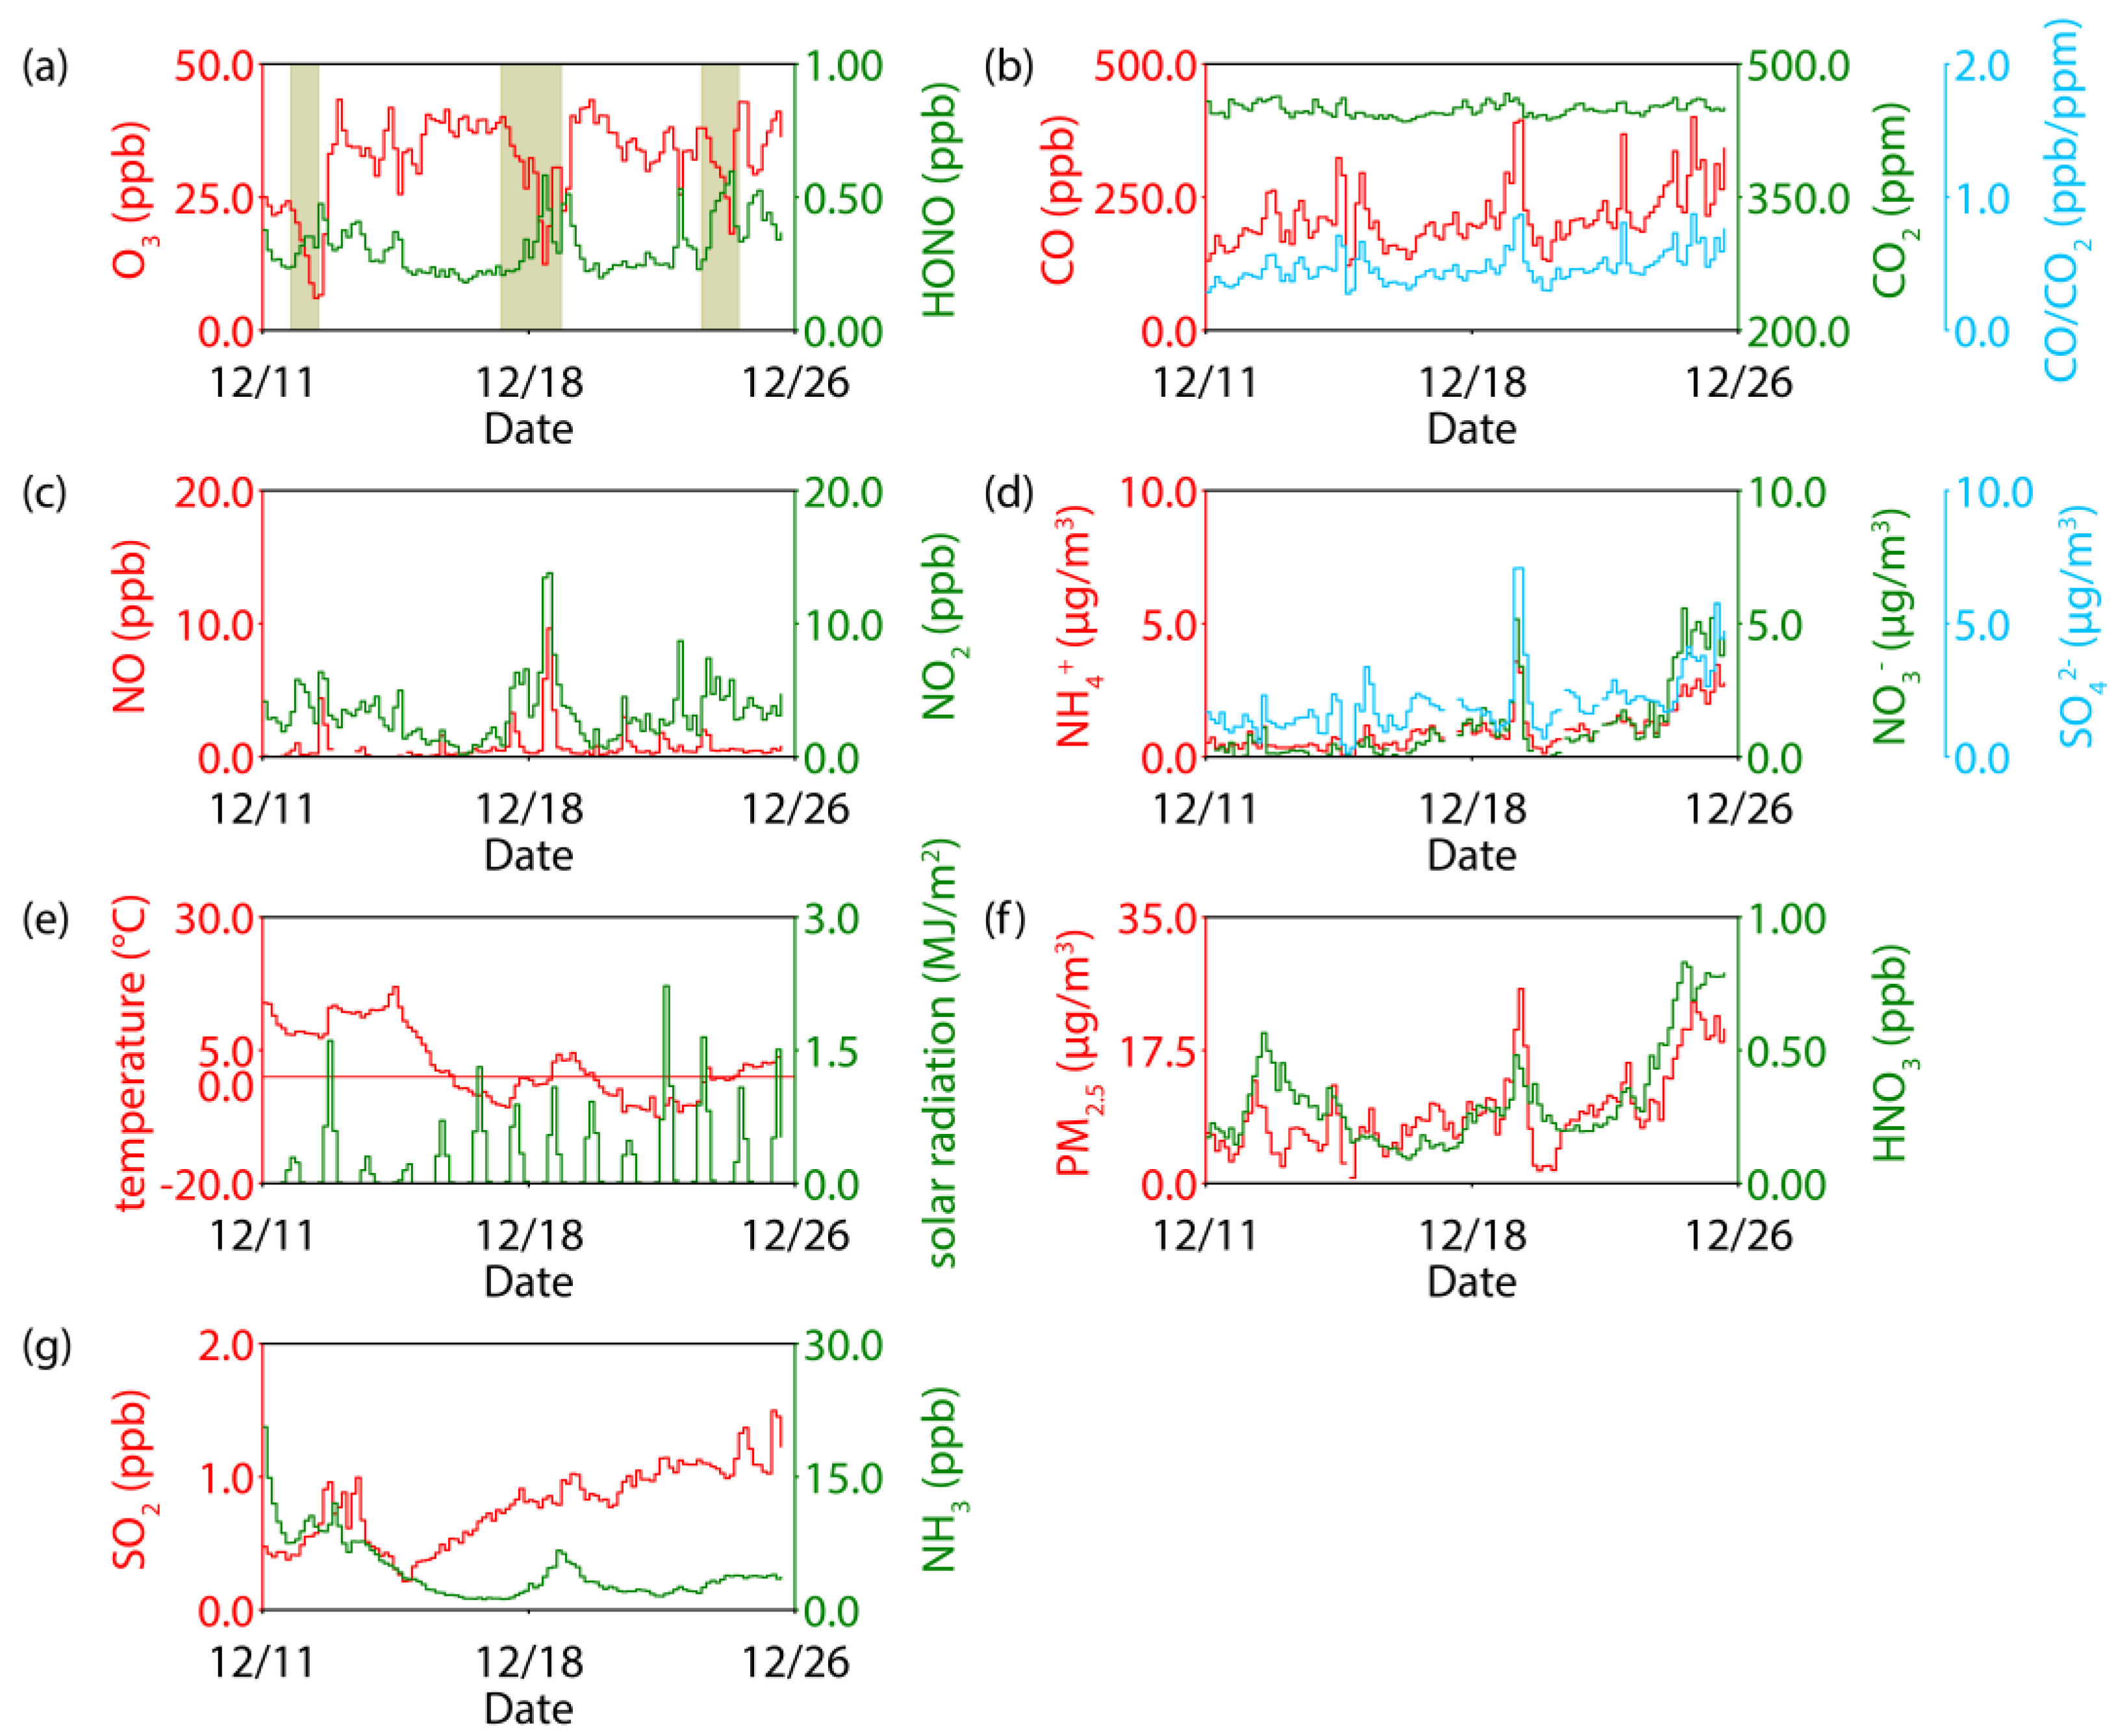
3.2. Ambient Air Measurement with a HONO Collection System
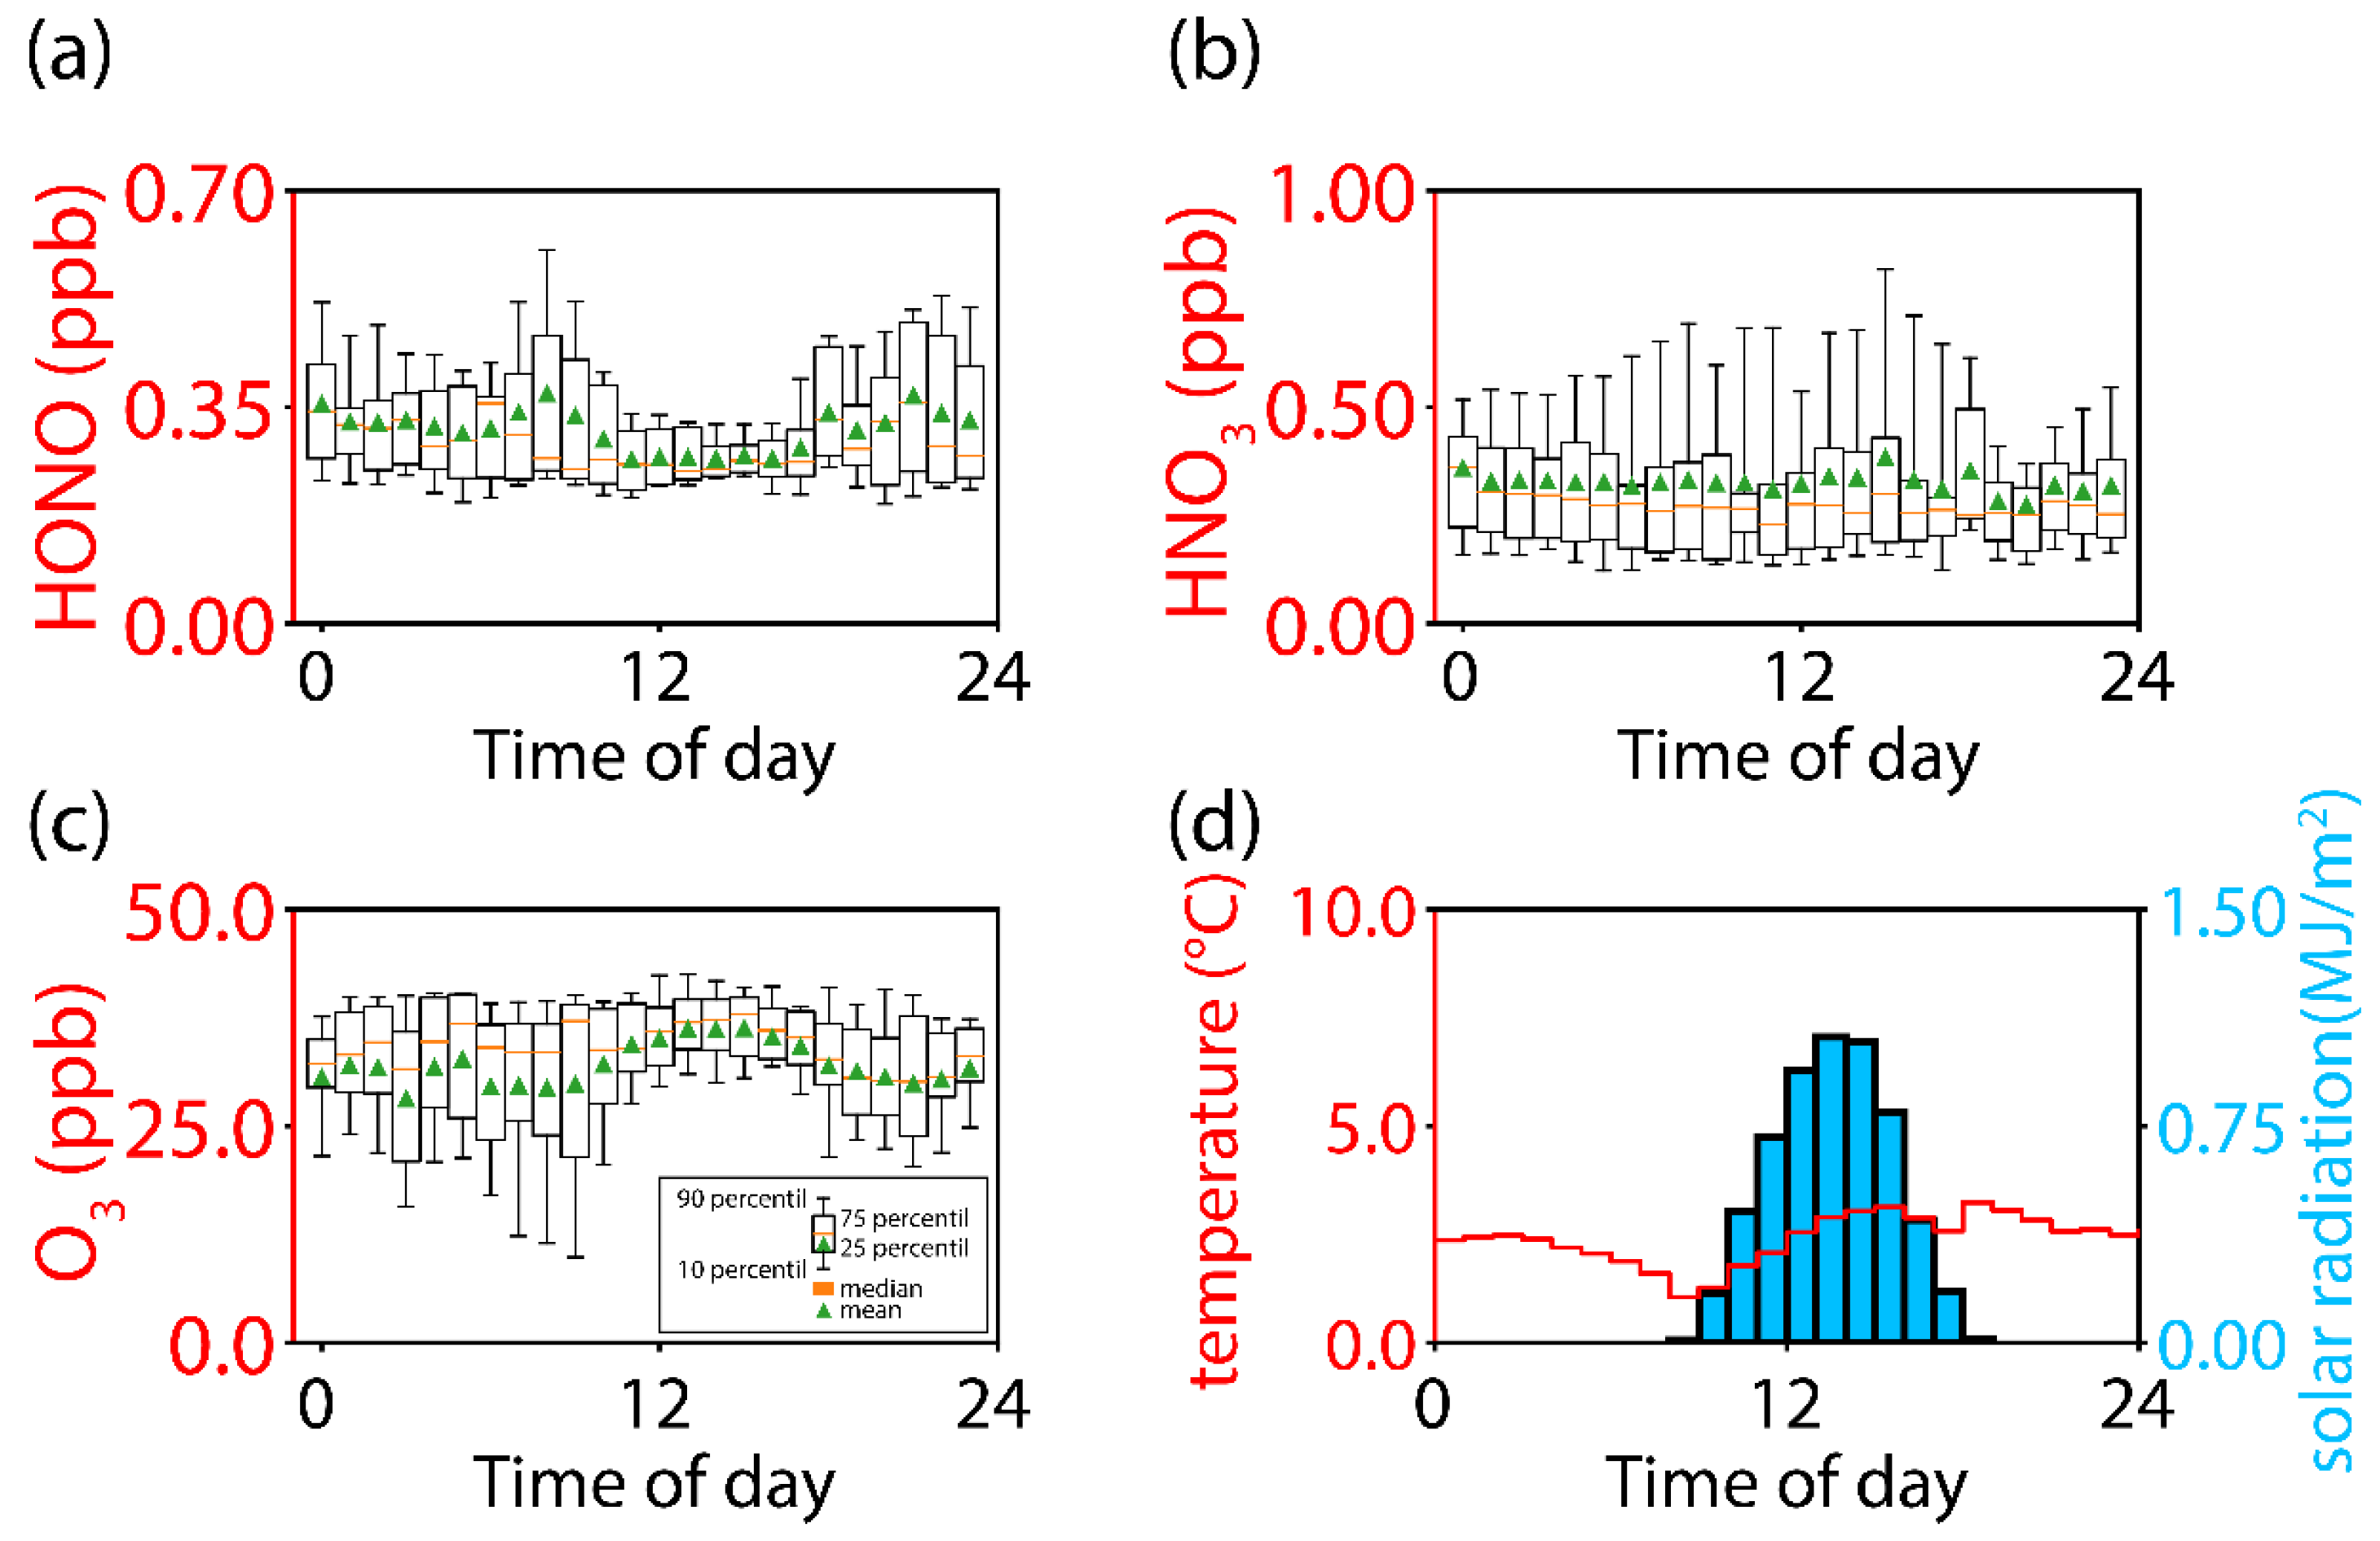
3.3. Diurnal Variation and Validation of a HONO Collection System for Ambient Air Measurement
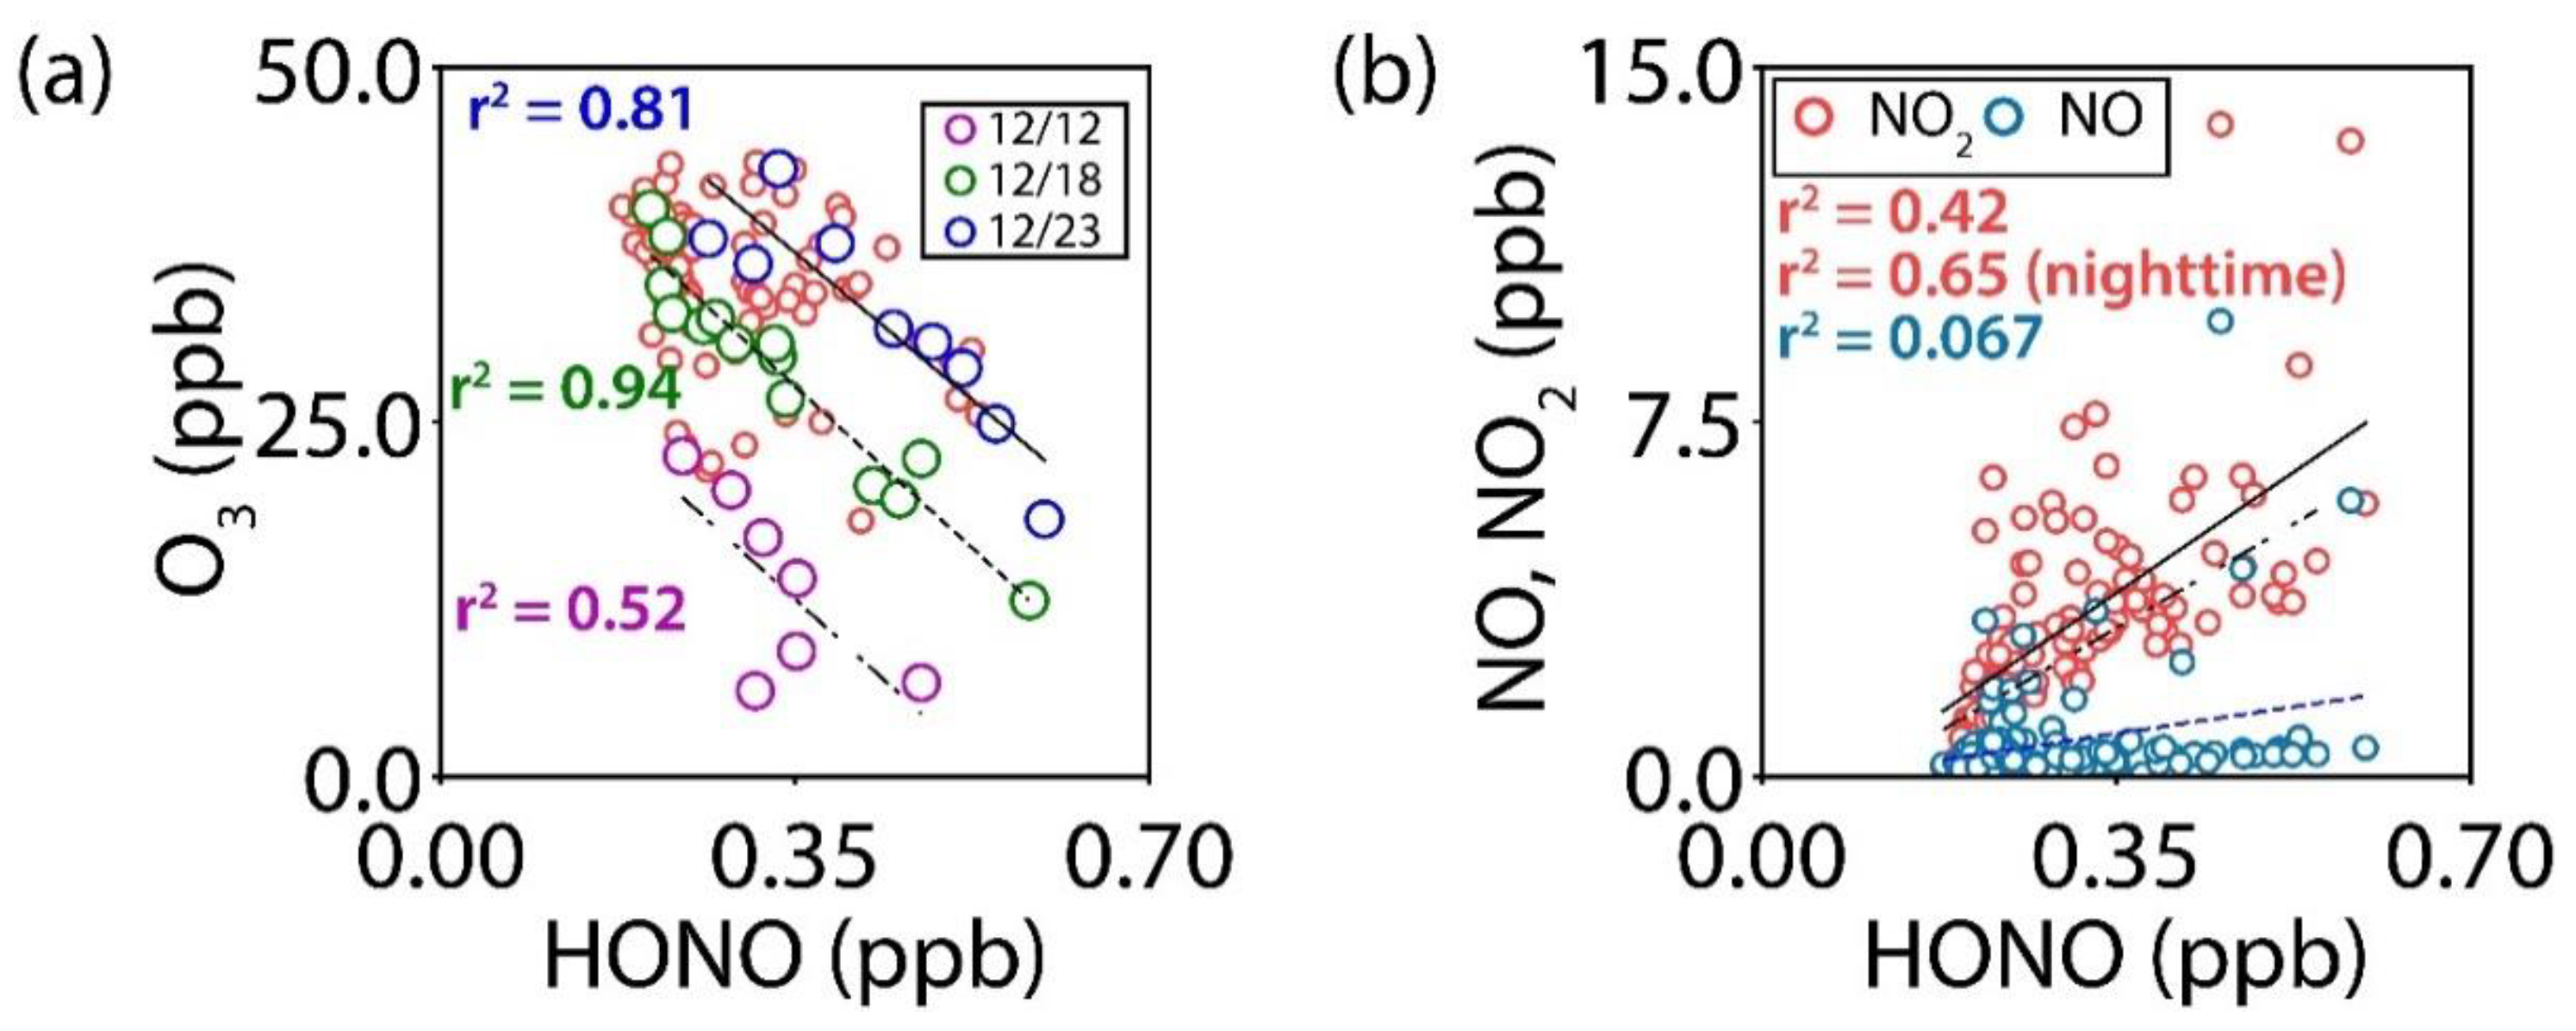
3.4. Inverse Relationship between Ozone and HONO
4. Discussion
Author Contributions
Funding
Institutional Review Board Statement
Informed Consent Statement
Data Availability Statement
Conflicts of Interest
References
- Ge, S.; Wang, G.; Zhang, S.; Li, D.; Xie, Y.; Wu, C.; Yuan, Q.; Chen, J.; Zhang, H. Abundant NH3 in China Enhances Atmospheric HONO Production by Promoting the Heterogeneous Reaction of SO2 with NO2. Environ. Sci. Technol. 2019, 53, 14339–14347. [Google Scholar] [CrossRef] [PubMed]
- Zhang, W.; Tong, S.; Ge, M.; An, J.; Shi, Z.; Hou, S.; Xia, K.; Qu, Y.; Zhang, H.; Chu, B.; et al. Variations and Sources of Nitrous Acid (HONO) during a Severe Pollution Episode in Beijing in Winter 2016. Sci. Total Environ. 2019, 648, 253–262. [Google Scholar] [CrossRef]
- Xing, C.; Liu, C.; Hu, Q.; Fu, Q.; Wang, S.; Lin, H.; Zhu, Y.; Wang, S.; Wang, W.; Javed, Z.; et al. Vertical Distributions of Wintertime Atmospheric Nitrogenous Compounds and the Corresponding OH Radicals Production in Leshan, Southwest China. J. Environ. Sci. 2021, 105, 44–55. [Google Scholar] [CrossRef]
- Hendrick, F.; Müller, J.-F.; Clémer, K.; Wang, P.; De Mazière, M.; Fayt, C.; Gielen, C.; Hermans, C.; Ma, J.Z.; Pinardi, G.; et al. Four Years of Ground-Based MAX-DOAS Observations of HONO and NO₂ in the Beijing Area. Atmos. Chem. Phys. 2014, 14, 765–781. [Google Scholar] [CrossRef]
- Kim, D.; Kim, J.; Lee, M.; Ahn, J.Y.; Lee, G. Assessment of Daytime HONO Emission Source from Asphalt Surface to Urban Air. Appl. Sci. 2021, 11, 1930. [Google Scholar] [CrossRef]
- Liu, Y.; Lu, K.; Ma, Y.; Yang, X.; Zhang, W.; Wu, Y.; Peng, J.; Shuai, S.; Hu, M.; Zhang, Y. Direct Emission of Nitrous Acid (HONO) from Gasoline Cars in China Determined by Vehicle Chassis Dynamometer Experiments. Atmos. Environ. 2017, 169, 89–96. [Google Scholar] [CrossRef]
- Su, H.; Cheng, Y.; Oswald, R.; Behrendt, T.; Trebs, I.; Meixner, F.X.; Andreae, M.O.; Cheng, P.; Zhang, Y.; Poschl, U. Soil Nitrite as a Source of Atmospheric HONO and OH Radicals. Science 2011, 333, 1616–1618. [Google Scholar] [CrossRef] [PubMed]
- Wu, D.; Horn, M.A.; Behrendt, T.; Müller, S.; Li, J.; Cole, J.A.; Xie, B.; Ju, X.; Li, G.; Ermel, M.; et al. Soil HONO Emissions at High Moisture Content Are Driven by Microbial Nitrate Reduction to Nitrite: Tackling the HONO Puzzle. ISME J. 2019, 13, 1688–1699. [Google Scholar] [CrossRef]
- Chai, J.; Hastings, M.G. Collection Method for Isotopic Analysis of Gaseous Nitrous Acid. Anal. Chem. 2018, 90, 830–838. [Google Scholar] [CrossRef]
- Heland, J.; Kleffmann, J.; Kurtenbach, R.; Wiesen, P. A New Instrument To Measure Gaseous Nitrous Acid (HONO) in the Atmosphere. Environ. Sci. Technol. 2001, 35, 3207–3212. [Google Scholar] [CrossRef]
- Kim, N.K.; Kim, Y.P.; Ghim, Y.S.; Song, M.J.; Kim, C.H.; Jang, K.S.; Lee, K.Y.; Shin, H.J.; Jung, J.S.; Wu, Z.; et al. Spatial Distribution of PM2.5 Chemical Components during Winter at Five Sites in Northeast Asia: High Temporal Resolution Measurement Study. Atmos. Environ. 2022, 290, 119359. [Google Scholar] [CrossRef]
- Kleffmann, J.; Lörzer, J.C.; Wiesen, P.; Kern, C.; Trick, S.; Volkamer, R.; Rodenas, M.; Wirtz, K. Intercomparison of the DOAS and LOPAP Techniques for the Detection of Nitrous Acid (HONO). Atmos. Environ. 2006, 40, 3640–3652. [Google Scholar] [CrossRef]
- Xue, C.; Ye, C.; Ma, Z.; Liu, P.; Zhang, Y.; Zhang, C.; Tang, K.; Zhang, W.; Zhao, X.; Wang, Y.; et al. Development of Stripping Coil-Ion Chromatograph Method and Intercomparison with CEAS and LOPAP to Measure Atmospheric HONO. Sci. Total Environ. 2019, 646, 187–195. [Google Scholar] [CrossRef] [PubMed]
- Cui, X.; Li, Y.; Jiang, C.; Cui, X.; Xie, J.; Yu, B. Line Positions and Effective Line Strengths of Trans-HONO near 1280 cm−1. Spectrochim. Acta. A 2023, 302, 123044. [Google Scholar] [CrossRef] [PubMed]
- Xing, C.; Liu, C.; Li, Q.; Wang, S.; Tan, W.; Zou, T.; Wang, Z.; Lu, C. Observations of HONO and Its Precursors between Urban and Its Surrounding Agricultural Fields: The Vertical Transports, Sources and Contribution to OH. Sci. Total Environ. 2024, 915, 169159. [Google Scholar] [CrossRef] [PubMed]
- Song, C.H.; Park, M.E.; Lee, E.J.; Lee, J.H.; Lee, B.K.; Lee, D.S.; Kim, J.; Han, J.S.; Moon, K.J.; Kondo, Y. Possible Particulate Nitrite Formation and Its Atmospheric Implications Inferred from the Observations in Seoul, Korea. Atmos. Environ. 2009, 43, 2168–2173. [Google Scholar] [CrossRef]
- Gil, J.; Kim, J.; Lee, M.; Lee, G.; Ahn, J.; Lee, D.S.; Jung, J.; Cho, S.; Whitehill, A.; Szykman, J.; et al. Characteristics of HONO and Its Impact on O3 Formation in the Seoul Metropolitan Area during the Korea-US Air Quality Study. Atmos. Environ. 2021, 247, 118182. [Google Scholar] [CrossRef]
- Dalmoro, A.; Barba, A.A.; Lamberti, G.; d’Amore, M. Intensifying the Microencapsulation Process: Ultrasonic Atomization as an Innovative Approach. Eur. J. Pharm. Biopharm. 2012, 80, 471–477. [Google Scholar] [CrossRef]
- Bose, S.; Keller, S.S.; Alstrøm, T.S.; Boisen, A.; Almdal, K. Process Optimization of Ultrasonic Spray Coating of Polymer Films. Langmuir 2013, 29, 6911–6919. [Google Scholar] [CrossRef]
- Tatar Turan, F.; Cengiz, A.; Kahyaoglu, T. Evaluation of Ultrasonic Nozzle with Spray-Drying as a Novel Method for the Microencapsulation of Blueberry’s Bioactive Compounds. Innov. Food Sci. Emerg. 2015, 32, 136–145. [Google Scholar] [CrossRef]
- Tang, K.; Qin, M.; Fang, W.; Duan, J.; Meng, F.; Ye, K.; Zhang, H.; Xie, P.; He, Y.; Xu, W.; et al. Simultaneous Detection of Atmospheric HONO and NO2 Utilising an IBBCEAS System Based on an Iterative Algorithm. Atmos. Meas. Tech. 2020, 13, 6487–6499. [Google Scholar] [CrossRef]
- Wang, L.; Zhang, J. Detection of Nitrous Acid by Cavity Ring-Down Spectroscopy. Environ. Sci. Technol. 2000, 34, 4221–4227. [Google Scholar] [CrossRef]
- Liao, W.; Case, A.T.; Mastromarino, J.; Tan, D.; Dibb, J.E. Observations of HONO by Laser-Induced Fluorescence at the South Pole during ANTCI 2003. Geophys. Res. Lett. 2006, 33. [Google Scholar] [CrossRef]
- Pérez, I.M.; Wooldridge, P.J.; Cohen, R.C. Laboratory Evaluation of a Novel Thermal Dissociation Chemiluminescence Method for in Situ Detection of Nitrous Acid. Atmos. Environ. 2007, 41, 3993–4001. [Google Scholar] [CrossRef]
- Bourgeois, I.; Peischl, J.; Neuman, J.A.; Brown, S.S.; Allen, H.M.; Campuzano-Jost, P.; Coggon, M.M.; DiGangi, J.P.; Diskin, G.S.; Gilman, J.B.; et al. Comparison of Airborne Measurements of NO, NO₂, HONO, NOy, and CO during FIREX-AQ. Atmos. Meas. Tech. 2022, 15, 4901–4930. [Google Scholar] [CrossRef]
- Cheng, P.; Cheng, Y.; Lu, K.; Su, H.; Yang, Q.; Zou, Y.; Zhao, Y.; Dong, H.; Zeng, L.; Zhang, Y. An Online Monitoring System for Atmospheric Nitrous Acid (HONO) Based on Stripping Coil and Ion Chromatography. J. Environ. Sci. 2013, 25, 895–907. [Google Scholar] [CrossRef]
- Kleffmann, J.; Wiesen, P. Technical Note: Quantification of Interferences of Wet Chemical HONO LOPAP Measurements under Simulated Polar Conditions. Atmos. Chem. Phys. 2008, 8, 6813–6822. [Google Scholar] [CrossRef]
- Ren, Y.; Stieger, B.; Spindler, G.; Grosselin, B.; Mellouki, A.; Tuch, T.; Wiedensohler, A.; Herrmann, H. Role of the Dew Water on the Ground Surface in HONO Distribution: A Case Measurement in Melpitz. Atmos. Chem. Phys. 2020, 20, 13069–13089. [Google Scholar] [CrossRef]
- Bari, A.; Ferraro, V.; Wilson, L.R.; Luttinger, D.; Husain, L. Measurements of Gaseous HONO, HNO3, SO2, HCl, NH3, Particulate Sulfate and PM2.5 in New York, NY. Atmos. Environ. 2003, 37, 2825–2835. [Google Scholar] [CrossRef]
- Oh, S.-H.; Song, M.; Schauer, J.J.; Shon, Z.-H.; Bae, M.-S. Assessment of Long-Range Oriented Source and Oxidative Potential on the South-West Shoreline, Korea: Molecular Marker Receptor Models during Shipborne Measurements. Environ. Pollut. 2021, 281, 116979. [Google Scholar] [CrossRef]
- Oh, S.-H.; Park, K.; Park, M.; Song, M.; Jang, K.-S.; Schauer, J.J.; Bae, G.-N.; Bae, M.-S. Comparison of the Sources and Oxidative Potential of PM2.5 during Winter Time in Large Cities in China and South Korea. Sci. Total Environ. 2023, 859, 160369. [Google Scholar] [CrossRef] [PubMed]
- Oh, S.-H.; Choe, S.; Song, M.; Yu, G.-H.; Schauer, J.J.; Shin, S.-A.; Bae, M.-S. Effects of Long-Range Transport on Carboxylic Acids, Chlorinated VOCs, and Oxidative Potential in Air Pollution Events. Environ. Pollut. 2024, 347, 123666. [Google Scholar] [CrossRef] [PubMed]
- Song, M.; Choi, J.; Oh, S.-H.; Choe, S.; Yu, G.-H.; Cho, S.-S.; Park, J.; Bae, M.-S. Diurnal Dithiothreitol Assays for Biomass Burning Source in PM1.0 and PM2.5 during Summer and Winter. Atmos. Environ. 2023, 313, 120033. [Google Scholar] [CrossRef]
- Song, M.; Kim, M.; Oh, S.-H.; Yu, G.-H.; Choe, S.; Jeon, H.; Ko, D.-H.; Park, C.; Bae, M.-S. Characteristics of Atmospheric Pollutants in Paddy and Dry Field Regions: Analyzing the Oxidative Potential of Biomass Burning. Atmosphere 2024, 15, 493. [Google Scholar] [CrossRef]
- Yu, G.-H.; Song, M.; Oh, S.-H.; Choe, S.; Jeon, H.; Ko, D.-H.; Bae, M.-S. Wintertime Diurnal Variation in Absorption Coefficient of Brown Carbon Associated with the Molecular Marker of Levoglucosan. Appl. Sci. 2024, 14, 4117. [Google Scholar] [CrossRef]
- Nodeh-Farahani, D.; Bentley, J.N.; Crilley, L.R.; Caputo, C.B.; VandenBoer, T.C. A Boron Dipyrromethene (BODIPY) Based Probe for Selective Passive Sampling of Atmospheric Nitrous Acid (HONO) Indoors. Analyst 2021, 146, 5756–5766. [Google Scholar] [CrossRef]
- Ziemba, L.D.; Dibb, J.E.; Griffin, R.J.; Anderson, C.H.; Whitlow, S.I.; Lefer, B.L.; Rappenglück, B.; Flynn, J. Heterogeneous Conversion of Nitric Acid to Nitrous Acid on the Surface of Primary Organic Aerosol in an Urban Atmosphere. Atmos. Environ. 2010, 44, 4081–4089. [Google Scholar] [CrossRef]
- Zhou, X.; Qiao, H.; Deng, G.; Civerolo, K. A Method for the Measurement of Atmospheric HONO Based on DNPH Derivatization and HPLC Analysis. Environ. Sci. Technol. 1999, 33, 3672–3679. [Google Scholar] [CrossRef]
- Wu, D.; Kampf, C.J.; Pöschl, U.; Oswald, R.; Cui, J.; Ermel, M.; Hu, C.; Trebs, I.; Sörgel, M. Novel Tracer Method To Measure Isotopic Labeled Gas-Phase Nitrous Acid (HO15NO) in Biogeochemical Studies. Environ. Sci. Technol. 2014, 48, 8021–8027. [Google Scholar] [CrossRef]
- Stutz, J.; Oh, H.-J.; Whitlow, S.I.; Anderson, C.; Dibb, J.E.; Flynn, J.H.; Rappenglück, B.; Lefer, B. Simultaneous DOAS and Mist-Chamber IC Measurements of HONO in Houston, TX. Atmos. Environ. 2010, 44, 4090–4098. [Google Scholar] [CrossRef]
- Wong, K.W.; Oh, H.-J.; Lefer, B.L.; Rappenglück, B.; Stutz, J. Vertical Profiles of Nitrous Acid in the Nocturnal Urban Atmosphere of Houston, TX. Atmos. Chem. Phys. 2011, 11, 3595–3609. [Google Scholar] [CrossRef]
- Li, D.; Xue, L.; Wen, L.; Wang, X.; Chen, T.; Mellouki, A.; Chen, J.; Wang, W. Characteristics and Sources of Nitrous Acid in an Urban Atmosphere of Northern China: Results from 1-Yr Continuous Observations. Atmos. Environ. 2018, 182, 296–306. [Google Scholar] [CrossRef]
- Lee, J.K.; Han, H.S.; Chaikasetsin, S.; Marron, D.P.; Waymouth, R.M.; Prinz, F.B.; Zare, R.N. Condensing Water Vapor to Droplets Generates Hydrogen Peroxide. Proc. Natl. Acad. Sci. USA 2020, 117, 30934–30941. [Google Scholar] [CrossRef] [PubMed]
- Lee, J.K.; Walker, K.L.; Han, H.S.; Kang, J.; Prinz, F.B.; Waymouth, R.M.; Nam, H.G.; Zare, R.N. Spontaneous Generation of Hydrogen Peroxide from Aqueous Microdroplets. Proc. Natl. Acad. Sci. USA 2019, 116, 19294–19298. [Google Scholar] [CrossRef] [PubMed]
- Jeong, J.I.; Park, R.J.; Song, C.-K.; Yeh, S.-W.; Woo, J.-H. Quantitative Analysis of Winter PM2.5 Reduction in South Korea, 2019/20 to 2021/22: Contributions of Meteorology and Emissions. Sci. Total Environ. 2024, 907, 168179. [Google Scholar] [CrossRef]
- Crawford, J.H.; Ahn, J.-Y.; Al-Saadi, J.; Chang, L.; Emmons, L.K.; Kim, J.; Lee, G.; Park, J.-H.; Park, R.J.; Woo, J.H.; et al. The Korea–United States Air Quality (KORUS-AQ) Field Study. Elem. Sci. Anth. 2021, 9, 00163. [Google Scholar] [CrossRef]
- Halliday, H.S.; DiGangi, J.P.; Choi, Y.; Diskin, G.S.; Pusede, S.E.; Rana, M.; Nowak, J.B.; Knote, C.; Ren, X.; He, H.; et al. Using Short-Term CO/CO2 Ratios to Assess Air Mass Differences over the Korean Peninsula During KORUS-AQ. J. Geophys. Res. Atmos. 2019, 124, 10951–10972. [Google Scholar] [CrossRef]
- Tang, W.; Arellano, A.F.; DiGangi, J.P.; Choi, Y.; Diskin, G.S.; Agustí-Panareda, A.; Parrington, M.; Massart, S.; Gaubert, B.; Lee, Y.; et al. Evaluating High-Resolution Forecasts of Atmospheric CO and CO2 from a Global Prediction System during KORUS-AQ Field Campaign. Atmos. Chem. Phys. 2018, 18, 11007–11030. [Google Scholar] [CrossRef]
- Kim, M.; Song, M.; Oh, S.-H.; Yu, G.-H.; Choe, S.; Jeon, H.; Kim, J.-H.; Bae, M.-S. Impact of Precursor Compounds Associated with Long-Range Transport in the East Asia Region—Variation in CO/CO2 and VOCs. Appl. Sci. 2023, 13, 10783. [Google Scholar] [CrossRef]
- Yao, X.; Zhang, L. Trends in Atmospheric Ammonia at Urban, Rural, and Remote Sites across North America. Atmos. Chem. Phys. 2016, 16, 11465–11475. [Google Scholar] [CrossRef]
- Nair, A.A.; Yu, F. Quantification of Atmospheric Ammonia Concentrations: A Review of Its Measurement and Modeling. Atmosphere 2020, 11, 1092. [Google Scholar] [CrossRef]
- Pedersen, J.; Nyord, T.; Feilberg, A.; Labouriau, R. Analysis of the Effect of Air Temperature on Ammonia Emission from Band Application of Slurry. Environ. Pollut. 2021, 282, 117055. [Google Scholar] [CrossRef] [PubMed]
- Hong, Y.-M.; Lee, B.-K.; Park, K.-J.; Kang, M.-H.; Jung, Y.-R.; Lee, D.-S.; Kim, M.-G. Atmospheric Nitrogen and Sulfur Containing Compounds for Three Sites of South Korea. Atmos. Environ. 2002, 36, 3485–3494. [Google Scholar] [CrossRef]
- Kang, C.-M.; Lee, H.S.; Kang, B.-W.; Lee, S.-K.; Sunwoo, Y. Chemical Characteristics of Acidic Gas Pollutants and PM2.5 Species during Hazy Episodes in Seoul, South Korea. Atmos. Environ. 2004, 38, 4749–4760. [Google Scholar] [CrossRef]
- Kim, K.; Lee, C.; Choi, D.; Han, S.; Eom, J.; Han, J. A Study on the Formation Reactions and Conversion Mechanisms of HONO and HNO3 in the Atmosphere of Daejeon, Korea. Atmosphere 2024, 15, 267. [Google Scholar] [CrossRef]
- Hao, Q.; Jiang, N.; Zhang, R.; Yang, L.; Li, S. Characteristics, Sources, and Reactions of Nitrous Acid during Winter at an Urban Site in the Central Plains Economic Region in China. Atmos. Chem. Phys. 2020, 20, 7087–7102. [Google Scholar] [CrossRef]
- Stieger, B.; Spindler, G.; Fahlbusch, B.; Müller, K.; Grüner, A.; Poulain, L.; Thöni, L.; Seitler, E.; Wallasch, M.; Herrmann, H. Measurements of PM10 Ions and Trace Gases with the Online System MARGA at the Research Station Melpitz in Germany—A Five-Year Study. J. Atmos. Chem. 2018, 75, 33–70. [Google Scholar] [CrossRef]
- Ge, X.; He, Y.; Sun, Y.; Xu, J.; Wang, J.; Shen, Y.; Chen, M. Characteristics and Formation Mechanisms of Fine Particulate Nitrate in Typical Urban Areas in China. Atmosphere 2017, 8, 62. [Google Scholar] [CrossRef]
- Cheng, C.; Yang, S.; Yuan, B.; Pei, C.; Zhou, Z.; Mao, L.; Liu, S.; Chen, D.; Cheng, X.; Li, M.; et al. The Significant Contribution of Nitrate to a Severe Haze Event in the Winter of Guangzhou, China. Sci. Total Environ. 2024, 909, 168582. [Google Scholar] [CrossRef]
- Akimoto, H.; Tanimoto, H. Rethinking of the Adverse Effects of NOx-Control on the Reduction of Methane and Tropospheric Ozone—Challenges toward a Denitrified Society. Atmos. Environ. 2022, 277, 119033. [Google Scholar] [CrossRef]
- Andersen, S.T.; Carpenter, L.J.; Reed, C.; Lee, J.D.; Chance, R.; Sherwen, T.; Vaughan, A.R.; Stewart, J.; Edwards, P.M.; Bloss, W.J.; et al. Extensive Field Evidence for the Release of HONO from the Photolysis of Nitrate Aerosols. Sci. Adv. 2023, 9, eadd6266. [Google Scholar] [CrossRef] [PubMed]
- Chen, J.; Jiang, H.; Chen, X.; Wang, J.; Huang, D.; Lian, C.; Wang, W.; Ammann, M.; Bao, F.; Chen, C.; et al. A Novel Mechanism for NO2-to-HONO Conversion on Soot: Synergistic Effect of Elemental Carbon and Organic Carbon. Environ. Sci. Technol. Lett. 2023, 10, 878–884. [Google Scholar] [CrossRef]
- Lu, X.; Wang, Y.; Li, J.; Shen, L.; Fung, J.C.H. Evidence of Heterogeneous HONO Formation from Aerosols and the Regional Photochemical Impact of This HONO Source. Environ. Res. Lett. 2018, 13, 114002. [Google Scholar] [CrossRef]
- Wang, H.; Huang, C.; Tao, W.; Gao, Y.; Wang, S.; Jing, S.; Wang, W.; Yan, R.; Wang, Q.; An, J.; et al. Seasonality and Reduced Nitric Oxide Titration Dominated Ozone Increase during COVID-19 Lockdown in Eastern China. npj Clim. Atmos. Sci. 2022, 5, 24. [Google Scholar] [CrossRef]
- Xuan, H.; Zhao, Y.; Ma, Q.; Chen, T.; Liu, J.; Wang, Y.; Liu, C.; Wang, Y.; Liu, Y.; Mu, Y.; et al. Formation Mechanisms and Atmospheric Implications of Summertime Nitrous Acid (HONO) during Clean, Ozone Pollution and Double High-Level PM2.5 and O3 Pollution Periods in Beijing. Sci. Total Environ. 2023, 857, 159538. [Google Scholar] [CrossRef] [PubMed]
- Wang, L.; Wen, L.; Xu, C.; Chen, J.; Wang, X.; Yang, L.; Wang, W.; Yang, X.; Sui, X.; Yao, L.; et al. HONO and Its Potential Source Particulate Nitrite at an Urban Site in North China during the Cold Season. Sci. Total Environ. 2015, 538, 93–101. [Google Scholar] [CrossRef]
- Wang, J.; Zhang, X.; Guo, J.; Wang, Z.; Zhang, M. Observation of Nitrous Acid (HONO) in Beijing, China: Seasonal Variation, Nocturnal Formation and Daytime Budget. Sci. Total Environ. 2017, 587–588, 350–359. [Google Scholar] [CrossRef]
- Xuan, H.; Liu, J.; Zhao, Y.; Cao, Q.; Chen, T.; Wang, Y.; Liu, Z.; Sun, X.; Li, H.; Zhang, P.; et al. Relative Humidity Driven Nocturnal HONO Formation Mechanism in Autumn Haze Events of Beijing. npj Clim. Atmos. Sci. 2024, 7, 193. [Google Scholar] [CrossRef]
- Lee, J.D.; Whalley, L.K.; Heard, D.E.; Stone, D.; Dunmore, R.E.; Hamilton, J.F.; Young, D.E.; Allan, J.D.; Laufs, S.; Kleffmann, J. Detailed Budget Analysis of HONO in Central London Reveals a Missing Daytime Source. Atmos. Chem. Phys. 2016, 16, 2747–2764. [Google Scholar] [CrossRef]
- Meusel, H.; Kuhn, U.; Reiffs, A.; Mallik, C.; Harder, H.; Martinez, M.; Schuladen, J.; Bohn, B.; Parchatka, U.; Crowley, J.N.; et al. Daytime Formation of Nitrous Acid at a Coastal Remote Site in Cyprus Indicating a Common Ground Source of Atmospheric HONO and NO. Atmos. Chem. Phys. 2016, 16, 14475–14493. [Google Scholar] [CrossRef]
| Compounds | Unit | Mean ± Std |
|---|---|---|
| PM2.5 | µg/m3 | 9.38 ± 5.34 |
| NO3− | µg/m3 | 1.3 ± 1.5 |
| SO42− | µg/m3 | 2 ± 1.16 |
| NH4+ | µg/m3 | 0.99 ± 0.76 |
| HONO | ppb | 0.31 ± 0.1 |
| HNO3 | ppb | 0.32 ± 0.19 |
| NO | ppb | 0.77 ± 1.29 |
| NO2 | ppb | 3.28 ± 2.22 |
| O3 | ppb | 32.44 ± 7.97 |
| SO2 | ppb | 0.79 ± 0.29 |
| NH3 | ppb | 4.33 ± 3.26 |
| CO | ppb | 212.42 ± 57.8 |
| CO2 | ppm | 448.62 ± 7.35 |
| CO/CO2 | ppb/ppm | 0.47 ± 0.12 |
Disclaimer/Publisher’s Note: The statements, opinions and data contained in all publications are solely those of the individual author(s) and contributor(s) and not of MDPI and/or the editor(s). MDPI and/or the editor(s) disclaim responsibility for any injury to people or property resulting from any ideas, methods, instructions or products referred to in the content. |
© 2024 by the authors. Licensee MDPI, Basel, Switzerland. This article is an open access article distributed under the terms and conditions of the Creative Commons Attribution (CC BY) license (https://creativecommons.org/licenses/by/4.0/).
Share and Cite
Oh, S.-H.; Schauer, J.J.; Jeon, H.; Ko, D.-H.; Choe, S.; Bae, M.-S. Efficiency and Interference Verification of a HONO Collection System Using an Ultrasonic Nozzle Coupled with a Recirculating Spray Chamber for Ambient Air Monitoring. Appl. Sci. 2024, 14, 8930. https://doi.org/10.3390/app14198930
Oh S-H, Schauer JJ, Jeon H, Ko D-H, Choe S, Bae M-S. Efficiency and Interference Verification of a HONO Collection System Using an Ultrasonic Nozzle Coupled with a Recirculating Spray Chamber for Ambient Air Monitoring. Applied Sciences. 2024; 14(19):8930. https://doi.org/10.3390/app14198930
Chicago/Turabian StyleOh, Sea-Ho, James J. Schauer, Hajeong Jeon, Dong-Hoon Ko, Seoyeong Choe, and Min-Suk Bae. 2024. "Efficiency and Interference Verification of a HONO Collection System Using an Ultrasonic Nozzle Coupled with a Recirculating Spray Chamber for Ambient Air Monitoring" Applied Sciences 14, no. 19: 8930. https://doi.org/10.3390/app14198930