Article

Analyzing the Reinforcement of Multiwalled Carbon Nanotubes in Vulcanized Natural Rubber Nanocomposites Using the Lorenz–Park Method

by
Diego Silva Melo
1,
Carlos Toshiyuki Hiranobe
2,
Gabrieli Roefero Tolosa
3,
José Antônio Malmonge
1,
Cicero Rafael Cena
4,
Aldo Eloizo Job
3,
Renivaldo José Santos
2 and
Michael Jones Silva
1,2,*
1
Department of Engineering, School of Engineering, Campus of Ilha Solteira, Sao Paulo State University (UNESP), Avenida Brazil, Ilha Solteira 15385-000, SP, Brazil
2
Department of Engineering, School of Engineering and Sciences, Campus of Rosana, Sao Paulo State University (UNESP), Avenida dos Barrageiros, Rosana 19274-000, SP, Brazil
3
Department of Physics, School of Science and Technology, Campus of Presidente Prudente, Sao Paulo State University (UNESP), Rua Roberto Simonsen, Presidente Prudente 19060-900, SP, Brazil
4
Institute of Physics, Federal University of Mato Grosso do Sul (UFMS), Rua Costa e Silva, Campo Grande 79070-900, MS, Brazil
*
Author to whom correspondence should be addressed.
Appl. Sci. 2024, 14(19), 8973; https://doi.org/10.3390/app14198973 (registering DOI)
Submission received: 27 August 2024 / Revised: 26 September 2024 / Accepted: 2 October 2024 / Published: 5 October 2024
(This article belongs to the Special Issue Polymer Nanocomposites: State of the Art and Future Prospects)

Abstract

:
In this study, multiwalled carbon nanotubes (MWCNTs) were incorporated into vulcanized natural rubber (VNR) matrixes to create nanocomposites with improved mechanical, thermal, and electrical properties. The interfacial interaction of the MWCNTs with the VNR matrix was quantitatively evaluated based on the crosslink density value calculated using the Flory–Rehner methodology. Various rheometric parameters were influenced by the addition of the MWCNTs, including minimum torque (ML), maximum torque (MH), and scorch time (tS1). The MWCNTs significantly enhanced the vulcanization of the composites based on the VNR matrix. This study highlights the impact of MWCNTs on crosslink density, improving mechanical properties and reducing swelling in the VNR matrix. We discovered that the MWCNTs and the VNR matrix interact strongly, which improved the mechanical properties of the matrix. The MWCNTs improved the hardness, tensile strength, and abrasion resistance of the VNR/MWCNT nanocomposites. Based on dynamic mechanical analysis, MWCNT incorporation improved stiffness as indicated by a change in storage modulus and glass transition temperatures. The addition of MWCNTs to the VNR/MWCNT nanocomposites significantly improved their electrical properties, reaching a percolation threshold where conductive pathways were formed, enhancing their overall conductivity. Overall, this study demonstrates the versatility and functionality of VNR/MWCNT nanocomposites for a variety of applications, including sensors, electromagnetic shielding, and antistatic blankets.

1. Introduction

The potential for polymer composites reinforced with nanomaterials to drastically enhance mechanical, thermal, and functional properties has garnered substantial attention in recent years [1,2,3,4]. Both synthetic and natural polymers serve as matrices in the development of these composites. Among natural polymers, natural rubber (NR) is particularly notable for its superior mechanical and thermal properties, especially in its vulcanized form [5,6]. Its remarkable elasticity, resistance to wear and fatigue, and renewable nature have made it an indispensable material in many industries. However, its mechanical and thermal limitations in certain applications necessitate a search for advanced reinforcement techniques [7]. NR’s exceptional properties have drawn interest from various technological and industrial sectors [8,9,10,11,12,13]. There are more than 2000 types of plants that produce natural rubber (NR) latex; however, latex from the rubber tree (Hevea brasiliensis) is the most valuable due to its quality, production level, and economic aspects [14]. NR is composed of cis-1,4-isoprene isomeric units with a head–tail configuration. NR is one of the most widely used polymers due to its properties, such as elasticity, flexibility, and resilience [15].
Carbon nanotubes (CNTs) are among the leading nanomaterials for reinforcing polymer matrices due to their extraordinary mechanical, electrical, and thermal properties [16]. CNTs are self-assembled tubular structures consisting of carbon atoms arranged in hexagonal configurations. Their chirality, a term that refers to their atomic arrangement, governs whether they exhibit a metallic or semiconducting behavior. CNTs are generally categorized into single-walled (SWCNTs) and multiwalled carbon nanotubes (MWCNTs) types [17,18]. A SWCNT is a hexagonal tubular form of graphene. In SWCNTs, carbon atoms are arranged in a hexagonal lattice structure, which curls up into a cylindrical tube. Typical SWCNT diameters are in the range of 0.4 to 2 nm, and their unique properties are a result of two active sites, namely, the side wall of the tube and the end cap [17,18]. On the other hand, MWCNTs are composed of 2 to 50 graphene sheets rolled cylindrically into various shapes, producing a slightly intricate structure with an outer tube diameter ranging from 2 to 30 nm and an inner tube diameter ranging from 0.3 to 20 nm [18,19]. CNTs are characterized by extremely high surface areas, a high aspect ratio (length/diameter), and remarkably high mechanical resistance. In particular, the mechanical tensile strength of CNTs is 100 times greater than that of steel, and their electrical and thermal conductivities are comparable to those of copper [20,21,22]. Due to these unique properties, CNTs can be used to produce desirable consumer products by filling different polymers and ceramics. It is well known that MWCNTs possess high mechanical strength, excellent thermal and electrical conductivity, and a high surface-to-volume ratio, making them an excellent choice for reinforcing polymer matrixes [23,24]. As a result of the incorporation of MWCNTs into natural rubber, a composite with superior properties may be generated, which can be used in a range of industrial applications [25].
The combination of NR with CNTs stands out as a particularly promising research avenue. Recent studies have demonstrated that the addition of MWCNTs to NR-based nanocomposites can significantly improve their mechanical, thermal, and electrical properties. Surface modifications of MWCNTs have been shown to enhance adhesion to the NR matrix, resulting in superior reinforcement performance and improved thermal stability [26]. Depending on the concentration and dispersion of MWCNTs within the NR matrix, notable improvements in tensile strength, thermal stability, and conductivity have been observed [27,28,29,30]. For example, the surface modification of MWCNTs in NR composites has been linked to enhanced crosslink density and superior filler–matrix interactions, resulting in improved dispersion and composite properties [31]. After curing and binding both NR/carbon black/prevulcanized multiwalled carbon nanotube (NR/CB/P-MWCNT) nanocomposites and NR/carbon black/oxidized multiwalled carbon nanotube (NR/CB/O-MWCNT) nanocomposites, the authors of one study observed a higher crosslink density for the latter nanocomposites, which, in turn, led to greater filler–rubber interactions and, consequently, improved dispersion of CB/O-MWCNTs within the NR matrix. According to an analysis of hardness (Shore A), NR/CB/P-MWCNT nanocomposites have higher entanglement and agglomeration levels than NR/CB/O-MWCNT nanocomposites. Based on the study conducted by Wiroonpochit et al., sulfur-free ultraviolet-light-prevulcanized NR latex was used to create antistatic NR films containing optimized concentrations of multiwalled carbon nanotubes (MWCNTs) as conductors, nanocrystalline cellulose (NCC) as a co-filler, sodium dodecyl sulfate (SDS) as a surfactant, and zinc oxide (ZnO) as an antibacterial agent [32]. It was demonstrated by the authors that the films formed with NR/MWCNTs had improved mechanical properties and electrical properties; according to their analysis, the results exceeded the requirements of the American Society for Testing and Materials (ASTM) Standards [33] for mechanical properties and International Electrotechnical Commission/Technical Specification (IEC/TS) [34]. A study was conducted by Sani et al. to examine the effect of MWCNT reinforcement on the self-healing performance of natural rubber [35]. By analyzing the mechanical properties obtained through tensile and tear strength tests, it was determined that the incorporation of MWCNTs increased both properties by three and two orders of magnitude, respectively [35].
The Lorenz–Park method is an analytical tool for analyzing the interactions between fillers and polymer matrices in composite materials [36,37]. An important aspect of this methodology is that it provides the ability to understand how different phases within a composite interact, a process that plays an essential role in optimizing a material’s mechanical properties [38]. Through the analysis of the relationship between the properties of the filler and the rubber matrix, the Lorenz–Park equation quantitatively describes the interaction between the two [36,38,39]. Specifically, it examines how the filler enhances or modifies the characteristics of the rubber, including its viscosity, elasticity, and overall mechanical properties [36]. Thus, Lorenz–Park equation predictions are validated by experimental data, allowing researchers to confirm the degree of interaction observed in real-life applications [38,40]. Additionally, this methodology provides a framework for optimizing composite formulations by correlating mechanical properties with filler concentration and type [36,41]. An increase in the amount of filler, for example, has been shown to result in an increase in cross-link density and an improvement in mechanical performance. This method has been used to analyze interactions in composite materials containing natural rubber combined with silica particles, cellulose, or polyurethane residues [36,38,39]. The results of these studies demonstrate that different types of filler can have significant impacts on the behavior of composites. Additionally, this method provides insight into rheological changes occurring during processing, which is important in manufacturing processes such as extrusion and molding, where flow characteristics are highly important [36,42,43].
Nanocomposites made from MWCNTs dispersed in a VNR matrix offer several advantages in terms of their morphology, thermal properties, and mechanical properties [44]. The addition of MWCNTs to VNR-based nanocomposites can also enhance their electrical properties, thereby enhancing their potential applications. As a result of the combination of MWCNTs and a VNR matrix, conductive nanocomposites with unique and highly desirable electrical properties can be produced. Various applications of these conductive nanocomposites can be found, including flexible electronics, advanced sensors, and energy storage devices such as supercapacitors [45,46,47,48,49].
Recent studies indicate that incorporating MWCNTs into NR significantly improves the latter’s mechanical and thermal properties. The effectiveness of this reinforcement is influenced by factors such as the surface modification of MWCNTs, a process that enhances their adhesion to the polymer matrix, leading to better performance in terms of tensile strength and thermal stability. For instance, research has shown that MWCNT-reinforced NR composites can exhibit substantial improvements in tensile strength and thermal stability depending on the concentration and dispersion of nanotubes within the matrix. A novel aspect of this research is the application of the Lorenz–Park methodology to investigate the interactions between MWCNTs and vulcanized natural rubber (VNR). This approach allows for a theoretical–experimental adjustment that provides deeper insights into the reinforcement mechanisms at play. Using a two-roll mill for preparation, we systematically examined how dispersion and synergy between MWCNTs and VNR affect their rheological, mechanical, thermal, and electrical properties.

2. Materials and Methods

2.1. Materials

A Brazilian clear crepe natural rubber (CCB) with a Mooney viscosity of 98.0 (evaluated at 100 degrees Celsius) was purchased from DLP Industria e Comércio de Borracha e Artefatos LTDA, located in Poloni, Brazil. Located in Belo Horizonte, Brazil, NanoView NanoTecnologia supplies multiwalled carbon nanotubes (MWCNTs) with external diameters of 10–30 nm and lengths of 5–30 cm. Vulcanization reagents, including zinc oxide (ZnO, 99.8% purity, from Neon), stearic acid (C18H36O2, 95%, from Êxodo Científica), and sulfur (S8, 99.5%, from Scientific Exotic), in addition to the accelerators benzoathiazole disulfide/MBTS (C14H8N2S4, 99%, from Basile Química) and tetramethylthiuram disulfide/TMTD (C6H12N2S4, 99%, from Basile Química), were obtained commercially. The formulation used to prepare the composites of NR/MWCNT is presented in Table 1.

2.2. Nanocomposites Preparation

Composites were prepared in an open-cylinder mixer with a friction ratio of 1:1.25 in accordance with ASTM [50]. Initially, natural rubber was added to the mixer with zinc oxide and stearic acid, as well as MWCNTs as filler, in proportions of 0, 1, 2, 3, 4, and 5 per hundred rubbers (phr). As soon as the mixture reached homogeneity, it was allowed to rest at room temperature for 24 h. Afterwards, the mixture was processed in the mixer again, wherein sulfur was added as a crosslinking agent and MBTS and TMTD were added as vulcanization accelerators. The mass was left at room temperature for two hours after final homogenization before being prepared for testing in a Mastermac thermopress (model Vulcan 400/20-1, manufactured in Brazil), which operates at 210 kgf cm−2 and uses a steel mold with dimensions of 50 mm × 150 mm × 2 mm with a maximum pressure of 210 kgf cm−2.

2.3. Nanocomposites Characterization

2.3.1. Rheometry

A Brazilian oscillatory disc rheometer, manufactured by Team Equipamentos, was used to determine the rheometric parameters. Tests were conducted in accordance with ASTM D2084-19a by exposing the composite to oscillations of 1° and isotherms of 150 °C [51].

2.3.2. Specific Mass Calculation

According to ASTM D297-21, the specific masses (ρ) of the compounds were determined using ethanol with a value of 0.79 g cm−3 [52]. Equation (1) was used to calculate ρ:
ρ = ρ L × m A m A   m B
where ρL represents the specific mass of ethanol at the analysis temperature; mA represents the mass of the sample; and mB represents the mass of the sample in the liquid.

2.3.3. The Flory–Rehner Method for Determining Crosslink Density in Organic Solvents

The swelling technique was used to determine the crosslinking density of the composites. The specimens were immersed in toluene with an approximate mass of 0.25 ± 0.05 g for five days. The specimens were then removed, dried to remove excess solvent, and weighed again. Afterwards, they were dried at 80 °C for 24 h and weighed again. Based on the values obtained for the mass of the dry specimen, the mass of the swollen specimen with solvent, and the mass of the dried specimen, the volumetric fraction of rubber in the swollen specimen could be estimated. Based on Equation (2), developed by Flory and Rehner, the crosslink density was calculated [53]. Specifically, the molar volume of toluene (V0) and the Flory–Huggins interaction parameter (χ) for natural rubber and toluene were 106.3 and 0.39 cm3 mol−1, respectively.
ν = ( ln 1 V B + V B + χ V B ) 2 ( ρ B ) ( V 0 ) ( V B 1 3 V B 2 ) ,
where ν is the crosslink density (mol cm−3), ρB is the rubber density, and VB is the volume fraction of rubber in swollen form determined by the weight increase associated with swelling.

2.3.4. Analysis of the Interfacial Interaction between the MWCNTs and the VNR Matrix (via the Lorenz–Park Method)

The Lorenz–Park method was used to evaluate the interaction between MWCNTs and VNR [42]. Based on swelling tests conducted in a solvent, the appropriate parameters were determined, and the interaction was calculated using Equation (3) [37]:
Q f Q g = a e z + b
Assume Q is the mass of toluene absorbed per gram of rubber; f and g represent the vulcanized nanocomposite including filler and VNR, respectively; and z represents the ratio of filler mass to rubber mass. a and b are constants. Equation (4) is used for calculation:
Q = w s w d w r × 100 / w F ,
where ws refers to the mass of the swollen composite when equilibrium is reached, wd refers to the mass of the dry composite, wr refers to the mass of the rubber in the dry composite, and wF refers to the total mass of the formulation.

2.3.5. Study of the Dispersion Degree of MWCNTs in the VNR Matrix

As a result of measuring the degree of dispersion of filler particles in a VNR matrix, it is possible to determine the homogeneity of the dispersion using the parameters obtained from rheometry. A high degree of homogeneity indicates a uniform distribution of filler particles in terms of size and shape. There are several mechanical properties of VNR that can be improved through this condition, including resistance to wear, abrasion, and fracture. It is possible to perform a quantitative analysis of the homogeneity of MWCNTs in VNR-based composites by applying Equation (5):
L = η r m r = M L f M L g M H f M H g ,
where L represents the degree of dispersion of the filler in the polymeric matrix; ηr is the ratio of the minimum torque of the composite containing the filler to that of the composite without the filler; mr is the ratio of the maximum torque of the composite with the filler to that of the composite without the filler; ML denotes the minimum torque, while MH denotes the maximum torque; and the subscripts f and g refer to the composites with and without the filler (or pure rubber), respectively.

2.3.6. Scanning Electron Microscopy Analysis (SEM)

By using a Carl Zeiss EVO LS15 scanning electron microscope operated at 20 kV, the surface and cryofractured cross-section morphologies of the NR/MWCNT composites were analyzed. The samples were coated with a thin layer of gold using a Quorum Q 150R ES sputter coater.

2.3.7. Hardness Analyses

Based on the ASTM D224-15 standard, the composite surfaces were evaluated for hardness using the Shore A scale [54]. In this study, an analog durometer produced by Digimess (model 400.142, manufactured in Shenzhen, Guangdong, China) was used, with a measurement range of 0 to 100 and an accuracy of 1 Shore A unit.

2.3.8. Abrasion Resistance

Based on Equation (6), abrasion loss was determined using MaqTest equipamentos, Franca, São Paulo, Brazil, with an abrasion course of 40 m and a pressure of 5 N applied to the test piece [55].
P A = Δ m   S 0   ρ   S ,
where PA represents the loss caused by abrasion (mm3/40 m); Δm is the mass loss of the composite (mg); S0 is the attack index theoretic of sandpaper on standard rubber (200 ± 20 mg); the real attack index of sandpaper on standard rubber is S (mg); and ρ is the specific mass of the nanocomposite (mg mm−3).

2.3.9. Tensile Test

Stress–strain tests were performed using a Biopdi universal testing machine (manufactured in São Carlos, São Paulo, Brazil), using a 5 kN load cell and an internal strain transducer. The tests were conducted using Type A specimens (dumbbell-shaped), in accordance with ASTM D412-16 [56].

2.3.10. Dynamic Mechanical Analysis (DMA)

A DMA of the samples obtained in the present study was completed using equipment produced by Netzsch (model DMTA 242C) in traction mode at a constant frequency of 10 Hz. DMAs were conducted at temperature ranges between −120 °C and 140 °C at a rate of 10 °C min−1, with a force of 1.6 N and an amplitude of 240 µm. Sample dimensions were approximately 11 mm × 5.3 mm (length and width), while thickness ranged from 200 to 300 µm.

2.3.11. Thermogravimetric Analysis (TGA)

In order to conduct thermogravimetric analyses (TGAs), approximately 10 mg of sample mass was used. A TGA test was carried out using Netzsch model 209 equipment at temperatures ranging from 30 °C to 900 °C at a heating rate of 10 °C min−1 in an inert nitrogen atmosphere with a flow rate of 15 mL min−1.

2.3.12. Direct Current (dc) Conductivity Analysis

In order to measure the dc electrical conductivity (σdc), we used a programmable voltage–current source (KEITHLEY, model 236). Both faces of the films were painted with conductive paint to form conductive electrodes. To calculate σdc values for all specimens of the VNR/MWCNT nanocomposite, we used Equation (7):
σ d c = 1 R L A = i V L A
where R is the resistance, A is the electrode area, L is the sample thickness, and V and i are the applied voltage and measured current, respectively.

3. Results and Discussion

3.1. Rheometric Analysis

As shown in Table 2, the following results were obtained during the rheometric tests: minimum torque (ML), maximum torque (MH), torque variation (ΔM), scorch time (tS1), and optimal curing time (t90). Based on the results in Table 2, and taking into account the statistical error, the presence of fillers does not significantly affect the rheometric parameters compared with the reference sample (neat VNR).
The ML is defined as the shear strength observed at the beginning of vulcanization. This value indicates the consistency of the mixture before starting, which is crucial for the formation of the crosslinks between the polymer chains. In the VNR/MWCNT nanocomposite containing 4 phr (parts per hundred rubber) of MWCNTs, compared to those with 0, 1, 2, and 3 phr of MWCNTs, there was a noticeable trend of increasing ML values. This increase can be attributed to the resistance of the NR chains to movement as the amount of filler in the composite rises. MH is strongly linked to the formation of crosslinks, while ΔM reflects both the formation of crosslinks and the presence of fillers in the composites. It is clear that both parameters increase during the vulcanization process. Moreover, analyzing the torque variation indicates that the MWCNTs enhanced the interaction between the filler and the polymer matrix. There was, however, a trend towards reducing the tS1, which denotes the time elapsed from the beginning of heating to the point at which vulcanization begins to be detectable, as well as the t90 value, which refers to the time it will take for the VNR or VNR-based composites to reach 90% of their total cure state or crosslinks. As can be seen from the results, the addition of MWCNTs to the VNR matrix had little effect on the t90 v value; i.e., the dispersion of MWCNTs into VNR matrix did not affect the vulcanization process.

3.2. Flory–Rehner Crosslink Density

In VNR samples and VNR-based composites, crosslink density describes the number of chemical bonds formed between polymer chains during vulcanization. Typically, crosslinks are covalent bonds formed between polymer chains, transforming rubber from a viscoelastic material into one that is more elastic and resistant [57]. The degree of crosslinking has a direct impact on the mechanical properties of vulcanized rubber as well as VNR-based nanocomposites. Generally, a higher crosslink density translates into greater stiffness, tensile strength, and elasticity. It is important to note, however, that if the density of the rubber is too high, it can become very stiff and brittle [58]. The swelling analysis of rubber involves determining how much rubber swells in a solvent. An increase in crosslink density is accompanied by a decrease in swelling. It is possible to calculate the crosslink density using the Flory–Rehner theory, according to which swelling volume is related to the number of crosslinks [59]. As shown in Table 3, the crosslink density of the NR/MWCNT nanocomposites was determined. The gradual addition of MWCNTs to the VNR matrix increases the crosslinking density, which can improve the mechanical properties of vulcanized composites.

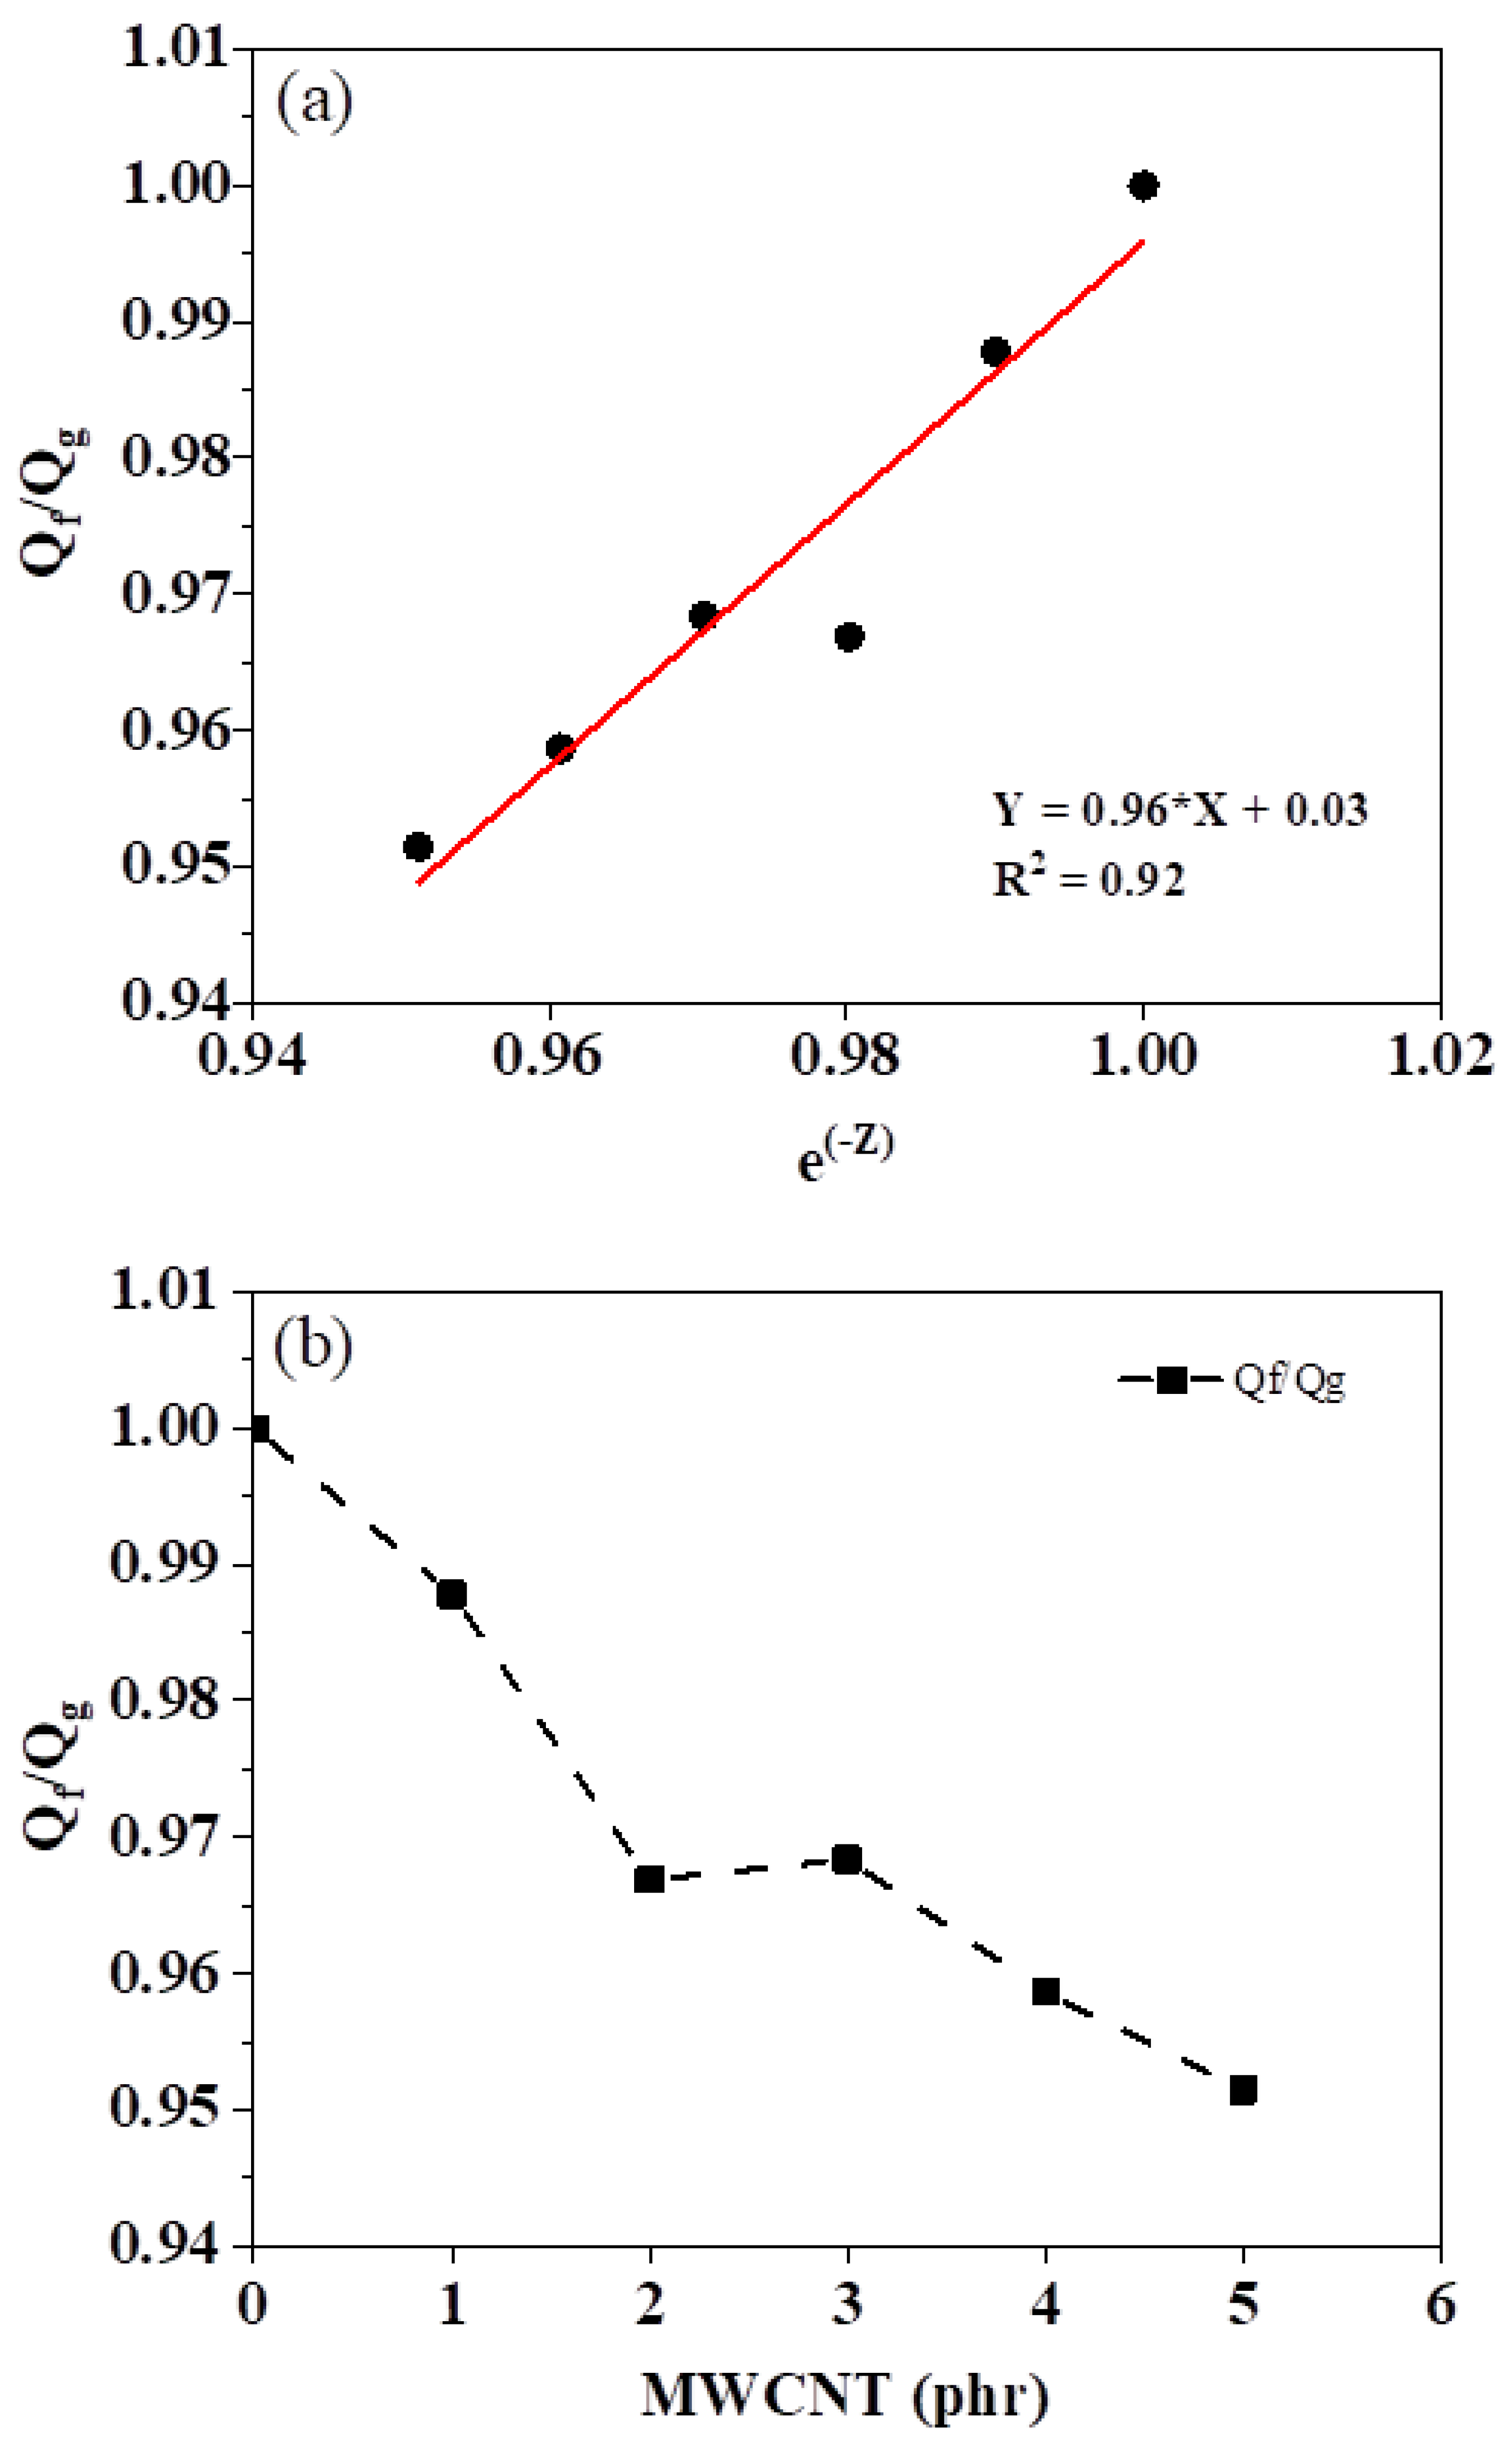
3.3. Analysis of Interfacial Interaction Using the Lorenz–Park Method

Using the equation proposed by Lorenz and Park, the interfacial interaction between the filler and the matrix was evaluated. Figure 1a presents a graphic of Qf/Qg as function of e−z for the VNR-based nanocomposite specimens reinforced with MWCNTs as well as for a neat VNR sample as a reference. The values of parameters a and b are the constants of the equation, with numerical values of 0.96 and 0.03, respectively, giving a correlation coefficient (R) of 0.92.
According to the observations of Lorentz and Park, a constant value above 0.7 suggests a strong interaction between the MWCNT filler and the VNR matrix. A similar result was obtained by [37] for the constants a and b in compounds derived from natural rubber containing leather residues [37]. The decrease in Qf/Qg values as the MWCNTs are inserted is evident in Figure 1b, confirming the effective interaction between the matrix and the filler.
In ref. [60], graphene and graphene oxide (GO) were evaluated in terms of their interaction with natural rubber. Graphene is considered a promising reinforcement material for nanocomposites; however, the authors detected Qf/Qg values of 0.82 and 0.85 for graphene and GO, respectively, indicating a lower interaction than that of MWCNTs in a VNR matrix. Based on the Lorenz–Park method, the performance of paper sludge in NR composites was evaluated using maleic anhydride as a coupling agent, as described in ref. [61]. With increasing amounts of filler, it was reported that Qf/Qg values increased. As the amount of filler increases, the interaction between the filler and the matrix decreases. Paper sludge and rubber are hydrophobic, and this is attributed to their hydrophilic natures.
In conclusion, all VNR/MWCNT nanocomposite specimens are made of the same elastomer and have the same crosslinking system. As shown in Figure 1b, an increase in filler leads to a decrease in Qf/Qg, which can be attributed to improved mechanical properties due to a good interfacial interaction between VNR chains and MWCNTs [37]. Alternatively, higher Qf/Qg values indicate lower interaction between MWCNTs and the VNR matrix.

3.4. Analysis of the Degree of Filler Dispersion

In order to determine the values of the degree of dispersion (L) based on the torque property data provided in Table 2, we used Equation (5). Figure 2 illustrates the degree of MWCNT dispersion in the NR matrix. In comparison with the neat VNR matrix, lower values of L indicate better dispersion of the MWCNTs. According to Figure 2, the pure VNR sample has an L value equal to zero; the lower the L value, in comparison with the pure matrix, the better the dispersion of MWCNTs in the VNR-based nanocomposite. The L values for the different VNR/MWCNT nanocomposite specimens were below the value for the NVR matrix, demonstrating good dispersion of the MWCNTs. As compared to the pure VNR matrix, the NVR/MWCNT1 samples have a lower L value (−0.21) compared to the VNR/MWCNT5 samples (−0.06). MWCNTs have a greater tendency to agglomerate because of van der Waals forces as the MWCNT concentration increases in the VNR matrix. A lower viscosity tends to reduce the minimum torque, facilitating the dispersion of fillers and intensifying the interaction between MWCNTs and NR. Physical crosslinks are created between the filler and the matrix as a result of their interaction, which increases the total crosslink density [62].

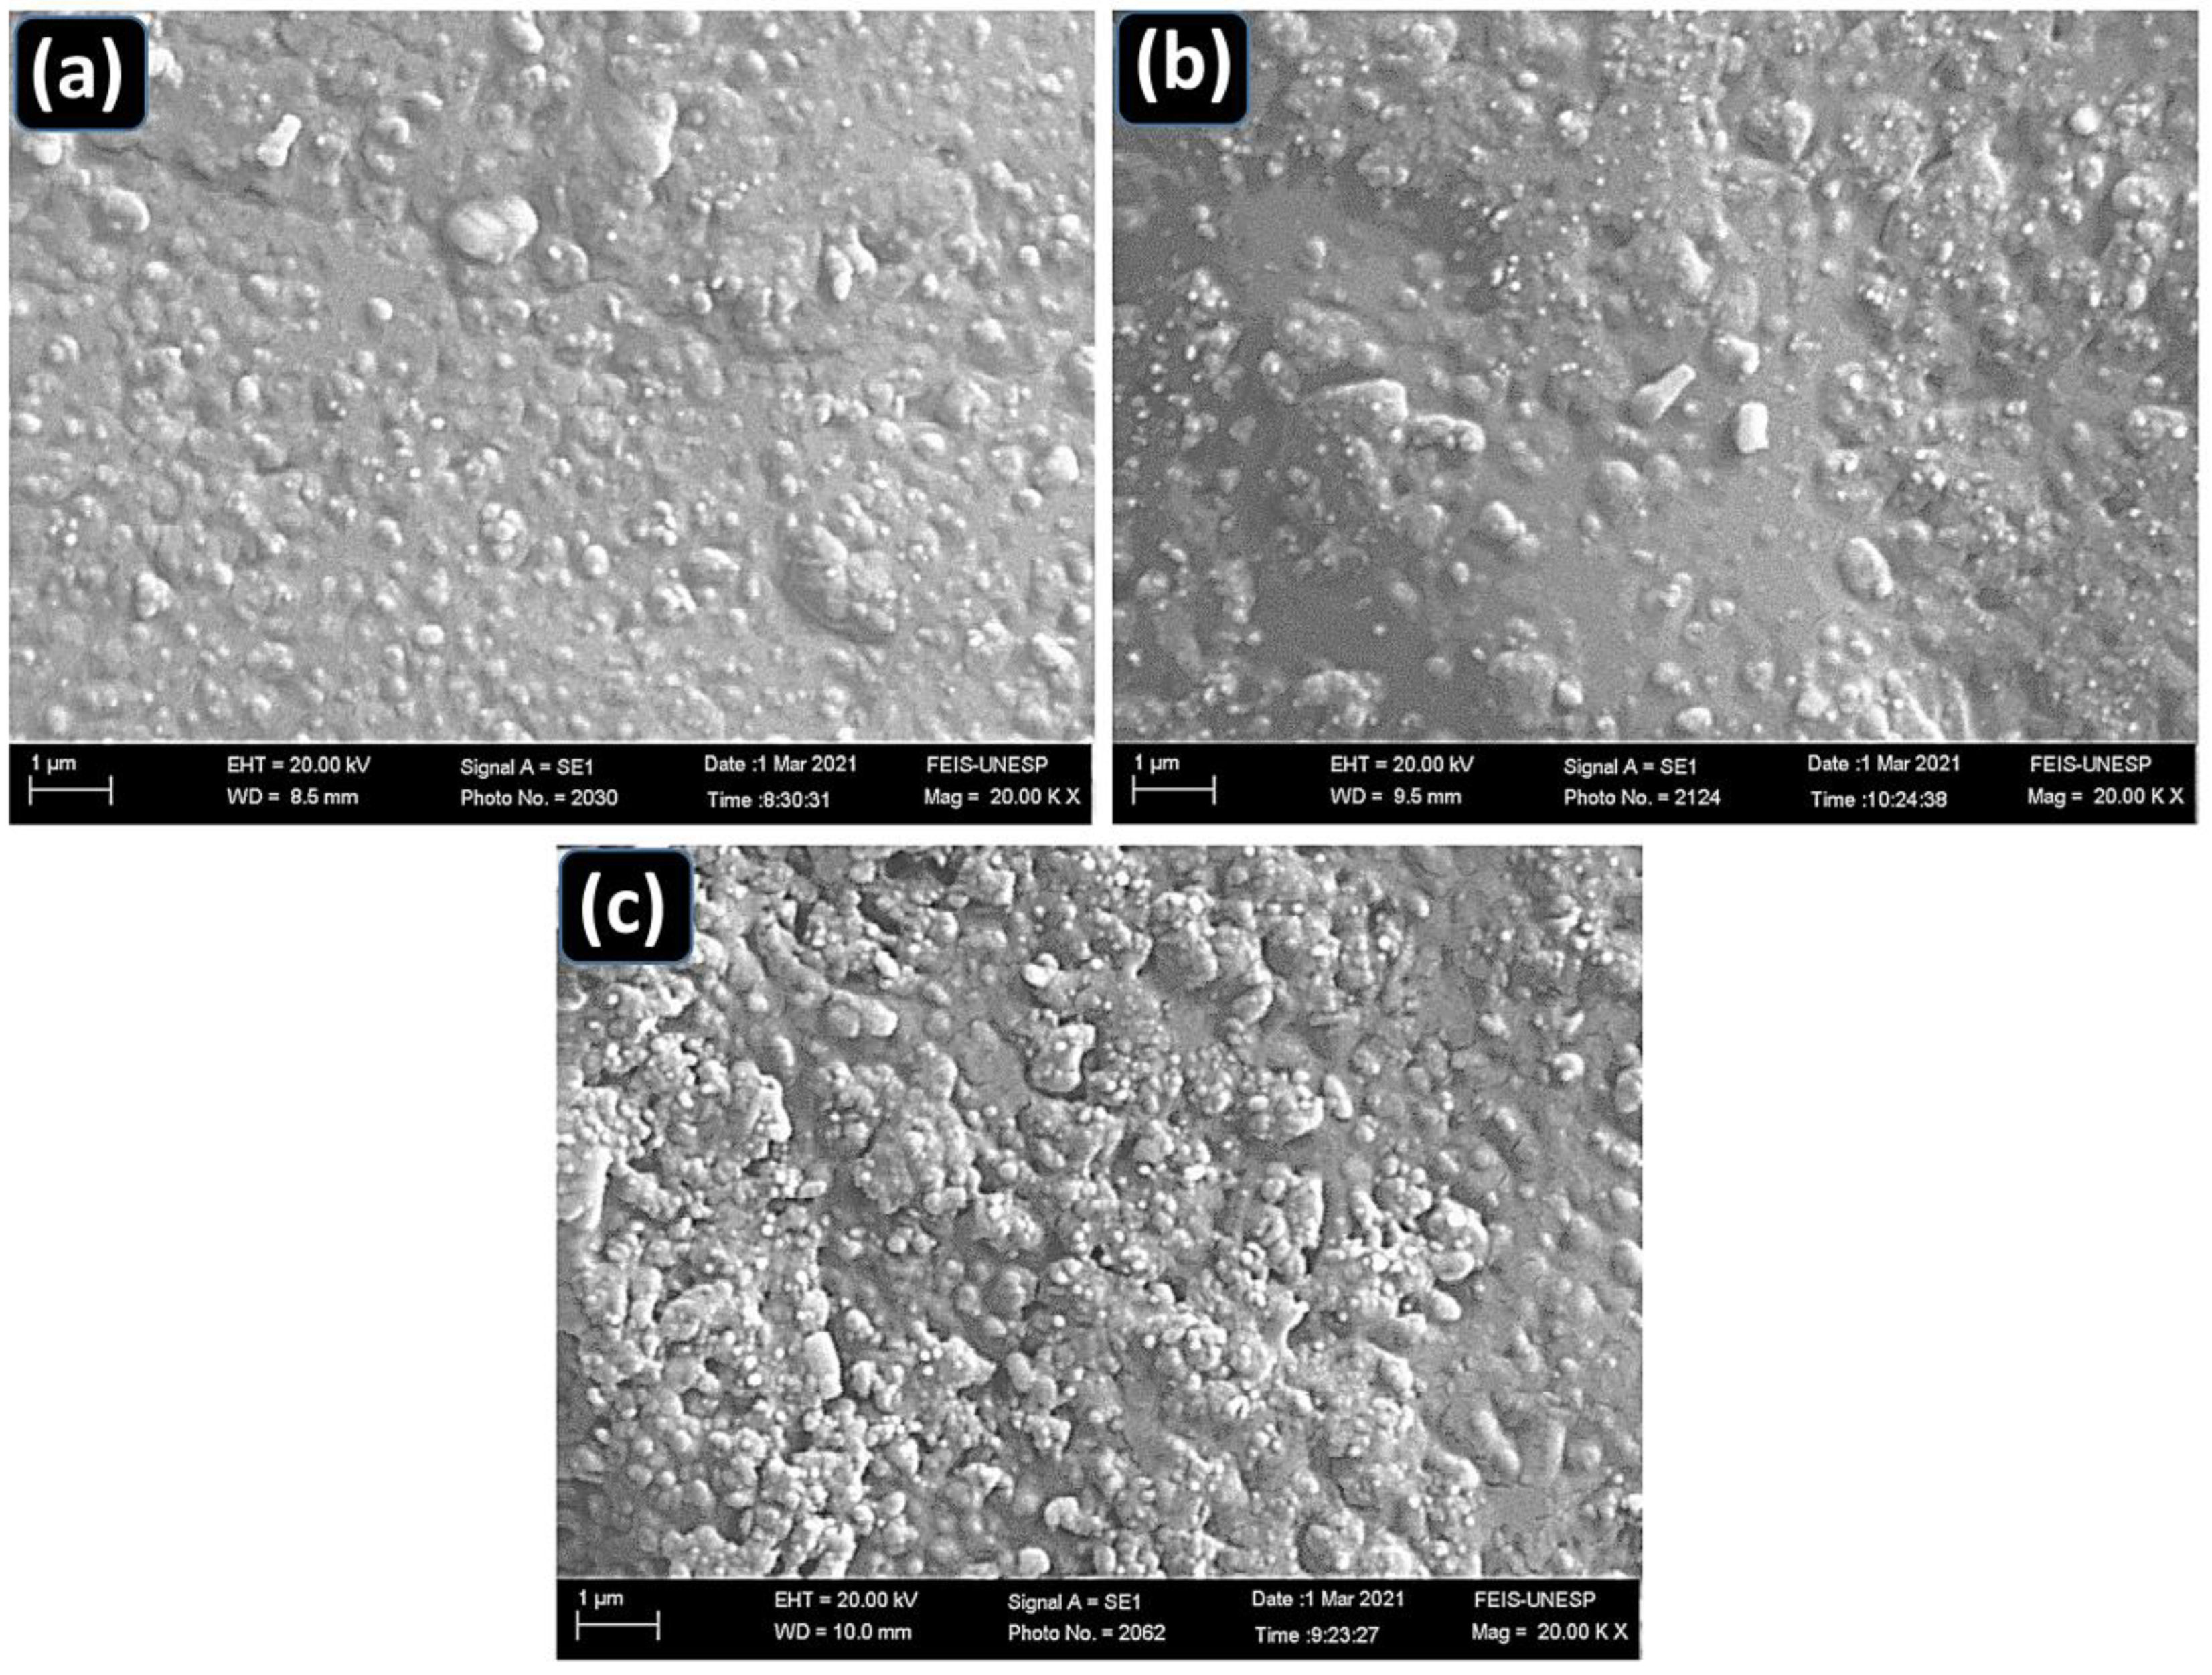
3.5. Morphological Analysis

SEM microimages of the cryofractured cross-sectional surfaces of the VNR/MWCNT nanocomposite specimens with 1, 3 and 5 phr of MWCNTs are shown in Figure 3a, 3b, and 3c, respectively. According to Figure 3, all the VNR/MWCNT nanocomposite specimens have rougher surfaces, which become rougher with gradual MWCNT insertion. Considering that the fillers are encapsulated by the VNR matrix, it can be concluded that there is good interaction between the MWCNTs and the NR. In addition, the images demonstrate a homogeneous dispersion of MWCNTs within the VNR matrix, a result that is in accordance with the analyses of the degree of dispersion of MWCNTs within the VNR matrix.

3.6. Specific Mass, Hardness (Shore A), and Abrasion Resistance Analysis

The results of the specific mass tests, hardness tests using the Shore A scale, and abrasion loss tests of the VNR/MWCNT nanocomposites with different concentrations of MWCNTs are shown in Figure 4. According to our findings, the addition of MWCNTs resulted in a linear increase in specific mass, although the difference between the pure VNR sample and the VNR/MWCNT nanocomposite with the highest filler concentration (5 phr) is only 0.03 g cm−3. In addition, the hardness of the VNR/MWCNT nanocomposites increased with an increase in the number of MWCNTs added, as the dispersion of MWCNTs in the VNR matrix makes the composites more rigid. At a microscopic level, the interaction between the MWCNTs and the VNR matrix restricts the mobility of the polymer chains [63].
Figure 4 illustrates the values associated with abrasion loss for VNR/MWCNT nanocomposites with different MWCNT fillers. During this test, the material was evaluated for its resistance to friction-induced wear. Although the VNR/MWCNT nanocomposites demonstrated good abrasion resistance, the addition of MWCNTs reduced the resistance in the nanocomposite specimens with 4 and 5 phr of MWCNTs. A possible explanation for the observed behavior can be the agglomeration of MWNCTs within the VNR/MWCNT4 and VNR/MWCNT5 resulting in tension points that facilitate the wear of the material under friction conditions.

3.7. Mechanical Analysis

The stress–strain curves of the VNR/MWCNT nanocomposite specimens with different MWCNT fillers are shown in Figure 5. In Figure 5, the stress–strain curves of the VNR/MWCNT nanocomposite specimens exhibit typical properties related to elastomeric materials; that is, high elasticity is reflected in high strain at the break (εatbreak) and high stress at the break (σatbreak). In Figure 5, it is evident that increasing the concentration of MWCNTs in the NVR matrix impacts the mechanical properties of the VNR/MWCNT nanocomposites. As the concentration of MWCNT in the VNR/MWCNT nanocomposite increases, the εatbreak value decreases, indicating that the material has become more rigid [64]. Increasing MWCNT concentration, however, does not produce significant variations in the σatbreak value. According to the stress–strain curves of all the VNR/MWCNT nanocomposite specimens, the MWCNTs efficiently acted as reinforcement, absorbing part of the mechanical stress imposed on the VNR matrix.
In a study of NR-based nanocomposites reinforced with carbon black (CB) and MWCNTs, Shahamatifard et al. observed the same behavior, mainly in regard to tensile strength (TS) for different concentrations of MWCNTs [31]. According to the authors, a reduction in TS may be due to poor dispersion of the filler, particularly in samples containing 5 phr of MWCNT. In a study conducted by Liu et al., the dispersion, electrical conductivity, mechanical properties, and resistance–strain response behaviors of MWCNT/NR composites were investigated using different processing conditions [65]. In terms of tensile properties, the authors found that stress increases with strain and MWCNT content, while tensile strain decreases with MWCNT content
As shown in Table 4, the mechanical parameters of the stress–strain curves extracted from Figure 5 are as follows: tensile strength at 100% (σ100%), 300% (σ300%), and 500% (σ500%) stress; σat break; and εat break.
The incorporation of MWCNTs into the VNR matrix resulted in a gradual increase in σ100%, σ300%, and σ500% values for all the specimens. However, when considering the statistical error, it appears that the presence of fillers does not significantly change the σat break values in comparison to all the nanocomposite specimens. Alternatively, the εat break values were reduced. There is a positive effect of the reinforcing properties of the MWCNTs, as well as the restriction in the mobility of the VNR polymer chains as a result of the interaction between the filler and matrix, resulting in stiffening of the VNR/MWCNT nanocomposite specimens. There was a significant increase in the tensile strength of the VNR/MWCNT nanocomposite specimens because of good adhesion between the VNR and the MWCNTs. As a result of this behavior, the MWCNTs were utilized as reinforcement agents within the VNR matrix, resulting in an improvement in the mechanical properties of the nanocomposites.

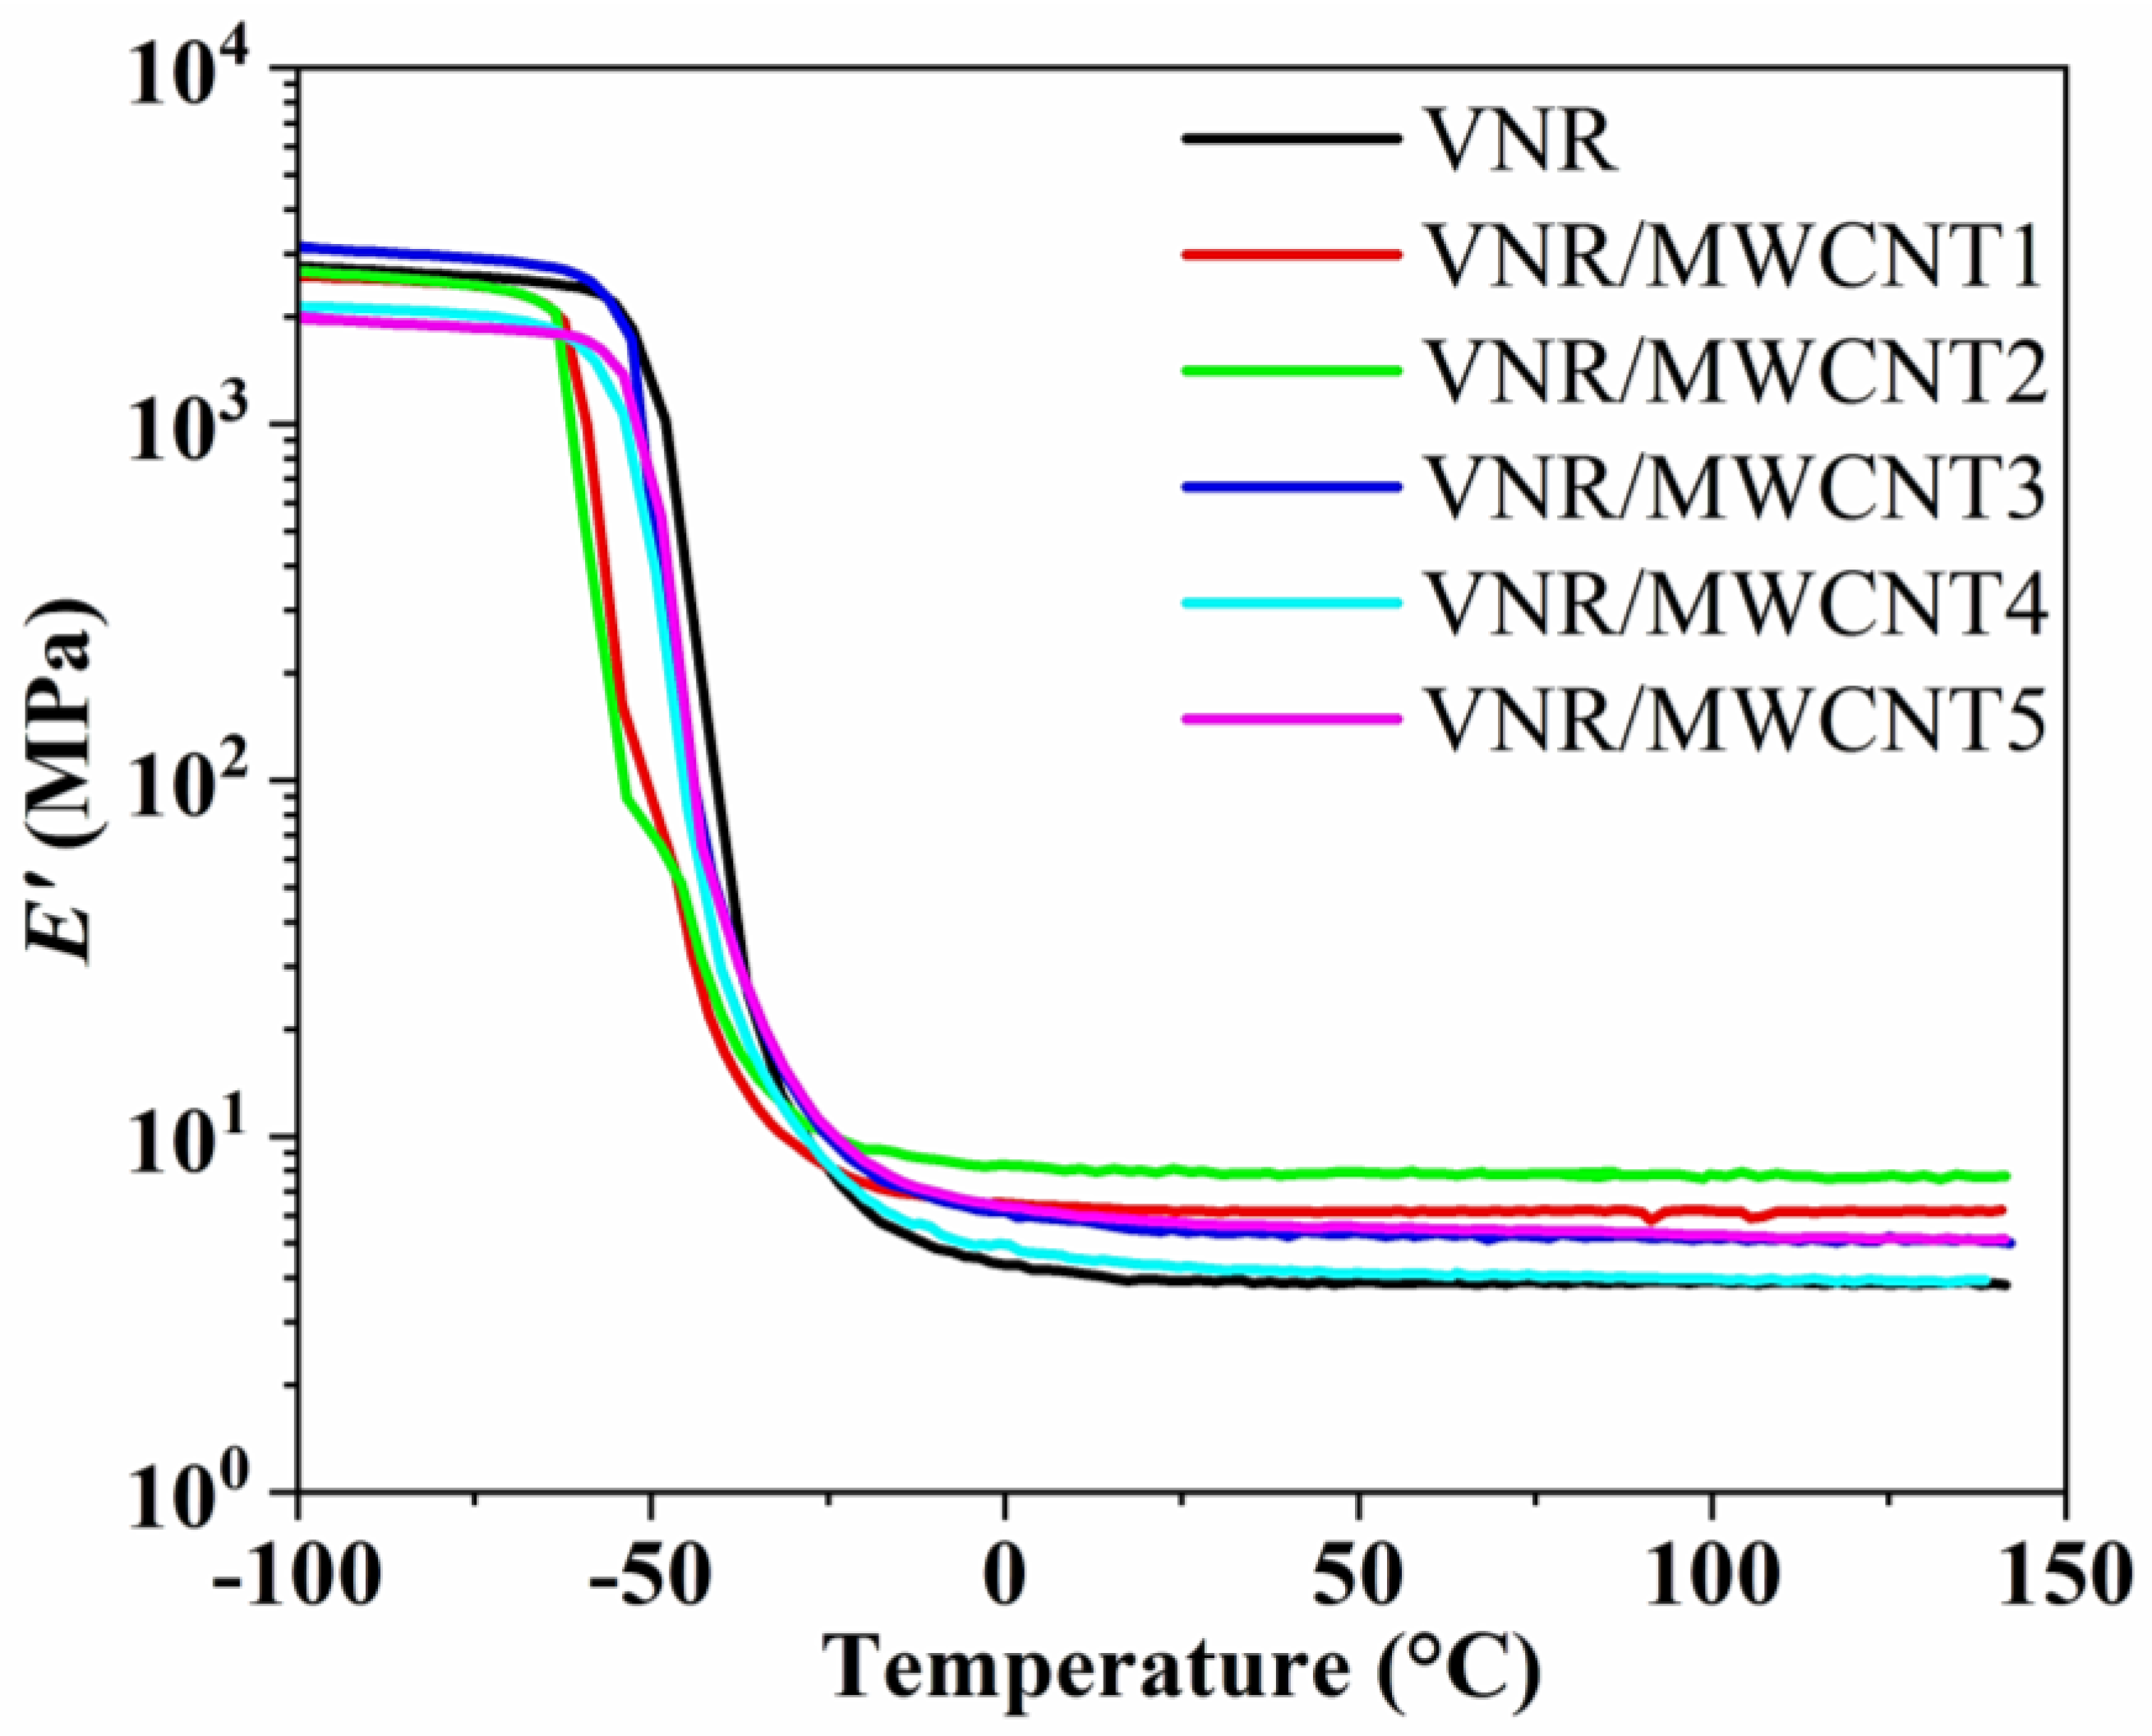
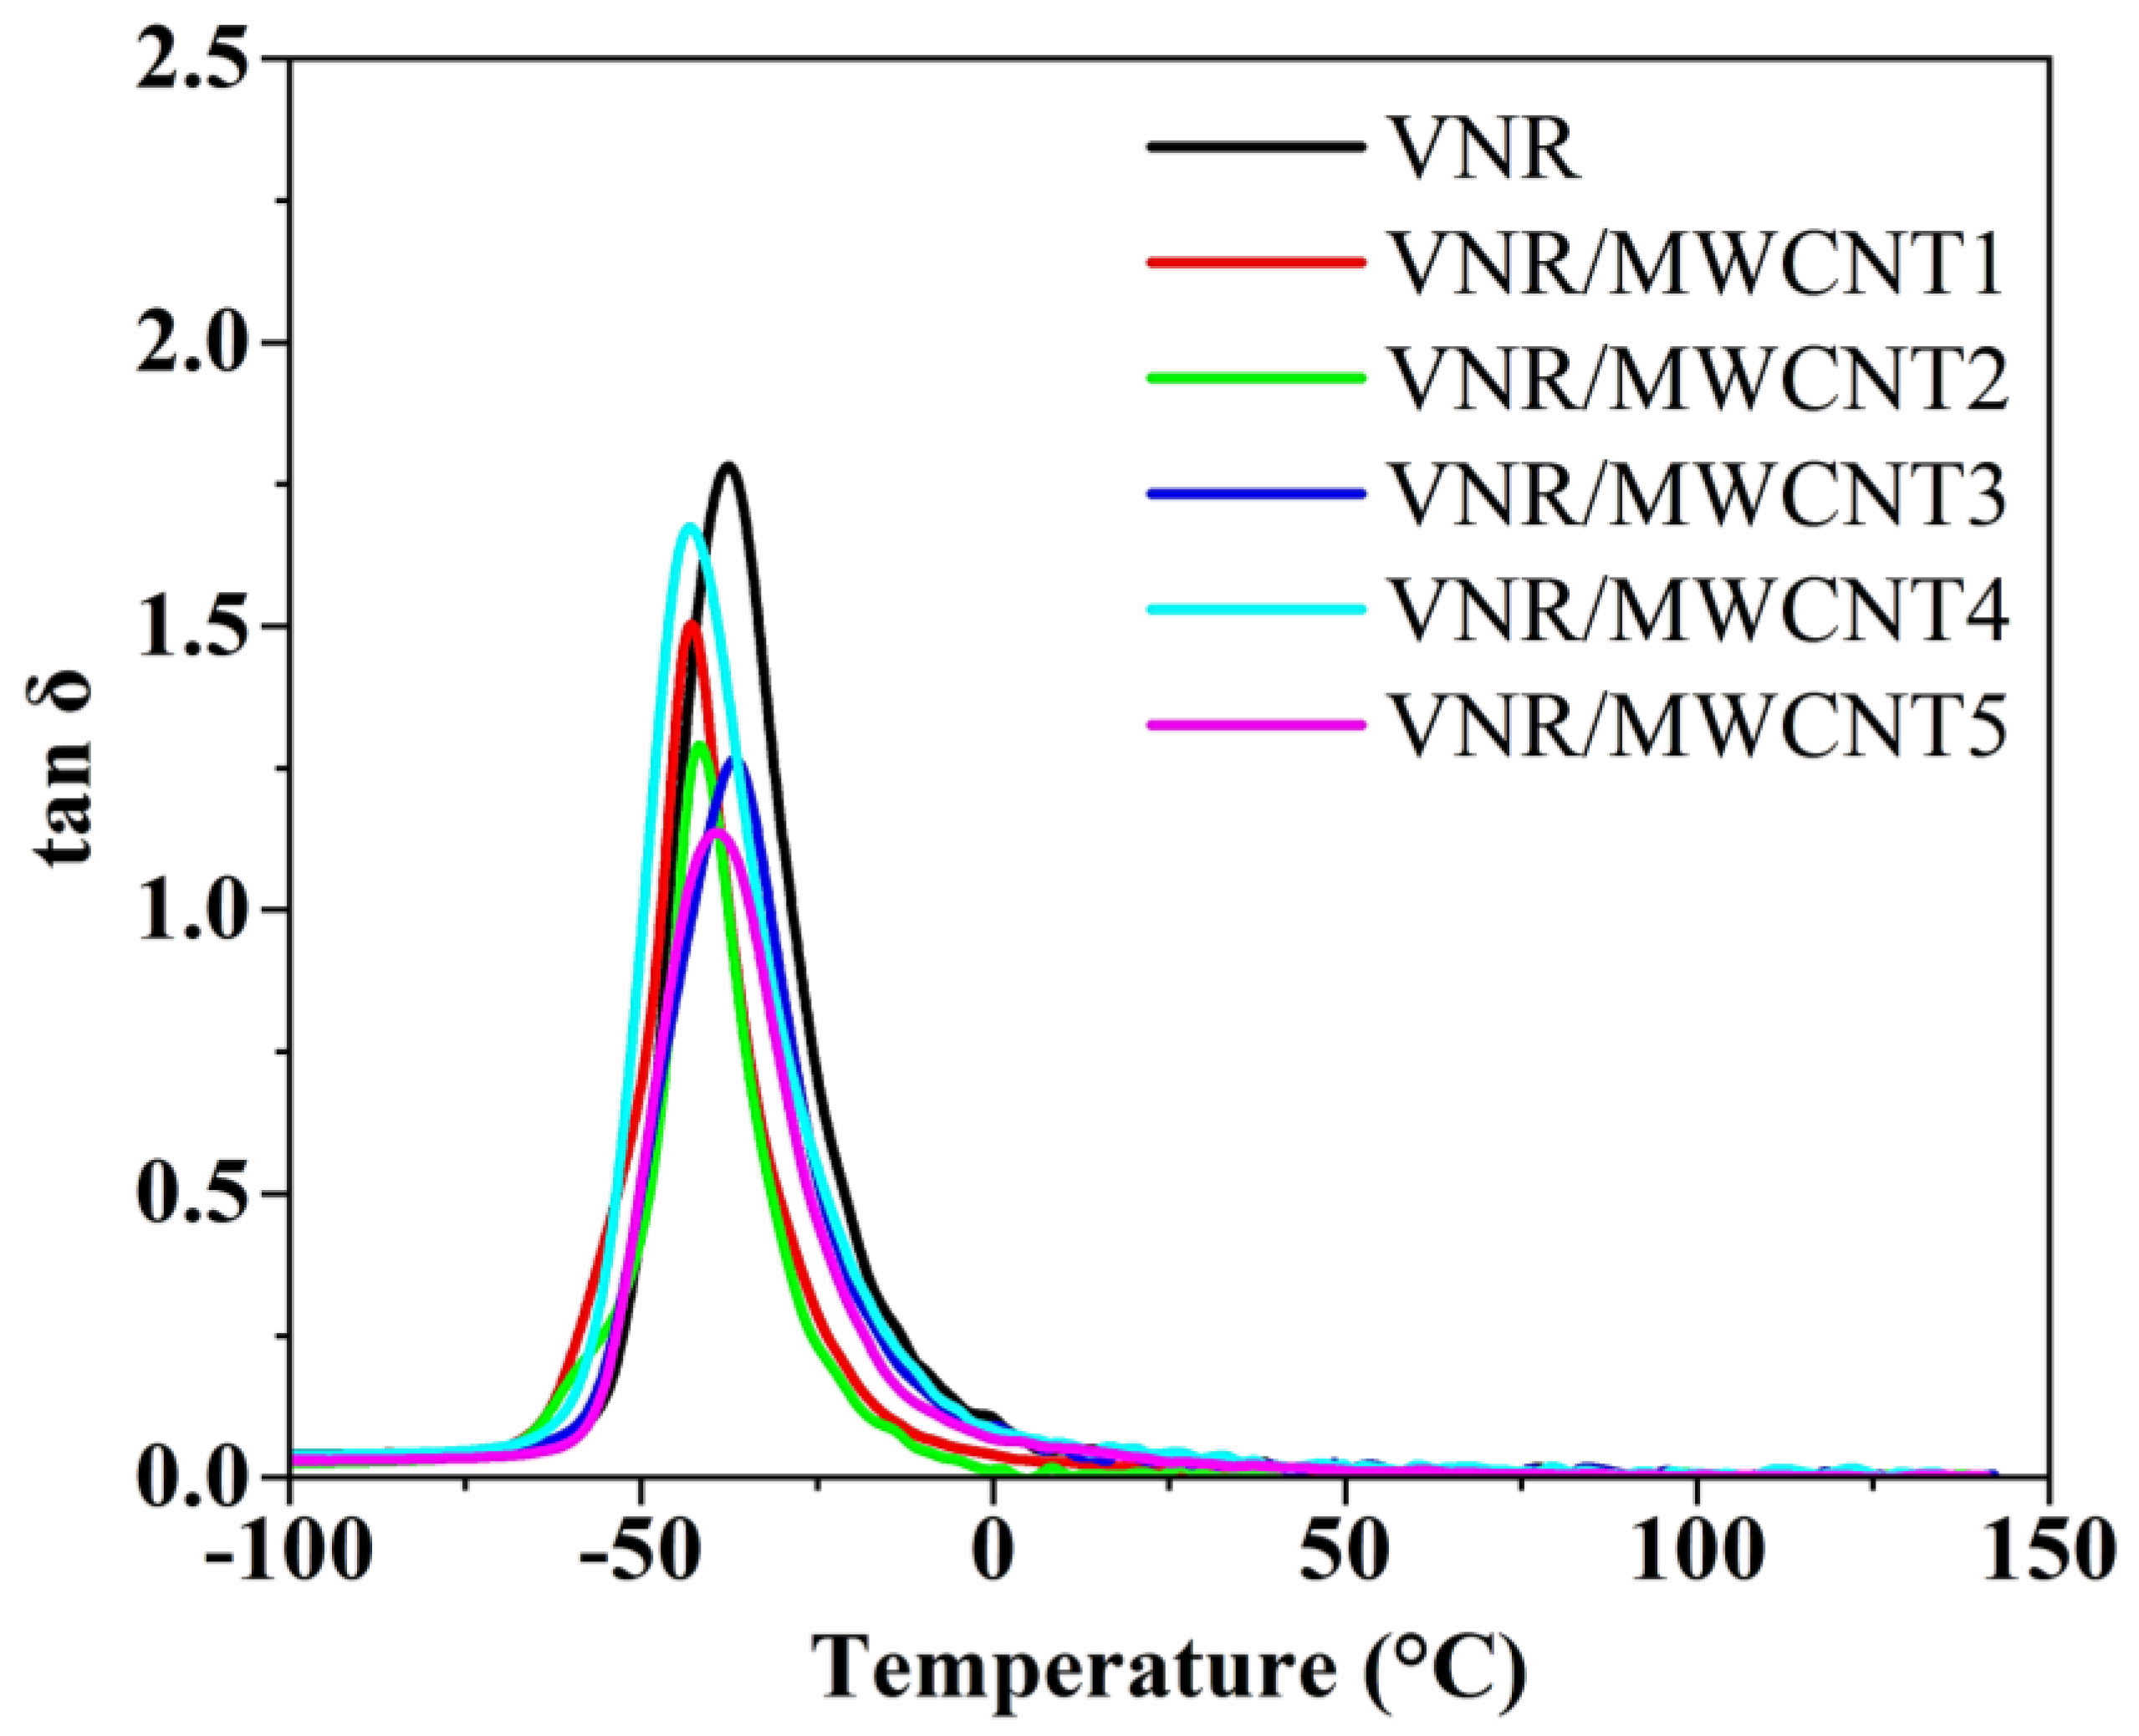
3.8. Dynamic Mechanical Analysis (DMA)

Figure 6 shows the storage modulus (E’) curves for the VNR/MWCNT nanocomposite samples as a function of temperature. In this study, the dynamic mechanical properties of the VNR-based nanocomposites with different MWCNT particle concentrations for a given temperature range were investigated using this technique. In all the VNR/MWCNT nanocomposite samples, a plateau was observed between −100 °C and −45 °C corresponding to the glassy state. A plateau can be observed in the E’ modulus curve due to the mechanical energy stored in the glassy region due to the restriction of the movement of the VNR molecular chains. VNR/MWCNT nanocomposites exhibit elastic moduli values approaching 2500 MPa at the plateau corresponding to the glassy region.
For all the specimens studied, the E’ modulus value decreases sharply as the temperature increases; i.e., between −65 °C and −20 °C is the temperature region where the glassy-to-rubbery transition occurs in the VNR-based specimens. All nanocomposites exhibit an abrupt drop in E’ modulus in this temperature range, which is referred to as the glassy transition region. This glassy-to-rubbery transition is attributed to the increase in the degrees of freedom of the polymer chains, that is, the increase in mobility of the VNR chains relative to each other, as well as the dissipation of mechanical energy during the cyclic deformation and heating cycle of the specimens. As the VNR/MWCNT nanocomposites reached −20 °C, due to the relaxation and greater mobility of the VNR chains, their consistency changed from rigid to soft and malleable, indicating rubbery properties. The E’ modulus of all the VNR/MWCNT nanocomposites in this region is greater than the E’ modulus of neat VNR, demonstrating the reinforcing effect of MWCNTs on VNR.
This glass-to-rubber transition region is best seen as a strong peak in the tan δ versus temperature curves shown in Figure 7. According to Figure 7, the strong peak observed in the graph of tan δ versus temperature is related to the glass transition temperature (Tg). In general, the mechanical loss factor or tan δ is considered to be an indicator of the damping properties of polymeric materials. As a result, it can serve as a means of identifying an equilibrium between elastic and viscous characteristics [12,66]. The value of tan δ of a composite may be influenced by a number of factors, including the type of filler and its distribution, as well as the interaction between the phases [12,67]. There is an intense peak associated with the Tg value for all the VNR/MWCNT specimens (Figure 7), also known as α relaxation. Generally, materials with a high loss factor have a high capacity for dissipation of energy, while materials with a low loss factor are more efficient at storing energy rather than dissipating it [68].
According to Figure 7, the amplitudes of the tan δ curves decrease with an increasing filler content, making the composites less elastic than the reference neat VNR. As a result of the strong interaction between the MWCNTs and the VNR matrix, the nanocomposites with MWCNTs exhibit a decrease in elasticity. In all the VNR/MWCNT nanocomposites, maximum thermal dissipation occurs at a greater intensity of around −40 °C, as shown by the peaks of the tan δ curves.

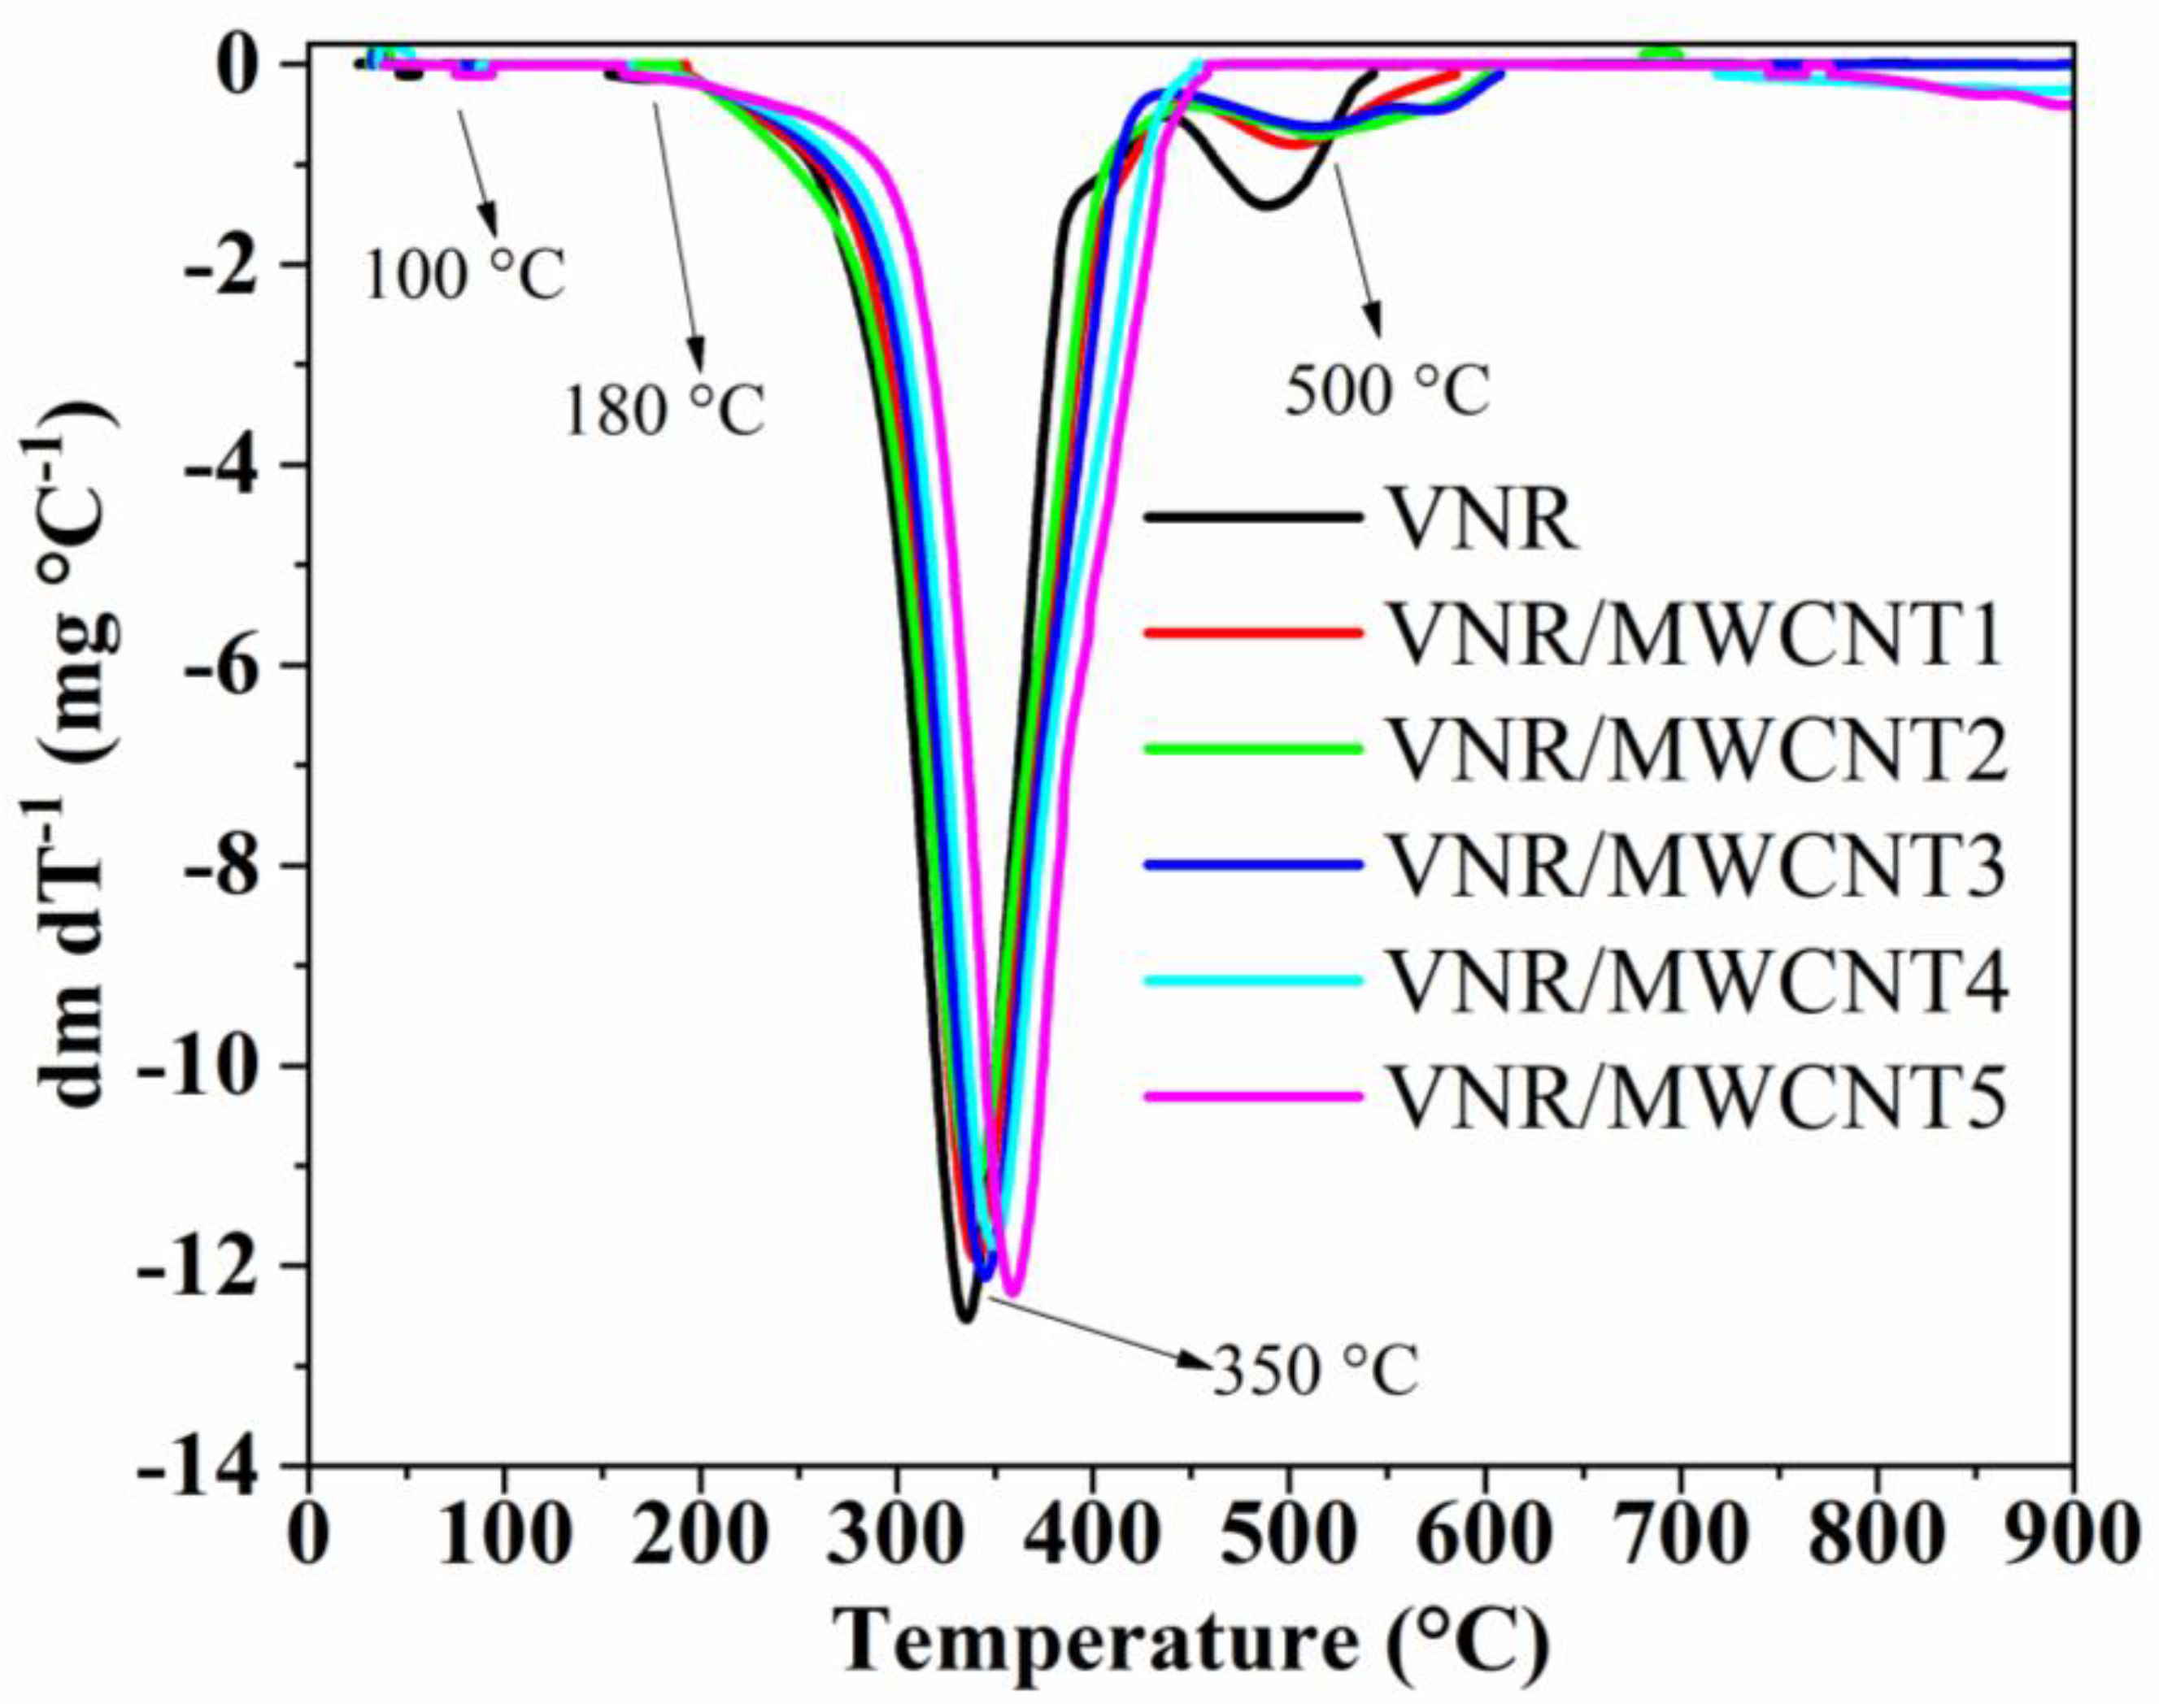
3.9. Thermogravimetric Analysis (TGA)

The thermogravimetric curves of the VNR/MWCNT nanocomposite specimens are shown in Figure 8. Figure 8 illustrates the loss of mass for each specimen as a function of temperature. Consequently, it is possible to identify the temperature range in which mass loss events occur. In the first event, moisture is lost from the VNR/MWCNT nanocomposites and pure VNR at 100 °C, representing approximately 1% of the mass loss. At approximately 180 °C, the second event occurs for all specimens and is related to volatile compounds with low thermal stability, such as fatty acids and non-rubber components [69]. It can be observed that all the VNR/MWCNT specimens and neat VNR present the same thermal behavior, i.e., only one main thermal event of mass loss. There is a third event, of greater intensity, that occurs between 350 and 400 °C, corresponding to 75–78% of the mass loss, which is due to the degradation of the isoprene chain in natural rubber [70]. A shoulder on the DTG curve can be observed as the last event at 500 °C (Figure 9), which represents 14–16% of the mass loss. This is a result of less accessible regions of the VNR that were not decomposed during the main event, which required more thermal energy to decompose [71]. A residual mass of less than 6% is composed of inorganic materials, including zinc used in the curing process.

3.10. Direct Current (dc) Electrical Conductivity Analysis

In this setting, it is essential to understand the conduction processes and phenomena that govern electrical conductivity in conductive polymer nanocomposites in order to develop new materials for desired applications. For example, when the concentration (p) of conductive nanofiller, such as MWCNTs, reaches the percolation threshold (pc), a conductive path forms, and the electrical conductivity of the nanocomposite increases significantly [72,73,74,75]. An abrupt increase in the dc electrical conductivity (σdc) of a nanocomposite occurs when concentrations of conductive nanofillers reach the percolation threshold [72,73,74]. The percolation threshold is defined as the volumetric fraction of conductive fillers that is necessary to form a continuous conductive path in a nanocomposite [72,73,74]. On the other hand, when the concentration of conductive fillers is below the percolation threshold, there are no conductive paths between the fillers in the matrix, resulting in an σdc value similar to that of an insulating polymer matrix. Contrary to this, the σdc value can increase dramatically above the percolation threshold because of the interconnection between the conductive paths, enabling filler carrier to flow efficiently and increasing the σdc of nanocomposites closer to the conductive nanofillers [72,73,74].
As shown in Table 5, the σdc values of VNR/MWCNT nanocomposites with different phr concentrations of MWCNTs are presented. The results in Table 5 indicate that the dispersion of MWCNTs in 1 phr had little impact on the σdc value of the nanocomposite; i.e., both the neat VNR and VNR/MWCNT samples presented σdc values in the range of 10−14 S/m. Nevertheless, when 2 phr of MWCNTs was added to VNR matrix, the σdc value of the nanocomposite increased by two orders of magnitude compared to neat VNR. A significant increase in the σdc value of the VNR/MWCNT nanocomposite was observed when the MWCNT concentration reached 3 phr. It is evident from the abrupt increase in the electrical conductivity of the VNR/MWCNT nanocomposite with 3 phr of MWCNTs that the percolation region is close to this concentration. In other words, it is in this region that electrical percolation takes place, where the MWCNTs form an uninterrupted conductive path in the nanocomposite that allows filler particles to move when they are subject to an external electric field. The σdc value at these MWCNT concentrations is six orders of magnitude greater than that for neat VNR, as can be observed in Table 5. In comparison with neat VNR, the σdc values of the nanocomposite samples of VNR/MWCNTs with 4 and 5 phr of MWCNTs were eight and ten orders of magnitude higher, respectively. It is possible that several uninterrupted paths formed within the nanocomposite as a result of the fact that samples with concentrations of 4 and 5 phr of MWCNTs are above the percolation threshold.
Thus, we have shown that a small mass fraction of MWCNTs can have a significant impact on the mechanical, thermal, and electrical properties of VNR/MWCNT nanocomposites, making them ideal for use as sensors and anti-static protection blankets.

4. Conclusions

This study successfully developed VNR-based nanocomposites reinforced with MWCNTs, demonstrating significant improvements in rheological, thermal, mechanical, and electrical properties. Rheometric tests showed enhanced vulcanization following MWCNT addition, improving parameters like torque and scorch time. Strong interfacial bonding between MWCNTs and the VNR, confirmed using the Lorenz–Park method, led to improved mechanical strength, while SEM revealed uniform MWCNT dispersion.
Mechanical tests showed increased rigidity, strength, and wear resistance with higher MWCNT concentrations. The tensile test revealed that increasing the concentration of MWCNTs in the VNR/MWCNT nanocomposite reduced the strain at the break, whereas it increased the stress at the break, demonstrating the positive effect and reinforcing properties of the MWCNTs in the VNR matrix. Based on thermal analysis, all the VNR/MWCNT nanocomposite specimens exhibit the same thermal profile as neat VNR, with the main mass loss occurring between 350 and 400 °C due to the degradation of the isoprene chain in the VNR. The thermal stability of the VNR-based nanocomposites was not affected by MWCNT dispersion. DMA results revealed a transition from rigid to rubbery states in the −65 °C to −20 °C range.
As determined by DC electrical analysis, when 5 phr of MWCNTs are dispersed in the NRV/MWCNT nanocomposite, there is an increase of ten orders of magnitude in electrical conductivity compared to that of pure NRV, and the percolation threshold is near 3 phr.
These findings demonstrate the potential of MWCNT-reinforced VNR nanocomposites for advanced applications such as flexible electronics and sensors, offering superior performance across multiple properties.

Author Contributions

Conceptualization, D.S.M., C.T.H., R.J.S., and M.J.S.; methodology, D.S.M., C.T.H., G.R.T., R.J.S., and M.J.S.; validation, D.S.M., C.T.H., G.R.T., J.A.M., C.R.C., A.E.J., R.J.S., and M.J.S.; formal analysis, D.S.M., C.T.H., A.E.J., R.J.S., and M.J.S.; investigation, D.S.M., C.T.H., G.R.T., J.A.M., C.R.C., A.E.J., R.J.S., and M.J.S.; resources, R.J.S. and M.J.S.; data curation, D.S.M., C.T.H., J.A.M., C.R.C., A.E.J., and M.J.S.; writing—original draft preparation, D.S.M., C.T.H., G.R.T., J.A.M., C.R.C., A.E.J., R.J.S., and M.J.S.; writing—review and editing, C.T.H., J.A.M., C.R.C., A.E.J., R.J.S., and M.J.S.; visualization, C.T.H., J.A.M., R.J.S., and M.J.S.; supervision, R.J.S. and M.J.S.; project administration, M.J.S.; funding acquisition, M.J.S. All authors have read and agreed to the published version of the manuscript.

Funding

This research was funded by Sao Paulo State Funding Agency (FAPESP), grant number grant 2017/19809-5.

Institutional Review Board Statement

Not applicable.

Informed Consent Statement

Not applicable

Data Availability Statement

The data presented in this study are available upon request from the corresponding author.

Acknowledgments

The authors acknowledge the Pró-Reitoria de Pesquisa (PROPE-UNESP) for the financial support provided.

Conflicts of Interest

The authors declare no conflicts of interest.

References

  1. Thongchom, C.; Refahati, N.; Saffari, P.R.; Saffari, P.R. An Experimental Study on the Effect of Nanomaterials and Fibers on the Mechanical Properties of Polymer Composites. Buildings 2022, 12, 7. [Google Scholar] [CrossRef]
  2. Sapuan, S.M.; Nurazzi, N.M.; Shazleen, S.S.; Norrrahim, M.N.F.; Foong Ng, L.Y.; Sabaruddin, F.A.; Padzil, F.N.M. Production and Performance Properties of Composites Reinforced with Environmentally Benign Nanomaterials. In Synthetic and Natural Nanofillers in Polymer Composites; Elsevier: Amsterdam, The Netherlands, 2023; pp. 143–171. [Google Scholar]
  3. Idumah, C.I.; Obele, C.M. Understanding Interfacial Influence on Properties of Polymer Nanocomposites. Surf. Interfaces 2021, 22, 100879. [Google Scholar] [CrossRef]
  4. Saleh, T.A.; Shetti, N.P.; Shanbhag, M.M.; Raghava Reddy, K.; Aminabhavi, T.M. Recent Trends in Functionalized Nanoparticles Loaded Polymeric Composites: An Energy Application. Mater. Sci. Energy Technol. 2020, 3, 515–525. [Google Scholar] [CrossRef]
  5. Fakhru, A.; Atieh, M.A.; Girun, N.; Chuah, T.G. Effect of Multi-Wall Carbon Nanotubes on the Mechanical Properties of Natural Rubber. Compos. Struct. 2006, 75, 496–500. [Google Scholar] [CrossRef]
  6. Atieh, M.A.; Girun, N.; Mahdi, E.S.; Tahir, H.; Guan, C.T.; Alkhatib, M.F.; Ahmadun, F.R.; Baik, D.R. Effect of Multi-Wall Carbon Nanotubes on the Mechanical Properties of Natural Rubber. Fuller. Nanotub. Carbon Nanostructures 2006, 14, 641–649. [Google Scholar] [CrossRef]
  7. Sethulekshmi, A.S.; Saritha, A.; Joseph, K. International Journal of Biological Macromolecules A Comprehensive Review on the Recent Advancements in Natural Rubber Nanocomposites. Int. J. Biol. Macromol. 2022, 194, 819–842. [Google Scholar] [CrossRef]
  8. Al-Sehemi, A.G.; Al-Ghamdi, A.A.; Dishovsky, N.T.; Radev, L.N.; Mihailova, I.K.; Malinova, P.A.; Atanasov, N.T.; Atanasova, G.L. Natural Rubber–Based Composites Filled with Bioglasses from a CaO-SiO2-P2O5-Ag2O System. Effect of Ag2O Concentration in the Filler on Composite Properties. Polym. Adv. Technol. 2020, 31, 574–588. [Google Scholar] [CrossRef]
  9. Andrade, K.L.; Ramlow, H.; Floriano, J.F.; Acosta, E.D. Latex and Natural Rubber: Recent Advances for Biomedical Applications. Polimeros 2022, 32, e2022015. [Google Scholar] [CrossRef]
  10. Guerra, N.B.; Sant’Ana Pegorin, G.; Boratto, M.H.; de Barros, N.R.; de Oliveira Graeff, C.F.; Herculano, R.D. Biomedical Applications of Natural Rubber Latex from the Rubber Tree Hevea Brasiliensis. Mater. Sci. Eng. C 2021, 126, 112126. [Google Scholar] [CrossRef]
  11. Lima, L.R.M.; Caetano, G.F.; Soares, V.O.; Santos, R.J.; Malmonge, J.A.; Silva, M.J.; Yarin, A.L. Evaluation of Tensile, Thermal, and Biological Properties of Natural Rubber-Based Biocomposite with Biosilicate and 45S5-K Bioglass. Appl. Polym. 2023, 140, e53894. [Google Scholar] [CrossRef]
  12. Silva, M.J.; Dias, Y.J.; Zaszczyńska, A.; Robles, J.R.; Abiade, J.; Kowalczyk, T.; Kołbuk, D.; Sajkiewicz, P.Ł.; Yarin, A.L. Biocomposite-based Fibrous Scaffolds of Natural Rubber/Polyhydroxybutyrate Blend Reinforced with 45S5 Bioglass Aiming at Biomedical Applications. Polym. Compos. 2024, 45, 1107–1127. [Google Scholar] [CrossRef]
  13. Sousa, E.A.; Silva, M.J.; Sanches, A.O.; Soares, V.O.; Job, A.E.; Malmonge, J.A. Mechanical, Thermal, and Morphological Properties of Natural Rubber/45S5 Bioglass® Fibrous Mat with Ribbon-like Morphology Produced by Solution Blow Spinning. Eur. Polym. J. 2019, 119, 1–7. [Google Scholar] [CrossRef]
  14. Silva, M.J.; Dias, Y.J.; Yarin, A.L. Electrically-Assisted Supersonic Solution Blowing and Solution Blow Spinning of Fibrous Materials from Natural Rubber Extracted from Havea Brasilienses. Ind. Crops Prod. 2023, 192, 116101. [Google Scholar] [CrossRef]
  15. Cornish, K.; Xie, W. Natural Rubber Biosynthesis in Plants: Rubber Transferase, 1st ed.; Elsevier Inc.: Amsterdam, The Netherlands, 2012; Volume 515, ISBN 9780123942906. [Google Scholar]
  16. Abubakre, O.K.; Medupin, R.O.; Akintunde, I.B.; Jimoh, O.T.; Abdulkareem, A.S.; Muriana, R.A.; James, J.A.; Ukoba, K.O.; Jen, T.C.; Yoro, K.O. Carbon Nanotube-Reinforced Polymer Nanocomposites for Sustainable Biomedical Applications: A Review. J. Sci. Adv. Mater. Devices 2023, 8, 100557. [Google Scholar] [CrossRef]
  17. Anzar, N.; Hasan, R.; Tyagi, M.; Yadav, N.; Narang, J. Carbon Nanotube—A Review on Synthesis, Properties and Plethora of Applications in the Fi Eld of Biomedical Science. Sens. Int. 2020, 1, 100003. [Google Scholar] [CrossRef]
  18. Yadav, K.K.; Khan, N.; Jha, M. Application of Surface Modified Carbon Nanotubes in Energy. In Surface Modified Carbon Nanotubes Volume 2: Industrial Applications; American Chemical Society: Washington, DC, USA, 2022; pp. 101–119. [Google Scholar]
  19. Saifuddin, N.; Raziah, A.Z.; Junizah, A.R. Carbon Nanotubes: A Review on Structure and Their Interaction with Proteins. J. Chem. 2013, 2013, 676815. [Google Scholar] [CrossRef]
  20. Chang, T.E.; Jensen, L.R.; Kisliuk, A.; Pipes, R.B.; Pyrz, R.; Sokolov, A.P. Microscopic Mechanism of Reinforcement in Single-Wall Carbon Nanotube/Polypropylene Nanocomposite. Polymers 2005, 46, 439–444. [Google Scholar] [CrossRef]
  21. Li, F.; Cheng, H.M.; Bai, S.; Su, G.; Dresselhaus, M.S. Tensile Strength of Single-Walled Carbon Nanotubes Directly Measured from Their Macroscopic Ropes. Appl. Phys. Lett. 2000, 77, 3161–3163. [Google Scholar] [CrossRef]
  22. Treacy, M.M.J.; Ebbesen, T.W.; Gibson, J.M. Exceptionally High Young’s Modulus Observed for Individual Carbon Nanotubes. Nature 1996, 381, 678–680. [Google Scholar] [CrossRef]
  23. Nurazzi, N.M.; Asyraf, M.R.M.; Khalina, A.; Abdullah, N.; Lee, C.L.; Aisyah, H.A.; Nor, M.; Norrrahim, F.; Ilyas, R.A.; Harussani, M.M.; et al. Nanotube-Reinforced Polymer Composite: An Overview. Polymers 2021, 13, 1047. [Google Scholar] [CrossRef]
  24. Kumar, A.; Sharma, K.; Rai, A. A Review on the Mechanical Properties of Polymer Composites Reinforced by Carbon Nanotubes and Graphene. Carbon Lett. 2021, 31, 149–165. [Google Scholar] [CrossRef]
  25. Jayalakshmy, M.S.; Mishra, R.K. Applications of Carbon-Based Nanofiller-Incorporated Rubber Composites in the Fields of Tire Engineering, Flexible Electronics and EMI Shielding; Elsevier Inc.: Amsterdam, The Netherlands, 2019; ISBN 9780128173428. [Google Scholar]
  26. Takeuchi, K.; Noguchi, T.; Ueki, H.; Niihara, K.; Sugiura, T.; Inukai, S.; Fujishige, M. Journal of Physics and Chemistry of Solids Improvement in Characteristics of Natural Rubber Nanocomposite by Surface Modi Fi Cation of Multi-Walled Carbon Nanotubes. J. Phys. Chem. Solids 2015, 80, 84–90. [Google Scholar] [CrossRef]
  27. Jose, T.; Moni, G.; Salini, S.; Jess, A.; Jacob, J.; George, S.C. Industrial Crops & Products Multifunctional Multi-Walled Carbon Nanotube Reinforced Natural Rubber Nanocomposites. Ind. Crops Prod. 2017, 105, 63–73. [Google Scholar] [CrossRef]
  28. Soundararaj, R.; Senthilvel, K.; Rathinam, N.; Prabu, B. Materials Today: Proceedings Experimental Studies on Mechanical Properties of Natural Rubber Carbon Black-Carbon Nanotube Composite. Mater. Today Proc. 2021, 38, 3077–3084. [Google Scholar] [CrossRef]
  29. Ponnamma, D.; Sadasivuni, K.K.; Strankowski, M.; Guo, Q.; Thomas, S. Synergistic Effect of Multi Walled Carbon Nanotubes and Reduced Graphene Oxides in Natural Rubber for Sensing Application. Soft Matter 2013, 9, 10343–10353. [Google Scholar] [CrossRef]
  30. Shahamatifard, F.; Rodrigue, D.; Park, K.W.; Frikha, S.; Mighri, F.; Rodrigue, D.; Park, K.W.; Frikha, S.; Mighri, F. Natural Rubber Nanocomposites: Effect of Carbon Black/Multi-Walled Carbon Nanotubes Hybrid Fillers on the Mechanical Properties and Thermal Conductivity. Polym. -Plast. Technol. Mater. 2021, 60, 1686–1696. [Google Scholar] [CrossRef]
  31. Shahamatifard, F.; Rodrigue, D.; Park, K.; Frikha, S.; Mighri, F. Surface Modification of MWCNT to Improve the Mechanical and Thermal Properties of Natural Rubber Nanocomposites. Can. J. Chem. Eng. 2023, 101, 1881–1896. [Google Scholar] [CrossRef]
  32. Wiroonpochit, P.; Keawmaungkom, S.; Chisti, Y.; Hansupalak, N. Multi-Response Optimization of Conductive Natural Rubber Films with Enhanced Properties and Reduced Materials Requirements. Ind. Crops Prod. 2024, 212, 118296. [Google Scholar] [CrossRef]
  33. ASTMD3578-19; Standard Specification for Rubber Examination Gloves. ASTM International: West Conshohocken, PA, USA, 2019.
  34. 60079-32-1; International Electrotechnical Commission. Explosive Atmospheres—Part 32-1: Electrostatic Hazards, Guidance, IEC/TS 60079-32-1 Ed 1.0. IEC: Geneva, Swtizerland, 2013; Volume 139, p. 51880.
  35. Sani, N.F.M.; Shuib, R.K.; Zainol, M.H.; Othman, N.; Tran, D.L. Effect of Multi-Walled Carbon Nanotubes Reinforcement on Self-Healing Performance of Natural Rubber. Pure Appl. Chem. 2024, 96. [Google Scholar] [CrossRef]
  36. De Carvalho, A.P.; Dos Santos, H.F.; Ribeiro, G.D.; Hiranobe, C.T.; Goveia, D.; Gennaro, E.M.; Paim, L.L.; Dos Santos, R.J. Sustainable Composites: Analysis of Filler–Rubber Interaction in Natural Rubber–Styrene–Butadiene Rubber/Polyurethane Composites Using the Lorenz–Park Method and Scanning Electron Microscopy. Polymers 2024, 16, 471. [Google Scholar] [CrossRef]
  37. Santos, R.J.; Hiranobe, C.T.; Dognani, G.; Silva, M.J.; Paim, L.L.; Cabrera, F.C.; Torres, G.B.; Job, A.E. Using the Lorenz–Park, Mooney–Rivlin, and Dynamic Mechanical Analysis Relationship on Natural Rubber/Leather Shavings Composites. J. Appl. Polym. Sci. 2021, 139, 51880. [Google Scholar] [CrossRef]
  38. Chowdhury, S.G.; Chanda, J.; Ghosh, S.; Pal, A.; Ghosh, P.; Bhattacharyya, S.K.; Mukhopadhyay, R.; Banerjee, S.S.; Das, A. Morphology and Physico-Mechanical Threshold of α-Cellulose as Filler in an E-SBR Composite. Molecules 2021, 26, 694. [Google Scholar] [CrossRef] [PubMed]
  39. He, F.; Yuan, T.; Li, C.; Sun, L.; Liao, S. Interfacial Interactions and Properties of Natural Rubber–Silica Composites with Liquid Natural Rubber as a Compatibilizer and Prepared by a Wet-compounding Method. J. Appl. Polym. Sci. 2018, 135, 46457. [Google Scholar] [CrossRef]
  40. Araújo, S.S.; Santos, G.T.A.; Tolosa, G.R.; Hiranobe, C.T.; Budemberg, E.R.; Cabrera, F.C.; Silva, M.J.d.; Paim, L.L.; Job, A.E.; Santos, R.J. dos Acai Residue as an Ecologic Filler to Reinforcement of Natural Rubber Biocomposites. Mater. Res. 2023, 26, e20220505. [Google Scholar] [CrossRef]
  41. Haseena, A.P.; Dasan, K.P.; Namitha, R.; Unnikrishnan, G.; Thomas, S. Investigation on Interfacial Adhesion of Short Sisal/Coir Hybrid Fibre Reinforced Natural Rubber Composites by Restricted Equilibrium Swelling Technique. Compos. Interfaces 2004, 11, 489–513. [Google Scholar] [CrossRef]
  42. Lorenz, O.; Parks, C.R. The Crosslinking Efficiency of Some Vulcanizing Agents in Natural Rubber. J. Polym. Sci. 1961, 50, 299–312. [Google Scholar] [CrossRef]
  43. Stelescu, M.D.; Airinei, A.; Bargan, A.; Fifere, N.; Georgescu, M.; Sonmez, M.; Nituica, M.; Alexandrescu, L.; Stefan, A. Mechanical Properties and Equilibrium Swelling Characteristics of Some Polymer Composites Based on Ethylene Propylene Diene Terpolymer (EPDM) Reinforced with Hemp Fibers. Materials 2022, 15, 6838. [Google Scholar] [CrossRef] [PubMed]
  44. Scaglia, F.; Mazzini, A.; Perretta, C.; Regattieri, G.; Marchetti, G. Industrial EP(D)M Rubber Production Process: A First-Principle Data-Driven Modelling Approach. Chem. Eng. Trans. 2023, 100, 163–168. [Google Scholar] [CrossRef]
  45. Zhan, Y.; Lago, E.; Santillo, C.; Del Río Castillo, A.E.; Hao, S.; Buonocore, G.G.; Chen, Z.; Xia, H.; Lavorgna, M.; Bonaccorso, F. An Anisotropic Layer-by-Layer Carbon Nanotube/Boron Nitride/Rubber Composite and Its Application in Electromagnetic Shielding. Nanoscale 2020, 12, 7782–7791. [Google Scholar] [CrossRef]
  46. Verdolotti, L.; Santillo, C.; Rollo, G.; Romanelli, G.; Lavorgna, M.; Liguori, B.; Lama, G.C.; Preziosi, E.; Senesi, R.; Andreani, C.; et al. MWCNT/RGO/Natural Rubber Latex Dispersions for Innovative, Piezo-Resistive and Cement-Based Composite Sensors. Sci. Rep. 2021, 11, 18975. [Google Scholar] [CrossRef]
  47. Costa, N.L.; Hiranobe, C.T.; Cardim, H.P.; Dognani, G.; Sanchez, J.C.; Carvalho, J.A.J.; Torres, G.B.; Paim, L.L.; Pinto, L.F.; Cardim, G.P.; et al. A Review of EPDM (Ethylene Propylene Diene Monomer) Rubber-Based Nanocomposites: Properties and Progress. Polymers 2024, 16, 1720. [Google Scholar] [CrossRef] [PubMed]
  48. Salaeh, S.; Thitithammawong, A.; Salae, A. Highly Enhanced Electrical and Mechanical Properties of Methyl Methacrylate Modified Natural Rubber Filled with Multiwalled Carbon Nanotubes. Polym. Test. 2020, 85, 106417. [Google Scholar] [CrossRef]
  49. Wiroonpochit, P.; Keawmaungkom, S.; Chisti, Y.; Hansupalak, N. A Novel Preparation of Natural Rubber Films with a Conducting Nanocarbon Network for Antistatic Applications. Mater. Today Commun. 2023, 34, 105349. [Google Scholar] [CrossRef]
  50. ASTMD3182-21a; Standard Practice for Rubber—Materials, Equipment, and Proced Ures for Mixing Standard Compounds and Preparing Standard Vulcanized Sheets. ASTM: West Conshohocken, PA, USA, 2021.
  51. ASTMD2084-19a; Standard Test Method for Rubber Property—Vulcanization Using Oscillating Disk Cure Meter. ASTM: West Conshohocken, PA, USA, 2019.
  52. ASTMD297-21; Standard Test Methods for Rubber Products-Chemical Analysis. ASTM: West Conshohocken, PA, USA, 2022.
  53. Flory, P.J.; Rehner, J. Statistical Mechanics of Cross—Linked Polymer Networks II. Swelling 1943, 11, 521–526. [Google Scholar] [CrossRef]
  54. ASTMD224-15; Standard Test Method for Rubber Property-Durometer Hardness. ASTM: West Conshohocken, PA, USA, 2021.
  55. ASTMD5963-04; Standard Test Method for Rubber Property—Abrasion Resistance (Rotary Drum Abrader). ASTM: West Conshohocken, PA, USA, 2019.
  56. ASTMD412-16; Standard Test Methods for Vulcanized Rubber and Thermoplastic Elastomers-Tension. ASTM: West Conshohocken, PA, USA, 2021.
  57. Marković, G.; Marinović-Cincović, M.; Jovanović, S.S.; Jovanović, V.; Budinski-Simendić, J. Reactive and Functional Polymers Volume Two; Gutiérrez, T.J., Ed.; Springer: Berlin/Heidelberg, Germany, 2020; ISBN 9783030451349. [Google Scholar]
  58. Pittayavinai, P.; Thanawan, S.; Amornsakchai, T. Manipulation of Mechanical Properties of Short Pineapple Leaf Fi Ber Reinforced Natural Rubber Composites through Variations in Cross-Link Density and Carbon Black Loading. Polym. Test. 2016, 54, 84–89. [Google Scholar] [CrossRef]
  59. Vural, S.; Dikovics, K.B.; Kalyon, D.M. Cross-Link Density, Viscoelasticity and Swelling of Hydrogels as Affected by Dispersion of Multi-Walled Carbon Nanotubes. Soft Matter 2010, 6, 3870–3875. [Google Scholar] [CrossRef]
  60. Li, F.; Yan, N.; Zhan, Y.; Fei, G.; Xia, H. Probing the Reinforcing Mechanism of Graphene and Graphene Oxide in Natural Rubber. J. Appl. Polym. Sci. 2013, 129, 2342–2351. [Google Scholar] [CrossRef]
  61. Ismail, H.; Rusli, A.; Rashid, A.A. Maleated Natural Rubber as a Coupling Agent for Paper Sludge Filled Natural Rubber Composites. Polym. Test. 2005, 24, 856–862. [Google Scholar] [CrossRef]
  62. Surya, I.; Ginting, M.; Surya, I.; Maulina, S.; Ismail, H. The Degree of Filler Dispersion, Rheometric and Mechanical Properties of Carbon Black-Filled Styrene-Butadiene Rubber Composites in the Presence of Alkanolamide. In IOP Conference Series: Materials Science and Engineering; IOP Publishing: Bristol, UK, 2019. [Google Scholar] [CrossRef]
  63. Zakiyan, S.E.; Azizi, H.; Ghasemi, I. In Fl Uence of Chain Mobility on Rheological, Dielectric and Electromagnetic Interference Shielding Properties of Poly Methyl-Methacrylate Composites Fi Lled with Graphene and Carbon Nanotube. Compos. Sci. Technol. 2017, 142, 10–19. [Google Scholar] [CrossRef]
  64. Silva, M.J.; Sanches, A.O.; Medeiros, E.S.; Mattoso, L.H.C.; McMahan, C.M.; Malmonge, J.A. Nanocomposites of Natural Rubber and Polyaniline-Modified Cellulose Nanofibrils. J. Therm. Anal. Calorim. 2014, 117, 387–392. [Google Scholar] [CrossRef]
  65. Liu, X.; Guo, R.; Li, R.; Liu, H.; Fan, Z.; Yang, Y.; Lin, Z. Effect of the Processing on the Resistance–Strain Response of Multiwalled Carbon Nanotube/Natural Rubber Composites for Use in Large Deformation Sensors. Nanomaterials 2021, 11, 1845. [Google Scholar] [CrossRef] [PubMed]
  66. Manoharan, S.; Suresha, B.; Ramadoss, G.; Bharath, B. Effect of Short Fiber Reinforcement on Mechanical Properties of Hybrid Phenolic Composites. J. Mater. 2014, 2014, 5–11. [Google Scholar] [CrossRef]
  67. Jayanarayanan, K.; Thomas, S.; Joseph, K. Morphology, Static and Dynamic Mechanical Properties of in Situ Microfibrillar Composites Based on Polypropylene/Poly (Ethylene Terephthalate) Blends. Compos. Part A Appl. Sci. Manuf. 2008, 39, 164–175. [Google Scholar] [CrossRef]
  68. Anas, K.; David, S.; Babu, R.R.; Selvakumar, M.; Chattopadhyay, S. Energy Dissipation Characteristics of Crosslinks in Natural Rubber: An Assessment Using Low and High-Frequency Analyzer. J. Polym. Eng. 2018, 38, 723–729. [Google Scholar] [CrossRef]
  69. Fernández-Berridi, M.J.; González, N.; Mugica, A.; Bernicot, C. Pyrolysis-FTIR and TGA Techniques as Tools in the Characterization of Blends of Natural Rubber and SBR. Thermochim. Acta 2006, 444, 65–70. [Google Scholar] [CrossRef]
  70. Zanchet, A.; Maciel, F.; Danielli, F.; Sousa, B.D.; Luiz, H.; Jr, O. Experimental and Artificial Neural Network Approach for Prediction of the Thermal Degradation Behavior of Sugarcane-Based Vulcanization Additives in Natural Rubber Compounds. Clean. Eng. Technol. 2021, 5, 100303. [Google Scholar] [CrossRef]
  71. Košíková, B.; Gregorová, A.; Osvald, A.; Krajčovičová, J. Role of Lignin Filler in Stabilization of Natural Rubber–Based Composites. J. Appl. Polym. Sci. 2007, 103, 1226–1231. [Google Scholar] [CrossRef]
  72. Rebeque, P.V.; Silva, M.J.; Cena, C.R.; Nagashima, H.N.; Malmonge, J.A.; Kanda, D.H.F. Analysis of the Electrical Conduction in Percolative Nanocomposites Based on Castor-Oil Polyurethane with Carbon Black and Activated Carbon Nanopowder. Polym. Compos. 2019, 40, 7–15. [Google Scholar] [CrossRef]
  73. Balberg, I.; Azulay, D.; Goldstein, Y.; Jedrzejewski, J. Possible Origin of the Smaller-than-Universal Percolation-Conductivity Exponent in the Continuum. Phys. Rev. E 2016, 93, 062132. [Google Scholar] [CrossRef] [PubMed]
  74. Kirkpatrick, S. Percolation and Conduction. Rev. Mod. Phys. 1973, 45, 574–588. [Google Scholar] [CrossRef]
  75. Melo, D.S.; Reis, I.C.; Queiroz, J.C.; Cena, C.R.; Nahime, B.O.; Malmonge, J.A.; Silva, M.J. Evaluation of Piezoresistive and Electrical Properties of Conductive Nanocomposite Based on Castor-Oil Polyurethane Filled with MWCNT and Carbon Black. Materials 2023, 16, 3223. [Google Scholar] [CrossRef] [PubMed]
Figure 1. (a) Variation in Qf/Qg as a function of e−Z for VNR/MWCNT nanocomposites. (b) Effect of MWCNTs on Qf/Qg of VNR/MWCNT nanocomposite specimens.
Applsci 14 08973 g001
Figure 2. The degree of filler dispersion in the polymeric matrices of VNR/MWCNT nanocomposites.
Applsci 14 08973 g002
Figure 3. SEM micrographs of the cryofractured cross-sectional surface of the (a) NR/MWCNT1, (b) NR/MWCNT3, and (c) NR/MWCNT5 samples.
Applsci 14 08973 g003
Figure 4. Curves of specific mass, hardness, and abrasion loss as a function of MWCNT concentration for MWCNT/VNR nanocomposite specimens.
Applsci 14 08973 g004
Figure 5. Stress–strain curves of VNR/MWCNT nanocomposites with different concentrations of MWCNT fillers.
Applsci 14 08973 g005
Figure 6. Logarithmic-scale storage modulus curves as a function of temperature for VNR/MWCNT nanocomposites at varying MWCNT concentrations.
Applsci 14 08973 g006
Figure 7. Tan δ curves of VNR/MWCNT nanocomposites with different concentrations of MWCNT fillers.
Applsci 14 08973 g007
Figure 8. Thermogravimetric analysis (TGA) curves as a function of temperature for VNR/MWCNT nanocomposites at varying MWCNT filler concentrations.
Applsci 14 08973 g008
Figure 9. Derivative thermogravimetric (DTG) curves as a function of temperature for VNR/MWCNT nanocomposites with varying MWCNT filler concentrations.
Applsci 14 08973 g009
Table 1. The formulation for the preparation of VNR-based nanocomposites containing MWCNTs.
ComponentsVNRVNR/MWCNT1VNR/MWCNT2VNR/MWCNT3VNR/MWCNT4VNR/MWCNT5
NR100100100100100100
Zinc oxide444444
Stearic acid222222
MWCNTs012345
Sulfur1.51.51.51.51.51.5
MBTS111111
TMTD0.50.50.50.50.50.5
Total109110111112113114
Table 2. VNR/MWCNT nanocomposite’s rheometric parameters.
SpecimensML
(dNm)
MH
(dNm)
ΔM = (MH − ML)
(dNm)
tS1
(min)
t90
(min)
VNR1.40 ± 0.0827.69 ± 1.9326.29 ± 1.852.22 ± 0.033.25 ± 0.14
VNR/MWCNT11.14 ± 0.0728.46 ± 0.7527.32 ± 0.782.27 ± 0.023.30 ± 0.18
VNR/MWCNT21.40 ± 0.0531.01 ± 0.9529.61 ± 1.022.13 ± 0.053.10 ± 0.21
VNR/MWCNT31.40 ± 0.0332.68 ± 0.9131.27 ± 1.012.07 ± 0.033.10 ± 0.22
VNR/MWCNT41.53 ± 0.0535.35 ± 0.5433.83 ± 0.632.00 ± 0.043.07 ± 0.28
VNR/MWCNT51.79 ± 0.9037.01 ± 0.8035.23 ± 0.891.95 ± 0.053.05 ± 0.31
Table 3. Crosslink density of NR/MWCNT composites (as determined via the Flory–Rehner method).
SpecimensFlory–Rehner (10−4 (mol cm−3))
VNR1.86 ± 0.03
VNR/MWCNT11.86 ± 0.02
VNR/MWCNT22.11 ± 0.02
VNR/MWCNT32.22 ± 0.04
VNR/MWCNT42.42 ± 0.04
VNR/MWCNT52.45 ± 0.04
Table 4. Mechanical parameters of the stress–strain curves: tensile strength at 100% (σ100%), 300% (σ300%), and 500% (σ500%) stress; tensile strength at break (σat break); and the elongation at break (εat break) of neat VNR and VNR/MWCNT nanocomposites with different MWCNT fillers.
Specimensσ100%
(MPa)
σ300%
(MPa)
σ500%
(MPa)
σat break
(MPa)
εat break
(%)
VNR0.72 ± 0.041.73 ± 0.103.19 ± 0.248.84 ± 2.48780 ± 34
VNR/MWCNT10.84 ± 0.032.08 ± 0.054.02 ± 0.069.48 ± 2.03731 ± 43
VNR/MWCNT20.94 ± 0.062.42 ± 0.184.80 ± 0.4010.45 ± 0.62708 ± 29
VNR/MWCNT31.09 ± 0.072.87 ± 0.225.84 ± 0.349.65 ± 2.16640 ± 38
VNR/MWCNT41.28 ± 0.093.31 ± 0.176.81 ± 0.4010.62 ± 2.09617 ± 43
VNR/MWCNT51.47 ± 0.053.94 ± 0.198.03 ± 0.409.67 ± 1.60553 ± 53
Table 5. dc electrical conductivity of VNR-based nanocomposites with varying MWCNT phr concentrations.
Specimensσdc (S/m)
VNR(2.64 ± 0.08) × 10−14
VNR/MWCNT1(2.84 ± 0.03) × 10−14
VNR/MWCNT2(4.23 ± 0.05) × 10−12
VNR/MWCNT3(3.36 ± 0.04) × 10−8
VNR/MWCNT4(7.45 ± 0.04) × 10−6
VNR/MWCNT5(2.24 ± 0.06) × 10−4
Disclaimer/Publisher’s Note: The statements, opinions and data contained in all publications are solely those of the individual author(s) and contributor(s) and not of MDPI and/or the editor(s). MDPI and/or the editor(s) disclaim responsibility for any injury to people or property resulting from any ideas, methods, instructions or products referred to in the content.

